Article

Digital Impedance Bridge for Four-Terminal-Pair AC Resistor Calibration up to 20 kHz

Laboratoire National de Métrologie et d’Essais, 78197 Trappes, France
*
Author to whom correspondence should be addressed.
Metrology 2024, 4(1), 1-14; https://doi.org/10.3390/metrology4010001
Submission received: 29 October 2023 / Revised: 10 December 2023 / Accepted: 14 December 2023 / Published: 4 January 2024
(This article belongs to the Special Issue Power and Electronic Measurement Systems)

Abstract

:
For this study, a substitution principle-based impedance bridge has been developed to calibrate AC resistors in a four-terminal-pair (4TP) configuration. The calibration is performed in the full complex plane for resistances ranging from 100 mΩ to 400 Ω and frequencies of between 50 Hz and 20 kHz. The automated bridge is based on four resistors associated with two high-impedance stages. The balancing of the bridge is achieved by means of PXI modules. The bridge is automatically balanced via a simplex top-down algorithm. The new bridge is primarily used for the measurement chain of AC standard resistors defined in a 4TP configuration at LNE, which are used for routine customer calibrations. The traceability of LNE’s standard resistors when defined in a 4TP configuration is ensured by a measurement chain from a 1 kΩ reference resistor using the new bridge. The reference resistor was calibrated previously via comparison with a calculable resistor up to 20 kHz. The bridge was validated via comparison with calibration results obtained in 1983 and 2009. For a resistor of 1 Ω at 1 kHz, the uncertainty of the series resistance variation and the phase shift are less than 6 µΩ/Ω (k = 1) and 6 µrad (k = 1), respectively.

1. Introduction

The traceability of electrical resistors to the International System of Units (SI) is a crucial step before they can be used [1]. In electrical metrology, the calibration of AC resistors for frequencies up to 1 MHz is performed via several methods: an impedance comparison bridge [2,3,4,5,6,7], measurement by the current/voltage method [8], the self-balancing bridge method or impedance analyzers [9,10], and the network analyzer method [11].
Impedance (of a resistor, a capacitor, or an inductor) is mainly defined according to its four configurations: a two-wire/single terminal (2T), a four-wire/single terminal (4T), a two-terminal pair (2TP), or a four-terminal pair (4TP) [12]. For impedance calibration at the highest level of accuracy, the 2TP and 4TP configurations are the most commonly used forms, especially due to the ability to add a potential reference terminal to eliminate leakage resistances with the reference potential (ground) [12,13,14,15,16,17,18]. The 4TP configuration greatly reduces the influence of contact impedances (typically less than a few tens of micro-ohms) on the impedance measurement; thus, it is mainly used for low impedance values (typically less than 400 Ω). However, the 2TP configuration is usually used for high impedance values (typically above 400 Ω) while neglecting the influence of contact impedances [16,17].
At LNE, the traceability of AC resistance measurements up to 10 MHz is ensured by employing methods based on the principle of impedance comparison bridges for frequencies between 50 Hz and 20 kHz [18,19,20,21]. For frequencies up to 20 kHz, three methods, representing three levels of uncertainty, are used: a comparison bridge, based on a “two-stage” autotransformer (uncertainty level 1) [20], a Wheatstone bridge based on four resistors (uncertainty level 2), and a comparison bridge based on a sampling technique (uncertainty level 3) [21]. In terms of uncertainty level 2, a new automated Wheatstone bridge has been implemented for the calibration of AC resistors defined in a 2TP configuration (between 400 Ω and 2 MΩ) [18].
In this paper, an evolution of LNE’s impedance bridge (Wheatstone bridge) is used to calibrate AC resistors defined in a 4TP configuration for resistors between 100 mΩ and 400 Ω. This paper is a supplement to a previous paper [18]. However, it differs from the calibration bench that was previously presented, in terms of:
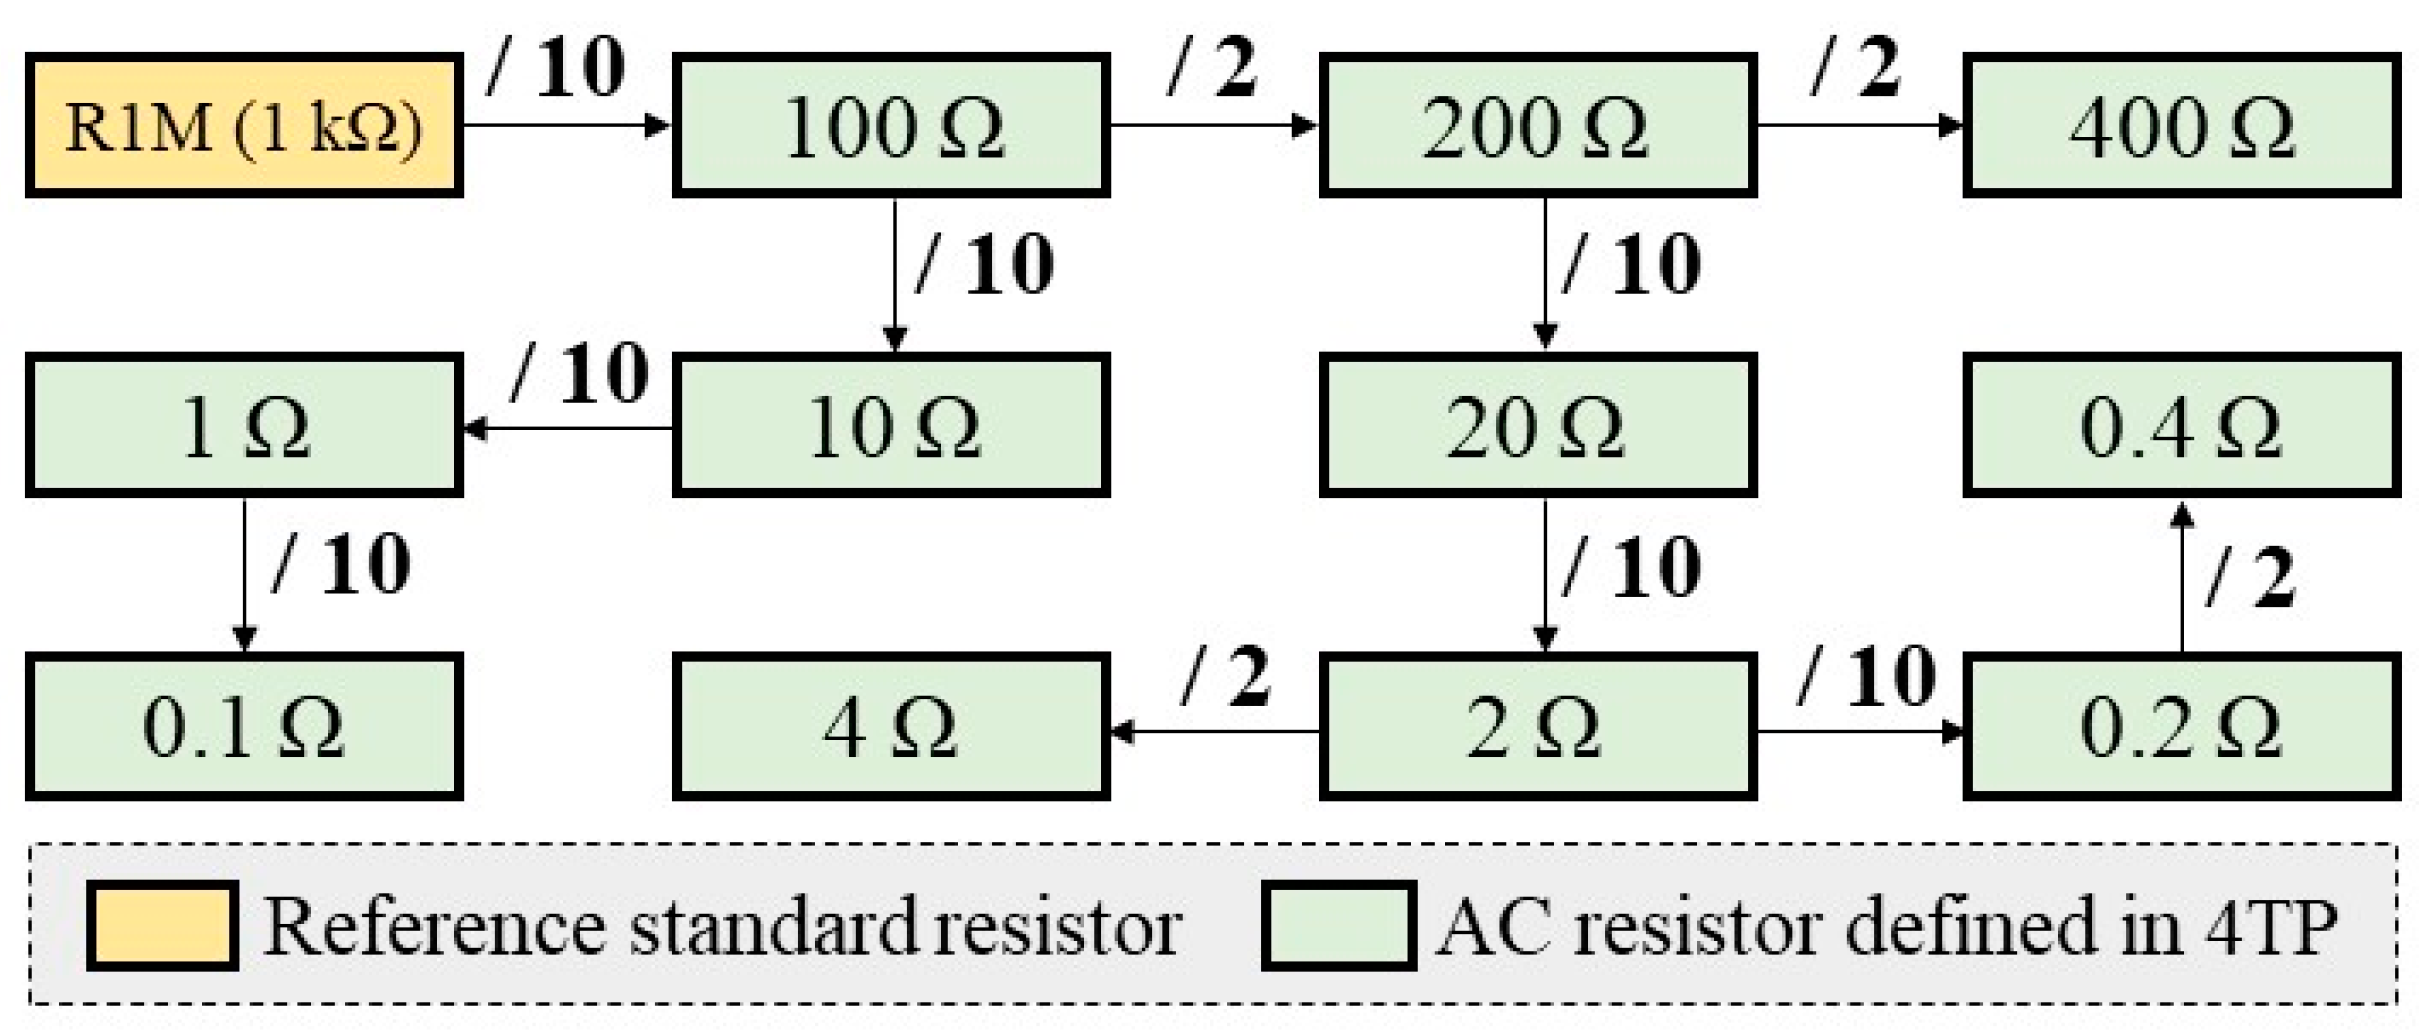
  • The range of resistors to be calibrated. In the first paper [18], the resistors range from 400 Ω to 2 MΩ. In the present paper, the calibration system is developed for low resistance values of between 100 mΩ and 400 Ω.
  • The type of resistors. In the first paper [18], the resistors are defined in a 2TP configuration. In this paper, the measured resistors are defined in a 4TP configuration, which requires triaxial connections to limit the internal leakage (internal guard).
  • Although the power source and voltage injection system are the same as in the first paper [18], the calibration system presented in this paper has been improved to measure low resistance values. In the new calibration bench, two developed high-impedance stages and standard capacitors have been used to ensure bridge balance for resistors defined in a 4TP configuration. Consequently, the calibration equations to define the frequency variation of the calibrated resistors are different from those in the first paper [18].
We will be focusing on the calibration of AC resistance standards that are defined and measured in a 4TP configuration. A detailed uncertainty budget is also presented in this paper.

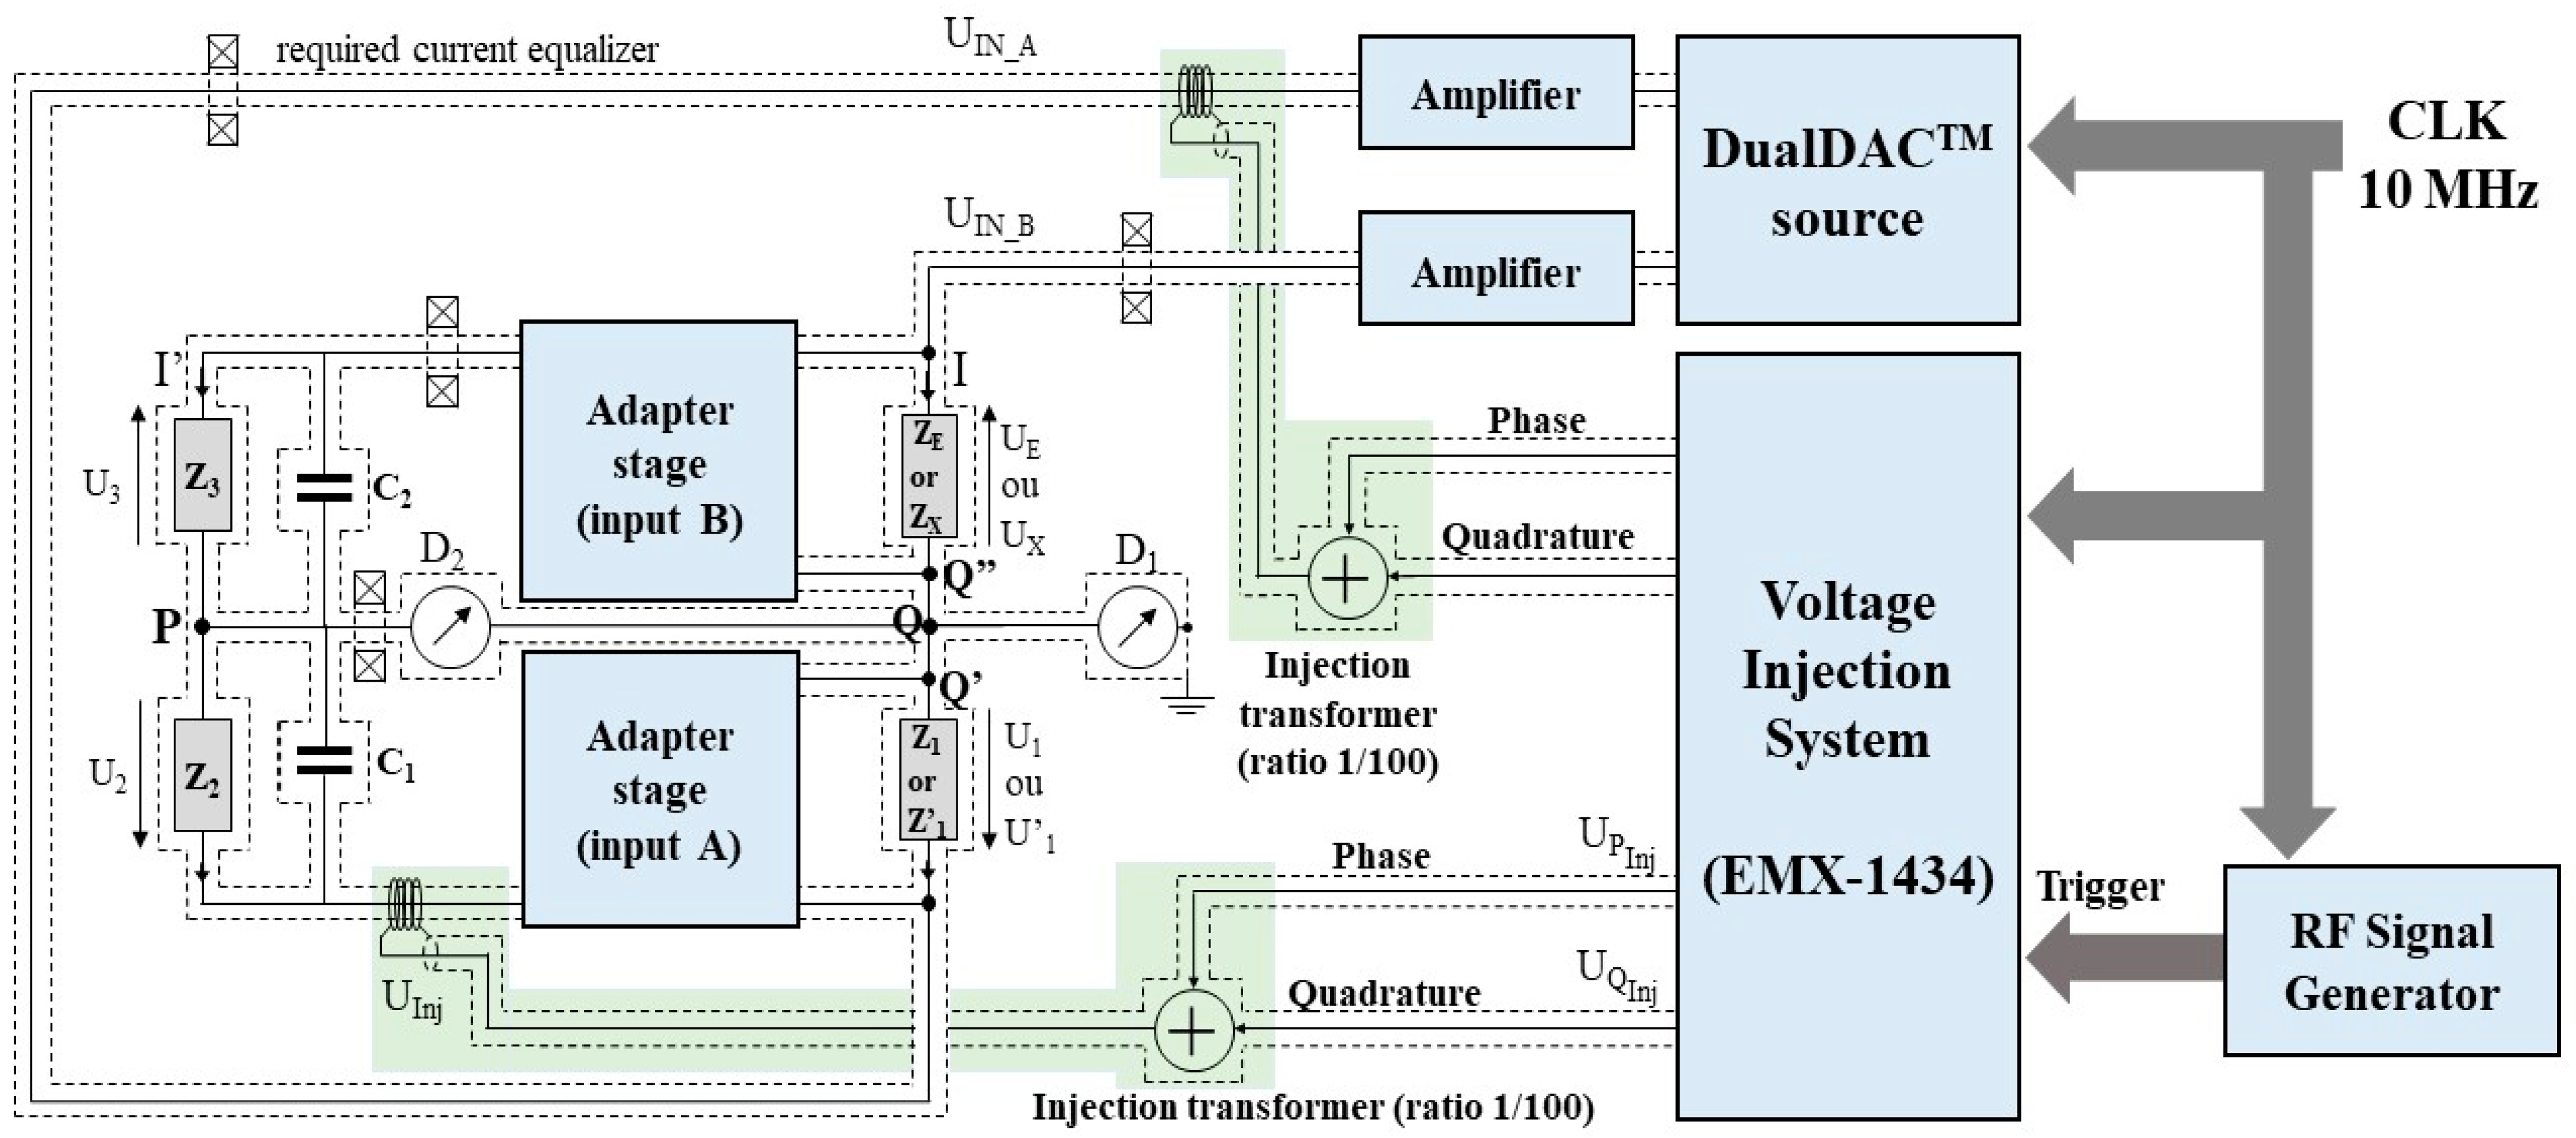
2. Description of the Impedance Bridge

The calibration bridge principle proposed for resistors defined in a 4TP configuration is similar to that presented in [18] for resistors defined in a 2TP configuration. Figure 1 shows the Wheatstone bridge schematic developed for resistors defined in a 4TP configuration up to 20 kHz. The calibrated resistor values range from 100 mΩ to 400 Ω. The bridge is based on the substitution principle between the impedance to be calibrated, ZX, and the standard impedance, ZE. It is composed of four impedances: ZE (or ZX), Z1 (or Z′1), and two impedances, Z2 and Z3, for adjusting the bridge ratio. The bridge is balanced by keeping the vertices of the sensing diagonal (nodes P and Q) at ground potential. This balance is achieved by injecting a voltage in-phase and quadrature with the input voltage through two injection systems and by adjusting a capacitor C1 (or C2), placed in parallel with impedance Z2 (or Z3). Null detectors D1 and D2 are placed at nodes P and Q to determine the balance of the bridge. This grounding of nodes P and Q allows us:
  • To ensure a 4TP configuration for impedances ZE (or ZX) and Z1 (or Z’1) and a 2TP configuration for impedances Z2 and Z3;
  • To eliminate the influence of parasitic impedances between the P and Q nodes and the ground;
  • To eliminate the influence of the common mode on the main null detector, D2.
The bridge is supplied by a commercial dual precision arbitrary waveform generator, which has been designed for low-frequency metrological applications (DualDAC™) [22]. Its two voltage sources are independently controlled in terms of amplitude and phase in a frequency range of between 0.1 Hz and 20 kHz. A preliminary study was carried out on how the power source should be selected [23]. At each DualDAC™ voltage output, a power amplifier is used to feed the Wheatstone bridge with the necessary current.
The bridge is balanced using the injection system, based on the PXI EMX-1434 modules [24] and by adjusting one of the standard capacitors, C1 or C2. The use of PXI EMX-1434 modules as a voltage injection system is demonstrated in a previous study [25]. The results of a comparison with other PXI modules showed that the EMX-1434 module is characterized by the ability to provide finely adjustable voltages in phase and quadrature (a few µV in amplitude and a few millidegrees in phase) with low signal distortion, a low DC residual offset, low temperature drift, high linearity, and a low signal-to-noise ratio. Two voltage injection systems are used: the first is employed to ensure the metrological configuration of the resistors, the balance of which is measured using null detector D1. The second system is used to ensure the main balance of the bridge; its balance is measured using null detector D2. Each voltage injection system has two generators of the EMX-1434 module (in quadrature and in phase). An injection transformer is used to perform the vector sum of the supply voltage vector and the two injection voltages in phase and quadrature [26]. Capacitors C1 and C2 are used to reduce the level of the in-phase voltage that is injected by the EMX-1434 modules, which is necessary to ensure the bridge balance (showing a minimum on the detector D2).
A 10 MHz signal with an external trigger signal is used to synchronize the DualDAC™ source and the EMX-1434 module. A calibrated phasemeter is also used to correct any phase errors before starting to balance the bridge.
A single digital lock-in amplifier with two inputs (NA and NB) is used for null detectors D1 and D2. For null detector D1, the lock-in amplifier input mode is configured to input NA. However, the configuration of the lock-in amplifier input mode to NA-NB allows the lock-in amplifier to be positioned on D2.
Current equalizers are used to minimize the influence of electromagnetic noise and to ensure a coaxial configuration [27,28]. For the same purpose, mutual induction coupling is minimized by twisting the power cables and the cables connected to the adapter stages. Short cables are used between nodes P or Q and the lock-in amplifier to minimize the leakage impedance to the ground.
Considering impedances Z2 and Z3, which are defined in 2TP configurations and are used to adjust the bridge ratio, high-impedance differential stages (adapter stages A and B) are used between the two bridge sections. These stages eliminate the influence of voltage losses between nodes Q Q′ and Q Q″. For the same purpose, the connection lengths between these nodes have been minimized. The adapter stages are designed with triaxial input connectors to limit the internal leakage (internal guard) [21].
The high-impedance stages used are based on an instrumentation amplifier (differential input). These stages represent the main difference with the bridge used for resistors defined in a 2TP configuration [18] and ensure the 4TP configuration. The schematic diagram is shown in Figure 2a. The amplifiers used (OP27) were selected to provide broadband stability up to a few megahertz. Two guard amplifiers of LT1028 (A5 and A6), combined with a triaxial input circuit, not only eliminated the influence of cable losses but also limited their effect on amplifier stability. The settings for phase errors are made by fine adjustment of the capacitance, Ch+, Ch, Cb+, and Cb, of each adapter stage. The high-impedance stages consist of the following electronic modules:
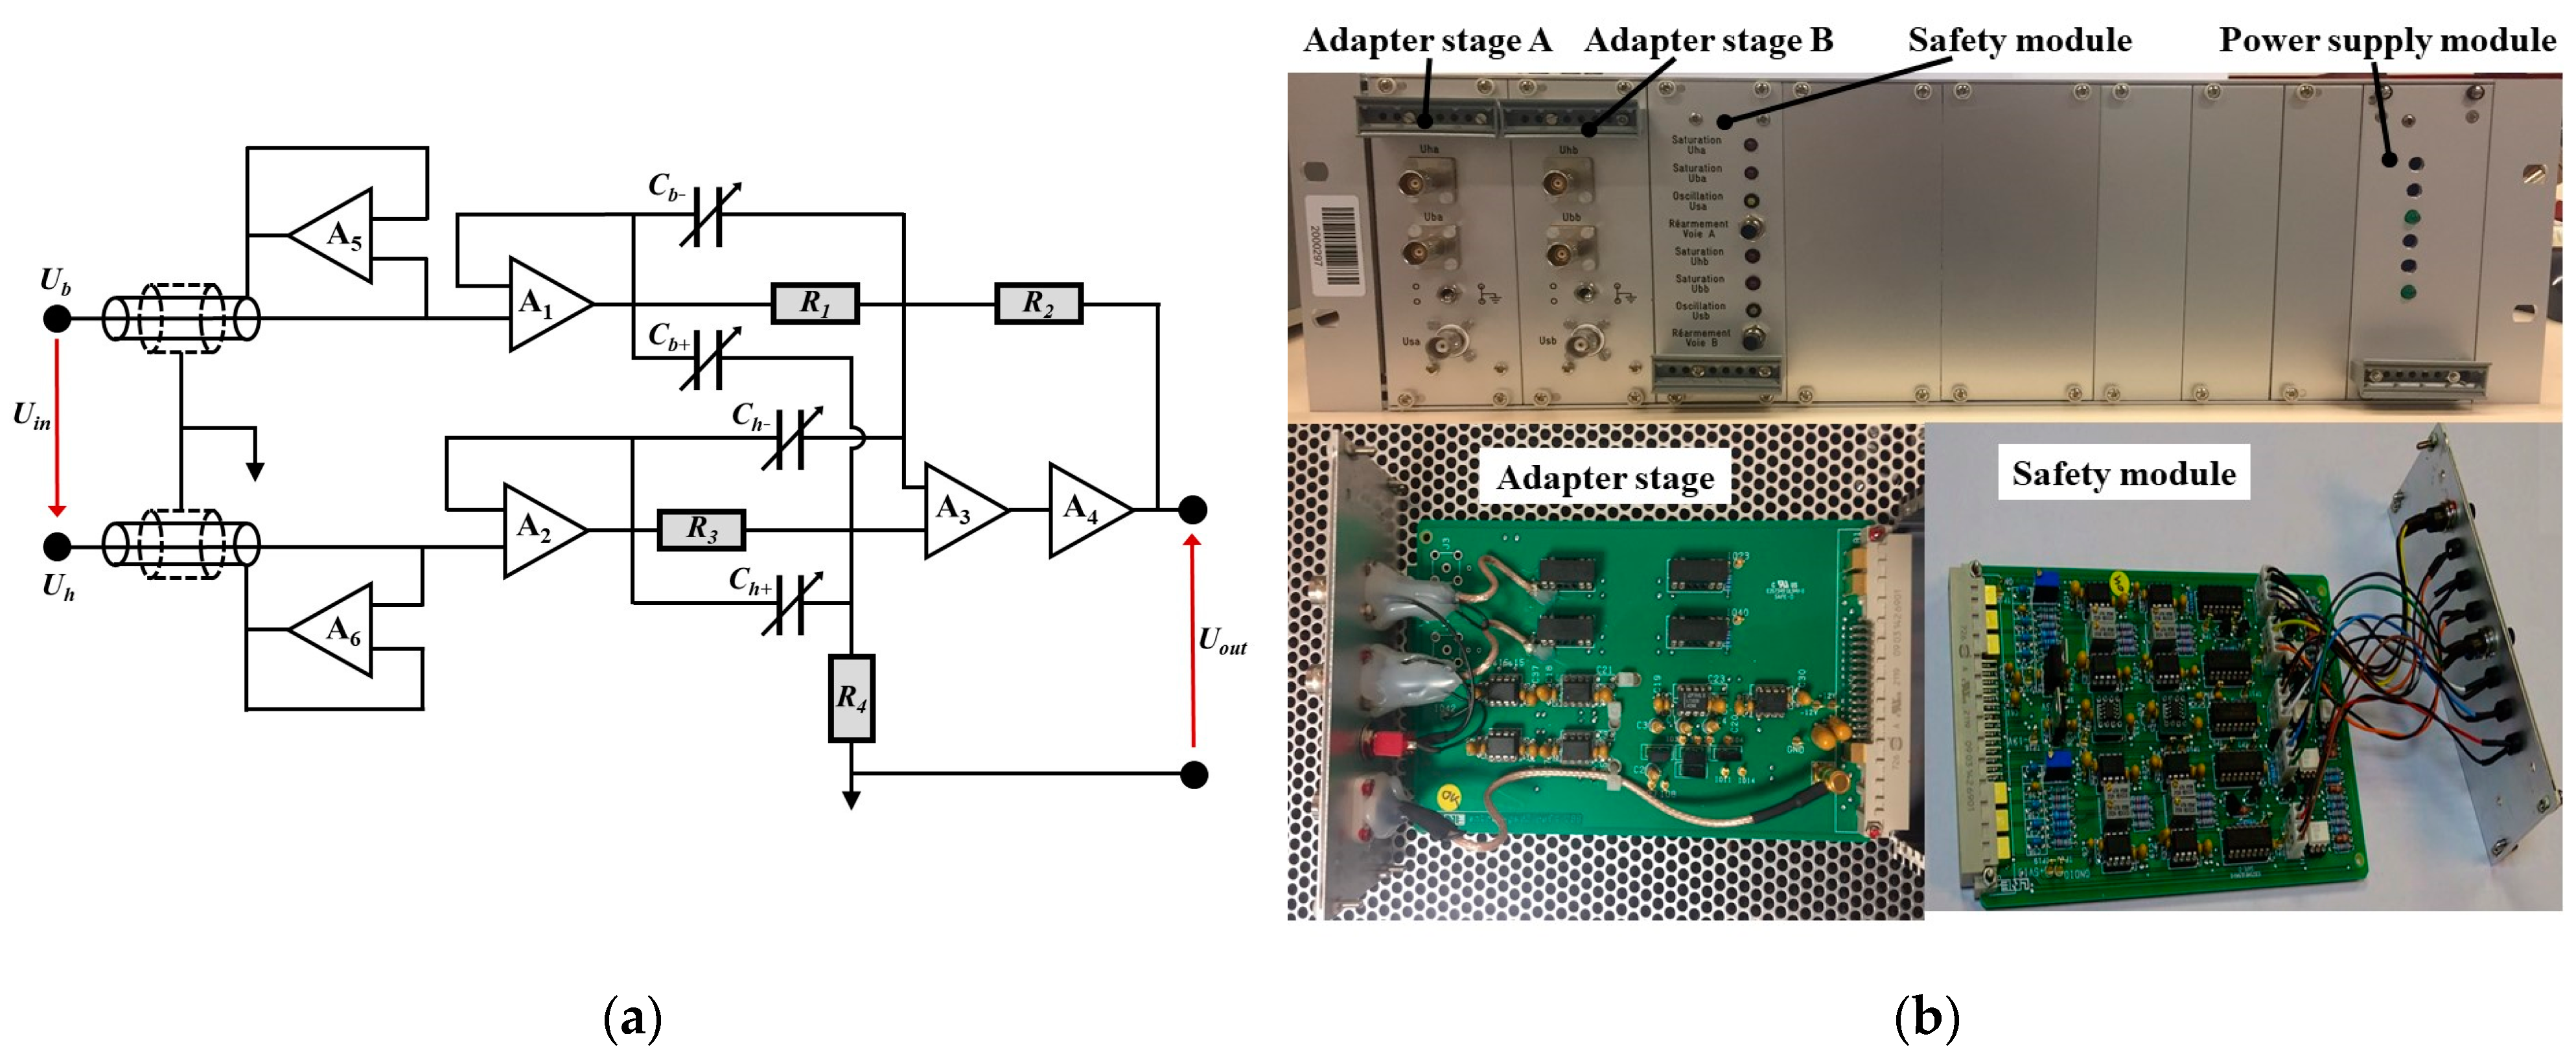
  • Two adapter stages A and B, representing the main module of the high-impedance stages.
  • A safety module to protect and warn against voltage limits or saturation levels for the input module amplifiers (3 V).
  • Power supply module to supply power to the high-impedance stages (±12 V).
The implementation of high-impedance stages is shown in Figure 2b. The differential inputs of the high-impedance stages are calibrated and adjusted before use. The purpose of this calibration is to verify the negligible effect of the gain and phase shift (the phase shift of the Uout output with respect to the Ub input) of the high-impedance stages on the voltages supplying impedances Z2 and Z3 (see Figure 1). The calibration results are not used to determine the characteristics of the AC resistors (using the substitution method), as described in Section 3. The gain and phase shift errors are measured after a period of thermal stabilization of the input stages (at least 24 h). Three configurations are verified:
  • Follower configuration: voltage is applied to the high input Uh and grounded low input Ub.
  • Inverter configuration: voltage is applied to the low input Ub and grounded to the high input Uh.
  • Differential configuration: the same voltage is applied to the low input Ub and high input Uh.
The maximum absolute gain and phase shift corrections are less than (40 ± 3) µV/V and (26 ± 7) µrad, respectively, up to 20 kHz. The use of the substitution principle, the stability of the corrections, and the associated low uncertainties of the two matched adapter stages allow us to disregard their influence on the calibration of the AC resistor up to 20 kHz; this part is detailed in Section 3.
The input impedance Zp of each adapter stage (A and B) is modeled by a capacitor Cp and a resistor Rp in parallel. These components are measured using a HIOKI IM3536 RLC bridge at each frequency, and the values considered are the average of 100 acquisitions. Table 1 shows the measured values of the capacitors Cp and the resistors Rp. The measured input impedances of each adapter stage (A and B) are sufficiently large to ensure a 4TP configuration when calibrating AC resistors up to 20 kHz.
The measurement system is automated, performing all the tasks necessary to compare AC resistors defined in a 4TP configuration, automatically balancing the bridge, and controlling the maximum electrical current according to the nominal current values of the compared resistors. The main steps of the measuring procedure are:
  • Construction of the impedance bridge with impedances Z1, Z2, Z3, and ZE;
  • Generation of the supply voltages UIN_A and UIN_B by the DualDAC™ source, based on the bridge ratio and the maximum input voltage of the adapter stages (3 V);
  • Correction of phase errors between the DualDAC™ source and the EMX-1434 module;
  • Adjustment by successive iterations of balances on detectors D1 and D2, using the voltage injection system and the capacitor C1 (or C2);
  • Repetition of steps 2 to 4 for each measurement frequency;
  • Substitution of Z1 and ZE by Z′1 and ZX, respectively (an electrical circuit with impedances Z′1, Z2, Z3 and ZX);
  • Repetition of steps 2 to 5.

3. AC Resistor Calibration

The impedance bridge is based on the substitution principle between the impedance to be calibrated, ZX, and the standard impedance, ZE. The calibration equations are detailed for the standard resistor ZE. The bridge then consists of impedances ZE and Z1 and two impedances, Z2 and Z3, for the bridge ratio. Applying Ohm’s law to the balance of the bridge, the complex voltages across impedances Z1, Z2, Z3, and ZE are given by:
U 1 = Z 1   I U E = Z E   I U 2 = ( Z 2 / / Z C 1 )   I U 3 = ( Z 3 / / Z C 2 )   I
where ZC1 and ZC2 are the impedances of capacitors C1 and C2 at the measurement frequency f. The voltages UE, U1, U2, and U3 are the voltages across impedances ZE, Z1, (Z2//ZC1), and (Z3//ZC2), respectively. The currents I and I′ are the electrical currents in each bridge arm.
The relations between the bridge voltages are ascertained by applying Kirchhoff’s voltage law:
U 1 = U I N _ A U E = U I N _ B G A . U 1 = U 2 + U I n j G B . U E = U 3
where GA and GB are the complex gains of the high-impedance stages of inputs A and B, respectively. The voltages UIN_A and UIN_B are the bridge supply voltages. The complex voltage UInj at the output of the injection transformer is the voltage that is injected to ensure bridge balance.
The complex transfer coefficient kInj of the voltage injection system is defined by the ratio between the injected voltage UInj and the voltage U1 that is supplied to impedance Z2 (in the bridge balance):
k I n j = U I n j U 1 = U P I n j + j   U Q I n j N T   U I N _ A = 1 G A k P I n j + j   k Q I n j
where NT is the gain ratio of the injection transformer (=100). UP_Inj and UQ_Inj are the injected voltages in phase and quadrature, respectively, to ensure bridge balance. kP_Inj and kQ_Inj are the transfer coefficients in phase and in quadrature, respectively, of the voltage injection system.
Using Equations (1)–(3), we obtain:
Z 1 Z E = U 1 U E = U I N _ A U I N _ B ( Z 2 / / Z C 1 ) ( Z 3 / / Z C 2 ) = U 2 U 3 = G A G B U I N A U I N B k I n j
Thus:
Z 1 Z E G A G B = Z 2 / / Z C 1 Z 3 / / Z C 2 + k I n j
By developing Equation (5) to the first order:
Z E Z 1 1 + Z 3 Z C 2 1 + Z 2 Z C 1 1 + k I n j Z 3 / / Z C 2 Z 2 / / Z C 1 = Z 3 Z 2 G A G B
From Equation (6), considering the substitution of Z1 and ZE by Z′1 and ZX, respectively, and the gain stability of adapter stages A and B, we obtain:
Z X Z 1 1 + Z 3 Z C 2 1 + Z 2 Z C 1 1 + k I n j Z 3 / / Z C 2 Z 2 / / Z C 1 = Z 3 Z 2 G A G B
where kInj= kP_Inj+ j kQ_Inj is the complex transfer coefficient of the voltage injection system with impedances Z′1 and ZX. ZC1 and ZC2 are, respectively, the impedances of the capacitors C′1 and C′2, adjusted to obtain the balance of the bridge (for a circuit with impedances Z′1 and ZX).
The substitution method avoids errors caused by the gains (GA and GB) of the adapter stages. The errors of the adapter stages, which are below the maximum values of 40 µV/V for the gain and 26 µrad for the phase shift up to 20 kHz, allow this hypothesis to be validated. These corrections were verified and validated before the adapter stages were used. By combining Equations (6) and (7), we obtain:
Z E Z 1 1 + Z 3 Z C 2 1 + Z 2 Z C 1 1 + k I n j Z 3 / / Z C 2 Z 2 / / Z C 1 = Z X Z 1 1 + Z 3 Z C 2 1 + Z 2 Z C 1 1 + k I n j Z 3 / / Z C 2 Z 2 / / Z C 1
The variation with the frequency of the series resistance of the impedance to be calibrated, ZX, is given by:
s X = s E s 1 + s 1 R D C 2 R D C 3 k P i n j k P i n j + ϖ 2 R D C 2 t 2 C 1 C 1 + R D C 3 t 3 C 2 C 2
where ΔsE, Δs1, and Δs1 are the relative variations with the frequency of impedances ZE, Z1, and Z′1, respectively. RDC2 and RDC3 are the DC resistances of impedances Z2 and Z3, respectively. t2 and t3 are the time constants, respectively, of impedances Z2 and Z3.
Similarly, the phase shift with the frequency of the impedance to be calibrated, ZX, is given by:
ϖ t X = ϖ t E t 1 + t 1 R D C 2 R D C 3 k Q i n j k Q i n j + ϖ R D C 2 C 1 C 1 + R D C 3 C 2 C 2
where tE, t1, and t’1 are the time constants of impedances ZE, Z1, and Z′1, respectively.
The parameters ∆sx and ωtx of the impedance to be calibrated, ZX, are determined as a function of the two complex transfer coefficients and the parameters of the normalized impedances, ZE, Z1, Z′1, Z2, Z3, ZC1, ZC2, Z′C1, and Z′C1. Impedances ZE, Z1, Z′1, Z2, and Z3 were previously calibrated using the bridge formed by a measurement chain from a 1 kΩ reference resistor. The measurement chain is presented in Section 5.

4. Uncertainty Budget

The uncertainty budget is similar to that for the resistances defined for a two-terminal pair and detailed in [18]. The additional uncertainty components being considered were consistent with the observations made during the calibration process:
  • Influence of adapter stages (BL1): This error relates to the calibration and adjustment of the differential inputs of the adapter stages. The errors on variation Δs are corrected. The associated uncertainty (k = 1) can be increased by a component equal to 1 µV/V up to 20 kHz. For phase shift measurements, considering a rectangular distribution law, the estimated uncertainty (k = 1) is less than 4.1 µrad up to 20 kHz.
  • Influence of parasitic impedances (BL2): The leakage impedances to the ground are eliminated by the Wagner arm. The input impedance of the adapters is likely to interfere with the measurements. This component is given according to the resistor values:
    For the relative variation, Δs: The values that were estimated for impedance Zp during the calibration of the adapter stages were used to apply a correction term. The uncertainty (k = 1) associated with the internal resistance value Rp of the impedance Zp of the adapter stages can be considered to be less than 1 GΩ. The correction term βs_Z, related to the influence of the parasitic impedance Zp on the variation Δs, is equal to:
β s _ Z = R X R 1 R 1 R X 1 R P + R 1 R X 2 2 π f s C p 2
where fs is the frequency (in Hz), and Cp is the internal capacitance of the impedance Zp of the adapter stages.
The uncertainty component BL2 is then given by:
B L 2   k = 1 = R X R 1 R 1 R X . u 2 ( R p ) R p 4 + ( R 1 + R X ) 2 π f s 2 C p 2 u 2 ( C p )
This component can be increased by considering Rp = 3 GΩ and Cp = 95 fF. We obtain:
B L 5   k = 1 R X R 1 R 1 R X · [ 1.1 × 10 10 + 9.5 × 10 29 · R 1 + R X 2 π f s 2 ]
  • For the phase shift ωt, the uncertainty (k = 1) associated with the capacitance value, Cp, is less than 1 fF; thus, the applied correction term is equal to (RxR1).Cp.2πfs. The uncertainty component BL2 is given by:
B L 2   k = 1 = R X R 1 · 2 π f s · u ( C p )    
  • Mutual induction effect (BL3): This component corresponds to the error due to mutual parasitic coupling between a current circuit and a voltage circuit. It is equal to:
β M = j   M · 2 π f s · R X R 1 · 1 R 1 1 R X
where βM is the correction term associated with the mutual inductance effect and M is the mutual inductance (in H).
This uncertainty component mainly affects the quadrature component (the parasitic time constant). The parasitic mutual inductance is estimated to be less than 0.2 nH. Therefore, its effect on the relative variation Δs is negligible. For the phase shift, the correction term is equal to M. Considering a rectangular distribution law, the uncertainty associated with this component on the phase shift is given by:
B L 3   k = 1 = 1.3 × 10 9 · f s · R X R 1 · 1 R 1 1 R X
Considering the major uncertainty components, Table 2 shows the example of Wheatstone bridge uncertainty budgets for the resistances SC1 (1 Ω) and SC0.1 (100 mΩ).

5. AC Resistance Standards Measurement Chain

The first step of the measurement chain is based on the calibration of a 1 kΩ resistor (R1M) via comparison with a calculable Haddad-type resistor up to 20 kHz [19]. This resistor is then used as the reference element for the measurement chain. Figure 3 shows the measurement chain for AC reference resistors defined in a 4TP configuration at LNE.
Several LNE standard resistors defined in a 4TP configuration have been measured. The relative variation ∆s and the phase shift ωt were characterized for each impedance at the following frequencies: 100 Hz, 1 kHz, 5 kHz, 10 kHz, and 20 kHz. The calibration current values for the measured resistors were between 3 mA and 1.5 A. The measurements made with the new Wheatstone bridge were compared with calibrations made in 1983 and 2009 [20,29]; these previous calibrations at LNE were made with a manual Wheatstone bridge (first generation) [20]. Table 3 and Table 4 show the example calibration of the resistors SC0.1 (100 mΩ) and SC0.2 (200 mΩ), respectively. Normalized error ratios of relative variation ∆s and the phase shift ωt were calculated for all calibrated resistors. This is a statistical test to compare the proficiency of measurement results, taking into account their uncertainties [30]. This normalized error ratio En is calculated in comparison with previous calibrations, using the following equation:
E n = x m x r e f U m 2 + U r e f 2
where xm and xref are the values of the relative variation Δs (or the phase shift ωt), measured with the presented impedance bridge and obtained in one of the previous calibrations, respectively. Um and Uref are the expanded uncertainties associated with xm and xref, respectively.
Figure 4 and Figure 5 show the absolute values of the normalized error ratios of the relative variation Δs and the phase shift ωt for the automated Wheatstone bridge presented in this paper, compared to the calibration results for the years 1983 and 2009, respectively. The ratios were calculated for all the resistors in the measurement chain (one resistor for each value) between 100 mΩ and 400 Ω and for frequencies up to 20 kHz. The ratio values obtained were less than 1. The results obtained validate the bridge presented in this paper.

6. Conclusions

In this paper, we present a new automated digital Wheatstone bridge for the calibration of AC resistors, defined in a 4TP configuration, from 100 mΩ to 400 Ω and from 20 Hz to 20 kHz. This bridge is mainly used at LNE to carry out the measurement chain process of standard resistors defined in a 4TP configuration with an AC current of up to 20 kHz. The measurement chain is ensured by a single reference resistor, R1M (1 kΩ), characterized via comparison with a calculable resistance of 1 kΩ and with the two-stage autotransformer bridge of LNE. The presented bridge is an improvement of the first-generation solution (a manual bridge). This bridge is based on a DualDAC™ commercial precision signal source, comprising a voltage injection system based on PXI modules and impedance adapter stages. At the end of this calibration, two main parameters are determined for each resistor as a function of frequency: the series resistance variation ∆s and the phase shift ωt. An uncertainty budget has been developed, taking into account the main sources of uncertainty of the bridge. The most important uncertainty components of the uncertainty budget are the bridge resistor values, the influence of temperature on the stability of the bridge, and the mutual induction effect. For all measured resistors, the normalized error ratios calculated with reference to the calibrations made in 1983 and 2009 are less than 1, which validates the bridge presented in this paper.
However, as with the resistors defined in a 2TP configuration, using a calculable resistor as a reference for the measurement chain, with expanded uncertainties of less than 3 µΩ/Ω on the variation ∆s and 3 µrad on the phase shift ωt up to 20 kHz, will reduce the combined uncertainties during the calibration of resistors defined in a 4TP configuration with the proposed bridge.

Author Contributions

M.O.: Design of the reference measurement set-ups, development of the generation systems, carrying out performance tests with separate and combined influence factors, and elaboration of the test procedures. R.V.: Validation of the measurement set-ups and carrying out performance tests with separate and combined influence factors. M.A.: Validation of the measurement set-ups and carrying out performance tests with separate and combined influence factors. All authors have read and agreed to the published version of the manuscript.

Funding

This research received no external funding.

Data Availability Statement

The data presented in this study are available on request from the corresponding author. The data are not publicly available due to ethical restrictions.

Conflicts of Interest

The authors declare no conflict of interest.

References

  1. Callegaro, L. Traceable Measurements of Electrical Impedance. IEEE Instrum. Meas. Mag. 2015, 18, 42–46. [Google Scholar] [CrossRef]
  2. Sindjui, R. Réalisation et Caractérisation de Dispositifs de Mesure Associés à la Détermination de la Constante de von Klitzing à Partir d’un Condensateur Calculable Etalon dit de Thompson-Lampard. Ph.D. Thesis, Université Paris Saclay (COmUE), Paris, France, 2016. [Google Scholar]
  3. Budovsky, I. Measurement of Phase Angle Errors of Precision Current Shunts in the Frequency Range From 40 Hz to 200 kHz. IEEE Trans. Instrum. Meas. 2007, 56, 284–288. [Google Scholar] [CrossRef]
  4. Overney, F.; Flowers-Jacobs, N.E.; Jeanneret, B.; Rüfenacht, A.; Fox, A.E.; Dresselhaus, P.D.; Benz, S.P. Dual Josephson Impedance Bridge: Towards a Universal Bridge for Impedance Metrology. Metrologia 2020, 57, 065014. [Google Scholar] [CrossRef] [PubMed]
  5. Kucera, J.; Sedlacek, R.; Bohacek, J. An HF Coaxial Bridge for Measuring Impedance Ratios up to 1 MHz. Meas. Sci. Technol. 2012, 23, 085004. [Google Scholar] [CrossRef]
  6. Rybski, R.; Kaczmarek, J.; Koziol, M. A PXI-Based Calibration System for Low-Value AC Resistors. IEEE Trans. Instrum. Meas. 2018, 67, 905–911. [Google Scholar] [CrossRef]
  7. Rybski, R.; Kaczmarek, J.; Koziol, M. Characterization of a digitizer for a low value resistor calibration system in the audio-frequency band. In Proceedings of the 2012 Conference on Precision Electromagnetic Measurements, Washington, DC, USA, 1–6 July 2012; pp. 580–581. [Google Scholar]
  8. Zhu, X.; Zhang, L.; Guo, Y.; Wei, P.; Zai, R.; Drewniak, J.; Pommerenke, D. I-V Method Based PDN Impedance Measurement Technique and Associated Probe Design. In Proceedings of the 2019 IEEE International Symposium on Electromagnetic Compatibility, Signal & Power Integrity (EMC+SIPI), New Orleans, LA, USA, 22–26 July 2019; pp. 30–33. [Google Scholar]
  9. Overney, F.; Jeanneret, B. Calibration of an $LCR$ -Meter at Arbitrary Phase Angles Using a Fully Automated Impedance Simulator. IEEE Trans. Instrum. Meas. 2017, 66, 1516–1523. [Google Scholar] [CrossRef]
  10. Istrate, D.; Blanc, I.; Fortuné, D. Development of a Measurement Setup for High Impulse Currents. IEEE Trans. Instrum. Meas. 2013, 62, 1473–1478. [Google Scholar] [CrossRef]
  11. Sordi, F.; Capineri, L.; Carobbi, C. Lumped Circuit Model and VNA Measurement of the RF Impedance of a Bypass Network. In Proceedings of the 2021 IEEE International Joint EMC/SI/PI and EMC Europe Symposium, Raleigh, NC, USA, 26 July–13 August 2021; pp. 196–201. [Google Scholar]
  12. Callegaro, L. Electrical Impedance: Principles, Measurement, and Applications, 1st ed.; CRC Press: Boca Raton, FL, USA, 2012. [Google Scholar]
  13. Hague, B. Alternating Current Bridge Methods for the Measurement of Inductance Capacitance. and Effective Resistance at Low and Telephonic Frequencies: A Theoretical and Practical Handbook for the Use of Advanced Students. Nature 1930, 113, 530. [Google Scholar]
  14. Christensen, A.E. A versatile electrical impedance calibration laboratory based on a digital impedance bridge. In Proceedings of the 19th International Congress of Metrology (CIM2019), Porte de Versailles, France, 24–26 September 2019. [Google Scholar]
  15. Sindjui, R. Realization and Characterization of Measuring Devices Associated with the Determination of the von Klitzing Constant from a Calculable Standard Capacitor Called Thompson-Lampard. Ph.D. Thesis, Université Paris-Saclay, Paris, France, 2017. [Google Scholar]
  16. Kibble, B.P. Four Terminal-Pair to Anything Else! In Proceedings of the IEE Colloquium on Interconnections from DC to Microwaves (Ref. No. 1999/019), London, UK, 18 February 1999. [Google Scholar]
  17. Callegaro, L. Four Terminal-Pair Impedance Comparisons at High Frequency. In Proceedings of the 21st IEEE Instrumentation and Measurement Technology Conference (IEEE Cat. No.04CH37510), Como, Italy, 18–20 May 2004; Volume 1, pp. 383–386. [Google Scholar]
  18. Ouameur, M.; Vasconcellos, R.; Agazar, M.; Thévenot, O.; Patois, E. New Impedance Bridge at LNE for the Two Terminal-Pair AC Resistor Calibration up to 20 kHz. Metrologia 2022, 59, 055005. [Google Scholar] [CrossRef]
  19. Consejo, C.; Thevenot, O.; Lahousse, L.; Piquemal, F.; David, J.M. Improvements of the Measurement Chain for the Determination of the von Klitzing Constant K. IEEE Trans. Instrum. Meas. 2009, 58, 902–907. [Google Scholar] [CrossRef]
  20. Delmas, J.; Knosp, R. Etalonnage de Résistances et de Shunts En Courant Alternatif; LNE internal project n° 81.2.46.0007 study n° 697311, report n° 941. 1983. [Google Scholar]
  21. Agazar, M.; Ouameur, M. Compensated High Input Impedance Stage for the Measurements of Four Terminals Resistors up to 20 kHz. In Proceedings of the 2020 Conference on Precision Electromagnetic Measurements (CPEM), Denver, CO, USA, 24–28 August 2020; pp. 1–2. [Google Scholar]
  22. Information Published on the Manufacturer’s Website about the DualDAC Source. Available online: https://aivon.fi/wordpress/dualdac-3/ (accessed on 5 October 2023).
  23. Ouameur, M.; Vasconcellos, R.; Agazar, M. A Double Precision Arbitrary Waveform Generator Based Calibration System for Low-Value AC Resistors up to 20 kHz. In Proceedings of the 2021 IEEE 12th Annual Information Technology, Electronics and Mobile Communication Conference (IEMCON), Vancouver, BC, Canada, 27–30 October 2021; pp. 0796–0798. [Google Scholar]
  24. EMX-1434. Smart PXI Express 4 Channel 204.8 kSa/s Arbitrary Waveform Generator. Available online: https://www.vtiinstruments.com/products/functional-test/emx-series/emx-1434 (accessed on 5 October 2023).
  25. Ouameur, M.; Vasconcellos, R.; Agazar, M. A PXI Modules-Based Voltage Injection System for AC Resistors Calibration. In Proceedings of the 2021 IEEE 7th International Conference on Smart Instrumentation, Measurement and Applications (ICSIMA), Bandung, Indonesia, 23–25 August 2021; pp. 257–260. [Google Scholar]
  26. Sindjui, R.; Gournay, P.; Thevenot, O.; Thuillier, G. Fabrication of a standard two-stage autotransformer at LNE. In Proceedings of the 29th Conference on Precision Electromagnetic Measurements (CPEM 2014), Rio de Janeiro, Brazil, 24–29 August 2014. [Google Scholar]
  27. Schurr, J.; Melcher, J. Unequalized currents in coaxial AC bridges. IEEE Trans. Instrum. Meas. 2004, 53, 807–811. [Google Scholar] [CrossRef]
  28. Thevenot, O. Calibration of Standard Transformers. Master’s Thesis, Conservatoire National des Arts et Métiers (CNAM), Paris, France, 2003. [Google Scholar]
  29. Manceau, J. Characterization of Standard Resistors in Sinusoidal Alternating Current; LNE internal project n° 81.2.46.0007 study n° 2.03, report n° PQ/96-EM-8; 2010.
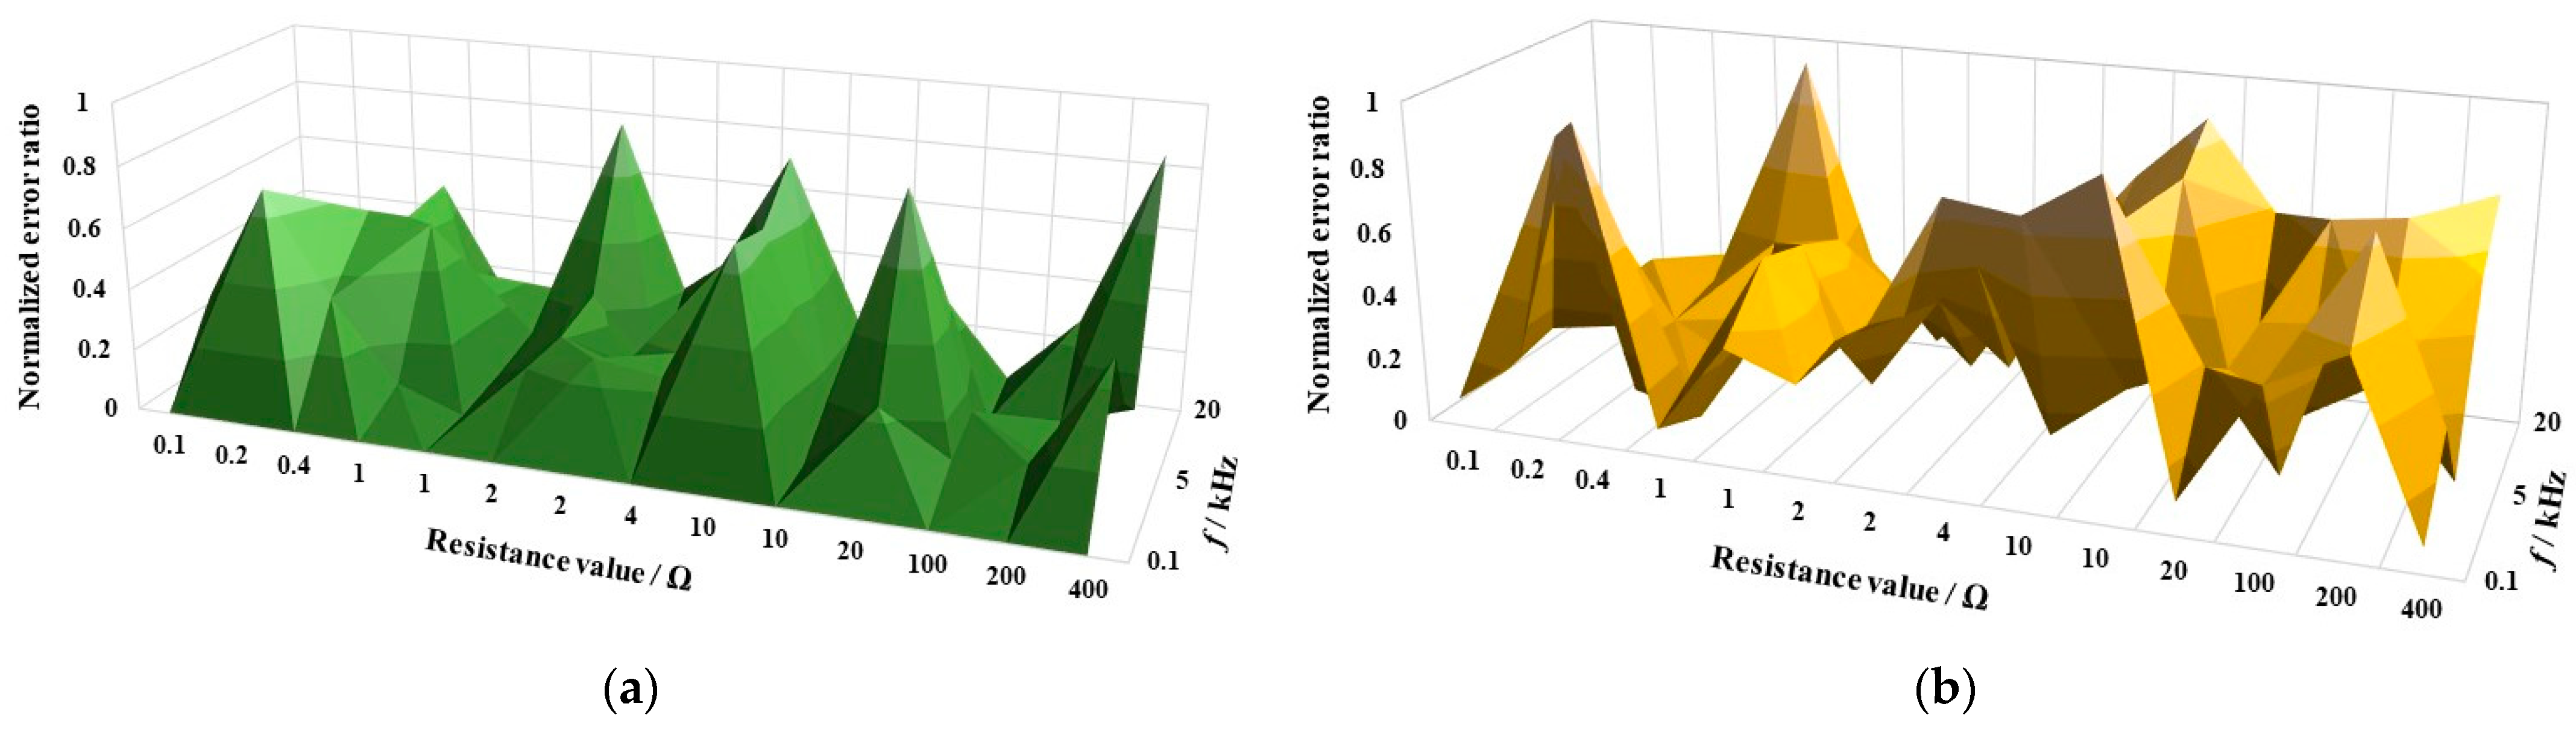
  30. Lee, Y.S. Applying Normalized Error Ratio in the Vector Measurement Quantities. In Proceedings of the 74th ARFTG Microwave Measurement Conference, Broomfield, CO, USA, 30 November–4 December 2009; pp. 1–6. [Google Scholar]
Figure 1. Schematic of the Wheatstone bridge for AC resistors defined in a four-terminal pair up to 20 kHz.
Metrology 04 00001 g001
Figure 2. High-impedance stages. (a) Schematic diagram; (b) implementation.
Metrology 04 00001 g002
Figure 3. Measurement chain for AC resistors defined in a four-terminal pair at LNE to a 1 kΩ standard resistor (R1M). The chain is made by sequentially connecting pairs of standards for the following bridge ratios: 2 and 10.
Metrology 04 00001 g003
Figure 4. Normalized error ratio of measurements with the presented digital impedance bridge, compared with the calibration results in the year 1983 for values between 100 mΩ and 400 Ω and up to 20 kHz. (a) Values for the variation of the series resistance Δs. (b) for the phase ωt.
Metrology 04 00001 g004
Figure 5. Normalized error ratio of measurements with the presented digital impedance bridge compared with the calibration results of the year 2009 for values between 100 mΩ and 400 Ω and up to 20 kHz. (a) Values for the variation of the series resistance Δs. (b) Values for the phase ωt.
Metrology 04 00001 g005
Table 1. The measured values, with uncertainties (k = 2), of the capacitors Cp and the resistors Rp of each adapter stage.
Frequency (kHz)Adapter Stage AAdapter Stage A
Capacitance Cp (fF)Resistance Rp (GΩ)Capacitance Cp (fF)Resistance Rp (GΩ)
0.195.1 ± 0.53011.4 ± 0.995.1 ± 0.52589.2 ± 0.9
0.295.0 ± 0.42055.2 ± 0.995.0 ± 0.42375.3 ± 0.9
0.595.1 ± 0.41971.3 ± 0.995.0 ± 0.42347.6 ± 0.9
195.2 ± 0.2922.9 ± 0.995.2 ± 0.2753.1 ± 0.9
295.1 ± 0.4235.3 ± 0.995.1 ± 0.4217.6 ± 0.9
595.0 ± 0.843.1 ± 0.995.0 ± 0.841.9 ± 0.9
1095.1 ± 1.611.5 ± 0.995.0 ± 1.611.5 ± 0.9
2095.2 ± 1.63.1 ± 0.995.2 ± 1.63.1 ± 0.9
Table 2. Uncertainty components (k = 1) for the LNE’s impedance bridge.
Resistance Defined in 4TP ConfigurationFrequency (kHz)Estimated Uncertainty (k = 1) of the Different Uncertainty Components of the Wheatstone Bridge Due to:Estimated Uncertainty
(k = 2)
Impedances ZE, Z1 et Z’1Complex Transfer Coefficients kinj and k’injInfluence of Temperature on the Stability of the Bridge (UB1)Accuracy Error Associated with the Adapter Stages (BL1)Influence of Parasitic Impedances (BL2)Mutual Induction Effect (BL3)
Δs
(µΩ/Ω)
ωt
(µrad)
Δs
(µΩ/Ω)
ωt
(µrad)
Δs
(µΩ/Ω)
ωt
(µrad)
Δs
(µΩ/Ω)
ωt
(µrad)
Δs
(µΩ/Ω)
ωt
(µrad)
ωt
(µrad)
Δs
(µΩ/Ω)
ωt
(µrad)
SC1 (1 Ω)0.13.63.60.60.62.42.41.01.00.60.10.69.19.2
15.05.10.60.62.42.41.01.00.61.40.611.511.9
511.611.60.60.62.42.41.01.40.67.23.023.928.6
1019.920.00.60.62.42.41.02.20.614.46.040.251.2
2034.919.20.80.82.42.41.04.10.628.812.070.173.9
SC0.1 (100 mΩ)0.15.56.00.40.42.82.81.01.00.00.03.212.514.8
17.213.00.30.32.82.81.01.00.00.03.215.627.4
515.246.60.30.32.82.81.01.40.00.115.831.198.5
1025.688.70.30.32.82.81.02.20.00.231.651.5188.5
2045.3170.50.50.52.82.81.04.10.00.363.290.8363.9
Table 3. Values and uncertainties (k = 2) of the variation ∆s and the phase shift ωt of the resistor SC0.1 (100 mΩ).
Frequency (kHz)ParametersYear of Calibration
198320092022
0.1Variation Δs (µΩ/Ω)0 ± 110 ± 110 ± 13
Phase shift ωt (mrad)0.23 ± 0.010.23 ± 0.010.23 ± 0.01
1Variation Δs (µΩ/Ω)26 ± 1528 ± 1532 ± 16
Phase shift ωt (mrad)2.32 ± 0.032.32 ± 0.032.32 ± 0.03
5Variation Δs (µΩ/Ω)260 ± 33260 ± 33261 ± 31
Phase shift ωt (mrad)11.3 ± 0.111.3 ± 0.111.3 ± 0.1
10Variation Δs (µΩ/Ω)470 ± 56459 ± 56461 ± 52
Phase shift ωt (mrad)22.3 ± 0.322.3 ± 0.322.3 ± 0.2
20Variation Δs (µΩ/Ω)840 ± 100813 ± 100812 ± 91
Phase shift ωt (mrad)44.3 ± 0.544.3 ± 0.544.3 ± 0.4
Table 4. Values and uncertainties (k = 2) of the variation ∆s and the phase shift ωt of the resistor SC0.2 (200 mΩ).
Frequency (kHz)ParametersYear of Calibration
198320092022
0.1Variation Δs (µΩ/Ω)0 ± 100 ± 100 ± 10
Phase shift ωt (mrad)0.19 ± 0.010.19 ± 0.010.18 ± 0.01
1Variation Δs (µΩ/Ω)25 ± 1324 ± 1338 ± 13
Phase shift ωt (mrad)1.86 ± 0.031.90 ± 0.031.89 ± 0.03
5Variation Δs (µΩ/Ω)125 ± 28101 ± 28131 ± 28
Phase shift ωt (mrad)9.1 ± 0.19.2 ± 0.19.1 ± 0.1
10Variation Δs (µΩ/Ω)225 ± 46205 ± 46218 ± 46
Phase shift ωt (mrad)18.2 ± 0.218.1 ± 0.218.1 ± 0.2
20Variation Δs (µΩ/Ω)400 ± 83404 ± 83417 ± 83
Phase shift ωt (mrad)36.2 ± 0.436.3 ± 0.436.3 ± 0.4
Disclaimer/Publisher’s Note: The statements, opinions and data contained in all publications are solely those of the individual author(s) and contributor(s) and not of MDPI and/or the editor(s). MDPI and/or the editor(s) disclaim responsibility for any injury to people or property resulting from any ideas, methods, instructions or products referred to in the content.

