Case Report

The Safe Campus Project— Resilience of Academic Institutions during the COVID-19 Crisis

Medical and Biological Physics, Technische Universität Dortmund, Otto-Hahn-Str., 44227 Dortmund, Germany
*
Author to whom correspondence should be addressed.
COVID 2022, 2(10), 1435-1448; https://doi.org/10.3390/covid2100103
Submission received: 1 September 2022 / Revised: 19 September 2022 / Accepted: 20 September 2022 / Published: 10 October 2022

Abstract

:
In this study, we describe how to keep a campus safe and “open” by implementing a proactive, as opposed to reactive, strategy (the Green Zone strategy). The pillars are leadership, clear communication, clean air, vaccination campaigns, and intense efforts in mass testing. Over a period of 12 months, about 277,000 pooled real-time polymerase chain reaction (RT-PCR) samples and lateral flow tests (LFTs) were collected, and 201 people were identified as COVID-19-positive. For the PCRs, we use the Lollipop technique, combined with nose swabs and gargle samples, to minimize sample-collection efforts. Importantly, not only staff, students, and contractors, but also their family members, friends, and partners; daycare centers; and local sports and arts teams, etc., were invited and participated. This outreach made it possible to propagate the tests more widely and monitor a larger network. At times of larger social gatherings—most prominently, on 23 December 2021 before Christmas (during the rise of the Omicron wave)—testing capacities were increased. The results not only demonstrate the great power of mass testing in providing an open-but-safe work environment, even if the surroundings are highly infectious (red zone), but also the strength and resilience of a university. It shows how the unique pillars of science, infrastructure, students, and independency make it possible to maneuver a community, even through unpredictable times.

1. Introduction

There is probably little scientific doubt that an elimination strategy would be the best solution for any new arising form of an infectious disease [1,2]. However, there seems to be a lot of doubt about whether such a strategy could be realized. Often, concerted efforts over larger areas (several countries, states, counties, or municipalities) seem to be nearly impossible to organize. We here show that local efforts are always worthwhile. Of course, they work best when more areas commit to the efforts. However, even if you are in it alone, it is still better to act when it comes to the two choices: wait or take action.
We first describe the theoretical concept, which is built along the lines of Yaneer Bar-Yam’s work (the Green Zone model) [3,4], but which has also been thoroughly described by others [5,6]. It outlines the importance of a good detection tool; that is, a testing strategy that can identify a significant number of infected people. It demonstrates how this concept can be put into action on a university campus and why universities have a particular opportunity to be excellent role models by integrating the community in their strategies.

2. Theory and Background

2.1. The Green Zone Concept

Let us start with a fire analogy. Small, local fires are relatively easy to stamp out, while wildfires in large areas are not. If we imagine a state or county as a collection of small municipalities that are independently governed, each municipality could fairly easily control the local fire. The caveat is that fire does not care about the jurisdiction of a municipality; it simply spreads across the borders from one to the next. In other words, as long as the fire is uncontrolled on a larger scale, local action, although still helpful, is considerably weakened.
Figure 1 illustrates the difference between reactive and proactive responses. The mindset is to strive for local elimination, which should make it possible to return to fairly normal life, although monitoring will not stop as long as the virus travels and vaccination does not sufficiently protect the community. To be clear: Striving for local elimination does not mean attempting to eradicate the virus from the globe. That would be a naive assumption and only differentiate between two end points: eradication or not. Local elimination simply means keeping the local numbers of (risky) infections as low as possible to minimize the danger to the community. Furthermore—by giving the virus fewer opportunities to mutate—it reduces the chance for new variants of concern, which in turn protects everybody. This can be achieved through a rapid, localized, and effective response (a proactive strategy). A simple comparison can illustrate the overwhelming difference from a reactive response. At a doubling rate of one week, for instance, the damage after six months, and, hence, the measures required in order to stop the virus from spreading, will be about 600,000 times greater compared to weekly local elimination. Importantly, it is not only that the number of deaths will be dramatically higher, but also the measures required in order to regain control over the situation will have to be much harsher and much more widespread. Hence, if you want to control a virus and avoid large scale lockdowns, you should always act rapidly without hesitation.
Fortunately, we have some good tools that work against the spreading of a virus. First, we know that a virus feeds on our social contacts. If we avoid contact, the virus has nowhere to go and vanishes quickly. Second, if we know the path of transmission of the virus (air, water, body fluids, etc.), we can act in a more targeted manner in order to optimize the efficiency of the reduction in social contact; using proper cleaning systems, either for air or for water, would be a typical example. Last but not least, there is the identification of the virus. The more precisely one knows where the virus is, the more targeted and localized actions can be applied. Lockdowns are not necessary if every infected individual is known and behaves appropriately. We simply need to isolate those infected, who represent a tiny fraction of the population. In this context, SARS-CoV-2 is special and demonstrates the importance of testing. Since the “natural detection” method, which utilizes health symptoms, does not work very well with COVID-19 [7,8], and since about 50% of infections result from infected people without symptoms [9], we needed to think about testing strategies in order to identify and suppress SARS-CoV-2.

2.2. Creating a Baseline of Safety by Vaccination and Clean Air

Three major tools are fairly easy to implement. Vaccination, clean air, and masks.
First, vaccination. This not only considerably reduces the odds for a severe case, but—even though to a much lesser degree—also slows down transmission [10] and the risk of long-term health issues (long COVID-19). Create a low threshold for people to receive their shot. This can be achieved by good leadership, open communication on the pros and cons of vaccination, and by providing easy access with on-campus walk-in vaccination events and a list of sites with available doses.
The second major tool of protection is clean air. SARS-CoV-2 is airborne [11]. Good ventilation, filtration, and of course masks significantly lowers the risk of infections. This has been ignored or not fully appreciated for far too long, which caused not only a lot of direct damage to health, the economy, and society, but also weakened the trust of society in officials, making the spread of misinformation even more successful [12]. Clean air, similar to clean water or “clean” intercourse, can be provided by good ventilation or filter systems. During a warm period outside, simply opening the windows for most of the day is probably very efficient. Where windows cannot be opened continuously, for whatever reason, a filter system should be installed. The options range from expensive HEPA filter systems in the order of thousands of dollars, household filters in the order of hundreds of dollars, all the way to simple do-it-yourself systems, such as the Corsi–Rosendahl box for as cheap as USD 100 [13]. Those who have used the past years to stock up on good filter systems instead of engaging in long debates about what is the perfect solution, killed at least two birds with one stone: (i) protecting their students and staff by providing clean air and (ii) saving a lot of energy during a raging energy crisis in Europe. Only if CO2 levels reach a threshold, air is exchanged. Until then, air is filtered to reduce heat loss.
Third and last but by far not least: Masks should not even be a debate, as long as numbers are high and people are becoming sick or even dying. The golden rule should always be applied: Treat those in trouble the way you want to be treated when in trouble. It is irrelevant whether the major threat is only toward the elderly and people with comorbidities. It also does not matter whether clear proof of long-term consequences (long or post-COVID-19) surely exists. The absence of evidence must not be confused with the evidence of absence if the potential damage is significant [3]. In other words, even if the chances of winning EUR 100,000 are 99.9% in a game of Russian roulette, walk away.

2.3. Testing Strategies

Testing enables us to confine the battle against SARS-CoV-2 only to those infected. PCR tests are still the gold standard [14], but reliable antigen tests or lateral flow tests (LFTs) can be used as well to help control the spread [15]. The advantages of LFTs are obvious: The results are returned within 15 min and the sample collection can be performed anywhere. Their lower sensitivity rates have not only been perceived as a disadvantage. Indeed, if positivity would slightly coincide with or precede infectiousness, this would be the silver bullet [16]. However, great variations in quality [17] and positivity only partially after symptom onset [18] require further tools. PCR analysis, however, is not perfect either. It requires specific and expensive lab equipment, more expensive chemicals, and usually takes many hours to days until the results are returned, especially if the demand for tests is high. Another option would be loop-mediated isothermal amplification (LAMP), which is still a lot more sensitive than LFTs and requires less expensive tools than RT-PCR. Whatever method you choose depends not only on the setting and your budget, but also on the degree of infections you are facing. Especially for low-incidence strategies—such as the Green Zone approach—LFTs may become insufficient. However, they can be very powerful to slow down the spread at high rates of infections. The differences in sensitivity between antigens, RT-LAMP, bead LAMP, and direct RT-PCR compared to diagnostic RT-qPCR for Ct values equal to or below 35 are roughly 72.92% [19], 82%, 93%, and 98%, respectively [20]. In summary, choose your combination of testing tools according to your local setting and availability. Adapt in time as well as space and location. Focusing on just one testing tool country-wide was and is not a good idea and leads to unnecessary confusion.

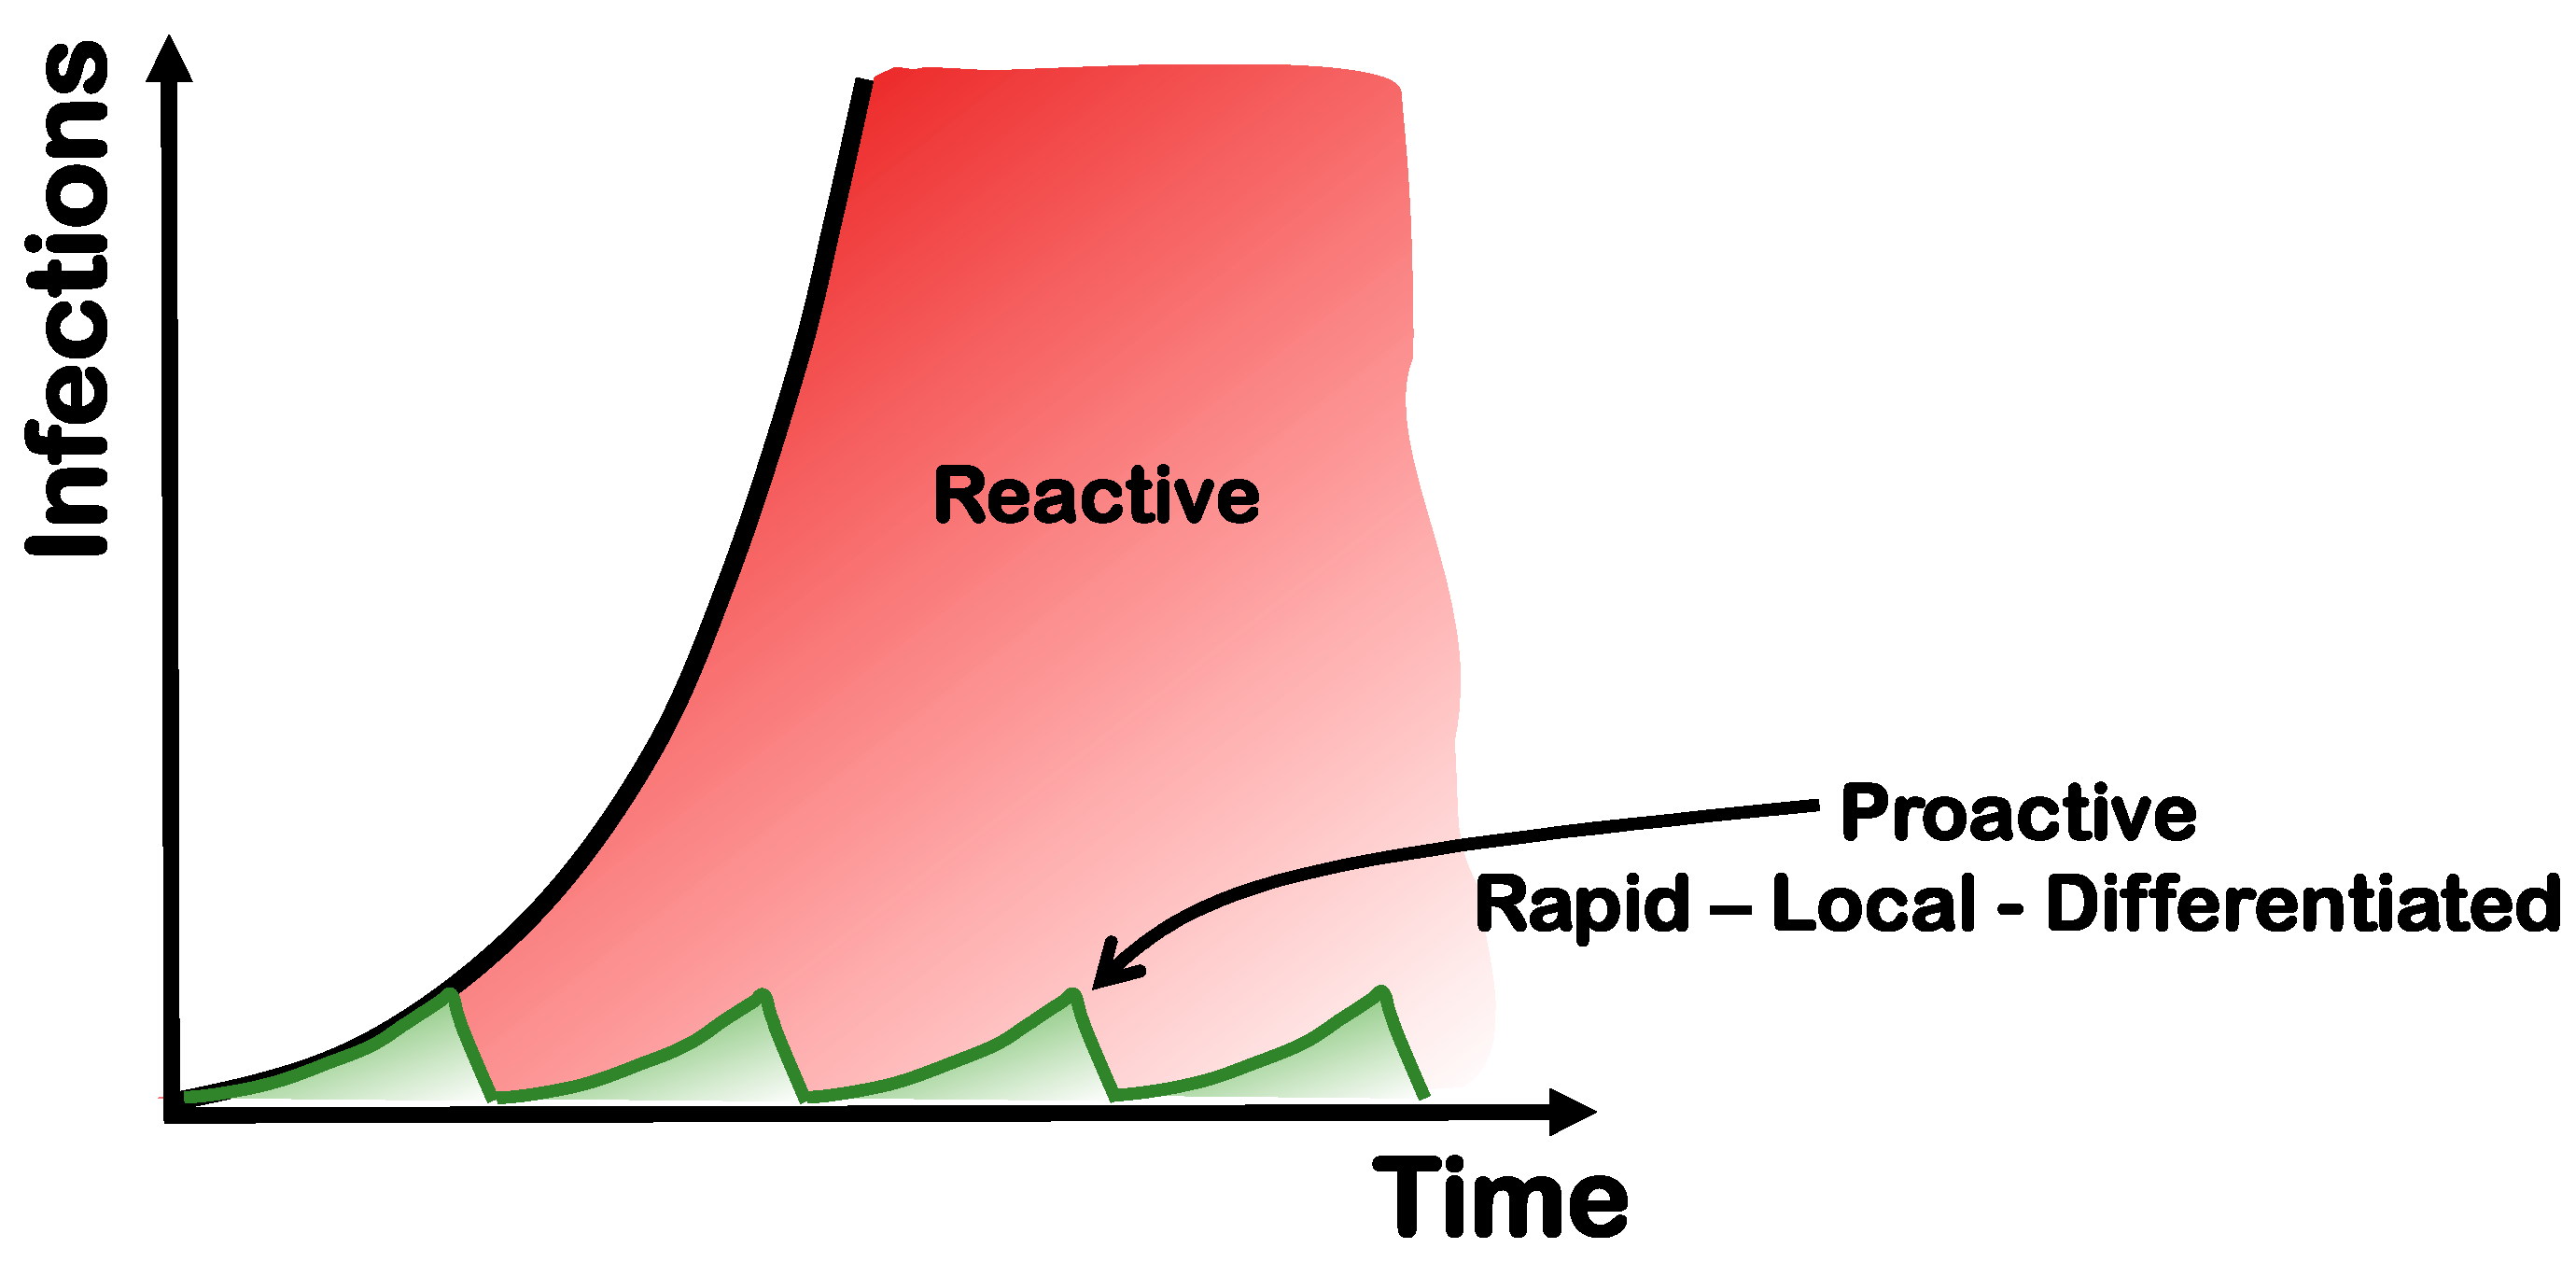
2.4. Massive Testing Instead of Lockdowns

Lockdowns lead to a considerable reduction in contacts on which the virus feeds. Ideally, the number of infectious persons can be reduced by up to 90%, and the effective probability of an infectious person generating an infection is thus reduced by a factor of 10. However, lockdowns not only entail considerable economic costs, but also social costs.
Suppression due to mass testing: Mass testing could offer an economically and socially more acceptable alternative to lockdowns. Kühn et al. recently demonstrated clearly that, especially when combined with rapid response and localized contact reduction, a Green Zone approach would have been entirely feasible, even in a country such as Germany with approximately 3700 km of land borders [21]. To understand the impact of testing, at least semi-quantitatively, we considered that a fraction f of all infections (N0) was isolated at each testing step. The number of infections (Ni) still in circulation after i + 1 tests at a test interval of Δt days and a doubling interval τ is, to a first approximation:
N i + 1 = ( 2 Δ t τ ) i ( 1 f ) i + 1 N 0
The first term on the right-hand side of the equation describes the growth without the effect of mass testing. For τ = 2, in agreement with reports on Omicron, the increase for a test interval of one day (Δt = 1) is √2, which is just over 40% per interval. The second term describes the fraction of infection that is eliminated at each test step. Only if the latter overcompensates the first does the number of infections decrease.
Estimation of corrections: Although the equation above provides a good estimate, in reality the model is of course more complicated and several groups have thoroughly studied the impact of testing frequency on the reduction in infections [6,22,23]. One complication arises from the fact that infectivity and detectability are shifted with respect to each other. For oropharyngeal swabs and a PCR test, it is approximately 1–3 days [17]. Thus, for individuals whose infections occurred less than three days ago, it may not be detected by PCR and produce new infections even if tested. Furthermore, these numbers have to be taken with a grain of salt. When observing incubation times, one finds, that they are fat tailed (often approximated by a log-normal distribution) and stretch out over 12 days (90th percentile) [24]. Although incubation times are defined as the time between infection and symptoms and not between infection and testability (which is crucial for a mass-testing strategy), the above-mentioned numbers of 1–3 days are based on a study of limited statistics. It is suggested that at least in some people, the virus seems to remain dormant for a while, until it begins to significantly replicate. These effects are not taken into account in the above equation and would require a more advanced mathematical treatment. Concrete corrections for the delay between testability and infectiousness require a more rigorous mathematical treatment, which is discussed elsewhere. However, given the fact that the amount of people remaining undetected despite testing (=the tail fraction x of the log-normal distribution) is fairly small compared to f (x ≈ 0.1), the corrections are rather small (<2x). Thus, if at a doubling time τ = 2 days, 70% (f = 0.7) of the population in a city or district are tested every Δt = 2 days and isolated accordingly, the number of infectious people would be reduced by about 90% or by a factor of 10 in 1–2 weeks. This is roughly equivalent to the effect of a lockdown. In one month, with mass testing and no lockdowns, the incidence could be reduced to single digits and thus to an easily controllable state. Controllable means that local outbreaks can be rapidly eliminated (see Figure 1). Similar results are also discussed in a much more detailed and sophisticated simulation of the groups of Basermann and Meyer-Hermann [6,21], who demonstrated that a Green Zone (NO-COVID-19 [25,26]) approach would certainly have been possible in Germany as well, and is by no means limited to states on an isle or permanent lockdowns.
Optimal pool size. Expanding the testing capacity should not be difficult, especially not if universities are increasingly involved and additional methods to PCR, such as the LAMP technique, are added. The latter can be easily performed by non-professional personal and does not require expensive lab equipment [20]. Detailed open access protocols exist (rtlamp.org) and could be easily rolled out on all levels, family and friends bubbles, sports teams, companies, schools, daycare centers, (small) communities, et cetera. The easily performed gargle or Lollipop method allows the pooling of 20 or even more samples [27,28], which of course has to be adapted to the respective incidences. If the latter goes through the roof, even pooling can become counterproductive. The optimal pool size can be easily calculated. If Nt is the total number of tests performed, n the pool size and I the fraction of tests that turn out positive, which is the fraction of infected people in the sample. We assume that each pool has either one or none positives, which is correct in the limit of small I. The total number of tests to be performed in order to determine an infectious individual is then:
N t = N 0 n + I N 0 n
where N0 is the total amount of people tested. The first term describes the number of pools, while the second term represents the number of tests needed to resolve a positive pool. This equation exhibits a minimum for the optimal pool size nopt = √1/I. That means, if 10% of the population is infected (10,000 in 100,000), the pooling of groups more than 3 are counterproductive (although this number is a lower bound due to the enforced boundary condition of just one or none positive samples per pool). However, if rates of infection return to those known from before the Omicron wave (1/1000 or less in 2020 and 2021), an entire school class could be put together in one or two pools.
The expansion of mass testing would further reduce the risk for new entry and thus local outbreaks. Combined with good clean-air approaches (ventilation, filters, and masks), vaccination campaigns, and 2G+ indoors with an increased risk of infection, one can effectively delay the doubling time τ. This would provide some leeway for “weaknesses” in test frequency (Δt), population compliance, and test sensitivity (f), and the risk of re-introduction. Testing frequencies should be as high as possible wherever vulnerable groups are located.
We conclude from our work and those of others that high-frequency mass testing combined with clean-air and vaccination campaigns can reduce incidences to single digits within a few weeks. Once a low incidence has been achieved across the board, the area to be monitored by testing considerably shrinks and is increasingly reduced to the “periphery”, such as border areas and airports. Importantly, local efforts must considerably increase if the risk for the entry of new variants increases only slightly. Additionally, non-personalized testing tools (PCR or LAMP tests of sewage water, air, and surfaces) used to monitor the virus may further reduce the burden on the population and students and kids in particular.

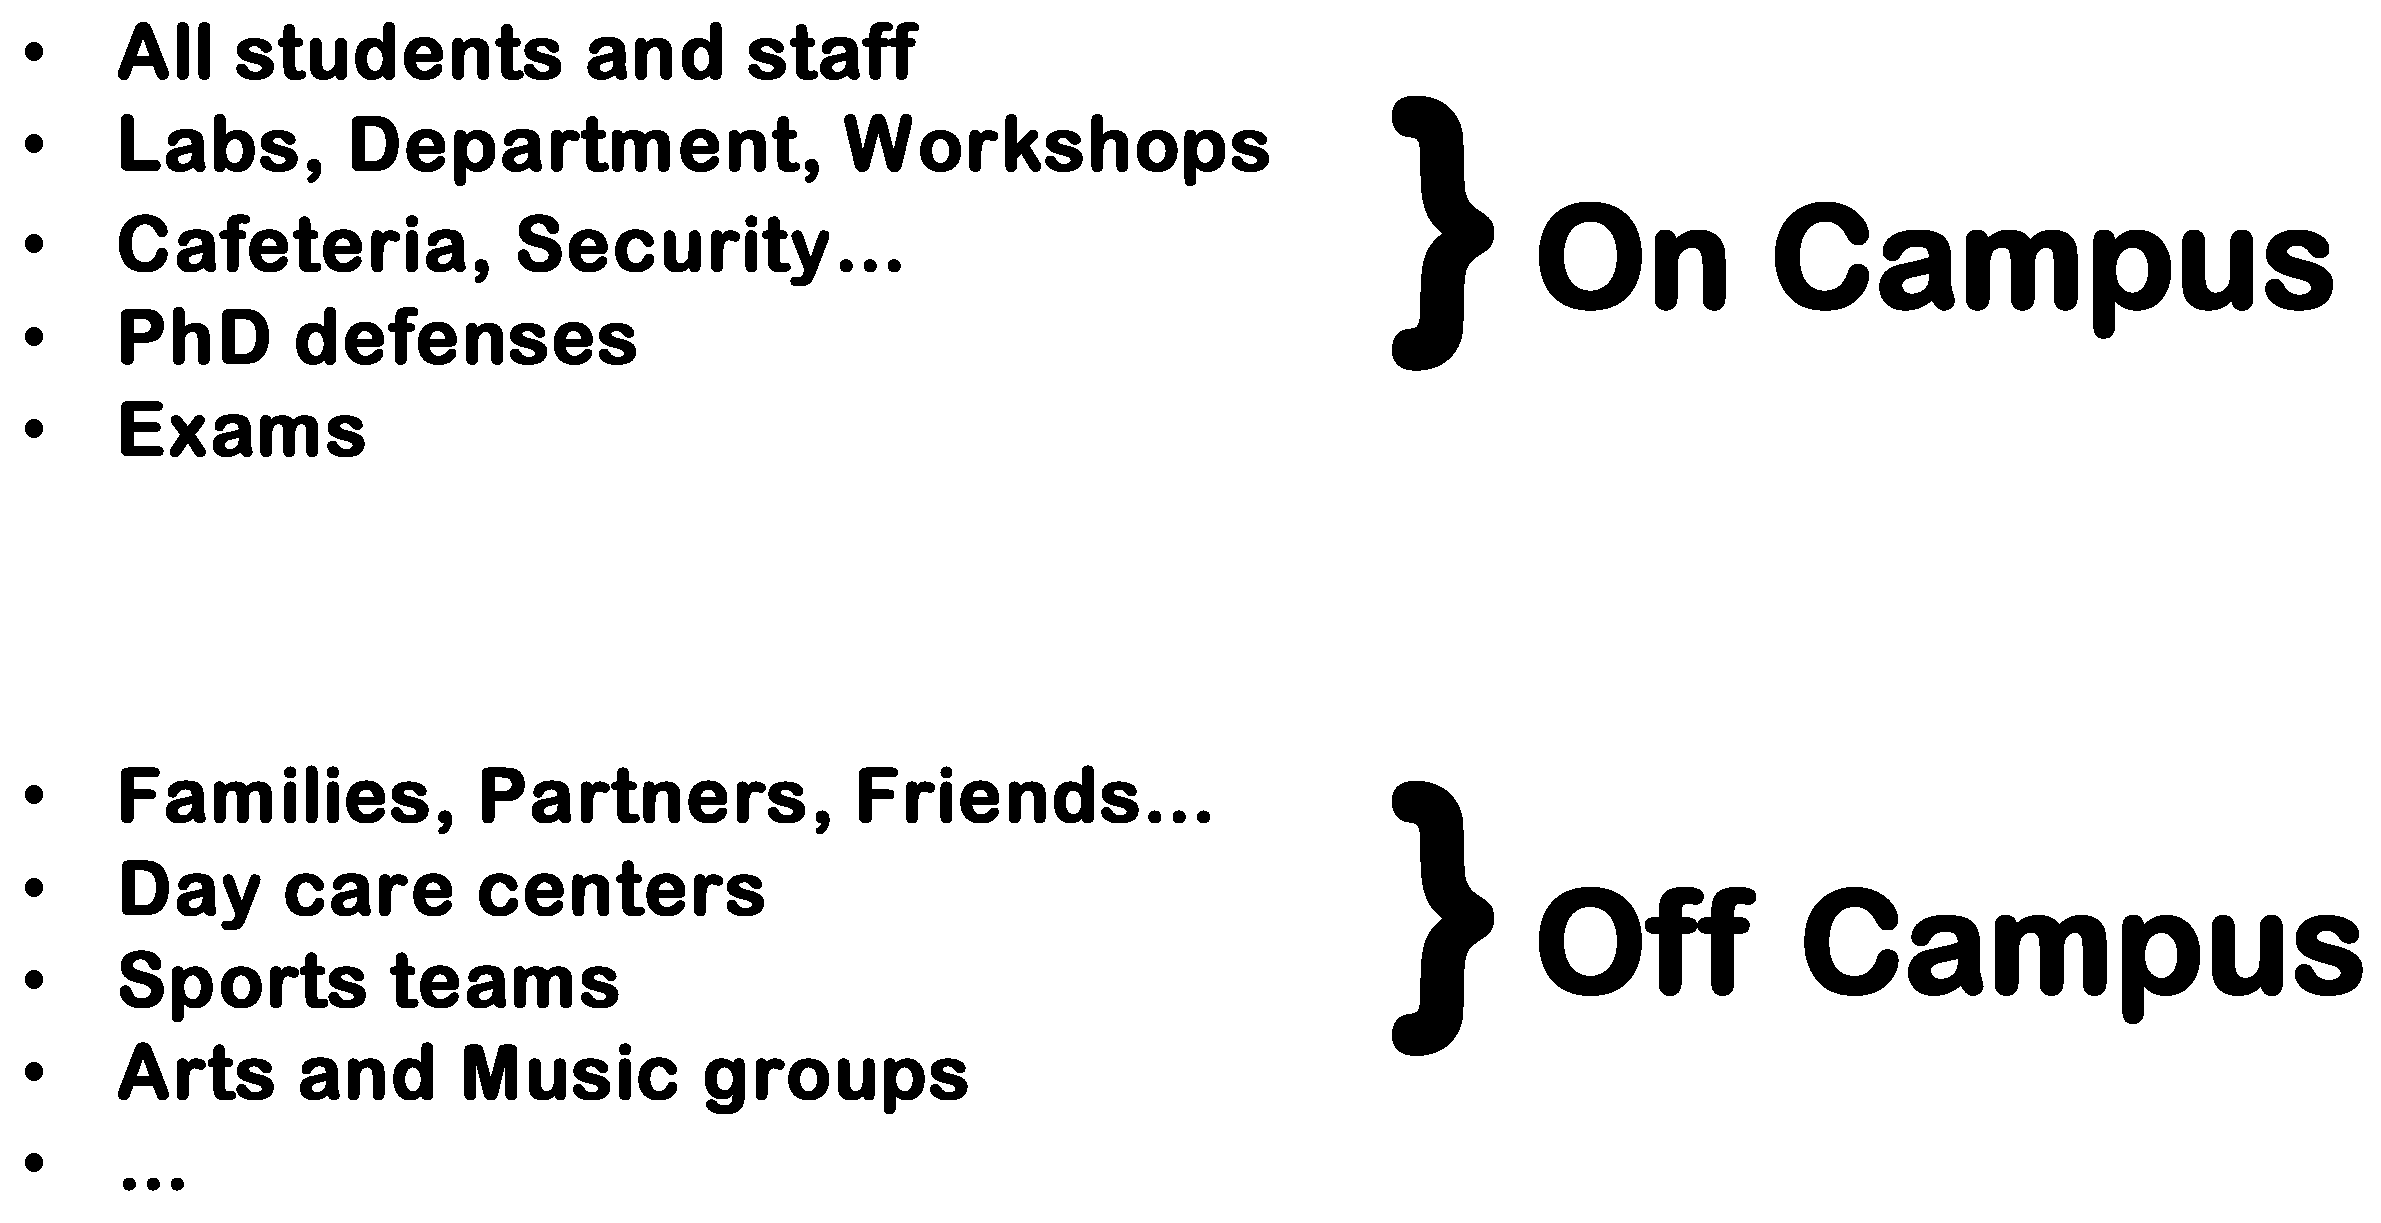
2.5. Local Efforts in a Global Environment

We close this section by returning to the initial issue: Is it worthwhile to protect a local area, striving for elimination (Figure 1), if the rest of your surrounding is not playing along? The simple answer is yes, of course. Just as it is worthwhile to extinguish a fire now even if you are quite certain, another one will arise. (1) With every wave of infections, you will lose people. If your community skips a wave of infections, it skips a wave of suffering human beings. (2) Along the same lines, it is false to conclude that since you survived the infection the first time without much harm (including long or post-COVID-19), you will survive a second or third one equally easily. Just compare the wild-type and delta waves. Continuously emerging new variants from the global Petri dish do not allow us to make this conclusion. You put yourself at risk again and again in particular to the long-term effects (long COVID-19), which are very poorly understood, thus making you the Guinea pig of a global experiment. In other words, we have to realize that every infection matters. (3) You set an example for how a community is not powerless, but can protect itself and be a good role model. (4) It is a much better investment. While regions with high infection rates are either anxious or busy treating their sick community members, your community is busy keeping the numbers down in order to keep life and economy open. Additionally, once the numbers are down, only a small group of the community is required to keep everybody safe. (5) On a global scale, you increase the chance to stop the pandemic for real. The lower the amount of people with an infection, the lower the rate of mutations. If you isolate those infected (enabled due to a good test strategy), potential mutations are prevented from spreading.
This pandemic may easily continue, until we decide to end it. However, an endemic situation is as promising as herd immunity or the “live with the virus” philosophy. Not much more than ignoring the situation, for instance, is the fact that a few hundred people still die every single day from COVID-19 in Germany, the size of a transatlantic passenger flight. Ignoring this increases further the considerable risk of economical and societal burdens for long-term damages. Endemic includes the tacit assumption that it is mild and inevitable, and therefore paints not only a false picture, but a dangerous certainty. It carries the great risk of maneuvering humanity into many years of illness, accompanied by unpredictable waves of disease outbreaks [29].

3. Testing Procedures

3.1. Test Strategy 1.0—PCR Plus Antigen

The first testing strategy that was implemented at TU Dortmund was based on a combination of LFTs and pooled PCR tests. Participating TU members were supposed to perform an LFT (nasal swab) at home, each day they were present at the university. Only in case of a negative LFT and without symptoms were they allowed to enter the campus. Additionally, up to two PCR tests were supposed to be performed per week (one on the first day of presence and a second one in the case of three or more days of presence). For the collection of the samples, three test stations were located on the campus, with two parallel testing streets each (an example of a test station is shown in Figure 2ac.
On entering a testing street, contact information had to be submitted and a QR code was generated for the test. Additionally, two sampling swabs were delivered. The next step was the sample extraction. For this, the Lollipop technique [28] was combined with a nasal swab. The sample was extracted by the participants themselves by sucking on a sampling swab for 30 s first. Then, the same sampling swab was inserted consecutively into both nostrils (circa 2 cm deep) and rotated alongside the inner surface of the nose (circa 10 times). Two samples were extracted for every test. At the end of the testing street, the first sample (sample A) was put into a pool of up to 10 samples in total. The second sample (sample B) was stored separately, together with the other B samples corresponding to that pool. All collected pools with corresponding B samples were transported to Klinikum Dortmund. There, the PCR analysis of the pools was conducted on the same day. The results of the tested pools could be checked by scanning the QR code and were available within 24 h. Only in case of a positive pool were the corresponding B samples tested to resolve that pool. In case of a positive B sample, the responsible public health department was informed.
Over a time span of 28 weeks, from 15 March to 26 September 2021, a total of 26,957 samples were PCR tested in pools in the described way. This equates to an average of 962.75 tested samples per week. Of the B samples that had to be tested—to resolve a positive pool—a total of 4 were positive. For the prior testing at home, TU Dortmund distributed a total of 135,917 LFTs to its members over a period of 27 weeks, from April to September 2021, which equates to an average of 5033.96 distributed LFTs per week.

3.2. Why a New Testing Strategy?

Speed trumps perfection. The initial testing strategy 1.0 took all the infrastructure available on campus and hospital to rapidly implement a testing strategy. Speed was at the essence. Once a regular testing concept was up and running, we researched and designed—in collaboration with scientist all over the globe—a new testing strategy to overcome some of the shortcomings. It is important though, that details, optimizations, and perfection while discussed must under no circumstances hinder interventions. Nothing is more costly for health, the economy, and society than time (see Figure 1).

3.3. Test Strategy 2.0
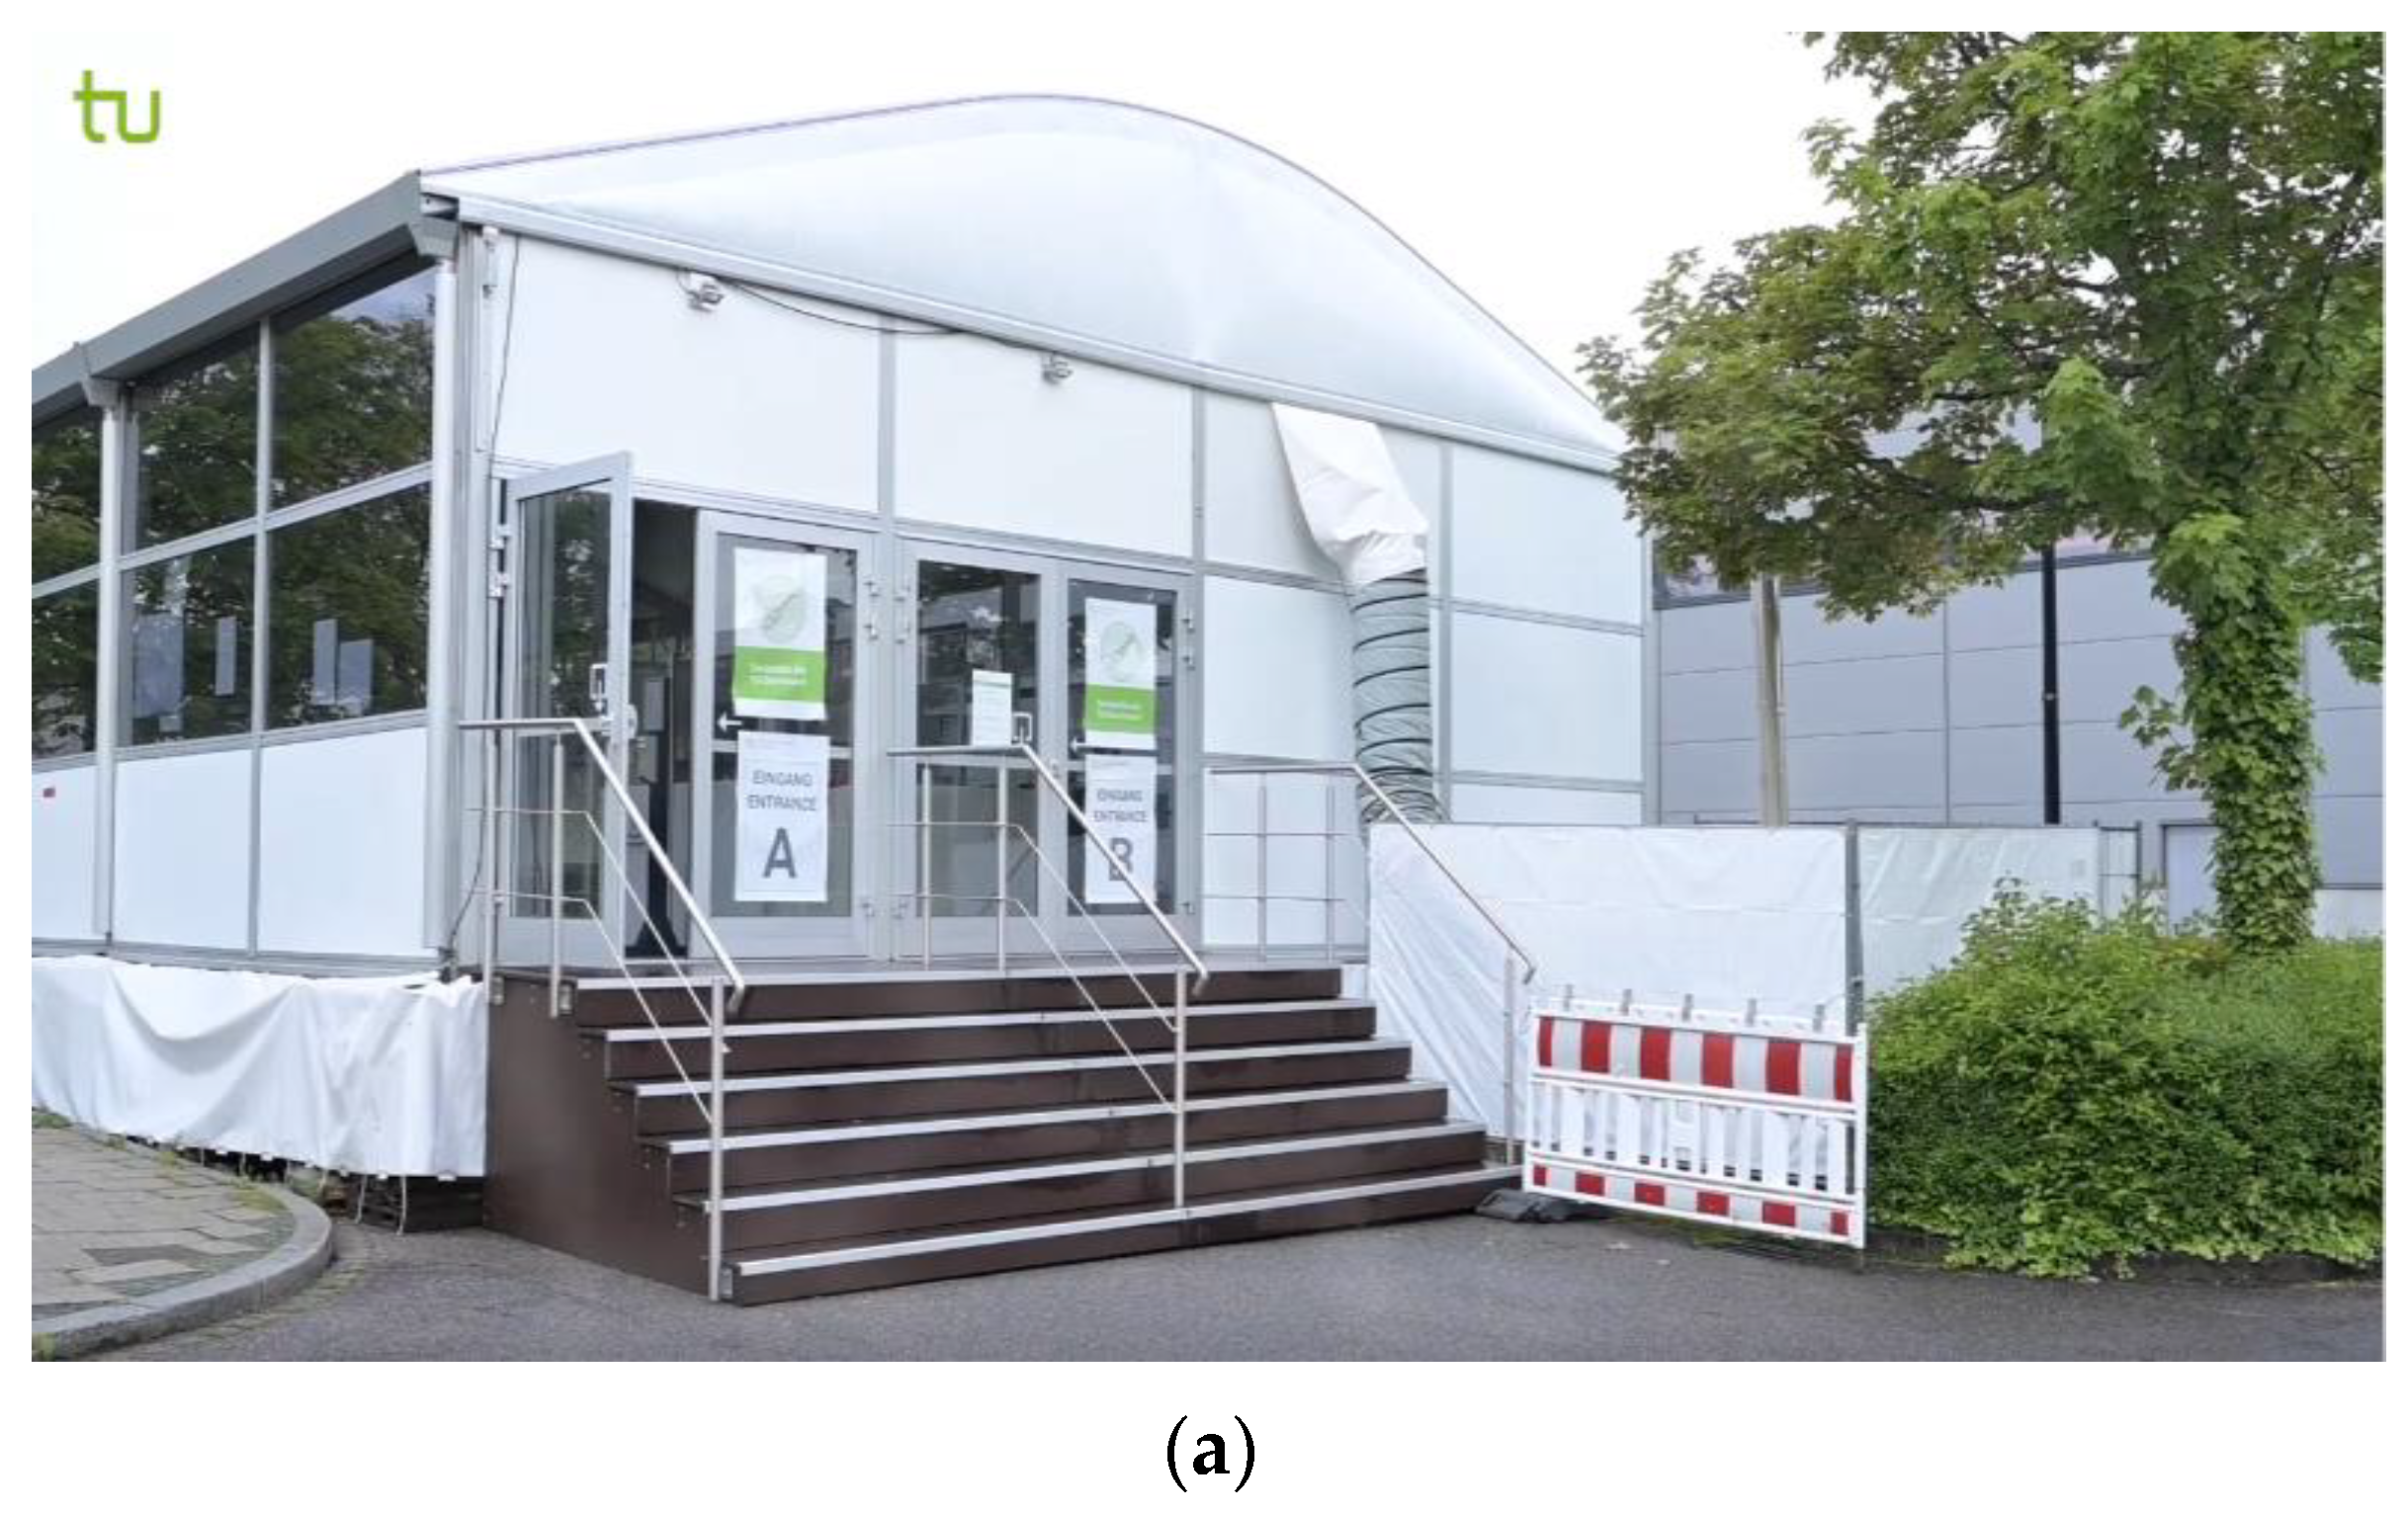
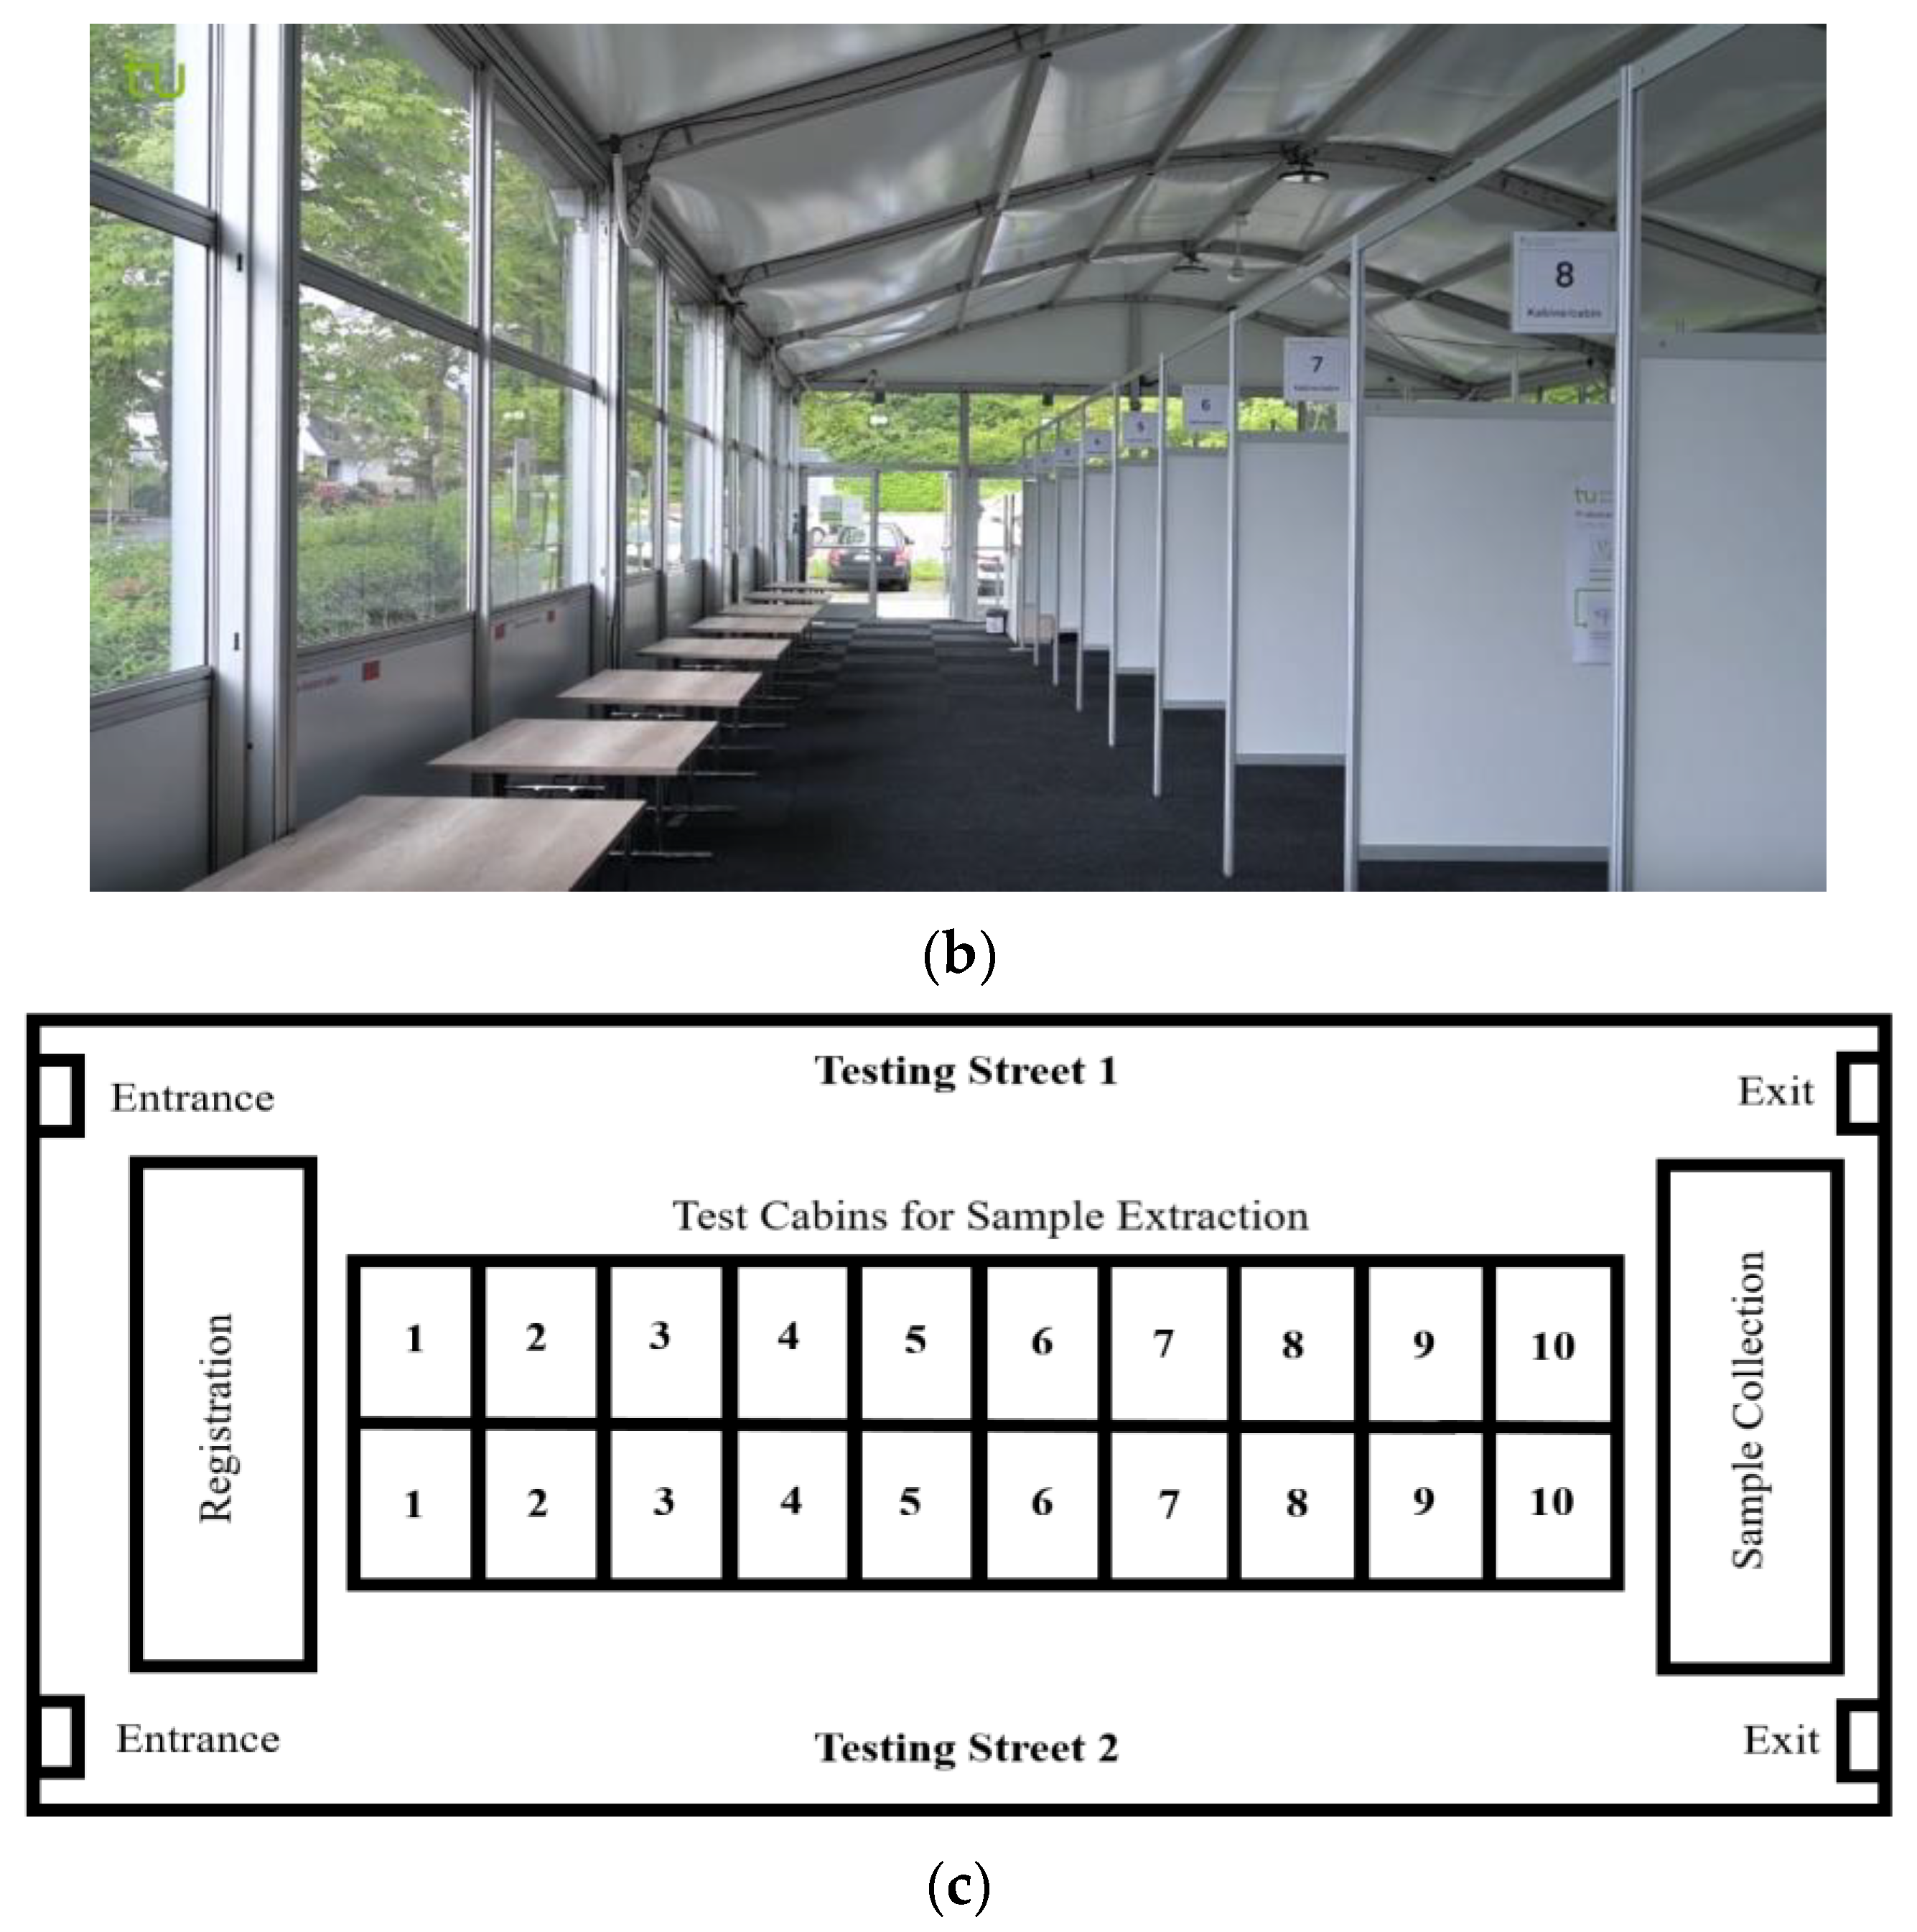
The second testing strategy emphasized speed, sensitivity, low cost per test, and a high throughput while keeping the number of required staff low. This strategy eventually replaced the first. Time to result was decreased due to a one-step RT-PCR analysis, targeting three different viral targets (N-Gene, ORF1a, and ORF1b (TaqMan™ SARS-CoV-2 Fast PCR Combo Kit 2.0; Thermo Fisher Scientific, 6055 Sunol Blvd, Pleasanton, CA, USA). Classical PCR systems require RNA purification. One-step RT-PCR systems circumvent this step, effectively reducing the time-to-result to 2 h from sample preparation to result.

3.4. Procedure

Following the protocols from the WICOVIR study [30] and the work of the Brennecke group [20], the sample collection was delegated to the participants themselves by providing two 15 mL centrifuge tubes per person. These tubes were to be taken home in order to collect gargle samples in the morning before eating or drinking anything prior to sample collection. The participants were instructed to gargle with 5 mL of tap water for roughly 30 to 60 s, and recollect the water in the given tubes, splitting the 5 mL into 2 × 2.5 mL. No form of registration was implemented and participation was anonymous and voluntary. This approach not only simplified the sample collection, but also allowed family members, friends, or partners to prepare a sample in the same way. Children under 6 years of age who were not able to gargle used sterile cotton swabs to collect Lollipop samples (see section “Test strategy 1.0”). The swabs were then suspended in 3 or 5 mL of tap water for individual and pool samples, respectively. Lollipop pools consisted of no more than five swabs. One sample was used to participate in the pool tests (“A-sample”), while the remaining tube was kept by the participant. In case their pool was positive, the second sample would then be delivered to our laboratory on the same day to be analyzed on the following day. This ensured a timely notification of potential positive participants and thus minimized the risk of them infecting their surroundings. If symptoms were present, the participants were asked not to add their sample to the pools. People with a previous SARS-CoV-2 infection were asked not to participate in pool tests for 8 weeks after recovery.
Analysis was conducted in a laboratory on campus. Samples older than 24 h were discarded. In addition to the self-organized pools, pool tests for individuals were offered 4 times per week for 2 h each (wild pools). Students, employees, etc. could bring their A samples to the campus and fill them into numbered containers. After 10 samples were collected, the container was closed and the next one was opened. Such a pooling system with 10 people per pool in combination with costs of roughly EUR 5 per PCR reaction kept the costs for chemicals per test and person less than EUR 1.
The results were anonymously published the same day on the PCR team’s website (pseudonyms were chosen by the groups and families).
This process was offered 4 times per week. Importantly, the perimeter of participating people (the social network) was generously set and included not only the entire campus community, but also families, day care centers, theater groups and alike (Figure 3).
Indeed, not a single group has been denied to date. All groups would simply collect their own samples and drop them off on any day from Monday to Thursday at the designated drop-off place. Using this strategy, we hope to achieve a better insight of how the virus “moves” within the network in which the campus is embedded. Via their community, it is connected with local schools, daycare centers, companies, social activities (pubs, sport…), and in particular to long-distance-travel behavior, one of the major challenges of any strategy that aims to suppress the spread of an infectious disease.

4. Results

Over a period of 6 months, about 28,000 people were PCR tested for SARS-CoV-2 using test strategy 2.0 (Figure 4). Daily, between 100 and 200 people participated in the “wild pools”. In addition, we received about 70 self-organized tubes via our freely accessible collection container (Figure 5). These included B samples obtained from the previous day and self-organized pools.
In total, 197 positive individuals were identified throughout test strategy 2.0 (Figure 6). To our knowledge, practically all 197 were pre- or asymptomatic and were planning to visit the campus, their lab, seminars, lectures, or office.

5. Discussion

We here report on how to implement a vaccination-PLUS strategy on the campus of a university in Germany. The central piece was the rolling out of two different test strategies. The main motivation of the tests was to help detect hidden infections and thus prevent outbreaks of SARS-CoV-2 infections on campus and in families in order to achieve a safe environment for lectures and events in person. With a total of ≈277,000 tests (and counting), we were able to significantly reduce the risk of infections within the campus community.
During test strategy 1.0 (from 15 March 2021–26 September 2021), a total of 135,917 LFTs were distributed and a total of 26,957 samples were PCR tested in pools. The positivity rate of the PCR tests was 0.015% over this period. During test strategy 2.0 (from 6 October 2021–25 March 2022), a total of 28,347 individuals were tested and the positivity rate over this period was 0.695%. In addition, at least another 85,602 LFT were provided by TU Dortmund. We detected between 1 and 16 infections per day of testing (Figure 6). Furthermore, community transmission was fairly low (<10) according to all available reports.
The high number of organized pools by departments, families, but especially daycare centers, and the high participation in the Christmas event, highlighted the demand for a consistent test offer during a viral pandemic. This should be an incentive to organize mass testing, especially before holidays and larger social gatherings.

Avoiding Outbreaks

Detecting a single, positive individual, before the infected individual became contagious, did prevent several outbreaks, effectively keeping the corresponding institution open, instead of locking it down or leading to isolations, while also providing a safe environment for family and social gatherings. To put the success of such a prevention into numbers is not an easy task. However, participating groups clearly reported that outbreaks were stopped because of the early detection of positive cases. Particularly positive was the feedback for our Christmas testing (“Ein Test zum Fest”). About a week before Christmas, we advertised a large testing event for 23 December 2021 to ensure for everybody a safe Christmas. Staff and time intervals for walk-ins were significantly increased. Overall, we tested more than 230 sample tubes that day with approximately 2000 people, including many families who were planning larger get-togethers or visiting their elderly. Six positive cases were identified and immediately reported. We provided contacts for further information on the precautions. Additionally, labs and daycare centers reported that outbreaks were stopped or avoided, in the latter case due to the early detection of an infected teacher.
Keeping the barrier for participation to a minimum is also important in order to maximize the number of participants. Furthermore, try to keep the technological preparations low in order to (i) be able to set up the infrastructure as rapidly as possible and (ii) allow to expand quickly adopting an increase in participation. As previously mentioned, the aim was to test as many people as possible with a small turnover rate. Having the participants register and creating personalized test certificates would significantly increase the number of necessary staff and technology. However, designing a test concept with this little bureaucratic burden did not only save a lot of work force, but also came with a price: a lack of control. There was no direct mechanism in place that oversaw the adherence to the rules and advice provided. We relied on voluntary participation and the adherence to the social contract we had in place within our community. Fortunately, the incidents in which this social contract was broken turned out to be only anecdotal and in its most common form (individual instead of pool samples) harmless and by no means malicious.

6. Conclusions

The university and its community have among the best prerequisites to demonstrate controlled action, when systems are under stress and outcomes are unpredictable: a combination of science, infrastructure, and student work force, along with a good amount of independency. During times when the rational discourse is distorted on all scales (with society and among political institutions) and collective illusion spreads (in part) due to extensive misinformation, it is important that academic institutions stand up and demonstrate leadership. They should be the role models and/or the triggers to restart a rational exchange that educates the population instead of entertaining them with rather random, opposing opinions, creating a dangerous misbalance. It is extremely negligent to leave young people to the chaos, which the populists enjoy so much. Addressing, tolerating, or forgetting the mistakes made during a crisis are three very different pathological stages of a society, and it is disproportionally hard to come back from the latter. Especially for the young, universities need to stand up and must not get tired to point out the right direction. Therefore, precisely when powerlessness and a lack of clear leadership spreads, signals of control must be broadcasted from somewhere. The price for mobilizing students is pennies and the return can hardly be overestimated.
Furthermore, universities can also be initiators for communities, as they offer a way towards quick proofs of concept for different containment or testing strategies or do-it-yourself solutions—as, for instance, the Corsi–Rosendahl Box filter [13]—which can then be shared as blueprints and adopted by other institutions and communities. It is a strategy meant to avoid lockdowns and rather keep public places open so that economic and overall societal damages are minimized.
It appears obvious that the way of reasoning here is not at all limited to pandemic situations, but should also be realized for the imminent refugee crisis in Europe or climate change. The unbureaucratic enrollment of student refugees could be paired with their integration into teams, who outreach to communicate between locals and refugees. Students from crisis regions, integrated quickly into a university setting, could help already overwhelmed local elementary and high schools to integrate and teach kids from the same region. This could have a considerable impact not only on accelerating the integration process, but also reducing stress on the systems (including economy and healthcare). The strategy is clear: Have the courage to get started and optimize as you move along. The worst is not to do anything, while being stuck in endless bureaucratic discussions. The strategy reported here should therefore not only serve as a blueprint for a rapid, accessible test strategy, but also for how to mobilize students to find solutions in unpredictable times in general.

7. Materials and Methods

For sample the collection, 2 × 15 mL centrifuge tubes were handed out to the participants. The sample medium was tap water.
Samples were prepared under a clean bench using the TaqMan™ SARS-CoV-2 Fast PCR Combo Kit 2.0 with the TaqPath 1-Step Multiplex Master Mix (No ROX) (Thermo Fisher Scientific), detecting viral N-Gene, ORF1a, ORF1b, and human RNAse P. Samples were prepared for 5 min at 62 °C followed by 5 min at 92 °C using the SalivaReady Solution provided with the kit in a 1:1 ratio.
The PCR was run using Design and Analysis Software 1.5 (Thermo Fisher Scientific) in the QuantStudio 5 (0.2 mL block) Thermocycler. The positive control as part of the kit and RNAse-free water as the negative control were used on every plate. The reactions were performed using the temperature profile shown in Table 1.
The measurements were analyzed with Design and Analysis Software 2.5 (Thermo Fisher Scientific, Waltham, MA, USA), using baseline options set from 5 to AUTO. All samples that showed one or more viral marker counts above 10,000 and the presence of RNAse P by cycle 38 were counted as positive. Samples without the presence of RNAse P were regarded as “invalid”.

Author Contributions

M.F.S. designed the study and wrote the paper. L.D., D.T.H. and G.H. performed the experiments. A.G. and L.D. provided the data analysis. All authors have read and agreed to the published version of the manuscript.

Funding

This project was funded by the institute’s own budget.

Institutional Review Board Statement

All procedures performed in this study were in accordance with the ethical standards of the university. Ethical clearance and approval were granted by the university, the city, and the state officials.

Informed Consent Statement

Participation in the study was entirely voluntarily and anonymous; sample collection required no human-to-human interaction.

Data Availability Statement

The datasets used and/or analyzed during the current study are available from the corresponding author upon reasonable request.

Acknowledgments

We thank the members of the no-COVID-19 group and the World Health Network for their helpful scientific discussions, in particular Yaneer Bar-Yam and Denise Feldner. Ute Teichert and Frank Renken for their help in communication with the public health sector. For general support, we would like to thank the Department of Physics (TU Dortmund) and TU Dortmund. We would also like to thank Florian Klein (Institute of Virology, University Hospital of Cologne), Uwe Cassens (Klinikum Dortmund), Frank Hünger (Klinikum Dortmund), and his team for their technical support. For their help with establishing the PCR method used during test strategy 2.0, we thank Mahdieh Rahmatollahi and Janina Kellermann (Thermo Fisher Scientific). We thank Andreas Schlemmer, Tim Trosky, Tom Rosenstein, Yana Koll, as well as Lisa-Marie Meier (TU Dortmund) and the members of the Medical and Biological Physics Group for their important feedback. Funding was provided by the Department of Physics of TU Dortmund, and a thermocycler was kindly provided for the time of the project from Thermo Fisher Scientific.

Conflicts of Interest

The authors declare no conflict of interest.

References

  1. Philippe, C.; Marques, N. The Zero Covid Strategyprotects People, Economies and Freedoms More Effectively. 2021. Available online: https://www.institutmolinari.org/2021/08/19/the-zero-covid-strategy-protects-people-economies-and-freedoms-more-effectively/ (accessed on 10 June 2022).
  2. Marshall, M. Zero-Covid Strategies Are Being Ditched, but They Were the Best Option. New Scientist. 30 March 2022. Available online: https://www.newscientist.com/article/mg25433800-100-zero-covid-strategies-are-being-ditched-but-they-were-the-best-option/ (accessed on 10 January 2022).
  3. Taleb, N.N.; Read, R.; Douady, R.; Norman, J.; Bar-Yam, Y. The Precautionary Principle (with Application to the Genetic Modification of Organisms). arXiv 2014, arXiv:1410.5787. [Google Scholar]
  4. Bar-Yam, Y. New England Complex Science Insitute. Available online: https://necsi.edu/ending-pandemics (accessed on 10 January 2022).
  5. Oliu-Barton, M.; Pradelski, B.S.R. Green zoning: An effective policy tool to tackle the COVID-19 pandemic. Health Policy 2021, 125, 981–986. [Google Scholar] [CrossRef] [PubMed]
  6. Kühn, M.J.; Abele, D.; Mitra, T.; Koslow, W.; Abedi, M.; Rack, K.; Siggel, M.; Khailaie, S.; Klitz, M.; Binder, S.; et al. Assessment of effective mitigation and prediction of the spread of SARS-CoV-2 in Germany using demographic information and spatial resolution. Math. Biosci. 2021, 339, 108648. [Google Scholar] [CrossRef]
  7. Tindale, L.C.; Stockdale, J.E.; Coombe, M.; Garlock, E.S.; Lau, W.Y.V.; Saraswat, M.; Zhang, L.; Chen, D.; Wallinga, J.; Colijn, C. Evidence for transmission of COVID-19 prior to symptom onset. eLife 2020, 9, 1–34. [Google Scholar] [CrossRef]
  8. He, X.; Lau, E.H.Y.; Wu, P.; Deng, X.; Wang, J.; Hao, X.; Lau, Y.C.; Wong, J.Y.; Guan, Y.; Tan, X.; et al. Temporal dynamics in viral shedding and transmissibility of COVID-19. Nat. Med. 2020, 26, 672–675. [Google Scholar] [CrossRef] [PubMed] [Green Version]
  9. Johansson, M.A.; Quandelacy, T.M.; Kada, S.; Prasad, P.V.; Steele, M.; Brooks, J.T.; Slayton, R.B.; Biggerstaff, M.; Butler, J.C. SARS-CoV-2 Transmission from People without COVID-19 Symptoms. JAMA Netw. Open 2021, 4, 1–8. [Google Scholar] [CrossRef] [PubMed]
  10. Vitiello, A.; Ferrara, F.; Troiano, V.; La Porta, R. COVID-19 vaccines and decreased transmission of SARS-CoV-2. Inflammopharmacology 2021, 29, 1357–1360. [Google Scholar] [CrossRef] [PubMed]
  11. Prather, K.A.; Marr, L.C.; Schooley, R.T.; McDiarmid, M.A.; Wilsonand, M.E.; Milton, D.K. Airborne transmission of SARS-CoV-2. Science 2020, 370, 303–304. [Google Scholar]
  12. Morawska, L.; Cao, J. Airborne transmission of SARS-CoV-2: The world should face the reality. Environ. Int. 2020, 139, 105730. [Google Scholar] [CrossRef]
  13. Dal Porto, R.; Kunz, M.N.; Pistochini, T.; Corsi, R.L.; Cappa, C.D. Characterizing the performance of a do-it-yourself (DIY) box fan air filter. Aerosol Sci. Technol. 2022, 56, 1–9. [Google Scholar] [CrossRef]
  14. Arnaout, R.; Lee, R.A.; Lee, G.R.; Callahan, C.; Cheng, A.; Yen, C.F.; Smith, K.P.; Arora, R.; Kirby, J.E. The Limit of Detection Matters: The Case for Benchmarking Severe Acute Respiratory Syndrome Coronavirus 2 Testing. Clin. Infect. Dis. 2021, 73, E3042–E3046. [Google Scholar] [CrossRef]
  15. Mina, M.J.; Andersen, K.G. COVID-19 testing: One size does not fit all. Science 2021, 371, 126–127. [Google Scholar] [CrossRef] [PubMed]
  16. Mina, M.J.; Peto, T.E.; García-Fiñana, M.; Semple, M.G.; Buchan, I.E. Clarifying the evidence on SARS-CoV-2 antigen rapid tests in public health responses to COVID-19. Lancet 2021, 397, 1425–1427. [Google Scholar] [CrossRef]
  17. Scheiblauer, H.; Filomena, A.; Nitsche, A.; Puyskens, A.; Corman, V.M.; Drosten, C.; Zwirglmaier, K.; Lange, C.; Emmerich, P.; Muller, M.; et al. Comparative sensitivity evaluation for 122 CE-marked rapid diagnostic tests for SARS-CoV-2 antigen, Germany, September 2020 to April 2021. Eurosurveillance 2021, 26, 1–13. [Google Scholar] [CrossRef]
  18. Esteve, C.; Catherine, F.X.; Chavanet, P.; Blot, M.; Piroth, L. How should a positive PCR test result for COVID-19 in an asymptomatic individual be interpreted and managed? Med. Mal. Infect. 2020, 50, 633–638. [Google Scholar] [CrossRef] [PubMed]
  19. Fernandez-Montero, A.; Argemi, J.; Rodríguez, J.A.; Ariño, A.H.; Moreno-Galarraga, L. Validation of a rapid antigen test as a screening tool for SARS-CoV-2 infection in asymptomatic populations. Sensitivity, specificity and predictive values. eClinicalMedicine 2021, 37, 100954. [Google Scholar] [CrossRef] [PubMed]
  20. Kellner, M.J.; Matl, M.; Ross, J.J.; Schnabl, J.; Handler, D.; Heinen, R.; Schaeffer, J.; Hufnagl, P.; Indra, A.; Dekens, M.P.S.; et al. Head-to-head comparison of direct-input RT-PCR and RT-LAMP against RT-qPCR on extracted RNA for rapid SARS-CoV-2 diagnostics. medRxiv 2021. [Google Scholar] [CrossRef]
  21. Kühn, M.J.; Abele, D.; Binder, S.; Rack, K.; Klitz, M.; Kleinert, J.; Gilg, J.; Spataro, L.; Koslow, W.; Siggel, M.; et al. Regional opening strategies with commuter testing and containment of new SARS-CoV-2 variants in Germany. BMC Infect. Dis. 2022, 22, 333. [Google Scholar] [CrossRef] [PubMed]
  22. Larremore, D.B.; Wilder, B.; Lester, E.; Shehata, S.; Burke, J.M.; Hay, J.A.; Tambe, M.; Mina, M.J.; Parker, R. Test sensitivity is secondary to frequency and turnaround time for COVID-19 screening. Sci. Adv. 2021, 7, 1–11. [Google Scholar] [CrossRef]
  23. Paltiel, A.D.; Zheng, A.; Walensky, R.P. Assessment of SARS-CoV-2 Screening Strategies to Permit the Safe Reopening of College Campuses in the United States. JAMA Netw. Open 2020, 3, 1–12. [Google Scholar] [CrossRef]
  24. Paul, S.; Lorin, E. Distribution of incubation periods of COVID-19 in the Canadian context. Sci. Rep. 2021, 11, 1–9. [Google Scholar] [CrossRef]
  25. Baumann, M.; Brinkmann, M.; Beier, M.; Brockmann, D.; Bude, H.; Fuest, C.; Feldner, D.; Hallek, M.; Kickbusch, I.; Mayer, M.; et al. NO-COVID. Part 1 & 2. 2021. Available online: https://nocovid-europe.eu/ (accessed on 10 January 2021).
  26. Horton, R. Offline: The case for No-COVID. Lancet 2021, 397, 359. [Google Scholar] [CrossRef]
  27. Dewald, F.; Suárez, I.; Johnen, R.; Grossbach, J.; Tovar, R.M.; Steger, G.; Joachim, A.; Rubio, G.H.; Fries, M.; Behr, F.; et al. Effective high-throughput RT-qPCR screening for SARS-CoV-2 infections in children. Nat. Commun. 2022. [Google Scholar] [CrossRef]
  28. Joachim, A.; Dewald, F.; Suárez, I.; Zemlin, M.; Lang, I.; Stutz, R.; Marthaler, A.; Bosse, H.M.; Lübke, N.; Münch, J.; et al. Pooled RT-qPCR testing for SARS-CoV-2 surveillance in schools—A cluster randomised trial. eClinicalMedicine 2021, 39, 1–10. [Google Scholar] [CrossRef]
  29. Katzourakis, A. COVID-19: Endemic doesn’t mean harmless. Nature 2022, 601, 485. [Google Scholar] [CrossRef]
  30. Kheiroddin, P.; Schöberl, P.; Althammer, M.; Cibali, E.; Würfel, T.; Wein, H.; Kulawik, B.; Buntrock-Döpke, H.; Weigl, E.; Gran, S.; et al. Results of WICOVIR Gargle Pool PCR Testing in German Schools Based on the First 100,000 Tests. Front. Pediatr. 2021, 9, 1–12. [Google Scholar] [CrossRef]
Figure 1. Illustration of the proactive (green) vs. reactive (red) response. Striving for local elimination of the virus (green) considerably reduces the overall burden (which roughly corresponds to the enclosed area).
Covid 02 00103 g001
Figure 2. (a) The outside of a test station. (Source: YouTube/TUDortmund_official, accessed on: 31 August 2022). (b) The inside of a test station. (Source: YouTube/TUDortmund_official). (c) Schematic view of a test station, with 2 lines and 20 cabins.
Covid 02 00103 g002aCovid 02 00103 g002b
Figure 3. Participating groups. Not only students and staff, but all social networks (even if only loosely connected) were invited to participate.
Covid 02 00103 g003
Figure 4. Weekly and cumulative participants for both test strategies 1.0 and 2.0. The number of participants during test strategy 2.0 is estimated based on the rounded average pool size of 6 for self-organized pools and 9 for wild pools. The gargle tests, although entirely voluntary, peak at 2200 participants per week, while test 1.0 peaks at roughly 1900.
Covid 02 00103 g004
Figure 5. Daily number of received sample tubes divided into self-organized samples, including B samples, as well as the pools (SOs) collected by families, work groups, etc., and “wild pools” (WP) of individual participants. Low numbers on the bars indicate the respective amounts of sample tubes in the SO or WP categories. On 23 December 2022, a Christmas testing (“Test zum Fest”) event was launched, resulting in three-times-more samples than the days prior.
Covid 02 00103 g005
Figure 6. Daily and cumulative numbers of positive individual samples during the course of test strategy 2.0. Low numbers on top of the bars denote the number of positive individual samples obtained that day.
Covid 02 00103 g006
Table 1. Temperature profile used in the PCR procedure (see Section 3.4).
TemperatureRamp RateTimeNumber of Cycles
53 °C3.2 °C per second5 min1
85 °C3.2 °C per second5 min1
95 °C3.2 °C per second2 min1
95 °C3.2 °C per second1 s40
62 °C2.5 °C per second30 s40
Publisher’s Note: MDPI stays neutral with regard to jurisdictional claims in published maps and institutional affiliations.

