
An Investigation into the Effect of Length Scale of Reinforcement on the Cryogenic Response of a Mg/2wt.%CeO2 Composite


Abstract
:1. Introduction
2. Materials and Methods
2.1. Materials
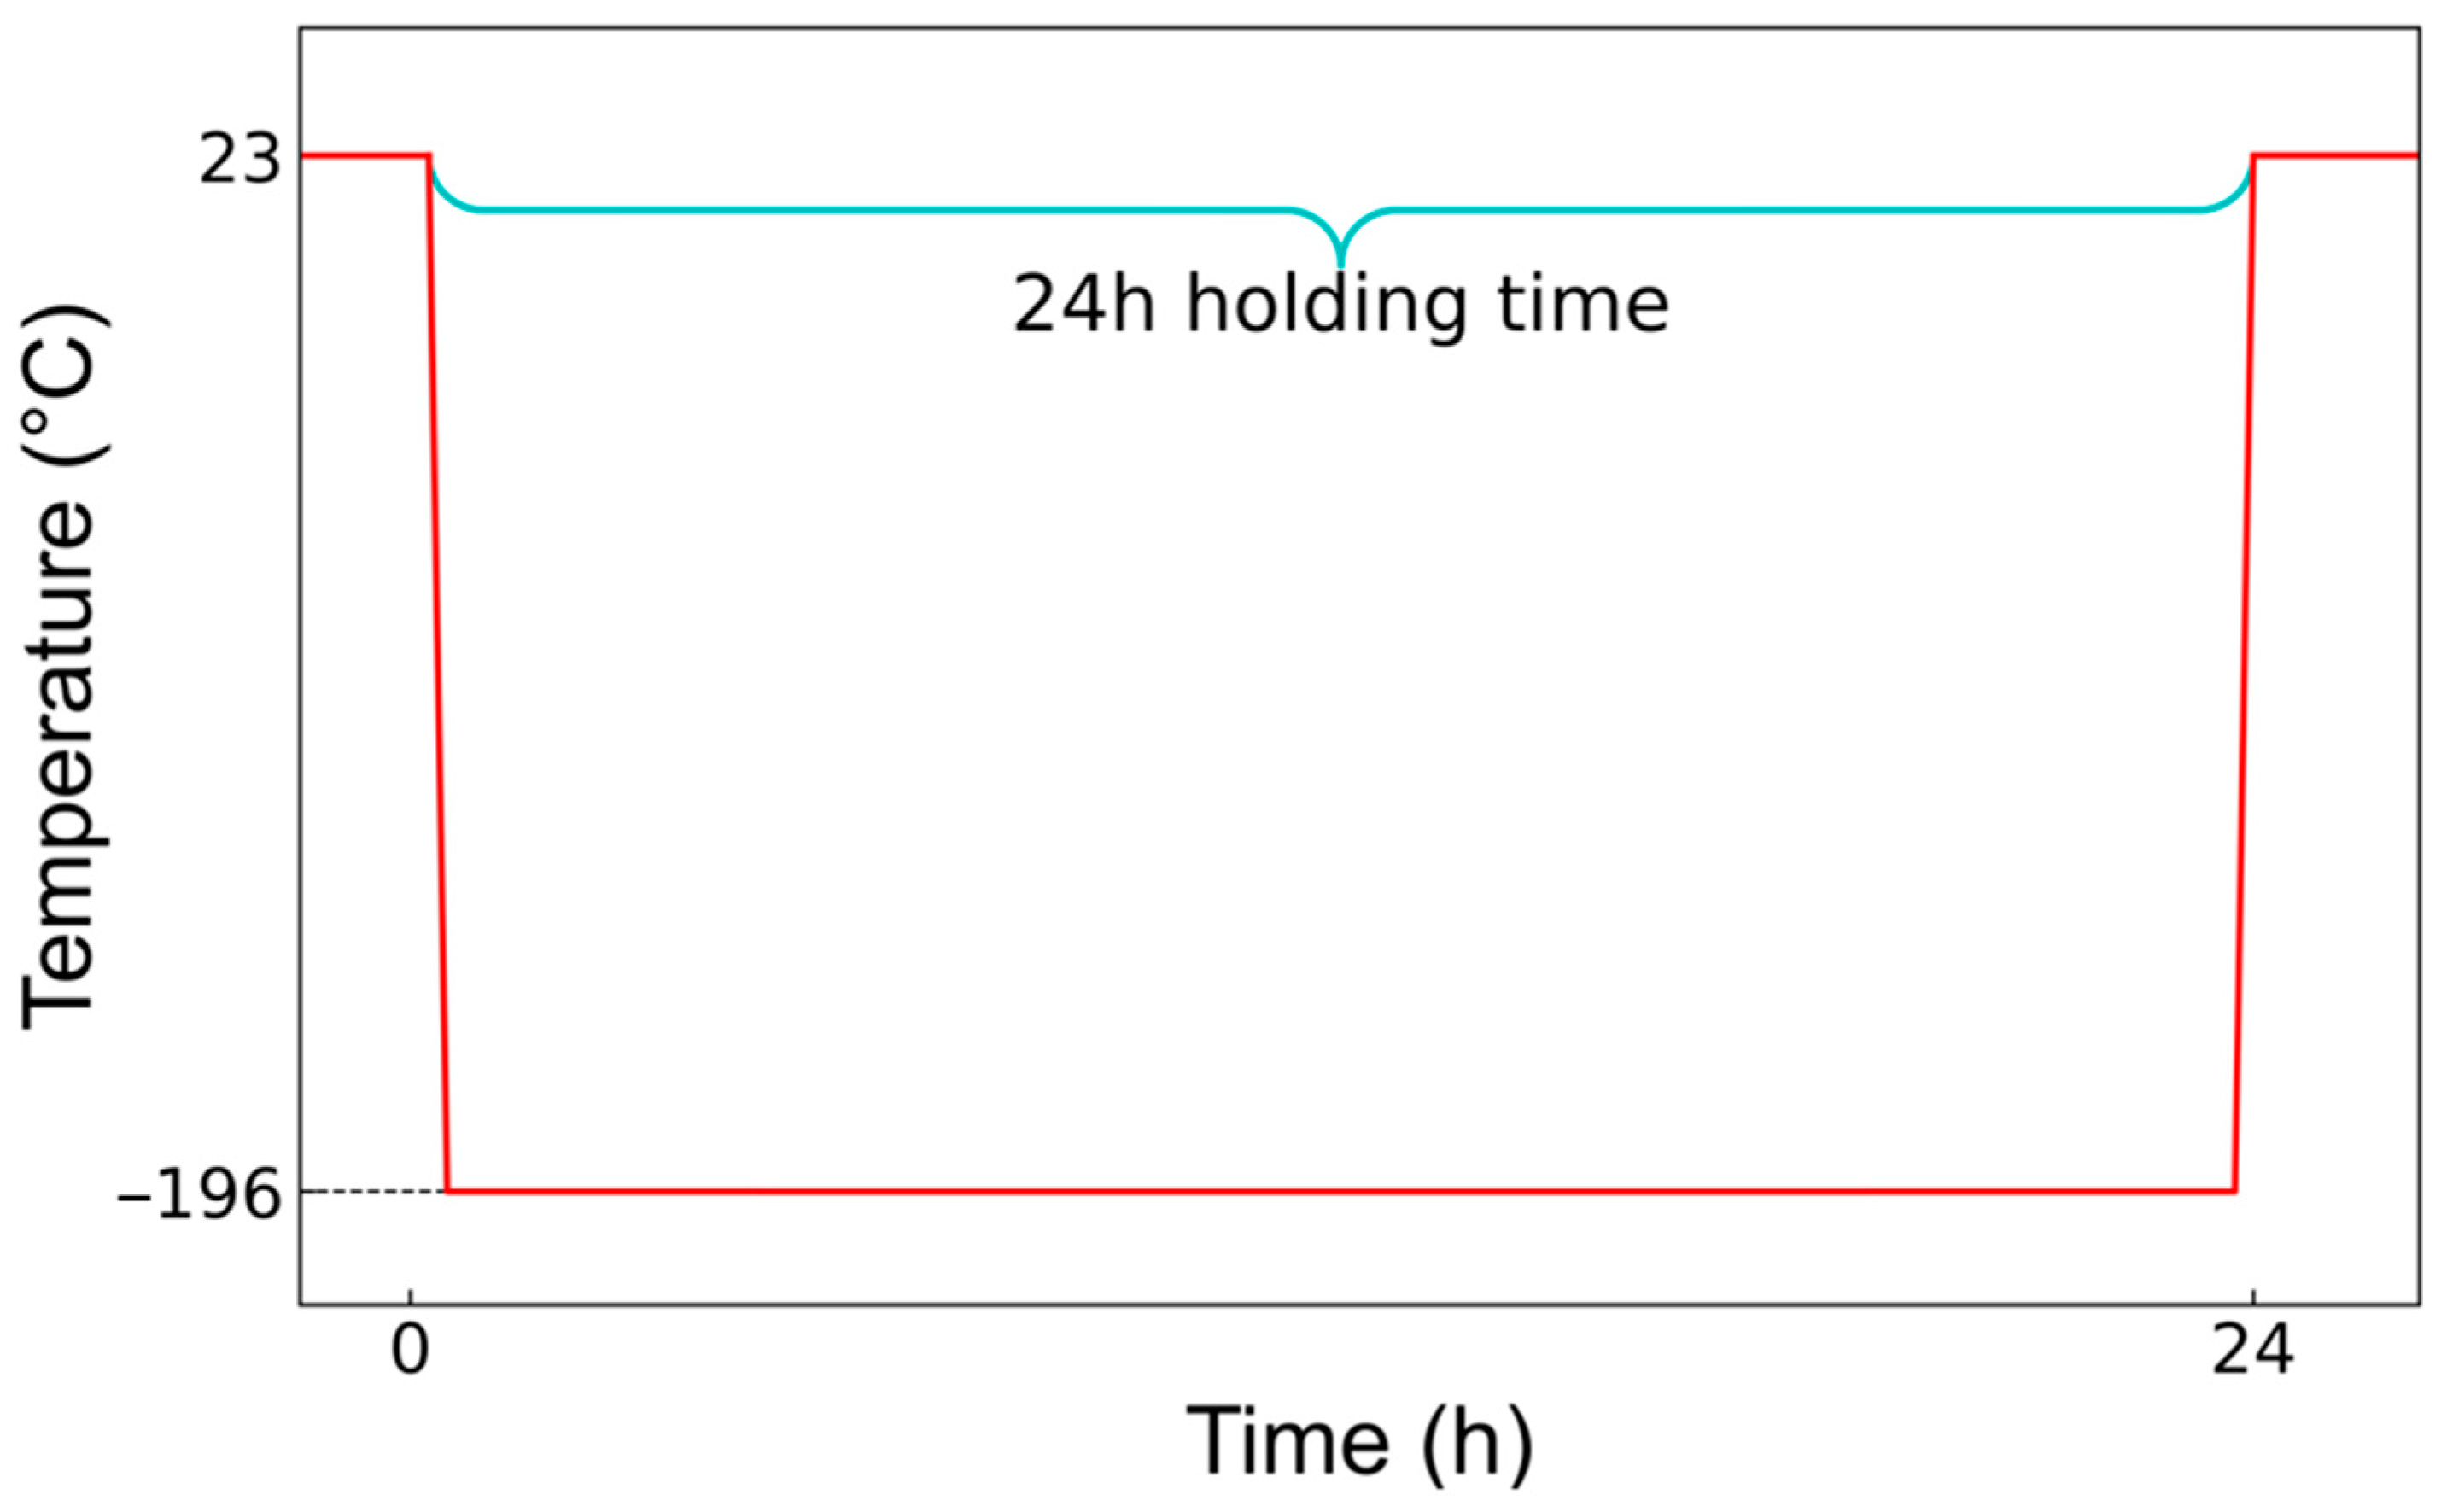
2.2. Processing
2.3. Characterization
2.3.1. Density and Porosity
2.3.2. Microstructure
2.3.3. Thermal Properties
2.3.4. Mechanical Properties
3. Results and Discussion
3.1. Density and Porosity
3.2. Microstructure
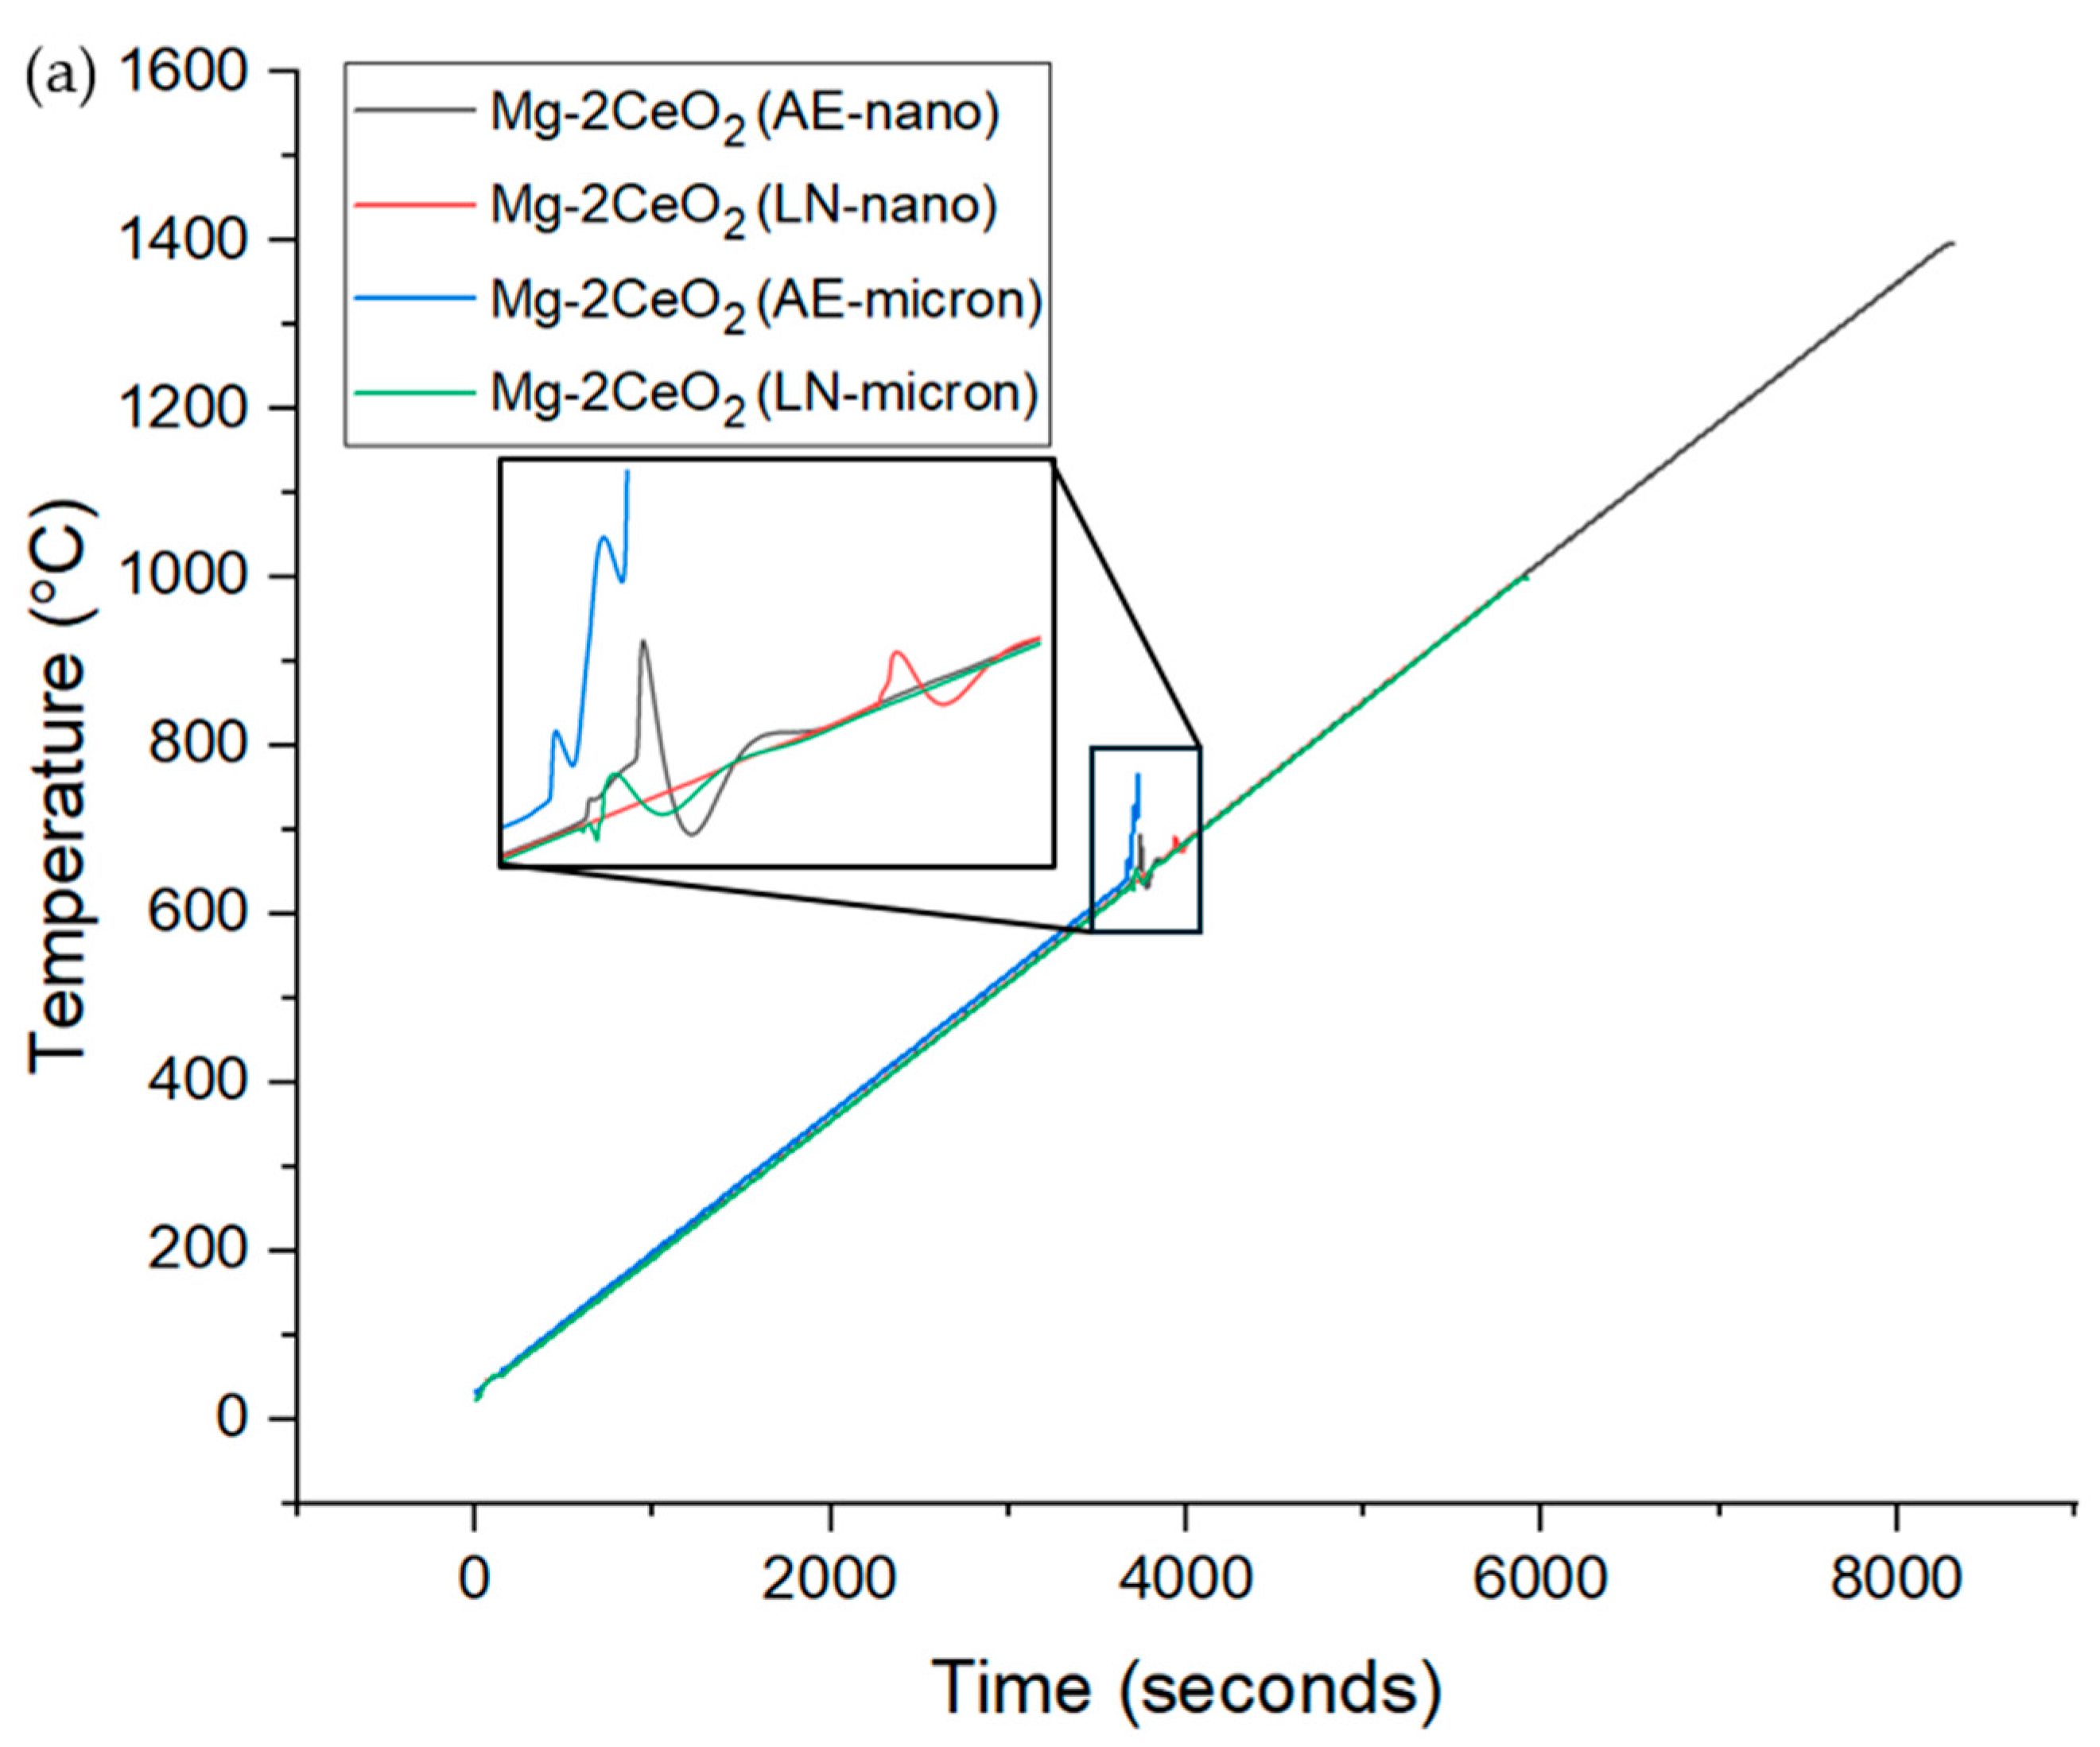
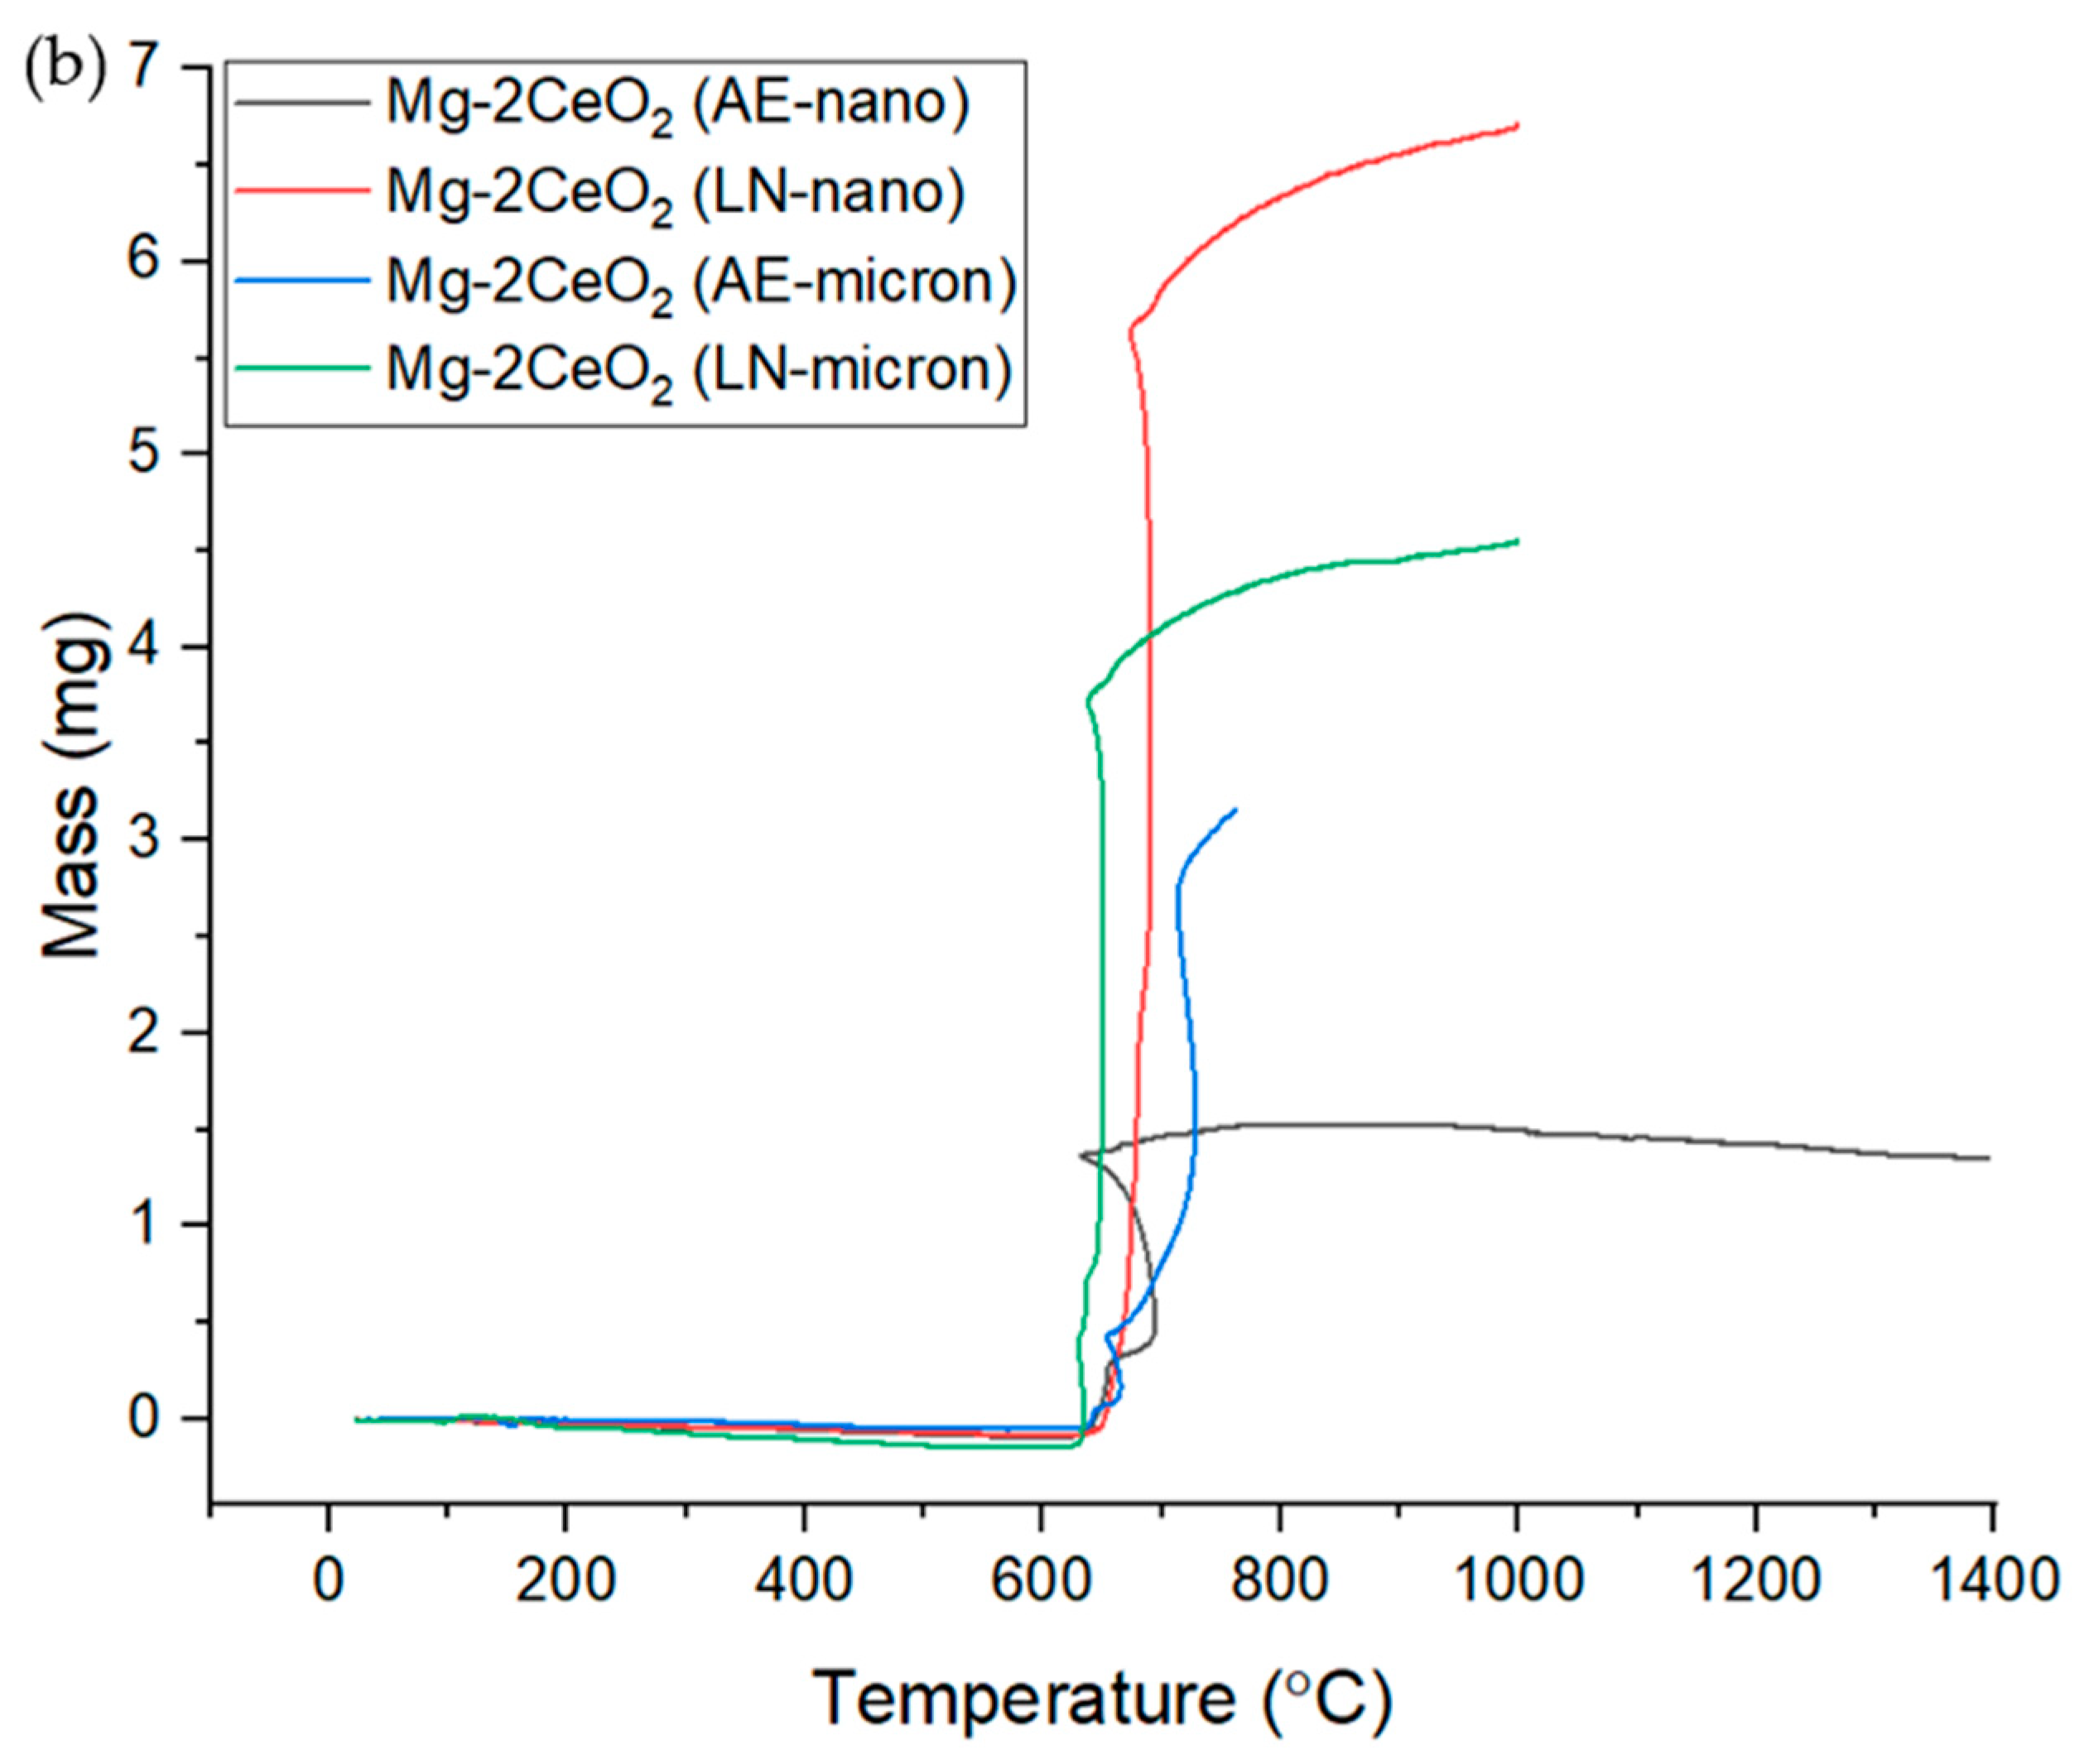
3.3. Thermal Response

| Composition | Ignition Temperature (°C) |
|---|---|
| Pure Mg | 580 |
| Mg-2CeO2 (AE-nano) | 638 (↑10.0%) |
| Mg-2CeO2 (LN-nano) | 676 (↑16.6%) |
| Mg-2CeO2 (AE-micron) | 644 (↑11.0%) |
| Mg-2CeO2 (LN-micron) | 637 (↑9.8%) |
| AZ31 [39] | 628 |
| AZ61 [40] | 559 |
| AZ81A [40] | 543 |
| AZ91 [39,40] | 600 |
| ZK40A [40] | 500 |
| ZK60A [40] | 499 |
| AM50 [40] | 585 |
| WE43 [40,41] | 644 |
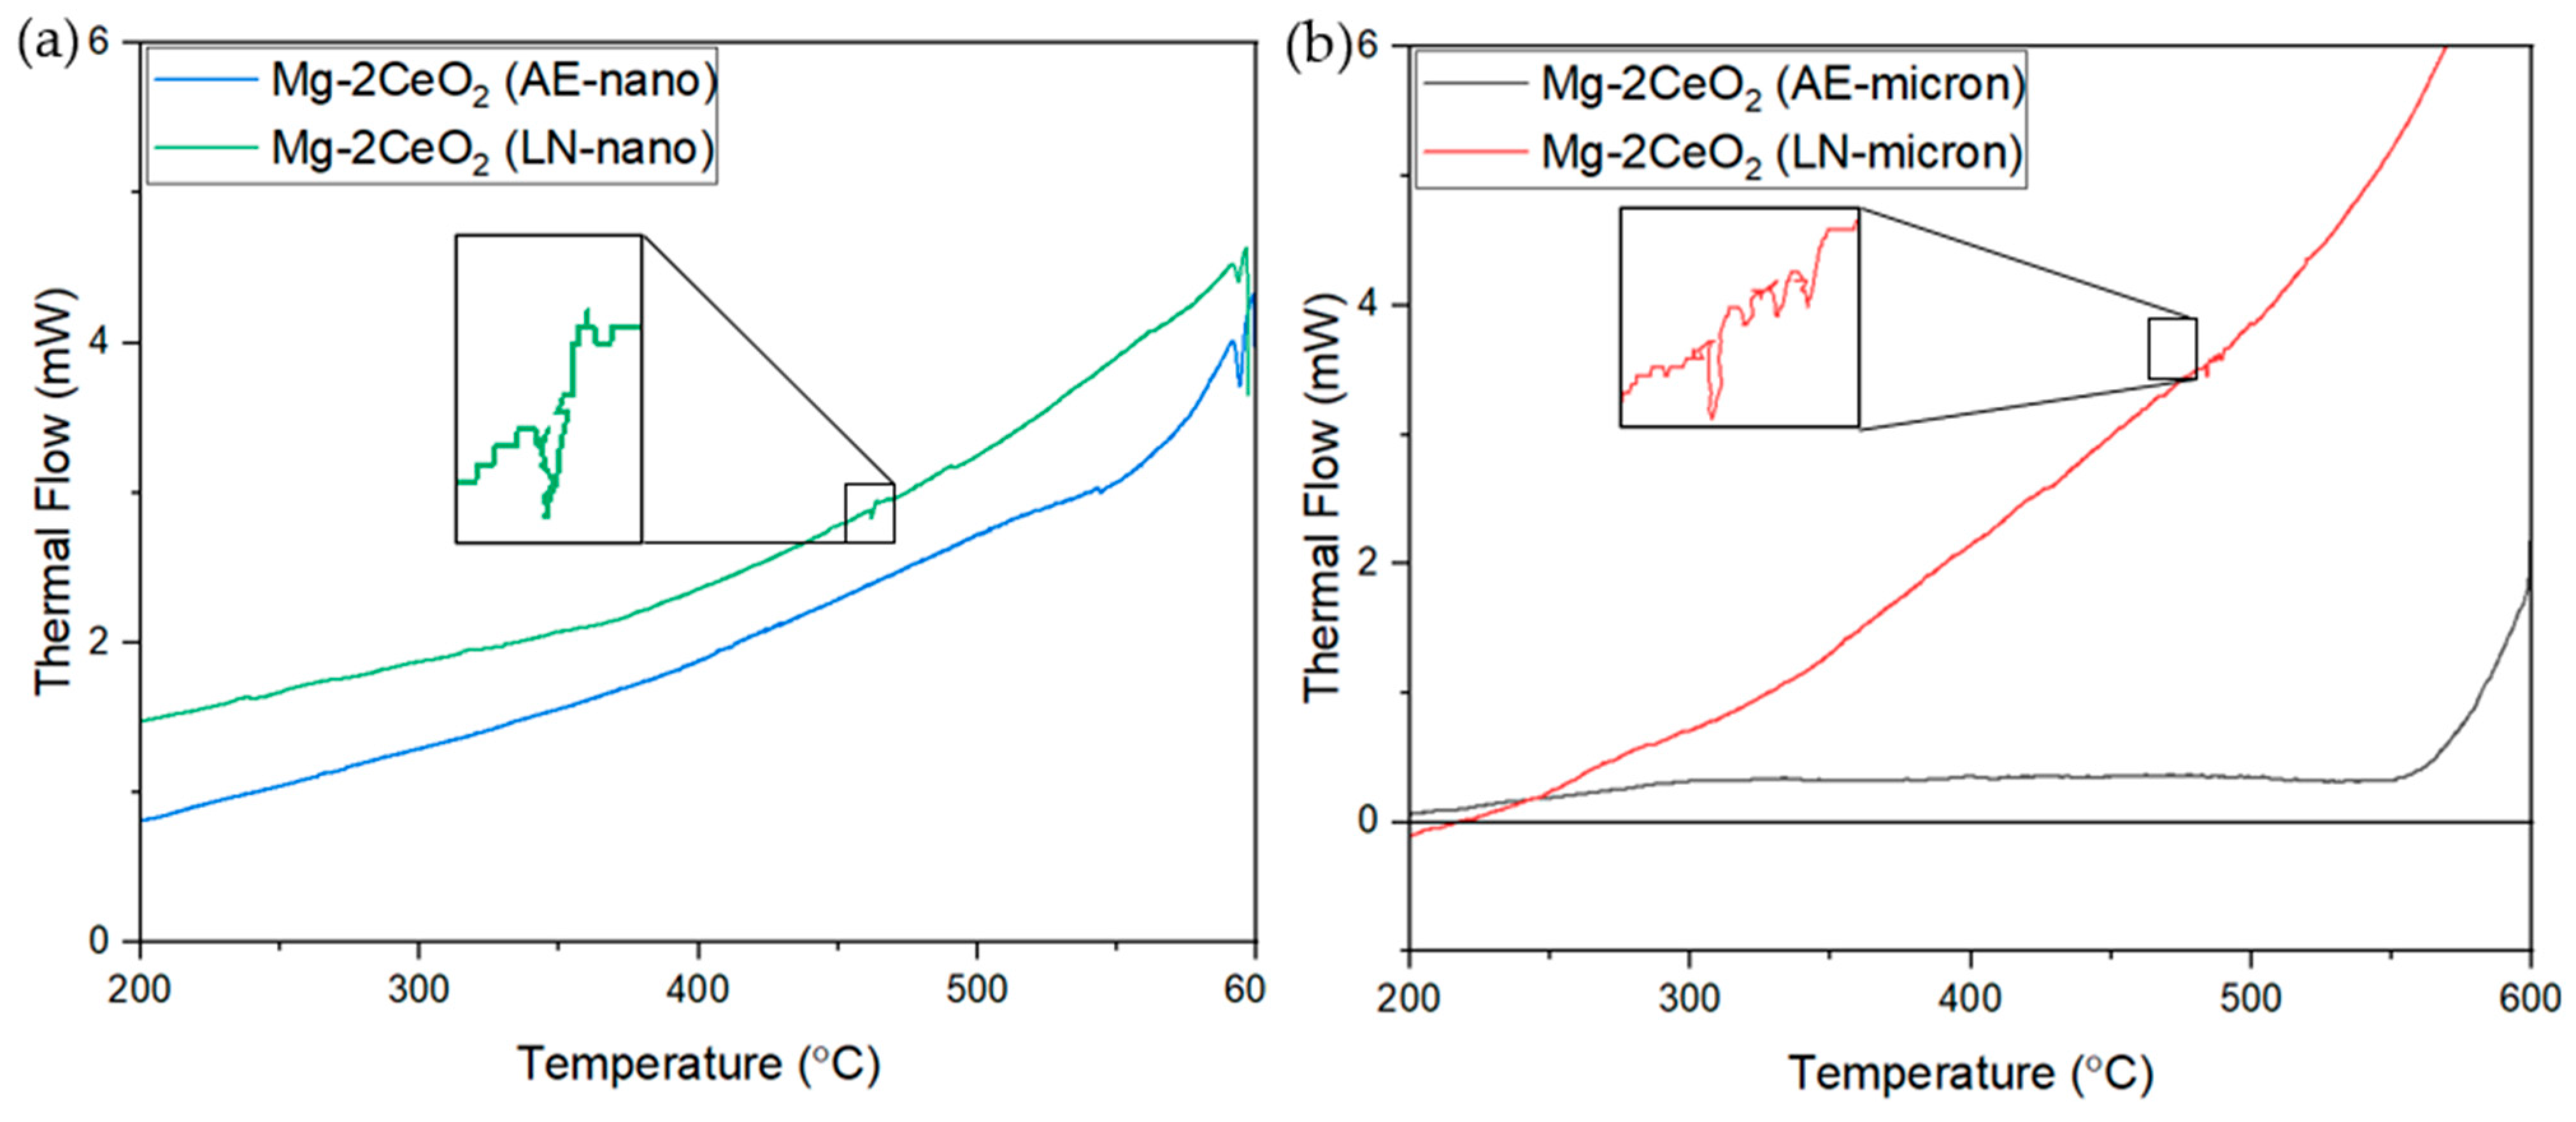
- The samples exhibiting basal texture, Mg-2CeO2 (AE-nano) and Mg-2CeO2 (LN-nano), showed higher ignition temperatures than the Mg-2CeO2 (AE-micron) and Mg-2CeO2 (LN-micron) samples showing pyramidal texture.
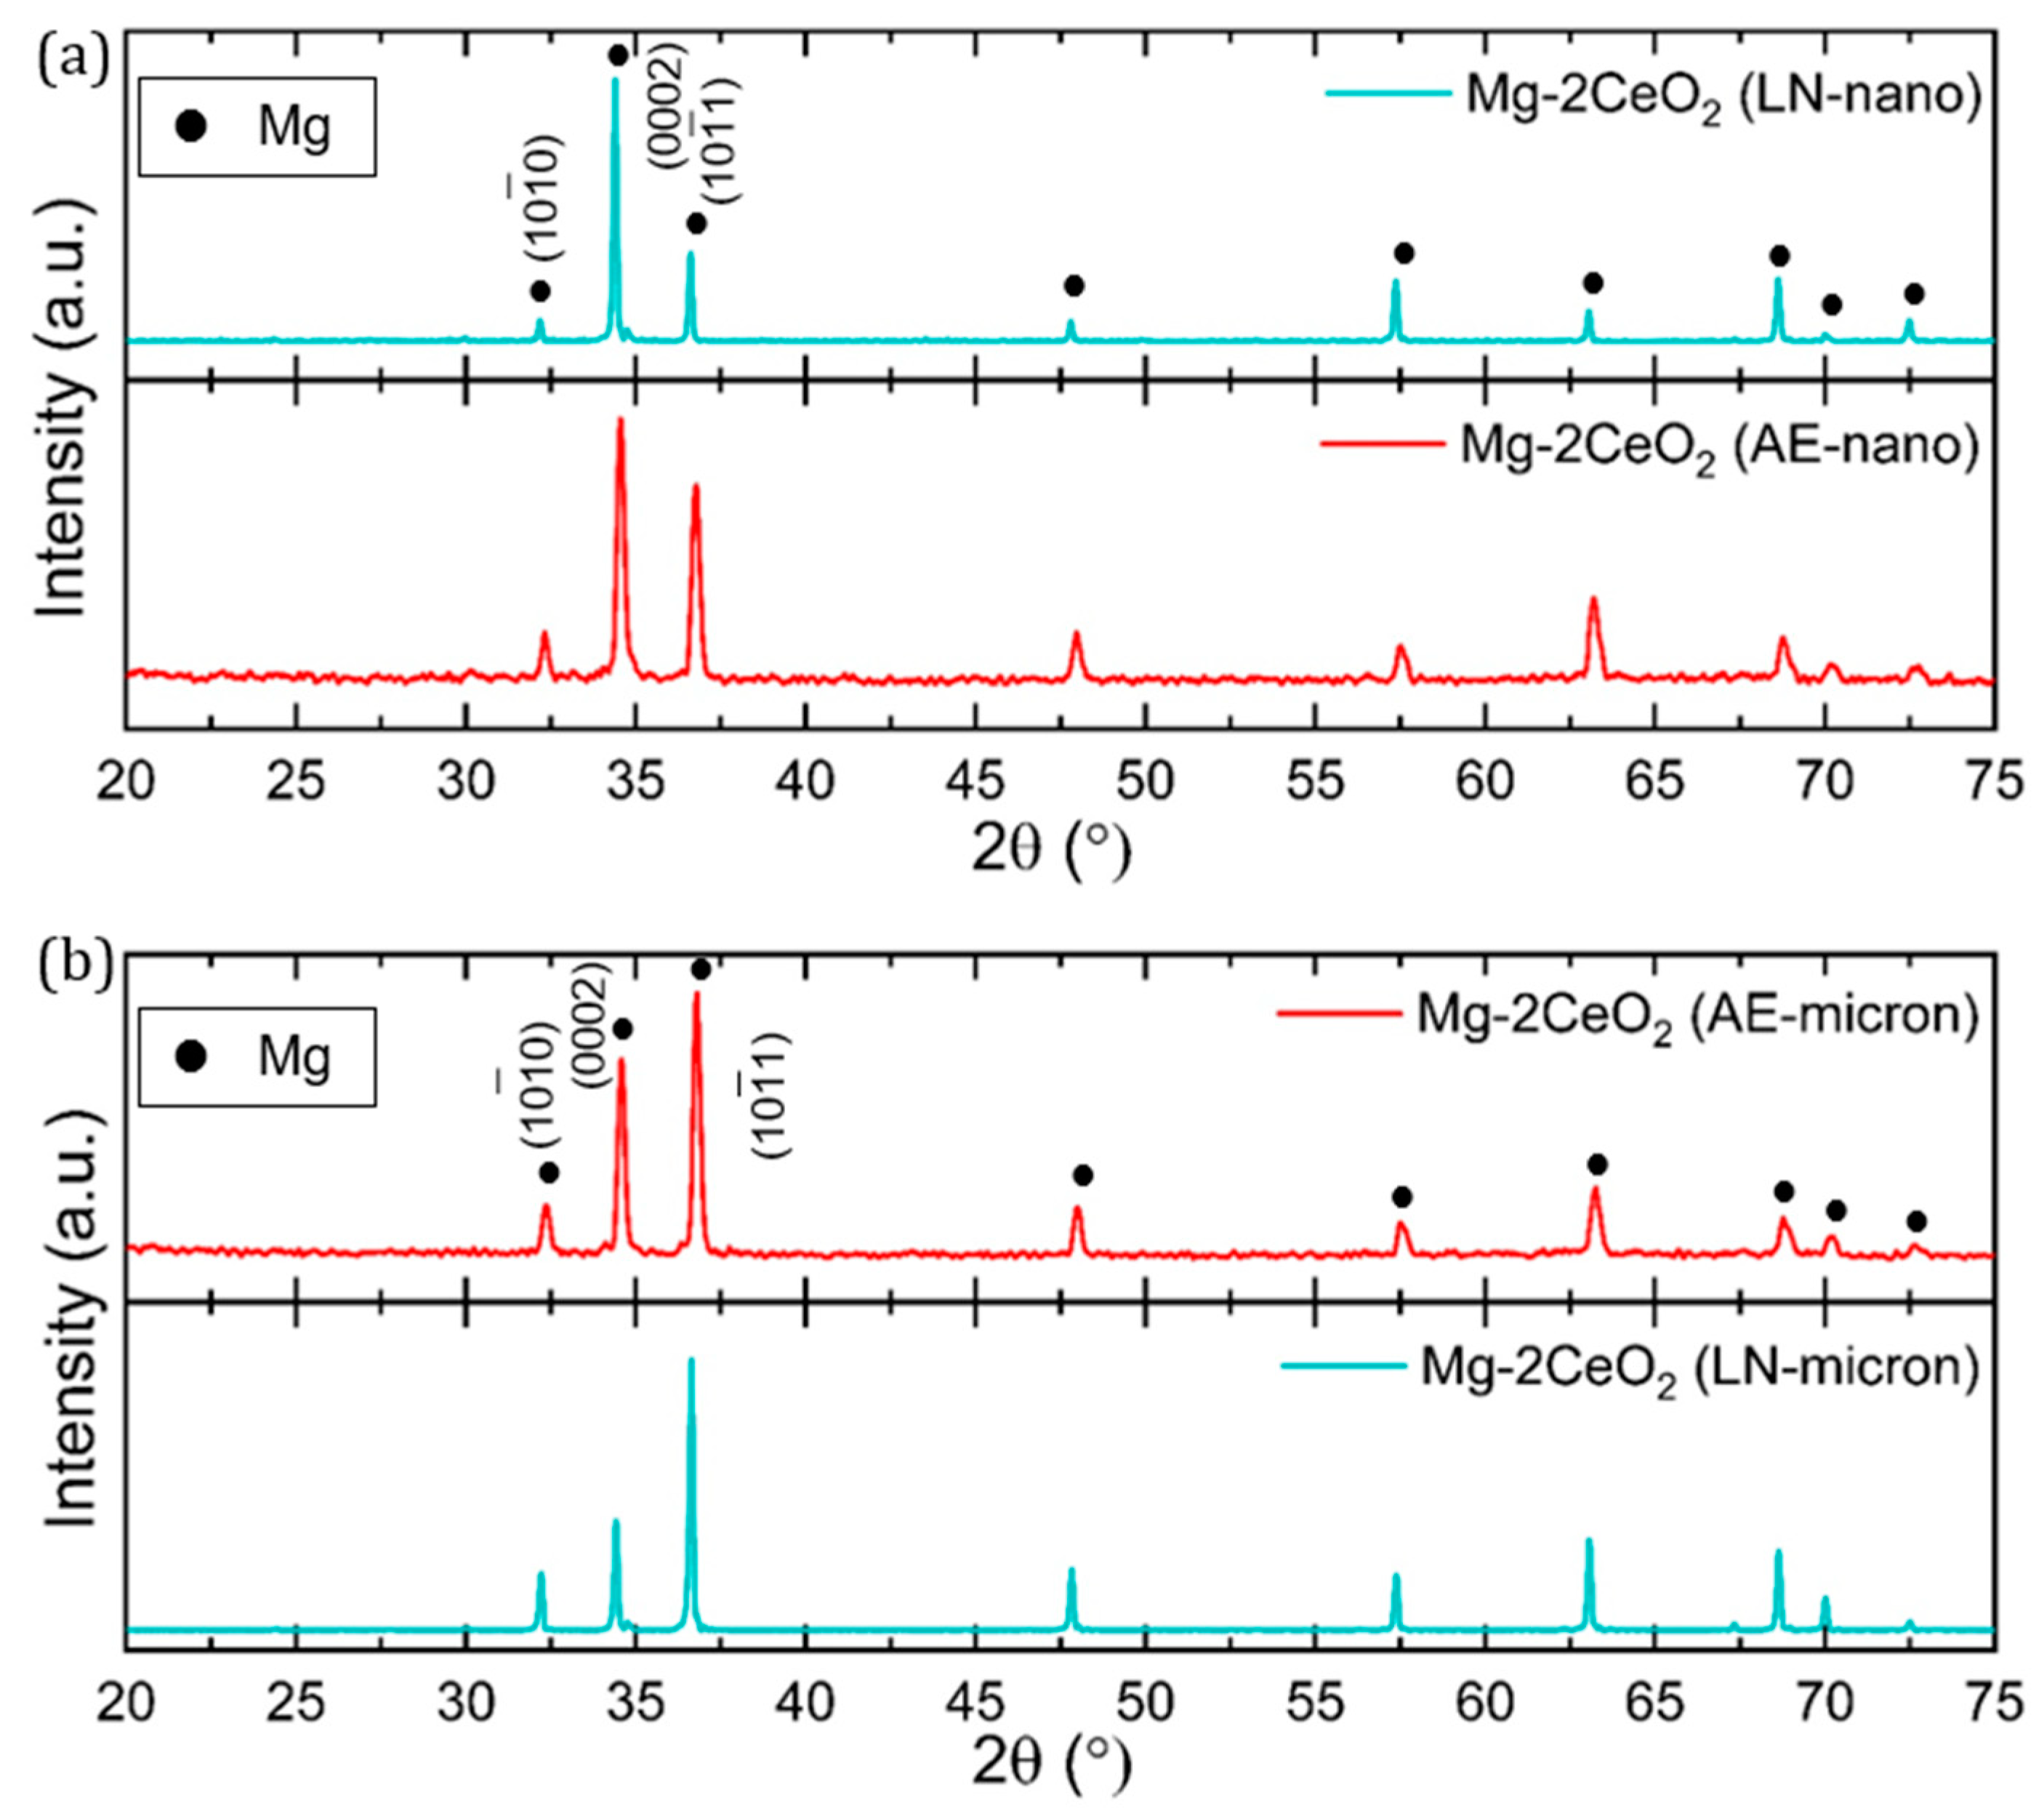
- Within the Mg-2CeO2 nanocomposites, the weakened basal texture in Mg-2CeO2 (AE-nano), as evidenced by the intensities of prismatic and pyramidal peaks, leads to a reduced ignition temperature.
- Within the Mg-2CeO2 microcomposites, the weakened pyramidal texture in Mg-2CeO2 (AE) increases the ignition temperature. In this case, the basal peak was stronger (Figure 2).
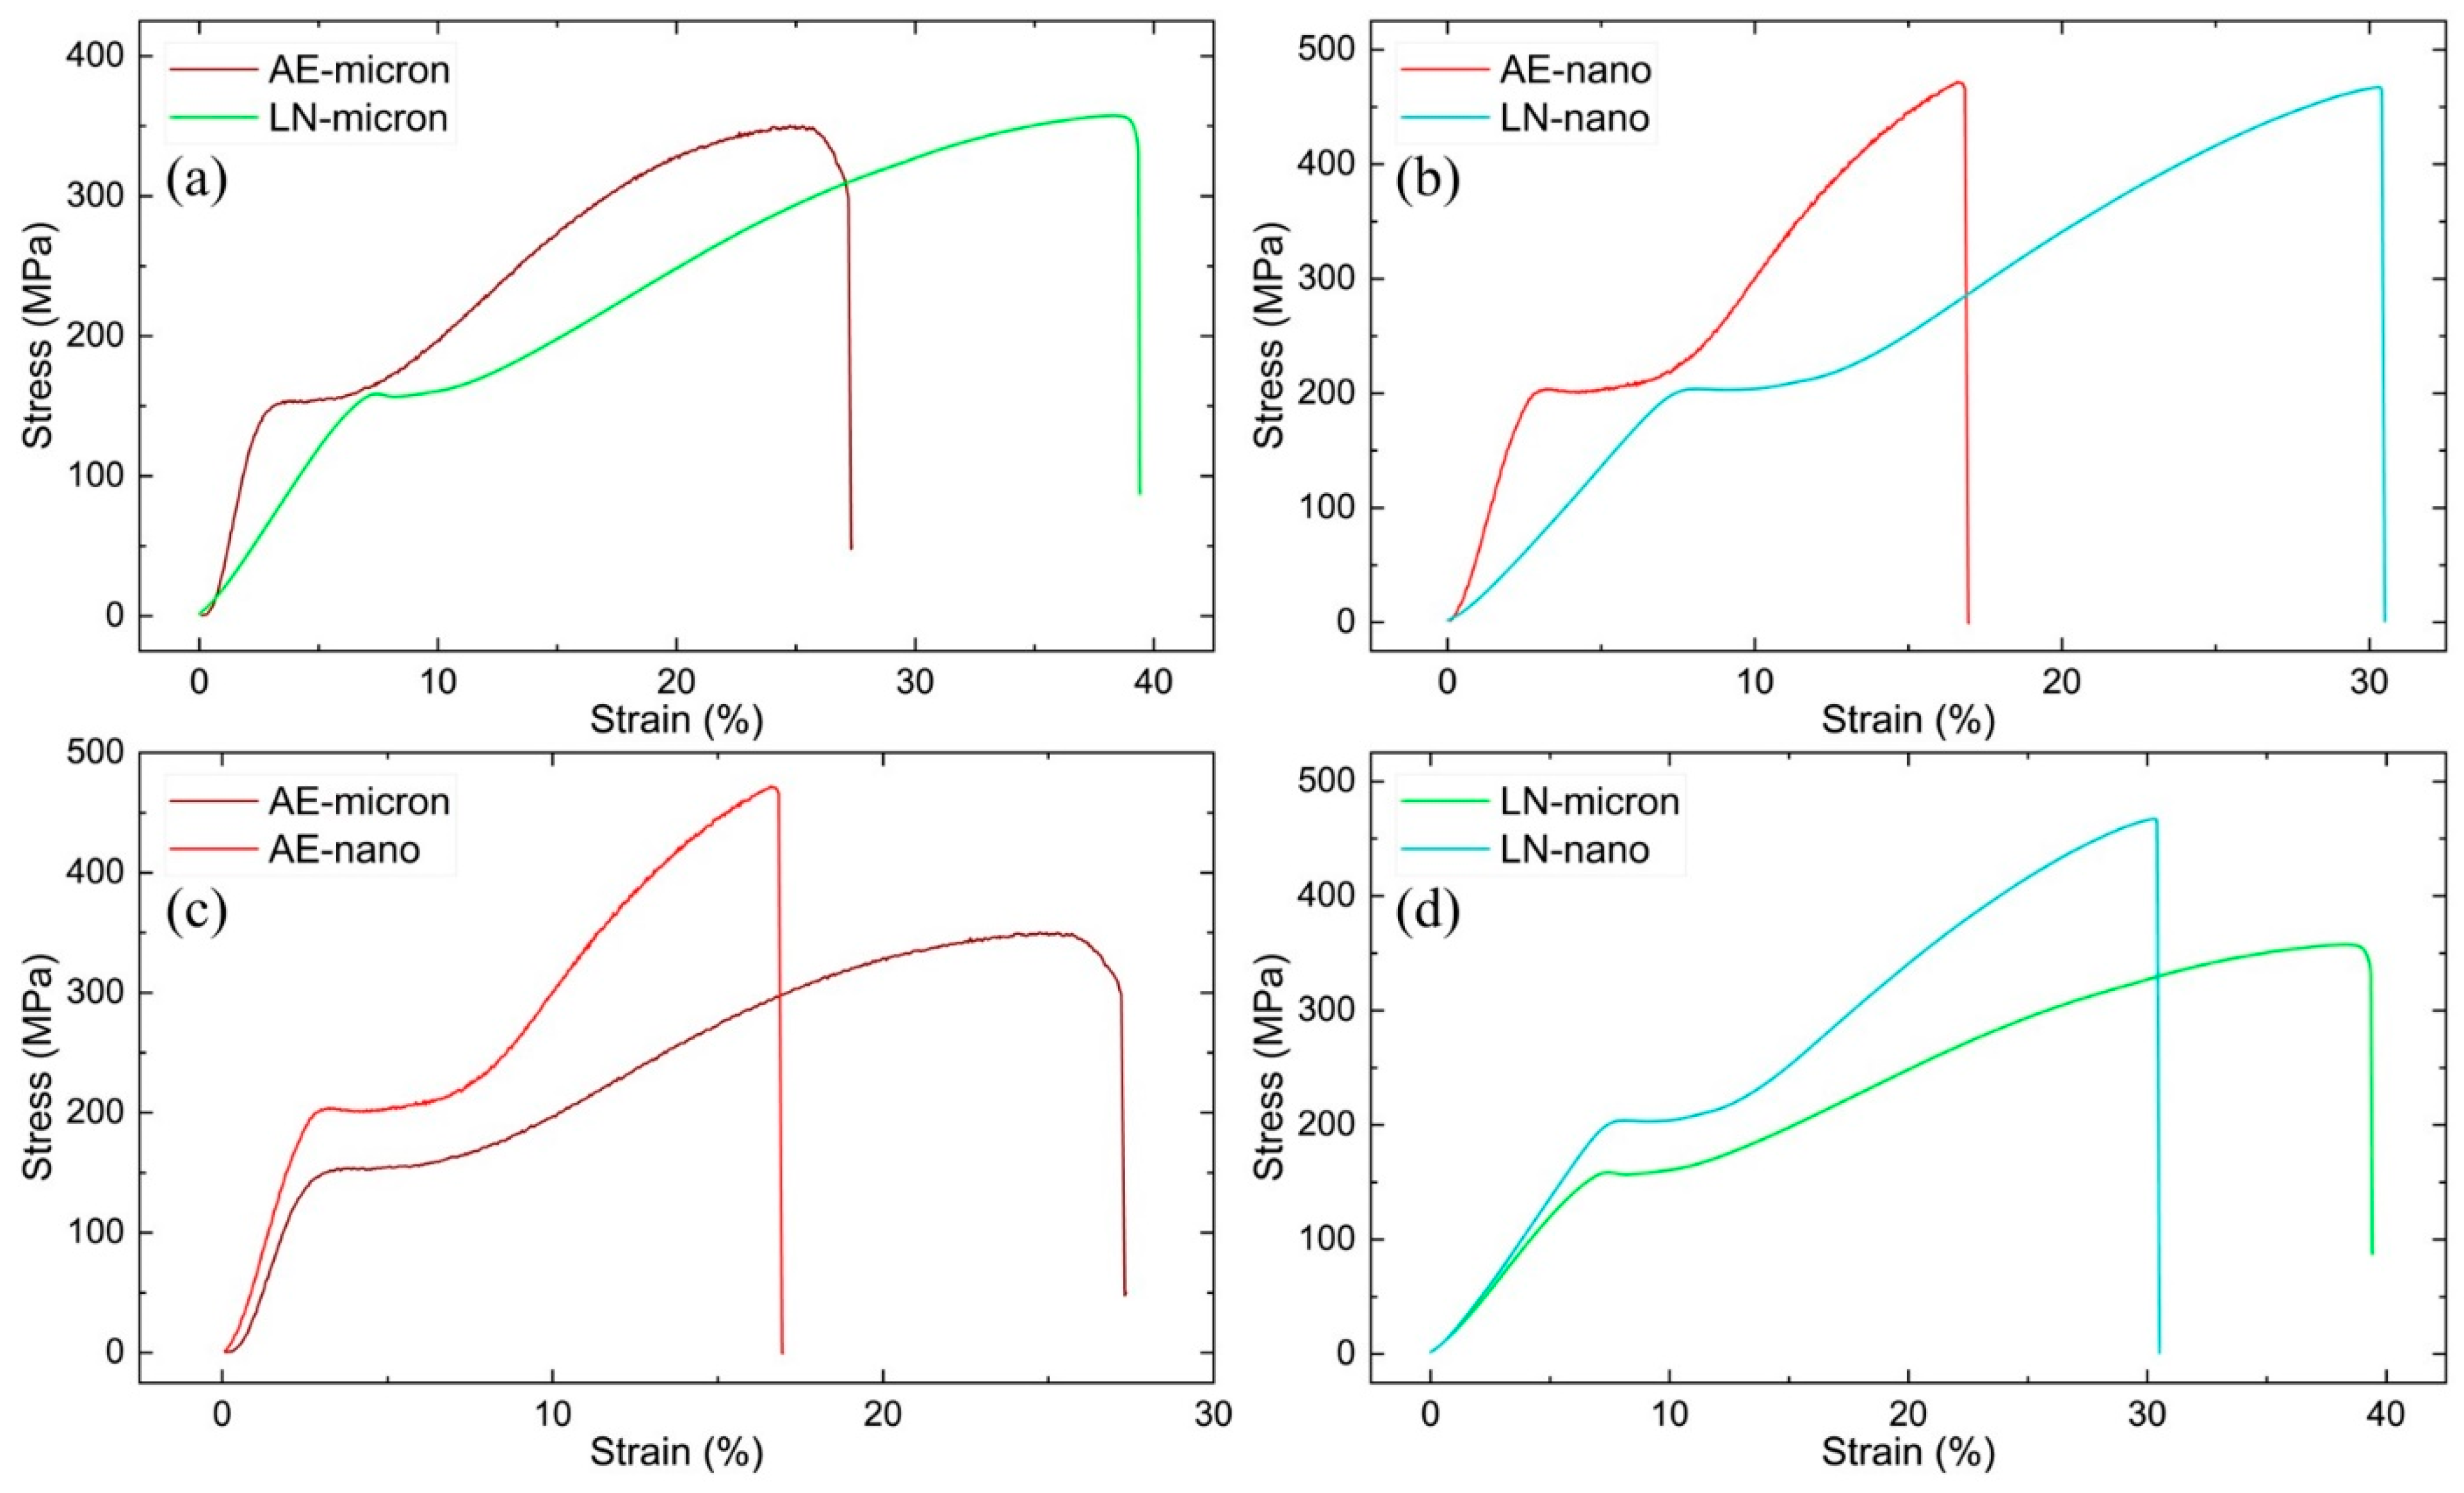
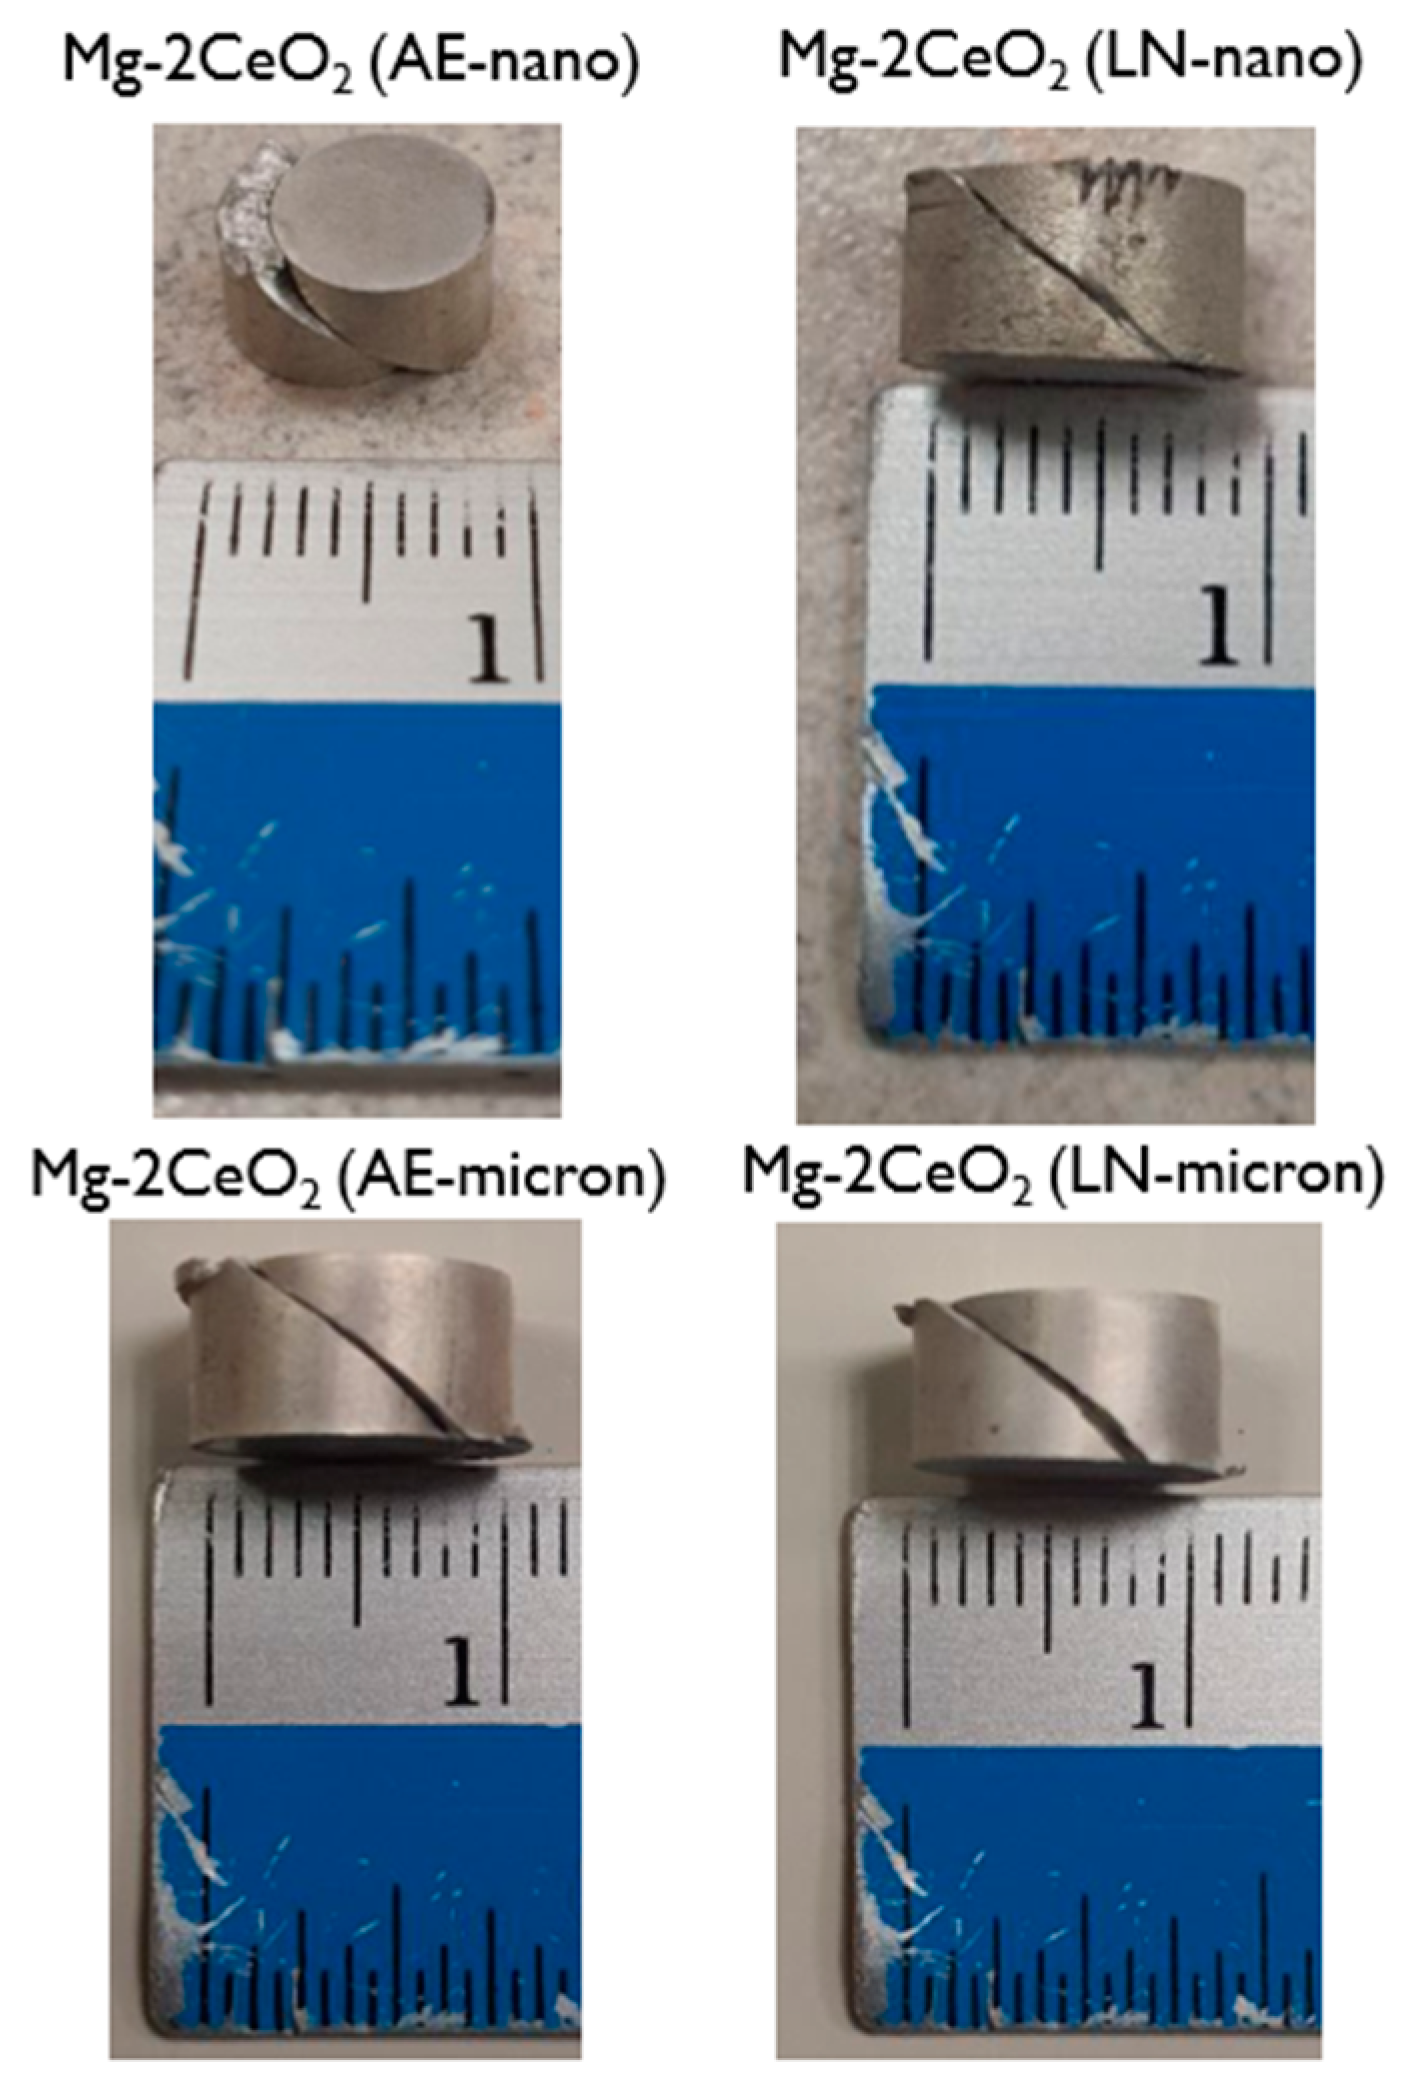
3.4. Mechanical Response
4. Conclusions
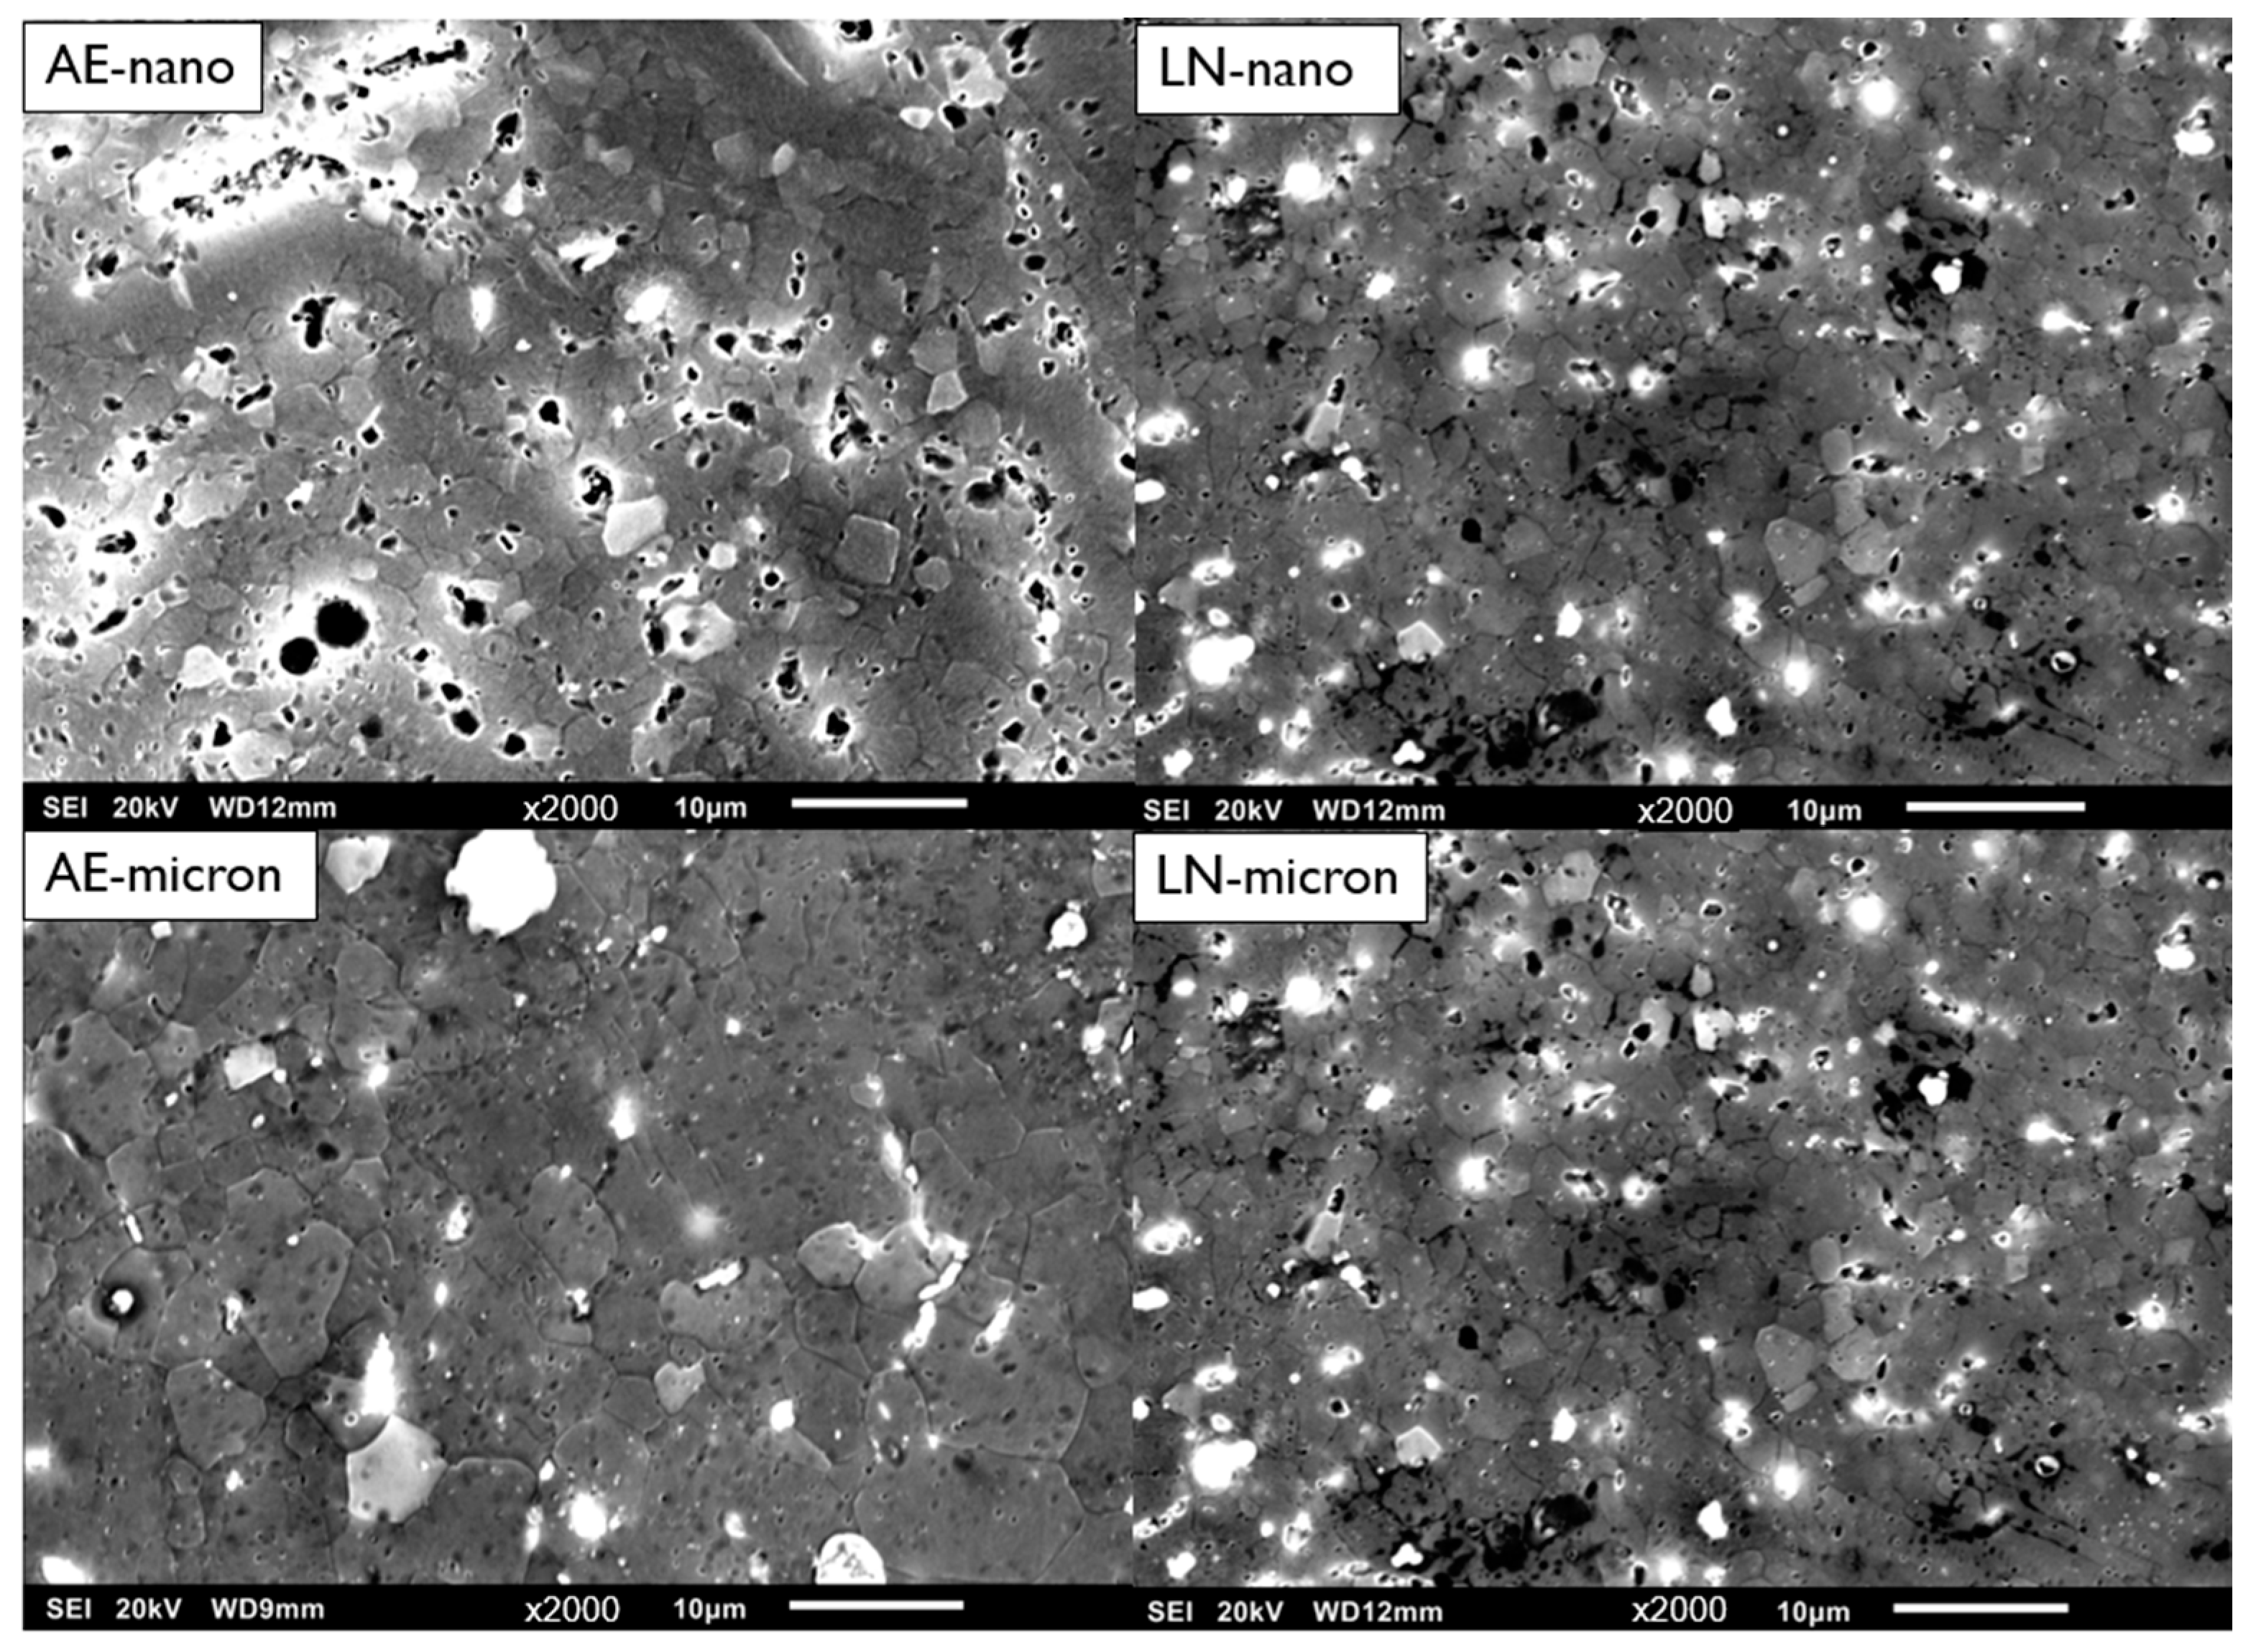
- At a constant amount of CeO2 (2wt.%), the grain sizes of the composite samples (micro- and nanocomposites) remained similar. Deep cryogenic treatment did not noticeably affect grain size at either length scale of reinforcement.
- The porosity values were reduced when the as-extruded micro- and nanocomposite samples were deep cryogenically treated (reduction of 0.08 and 0.43%pt, respectively).
- The deep cryogenic treatment did not randomize the texture of composites, which remained basal for nanocomposites and pyramidal for microcomposites. Instead, the intensity of individual peaks changed to further strengthen the original texture.
- The deep cryogenic treatment had a stronger effect on increasing ignition temperature in the case of the nanocomposite samples. This can be attributed to the coupled and complex effects of the number of particles in the matrix and the texture of the matrix.
- The deep cryogenic treatment enhanced the microhardness, 0.2 CYS, and fracture strain of both micro- and nanocomposite samples. The changes in UCS remained insignificant. The fracture strain increased significantly for nanocomposites (~80%) and microcomposites (27.6%).
Author Contributions
Funding
Institutional Review Board Statement
Informed Consent Statement
Data Availability Statement
Acknowledgments
Conflicts of Interest
References
- Charyeva, O.; Dakischew, O.; Sommer, U.; Heiss, C.; Schnettler, R.; Lips, K.S. Biocompatibility of magnesium implants in primary human reaming debris-derived cells stem cells in vitro. J. Orthop. Traumatol. 2016, 17, 63–73. [Google Scholar] [CrossRef] [PubMed]
- Geoscience Australia. Magnesium. Available online: https://www.ga.gov.au/education/minerals-energy/australian-mineral-facts/magnesium (accessed on 23 February 2024).
- Gupta, M.; Sharon, N.M.L. Chapter 4—Fundamentals of Metal Matrix Composites. In Magnesium, Magnesium Alloys, and Magnesium Composites; John Wiley & Sons: Hoboken, NJ, USA, 2010. [Google Scholar] [CrossRef]
- Akyuz, B. Machinability of Magnesium and Its Alloys. TOJSAT Online J. Sci. Technol. 2011, 1, 31–38. [Google Scholar]
- Maier, P.; Hort, N. Magnesium Alloys for Biomedical Applications. Metals 2020, 10, 1328. [Google Scholar] [CrossRef]
- Prasadh, S.; Raguraman, S.; Wong, R.; Gupta, M. Current Status and Outlook of Temporary Implants (Magnesium/Zinc) in Cardiovascular Applications. Metals 2022, 12, 999. [Google Scholar] [CrossRef]
- Yu, Z.; Chen, J.; Yan, H.; Xia, W.; Su, B.; Gong, X.; Guo, H. Degradation, stress corrosion cracking behavior and cytocompatibility of high strain rate rolled Mg-Zn-Sr alloys. Mater. Lett. 2020, 260, 126920. [Google Scholar] [CrossRef]
- Mishra, S.K.; Manakari, V.; Parande, G.; Matli, P.R.; Gupta, M. Development of Ultralight Binary Mg-Li Alloys: Enhancing Damping, Ductility, and Ultimate Compressive Strength beyond 2000 MPa. J. Mater. Eng. Perform. 2023, 32, 2723–2734. [Google Scholar] [CrossRef]
- Bupesh Raja, V.K.; Parande, G.; Kannan, S.; Sonawwanay, P.D.; Selvarani, V.; Ramasubramanian, S.; Ramachandran, D.; Jeremiah, A.; Akash Sundaraeswar, K.; Satheeshwaran, S.; et al. Influence of Laser Treatment Medium on the Surface Topography Characteristics of Laser Surface-Modified Resorbable Mg3Zn Alloy and Mg3Zn1HA Nanocomposite. Metals 2023, 13, 850. [Google Scholar] [CrossRef]
- Guo, Y.C.; Nie, K.B.; Kang, X.K.; Deng, K.K.; Han, J.G.; Zhu, Z.H. Achieving high-strength magnesium matrix nanocomposite through synergistical effect of external hybrid (SiC+TiC) nanoparticles and dynamic precipitated phase. J. Alloys Compd. 2019, 771, 847–856. [Google Scholar] [CrossRef]
- Kujur, M.S.; Manakari, V.; Parande, G.; Prasadh, S.; Wong, R.; Mallick, A.; Gupta, M. Development of rare-earth oxide reinforced magnesium nanocomposites for orthopaedic applications: A mechanical/immersion/biocompatibility perspective. J. Mech. Behav. Biomed. Mater. 2021, 114, 104162. [Google Scholar] [CrossRef]
- He, Q. Experimental study on polishing performance of CeO2 and nano-SiO2 mixed abrasive. Appl. Nanosci. 2018, 8, 163–171. [Google Scholar] [CrossRef]
- Borra, C.R.; Vlugt, T.J.H.; Yang, Y.; Offerman, S.E. Recovery of Cerium from Glass Polishing Waste: A Critical Review. Metals 2018, 8, 801. [Google Scholar] [CrossRef]
- Kabir, M.S.; Zhou, Z.; Xie, Z.; Munroe, P. Scratch and wear resistance of hydrophobic CeO2−x coatings synthesized by reactive magnetron sputtering. Ceram. Int. 2020, 46, 89–97. [Google Scholar] [CrossRef]
- Thiruvoth, D.D.; Ananthkumar, M. Evaluation of cerium oxide nanoparticle coating as corrosion inhibitor for mild steel. Mater. Today Proc. 2022, 49, 2007–2012. [Google Scholar] [CrossRef]
- Eyring, L. Chapter 27: The binary rare earth oxides. In Handbook on the Physics and Chemistry of Rare Earths; Elsevier: Amsterdam, The Netherlands, 1979; Volume 3, pp. 337–399. [Google Scholar]
- Trovarelli, A.; de Leitenburg, C.; Boaro, M.; Dolcetti, G. The utilization of ceria in industrial catalysis. Catal. Today 1999, 50, 353–367. [Google Scholar] [CrossRef]
- Chen, H.-I.; Chang, H.-Y. Synthesis and characterization of nanocrystalline cerium oxide powders by two-stage non-isothermal precipitation. Solid State Commun. 2005, 133, 593–598. [Google Scholar] [CrossRef]
- Tsunekawa, S.; Sahara, R.; Kawazoe, Y.; Kasuya, A. Origin of the Blue Shift in Ultraviolet Absorption Spectra of Nanocrystalline CeO2−x Particles. Mater. Trans. JIM 2000, 41, 1104–1107. [Google Scholar] [CrossRef]
- Lin, J.-D.; Duh, J.-G. Fracture toughness and hardness of ceria- and yttria-doped tetragonal zirconia ceramics. Mater. Chem. Phys. 2003, 78, 253–261. [Google Scholar] [CrossRef]
- Castano, C.E.; O’Keefe, M.J.; Fahrenholtz, W.G. Cerium-based oxide coatings. Curr. Opin. Solid State Mater. Sci. 2015, 19, 69–76. [Google Scholar] [CrossRef]
- Sun, C.; Li, H.; Chen, L. Nanostructured ceria-based materials: Synthesis, properties, and applications. Energy Environ. Sci. 2012, 5, 8475–8505. [Google Scholar] [CrossRef]
- Sonar, T.; Lomte, S.; Gogte, C. Cryogenic Treatment of Metal—A Review. Mater. Today Proc. 2018, 5, 25219–25228. [Google Scholar] [CrossRef]
- Dieringa, H. Influence of Cryogenic Temperatures on the Microstructure and Mechanical Properties of Magnesium Alloys: A Review. Metals 2017, 7, 38. [Google Scholar] [CrossRef]
- Gupta, S.; Parande, G.; Tun, K.S.; Gupta, M. Enhancing the Physical, Thermal, and Mechanical Responses of a Mg/2wt.%CeO2 Nanocomposite Using Deep Cryogenic Treatment. Metals 2023, 13, 660. [Google Scholar] [CrossRef]
- Gupta, S.; Parande, G.; Gupta, M. Comparison of Shallow (−20 °C) and Deep Cryogenic Treatment (−196 °C) to Enhance the Properties of a Mg/2wt.%CeO2 Nanocomposite. Technologies 2024, 12, 14. [Google Scholar] [CrossRef]
- Baldiserra, P.; Delprete, C. Deep Cryogenic Treatment: A Bibliographic Review. Open Mech. Eng. J. 2008, 2, 1–11. [Google Scholar] [CrossRef]
- ASTM E384-08; Standard Test Method for Microindentation Hardness of Materials. ASTM International: West Conshohocken, PA, USA, 2010. [CrossRef]
- ASTM E9-09; Standard Test Methods of Compression Testing of Metallic Materials at Room Temperature. ASTM International: West Conshohocken, PA, USA, 2018. [CrossRef]
- Huang, H.; Zhang, J. Microstructure and mechanical properties of AZ31 magnesium alloy processed by multi-directional forging at different temperatures. Mater. Sci. Eng. A 2016, 674, 52–58. [Google Scholar] [CrossRef]
- Parande, G.; Tun, K.S.; Neo, H.J.N.; Gupta, M. An Investigation into the Effect of Length Scale (Nano to Micron) of Cerium Oxide Particles on the Mechanical and Flammability Response of Magnesium. J. Mater. Eng. Perform. 2023, 32, 2710–2722. [Google Scholar] [CrossRef]
- Rohrer, G.S. “Introduction to Grains, Phases, and Interfaces—An Interpretation of Microstructure,” Trans. AIME, 1948, vol. 175, pp. 15–51, by C.S. Smith. Metall. Mater. Trans. A 2010, 41, 1063–1100. [Google Scholar] [CrossRef]
- Smith, C.S. Grains, phases, and interphases: An interpretation of microstructure. Trans. Metall. Soc. AIME 1948, 175, 15–51. [Google Scholar]
- Parande, G.; Manakari, V.; Meenashisundaram, G.K.; Gupta, M. Enhancing the tensile and ignition response of monolithic magnesium by reinforcing with silica nanoparticulates. J. Mater. Res. 2017, 32, 2169–2178. [Google Scholar] [CrossRef]
- Manakari, V.; Parande, G.; Doddamani, M.; Gupta, M. Enhancing the Ignition, Hardness and Compressive Response of Magnesium by Reinforcing with Hollow Glass Microballoons. Materials 2017, 10, 997. [Google Scholar] [CrossRef]
- Francl, J.; Kingery, W.D. Thermal Conductivity: IX, Experimental Investigation of Effect of Porosity on Thermal Conductivity. J. Am. Ceram. Soc. 1954, 37, 99–107. [Google Scholar] [CrossRef]
- Sood, A.; Cheaito, R.; Bai, T.; Kwon, H.; Wang, Y.; Li, C.; Yates, L.; Bougher, T.; Graham, S.; Asheghi, M.; et al. Direct Visualization of Thermal Conductivity Suppression Due to Enhanced Phonon Scattering Near Individual Grain Boundaries. Nano Lett. 2018, 18, 3466–3472. [Google Scholar] [CrossRef]
- Kogure, Y.; Hiki, Y. Effect of Dislocations on Low-Temperature Thermal Conductivity and Specific Heat of Copper-Aluminum Alloy Crystals. J. Phys. Soc. Jpn. 1975, 39, 698–707. [Google Scholar] [CrossRef]
- Liu, M.; Shih, D.S.; Parish, C.; Atrens, A. The ignition temperature of Mg alloys WE43, AZ31 and AZ91. Corros. Sci. 2012, 54, 139–142. [Google Scholar] [CrossRef]
- Tekumalla, S.; Gupta, M. An insight into ignition factors and mechanisms of magnesium based materials: A review. Mater. Des. 2017, 113, 84–98. [Google Scholar] [CrossRef]
- Ravi Kumar, N.V.; Blandin, J.J.; Suéry, M.; Grosjean, E. Effect of alloying elements on the ignition resistance of magnesium alloys. Scr. Mater. 2003, 49, 225–230. [Google Scholar] [CrossRef]
- Taha, A.S.; Hammad, F.H. Application of the Hall-Petch Relation to Microhardness Measurements on Al, Cu, Al-MD 105, and Al-Cu Alloys. Phys. Status Solidi (A) 1990, 119, 455–462. [Google Scholar] [CrossRef]
- Yu, H.; Xin, Y.; Wang, M.; Liu, Q. Hall-Petch relationship in Mg alloys: A review. J. Mater. Sci. Technol. 2018, 34, 248–256. [Google Scholar] [CrossRef]
- Wang, Y.; Choo, H. Influence of texture on Hall–Petch relationships in an Mg alloy. Acta Mater. 2014, 81, 83–97. [Google Scholar] [CrossRef]
- Jiang, Y.; Chen, D.; Chen, Z.; Liu, J. Effect of Cryogenic Treatment on the Microstructure and Mechanical Properties of AZ31 Magnesium Alloy. Mater. Manuf. Process. 2010, 25, 837–841. [Google Scholar] [CrossRef]
- Ibrahim, I.A.; Mohamed, F.A.; Lavernia, E.J. Particulate reinforced metal matrix composites—A review. J. Mater. Sci. 1991, 26, 1137–1156. [Google Scholar] [CrossRef]
- Hamad, K. Highly-Ductile Magnesium Alloys: Atomistic-Flow Mechanisms and Alloy Designing. Materials 2019, 12, 1934. [Google Scholar] [CrossRef]
- Suh, B.-C.; Shim, M.-S.; Shin, K.S.; Kim, N.J. Current issues in magnesium sheet alloys: Where do we go from here? Scr. Mater. 2014, 84–85, 1–6. [Google Scholar] [CrossRef]
- Mert, F.; Özdemir, A.; Kainer, K.U.; Hort, N. Microstructure and Mechanical Properties of High Pressure Die Cast AM50 Magnesium Alloy Containing Ce. In Magnesium Technology 2012; Mathaudhu, S.N., Sillekens, W.H., Neelameggham, N.R., Hort, N., Eds.; Springer International Publishing: Cham, Switzerland, 2016; pp. 149–154. [Google Scholar]
- Ahmad, I.R.; Shu, D.W. Compressive properties of AM50 and AZ91D alloys using split Hopkinson pressure bar. In Proceedings of the Second International Conference on Smart Materials and Nanotechnology in Engineering, Weihai, China, 8–11 July 2009; p. 749326. [Google Scholar]
- Shan, J. Fracture mechanism of magnesium alloys at room temperature. In Proceedings of the 4th International Conference on Mechatronics, Materials, Chemistry and Computer Engineering 2015, Xi’an, China, 12–13 December 2015; pp. 1109–1114. [Google Scholar]
- Dieringa, H.; Fuskova, L.; Fechner, D.; Blawert, C. Mechanical and corrosion behaviour of a hydroxyapatite reinforced magnesium alloy WE43. In Proceedings of the 17th International Conference on Composite Materials, ICCM, Edinburgh, UK, 27–31 July 2009. [Google Scholar]
- Lentz, M.; Klaus, M.; Coelho, R.S.; Schaefer, N.; Schmack, F.; Reimers, W.; Clausen, B. Analysis of the Deformation Behavior of Magnesium-Rare Earth Alloys Mg-2 pct Mn-1 pct Rare Earth and Mg-5 pct Y-4 pct Rare Earth by In Situ Energy-Dispersive X-ray Synchrotron Diffraction and Elasto-Plastic Self-Consistent Modeling. Metall. Mater. Trans. A 2014, 45, 5721–5735. [Google Scholar] [CrossRef]
- Xiong, Y.; Yu, Q.; Jiang, Y. An experimental study of cyclic plastic deformation of extruded ZK60 magnesium alloy under uniaxial loading at room temperature. Int. J. Plast. 2014, 53, 107–124. [Google Scholar] [CrossRef]


| Raw Material | Size | Purity | Supplier |
|---|---|---|---|
| Magnesium | - | ≥99.9% | Acros Organics, Morris Plains, NJ, USA |
| Cerium oxide (nanoscale) | 15–30 nm | 99.9% | Alfa Aesar GmbH & Co. KG, Haverhill, MA, USA |
| Cerium oxide (microscale) | 5 µm | 99.9% |
| Before Treatment | After Treatment | |||||
|---|---|---|---|---|---|---|
| Material | Theoretical Density [g/cm3] | Experimental Density [g/cm3] | Porosity [%] | Experimental Density [g/cm3] | Porosity [%] | Change in Porosity [%pt] |
| Pure Mg * [31] | 1.7380 | 1.732 ± 0.0005 | 0.3190 | - | - | - |
| Mg-2CeO2 (AE-nano) * [25,26] | 1.7648 | 1.745 ± 0.002 | 1.099 | - | - | - |
| Mg-2CeO2 (LN-nano) * [25,26] | 1.7648 | 1.7476 ± 0.0009 | 0.9764 | 1.755 ± 0.002 | 0.5445 | −0.4319 (↓44.2%) |
| Mg-2CeO2 (AE-micron) | 1.7648 | 1.760 ± 0.001 | 0.355 | - | - | - |
| Mg-2CeO2 (LN-micron) | 1.7648 | 1.7596 ± 0.002 | 0.2924 | 1.761 ± 0.001 | 0.2153 | −0.0771 (↓26.3%) |
| Composition | Mean Grain Size (µm) | Mean Aspect Ratio |
|---|---|---|
| Pure Mg [31] | 21 ± 0.8 | 1.4 ± 0.2 |
| Mg-2CeO2 (AE-nano) [25,26] | 2 ± 0.6 | 1.4 ± 0.3 |
| Mg-2CeO2 (LN-nano) [25,26] | 2.8 ± 0.6 | 1.2 ± 0.3 |
| Mg-2CeO2 (AE-micron) | 2.9 ± 0.8 | 1.5 ± 0.3 |
| Mg-2CeO2 (LN-micron) | 2.8 ± 0.8 | 1.6 ± 0.5 |
| Material | Plane | I/Imax |
|---|---|---|
| Mg-2CeO2 (AE-nano) [25,26] | 10–10 prism | 0.217021 |
| 0002 basal | 1 | |
| 10–11 pyramidal | 0.753191 | |
| Mg-2CeO2 (LN-nano) [25,26] | 10–10 prism | 0.104399 |
| 0002 basal | 1 | |
| 10–11 pyramidal | 0.52514 | |
| Mg-2CeO2 (AE-micron) | 10–10 prism | 0.21600 |
| 0002 basal | 0.75415 | |
| 10–11 pyramidal | 1 | |
| Mg-2CeO2 (LN-micron) | 10–10 prism | 0.21109 |
| 0002 basal | 0.40639 | |
| 10–11 pyramidal | 1 |
| Composition | Microhardness (HV) |
|---|---|
| Pure Mg [31] | 55 ± 3 |
| Mg-2CeO2 (AE-nano) [25] | 86 ± 2 |
| Mg-2CeO2 (LN-nano) [25,26] | 92 ± 4 (↑7%) |
| Mg-2CeO2 (AE-micron) | 74 ± 3 |
| Mg-2CeO2 (LN-micron) | 88 ± 7 (↑19%) |
| Composition | 0.2 CYS (MPa) | UCS (MPa) | Total Fracture Strain (%) | Plastic Fracture Strain (%) | Energy Absorbed (MJ/m3) |
|---|---|---|---|---|---|
| Pure Mg [31] | 63 ± 4 | 278 ± 5 | 24 ± 1 | - | 45 |
| Mg-2CeO2 (AE-nano) [26] | 178 ± 19 | 473 ± 16 | 16.5 ± 0.7 | 10.5 | 43.3 ± 1.8 |
| Mg-2CeO2 (LN-nano) [26] | 203 ± 5 (↑14.2%) | 452 ± 15 (↓4.4%) | 29.7 ± 1.2 (↑80%) | 13.0 | 76 ± 6 (↑72%) |
| Mg-2CeO2 (AE-micron) | 142 ± 11 | 341 ± 8 | 29 ± 3 | 21.0 | 70 ± 10 |
| Mg-2CeO2 (LN-micron) | 157.5 ± 1 (↑10.9%) | 347.6 ± 6 (↑1.9%) | 37 ± 3 (↑27.6%) | 23.0 | 100 ± 8 (↑42.9%) |
| AM50 [49] | 110 | 312 | 11.5 | - | NA |
| AZ91D [50] | 130 | 300 | 12.4 | - | |
| AZ31 [51] | - | 250 | 28 | - | |
| Mg-5Zn/5BG [26] | - | 112.8 | - | - | |
| WE43 [52] | 261 ± 16 | 420 ± 13 | 16.3 ± 1.0 | - | |
| WE43 + Apatite [52] | 229 ± 6 | 380.1 ± 9.0 | 11.7 ± 0.5 | - | |
| ME21 [53] | 87 | 260 | 25 | - | |
| WE54 [26] | 210 | 325 | 27 | - | |
| ZK60 [54] | 159 | 472 | 12.4 | - | |
| Mg4Zn3Gd1Ca [26] | 260 ± 3 | 585 ± 18 | 12.6 ± 0.3 | - | |
| Mg4Zn3Gd1Ca-ZnO [26] | 355 ± 5 | 703 ± 40 | 10.6 ± 0.3 | - |
Disclaimer/Publisher’s Note: The statements, opinions and data contained in all publications are solely those of the individual author(s) and contributor(s) and not of MDPI and/or the editor(s). MDPI and/or the editor(s) disclaim responsibility for any injury to people or property resulting from any ideas, methods, instructions or products referred to in the content. |
© 2024 by the authors. Licensee MDPI, Basel, Switzerland. This article is an open access article distributed under the terms and conditions of the Creative Commons Attribution (CC BY) license (https://creativecommons.org/licenses/by/4.0/).
Share and Cite
Gupta, S.; Johanes, M.; Parande, G.; Gupta, M. An Investigation into the Effect of Length Scale of Reinforcement on the Cryogenic Response of a Mg/2wt.%CeO2 Composite. Micro 2024, 4, 170-184. https://doi.org/10.3390/micro4010012
Gupta S, Johanes M, Parande G, Gupta M. An Investigation into the Effect of Length Scale of Reinforcement on the Cryogenic Response of a Mg/2wt.%CeO2 Composite. Micro. 2024; 4(1):170-184. https://doi.org/10.3390/micro4010012
Chicago/Turabian StyleGupta, Shwetabh, Michael Johanes, Gururaj Parande, and Manoj Gupta. 2024. "An Investigation into the Effect of Length Scale of Reinforcement on the Cryogenic Response of a Mg/2wt.%CeO2 Composite" Micro 4, no. 1: 170-184. https://doi.org/10.3390/micro4010012