Article

Hydrofluoric Acid-Free Digestion of Organosilicon Nanoparticles for Bioanalysis by ICP-OES

Spago Nanomedical AB, Scheelevägen 22, 223 63 Lund, Sweden
*
Author to whom correspondence should be addressed.
Micro 2023, 3(1), 264-273; https://doi.org/10.3390/micro3010019
Submission received: 28 November 2022 / Revised: 22 December 2022 / Accepted: 3 January 2023 / Published: 2 March 2023
(This article belongs to the Section Analysis Methods and Instruments)

Abstract

:
A novel ICP-OES method has been developed for the determination of Si concentration, originating from polyorganophosphosilanes, in biological specimens that also contain metal ions. The method is free of hazardous hydrofluoric acid (HF) and involves digestion with HNO3/H2O2 prior to the analysis by ICP-OES. High and reproducible spike recovery was obtained from the controls.

1. Introduction

SN132D and Tumorad® are nanoparticles (NPs) used in clinical and regulatory preclinical development, for the imaging and treatment of cancer, respectively. Both NPs are polyethylene glycol (PEG)-coated with a polyorganophosphosilane core [1].
The Tumorad® NPs of 25–30 nm have a very high affinity for polyvalent metal ions suitable for clinical application. During their preclinical development, non-radioactive and easily detectable metals such as Y and Lu are incorporated to obtain information about bio-distribution and pharmacokinetics. A good bioanalytical method should allow the determination of both the loaded metal and the carrier NPs. The most suitable element is, in this case, Si because of the high background of P in tissue.
Silicon is the most abundant element in the earth’s crust after oxygen and is normally found as silicate minerals and silica. Leaked soluble silica is predominantly present as silicic acid, Si(OH)4, and is ubiquitously present, e.g., tap water contains ppm levels (mg/L). Although the magnitudes are lower than biological phosphorus, there are significant biological background concentrations of Si in all tissues. In the laboratory, the leakage of soluble silica from glass labware, analytical equipment, and reagents contribute to the background and, thus, limits the sensitivity and accuracy of bioanalyses. Partially soluble silica, such as oligomers of silicic acid, complicates the elemental analysis of Si.
Hydrofluoric acid (HF) is often used to obtain the complete recovery of Si in biological samples. However, hydrofluoric acid is highly corrosive to living tissue and glassware. It exposes the researcher to hazards and safety precautions that require time- and cost-inefficient solutions. For example, glassware has to be replaced by ceramic and plastic tools. Another major concern that affects the quantification of Si is the risk of losing Si from the sample as volatile SiF4, which may occur when HF is combined with strong acid [2]. For these reasons, Si is generally seen as a difficult element to measure by any analytical method, including ICP, which is the focus of the current article [2,3,4,5,6].
The current practice for the analysis of silicon in biological samples includes both HNO3 and HF during digestion [7,8,9]. The combination of HNO3 and HF has a broad application for many other elements from complex samples but is not optimal for samples containing organophosphosilanes [10,11].
The most relevant and recent literature on methods to quantify Si in challenging samples is sparse. The suggested methods in one publication present the use of H2O2, HNO3, and HF to determine total silicon from SiO2 particles with reaction-cell ICP-MS [5]. However, the method still includes HF, which, as mentioned above, is problematic in several ways. Another method presents a digestion protocol under basic conditions and the subsequent acidification by HNO3 before ICP-OES bioanalysis [12]. Herein, HF is not included but the alkaline conditions strongly favor conversion to silicate. Next, a method to detect silica NPs uses KOH followed by H2SO4 [4]. Alkaline digestion is highly unfavorable due to the large volumes required for dilution, resulting in an unsatisfactory sensitivity. Another limitation of digestion with KOH is the potential interference between the emission from potassium and metal ions such as Lu3+ or Y3+, which may be of interest to co-analyze. Lastly, one publication showed a procedure where tetramethylammonium hydroxide was used as a base [3]. This involves the addition of a large amount of organic carbon, which may contribute to the black-body background and, thus, reduce the sensitivity to detect Si.
Current state-of-the-art methods to detect Si do not consider metal ion analysis from the same samples. To overcome this, we have developed a novel method to detect silicon, present as alkyltrioxysilanes, and metal ions from the same sample without HF. The details of the new method are presented in the hope of being applicable to similar analytical problems.

2. Materials and Methods

2.1. Standards and Reagents

Milli-Q (MQ) water from Milli-Q Plus 185, Resistivity: 18.2 MΩ × cm (Millipore, Burlington, MA, USA) was used for sample preparation and all dilutions. Hydrogen peroxide, H2O2 29.0–32.0% (Sigma Aldrich, Saint Louis, MI, USA), and nitric acid, HNO3 67–69% (Normatom, VWR Chemicals, Sanborn, NY, USA) were of ultrapure grade. Calibrants for total silicon (Si) measurements were prepared from certified reference material with ISO/IEC 17025 and ISO Guide 34. A stock solution of 1013 mg/L (High Purity Standard, Sigma Aldrich, 08729) was used and diluted with 15.2% HNO3/5.3% H2O2 to prepare Si standards between 0.03 mg/L and 5 mg/L. Ludox AM-30 colloidal silica (30% wt/wt) was obtained from Sigma-Aldrich (420875).
Chicken liver, mouse liver, and mouse carcass were used in the method development and accuracy tests.

2.2. ICP-OES Equipment and Instrument Parameters
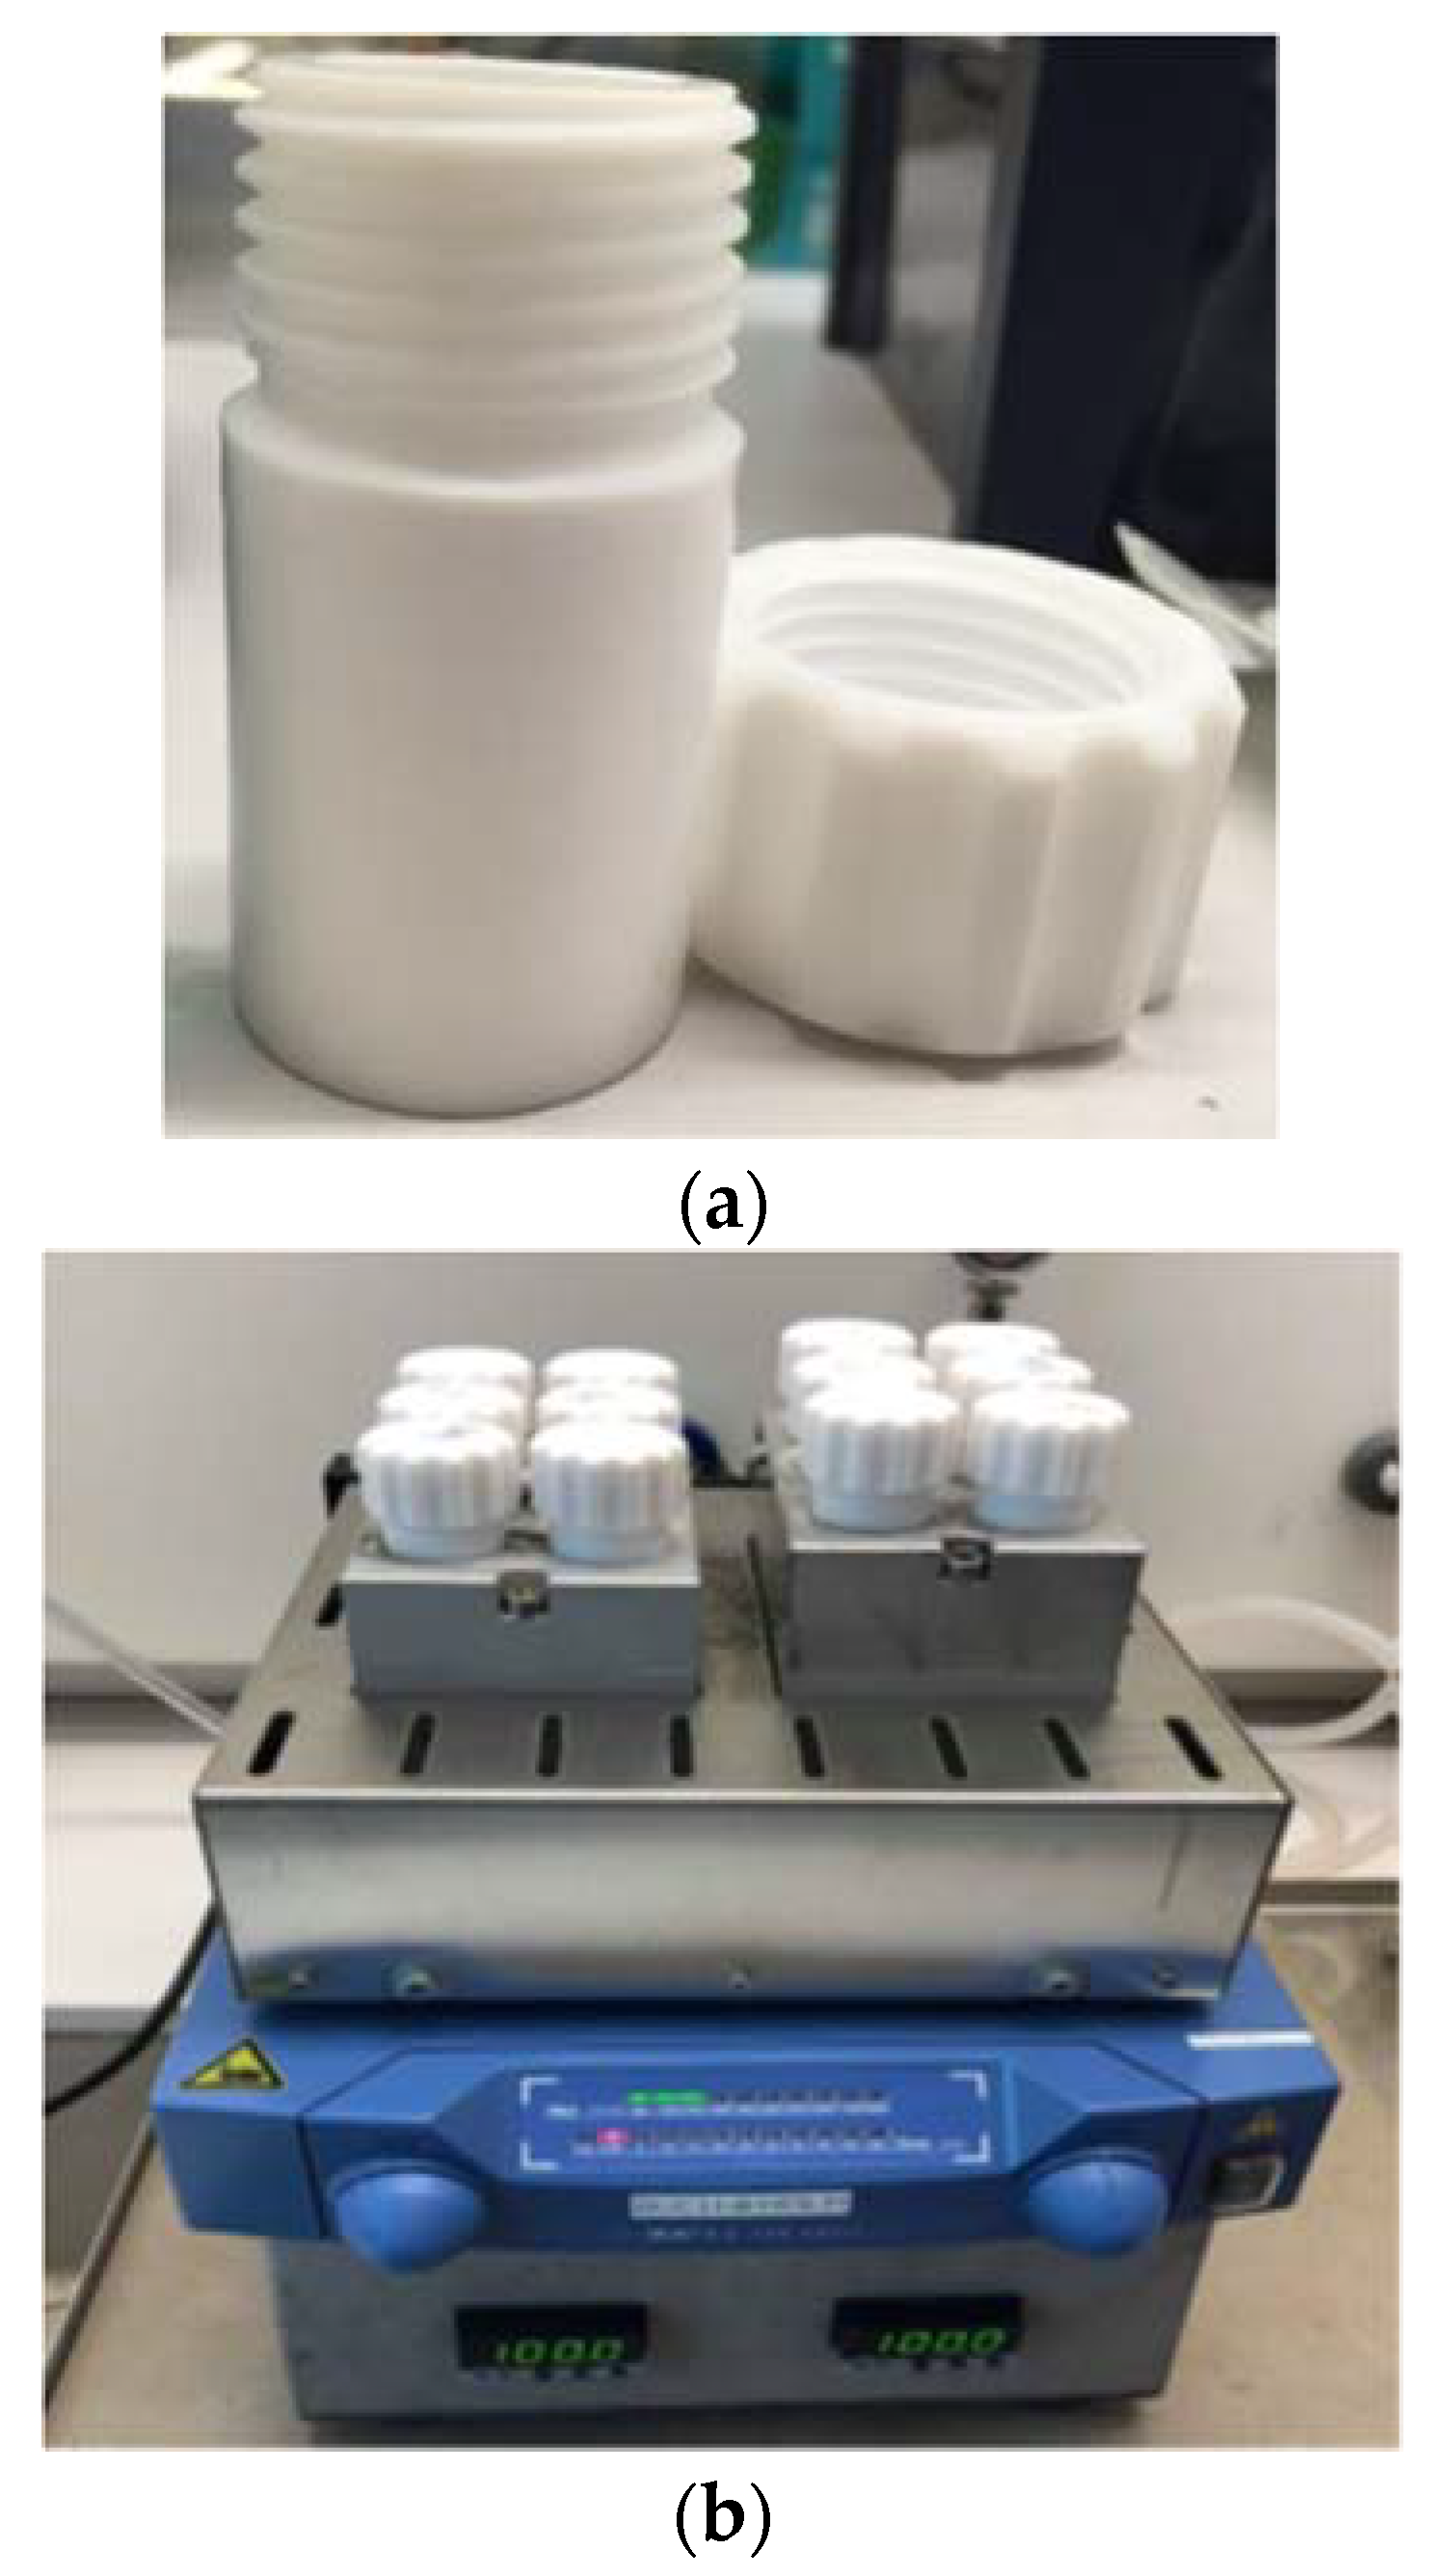
The standard components in glass, single-pass cyclonic spray chamber (201008170), torch (2.4 mm, 2010090400), and nebulizer (Seaspray, 2010096400), as well as the axial ICP-OES (710) and the software Agilent ICP Expert II V Version 2.0.5.283, employed for all measurements, were from the same manufacturer (Agilent Technologies, Mulgrave, Australia). The Si emission signal was recorded at 251.611 nm. The instrument parameters are shown in Table 1.

Other Equipment

Vials and threaded lids in PTFE were produced by Prototypverkstaden, Lund, Sweden. The volume was 12 mL, and the vial and lid, together, had a height of 54 mm and a weight of 64 g (Figure 1a). Holes (to fit the outer diameter of 27.5 mm) were made in blocks (80 × 130 mm) of aluminum. Two such blocks, each harboring 6 vials, were connected to a heater and shaker (modified from IKA® KS 130 Basic (Figure 1b)).
A safety shield from Nalgene, Rochester, NY, USA (6350) was put in front of the heater and shaker during heating.
Disposable scalpels were from Heinz Herenz, Hamburg Germany (0482). The cutting board, made of LDPE, was from the local supermarket. Plastic tweezers were obtained from Sagitta, Mariestad, Sweden.

2.3. Sample Preparation

2.3.1. Decontamination Procedures

The vials were washed in warm water + detergent (Exterran, Victoria, Australia, NO19263155004) and then rinsed with MQ water (at least 5 times). After rinsing with 6 M HNO3 and one last time with MQ water, they were dried at 60 °C before use. Thus, HF was not used for decontamination.

2.3.2. Sample Collection

Chicken liver, used for the majority of the recovery experiments, was obtained from the local supermarket. Livers, carcasses, and kidneys were from mice and rats; control animals from preclinical studies. The fur of the mouse carcasses was removed by shaving (Hair-Trimmer, Biltema, Lund, Sweden, 84-1019). Further removal of hair (which contains Si) was performed using Silky Fresh Hair Removal Cream, Veet. The mice were then homogenized (Moulinex Optiblend 2000). Kidneys from Wistar rats were used to test the recovery of Si after digestion without H2O2. All animal experiments were performed at the contract research organization Timeline (Lund, Sweden), according to their standard operating procedures and ethical permissions.

2.3.3. Digestion for Total Si Determination

A mixture of nitric acid and hydrogen peroxide (38% HNO3/13.2% H2O2) was prepared in a 50 mL centrifuge tube, first adding 22 mL of 30% H2O2 (stored in the fridge) and then 68% HNO3 up to 50 mL.
Tissue (0.3 g) was weighed in a Teflon vial, then the acid mixture (2.7 mL) was added. The samples were treated at 100 °C and shaken at 240 rpm for 1:30 h.
The digested tissue (2.0 mL) was removed from the vial and diluted (2.5-fold) with MQ-water (3.0 mL) in a 15 mL tube for ICP-OES analysis.
Weights were noted; before adding the sample, the sample weight, after the addition of HNO3/H2O2, and finally after the heating process. The leakage of weight was recorded and the loss was found to be negligible. The fraction of the digested sample transferred (typically around 80%) was calculated.

2.3.4. Attempted Digestion without H2O2

The recovery of Si from spiked rat kidneys was investigated to confirm the role of hydrogen peroxide during digestion. Sample preparation followed the protocol above (Section 2.3.3) except for the substitution of HNO3/H2O2 with 50% HNO3. The background concentration of Si was determined from non-spiked samples and subtracted.

2.3.5. Standards in 15.2% HNO3/5.3% H2O2

Standard solutions for Si between 0.03 mg/L and 5 mg/L were prepared in (15.2% HNO3/5.3% H2O2) to match the conditions in the digested samples (Figure 2).

2.3.6. NPs to Spike Tissue

Tumorad® NPs were used as the spike material. Nominal NP concentrations were measured and defined in 1% HNO3/5% HCl/20 mg/L of Triton X-100. Standard conditions for instrument parameters were used (Table 1) except for a lower RF power (1.2 kW).

3. Results

3.1. Method Validation and Analytical Quality Control

3.1.1. Limits of Detection and Quantification
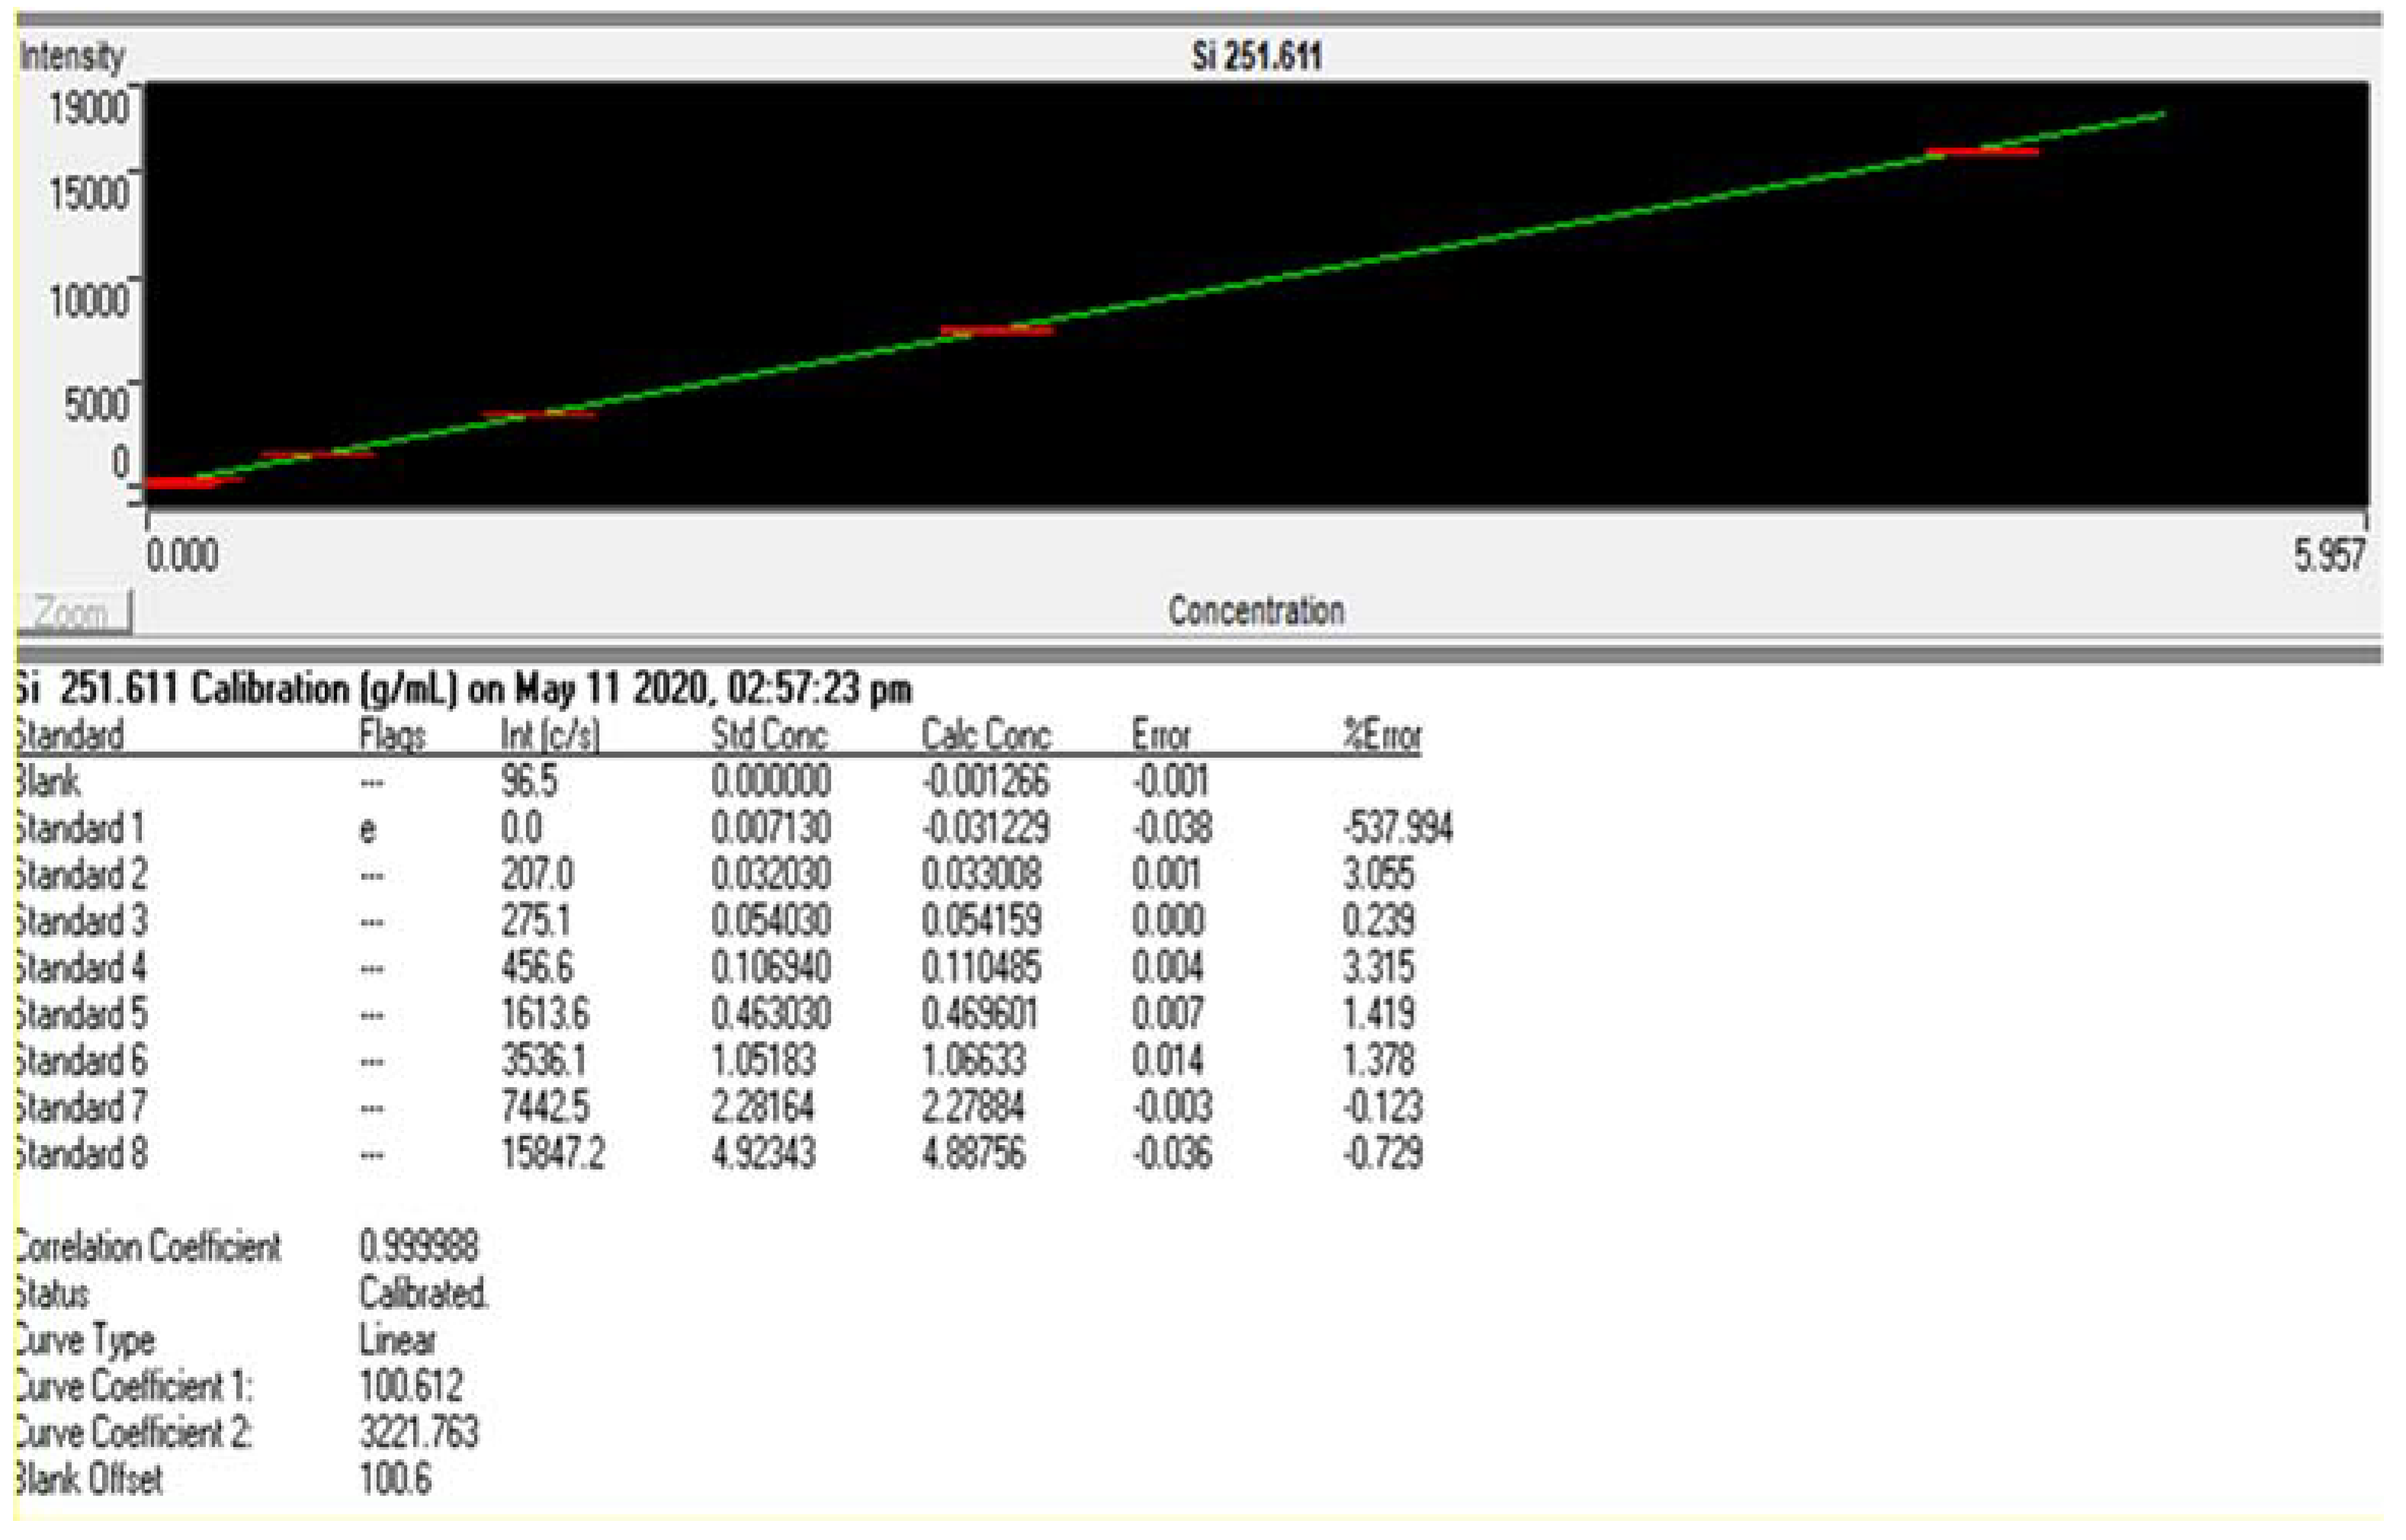
The limit of detection (LOD) is defined as the lowest concentration of analyte in a sample, which can be detected, though not necessarily quantified. Blank samples (in 15.2% HNO3 + 5.3% H2O2) were run at least six times. The LOD is calculated according to:
LOD = 3.3σ/S,
where σ is the standard deviation of the response and S is the slope of the calibration curve. The limit of quantification (LOQ) is defined as the lowest concentration of an analyte in a sample that can be determined with acceptable accuracy (±10%) under the stated operating conditions of the method. The LOQ is expressed as:
LOQ = 10σ/S.
The limits of detection (LOD) and quantification (LOQ) determined from blank measurements were 0.012 and 0.036 mg/L, respectively (Table 2).

3.1.2. Linearity

The validity of the linear calibration model was evaluated by generating seven points calibration acid concentration-matched curves using the standards of soluble silicon in the range of interest, 0.036–5 mg Si/L. A standard curve is shown above (Figure 2) and its parameters are shown in Table 3.

3.1.3. Limit of Quantification in Tissue

The biological material was chicken liver, mouse liver and mouse carcass. The background level from the mouse liver was undetectable, i.e., below the LOD, while the corresponding level from the chicken liver was low (around 0.05 mg/L as raw data of the ICP sample) and possible to quantify at the LOQ (Table 2; 0.036 mg/L). The lowest spike concentration, consisting of the background level and the added NP, tested and verified in the chicken liver (104.3 ± 7.5%) was 0.068 mg/mL (Table 4). Using the sample weight of 0.3 g, it corresponded to 1.5 mg Si/kg tissue. The level is similar to that established (2 mg Si/kg) by Hauptkorn, based on the LOQ [3]. Our biological Si backgrounds, from mouse and chicken liver, were significantly lower than those determined from the porcine and bovine liver (2–4 mg/kg) in the Hauptkorn study.

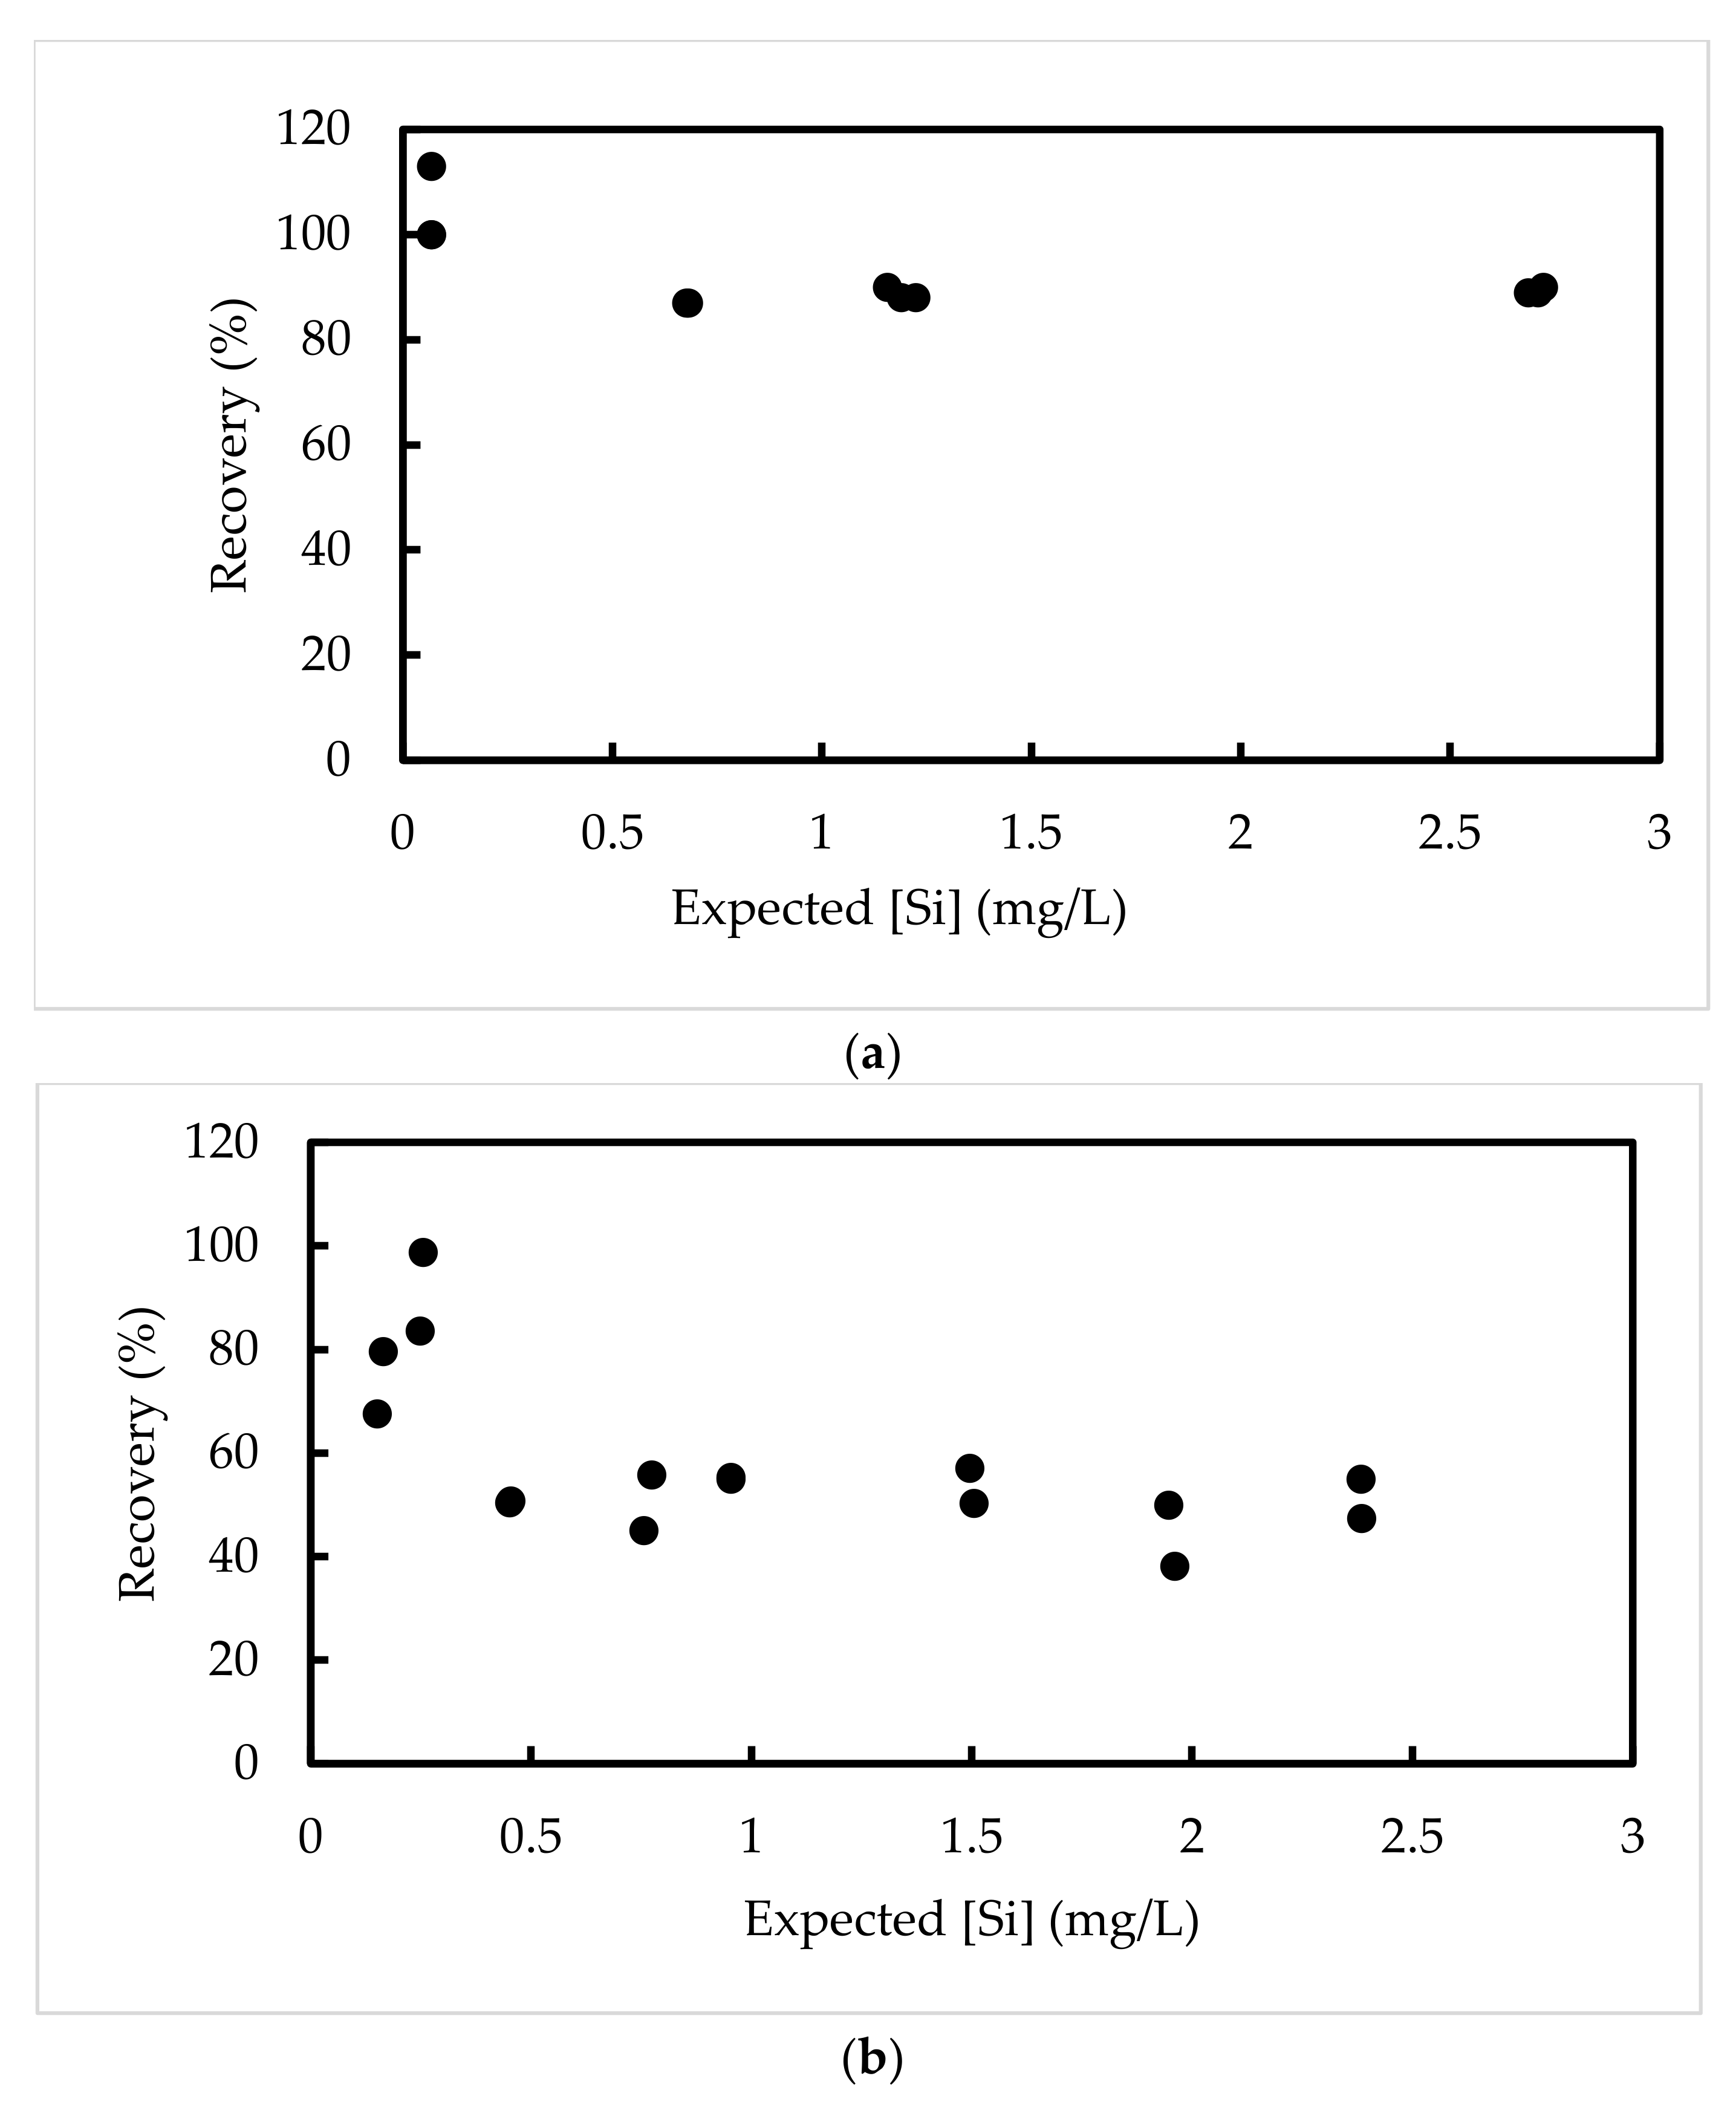
3.1.4. Recovery of Si in Spiked Tissue Using HNO3/H2O2

As shown in Table 4, Table 5, Table 6 and Table 7, and Figure 3a, the method presented here using HNO3/H2O2 for digestion gave a good recovery of Si. These results demonstrated that it was unnecessary to perform matrix-matching of the standards. Furthermore, the sufficient precision suggested that there is no need to include internal standards, which saved a lot of work.
Acceptance criteria according to the guideline on bioanalytical method validation (EMA European Medicines Agency) states that the mean concentration should be within 15% of the nominal values for the accuracy of samples, except for the LLOQ, which should be within 20% of the nominal value. As three concentrations, including the LLOQ, were tested and repeated three times, the recovery data shown in Table 4 and Figure 3a fulfills the accuracy criteria of EMA.
The carcass is a complex matrix, containing bone, skin, muscles, etc. The background of Si was high (1.6 mg/L) and the plasma of the ICP-OES was colored slightly orange, indicating the presence of Na and Ca; however, the recovery of Si was acceptable also in the carcass samples (Table 7 ≥ 90%). The Si emission wavelength of 251.611 nm is atomic, and not expected to be easily disturbed.

3.1.5. Attempted Digestion of Colloidal Silica (SiO2)

Ludox AM-30 is a colloidal suspension of silica in water and the average size of the particles is 17 nm. The material was subjected to the digestion protocol at two concentrations (0.85 and 1.25 mg/L) in triplicate. The recoveries were 62.0 ± 6.6 and 51.5 ± 1.5%, respectively. The overall high variability and lower recovery at the higher concentration are indicative of solubility problems in acidic conditions. Measuring Ludox in water gave close to 100% recovery (data not shown).

4. Discussion

An ICP-OES is a reasonably simple and less costly instrument than the ICP-MS. The current method presents a novel procedure for determining the Si present as polyorganophosphosilane and the metal ions in biological specimens. The sample preparation method is free from HF and has a high (>85%) and reproducible recovery in spiked tissue. It is not necessary to include internal standards or matrix-matching of the standards. The level of quantification (LOQ) of Si (0.036 mg/L in the ICP-OES) allows for the monitoring (and subtracting) of the biological Si background. The method is currently used to follow the biodistribution of Si and Lu in the preclinical studies of Tumorad®.
ICP-OES and ICP-MS are both high-throughput methods. ICP-MS offers the strongest power of detection. However, Si is challenging, as background polyatomic ions affect all three silicon isotopes, 28Si, 29Si, and 30Si, with the most intense interferences (14N14N+ and 12C16O+) occurring at the same m/z ratio as the major 28Si isotope. These difficulties have been overcome by extensions of the technique, such as the use of reaction cells [5] and high-resolution MS [2].
There are alternative instruments for detecting elemental Si. For example, the detection of Si(OH)4 using molybdate complexes and (UV-Vis) colorimetry is both sensitive and efficient [13]. However, the method is also sensitive to interferences from matrixes and Si requires prior conversion to the detectable species, Si(OH)4. Of note, neither electrothermal atomic absorption spectrometry (ETAAS), nor wavelength dispersive X-ray fluorescence spectrometry (WDXFR) have been developed into highly productive methods for tissue samples.
Alternative methods used to detect elemental Si have been taken into account when developing the current procedure. Furthermore, food-grade SiO2 particles have been suggested, via digestion in HNO3, H2O2, and HF, before the reaction-cell high-resolution ICP-MS [5]. Compared to the detection limit observed in the presented method, the detection limit was almost one order of magnitude lower. One advantage is the ability to detect Si at low concentrations, given the limited solubility of Si(OH)4 and its fluorosilicate derivatives. Another approach to detecting food-grade SiO2 particles employed HF-free base digestion (KOH) before acidification with H2SO4 [4]. The detection levels were similar to ours, although the tissue was not analyzed.
We have noted that the core of the NP, without its coating of polyethylene glycol-(PEG), is less soluble in acid. The presence of H2O2 most likely promotes oxidative cleavage of the carbon-silicon bond in the core and silicic acid is released as a final digestion product from the NP. Prior to digestion, the molecular mass is high (10 MDa). This process (oxidative cleavage) is likely driven to completion, as suggested, by comparing the recoveries obtained with and without H2O2 (Figure 3a,b).
For the purpose of detecting Si and metal ions in biological specimens, we do not exclude the possibility that other methods may work. For general elemental analyses with ICP-OES, the method published by Hauptkorn et al. is considered to be state-of-the-art [3]. However, with problematic metal ions present in the sample, conventional methods for preparing the samples for ICP-OES analysis will not suffice. It is also important to take into account the instrumental limitations. Quantification by ICP-OES requires digestion at elevated temperature in sealed vessels. Therefore, potentially explosive mixtures, such as NH3:H2O2, or corrosives, such as H2SO4:H2O2, are undesirable for use in the ICP-OES machine.
It is worth noting that this method exclusively covers the detection of Si present as organophosphosilanes. An attempt to extend the bioanalysis to pure silica particles (Ludox) did not succeed. Therefore, the current procedure is highly specific for samples containing organophosphosilanes. We hope the method can be useful to other investigators with similar analytical problems.

5. Conclusions

We present a novel, convenient, and efficient ICP-OES method for Si determination in biological specimens that may also contain metal ions. The method relies on digestion in a mixture of HNO3 and H2O2. In summary, we have developed an analytical ICP-OES method free from HF with a high (>85%) and reproducible recovery in spiked tissue.

Author Contributions

Conceptualization, N.Y., O.B. and O.A.; validation, N.Y.; formal analysis, N.Y.; investigation, N.Y.; writing—original draft preparation, O.B.; writing—review and editing, N.Y., O.B., I.Y.M. and O.A.; supervision, O.A.; project administration, O.A and I.Y.M. All authors have read and agreed to the published version of the manuscript.

Funding

This research received no external funding.

Institutional Review Board Statement

Not applicable.

Informed Consent Statement

Not applicable.

Data Availability Statement

Data is contained within the article.

Conflicts of Interest

All authors are employed by Spago Nanomedical AB, Lund Sweden.

References

  1. Eriksson, P.-O.; Aaltonen, E.; Petoral, R.; Lauritzson, P.; Miyazaki, H.; Pietras, K.; Månsson, S.; Hansson, L.; Leander, P.; Axelsson, O. Novel Nano-Sized MR Contrast Agent Mediates Strong Tumor Contrast Enhancement in an Oncogene-Driven Breast Cancer Model. PLoS ONE 2014, 9, e107762. [Google Scholar] [CrossRef] [PubMed] [Green Version]
  2. Yu, L.L.; Fassett, J.D.; Lindstrom, A.P. Determination of Si in Standard Reference Material SRM 295× Silica-on-Filter. J. Anal. At. Spectrom. 2003, 18, 738–741. [Google Scholar] [CrossRef]
  3. Hauptkorn, S.; Pavel, J.; Seltner, H. Determination of Silicon in Biological Samples by ICP-OES after Non-Oxidative Decomposition under Alkaline Conditions. Fresenius J. Anal. Chem. 2001, 370, 246–250. [Google Scholar] [CrossRef] [PubMed]
  4. Bossert, D.; Urban, D.A.; Maceroni, M.; Ackermann-Hirschi, L.; Haeni, L.; Yajan, P.; Spuch-Calvar, M.; Rothen-Rutishauser, B.; Rodriguez-Lorenzo, L.; Petri-Fink, A.; et al. A Hydrofluoric Acid-Free Method to Dissolve and Quantify Silica Nanoparticles in Aqueous and Solid Matrices. Sci. Rep. 2019, 9, 7938. [Google Scholar] [CrossRef] [PubMed] [Green Version]
  5. Aureli, F.; Ciprotti, M.; D’Amato, M.; do Nascimento da Silva, E.; Nisi, S.; Passeri, D.; Sorbo, A.; Raggi, A.; Rossi, M.; Cubadda, F. Determination of Total Silicon and SiO2 Particles Using an ICP-MS Based Analytical Platform for Toxicokinetic Studies of Synthetic Amorphous Silica. Nanomaterials 2020, 10, 888. [Google Scholar] [CrossRef] [PubMed]
  6. Peters, R.J.B.; Oomen, A.G.; van Bemmel, G.; van Vliet, L.; Undas, K.; Munniks, S. Silicon Dioxide and Titanium Dioxide Particles Found in Human Tissues. Nanotoxicology 2020, 14, 420–432. [Google Scholar] [CrossRef] [PubMed]
  7. Warren, C.J.; Xing, B.; Dudas, M.J. Simple Microwave Digestion Technique for Elemental Analysis of Mineral Soil Samples. Can. J. Soil Sci. 1990, 70, 617–620. [Google Scholar] [CrossRef]
  8. Taber, H.G.; Shogren, D.; Lu, G. Extraction of Silicon from Plant Tissue with Dilute HCl and HF and Measurement by Modified Inductive Coupled Argon Plasma Procedures. Commun. Soil Sci. Plant Anal. 2002, 33, 1661–1670. [Google Scholar] [CrossRef]
  9. Traoré, S.; Traoré, D.L.; Magassouba, S. Preparation of Silicon from Rice Husk as Renewable Energy Resource by the Use of Microwave Ashing and Acid Digestion. Int. J. Energy Eng. 2018, 8, 25–29. [Google Scholar] [CrossRef]
  10. Danadurai, K.S.K.; Chellam, S.; Lee, C.-T.; Fraser, M.P. Trace Elemental Analysis of Airborne Particulate Matter Using Dynamic Reaction Cell Inductively Coupled Plasma—Mass Spectrometry: Application to Monitoring Episodic Industrial Emission Events. Anal. Chim. Acta 2011, 686, 40–49. [Google Scholar] [CrossRef] [PubMed]
  11. Lo, J.M.; Sakamoto, H. Comparison of the Acid Combinations in Microwave-Assisted Digestion of Marine Sediments for Heavy Metal Analyses. Anal. Sci. 2005, 21, 1181–1184. [Google Scholar] [CrossRef] [PubMed] [Green Version]
  12. Viveros, R.D.; Liberman, A.; Trogler, W.C.; Kummel, A.C. Alkaline and Ultrasonic Dissolution of Biological Materials for Trace Silicon Determination. J. Vac. Sci. Technol. B Nanotechnol. Microelectron. Mater. Process. Meas. Phenom. 2015, 33, 031803. [Google Scholar] [CrossRef] [Green Version]
  13. Coradin, T.; Eglin, D.; Livage, J. The Silicomolybdic Acid Spectrophotometric Method and Its Application to Silicate/Biopolymer Interaction Studies. Spectroscopy 2004, 18, 567–576. [Google Scholar] [CrossRef]
Figure 1. (a) A PTFE-vial used for digestion. (b) PTFE vials in the incubator. The picture shows the setup with 12 PTFE vials in the Heater/shaker: IKA® KS 130 Basic, Buch & Holm.
Micro 03 00019 g001
Figure 2. A representative Si-standard curve. Screenshot from the ICP Expert program (Agilent) showing the Si-standard curve with its calculated parameters.
Micro 03 00019 g002
Figure 3. Recovery of Si from spiked and digested samples using either HNO3/H2O2 or HNO3 without H2O2. (a). Recovery (%) of Si with the method presented here using HNO3/H2O2. NPs were added to the chicken liver and digested in HNO3/H2O2 (n = 9). The percentage recovery in the sample was plotted against the expected raw data (Si mg/L). The results are also presented in Table 4. (b). Recovery of Si in the absence of H2O2. NPs were added to Wistar rat kidney and digested in 50% HNO3 (n = 16). The data are presented as in a. In both (a,b), NPs were added to attain close to 2.5 mg/L of Si as the highest concentration in the ICP sample.
Micro 03 00019 g003
Table 1. Optimized instrument parameter.
Instrument ParameterValue
RF power1.3 kW
Plasma gas flow15 L min−1
Auxiliary gas flow1.5 L min−1
Replicate read time5 s
Sample uptake delay time35 s
Instr. stabilization delay20 s
No. of replicates3
Nebulizer flow0.75 L min−1
Peristaltic pump flow rate15 rpm
Blank samples between samples1% HNO3 + 5% HCl with detergent was included between samples.
Wash between samplesRinse for 20 s with 1% HNO3.
Calibration curveWeighted linear and maximal 5% error allowed.
Recalibration was made every 30 samples.
Table 2. Si determination by ICP-OES: limits of detection (LOD) and limits of quantification (LOQ).
AVR Intensity of Blank (int)STD Deviation
(int)
Slope
(int/ppm)
LOD
(mg/L)
LOQ
(mg/L)
106.510.82977.660.0120.036
Table 3. Linearity of Si (λ = 251.611).
Statistical AnalysisObservation
Slope3221.76
Y-Intercept100.6
Correlation Coefficient0.9999
Table 4. Accuracy for chicken liver after digestion in HNO3/H2O2.
SamplesExpected ppmRaw Data ppm Ratio
LLOQ Si0.06840.06891.00
LLOQ Si0.06820.06851.00
LLOQ Si0.06840.07751.13
Low-level Si0.67820.58800.87
Low-level Si0.68200.58820.87
Medium level Si1.22541.0800.88
Medium level Si1.19041.05210.88
Medium level Si1.15661.04110.90
High level Si2.70972.41160.89
High level Si2.68672.39790.89
High level Si2.72362.44250.90
Table 5. Recovery ratios for chicken liver after digestion in HNO3/H2O2.
SamplesExpected
Si mg/L
Raw Data ICP
Si mg/L
Ratio
Ctrl-chicken liver 0.052 ± 0.01
Spike chicken liver #10.180.170.98
Spike chicken liver #20.200.190.94
Spike chicken liver #30.400.400.99
Spike chicken liver #40.410.411.01
Spike chicken liver #50.800.700.87
Spike chicken liver #60.870.750.86
Spike chicken liver #71.491.400.94
Spike chicken liver #81.521.350.89
Spike chicken liver #92.692.570.96
Table 6. Recovery ratios for mouse liver after digestion in HNO3/H2O2.
Study #, Sample IDExpected
Si mg/L
Raw Data ICP
Si mg/L
Ratio
Ctrl-mouse liver <LOD
Low spike mouse liver #10.450.420.92
Medium spike mouse liver #20.690.640.92
High spike mouse liver #31.010.930.92
High spike mouse liver #42.242.070.92
Table 7. Recovery ratios for mouse carcass after digestion in HNO3/H2O2.
SamplesExpected ppmRaw Data ppmRatio
Ctrl- mouse carcass 1.64 ± 0.14
Spike mouse carcass #12.662.600.98
Spike mouse carcass #22.572.280.89
Spike mouse carcass #32.612.400.92
Disclaimer/Publisher’s Note: The statements, opinions and data contained in all publications are solely those of the individual author(s) and contributor(s) and not of MDPI and/or the editor(s). MDPI and/or the editor(s) disclaim responsibility for any injury to people or property resulting from any ideas, methods, instructions or products referred to in the content.

