Article

The New Italian Standard on the Life Assessment of Martensitic Steels—First Results of the Experimental Validation Activity of XRD by Testing P91 and P92 Samples from Interrupted Uniaxial Creep Tests

1
Department of Technological Innovations and Safety of Plants, Products and Anthropic Settlements, Italian Working Compensation Authority, 00143 Roma, Italy
2
Advisory Department for Health and Safety, Italian Working Compensation Authority, 00143 Roma, Italy
*
Author to whom correspondence should be addressed.
Micro 2023, 3(1), 274-307; https://doi.org/10.3390/micro3010020
Submission received: 5 January 2023 / Revised: 3 February 2023 / Accepted: 7 February 2023 / Published: 2 March 2023
(This article belongs to the Special Issue State-of-the-Art Microscale and Nanoscale Researches in Italy)

Abstract

:
The Italian Thermotechnical Committee is drafting a new standard for the life assessment of creep-operated pressure equipment, including modern steam boilers. For the evaluation of the spent life ratio several methods are available, even if each of them is not exhaustive. It should be noted that the methods described must be considered in combination with NDTs and other kinds of tests, e.g., hardness tests. X-ray diffraction (XRD) is one of the methods that could be used to assess material evolution under creep conditions. The method allows for the study of phase transitions involving structural variations. It is possible to operate on both massive samples and powders. In this paper, work done with XRD, in the frame of a wider project regarding the study of the high-temperature behavior of welded martensitic steels, is presented. The results of the XRD analysis were compared with the results of the extraction replicas. This work concerns the controls of eight failed crept specimens submitted to XRD examinations. Eight XRD diagrams were produced and subsequently compared with 12 replicas for each specimen; that is, 96 extraction replicas were produced for this work. Then, around 5000 precipitates were analyzed for each specimen; therefore, for this work, around 40,000 precipitates were characterized with their chemical compositions. The average size of the precipitates was around 97 nm.

1. Introduction

INAIL is responsible in Italy for the authorization of the life extension of pressure plants (first according to a provisional Italian order and currently in force via an Italian ministerial decree on 11 April 2011). This activity started in 1993, and has provided excellent results in the last three decades in terms of plant safety. INAIL often refers to the European Collaborative Creep Committee (ECCC) recommendations for life extension safety procedures to apply in Italian plants, as the ECCC is recognized worldwide as the reference institution for creep research in addition to INAIL being a member of the ECCC.
In Italy, the use of martensitic steels in power plants, namely Grade 91 and Grade 92 (according to the ASME code), started only a few years ago. Currently, the Italian Thermotechnical Committee is drafting a new standard for the life assessment of creep-operated pressure equipment, including modern steam boilers.
In former times, the pressurized components of steam boilers were manufactured by using alloyed steels with different high-temperature behaviors. The main difference is the cavitation: alloyed steels for high-temperature pressurized components of steam boilers show regular cavitation from the secondary creep stage. This behavior is very effective for the assessment of high-temperature components and for life extension [1,2]. In the diagram of Figure 1 we can see that these steels show aligned cavitation at the beginning of the secondary creep stage, while they show microcracks at the end of this stage; that is, the final warning before failure. The main problem with these kinds of steels is that their maximum working temperature is limited to 550 °C, which does not fit with modern power plants, which require higher temperatures to increase their efficiency and reduce fuel expenses [3]. The welded joints in the components also have lower performance in terms of creep rupture strength.
Martensitic steels allow for higher service temperatures than alloyed steels; subsequently, their use in power generation has increased very much during recent decades [4]. They are widely used for the manufacturing of steam boilers. They are also characterized by little cavitation, starting during the tertiary creep stage, while approaching their end of life. Therefore, the use of cavitation for life assessment is not recommended for these steels. Another problem is that martensitic steels are more sensitive to any kind of industrial process. Of course, one of these processes is welding: any little change in welding parameters and/or the chemical composition of the welding material, the temperature, and so on can affect the creep resistance of the weld joint. The weld creep strength reduction factor for martensitic steels can be lower than 0.5 [5,6]. These materials are also very sensitive to heat treatments, as the creep resistance of the components is strongly dependent on the accuracy of these treatments [7,8].
Searching the evidence of creep degradation for martensitic steels, since cavitation cannot be used, it is necessary to follow the microstructure transformation during the life of a material. The aim is to identify the various creep stages, referred to as the creep–strain curve. Then, some other issues can arise. The main problem is to find an investigation tool with reliable performance and reasonable costs.
Several authors are concentrating their efforts on the second phase transformations [9,10,11,12], as during the service life at a high temperature it is possible to identify the following:
  • Fine-grain MX particles together with M23C6 in the first period;
  • A change in the number and size of these particles, together with the formation of different phases, such as the Laves phase and Z phase, in a subsequent period [10].
These particles cannot be found by an optical microscope (OM), requiring higher magnification. Normally they can be found and measured via extraction replicas and subsequent analyses via a transmission electron microscope (TEM). As this kind of microscopy is very expensive, if compared with OMs, plant owners do not like it and they try to reduce the points under inspection during the life assessment of the on-site activity of their plants. Another issue arising from the use of TEM-EDS (energy-dispersive X-ray spectroscopy) is that it requires the analysis of a single element and consequently long times to investigate an appropriate number of precipitates. Therefore, researchers are experimenting with other means of investigation. One of the most promising methods is X-ray diffraction (XRD) [11]. This method allows for a theoretical analysis of all precipitates in a given volume [12].
An 8-year research program on martensitic steels started in 2019 in order to develop a detailed microstructure atlas of P91 and P92, describing systematically the microstructure evolution under high-temperature conditions and long-term creep tests. Until now, no one has produced an atlas like this, and we think that it can provide essential data that are useful for the life assessment of pressurized components in P91 and P92. The activity is split into seven projects, including thermal ageing and creep tests with steel grades P91 and P92. The thermal ageing and the creep tests are regularly interrupted in order to perform X-ray diffraction of the crystal lattice. Some of the main results obtained by XRD, in comparison with TEM analyses, are reported in this paper.
The NDE methods currently tested by researchers worldwide are also described in this paper. The authors are instead investigating the possible use of XRD as well as a scanning force microscope as an alternative to the extraction replica method. The authors are currently involved in wide-ranging research activity in the field of the life assessment of martensitics. The main project is a “Martensitic steels microstructure atlas”.
The atlas project is split up in seven subprojects:
  • A study on the evolution of the microstructure and analyses of the precipitates of Grade 91 steel, artificially aged in a furnace, from 40,000 to 65,000 h at 550 °C and from 50,000 to 75,000 at 600 and 650 °C;
  • A study on the effect of mechanical stress on the evolution of the microstructure and of the state of Grade 91 steel precipitation at 550 °C, 600 °C, and 650 °C, with a creep test for each temperature and value of the load corresponding to the failure for creep at 50,000 h (according to ECCC datasheets) [13];
  • A study on the microstructural evolution of Grade 91 in the thermally altered zone (HAZ) of welded joints subjected to creep failure tests at temperatures of 550 °C, 600 °C, and 650 °C (with failure times of the order of 10,000, 20,000 and 50,000 h);
  • Setting up an isotherm for Grade 92 steel at a temperature between 600 and 650 °C, with five load conditions corresponding to creep failure at 20,000, 40,000, 60,000, 80,000, and 100,000 h (according to an ECCC datasheet);
  • A study on the evolution of the microstructure and of the precipitation state of Grade 92 steel at temperatures of 600 and 650 °C with load and in the absence of load, for times of 5000, 10,000, and 20,000 h; in regard to the tests with load, interrupted creep tests at 5000, 10,000 and 20,000 h, with load corresponding to creep failure at 50,000 h (according to an ECCC datasheet);
  • A study on the microstructural evolution in the HAZ of Grade 92 steel artificially aged in a furnace at 600 and 650 °C for 5000, 10,000, and 20,000 h;
  • A comparison of the microstructural evolution of the two Grade 91 and 92 steels for aging times from 3000 to 75,000 h.

2. Materials and Methods

As mentioned before, for life assessment several methods are available, even if each of them is not exhaustive. This is an extended version of the RBI approach [14]. For martensitic steels, even more than for other kind of steels, a correct assessment can be achieved only after the collection of all of the data about the manufacturing and use of a component:
  • Chemical composition of the steel;
  • Technological process of manufacturing;
  • Heat treatments;
  • Any welding qualifications;
  • Anything else useful for defining the initial delivering conditions before it begins its operational life;
  • A detailed description of the operating conditions and all kinds of event, with a particular attention to the data related to incidents and accidents.
It should be noted that the methods described must be considered in combination with the NDTs and other kinds of test, such as the hardness tests. Furthermore, it is recommended to combine the methods.
The main methods for component analyses include the following [15,16,17,18,19,20]:
  • Extraction replicas (Figure 1a,b);
  • Small-scale mechanical test (Figure 1c);
  • Neutron diffraction;
  • Thin foils;
  • Scanning force microscope;
  • Electromagnetic methods;
  • Metal replica;
  • X-ray diffraction;
  • Hardness tests.
An extraction replica is a metallographic replica aimed at the mechanical extraction of particles and carbides. The replicas are examined by a TEM.
The material microstructure evolution can be monitored in terms of size, morphology, and the chemical compositions of precipitates as well as phases (vanadium and niobium carbonitrides (MX), metal carbides of iron, chromium, and molybdenum (M23C6), the modified Z phase, and Laves phases).
The main advantages of an extraction replica are as follows:
  • No material removal, as the precipitates are extracted by stripping to an amorphous film; it is not necessary to cut a component sample;
  • The higher resolution of a TEM compared to an SEM;
  • It provides, for each category of precipitates, the chemical composition and size.
  • The main disadvantages are as follows:
  • Typical problems related to the development of the extraction replica process and the potential risk of pollution during sampling;
  • Further processes on replicas for TEM management (from acetate support to support for TEM use);
  • Very localized TEM survey area;
  • The analysis is usually performed on a few particles (<200);
  • A slow and expensive analysis is required for each position;
  • Limited availability of TEM equipment.
In regard to X-ray diffraction, this method allows for the study of phase transitions involving structural variations. It is possible to operate on both massive samples and powders. The instrument is the diffractometer.
Through XRD it is possible to check the presence and quantity of nonmetallic phases in addition to the measurement of deformation in fractions of nanometers.
The main advantages are as follows:
  • The applicability in situ (applies only to the portable instrument);
  • The technique allows for the recognition and quantitative study of sample phases;
  • It detects local plastic deformation and texture.
  • The main disadvantages are as follows:
  • Safety settings required for ionizing radiation (X-rays);
  • The measurement takes from a few to a few tens of minutes per point, during which neither the component nor the equipment must move or vibrate;
  • The preparation for the measurement depends on the accuracy required;
  • Very complex analysis of diffraction profiles (patterns), which requires highly specific training;
  • In cases of massive samples, routine software reveals 5–10% of the concentration of phases only for a few seconds; for higher sensitivities, more time and specific applications are required;
  • The measuring point has a variable extension;
  • It is necessary to operate in several steps if you want to study the second phases.
We have introduced the project “Martensitic steels microstructure atlas”, which is the main project where the study of the application of XRD is included.
The following activities are in progress:
  • Laboratory testing (thermal ageing in furnaces, creep tests);
  • Metallographic characterization;
  • OM, SEM, and TEM analyses;
  • XRD analysis;
  • Sample preparation for the small punch test (SPT);
  • Design of the final output.

2.1. Thermal Ageing, Creep Testing, OM, SEM, TEM, and XRD Analyses for the Atlas Project

In the frame of the main project (a P91 and P92 microstructure atlas), several kinds of tests are performed: thermal ageing, mechanical tests, and NDEs. Subprojects 1 to 6 are characterized by a specific set, specifically designed.
In regard to subproject N°1: GR 91 BM ageing, as mentioned before, is based only on the thermal ageing of grade P91, performed in an oven at 550, 600, and 650 °C. The samples were cut from the same tube (an outer diameter of 38.1 mm and a thickness of 4.6 mm), three circular sections that were 125 mm long. The test is regularly interrupted in order to monitor the material microstructure evolution.
The grade P91 test, interrupted after 4000 h, has been assessed for microstructure and precipitate status by an OM and SEM-EDS on bulk samples. The microstructural features revealed by an OM and SEM-EDS on aged samples, after the total annealing duration of about 50,000 h, are tempered martensite laths within original prior austenitic grains and polygonal ferritic subgrains on martensite lath boundaries and within recovered martensite laths.
Microstructural and precipitate analyses by SEM-EDS of GR 91 interrupted after 4000 h aged samples (Figure 2) are as follows:
  • Grain and subgrain (polygonal ferrite) coarse M23C6 (Cr-, Fe-, and Mo-rich carbides) and Laves-phase Fe- as well as Mo-rich particles with sizes in the range of 0.5 to 1.0 μm;
  • M23C6 carbides and Laves-phase particles with sizes in the range of 0.5 to 1.0 μm positioned on prior austenite grain boundaries, polygonal subgrain boundaries, martensite lath boundaries, and within recovered martensite laths.
In regard to subproject N°2 and subproject N°5: These are twin projects for the GR 91 and GR 92 base materials (BM creep test according to ISO 204:2009), interrupted after 4000 h, a crept specimen assessment of microstructure and precipitate status by an OM and SEM-EDS on a replica. The microstructural analyses have been performed on a replica, taken on the clamping heads and gauge lengths of three crept specimens selected from those obtained by tests interrupted after 4000 h. The analysis includes a microstructural investigation by SEM SE on a morphological replica and a precipitation status analysis by SEM-EDS on an extractive replica.
In regard to subproject N°3 and subproject N°6: These are twin projects for the GR 91 and GR 92 heat-altered zone (HAZ creep test according to ISO 204:2009), in-depth microstructural analyses on failed crept cross-weld specimens. In-depth microstructural analyses have been performed on 4 failed crept cross-weld specimens in steel Grade P91; on 1 ex-service specimen and 3 failed crept cross-weld specimens in steel Grade P92.
In regard to subproject N°4 (GR 92 BM isothermal creep test according to ISO 204:2009), the overall isothermal creep tests (5 creep tests) on the P92 base material at 620 °C are ongoing in agreement with the scheduled execution time for testing plans.
According to the outcomes of the creep tests, and considering the total duration time, the first creep test rupture occurred in November 2021.
Interrupted after 4000 h, the assessment of the microstructure and precipitate status of crept specimens was performed by an OM and SEM-EDS on a replica. Microstructural analyses have been performed on a replica, taken on the clamping heads and gauge lengths of two crept specimens selected from those obtained by these interrupted tests.
The outcome includes a microstructural analysis by an OM and SEM SE on a morphological replica in addition to a precipitation status analysis by SEM-EDS on an extractive replica.
The tests planned for each subproject were as follows:
  • An analysis of the microstructure with an optical microscope and image acquisition of micrographs at X100, X200, X500, and X1000 to integrate the atlas of the P91 and P92 microstructures;
  • Hardness take-over (HV10);
  • SEM and FEG-SEM microstructure analyses and digital image acquisition at X1000, X3000, X5000, and X10,000 zooms to integrate the atlas of the P91 and P92 microstructures;
  • A qualitative analysis of the precipitation state through an SEM and FEG-SEM, size, and position, and of the chemical composition of the precipitates through an EDS analysis;
  • An evaluation of the morphology and chemical composition of submicrometric precipitates by a TEM on an extraction replica (RE), the identification of precipitates by a chemical analysis (EDS), and X-ray diffraction of the crystal lattice (e.g., MX, M2X, M23C6, ...); image acquisition for P91 and P92 atlas integration;
  • Precipitate extraction from the massive sample by the electrolytic dissolution and collection of the extracted powders, analyses of the powders, and the realization of the diffraction spectrum; the interpretation of the diffraction spectra is also on the basis of the investigation results described above;
  • The preparation after the test, for each sample, of two discs, with a 8 mm diameter and a 0.5 mm thickness, to perform small punch tests according to CEN EN10371:2021.

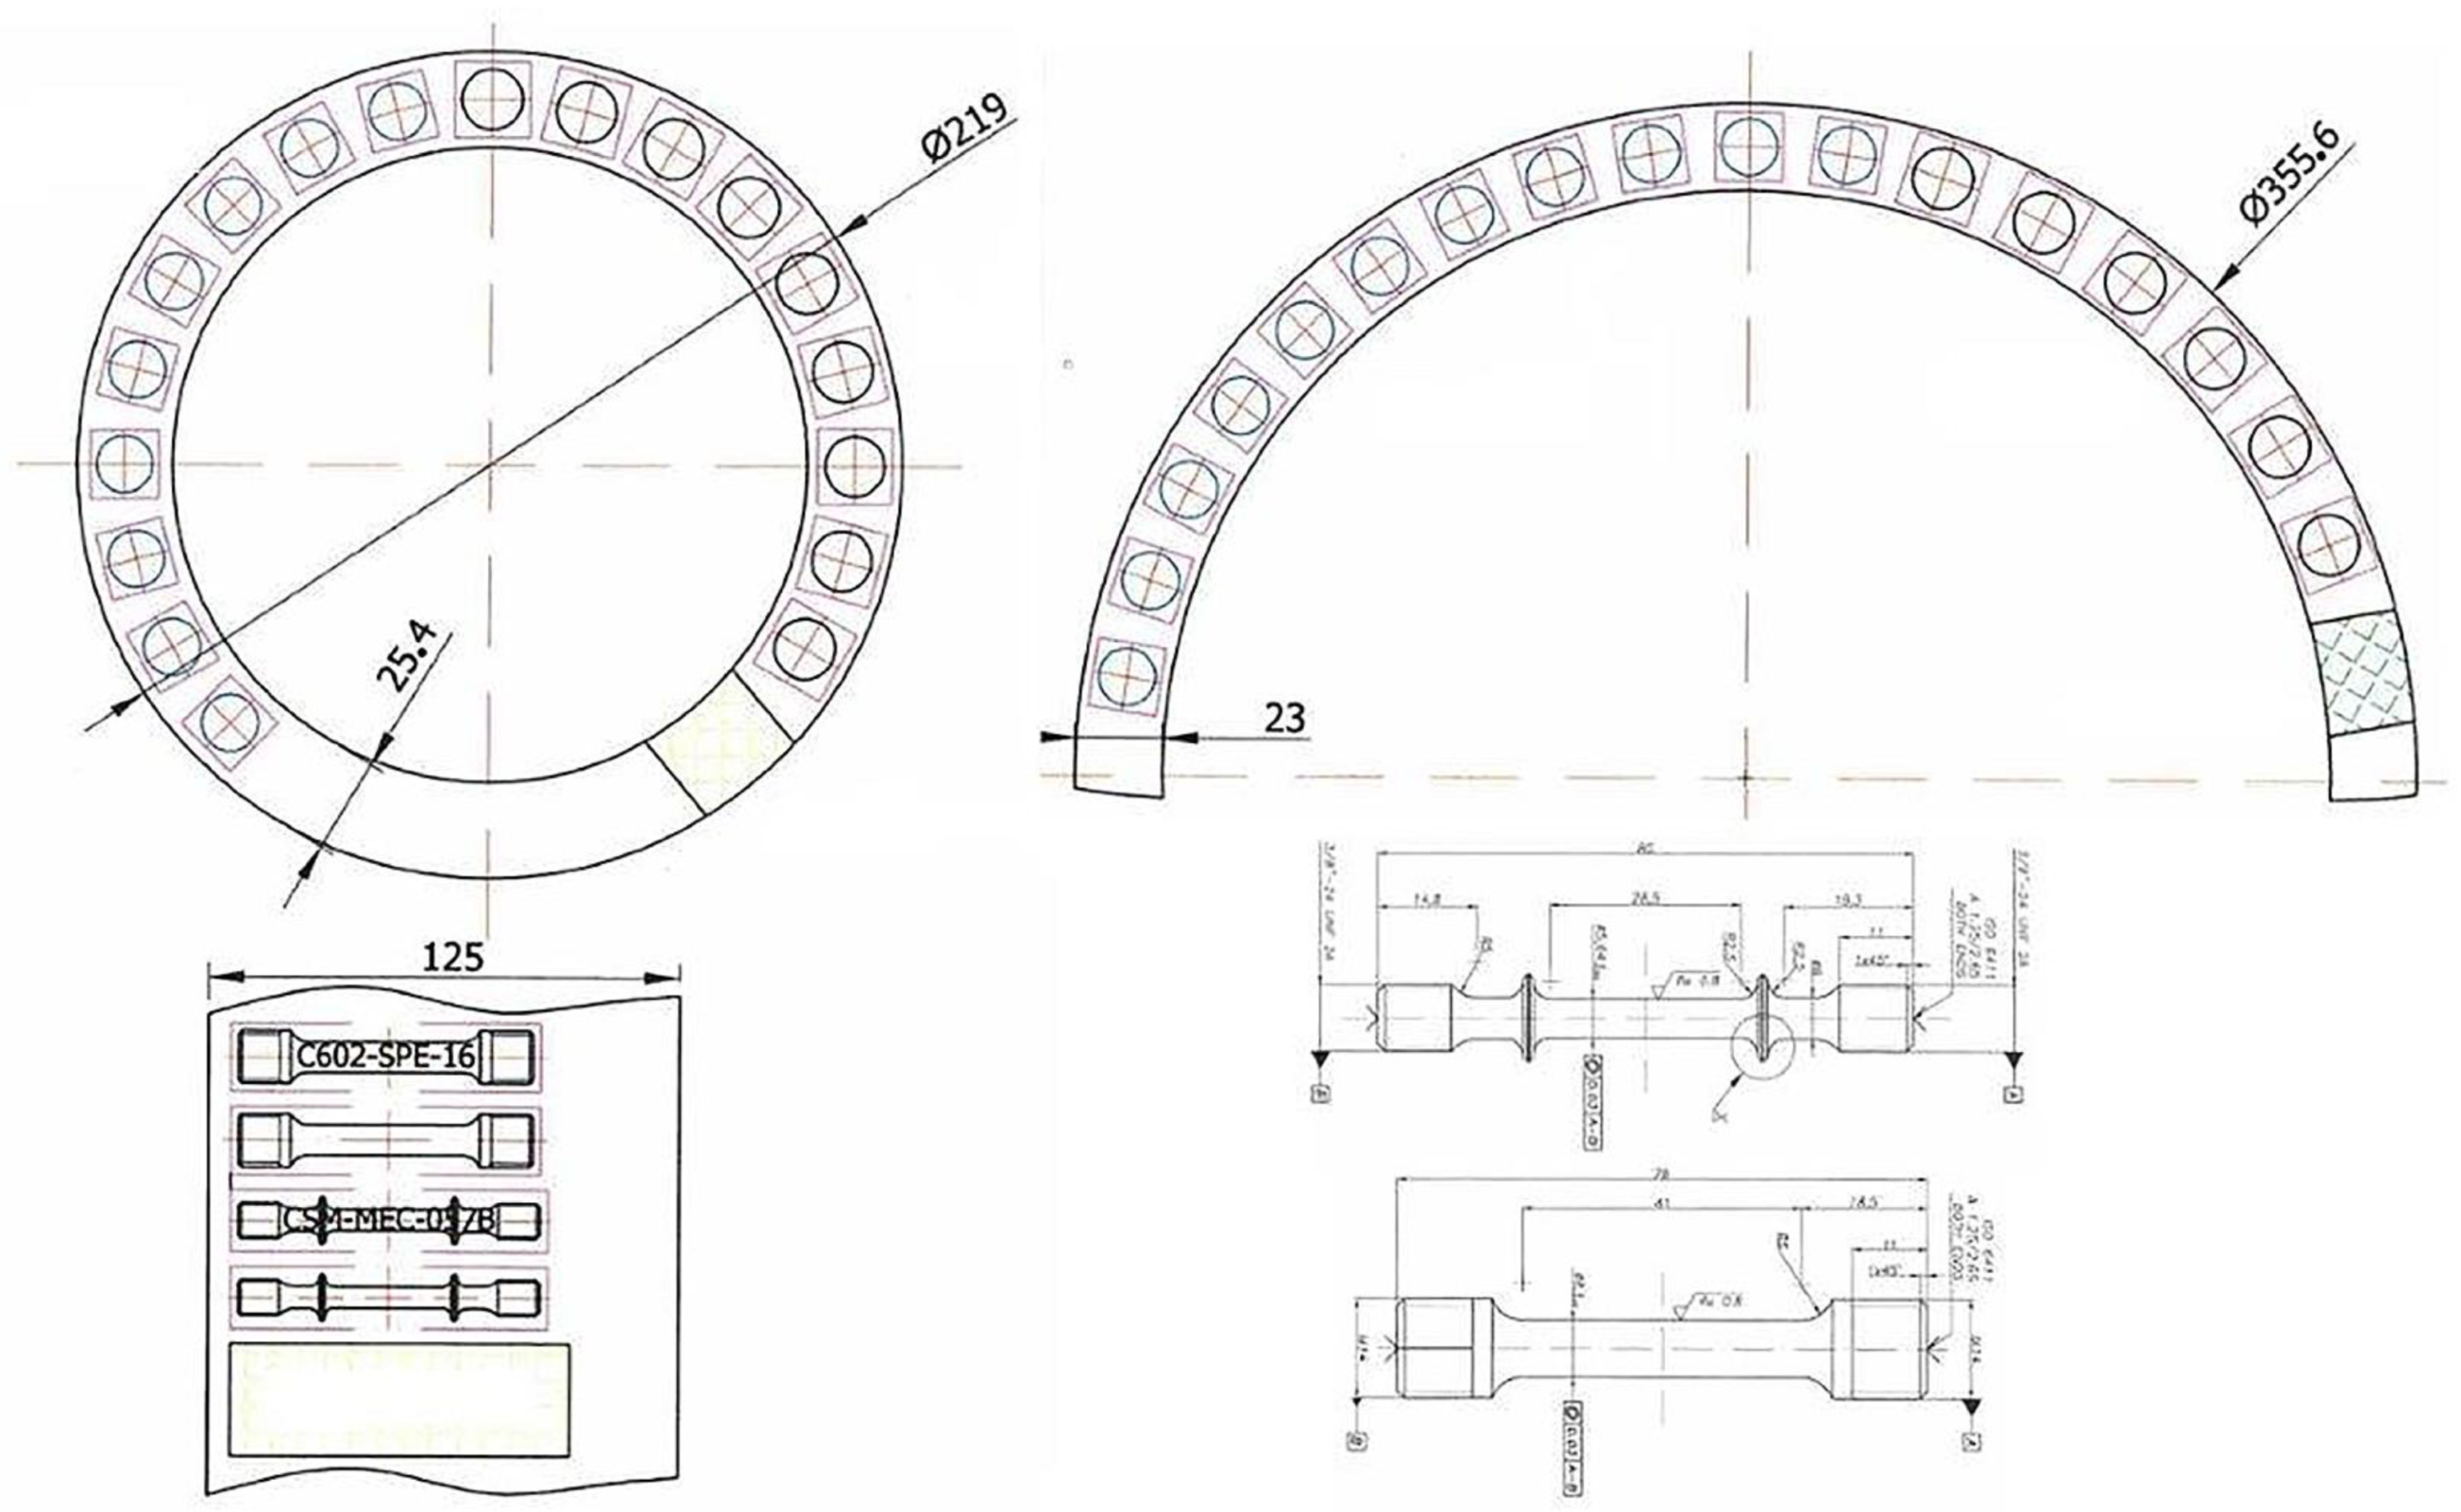
2.2. Original Material for Subprojects N. 3 and N. 6: Specimen Geometries, Compositions, Mechanical Properties, Welding Specifications, and Grain Sizes

In Figure 3 the specimen geometries are reported.
In Table 1 and Table 2 chemical analyses of the original P91 and P92 tubes are reported. The effect of the chemical composition can be relevant for the creep behavior of the steel [21].
In Table 3 and Table 4 the mechanical properties of the original P91 and P92 tubes are reported.
The grain sizes were 20.7 μm for P91 and 28.4 μm for P92.
The tubes were welded by a manual TIG + SMAW welding procedure specification, according to EN 15609-1 (Specification and qualification of welding procedures for metallic materials—Welding procedure specification—Part 1: Arc welding).
The TIG layers for the weld of the P91 tube were welded by EN ISO 21952-A-W CrMo9 1, while the SMAW layers were welded by ISO 3580-A-E CrMo91 B 42 H5. The pre-heating was 220 °C, while the interpass temperature was less than 300 °C; the post-heating was 350 °C for 1 h under insulation. The post-weld heat treatment was 750 °C for 2 h. The heat rate was less than 80 °C/h.
For the weld of the P92 tube, TIG layers were prepared by EN ISO 21952-A W ZCrMoWVNb9 0.5 1.5, while the SMAW layers were welded by EN ISO 3580-A: E ZCRMOWVNB 9 0.5 2 B42 H5. The pre-heating was 220 °C, while the interpass temperature was less than 300 °C; the post-heating was 350 °C for 1 h under insulation. The post-weld heat treatment was 760 °C for 4 h. The heat rate was less than 80 °C/h.

2.3. Creep Testing in Subprojects N. 3 and N. 6

The P91 welded specimen described in Section 2.2 was subjected to creep failure tests at temperatures of 550 °C, 600 °C, and 650 °C (with failure times of the order of 10,000, 20,000, and 50,000 h). The P92 welded specimen described in Section 2.3 was subjected to creep failure tests at temperatures of 600 °C and 650 °C (with failure times of the order of 10,000, 20,000, and 50,000 h).
Creep rupture tests are performed with the application of constant applied load according to UNI EN ISO 204:2009, adopting the testing practice specified by ECCC guidelines. Constant load creep machines are used. They are equipped with a standard creep furnace with three zone heating controls. An independent set of thermocouples are attached directly to the specimen to ensure a uniform temperature throughout the specimen at the required value. These thermocouple measurements are continuously logged and monitored. In the following tables (Table 5 and Table 6) the testing conditions and the time schedule for performing the other tests (XRD, SEM, TEM, OM, etc.) are detailed.

2.4. OM and SEM Analyses for Subprojects N. 3 and N. 6

Metallographic analyses by an optical microscope (OM) have been carried out on failed crept cross-weld specimens to determine the exact position of the failure in terms of the base material, fused zone, or subzone areas of heat-affected zones. Furthermore, the degree of softening of martensite has been determined quantitatively through hardness measurements. SEM-EDS microstructure characterization of the main HAZ subzones has been performed to assess tempered martensite evolution and modification in addition to precipitate status evolution.
Scanning electron microscope (SEM) instruments, operating with a LaB6 electron gun, are used for the analysis of microstructure and precipitate state.
Concerning the methodology used for microstructure characterization, digital SEM images in secondary electron (SE) mode are acquired at different magnifications (1000X, 3000X, 5000X, and 10,000X). The distinct types of microstructural constituents at the submicron scale, such as recovered martensite laths, prior austenitic grain boundary precipitates, and precipitates within martensitic laths, are examined using an SEM in secondary electron (SE) mode on both etched metallographic specimens and morphological replicas.
The analysis of precipitates is performed by using an SEM in secondary electron (SE) mode as well as backscattered electron (BSE) mode on both etched metallographic samples or extraction replicas.
Morphological analyses of precipitates include position on the microstructural features, particle shape, and size. The identification of different types of precipitates is based on compared analyses of combined information on size, morphology, and chemical composition. The chemical composition of precipitates on prior austenitic grain boundaries, recovered martensite lath boundaries, and within recovered martensite laths is assessed by using quantitative EDS microanalyses. On the basis of element repartition, Cr, Fe, Mo, W, M23C6, and Laves are distinguished. The above being the case, the main issue is MX identification, which is relevant for the assessment of the weld, as we can see with the TEM analysis.

2.5. The XRD Analysis for Subprojects N. 3 and N. 6

In the framework of the steel Grades 91 and 92 microstructure and precipitate evolution atlas project, analyses of the precipitated phases present in steel Grades 91 and 92 samples have been performed by using the electrolytic extraction of precipitates from the metallic matrix and X-ray diffraction (XRD) analyses on residual powders. The procedure foresees the precipitates’ extraction from the massive sample by electrolytic dissolution and the collection of the extracted powders, analyses of the powders and realization of the diffraction spectrum, and the interpretation of the diffraction spectra on the basis of the investigation results described above.
The electrolytic dissolution of bulk samples and the filtering of precipitates was achieved. The analysis of the precipitated phases present in steel Grade 91 and 92 samples has been performed by using electrochemical procedures, selectively dissolving the steel matrix, and separating the undissolved particles from the matrix by filtration. This procedure involves the anodic dissolution of the steel matrix in an alcohol electrolyte, followed by the collection of undissolved particles in special filters. The fine-tuned procedure for steel Grades 91 and 92 consists of two main phases:
  • Dissolution of the steel matrix—the anodic dissolution of the steel matrix is carried out in an acidic solution of 5% HCl in 95% ethanol through an electrolytic cell equipped with a dc power supply unit (HP 6261B) at room temperature at a potential of 15 V. For each sample, 10 g of steel is dissolved in 0.5 l of electrolytic solution;
  • Filtering of second phases—second-phase particles are extracted from the solution by filtering through a Millipore Isopore VMTP (0.05 µm mesh size) polycarbonate filter. Thereafter, the precipitates are carefully washed with ethanol to clear from possible contaminations due to the original solution containing iron and chlorides. Finally, the filter is dried and the powder is collected.
In greater detail: After the dissolution, the powders were prepared; the steel Grades 91 and 92 failed crept cross-weld specimens and the steel Grade 92 ex-service exposed material underwent electrolytic anodic dissolution of the steel matrix. Then, second-phase particles have been extracted from the solution by filtering through a Millipore Isopore VMTP (0.05 µm mesh size) polycarbonate filter. Finally, after drying, the filters containing the collected powders together with a virgin filter were prepared.
The following is the description of the methodology used for XRD analyses on powders containing extracted precipitates: XRD analyses on the filters containing powders of extracted precipitates of different samples have been performed by using a Panalytical X’Pert Pro X-ray diffractometer equipped with Co-Kα and Cu-Kα radiations. Each sample includes an XRD analysis of the virgin filter as a reference sample (blank). Steel Grade 91 and 92 samples and the identification codes for XRD analyses are shown in Table 7 below. XRD diffractograms obtained as the output of XRD analyses have been converted as row data files.
The instrument reports with the sample data are included in the figures of Section 3 (Results) after the XRD diagrams. The data range (2ndeta) was 24,670–69,653° for sample A and 25,010–69,993° for the other samples. The other data are the same for sample A to H, and they are summarized as follows:
  • Number of points: 3427;
  • Step size: 0.013;
  • 2ndeta correction: 0.34°;
  • Radiation X-rays;
  • Wavelength 1.541874 Å.
An X-ray analysis procedure has been applied to identify the precipitate phases in the extracted powders. Due to the overlapping of some of the X-ray reflections of similar phases with similar structures, a simulated diffraction pattern has been calculated that involves the fitting of the recorded diffractograms.
Phase identification has been achieved by automatic matching from the comparison of crystallographic peak intensity and a database analysis (Table 8).

2.6. The TEM Analysis for Subprojects N. 3 and N. 6

A field emission gun transmission electron microscope, TEM FEG JEOL 3200FS–HR, instrument is used for the analysis of the precipitate states of the P91 and P92 welded specimens.
The TEM methodology used for the assessment of size, morphology, chemical composition, crystallography, and the identification of precipitates is applied on carbon extraction replica samples. The fine-tuned procedure for steel Grades 91 and 92 consists of the following phases:
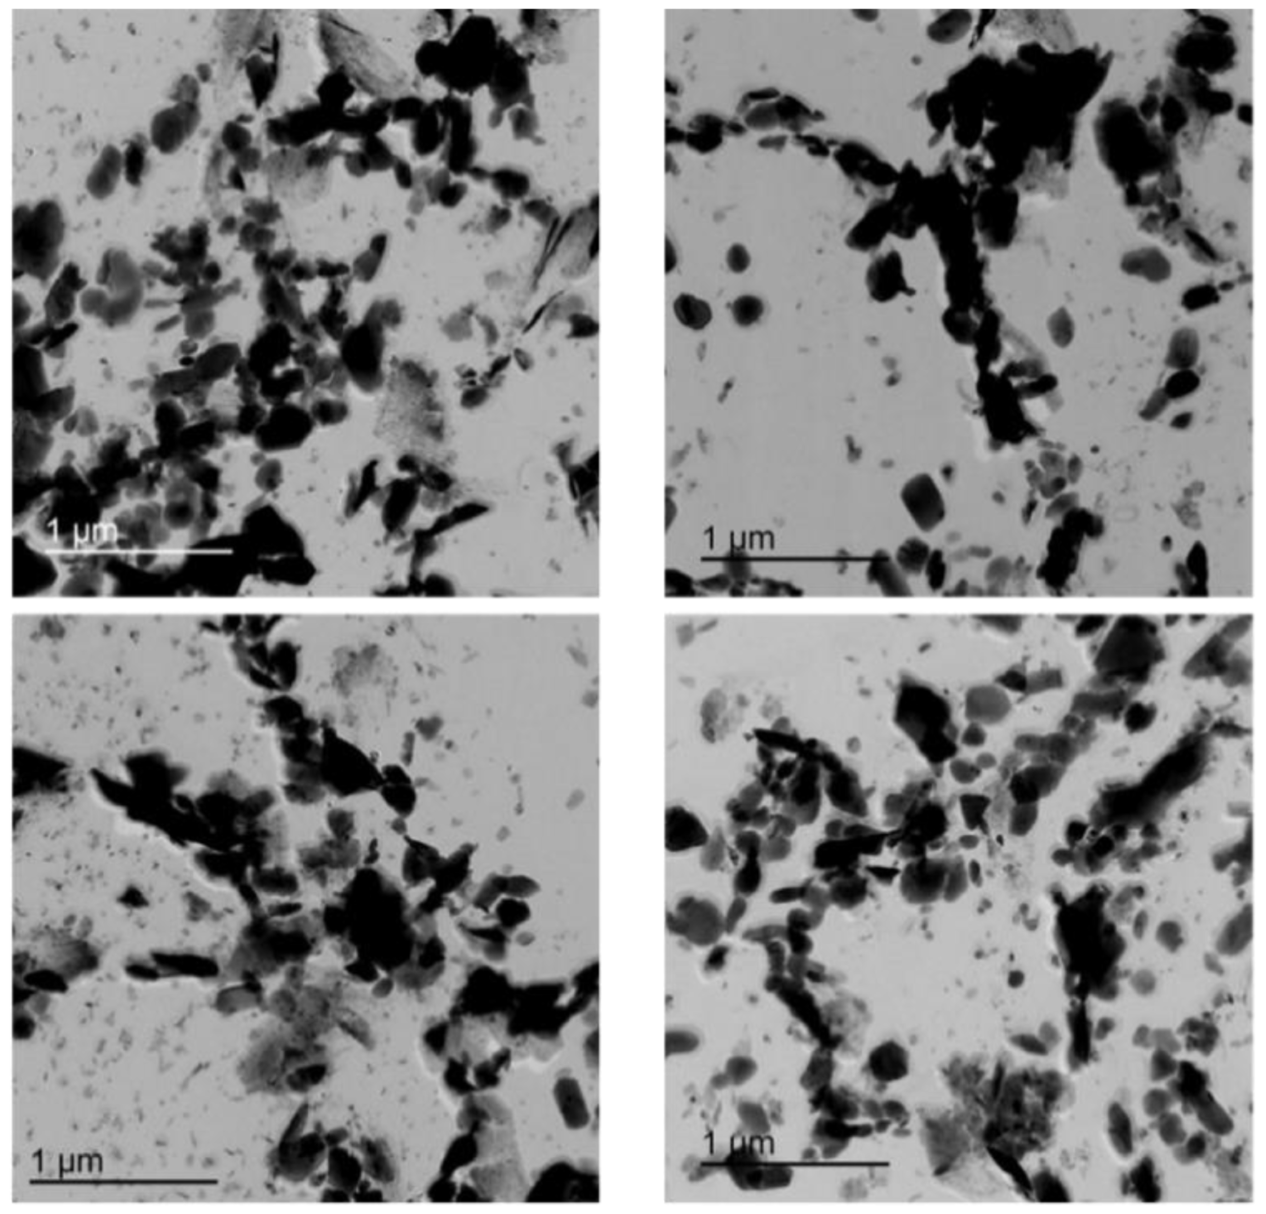
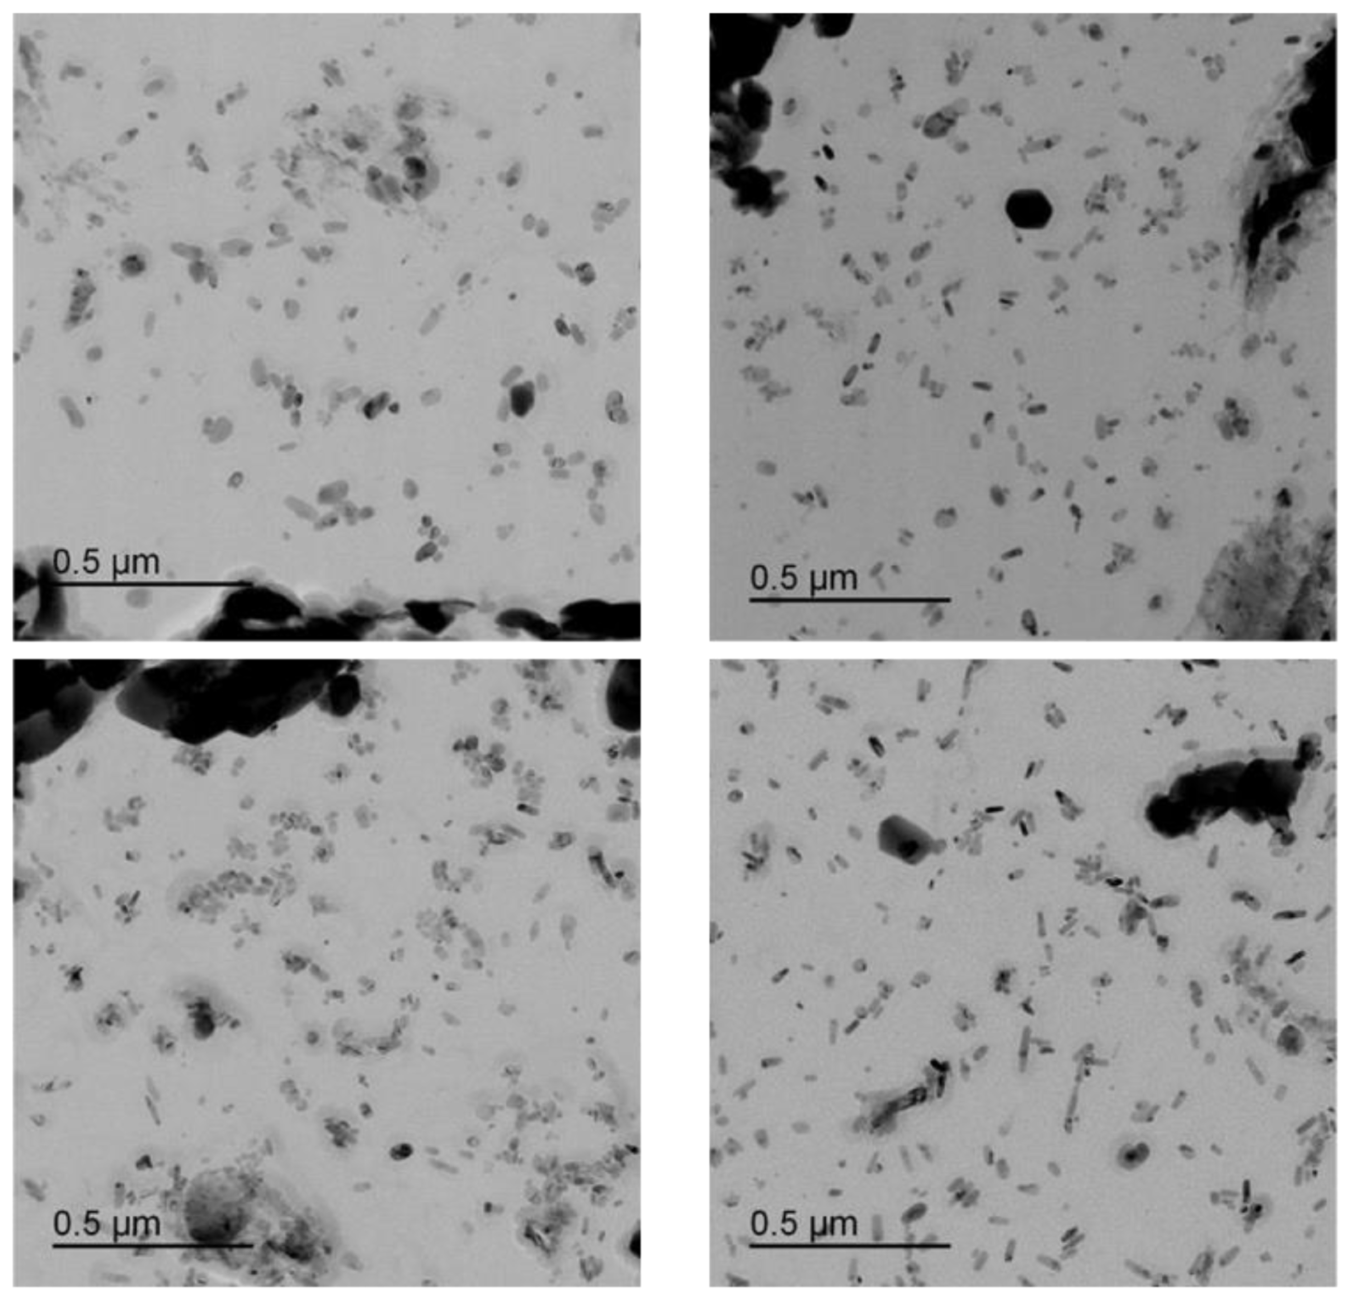
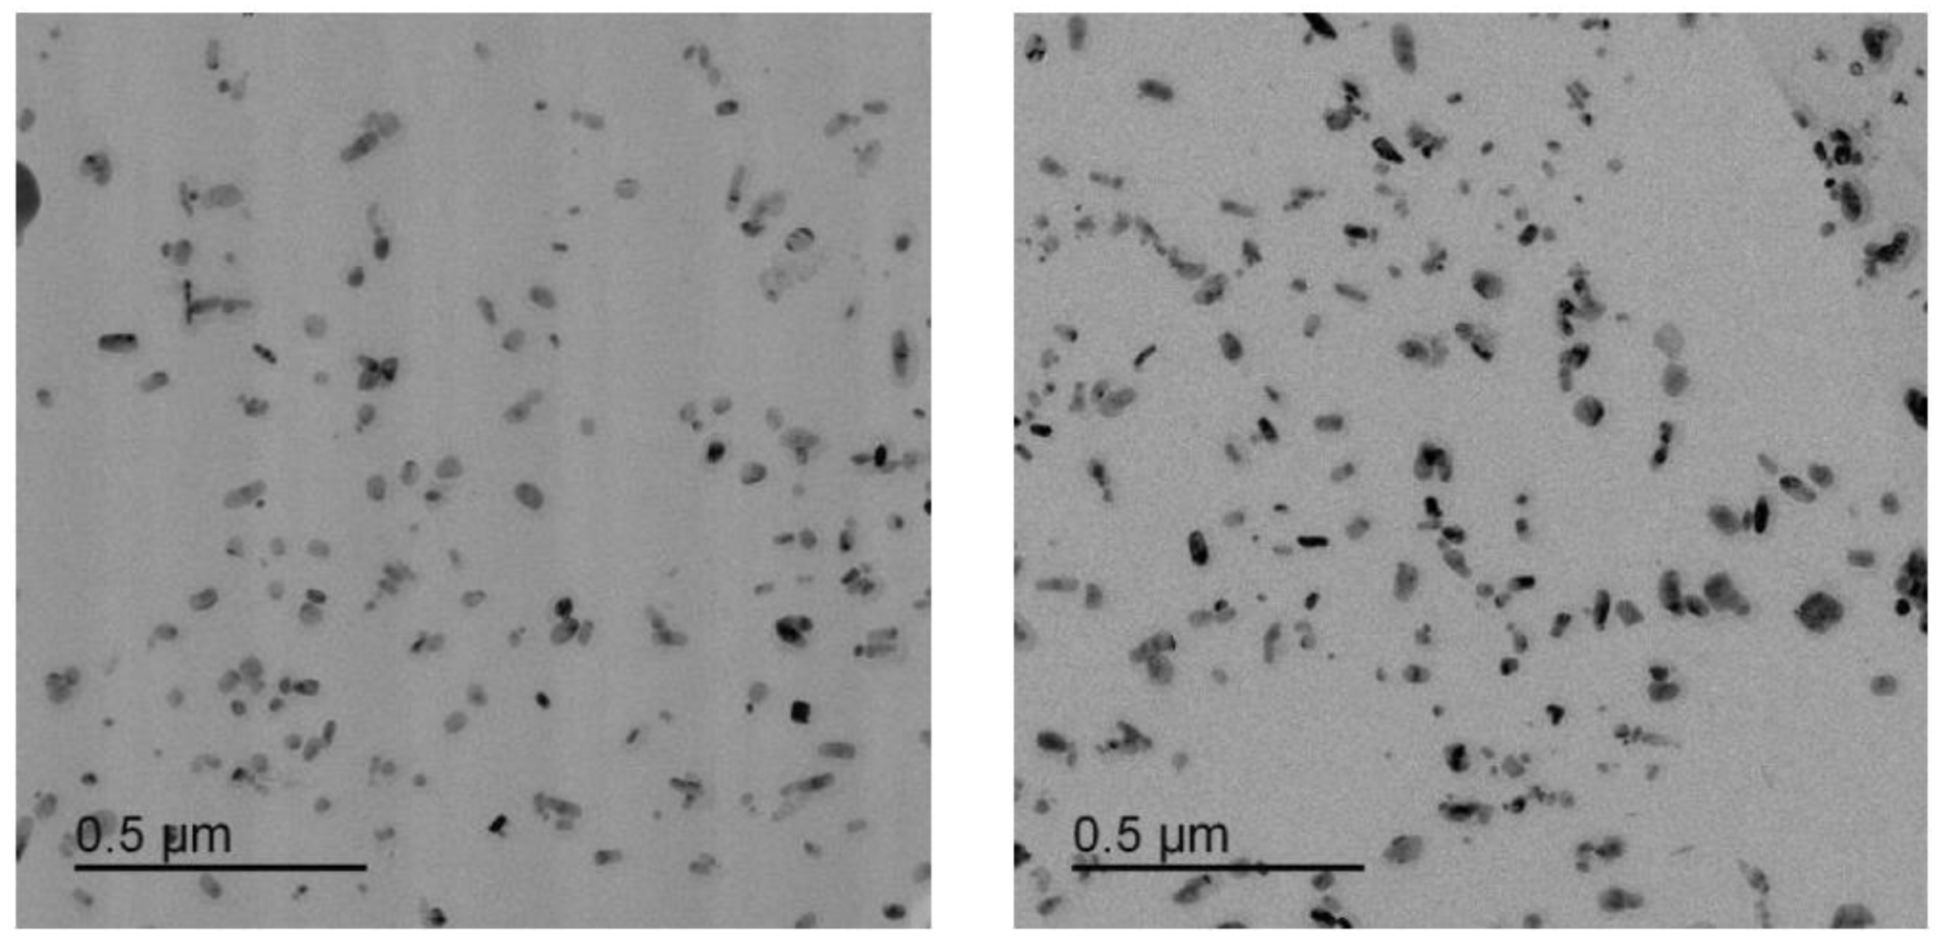
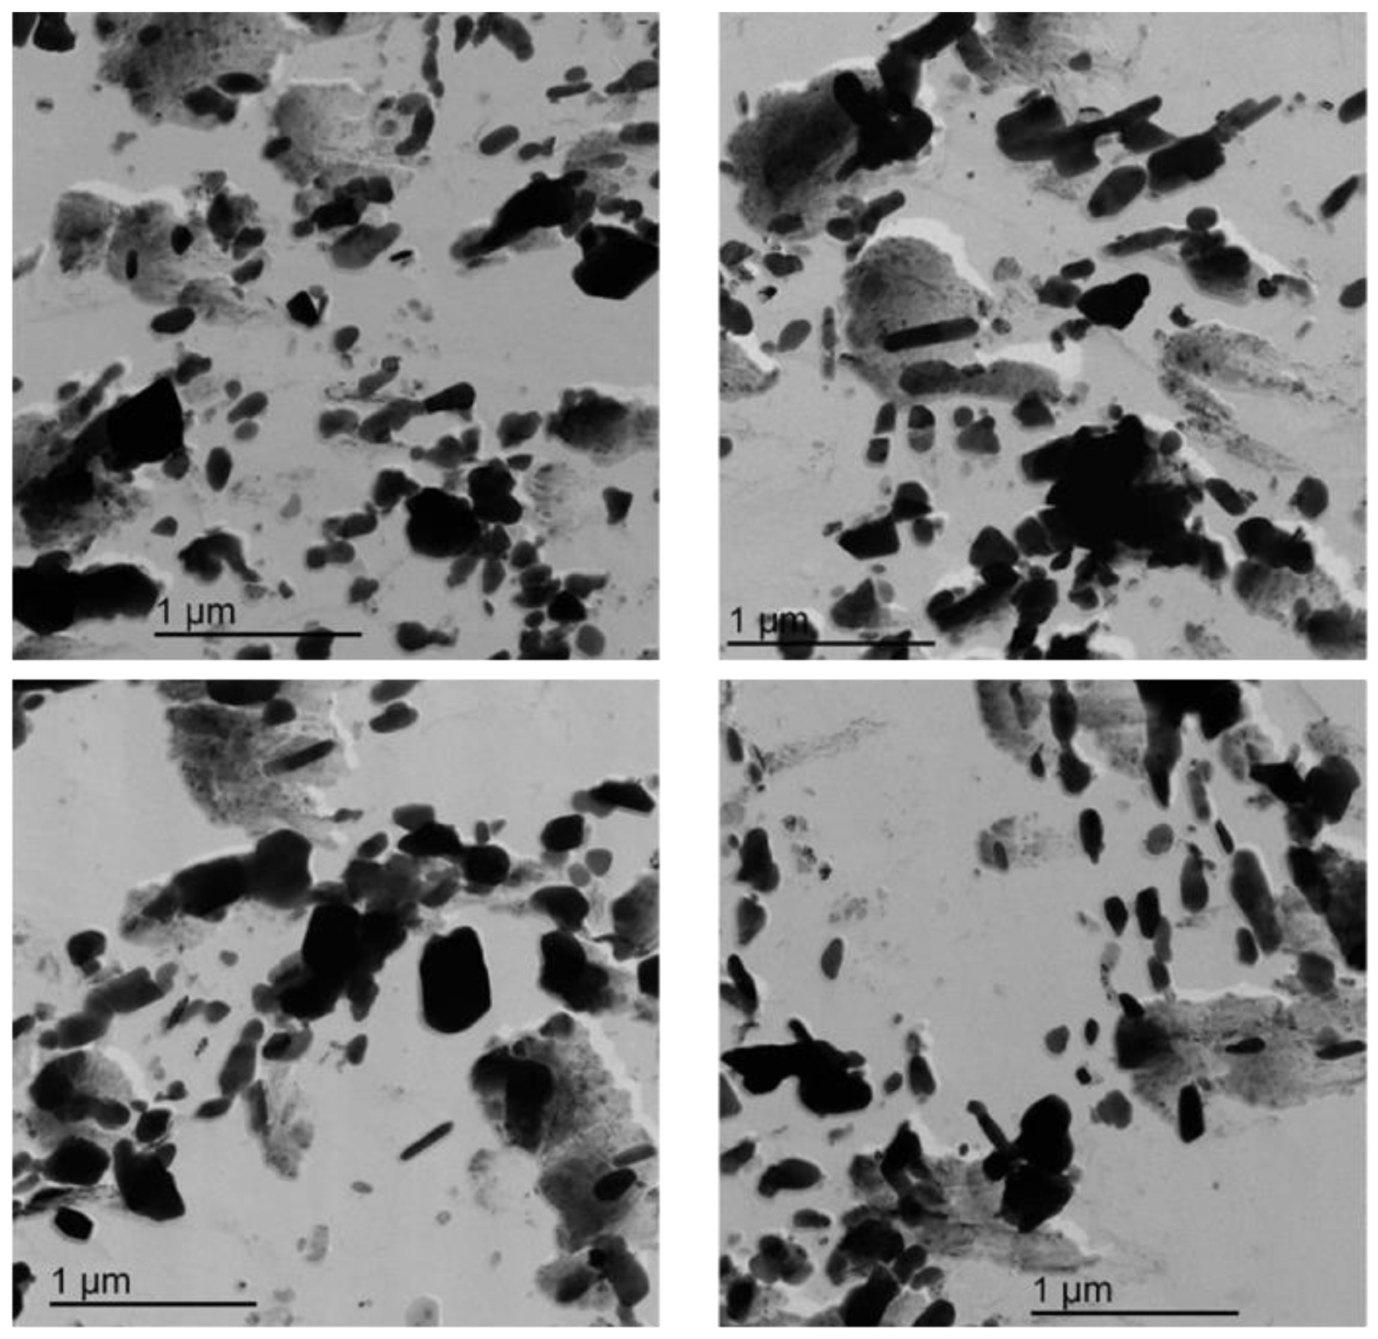
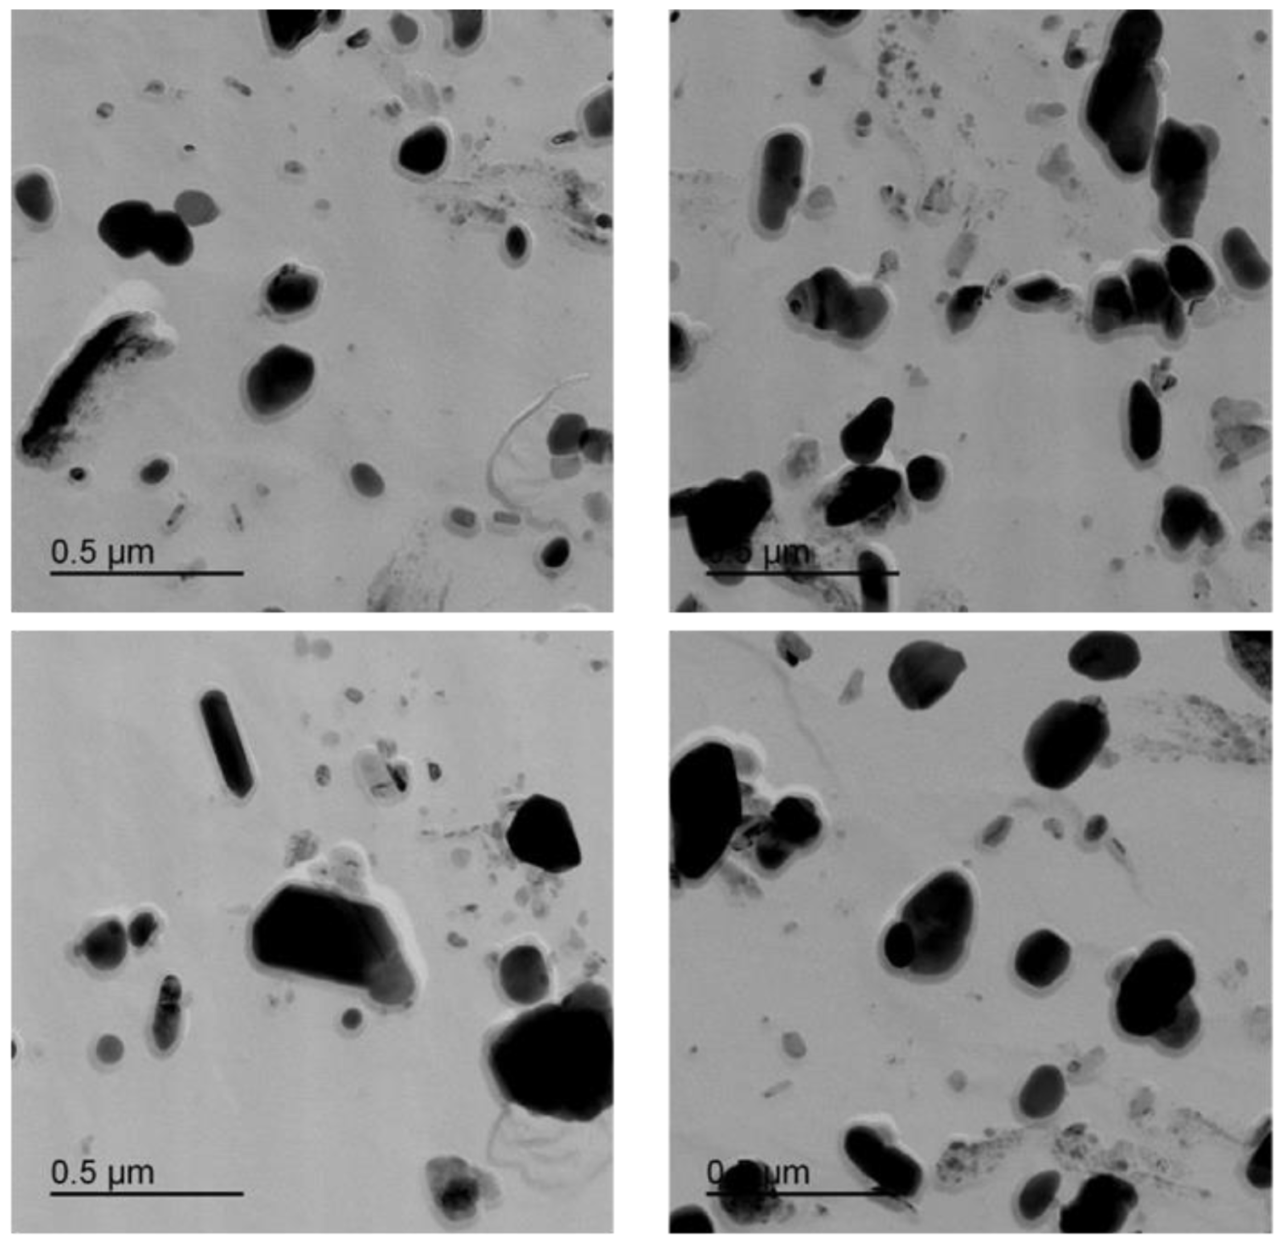
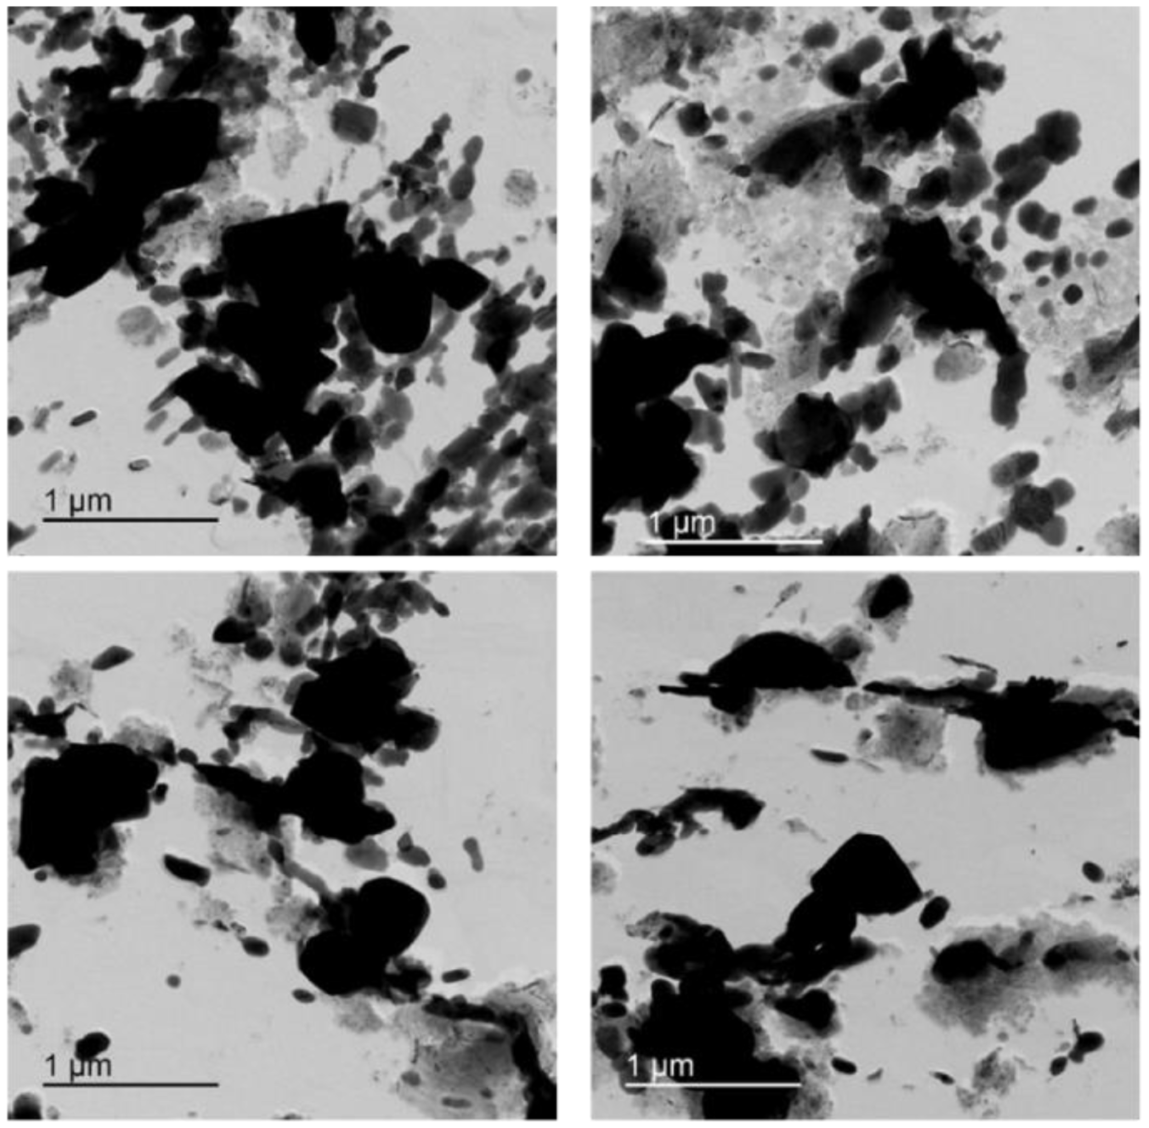
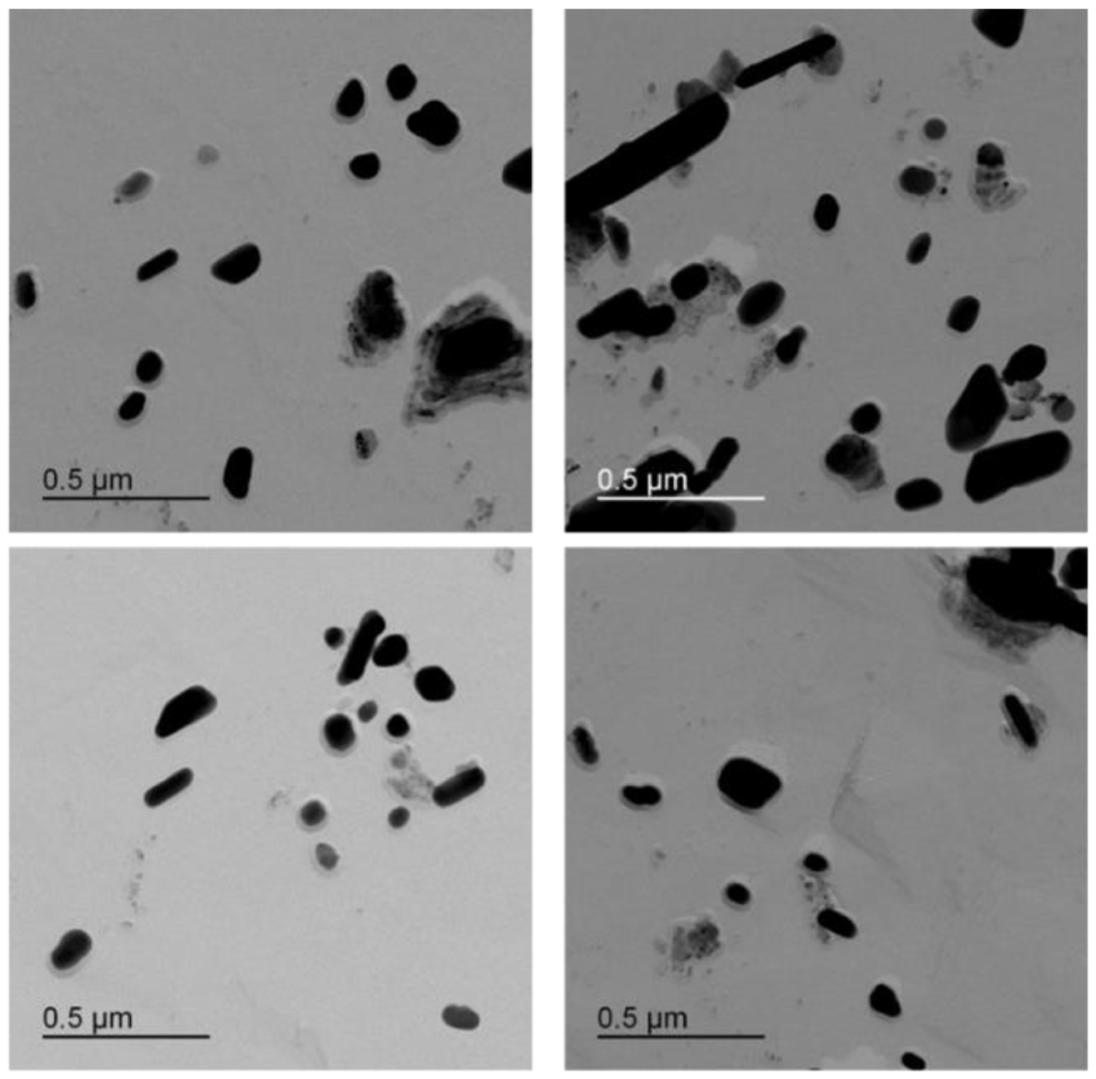
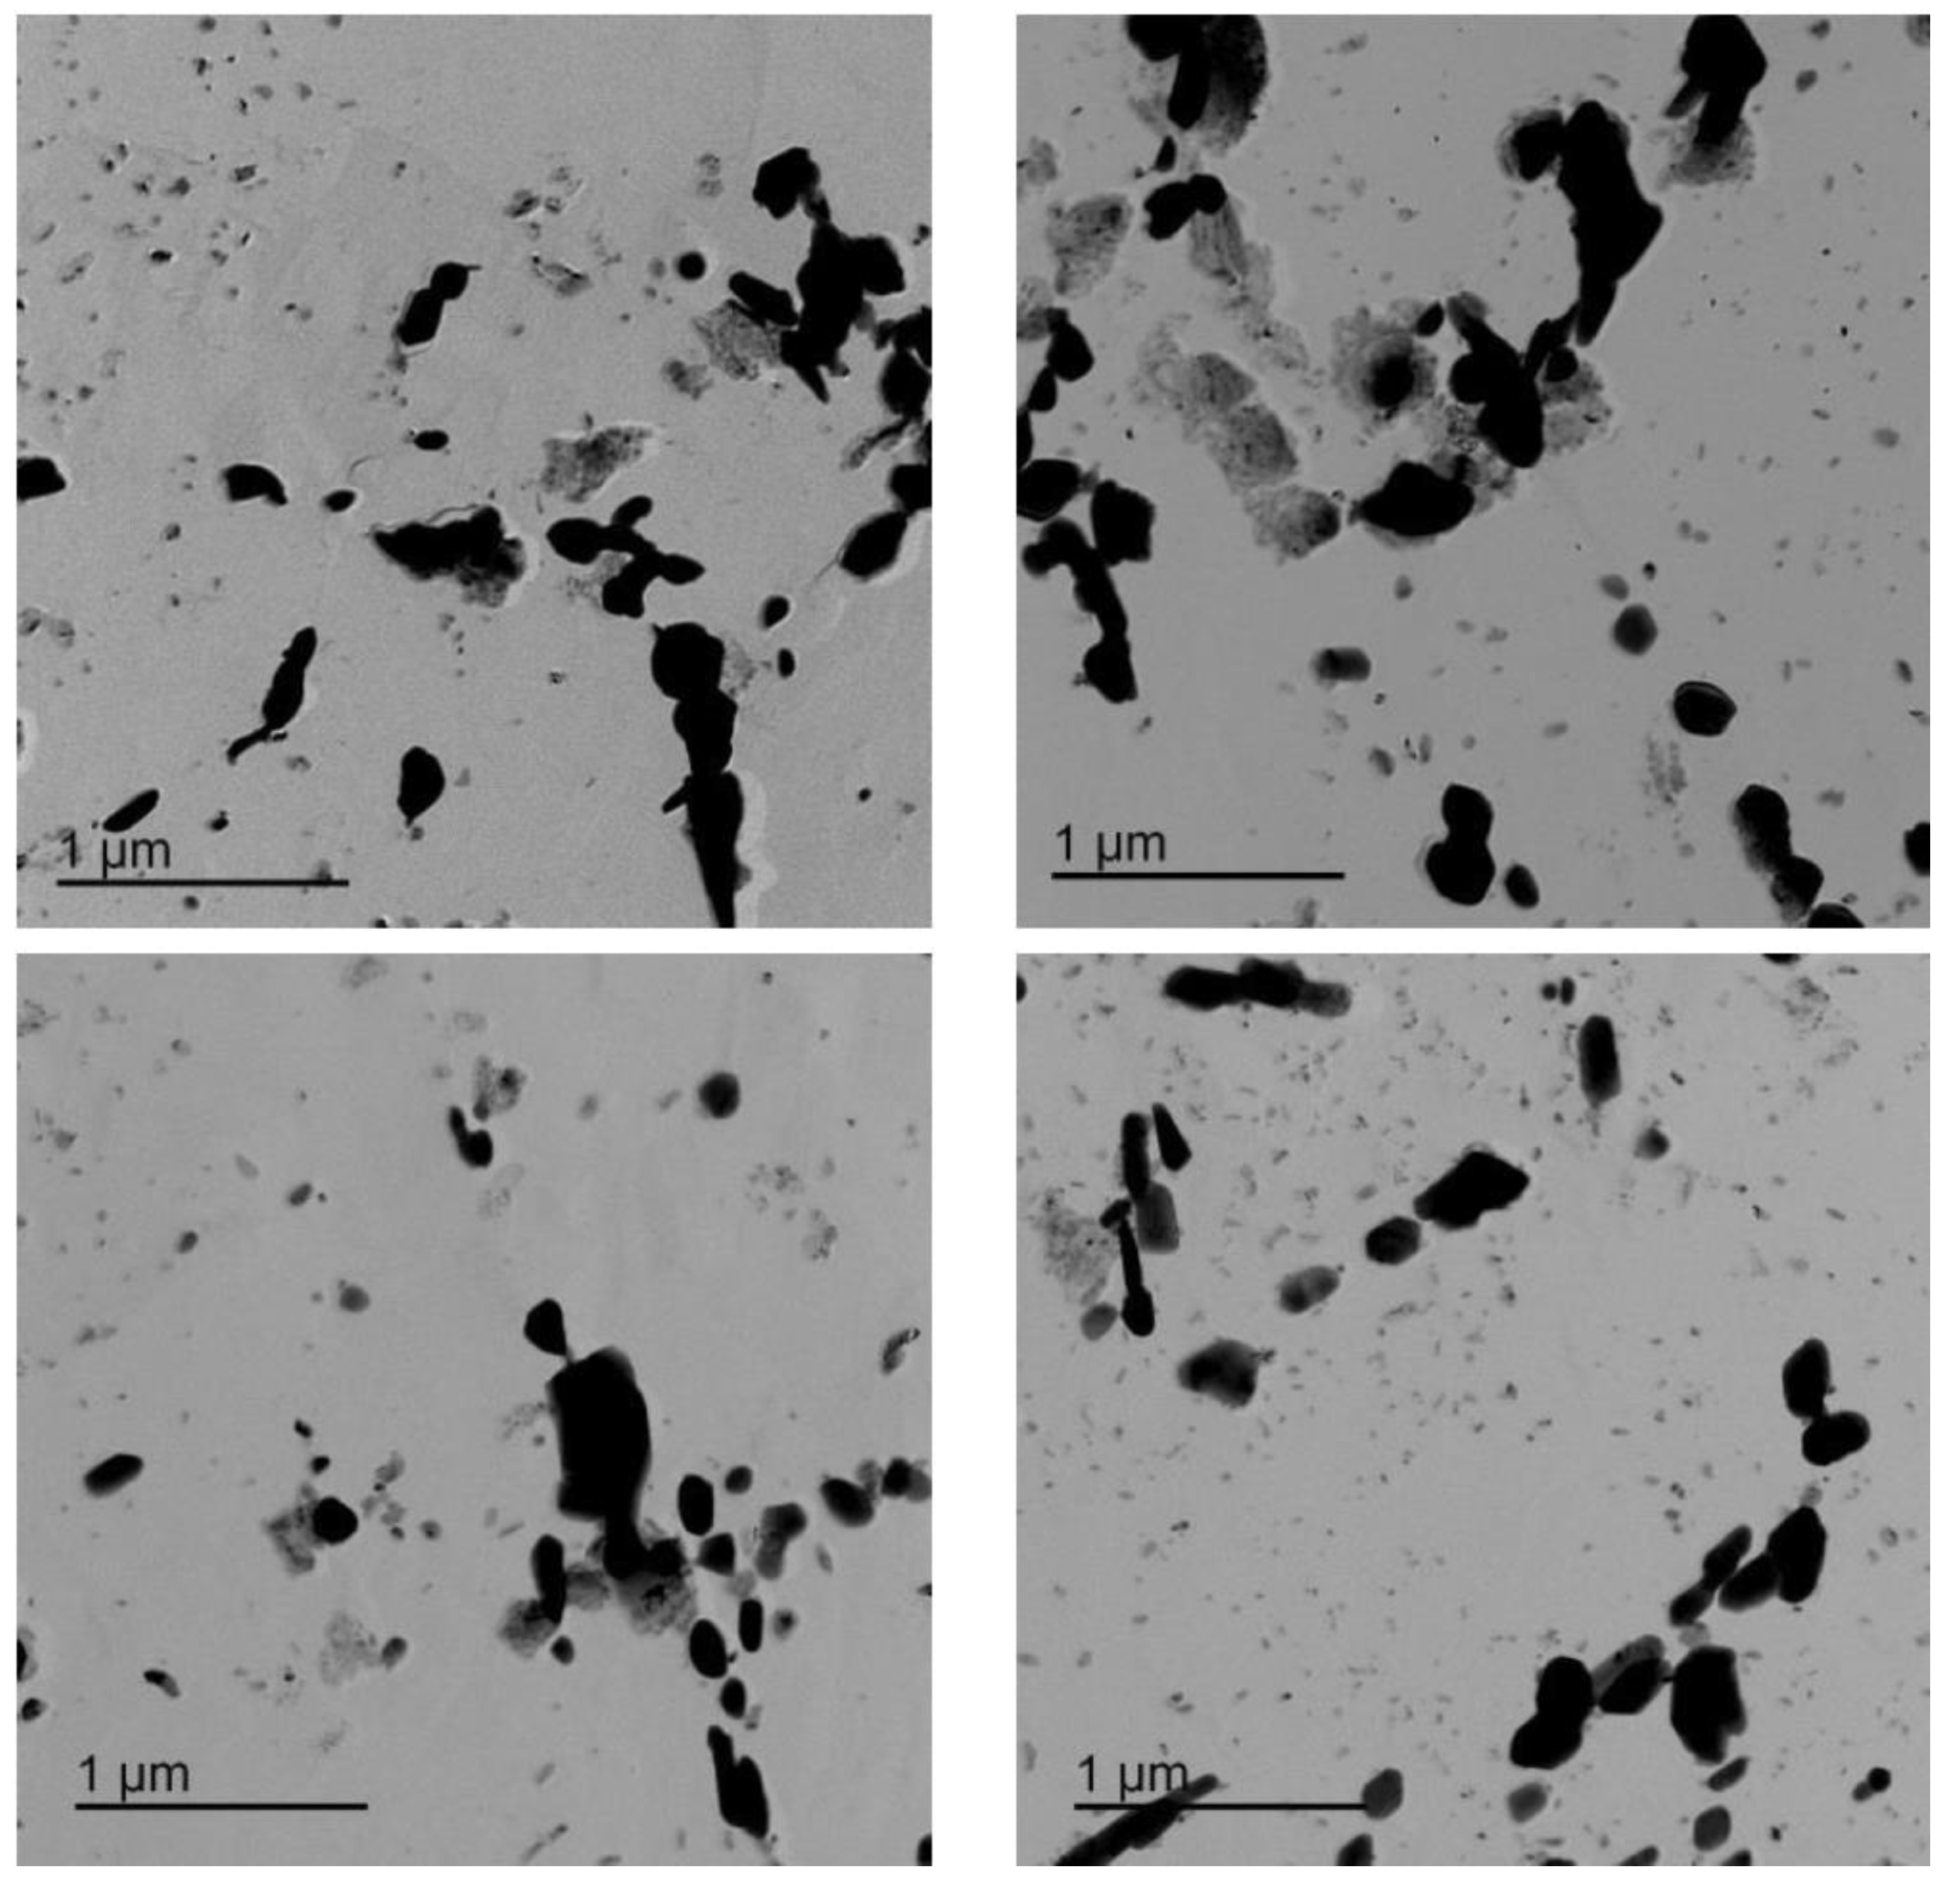
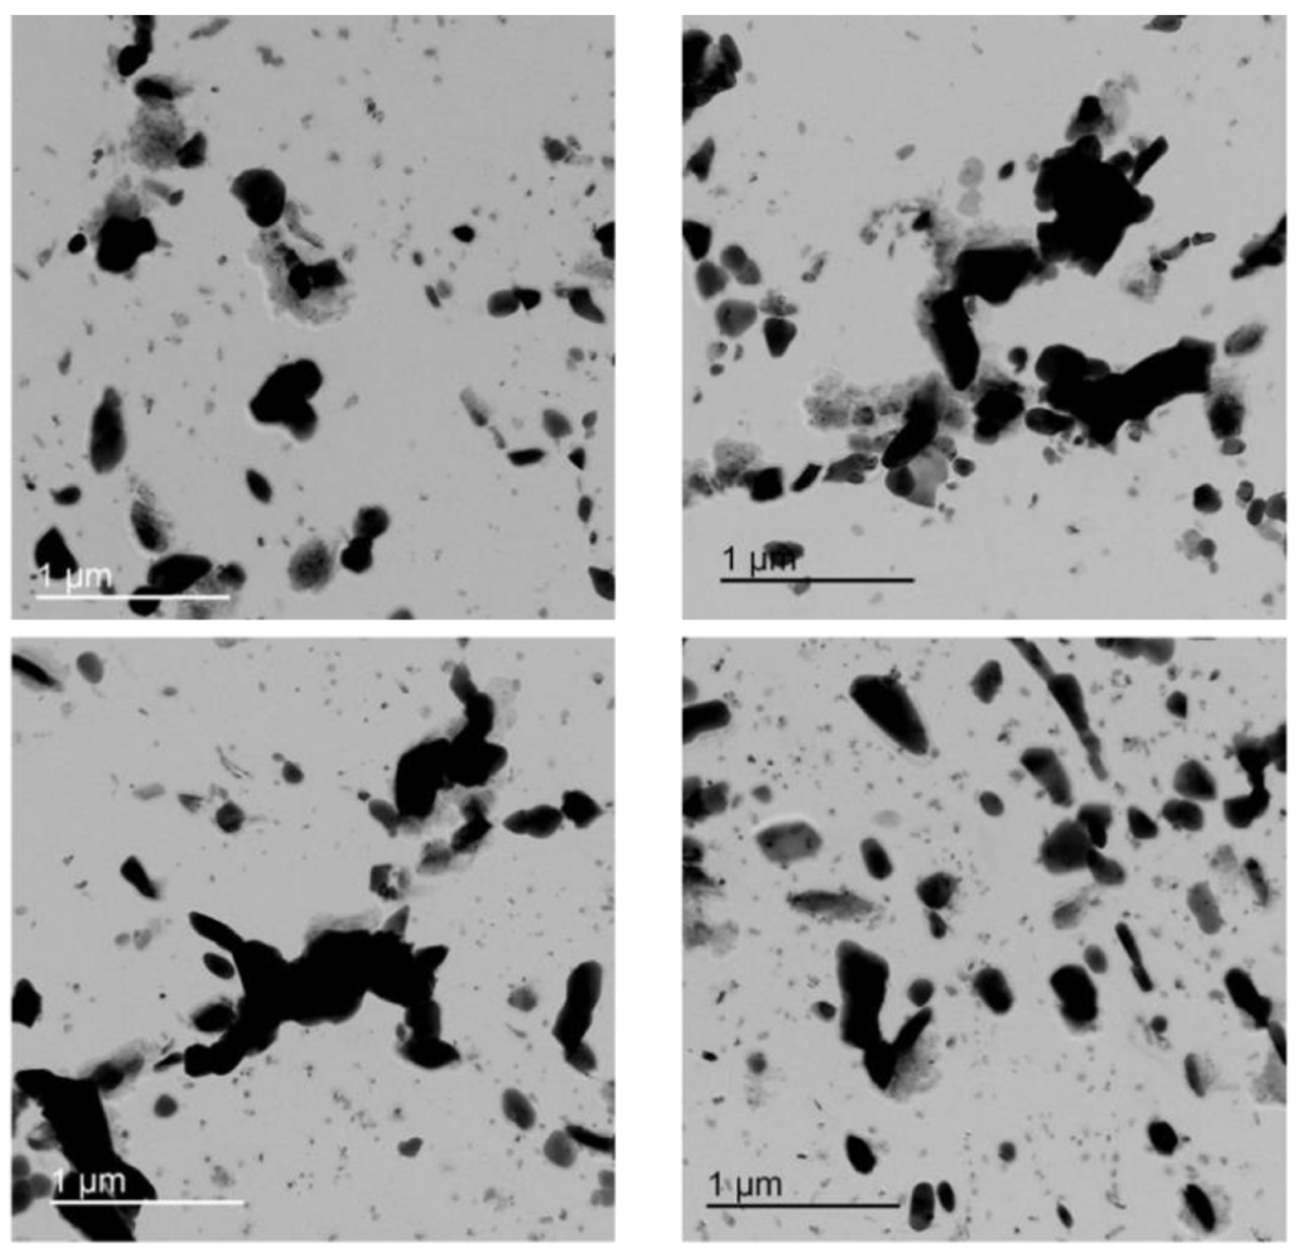
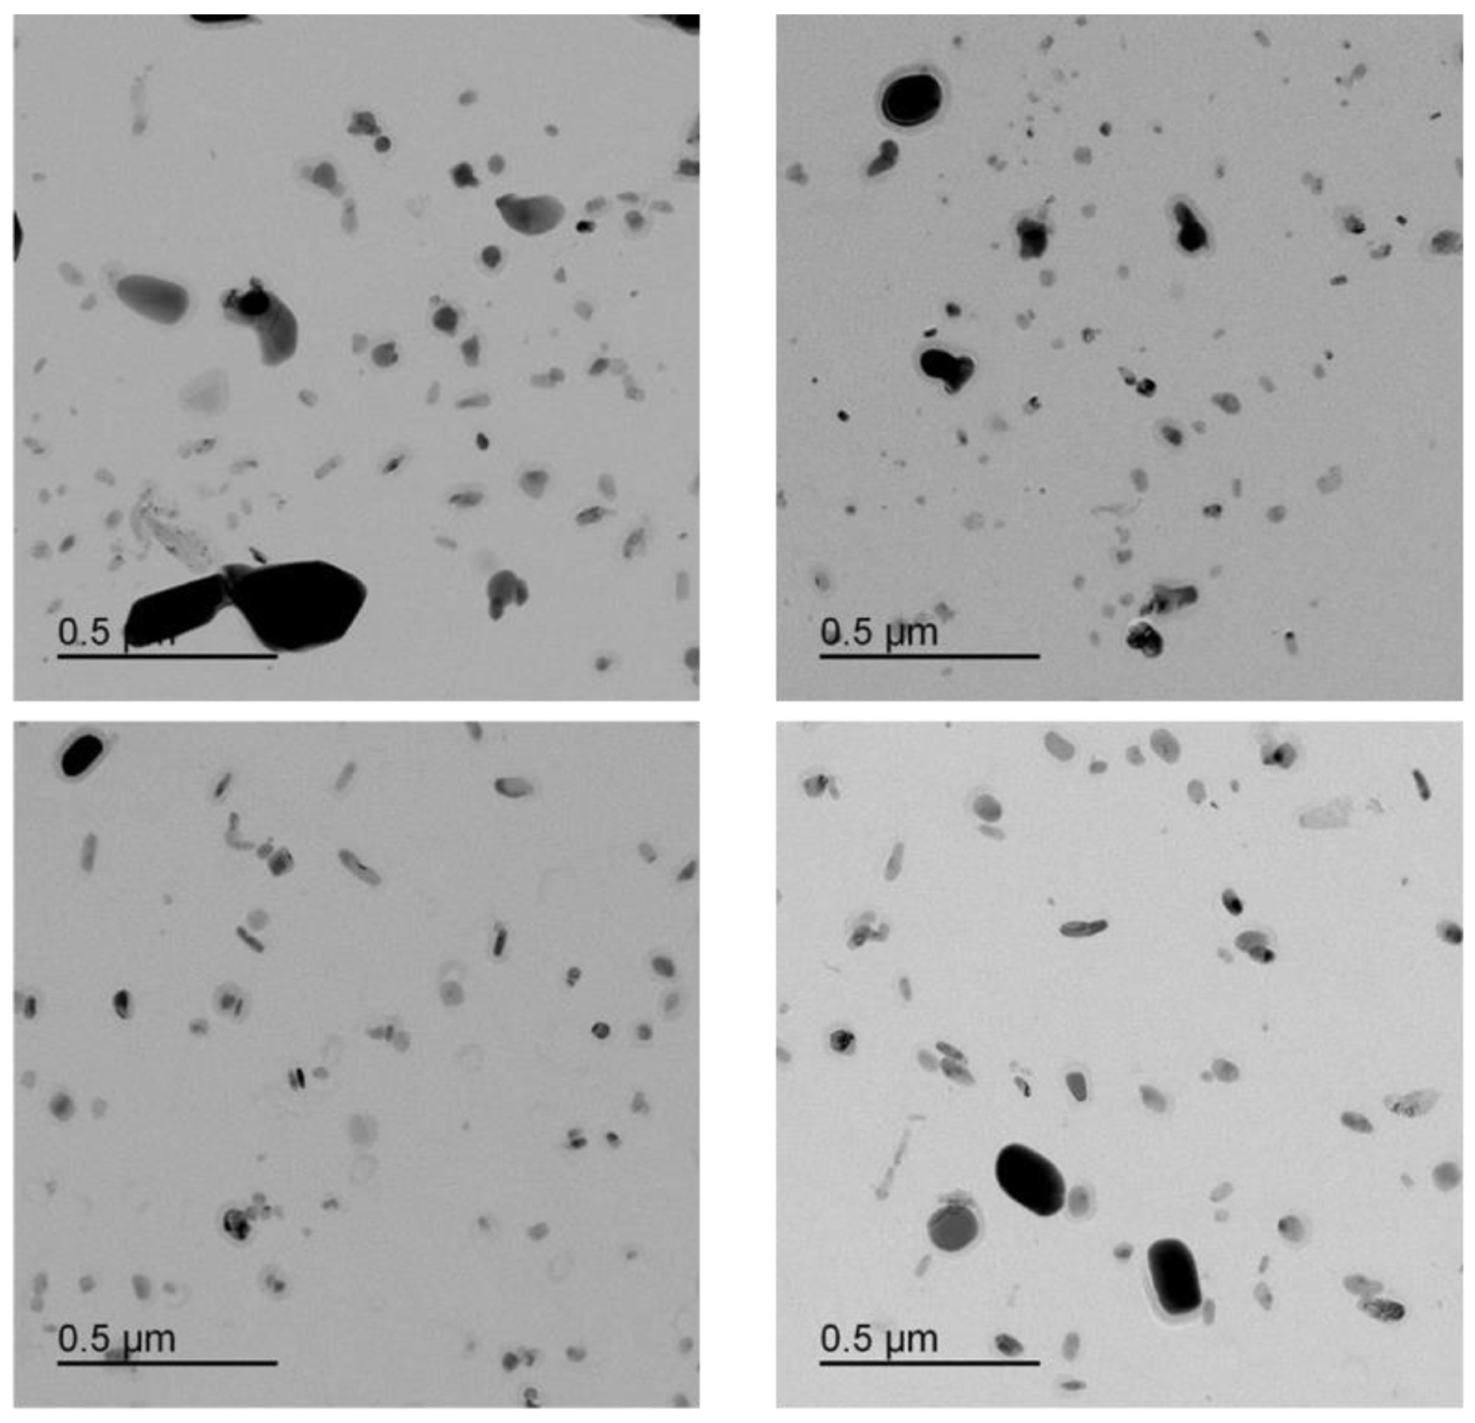
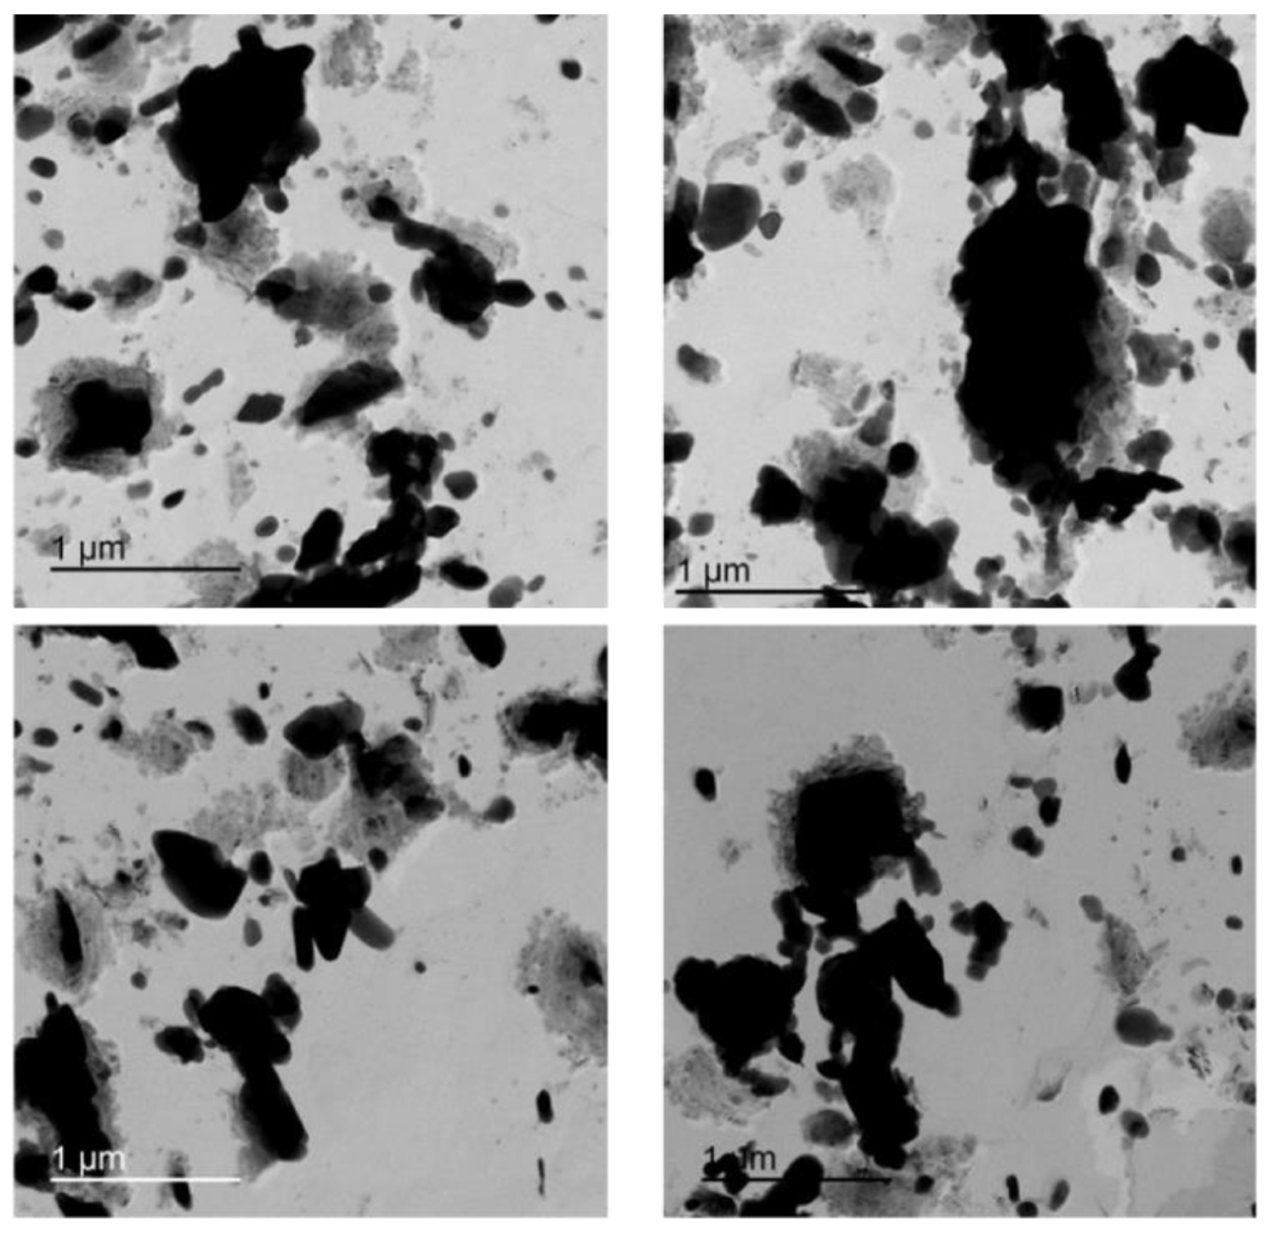
  • TEM images: Diffraction contrast technique. Two beam conditions in the selected area diffraction (SAD) pattern are selected for generating dark- and bright-field diffraction contrast images in order to highlight microstructural component constituents. A high-contrast, bright-field, and low-magnification image at 1000X is first acquired in order to highlight a general view of several prior austenite grains of the extraction and identify the representative area to be investigated. Then, TEM bright-field images are acquired in the selected area at different magnifications (12,000X, 50,000X, and 100,000X). In some regions of the selected area, information may be given concerning the precipitate position on the microstructural features, such as prior austenitic grain boundaries, recovered martensite lath boundaries, subgrain boundaries, and within recovered martensite laths.
  • Automatic image analysis: AIA applied on bright-field images. The assessment of morphology, size (diameter), size distribution, mean value, and the standard deviation of the overall precipitate population is performed on bright-field images by using automatic image analysis (AIA).
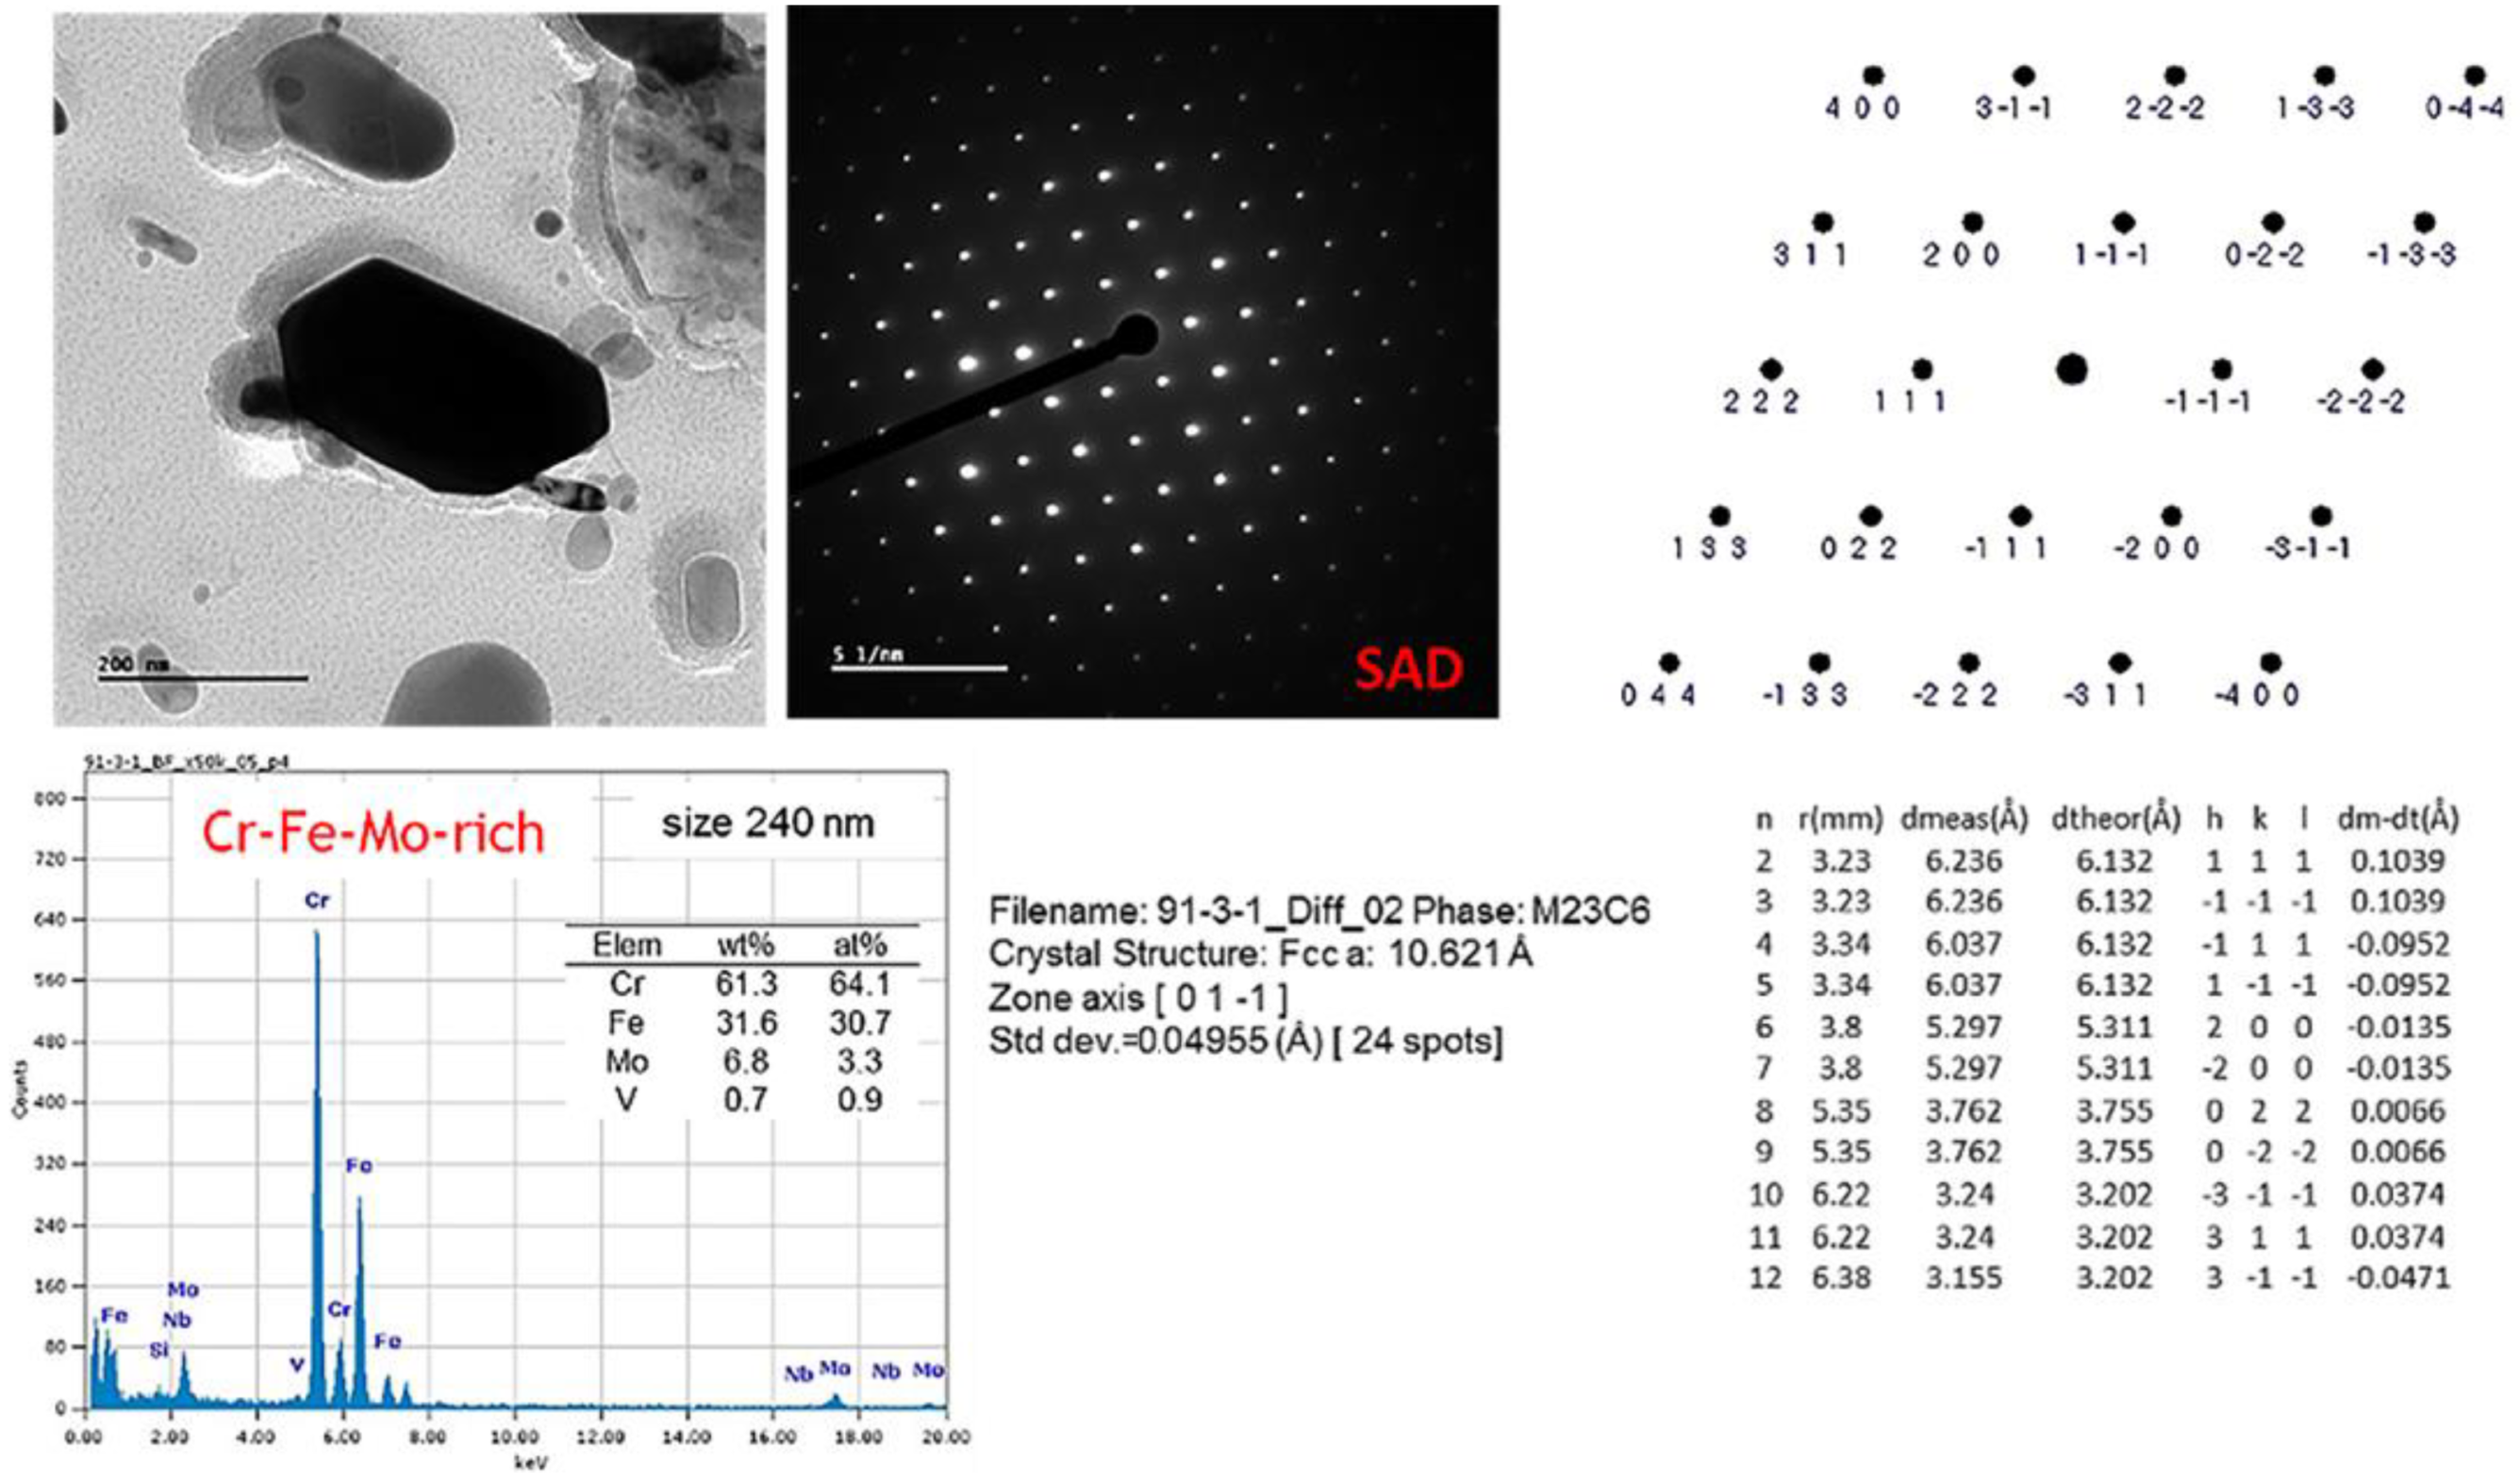
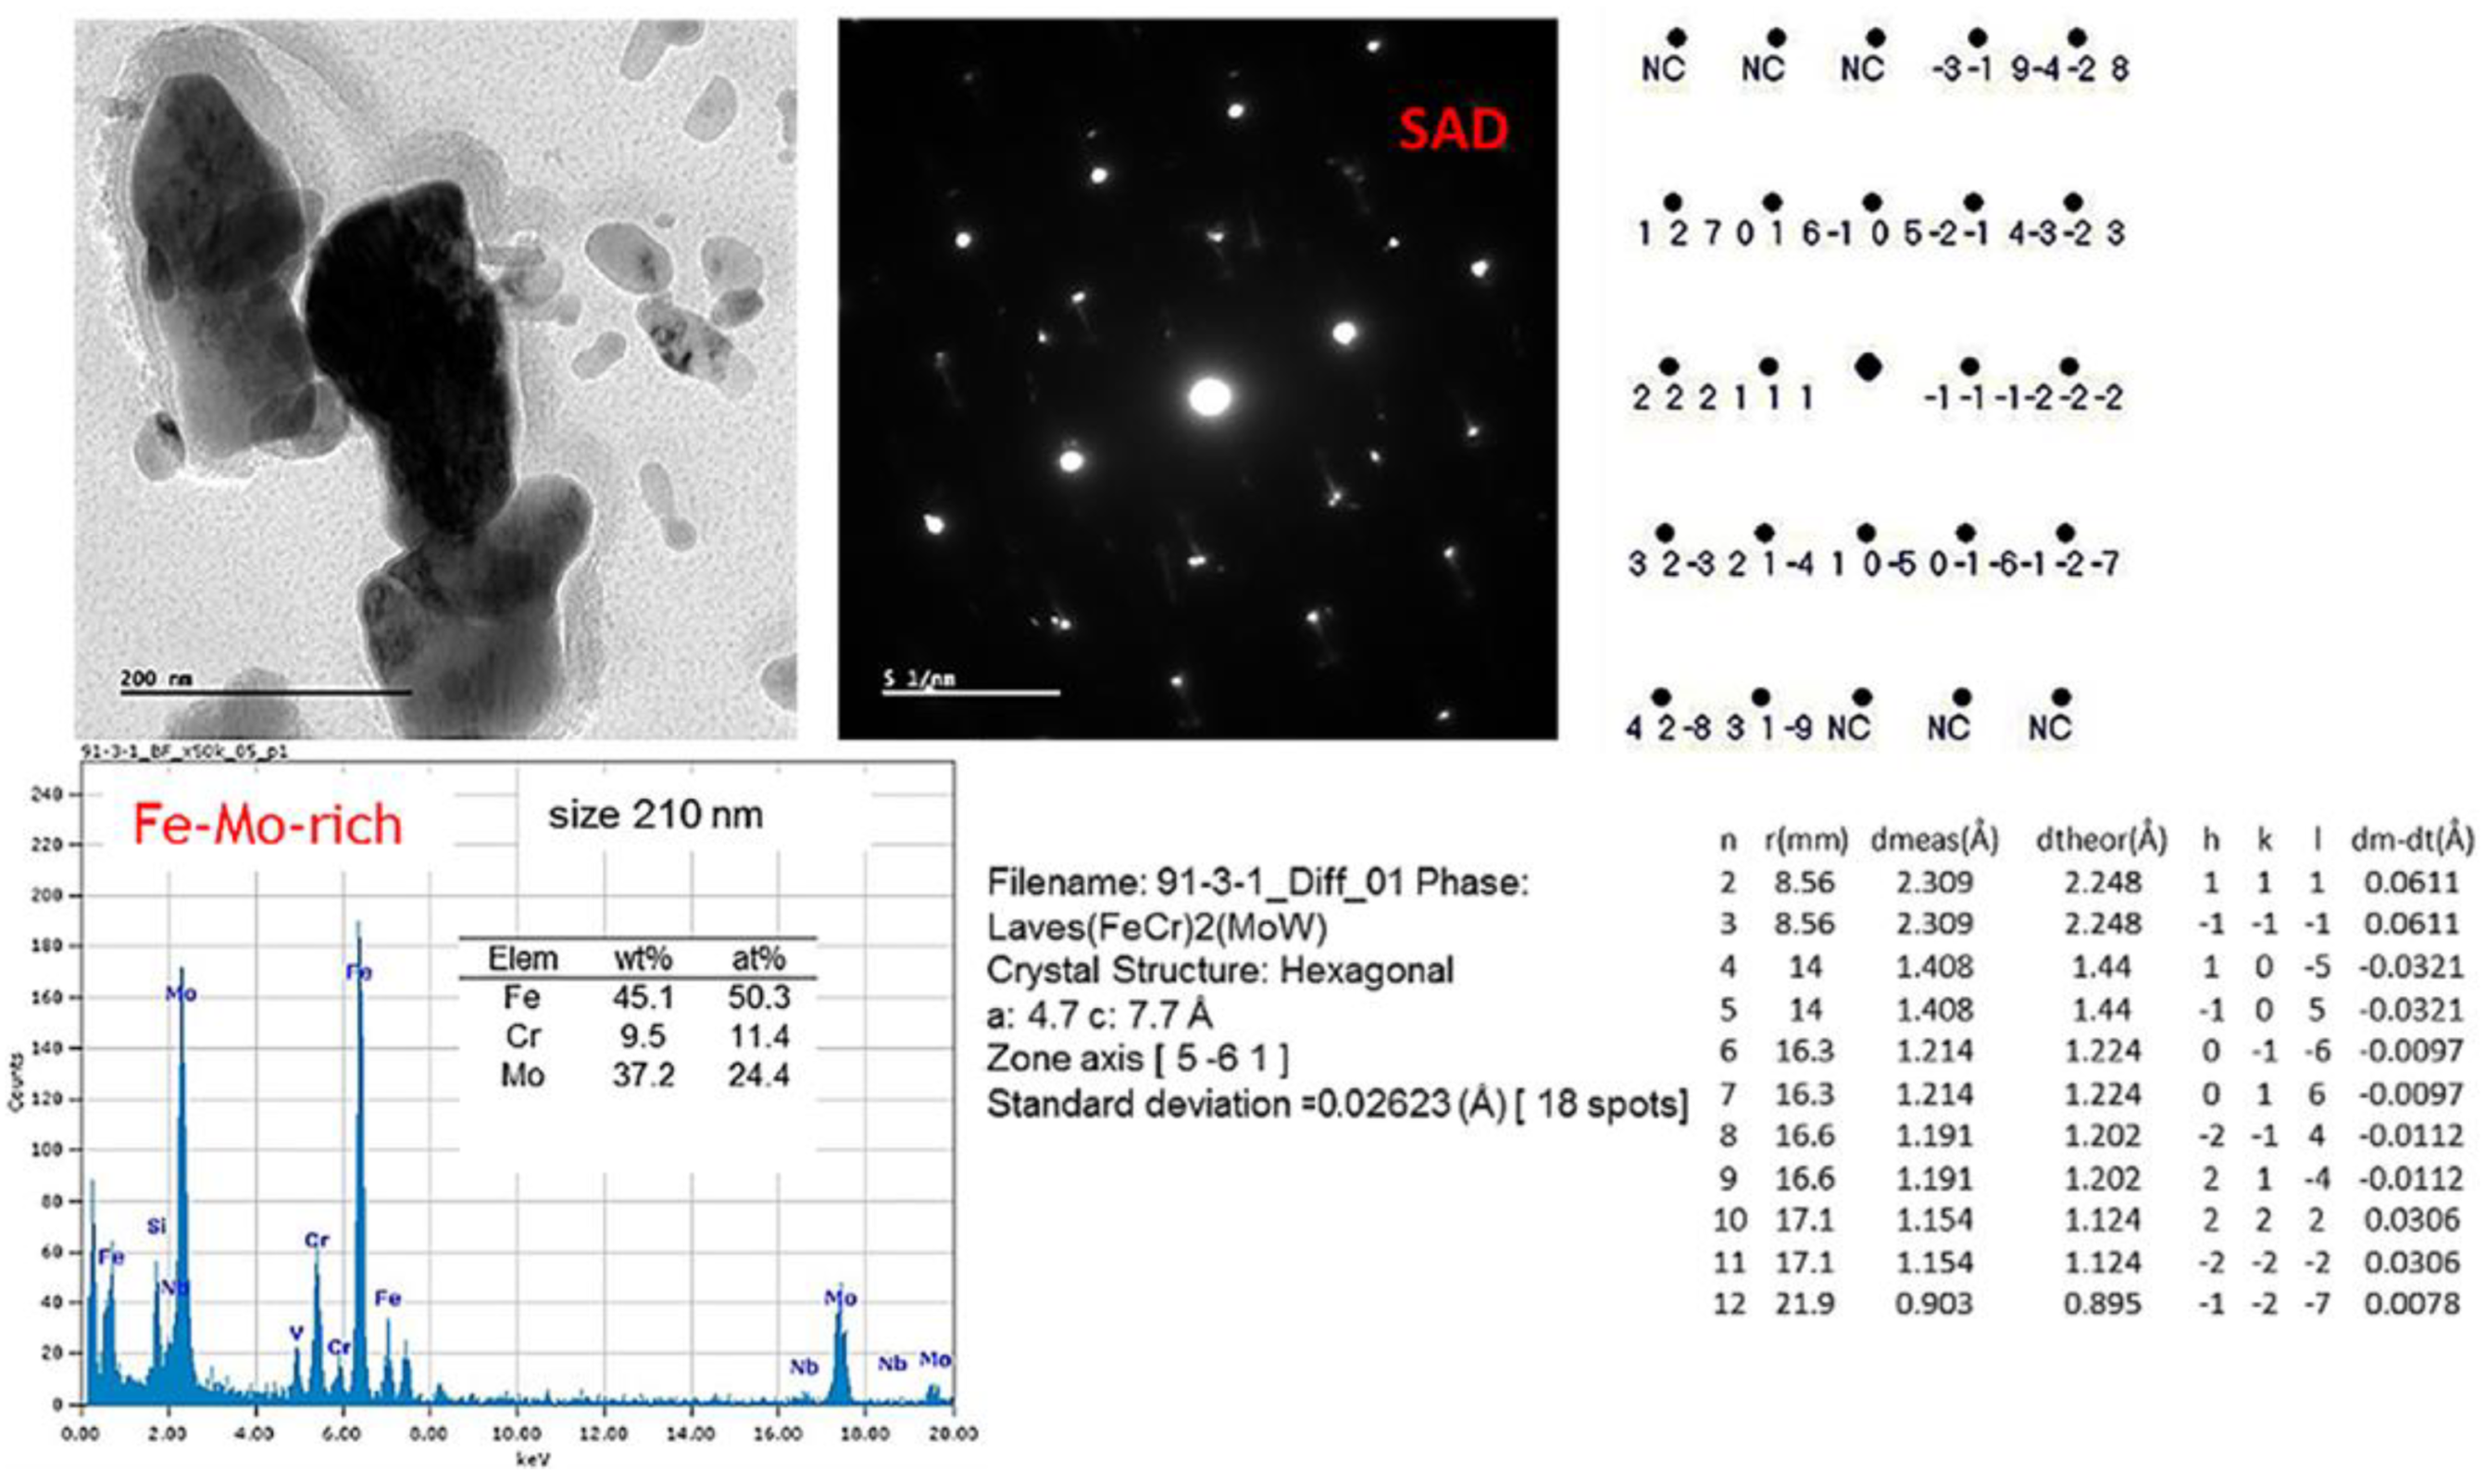
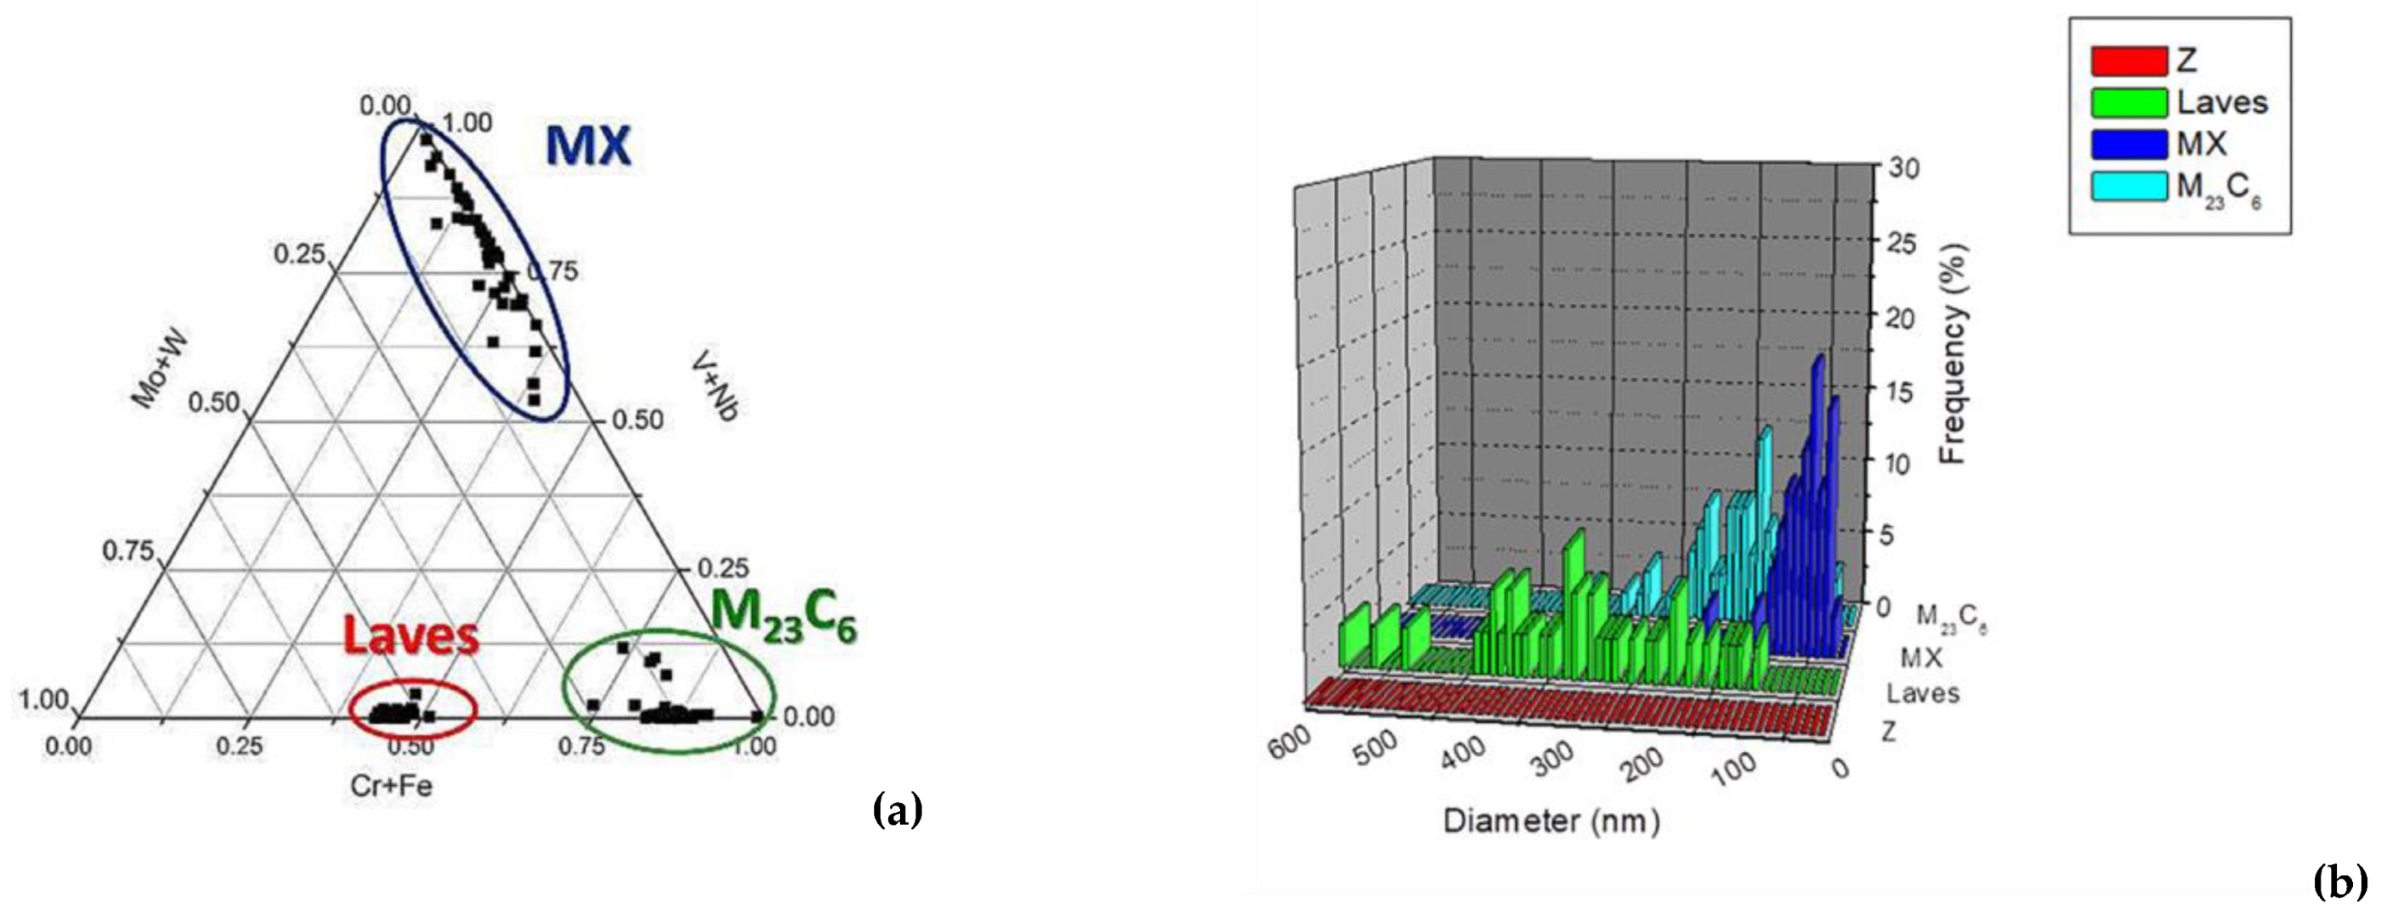
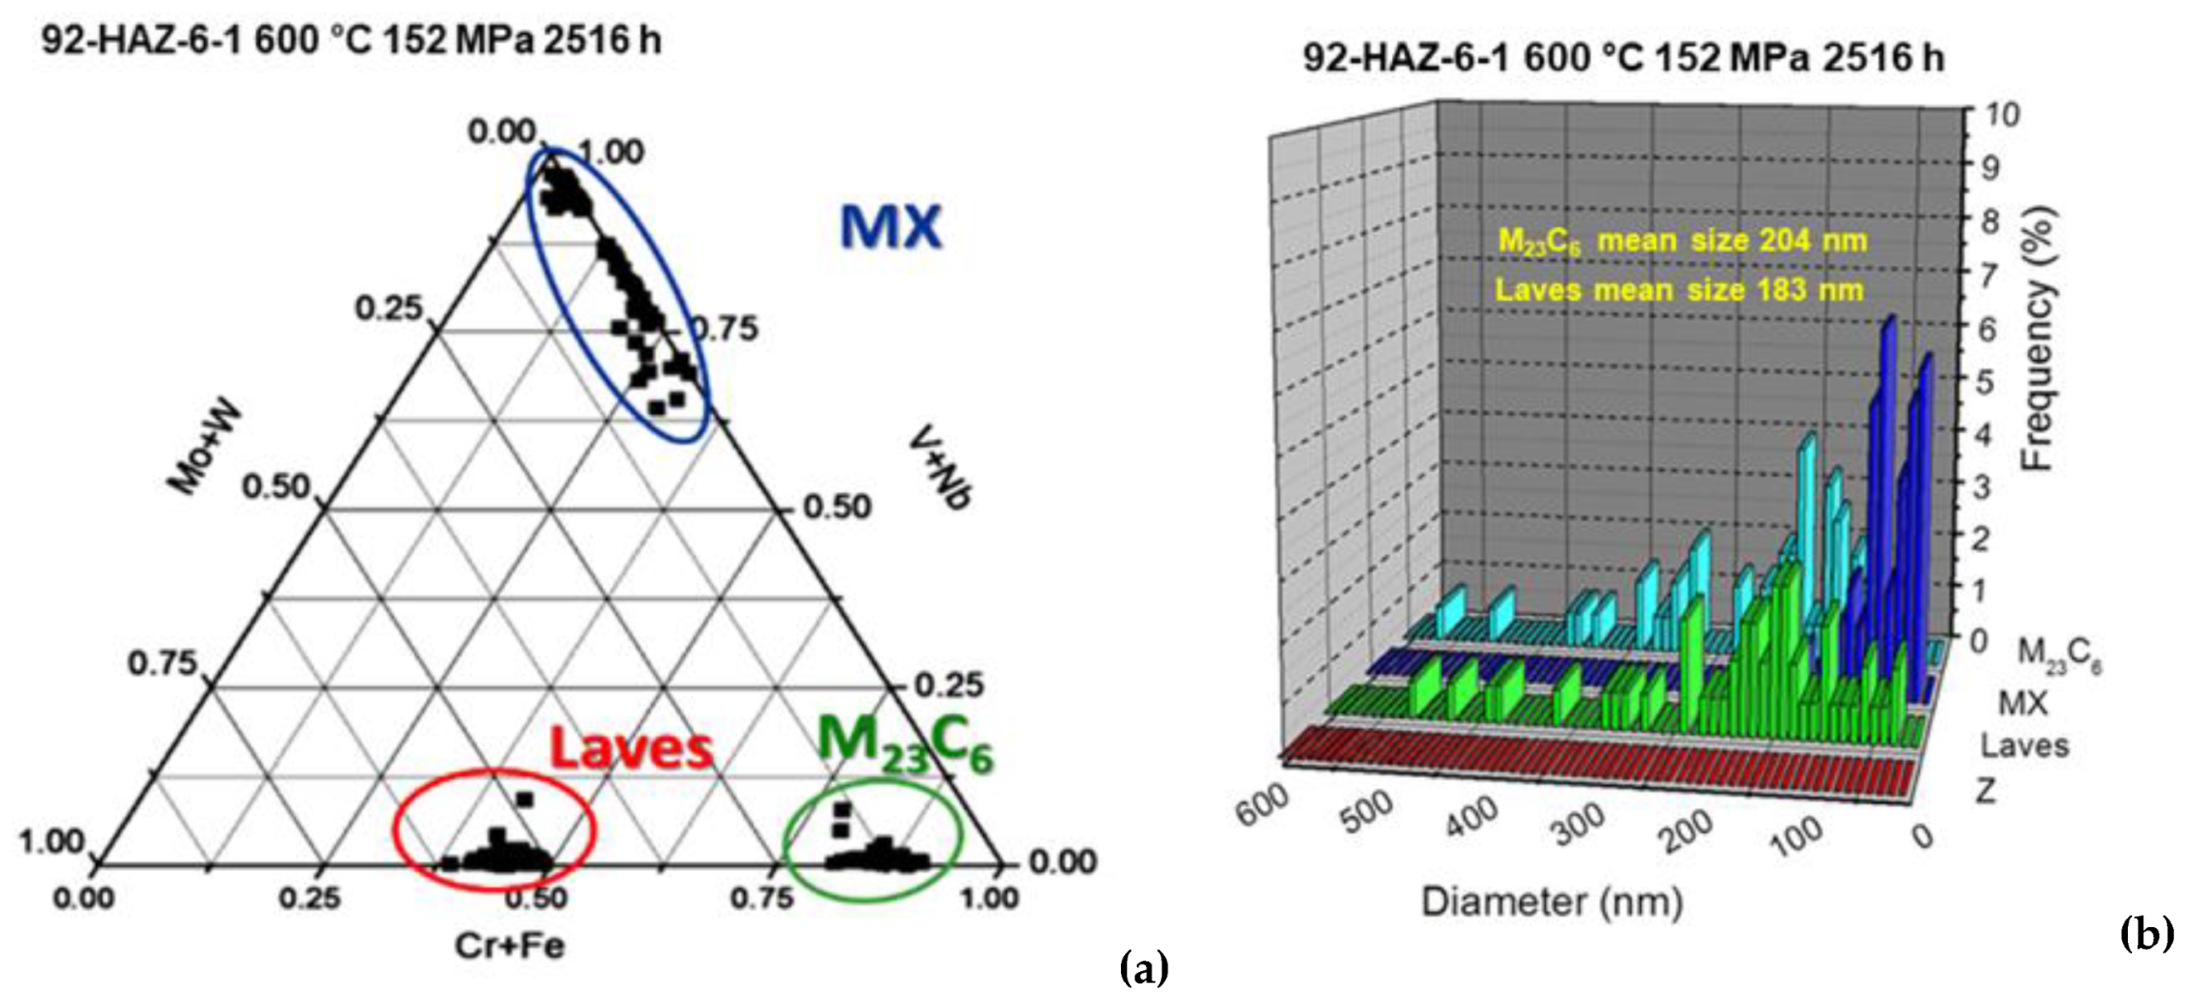
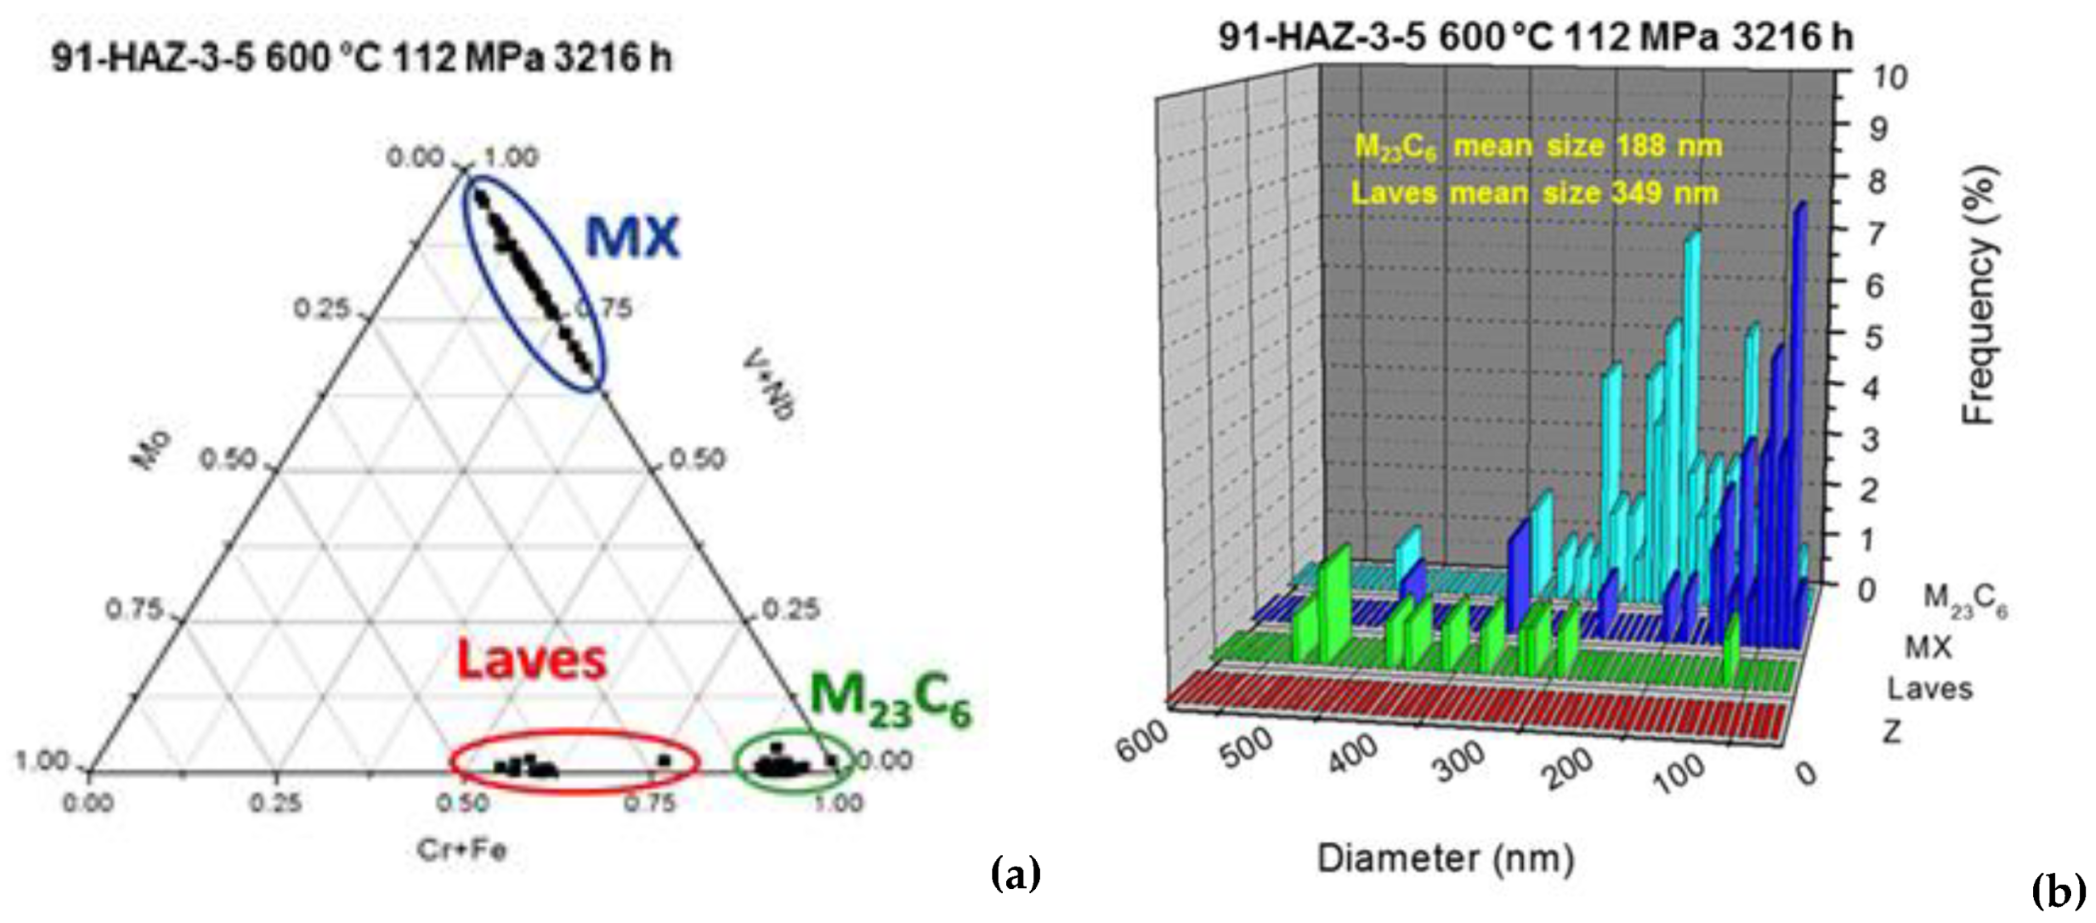
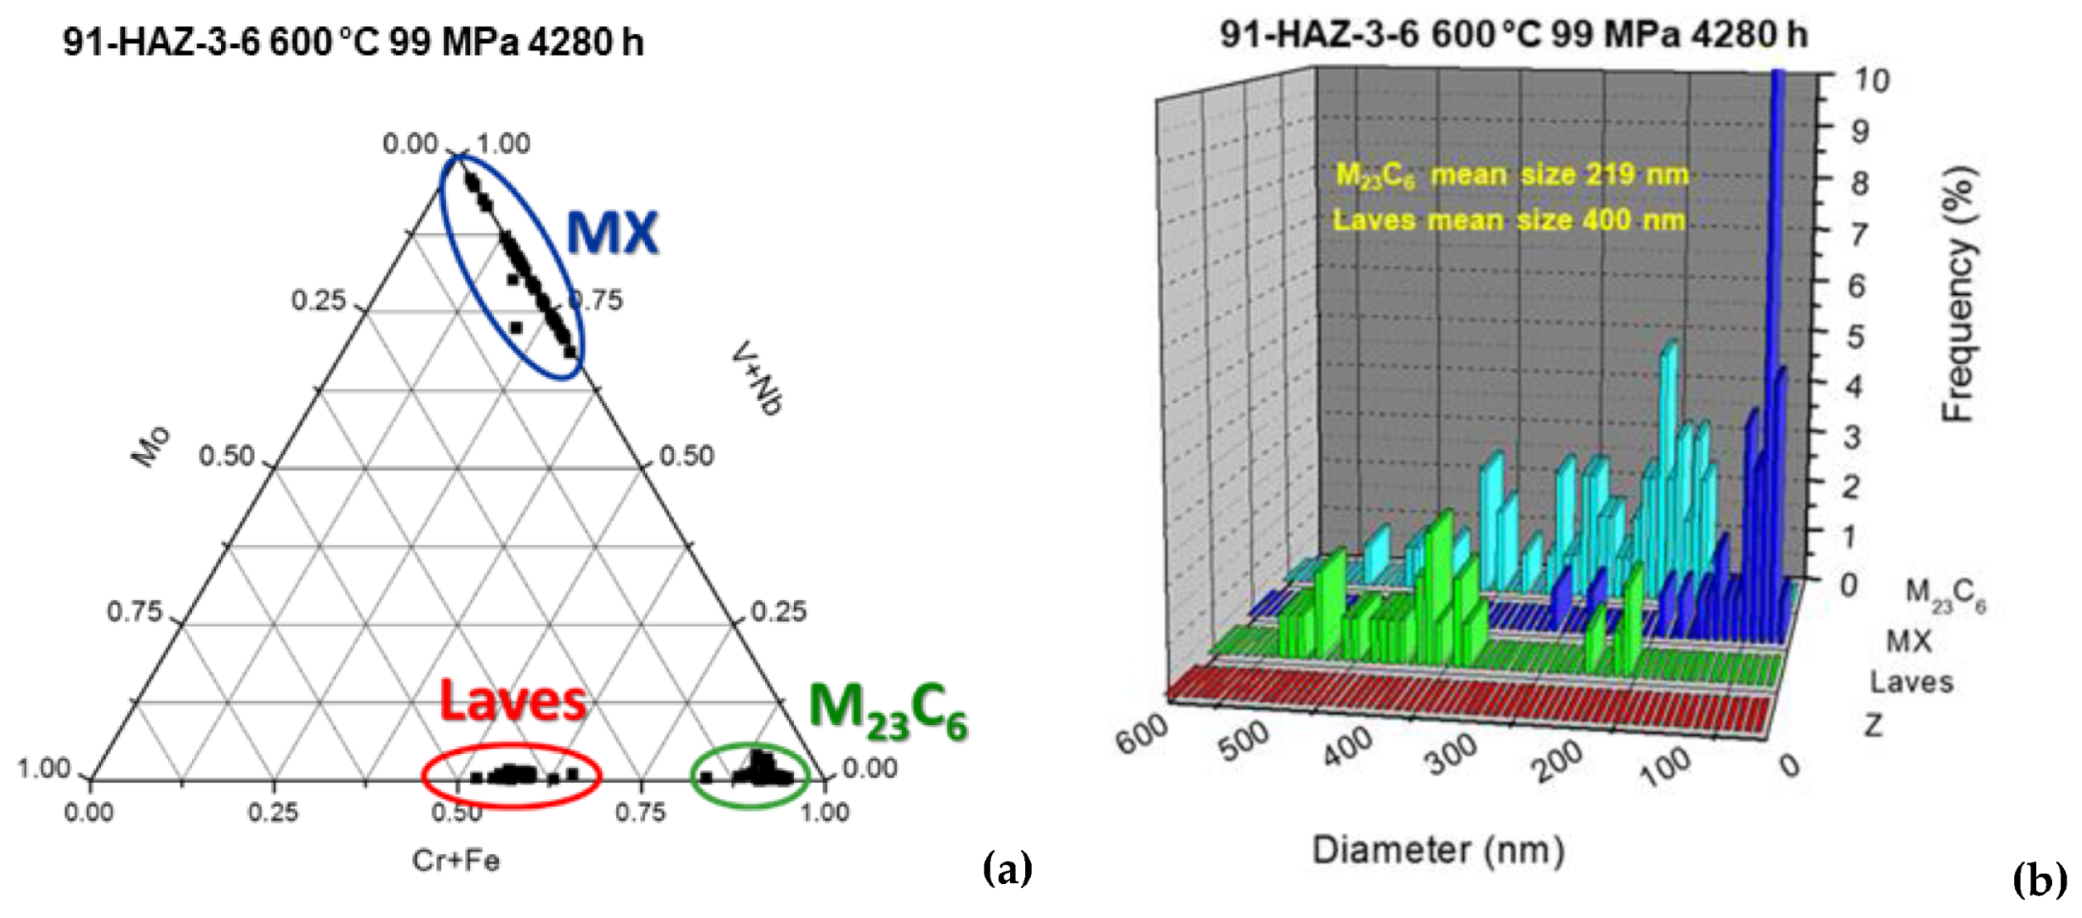
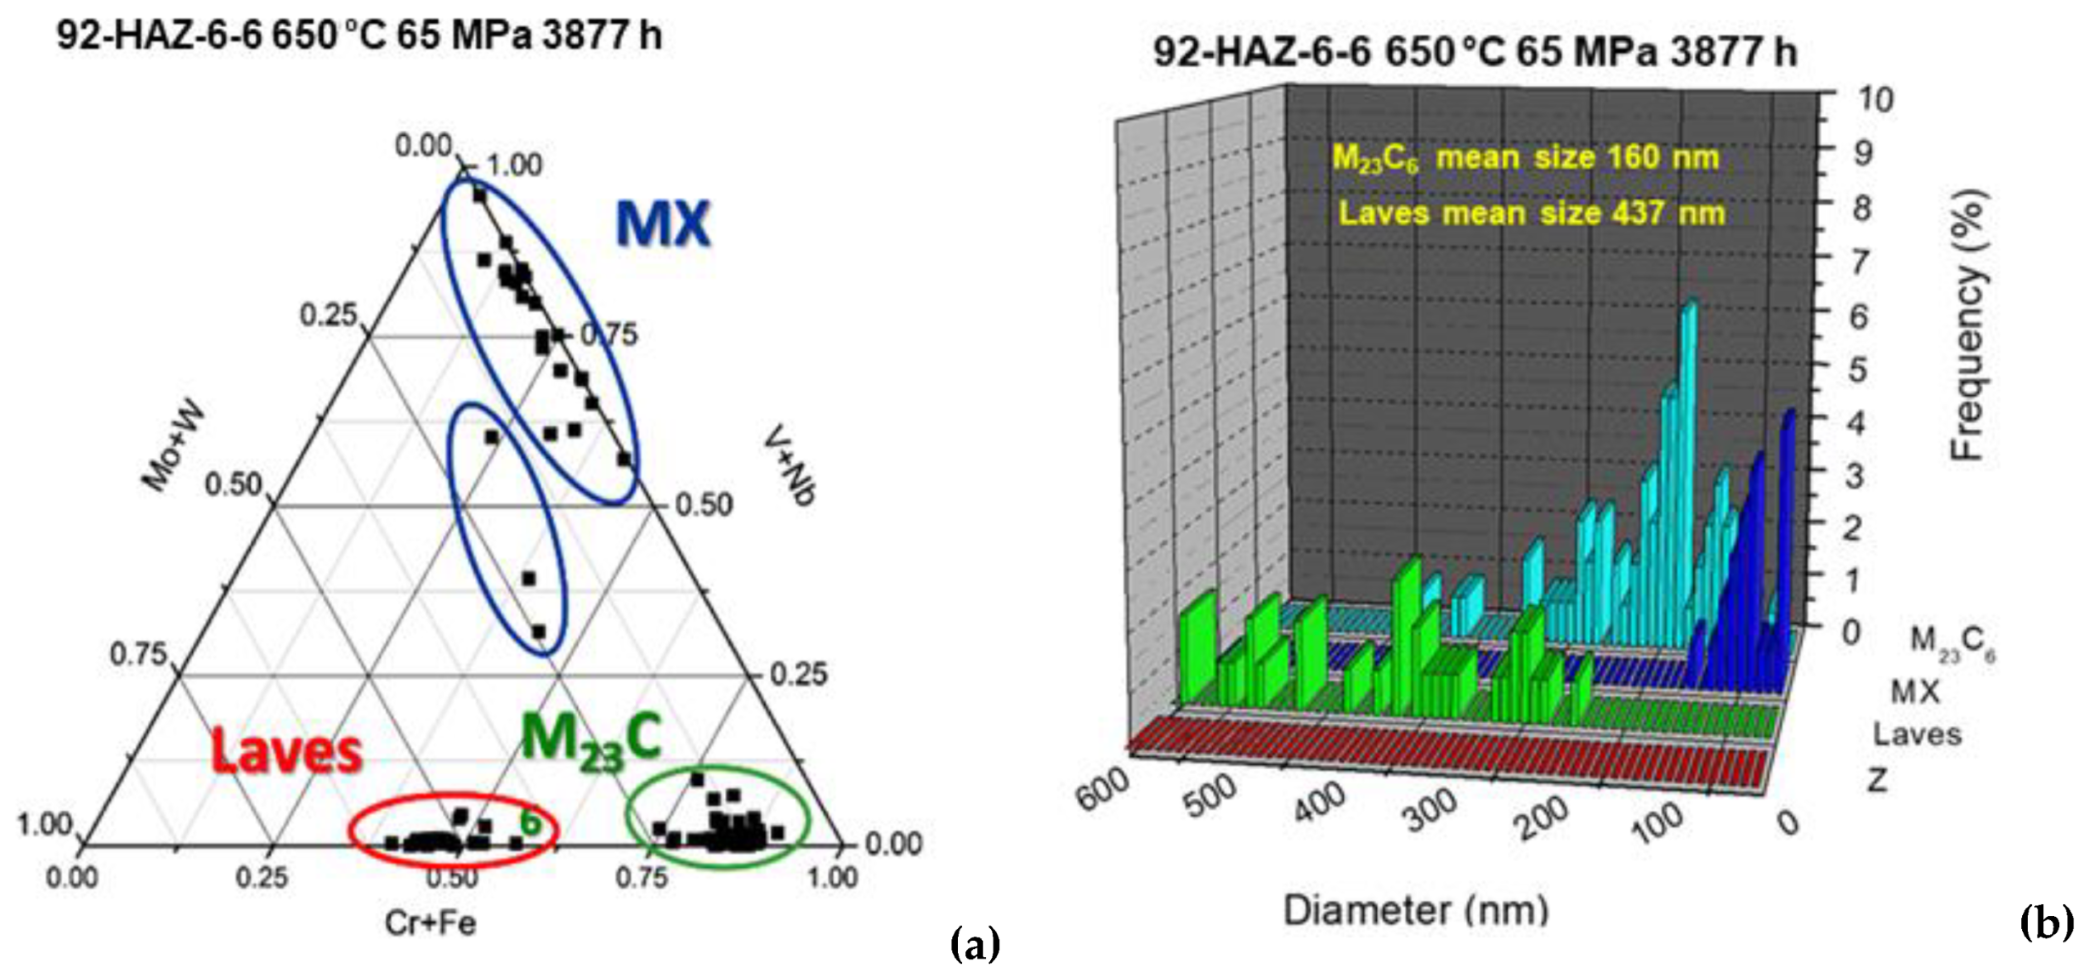
  • High-spatial-resolution microanalysis: The chemical composition of about 100 precipitates positioned on prior austenite grain boundaries, subgrain boundaries, recovered martensite lath boundaries, and within recovered martensite laths as well as subgrains is assessed by using high-spatial-resolution microanalysis (EDS). On the basis of element repartition, such as Cr, Fe, Mo, W, V, and Nb, different classes of precipitates are distinguished: M23C6, (Cr,Fe,W,Mo)-rich carbides; MX, V-rich, Nb-rich carbonitrides; Laves, Fe2 (W,Mo) phase (W,Mo)-rich; and Z nitride, (Cr,Nb,V)N phase (Cr,V,Nb)-rich.

3. Results

A collection of representative output data from the elaboration of XRD diagrams is reported in this section. For each sample, a set of data is given and includes the following:
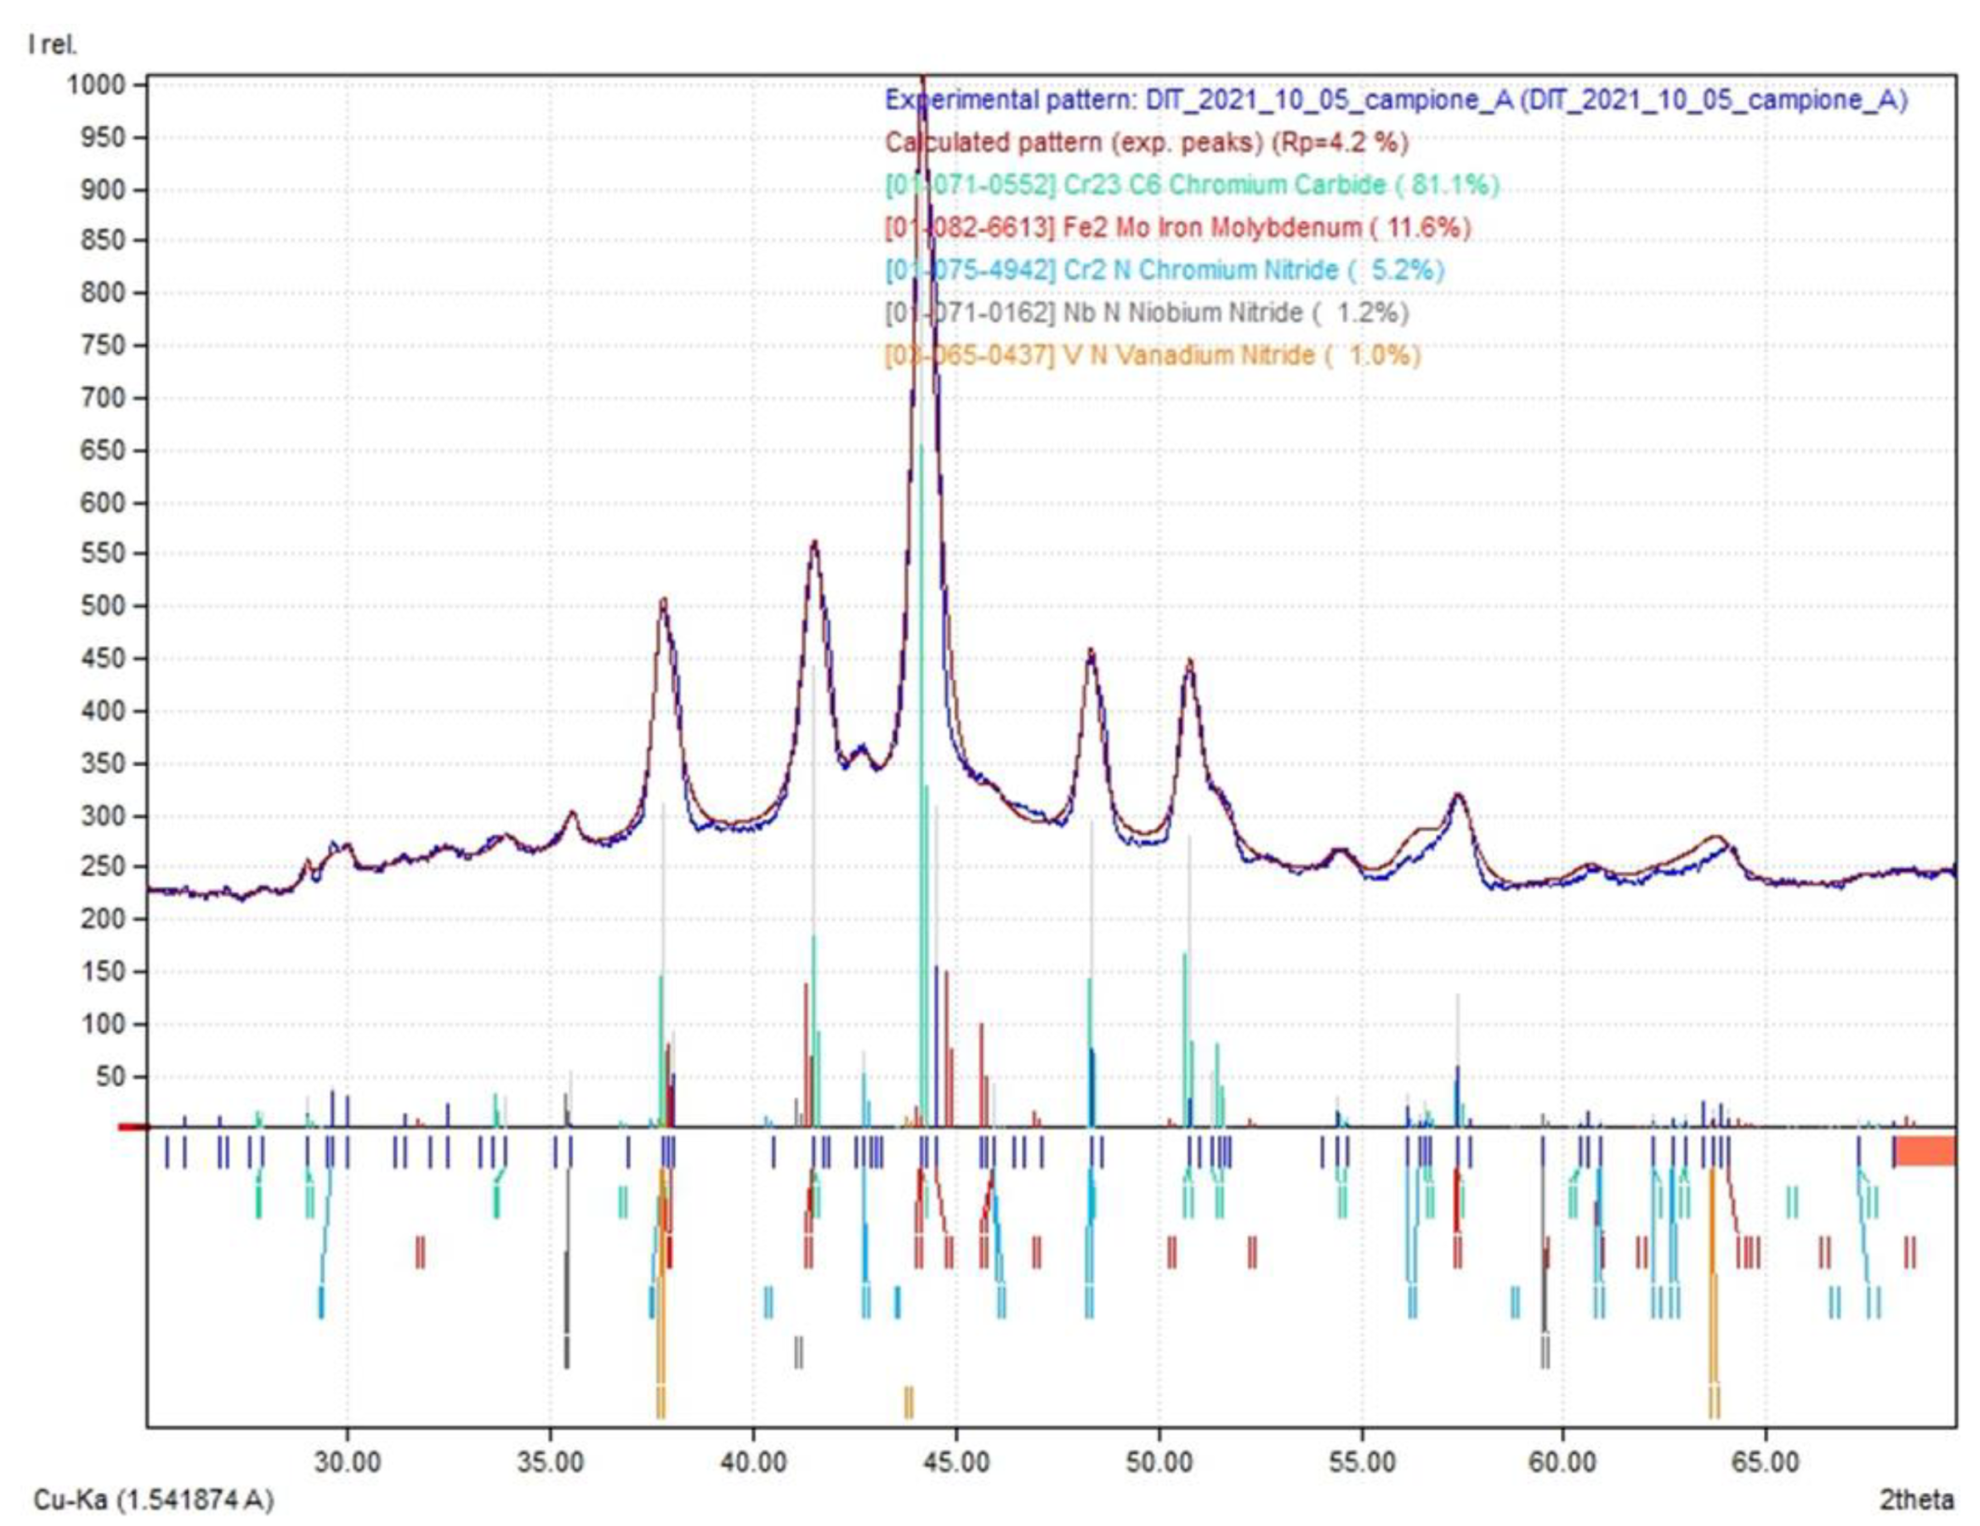
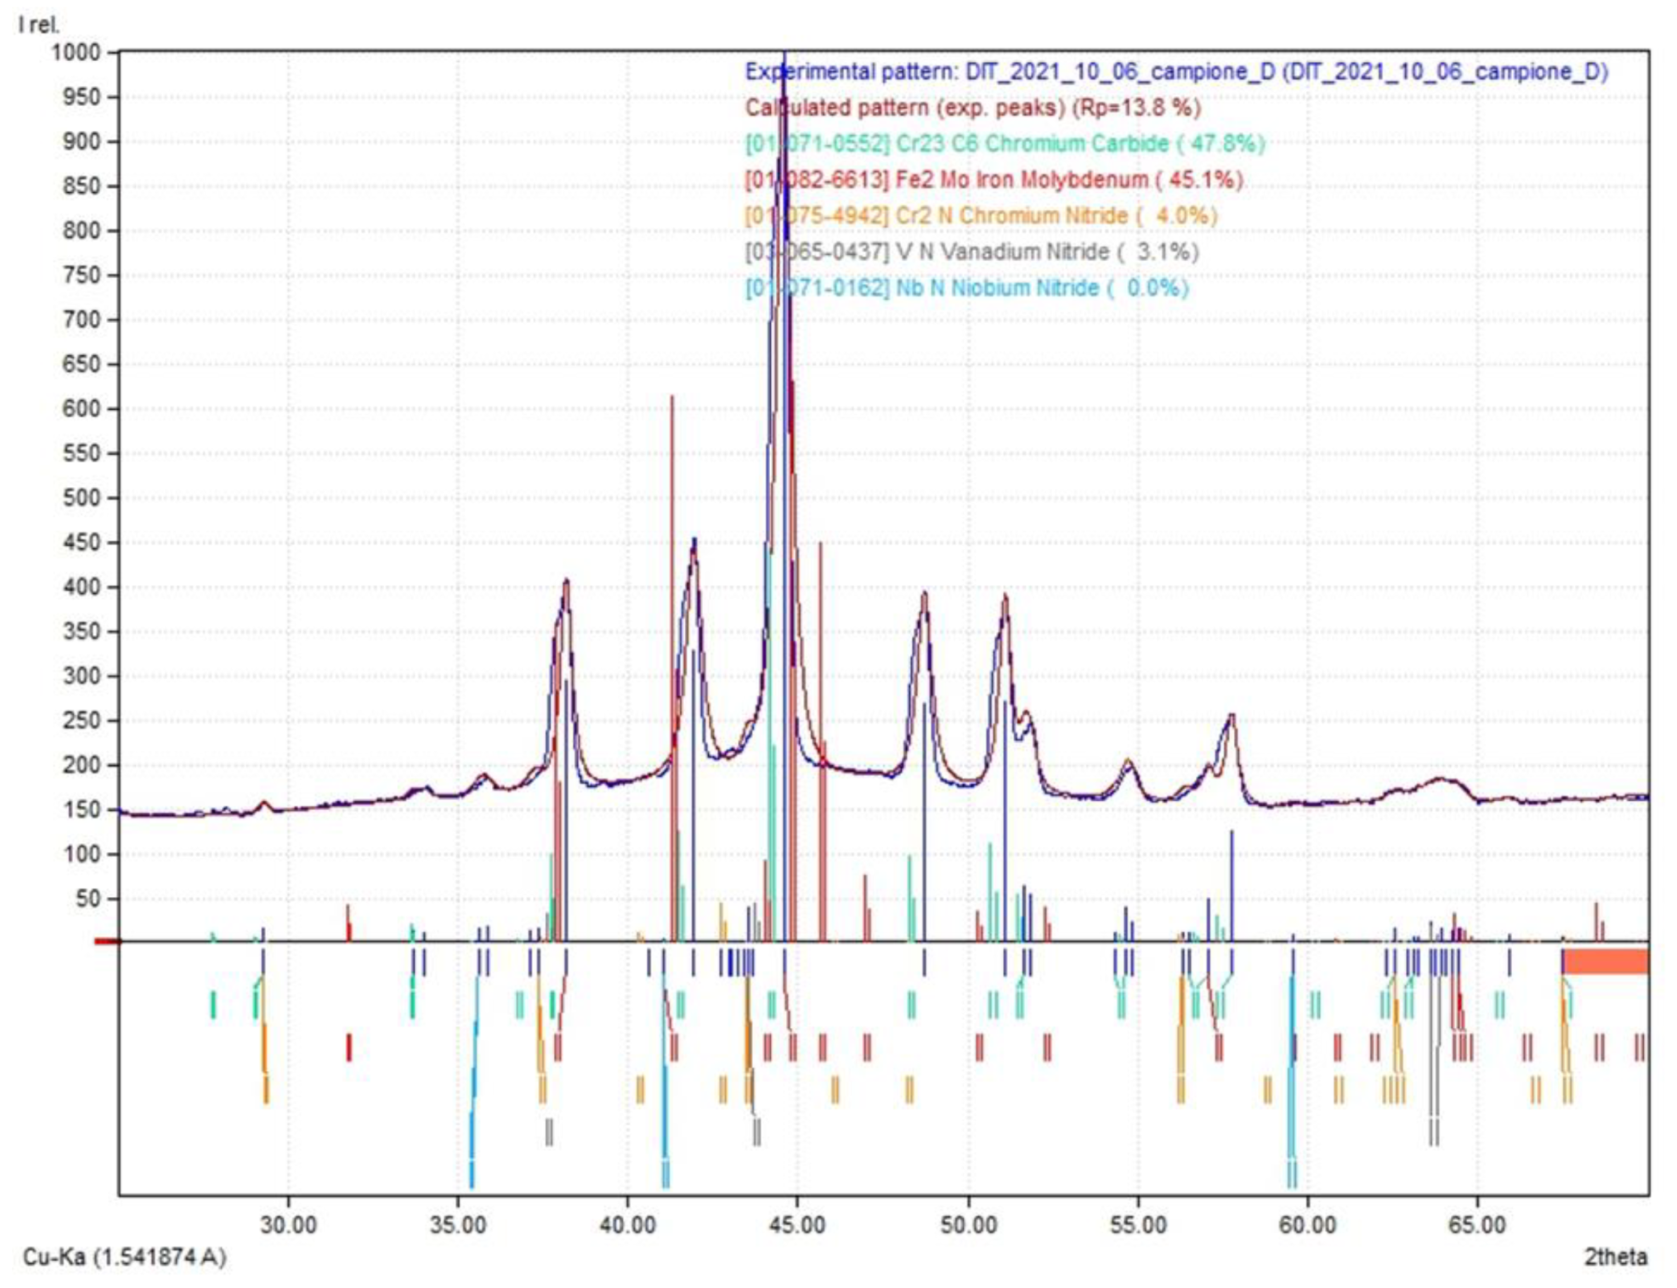
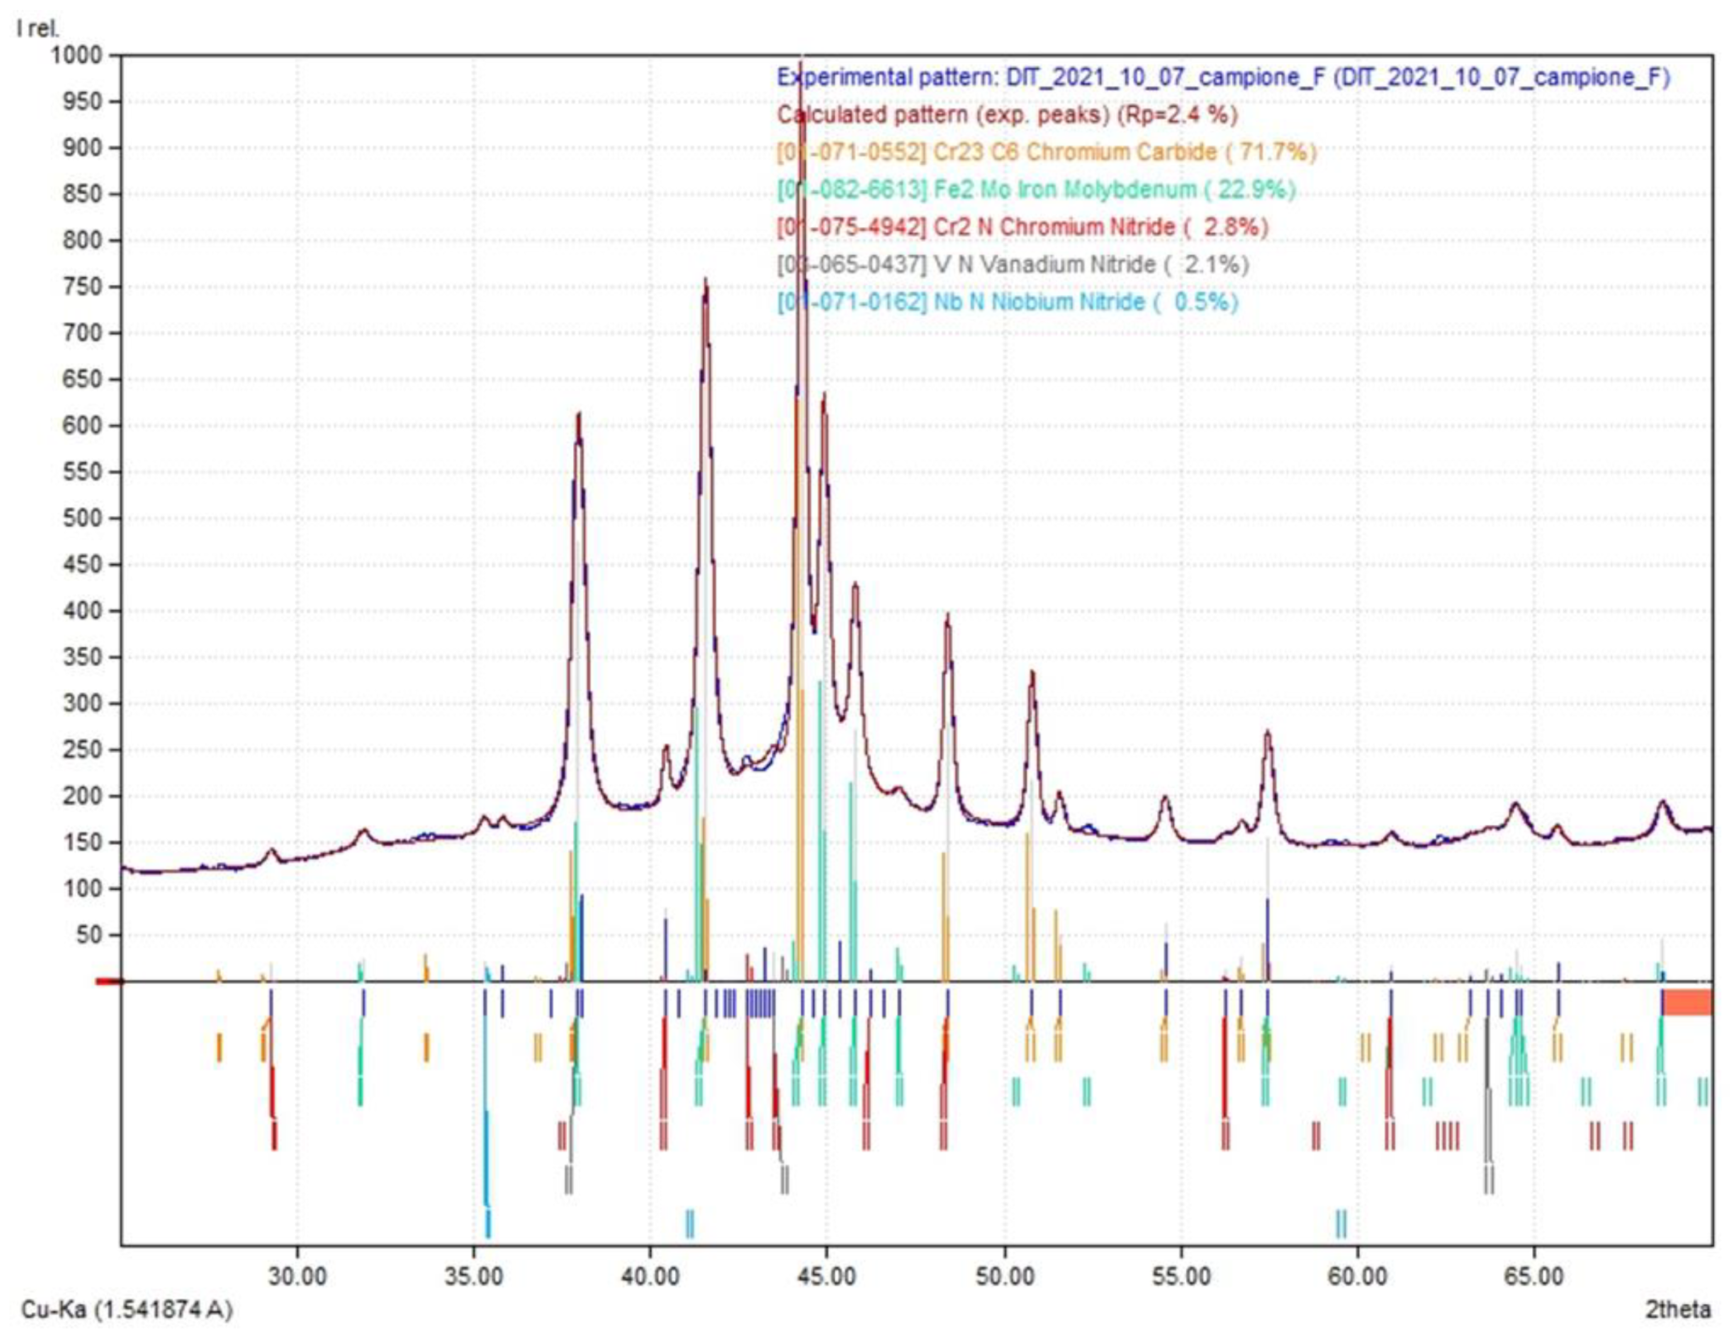
  • The XRD spectrum, calculated diffraction pattern, and matched phases associated with each peak intensity;
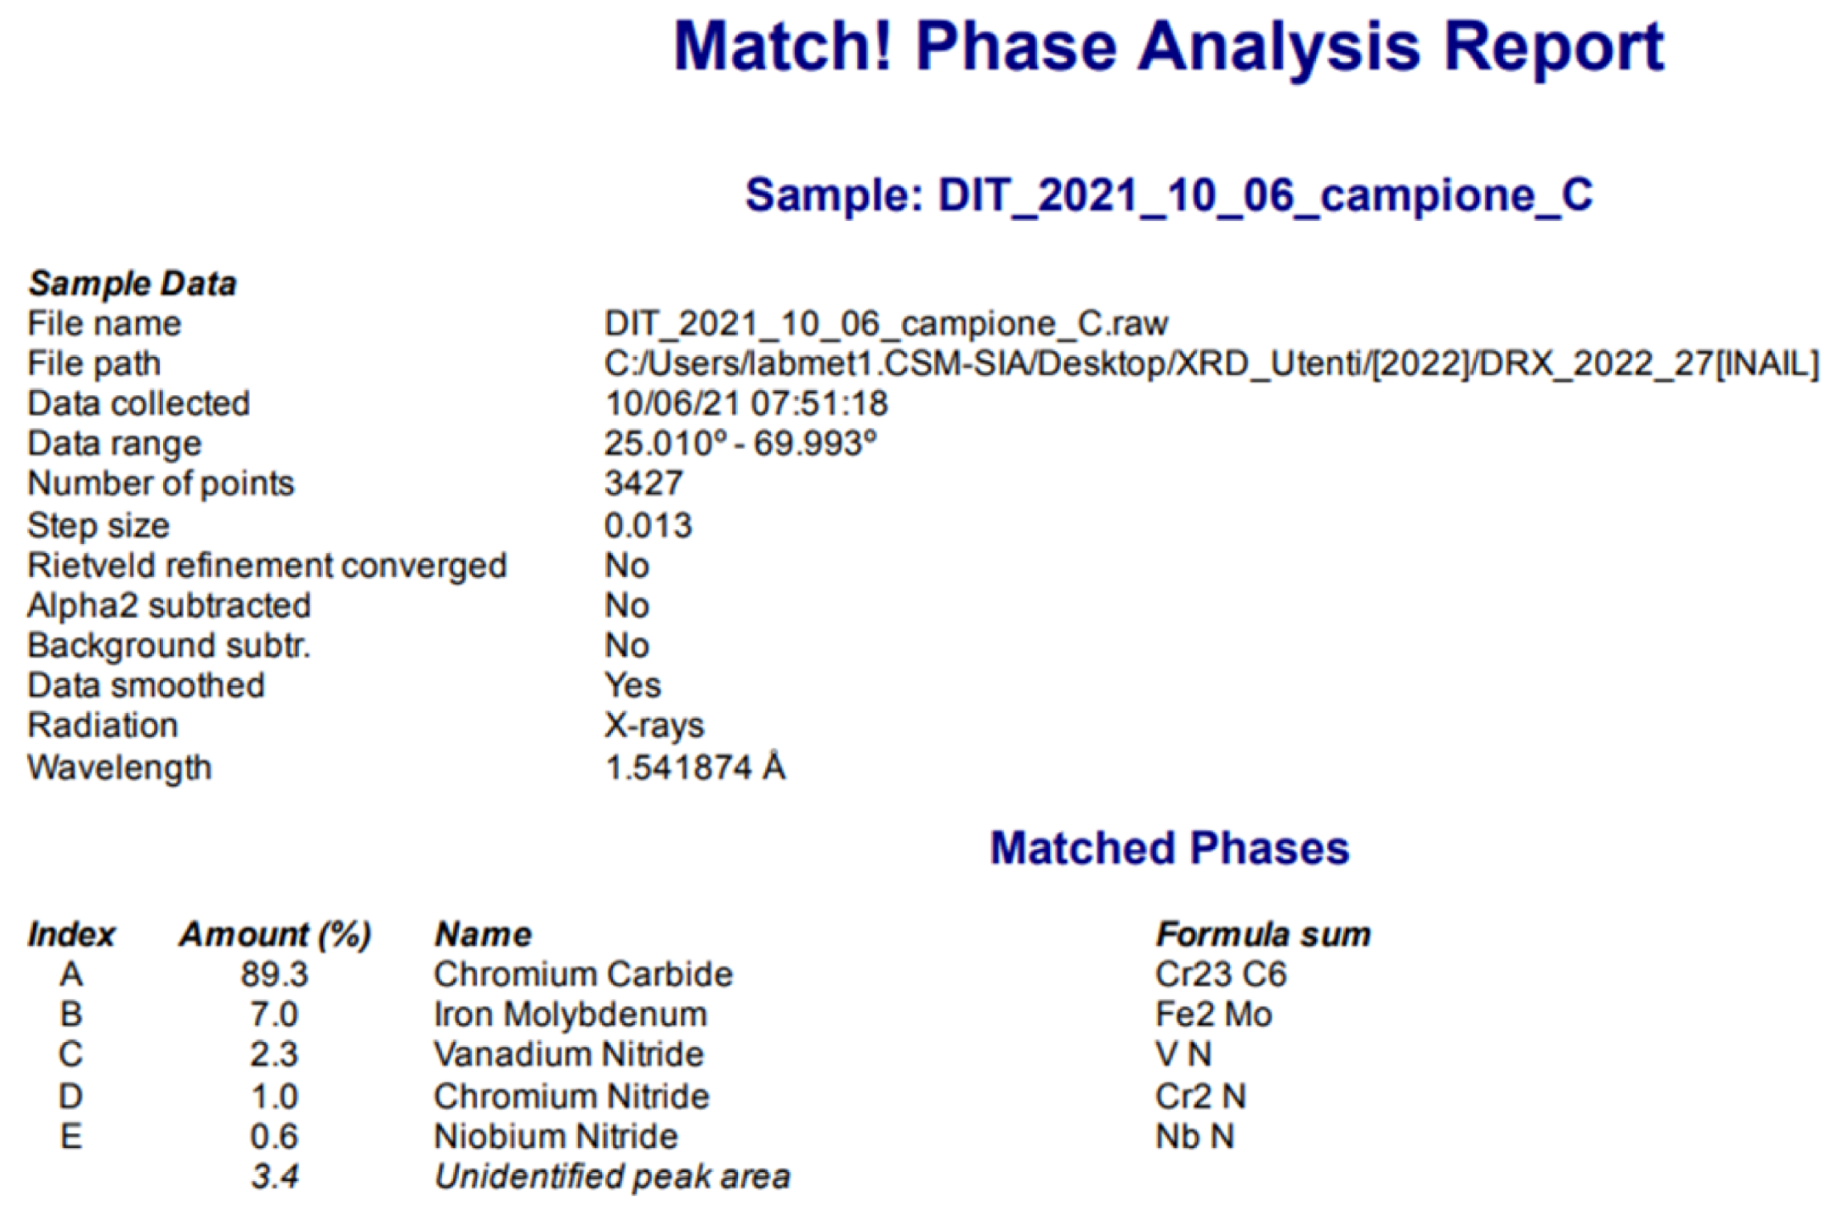
  • The Match Phase Analysis Report;
  • The evaluation of the partition of matched phases (amount %) given in the Match Phase Analysis Report;
  • The comparison with data obtained by extraction replicas and TEM analyses.

3.1. Results of the Tests Performed on Grade 91 HAZ

In the following figures (Figure 4, Figure 5, Figure 6, Figure 7, Figure 8 and Figure 9) the output of the tests performed on the first specimen is reported; it is the output of subproject N°3: GR 91 HAZ CREEP, failed crept cross-weld specimen 91-HAZ-3-1 550 °C 200 MPa 4395 h (sample A). A comparison of XRD vs. TEM is also reported.
The matched phases were as follows:
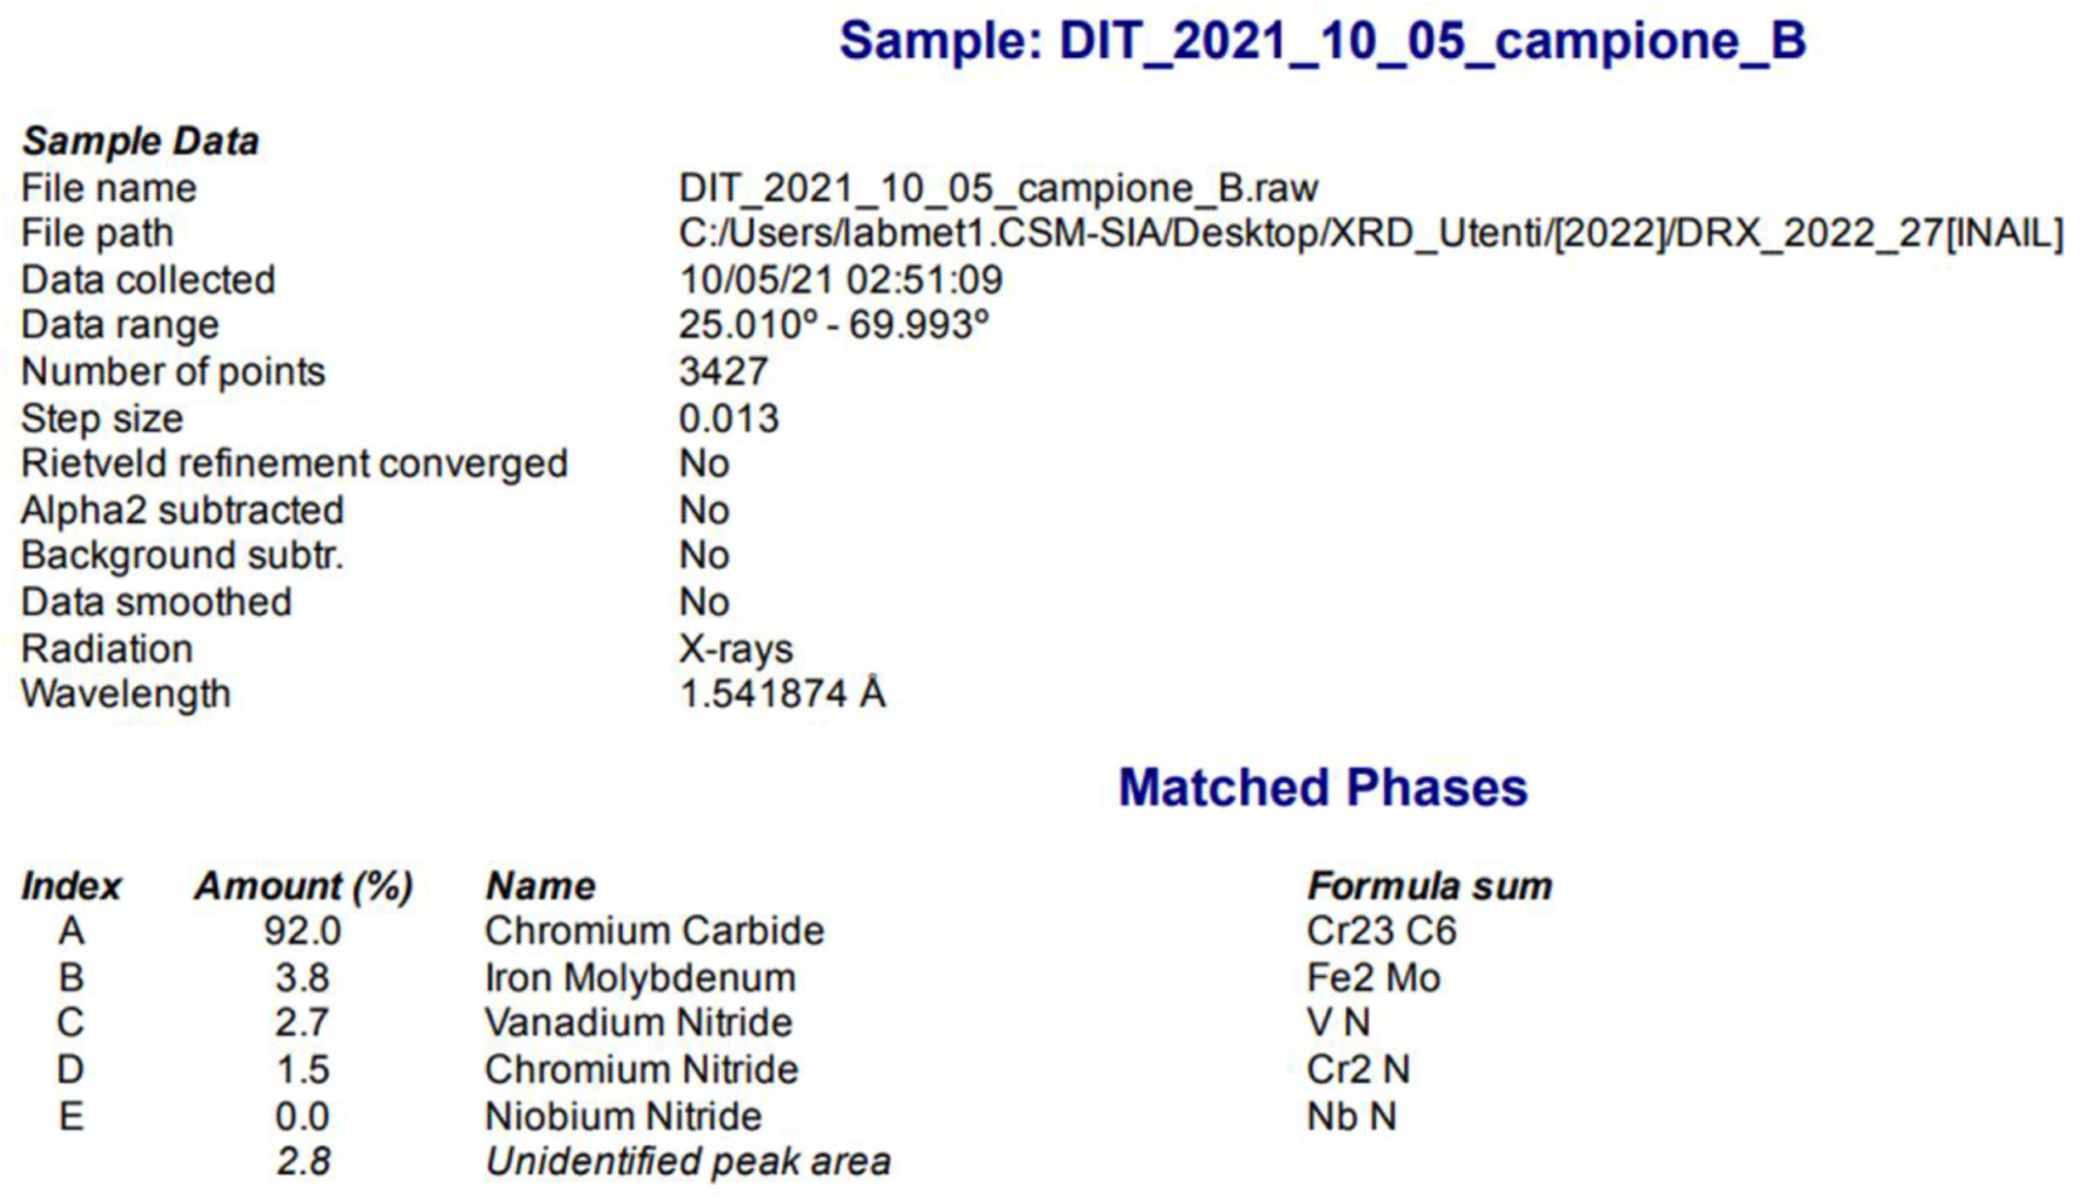
  • Chromium carbide, Cr23C6 (81.1%);
  • Iron molybdenum, Fe2Mo (11.6%);
  • Chromium nitride, Cr2N (5.2%);
  • Niobium nitride, NbN (1.2%);
  • Vanadium nitride, VN (1.0%);
  • Unidentified peaks (0.6%).
The results of the tests performed show that, through XRD and a TEM, it is possible to identify the same precipitates. We can note the absence of the Z phase by XRD as well as by the TEM. Additionally, the M23C6, Laves phase, and MX are identified by both methods. The data obtained by the TEM are more detailed, as we can identify the size of the precipitates as well as the frequency of each set of particles. By TEM-EDS the chemical elements are recognized, such that the precipitates are clearly identified (this was not possible by the size measurements, as we have found overlapping in the size of M23C6 and Laves phases, as is demonstrated by the size distribution diagram). The number of particles examined by XRD was 3427 (points), while the number of particles examined by TEM-EDS was 120. The quantitative analyses were characterized by different values:
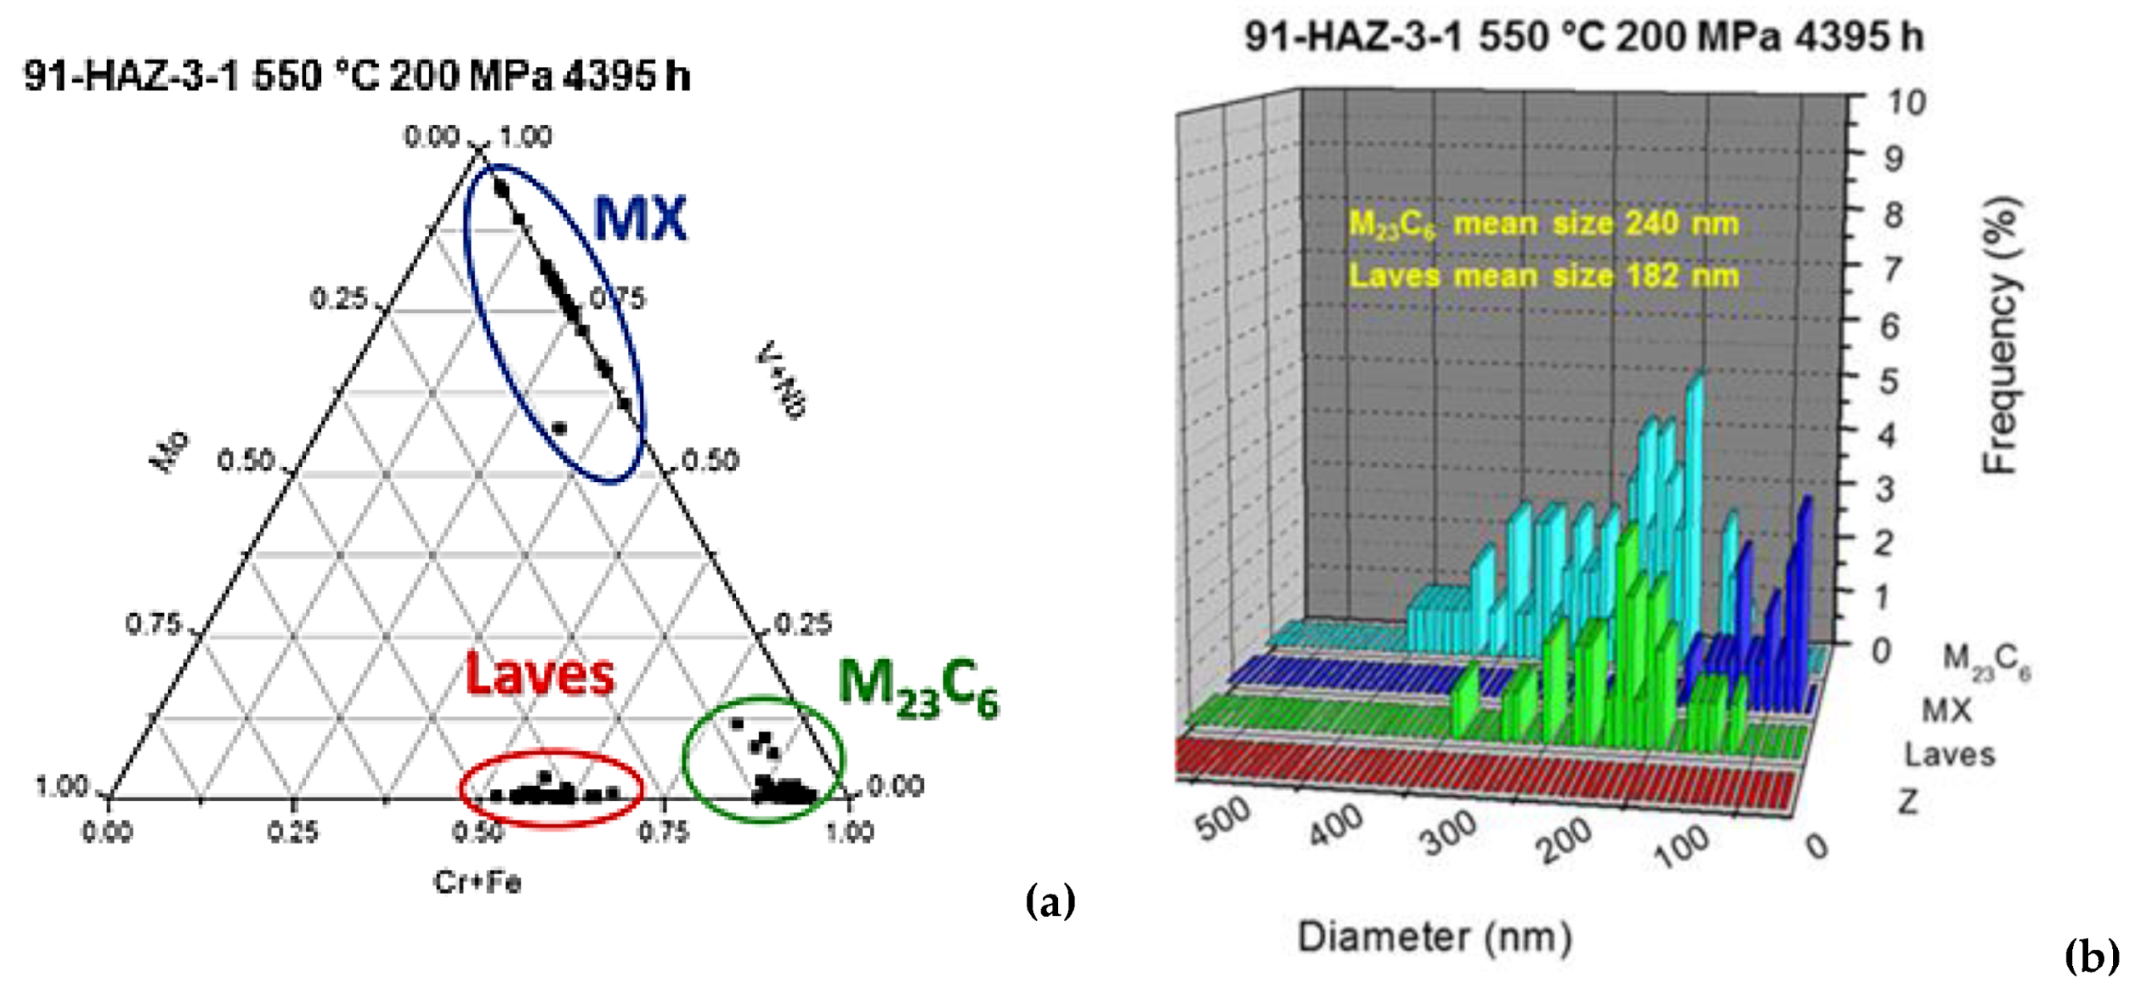
  • By XRD: more than 81% of M23C6, around 2% MX, and 12% Laves phases;
  • By the TEM: 60% M23C6, around 23% Laves phases, and 17% MX.
In the same project (subproject N°3) we obtained similar outputs from the test performed at 650 °C (the highest testing temperature). In this case, the sample failed earlier: just after 2072 h. In Figure 10, Figure 11 and Figure 12 these results are showed: failed crept cross-weld specimen 91-HAZ-3-8 650 °C 61 MPa 2072 h (sample D). There is not a very good fitting between the calculated diffraction pattern and XRD spectrum. The TEM analysis (Figure 11) also does not fit with the pattern. Therefore, the amount of iron molybdenum (Laves phase) is overestimated. It was suggested to repeat the XRD analysis.
The matched phases were as follows:
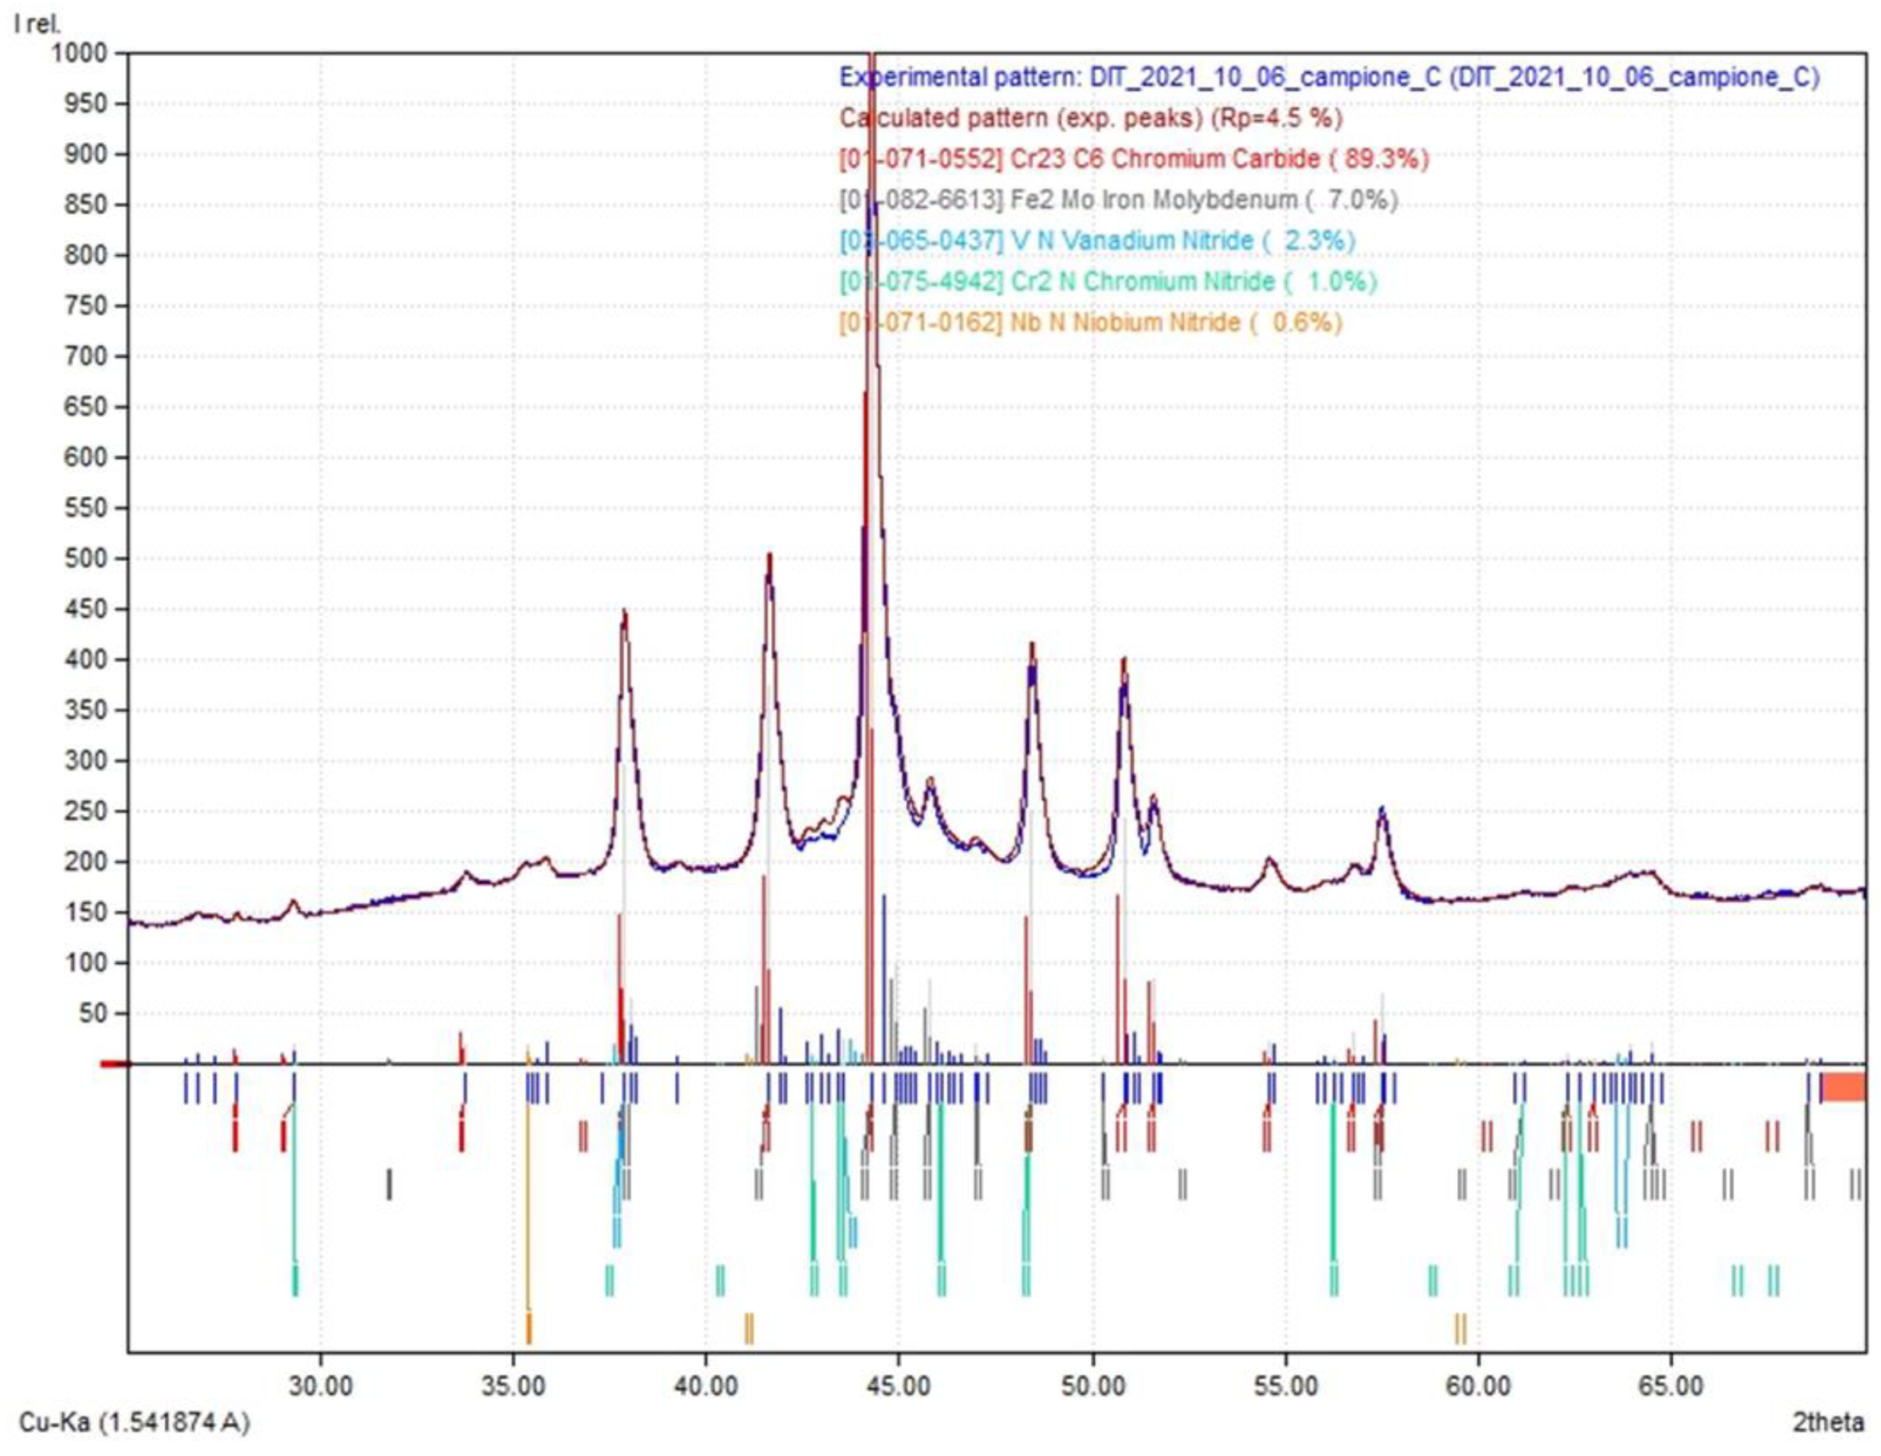
  • Chromium carbide, Cr23C6 (47.8%);
  • Iron molybdenum, Fe2Mo (45.1%);
  • Chromium nitride, Cr2N (4.0%);
  • Vanadium nitride, VN (3.1%);
  • Unidentified peaks (3.4%).
These results showed that XRD and the TEM identified M23C6 and MX, while XRD identified a large amount of Laves phases that was not confirmed by the TEM. The main size of M23C6 was similar to that revealed by the specimen 91-HAZ-3-1. The number of particles examined by XRD was 3427 (points), as was the case for the previous specimen, while the number of particles examined by TEM-EDS was 136. The actual presence of unidentified peaks (3.4%) is also noted, being much higher than the amount found in the specimen 91-HAZ-3-1 (0.6%).

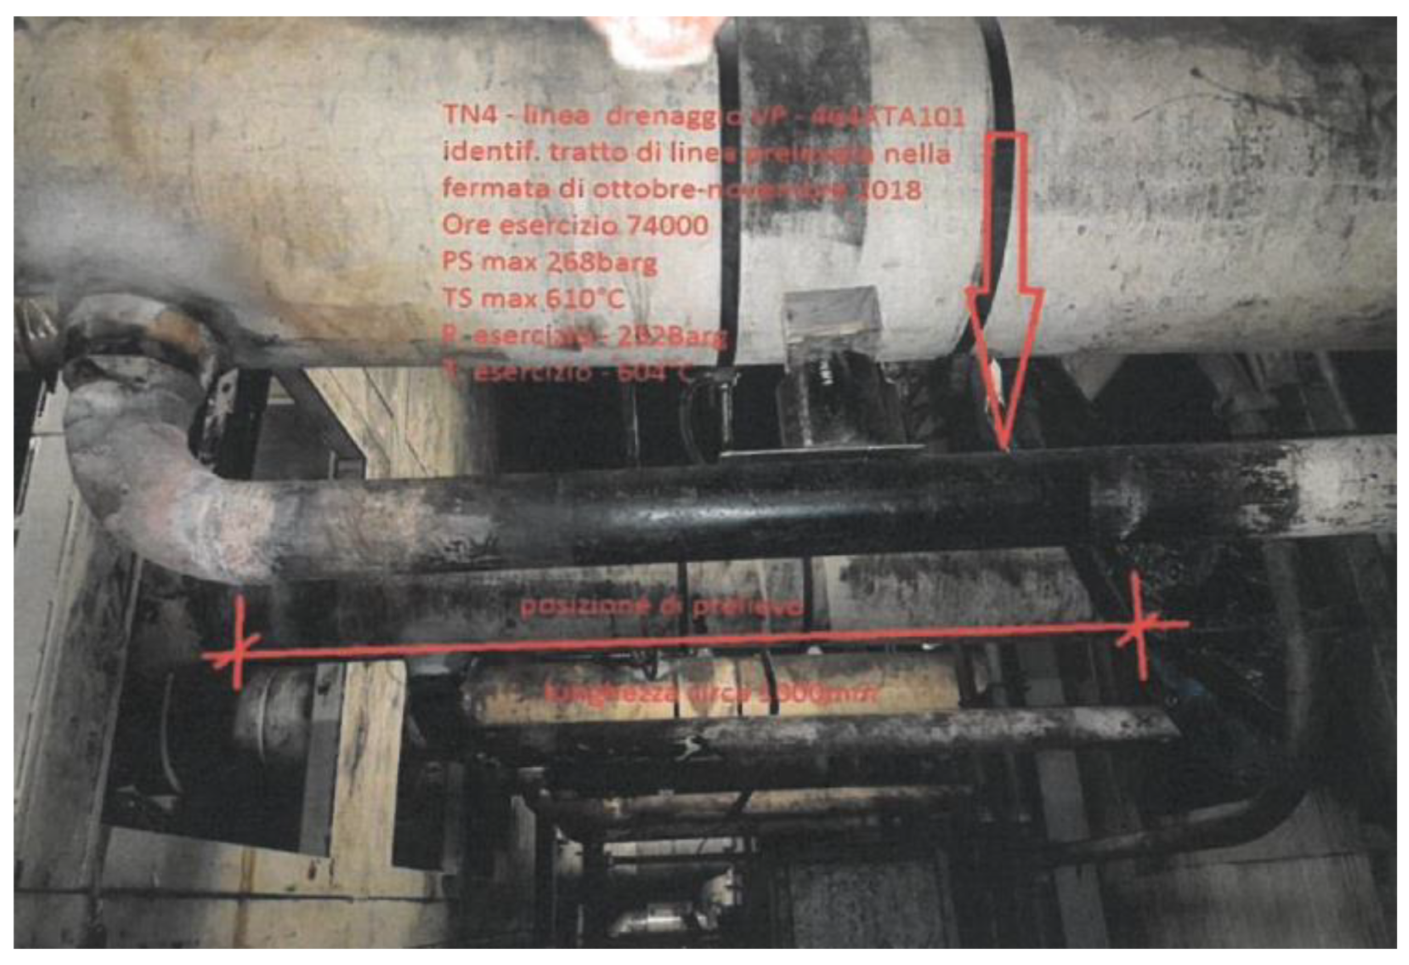
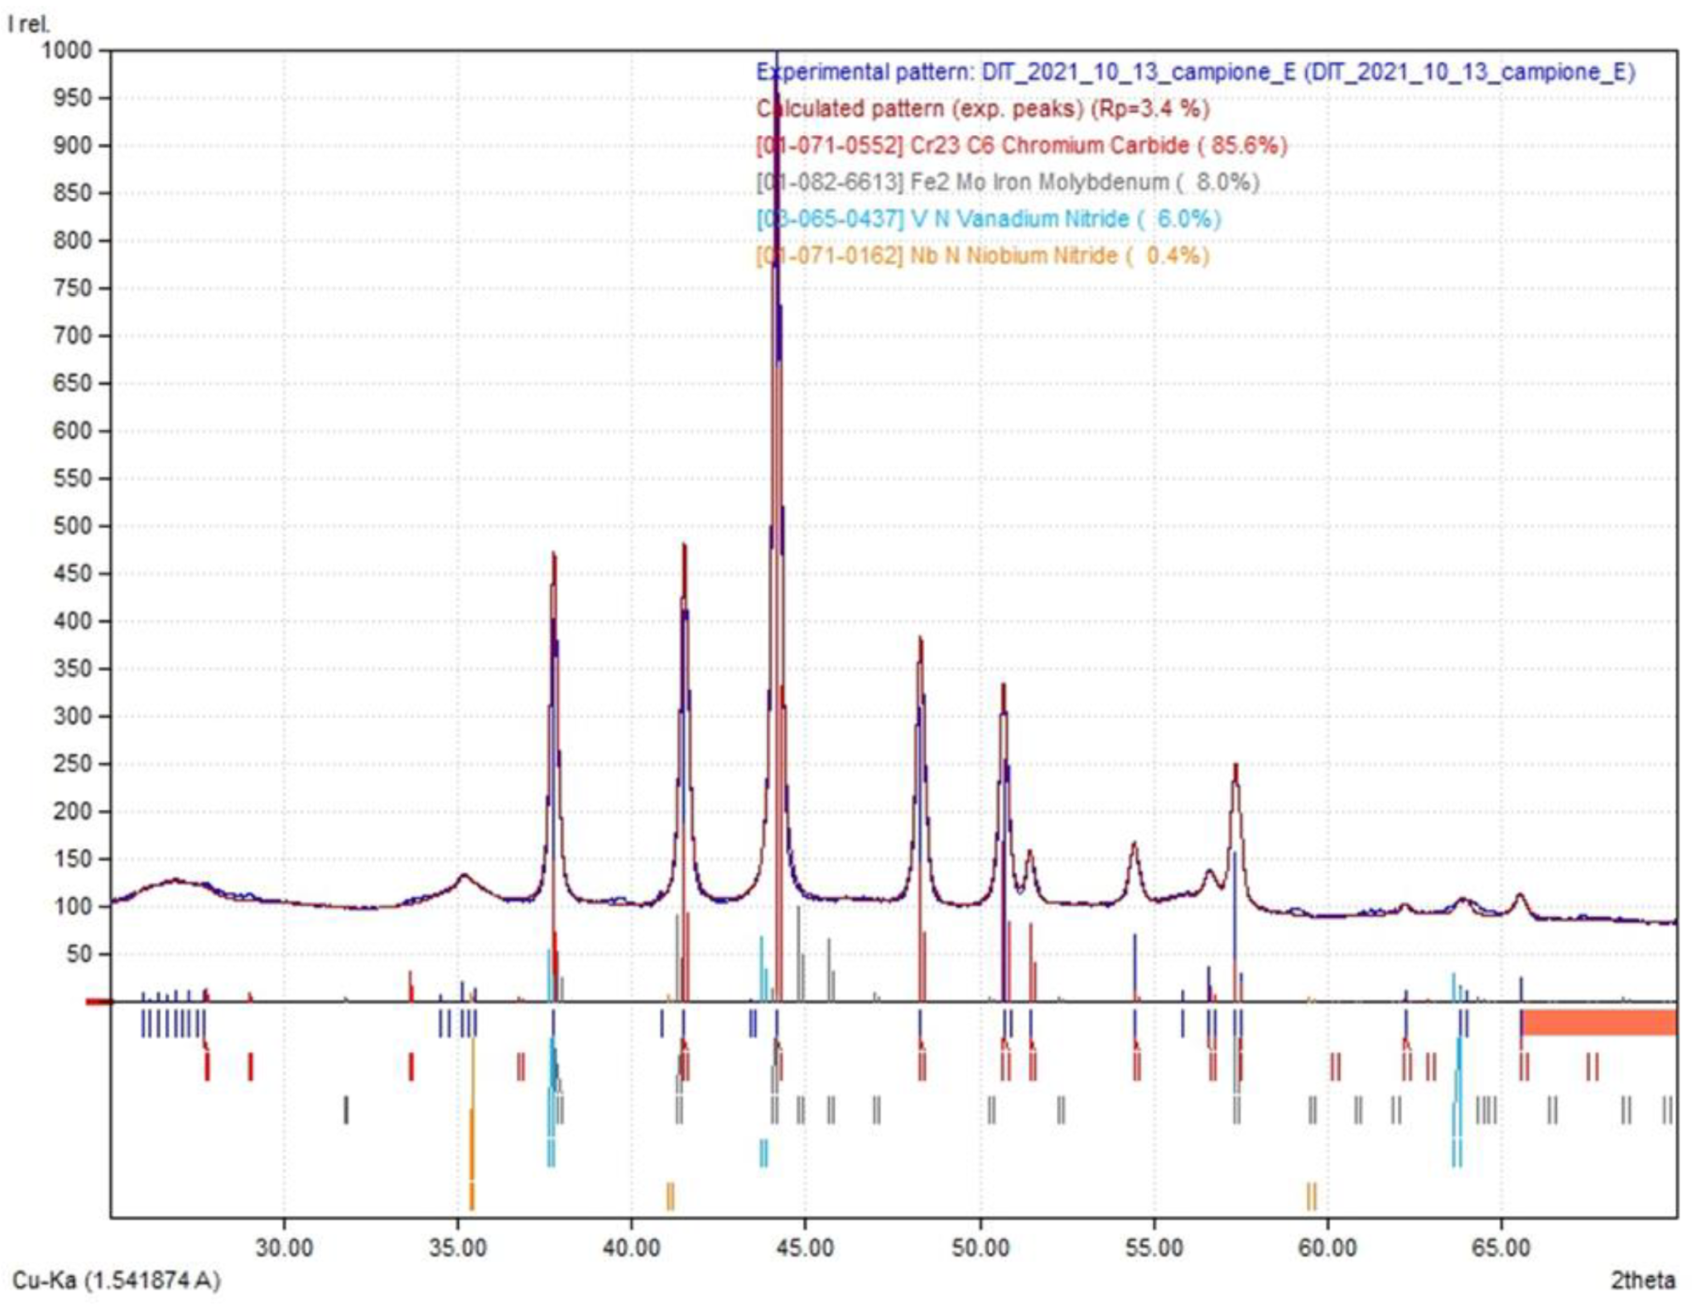
3.2. Results of the Tests Performed on Ex-Service Grade 92

Subproject N°1 also included ex-service material: GR 92 exposed-92-EX-1-2 (92 BM 604 °C 43 MPa 74,001 h) (sample E). The maintenance activity and related reparations in a power station allowed us to obtain some used material, such as this sample, extracted from an ex-service header (Figure 13).
In the following tables (Table 9 and Table 10), its chemical analysis and mechanical properties are reported.
The results are reported in Figure 14, Figure 15, Figure 16 and Figure 17.
The matched phases were as follows:
  • Chromium carbide, Cr23C6 (85.6%);
  • Iron molybdenum, Fe2Mo (8.0%);
  • Vanadium nitride, VN (6.0%);
  • Niobium nitride, NbN (0.4%);
  • Unidentified peaks (3.5%).
The results of the tests performed show the same precipitates by XRD and the TEM. Additionally, in this case the Z phase was not revealed by XRD or the TEM. M23C6, Laves phases, and MX were recognized by both methods. By the TEM, the size of the precipitates was measured, as was the frequency of each set of particles. The number of particles examined by XRD was the same (3427 points), while the number of particles examined by TEM-EDS was 140. This is not a failed crept specimen, as the original tube was cut during service, but the precipitates were similar to those found in the failed specimen. The quantitative analyses were instead characterized by different values:
  • By XRD: more than 80% M23C6, few MX and Laves phases;
  • By the TEM: 46% M23C6, around 25% Laves phases and MX.
The actual presence of unidentified peaks (3.5%) was also noted.

3.3. Results of the Tests Performed on Grade 92 HAZ

The results obtained by subproject N°6 are also reported. In the following figures (Figure 18, Figure 19 and Figure 20), the most representative of the project are included; subproject N°6 is GR 92 HAZ CREEP, and this is the failed crept cross-weld specimen 92-HAZ-6-1 600 °C 152 MPa 2516 h (sample F).
The matched phases were as follows:
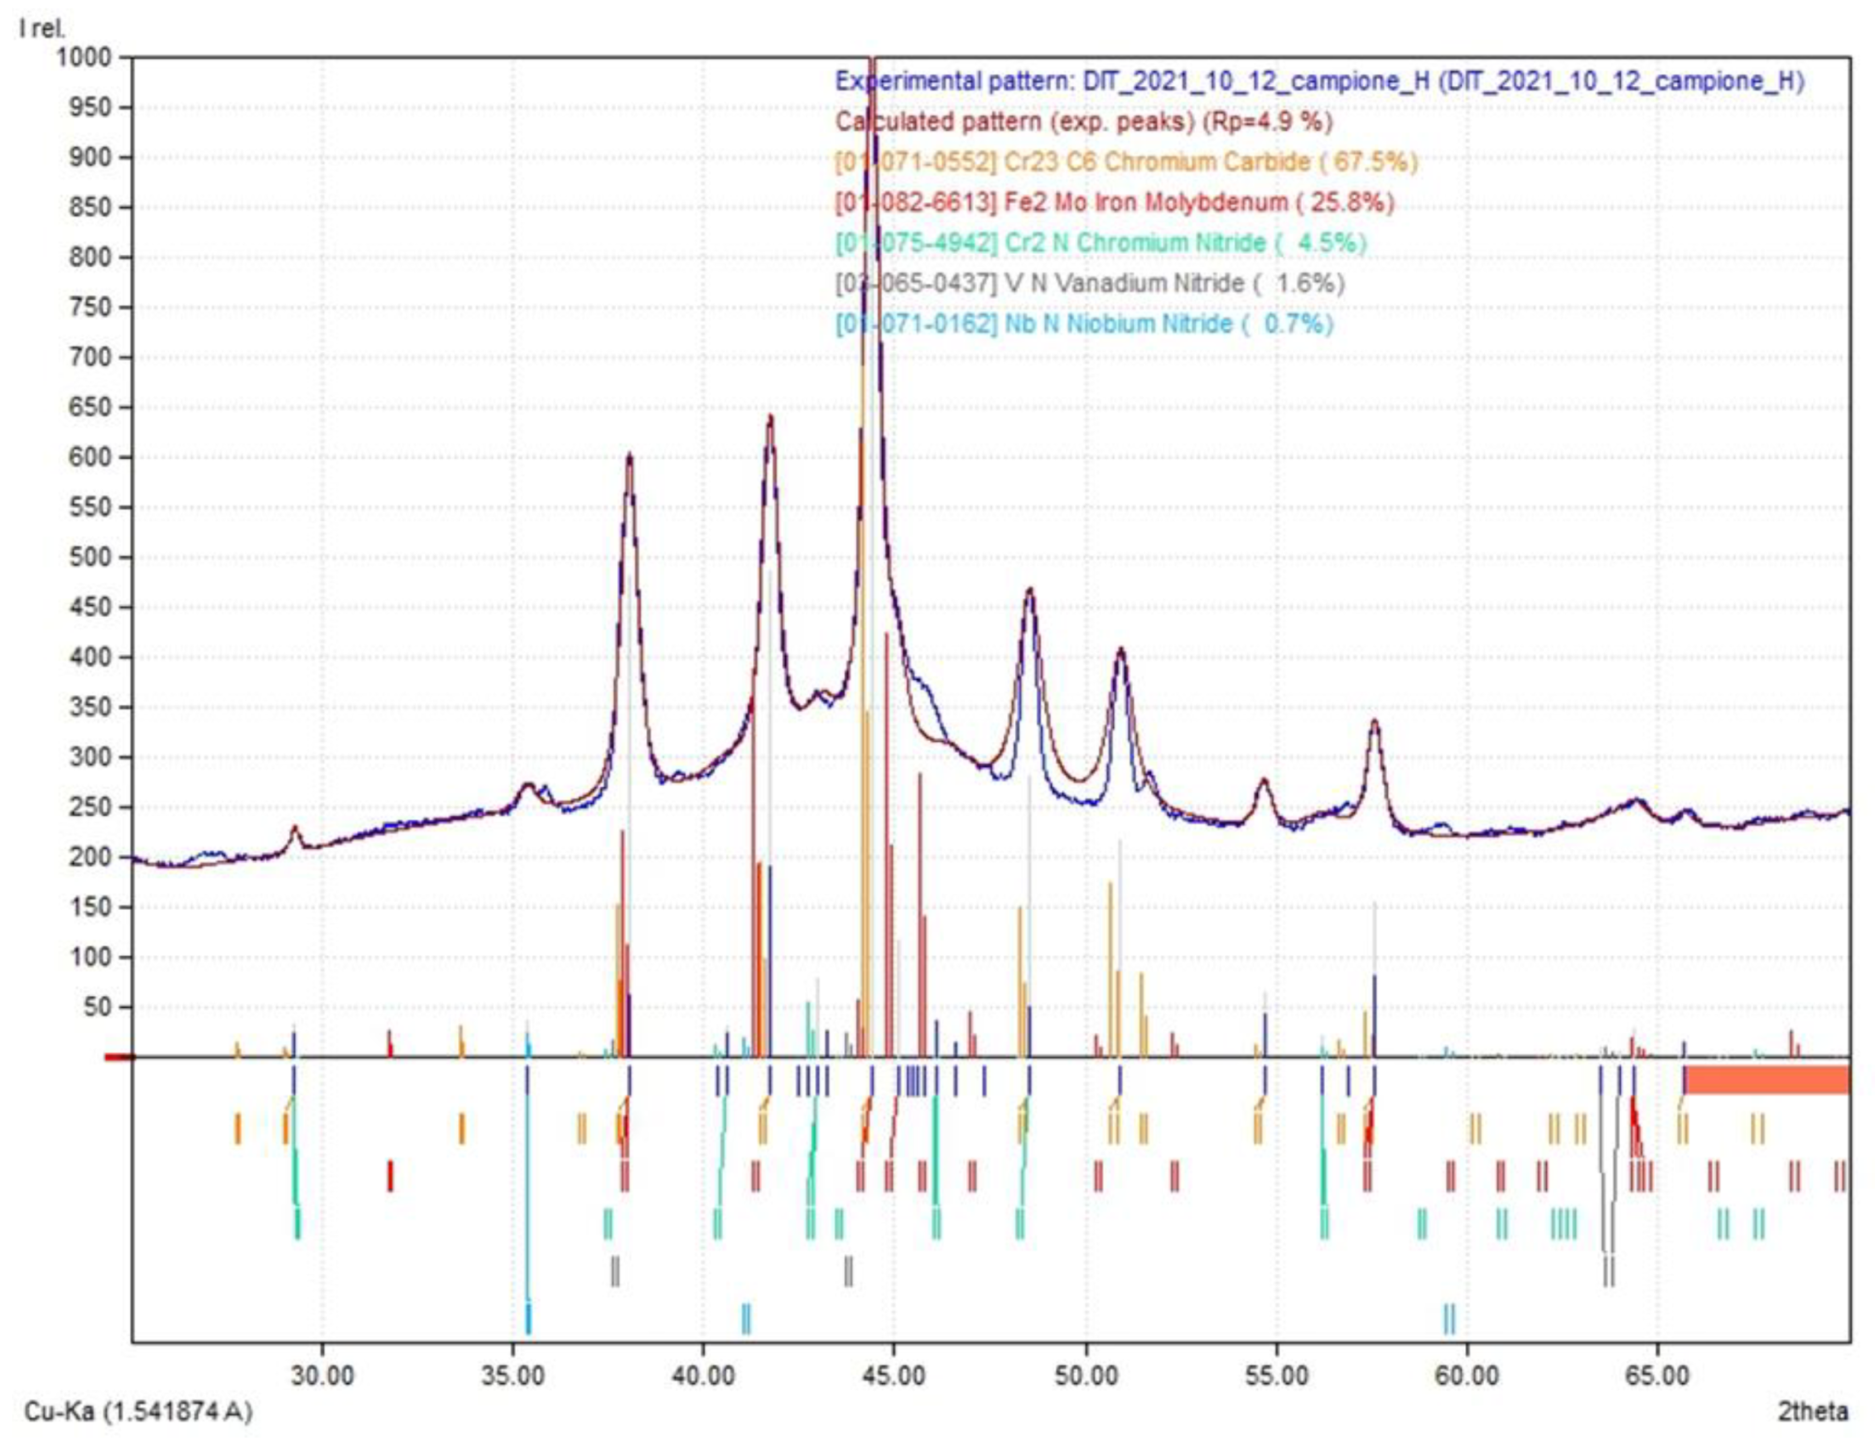
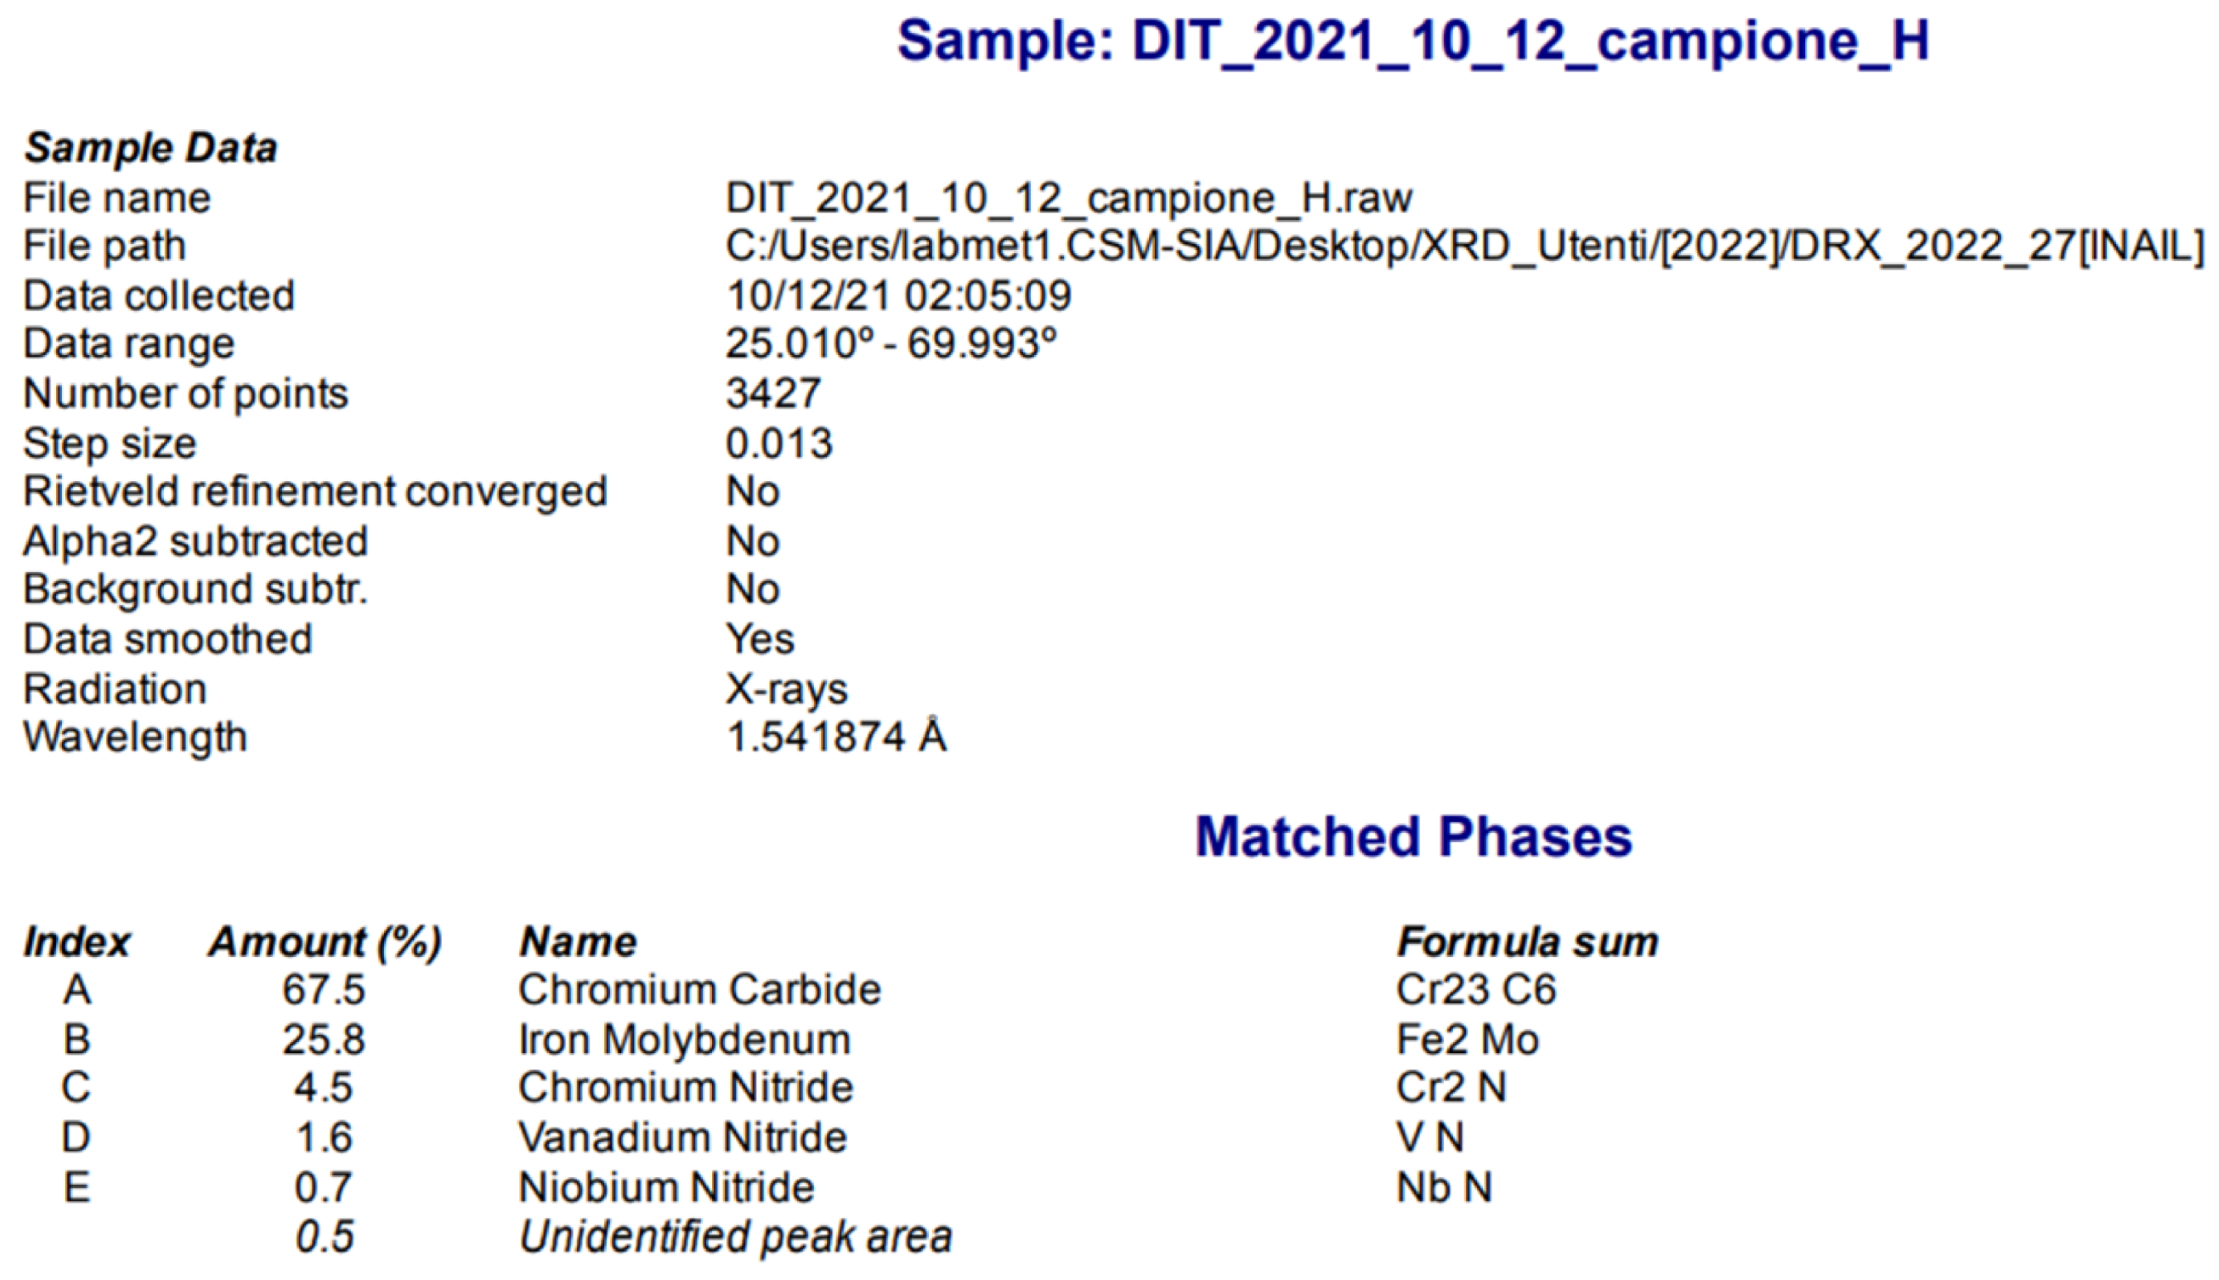
  • Chromium carbide, Cr23C6 (71.7%);
  • Iron molybdenum, Fe2Mo (22.9%);
  • Chromium nitride, Cr2N (2.8%);
  • Vanadium nitride, VN (2.1%);
  • Niobium nitride, NbN (0.5%);
  • Unidentified peaks (3.2%).
Additionally, in this case the precipitates found by XRD are also included in the outcomes from the TEM analysis. The number of points examined by XRD was the same (3427 points), while the TEM-EDS analysis was related to 153 precipitates. XRD recorded a higher percent of M23C6 (71%), while the TEM found around 1/3 M23C6, 1/3 MX, and 1/3 Laves phases.
The amount of unidentified peaks (3.2%) is also high in this case.
The following is the Grade 92 sample tested with a higher temperature (650 °C) and the maximum load for this grade, which is the failed crept cross-weld specimen 92-HAZ-6-5 650 °C 78 MPa 4616 h (sample G, Figure 20, Figure 21, Figure 22 and Figure 23).
The matched phases were as follows:
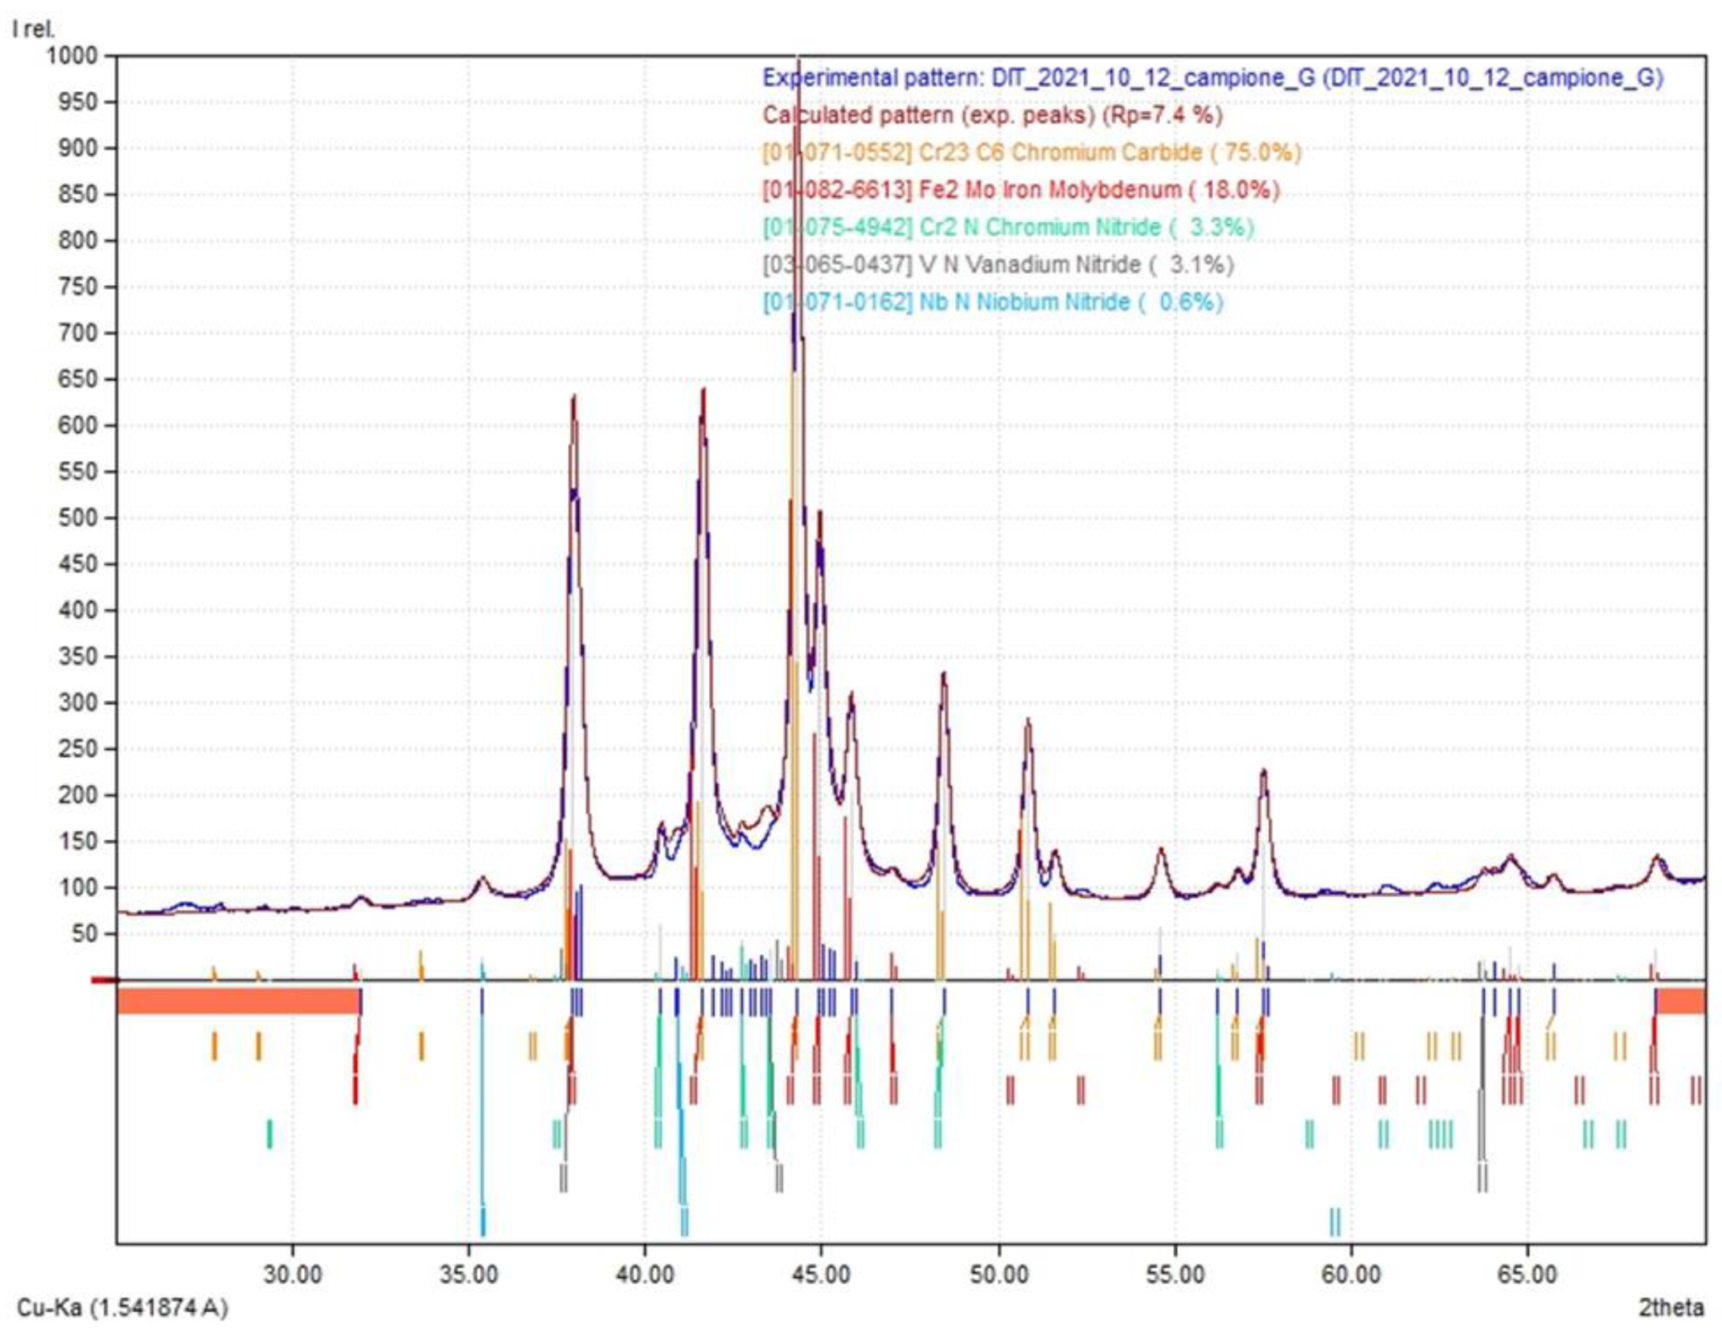
  • Chromium carbide, Cr23C6 (75.0%);
  • Iron molybdenum, Fe2Mo (18.0%);
  • Chromium nitride, Cr2N (3.3%);
  • Vanadium nitride, VN (3.1%);
  • Niobium nitride, NbN (0.6%);
  • Unidentified peaks (7.0%).
The precipitates found by XRD are also included in the outcomes from the TEM analysis. The number of points examined by XRD was the same (3427 points), while the TEM EDS analysis was related to 126 precipitates. XRD recorded a higher percent of M23C6 (75%), while the TEM found around 54% M23C6, 14% MX, and 32% Laves phases.
The amount of unidentified peaks (7%) was higher than the amount found for the other specimens.

4. Discussion

We found a good agreement from the results of the XRD analyses and extraction replicas in terms of precipitates found; only in one case were the results not in agreement, and it was suggested to repeat the test. The XRD examinations always regarded 3427 points, as they were related to the same volume of material; the TEM-EDS analyses were instead related to 100–150 precipitates, depending on the area selected for scanning.
Due to the abovementioned difference, the quantitative analysis of XRD is different from that coming from the TEM. It should be noted that XRD can be less sensitive to some precipitates, such as the Z phase (which we did not find), and that the extraction replicas can also leave some of the biggest precipitates on the specimen. This was noted by comparison with the SEM examination also performed in the research.
It is also worth underlining that a TEM provides some information regarding the size of the precipitates that is not possible to obtain via an XRD analysis. The sizing of precipitates should be crucial for the life assessment of martensitic steels.
However, XRD analyses are a good fit for the life assessment of pressurized components manufactured using martensitic steels, as they can follow the evolution of all of the phases in these steels.
In regard to the reliability of XRD, the filtering step is a key step for the XRD method: the precipitates are carefully washed with ethanol to clear possible contaminations due to the original solution containing iron and chlorides. These contaminants can affect the results of XRD examinations, as their diffraction patterns are very wide and can cover the patterns of the precipitates. Another point that requires further investigation is the presence of unidentified peaks, up to 7%.
Further results are reported in Appendix A. They are related to the sample identified in the following tables (Table 11 and Table 12) that are not already shown in Section 3.
The results of XRD reported in these tables are qualitatively in agreement with the data obtained by TEM analyses. We can see that, for sample A, the percentage of M23C6 is 81% from the XRD analysis, while from the TEM (from the ternary diagram and from the size distribution diagram) it is 60% (the precipitates found in sample A are reported in Table 13).
The integration between electron microscopy and XRD was also reported by Di Nunzio [12], Korsunsky [22], and Cipolla [23]. The first also confirmed the martensitic material behavior, investigating similar materials. Cipolla [23] also provided an integrated study on the use of a TEM and XRD for the microstructure transformation of martensitic steels. It was confirmed [24] that exposure to temperatures in the range of 600 to 650 °C causes a reduction in MX and an increasing in second phases, which for higher temperatures can be represented by the Z phase.
This is also retrievable in studies on the use of electron microscopy and the use of other NDE methods with P91 [9,10,11,24].
Another issue is that we have not yet obtained a size distribution diagram by the XRD analysis; on the other hand, the matched phase summary can be obtained more easily.
The tests reported are related to failed samples, with the exception of the ex-service material. The results of the failed samples are all in good agreement, with the exception of sample D, for which the results of XRD showed around 50% of Laves phases while the TEM did not find them. At the end of their lives every sample showed a good percent of M23C6, some Laves phase, and few MX.
The present data are obtained from short-duration tests. We have now decreased the strength level and at the end of the project we will compare the results of the longer tests with the tests reported in this paper. We have foreseen performing an XRD analysis after every specimen failure, after the scheduled end of each creep test, or after 25,000 h. This sampling rate fits with our scope as it is in agreement with the other results we are collecting.
The current tests will continue during the next 4 years. All failed samples will be substituted with other samples and they will be submitted to a lower load, according to the ECCC recommendations for the selected rupture time, also taking into account the weld creep reduction factor (WCRF).
Having much more data, we will better investigate the sampling rate provided for the laboratory instrument that we are using. We will have more specimens with which to produce filtered powders to be submitted to XRD analyses; therefore, we will better address how sample preparation (the residual contaminants) affects XRD results. Some results are shown in [25], but they are only for thermally aged P91, without creep and without welds. This being the case, more data are needed to address this issue.
The preparation of the test, according to the procedure mentioned in the previous sections, is not difficult, but it requires good accuracy in order to avoid contaminants affecting the results. This can also explain the problem with the use of the portable instrument, which requires the inspection of the bulk material, without the possibility of filtering the contaminants.
We will also investigate the use of other testing techniques that can be appropriately used to determine the sizing of the phases, which are essential data for the life assessment of martensitic steel components. One of them is a scanning force microscope, which we have already started to set for these tests. We also mean to perform some other tests with miniaturized specimens, such as small punch creep testing (SPCT); it can be useful to compare the microstructure obtained by creep tests and the microstructure of actual components of high-temperature plants, from which we can cut a little specimen for SPCT.

5. Conclusions

The methodologies used to identify the evolution of the creep damage of martensitic steels cannot be aligned with the methodologies suitable for conventional carbon and alloyed steels, since the damage shows a particular trend that cannot be standardized in the method identified in UNI 11374:2010 (non-destructive testing–metallographic examination by means of replicas of creep-operated pressure equipment).
It is necessary to identify the most suitable NDT techniques for determining creep damage. Several methods seem very promising, even if the results are not yet completely comparable with TEM analyses on extraction replicas. XRD analyses promise to be one of the methods with which to identify precipitates in the microstructures of GR 91 and 92 steels.
The results of the XRD analyses were compared with the results of the extraction replicas:
  • Eight HAZ failed crept specimens were submitted to XRD examinations;
  • Eight XRD diagrams were produced and subsequently compared with twelve replicas for each specimen; that is, ninety-six extraction replicas were produced for this work;
  • Around 5000 precipitates were analyzed for each specimen, and an average of 120 precipitates were characterized with TEM-EDS analyses;
  • The possibility to perform a correct quantitative analysis was demonstrated by a comparison with extraction replicas, showing the same precipitates found by XRD as well as the same microstructure evolution: the decreasing in MX, the little decreasing in M23C6, and the increasing in Laves phases were noted after the conclusion of the creep tests and for the ex-service specimen exposed to 600 °C, 40 MPa, and 74,000 h;
  • The results obtained (the XRD diagrams) will be included in the P91 and P92 microstructure atlas, the final aim of this research activity.
It should be noted that, currently, XRD can provide good results in terms of the quantitative analysis of the precipitates, without the possibility of sizing them. On the other hand, XRD can provide a full analysis of a given volume, including all of the precipitates that can be found in this volume.
This work will continue with all of the specimens currently under creep tests.

Author Contributions

Conceptualization, A.T. and P.D.B.; methodology, A.T.; software, P.D.B.; validation, A.T. and P.D.B.; formal analysis, A.T.; investigation, P.D.B.; resources, A.T. and P.D.B.; data curation, A.T.; writing—original draft preparation, A.T.; writing—review and editing, A.T.; visualization, A.T.; supervision, A.T.; project administration, A.T.; funding acquisition, A.T. All authors have read and agreed to the published version of the manuscript.

Funding

This research received no external funding.

Institutional Review Board Statement

Not applicable.

Informed Consent Statement

Not applicable.

Data Availability Statement

Data are available upon request to the authors.

Acknowledgments

The authors acknowledge the support of Dario Venditti, Susanna Matera (RINA Consulting—Centro Sviluppo Materiali) and Francesco Rizzo (Sapienza University) for their contributions to this paper: providing the XRD spectra, matching the phases and for the graphical support (Francesco Rizzo).

Conflicts of Interest

The authors declare no conflict of interest.

Appendix A

This appendix includes the results of the analyses performed on every sample that were not previously shown in Section 3.

Appendix A.1. Subproject N°3: GR 91 HAZ CREEP

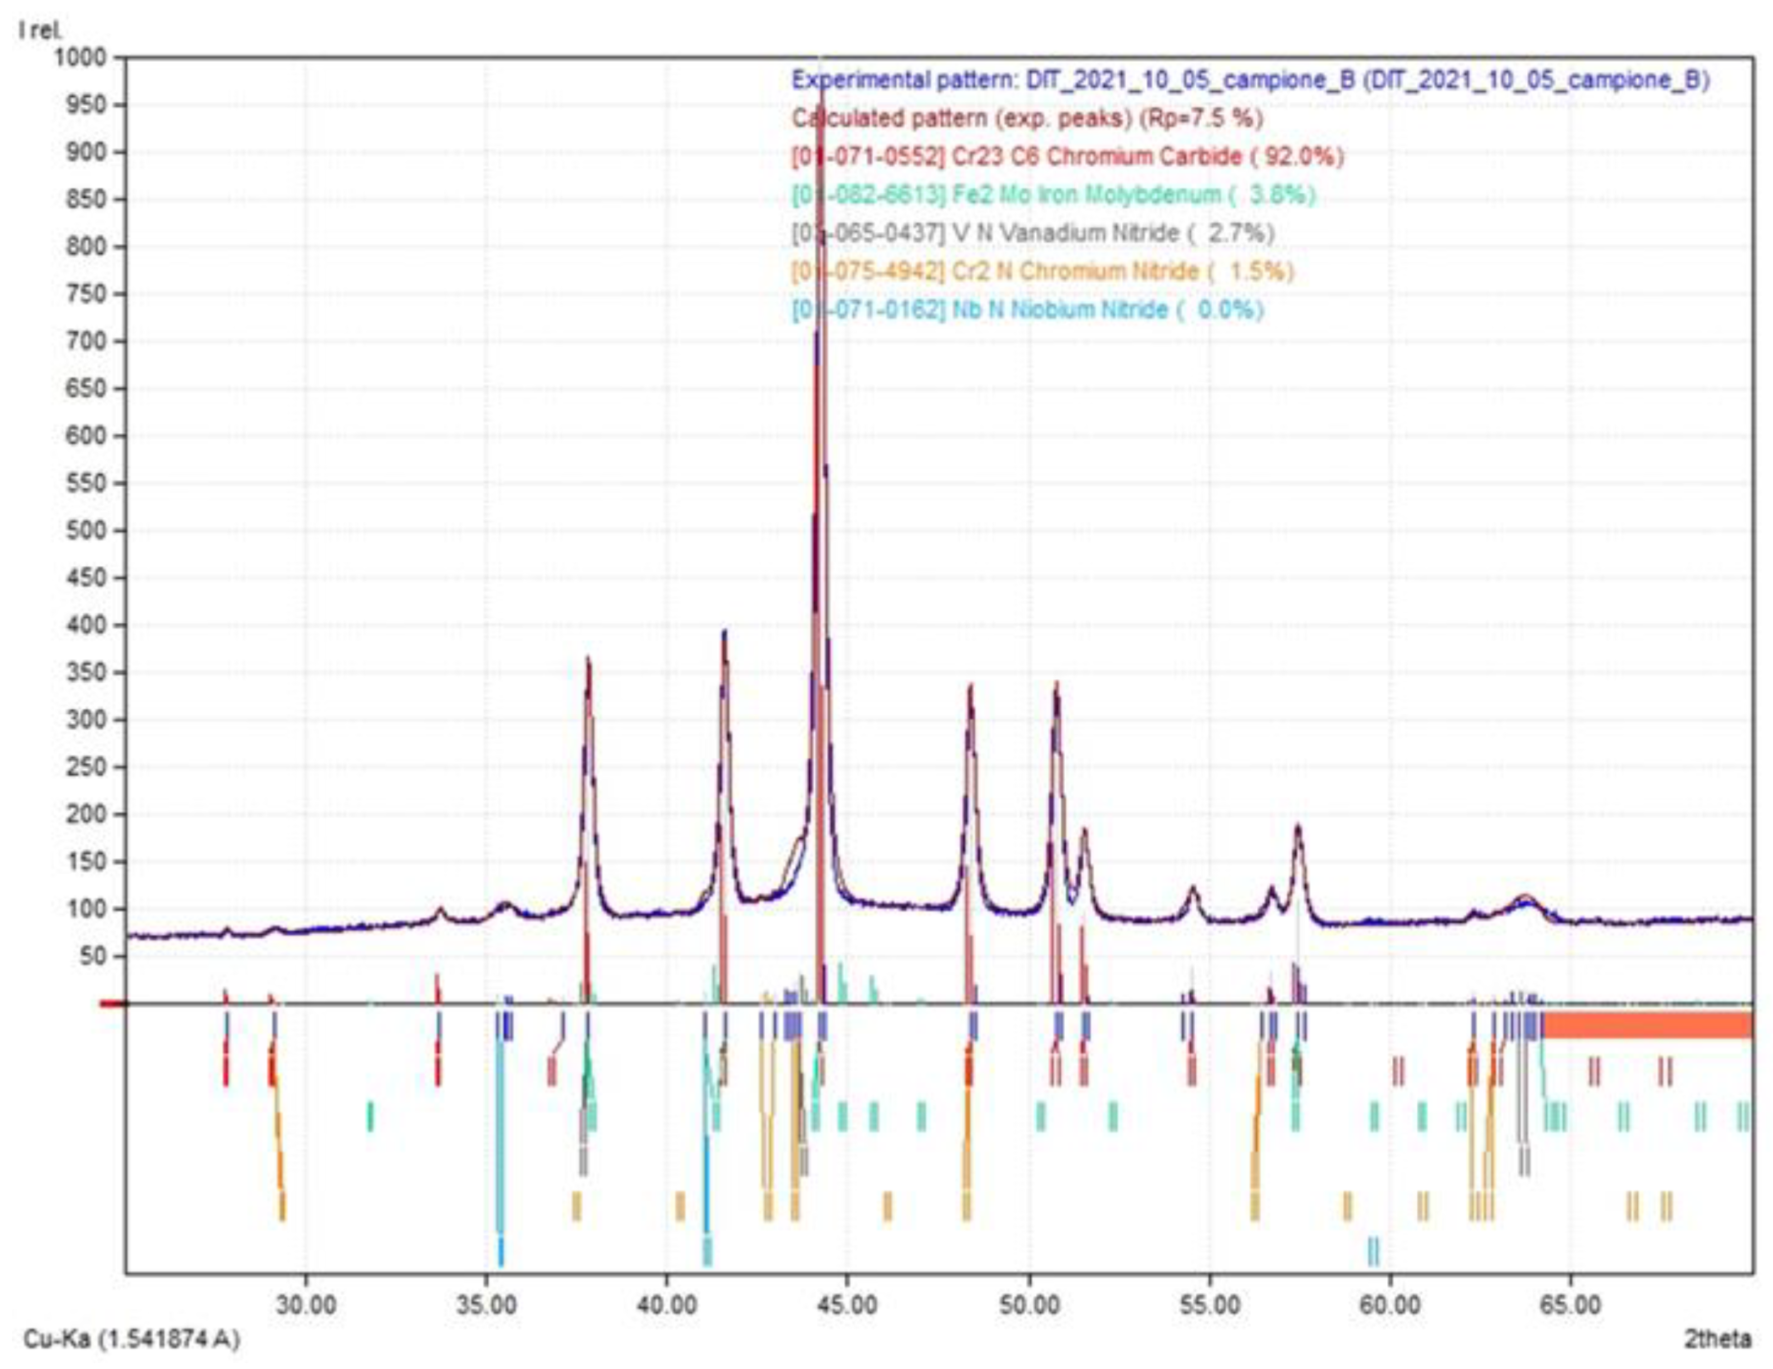
Appendix A.1.1. The Figure A1 Provide the Results of XRD on Failed Crept Cross-Weld Specimen 91-HAZ-3-5 600 °C 112 MPa 3216 h (Sample B)

Figure A1. Failed crept cross-weld specimen 91-HAZ-3-5 600 °C 112 MPa 3216 h (sample B). XRD analysis.
Micro 03 00020 g0a1
Figure A2. Failed crept cross-weld specimen 91-HAZ-3-5 600 °C 112 MPa 3216 h (sample B). Sample data and matched phases.
Micro 03 00020 g0a2
Figure A3. Failed crept cross-weld specimen 91-HAZ-3-5 600 °C 112 MPa 3216 h (sample B). Ternary diagram (a) and size distribution (b) (TEM analysis).
Micro 03 00020 g0a3
Figure A4. Failed crept cross-weld specimen 91-HAZ-3-5 600 °C 112 MPa 3216 h (sample B). TEM images on a carbon extraction replica at 50,000X.
Micro 03 00020 g0a4
Figure A5. Failed crept cross-weld specimen 91-HAZ-3-5 600 °C 112 MPa 3216 h (sample B). TEM images on a carbon extraction replica at 100,000X.
Micro 03 00020 g0a5

Appendix A.1.2. The Figure A6 Provide the Results of XRD on Failed Crept Cross-Weld Specimen 91-HAZ-3-6 600 °C 99 MPa 4280 h (Sample C)

Figure A6. Failed crept cross-weld specimen 91-HAZ-3-6 600 °C 99 MPa 4280 h (sample C). XRD analysis.
Micro 03 00020 g0a6
Figure A7. Failed crept cross-weld specimen 91-HAZ-3-6 600 °C 99 MPa 4280 h (sample C). Sample data and matched phases.
Micro 03 00020 g0a7
Figure A8. Failed crept cross-weld specimen 91-HAZ-3-6 600 °C 99 MPa 4280 h (sample C). Ternary diagram (a) and size distribution (b) (TEM analysis).
Micro 03 00020 g0a8
Figure A9. Failed crept cross-weld specimen 91-HAZ-3-6 600 °C 99 MPa 4280 h (sample C). TEM images on a carbon extraction replica at 50,000X.
Micro 03 00020 g0a9
Figure A10. Failed crept cross-weld specimen 91-HAZ-3-6 600 °C 99 MPa 4280 h. TEM images on a carbon extraction replica at 100,000X.
Micro 03 00020 g0a10

Appendix A.2. Subproject N°6: GR 92 HAZ CREEP

The Figure A11 Provide the Results of XRD on Failed Crept Cross-Weld Specimen 92-HAZ-6-6 650 °C 65 MPa 3877 h (Sample H).
Figure A11. Failed crept cross-weld specimen 92-HAZ-6-6 650 °C 65 MPa 3877 h (sample H). XRD analysis.
Micro 03 00020 g0a11
Figure A12. Failed crept cross-weld specimen 92-HAZ-6-6 650 °C 65 MPa 3877 h (sample H). Sample data and matched phases.
Micro 03 00020 g0a12
Figure A13. Failed crept cross-weld specimen 92-HAZ-6-6 650 °C 65 MPa 3877 h (sample H). Ternary diagram (a) and size distribution (b) (TEM analysis).
Micro 03 00020 g0a13
Figure A14. Failed crept cross-weld specimen 92-HAZ-6-6 650 °C 65 MPa 3877 h (sample H). TEM images on a carbon extraction replica at 50,000X.
Micro 03 00020 g0a14
Figure A15. Failed crept cross-weld specimen 92-HAZ-6-6 650 °C 65 MPa 3877 h (sample H). TEM images on a carbon extraction replica at 100,000X.
Micro 03 00020 g0a15

References

  1. Neubauer, B.; Arens-Fisher, F. Restfile Estimation of Power Plant Component under Creep Load. In Proceedings of the VGB Congress Power Plants 1982, Mannheim, Germany, 14–17 September 1982. [Google Scholar]
  2. Honda, T.; Fukahori, T.; Tokiyoshi, T.; Igari, T.; Tominaga, K.; Cocks, A.C.F. Type IV creep crack initiation and propagation in mod.9Cr-1Mo steel welds. Mater. High Temp. 2022, 39, 603–612. [Google Scholar] [CrossRef]
  3. Saini, A.; Pollock, T. High-temperature materials increase efficiency of gas power plants. MRS Bull. 2012, 37, 550–551. [Google Scholar] [CrossRef] [Green Version]
  4. Lee, H.Y.; Lee, J. Issues and solutions for integrity of pressure vessels and piping subjected to long-term creep exposure in supercritical thermal plants. Mater. High Temp. 2022, 39, 436–445. [Google Scholar] [CrossRef]
  5. Krein, R.; Schubert, J.; Klenk, A. Weld strength reduction in modern tempered martensitic 9% Chromium creep resistant steels. In Proceedings of the 4th International ECCC Creep & Fracture Conference, Dusseldorf, Germany, 10–14 September 2017. [Google Scholar]
  6. Zhang, S.; Tokunaga, H.; Kanai, M.; Lin, S.; Yaguchi, M.; Tamura, K.; Minami, Y. Effect of abnormal structure on creep strength of long-term used 9Cr steel welded joint. Mater. High Temp. 2022, 39, 578–589. [Google Scholar] [CrossRef]
  7. Maddi, L.; Ballal, A.R.; Peshwe, D.R.; Mathew, M.D. Influence of normalizing and tempering temperatures on the creep properties of P92 steel. High Temp. Mater. Process. 2020, 39, 178–188. [Google Scholar] [CrossRef]
  8. Gotti, A.; Di Gianfrancesco, A.; Ferrara, A.; Gariboldi, E.; Merckling, G.; Navone, S.; Parodi, S.; Poggio, E.; Ripamonti, D.; Verdino, S. Creep properties of ASTM A335 P92 pipe parent material and erection welded joint simulation: Effect of 1 or 3 PWHT. Mater. High Temp. 2022, 39, 647–654. [Google Scholar] [CrossRef]
  9. Yamamoto, Y.; Ferrara, A. Evolution of precipitation particles with respect to grain boundary energy in Grade 91 steel during creep exposure. Mater. High Temp. 2022, 39, 480–486. [Google Scholar] [CrossRef]
  10. Hasegawa, Y.; Ishii, N.; Kodama, M.; Kunieda, A.; Shimizu, K.; Kamada, Y. Possible microstructural resistant factors in P91 steel to the magnetic domain wall motion of electro-magnetic inspection method. In Proceedings of the High Temperature Plant Materials, Inspection, Monitoring & Assessment—MIMA 2 Conference, London, UK, 11–13 October 2022. [Google Scholar]
  11. Tamura, M.; Abe, F. Analysis of the Degradation in the Creep Strength of High-Cr Martensitic Steels. J. Mater. Sci. Res. 2021, 10, 1. [Google Scholar] [CrossRef]
  12. Di Nunzio, P.E.; Cipolla, L.; Tiberi Vipraio, S.; Martelli, S.; Somers MA, J. Quantitative X-ray diffraction analysis of development of Z phase in 12%Cr–Nb–V–N steel. Mater. Sci. Technol. 2010, 26, 1423–1428. [Google Scholar] [CrossRef]
  13. ECCC Recommendation Volumes. Available online: https://www.eccc-creep.com/eccc-recommendations-volumes (accessed on 9 February 2023).
  14. API Recommended Practice 580, 3rd ed.; Risk-based Inspection; American Petroleum Institute: Washington DC, USA, 2016.
  15. Merckling, G.; Benini, D.; Casiraghi, L.; Corsi, A.; Staffolani, A. Metallic replica technique for residual life assessment for components serviced in creep regime. Mater. High Temp. 2022, 39, 622–633. [Google Scholar] [CrossRef]
  16. Shibli, A. Remaining life assessment issues in high Cr martensitic steels and development of new innovative tools for damage monitoring and integrity assessment. Trans. Indian Inst. Met. 2010, 63, 339–348. [Google Scholar] [CrossRef]
  17. Wilson, J.W.; Allen, D.; Peyton, A.J.; Shibli, A.; Davis, C. Detection of creep degradation during pressure vessel testing using electromagnetic sensor technology. Mater. High Temp. 2017, 34, 448–457. [Google Scholar] [CrossRef] [Green Version]
  18. Wojcik, A.; Waitt, M.; Santos, A.; Shibli, A. A review of factors affecting the use of electrical potential drop (EPD) for creep life monitoring. Mater. High Temp. 2022. accepted. [Google Scholar] [CrossRef]
  19. EN 10371:2021; Metallic Materials—Small Punch Test Method. CEN-CENELEC: Brussels, Belgium, 2021.
  20. Peng, Z.; Liu, S.; Yang, C.; Yang, H. Correlation of hardness with maximum allowable stresses of Grade 91 steel. Mater. High Temp. 2022, 39, 472–479. [Google Scholar] [CrossRef]
  21. Yaguchi, M.; Hamaguchi, T.; Miki, K.; Yamamoto, Y.; Nomura, K.; Murakami, E.; Komai, N.; Inukai, T. Effects of chemical composition and heat treatment on creep properties of Grade 91 steel base metal and welded joint. Mater. High Temp. 2022, 39, 689–701. [Google Scholar] [CrossRef]
  22. Chen, J.; Wang, Z.; Papadaki, C.; Korsunsky, A.M. The Creep Deformation of a New Nickel-Base Alloy-by-Design Studied Using Synchrotron X-ray Diffraction. 2022. Available online: https://arxiv.org/abs/2210.16840 (accessed on 16 December 2022).
  23. Cipolla, L. Conversion of MX Nitrides to Modified Z-Phase in 9–12%Cr Ferritic Steels. Ph.D. Thesis, Technical University of Denmark, Kongens Lyngby, Denmark, March 2010. [Google Scholar]
  24. Danielsen, H.K. Review of Z phase precipitation in 9–12 wt-%Cr steels. Mater. Sci. Technol. 2016, 32, 126–137. [Google Scholar] [CrossRef] [Green Version]
  25. Alviz-Meza, A.; Duong, A.; Orozco-Agamez, J.; Kafarov, V.; Cardenas-Escorcia, Y.; Carrillo-Caballero, G.; Pena-Ballesteros, D. Study of Early P91 Dual Corrosion in Steam and Simulated Combustion Gases from a Gas-Fired Boiler. J. Mater. Res. Technol. 2021, 13, 271–282. [Google Scholar] [CrossRef]
Figure 1. (a) Extraction replicas; (b) example of sketches representing the TEM examination of the martensitics, in the time/strain diagram used for the alloyed steels; and (c) an example of a small-scale test facility, which is a small punch creep testing machine.
Micro 03 00020 g001
Figure 2. Microstructural and precipitate SEM analyses of GR 91 interrupted after 4000 h (total ageing 50,334 h at 650 °C).
Micro 03 00020 g002
Figure 3. The specimen geometries: P91 tube cutting plan, upper-left side; P92 tube cutting plan, upper-right side; the specimens according to ISO 204:2009, lower-right side.
Micro 03 00020 g003
Figure 4. Subproject N°3: GR 91 HAZ CREEP, failed crept cross-weld specimen 91-HAZ-3-1 550 °C 200 MPa 4395 h (sample A).
Micro 03 00020 g004
Figure 5. Subproject N°3: GR 91 HAZ CREEP, ternary diagram (a) and size distribution (b) (TEM analysis).
Micro 03 00020 g005
Figure 6. Failed crept cross-weld specimen 91-HAZ-3-1 550 °C 200 MPa 4395 h. TEM images on a carbon extraction replica at 50,000X; MX (clear points), M23C6 (black and generally elongated areas), and few Laves phases (black rounded areas) are present.
Micro 03 00020 g006
Figure 7. Failed crept cross-weld specimen 91-HAZ-3-1 550 °C 200 MPa 4395 h. TEM images on a carbon extraction replica at 100,000X; MX, M23C6, and few Laves phases are present.
Micro 03 00020 g007
Figure 8. Failed crept cross-weld specimen 91-HAZ-3-1 550 °C 200 MPa 4395 h. TEM SAD (Selected Area Diffraction) and EDS (Energy Dispersive Spectroscopy) microanalysis on M23C6 carbide.
Micro 03 00020 g008
Figure 9. Failed crept cross-weld specimen 91-HAZ-3-1 550 °C 200 MPa 4395 h. TEM SAD (Selected Area Diffraction) and EDS (Energy Dispersive Spectroscopy) microanalysis on Fe2Mo (Laves phase).
Micro 03 00020 g009
Figure 10. Failed crept cross-weld specimen 91-HAZ-3-8 650 °C 61 MPa 2072 h (sample D).
Micro 03 00020 g010
Figure 11. Failed crept cross-weld specimen 91-HAZ-3-8 650 °C 61 MPa 2072 h (sample D), ternary diagram (a) and size distribution (b) (TEM analysis).
Micro 03 00020 g011
Figure 12. Failed crept cross-weld specimen 91-HAZ-3-8 650 °C 61 MPa 2072 h (sample D). TEM images on a carbon extraction replica at 100,000X; MX, M23C6, and no Laves phases are noted.
Micro 03 00020 g012
Figure 13. Ex-service tube, selected from the drain line of the steam generator in a coal power plant.
Micro 03 00020 g013
Figure 14. Exposed material specimen 92-EX-1-2 (92 BM 604 °C 43 MPa 74,001 h) (sample E), XRD analysis.
Micro 03 00020 g014
Figure 15. Exposed material specimen 92-EX-1-2 (92 BM 604 °C 43 MPa 74,001 h) (sample E), ternary diagram (a) and size distribution (b) (TEM analysis).
Micro 03 00020 g015
Figure 16. Grade 92 in ex-service exposed 92-EX-1-2 604 °C 40 MPa 74,001 h. TEM images on a carbon extraction replica at 50,000X.
Micro 03 00020 g016
Figure 17. Grade 92 in ex-service exposed 92-EX-1-2 604 °C 40 MPa 74,001 h. TEM images on a carbon extraction replica at 100,000X.
Micro 03 00020 g017
Figure 18. Subproject N°6: GR 92 HAZ CREEP failed crept cross-weld specimen 92-HAZ-6-1 600 °C 152 MPa 2516 h (sample F), XRD analysis.
Micro 03 00020 g018
Figure 19. Subproject N°6: GR 92 HAZ CREEP failed crept cross-weld specimen 92-HAZ-6-1 600 °C 152 MPa 2516 h (sample F), ternary diagram (a) and size distribution (b) (TEM analysis).
Micro 03 00020 g019
Figure 20. Failed crept cross-weld specimen 92-HAZ-6-5 650 °C 78 MPa 4616 h (sample G), XRD analysis.
Micro 03 00020 g020
Figure 21. Failed crept cross-weld specimen 92-HAZ-6-5 650 °C 78 MPa 4616 h (sample G), ternary diagram (a) and size distribution (b) (TEM analysis).
Micro 03 00020 g021
Figure 22. Failed crept cross-weld specimen 92-HAZ-6-5 650 °C 78 MPa 4616 h (sample G). TEM images on a carbon extraction replica at 50,000X.
Micro 03 00020 g022
Figure 23. Failed crept cross-weld specimen 92-HAZ-6-5 650 °C 78 MPa 4616 h (sample G). TEM images on a carbon extraction replica at 100,000X.
Micro 03 00020 g023
Table 1. Chemical analysis (%) of the P91 tube batch.
CMnSiPSCrMoNiVAlCuTi
0.090.460.310.0160.0038.490.870.140.190.0040.040.002
NbWAsSnCoPbBSbZrBiCaN
0.0680.00460.0020.0040.01170.00190.00020.00050.00010.00110.00040.055
Table 2. Chemical analysis (%) of the P92 tube batch.
CMnSiPSCrMoNiVAlTiNbWBZrN
0.090.480.340.0110.0068.990.370.120.17<0.01<0.010.061.860.005<0.010.049
Table 3. Mechanical properties of the P91 tube batch.
T (°C)YS (MPa)UTS (MPa)A (%)H (HB)Flattening Test (Result)
+2052558526.3223Passed
Table 4. Mechanical properties of the P92 tube batch.
T (°C)YS (MPa)UTS (MPa)A (%)H (HB)Flattening Test (Result)
+2049167620.7217Passed
Table 5. Creep test program of subproject N°3: 3 GR 91 HAZ creep (with a background gray level for each temperature group, which is 550 °C, 600 °C and 650 °C). The last column is the schedule for the other tests to be performed on the creep specimen (after the specimen rupture or after the number of hours indicated in the last column).
Creep Specimen Identification CodeTemp. °CStress Level (MPa)Expected Time to Rupture (Hours)Time to NDEs if the Specimen Does Not Break Before
91-HAZ-3-155020010,00010,000 1
91-HAZ-3-255018920,00020,000 1
91-HAZ-3-355017550,00025,000 2
91-HAZ-3-460012210,00010,000 1
91-HAZ-3-560011220,00020,000 1
91-HAZ-3-66009950,00025,000 2
91-HAZ-3-76506810,00010,000 1
91-HAZ-3-86506120,00020,000 1
91-HAZ-3-96505450,00025,000 2
1. Equivalent to the expected time to rupture; 2. equivalent to ½ of the expected time to rupture.
Table 6. Creep test program of sub project N°6: 6 GR 92 HAZ creep; the last column is the schedule for the other tests to be performed on the creep specimen (after the specimen rupture or after the number of hours indicated in the last column).
Creep Specimen Identification CodeTemp. °CStress Level (MPa)Expected Time to Rupture (Hours)Time to NDEs if the Specimen Does Not Break Before
92-HAZ-6-160015210,00010,000 1
92-HAZ-6-260014120,00020,000 1
92-HAZ-6-360012550,00025,000 2
92-HAZ-6-46508810,00010,000 1
92-HAZ-6-56507820,00020,000 1
92-HAZ-6-66506550,00025,000 2
1. Equivalent to the expected time to rupture; 2. equivalent to ½ of the expected time to rupture.
Table 7. Identification of the samples submitted to the tests.
Steel Grades 91 and 92 Microstructure
and Precipitate Evolution Atlas
Identification Code (Grade 91)
Identif. Code
XRD Analysis
Steel Grades 91 and 92 Microstructure and
Precipitate Evolution Atlas Identification
Code (Grade 92)
Identif. Code
XRD Analysis
91-HAZ-3-1 550 °C 200 MPa 4395 hA92-EX-1-2 (92 BM 604 °C 43 MPa 74,001 h)E
91-HAZ-3-5 600 °C 112 MPa 3216 hB92-HAZ-6-1 600 °C 152 MPa 2516 hF
91-HAZ-3-6 600 °C 99 MPa 4280 hC92-HAZ-6-5 650 °C 78 MPa 4616 hG
91-HAZ-3-8 650 °C 61 MPa 2072 hD92-HAZ-6-6 650 °C 65 MPa 3877 hH
Table 8. Phase identification by automatic matching.
Identified Phases by XRD in Steel Grade 91 and 92
NameFormula SumClassification
Chromium CarbideCr23C6M23C6 carbide
Iron MolybdenumFe2MoLaves phase
Chromium NitrideCr2NM2N nitride
Niobium NitrideNbNMX carbonitride
Vanadium NitrideVN
Table 9. Ex-service tube’s chemical analysis (extracted from the original certificate).
CMnSiPSCrMoNiVAlSnNbN
0.0920.430.380.0120.0028.880.930.280.240.0140.0060.0720.047
Table 10. Ex-service tube’s mechanical properties.
T (°C)YS (MPa)UTS (MPa)A (%)H (HB)Flattening Test (Result)
+2055670441217Passed
Table 11. Evaluation of precipitated phases in steel Grade 91 samples by XRD.
Failed Crept Cross Weld Specimen GR 91Identif.
Code XRD
Analysis
Evaluation of Partition of Second Phases by XRD Analysis
M23C6MXLavesM2N
Cr23C6Nb NVNFe2Mo
Amount %Amount %Amount %Amount %Amount %
91-HAZ-3-1 550 °C 200 MPa 4395 hA8111125
91-HAZ-3-5 600 °C 112 MPa 3216 hB92 341
91-HAZ-3-6 600 °C 99 MPa 4280 hC891271
91-HAZ-3-8 650 °C 61 MPa 2072 h *D48 3454
* suggested indication: to repeat XRD analysis.
Table 12. Evaluation of precipitated phases in steel Grade 92 samples by XRD.
Specimen GR 92Identif. Code
XRD
Analysis
Evaluation of Partition of Second Phases by XRD Analysis
M23C6MXLavesM2N
C23C6NbNVNFe2Mo
Amount %Amount %Amount %Amount %Amount %
92-EX-1-2 (92 BM 604 °C 43 MPa 74,001 h)E860.468
92-HAZ-6-1 600 °C 152 MPa 2516 hF720.52233
92-HAZ-6-5 650 °C 78 MPa 4616 hG750.63183
92-HAZ-6-6 650 °C 65 MPa 3877 hH670.72265
Table 13. Failed crept cross-weld specimen 91-HAZ-3-1 550 °C 200 MPa 4395 h. Assessment of geometrical parameters and the mean chemical compositions of different types of precipitates by TEM-EDS microanalyses.
Failed Crept Cross Weld
Specimen
Precipitate DescriptionTEM EDS Analysis of Type of Precipitates
ClassificationCategoryMean
Size nm
NF%Average Element (wt%)
VCrFeNbMo
M23C6 carbide(Cr,Fe,Mo)-rich24073600.668.024.40.06.7
(Cr,Fe,Mo)23C6
MX carbo-nitrideNb-rich512210.54.02.082.20.0
91-HAZ-3-1(Nb,V)(N,C)
550 °C 200 MPa 4395 hV-rich65181566.619.64.95.60.6
(V,Nb)(C,N)
Laves phase(Fe,Mo)-rich18227230.412.444.30.238.7
Fe2Mo
Disclaimer/Publisher’s Note: The statements, opinions and data contained in all publications are solely those of the individual author(s) and contributor(s) and not of MDPI and/or the editor(s). MDPI and/or the editor(s) disclaim responsibility for any injury to people or property resulting from any ideas, methods, instructions or products referred to in the content.

