Review

Sustainability of Biogas Production from Anaerobic Digestion of Food Waste and Animal Manure

by
Sharath Kumar Ankathi
1,*,
Utkarsh S. Chaudhari
2,
Robert M. Handler
2,3 and
David R. Shonnard
2,3
1
Aramco Americas, Aramco Research Center−Detroit, Novi, MI 48377, USA
2
Department of Chemical Engineering, Michigan Technological University, Houghton, MI 49931, USA
3
Sustainable Futures Institute, Michigan Technological University, Houghton, MI 49931, USA
*
Author to whom correspondence should be addressed.
Appl. Microbiol. 2024, 4(1), 418-438; https://doi.org/10.3390/applmicrobiol4010029
Submission received: 8 January 2024 / Revised: 7 February 2024 / Accepted: 16 February 2024 / Published: 21 February 2024

Abstract

:
Anaerobic digestion (AD) involves a set of microbiological reactions and physio-chemical processes to generate biogas, a mixture of predominantly CH4 and CO2. It is commercialized globally; however, AD has limited commercial applications in the U.S. compared to other regions of the world. The main objective of this article is to review different studies on socio-economic and environmental aspects and policies of biogas/biomethane production and to focus on resource availability. The key outcome from this review shows that the anaerobic digestion of food waste and animal manure has great potential to achieve economic and environmental benefits compared to other waste management techniques such as landfilling or conventional manure management. The 12 life cycle assessment (LCA) studies reviewed showed lower impacts for biogas systems and indicated a need for standardization of methodology so that alternative production concepts can be objectively compared. Similarly, economic analyses showed higher profitability for a biogas combined heat and power facility compared to a biomethane facility. By considering a review of the sustainability of biogas, we presented a new multi-criteria sustainable assessment framework that includes three domains: i. resource availability and logistics, ii. process modeling, and iii. impact assessment with primary application to the optimum location and installation of sustainable biogas/biomethane plants in the U.S.

Graphical Abstract

1. Introduction

Significant waste generation occurs in the overall value chain of food, from the production stage through consumption and end-of-life treatment. According to the Food and Agriculture Organization (FAO), about 33% of food production throughout the world is wasted annually [1]. In 2019, approximately 931 million tonnes of food waste was generated globally [2]. Food waste (FW) generation has been significantly increasing with urbanization and population growth in recent years [3], and managing the generated waste is crucial in the sustainable development of societies, generating economic and environmental benefits [4].
Due to the increasing demand for food and natural resources by a growing population, a transition from linear to circular material flow for food is thought to be sustainable and useful. The linear material flow model is considered as “take-produce-consume-discard”, which is assumed unsustainable, as it extracts the resources for production and consumption but does not account for the reuse of waste material or regeneration. Conversely, a circular economy provides a platform to circulate resources in a closed-loop system to prevent waste generation and promote reuse, recycling, refurbishing, and repurposing of products through different management methods [5]. In the linear material flow of the food supply chain, food discarded in each stage starting from extraction, production, and consumption is ultimately landfilled, thereby wasting a large amount of organic resources and generating greenhouse gas (GHG) emissions in the form of methane from landfills and open manure management. The material flows represented in Figure 1 show the circularity of food and other organic waste using anaerobic digestion (AD) [6]. In a circular economy, food waste is seen as a resource and can be digested anaerobically to produce digestate (nutrients) and other useful products such as biomethane and compost [7]. Ontario in Canada and Europe have already proposed an action plan for the transition towards a circular economy to maintain the utility and value of materials, resources, and products within the economy [8].
In the U.S., around 292 million U.S. short tons of municipal solid waste (MSW) was generated in 2018, which mostly includes waste from the industrial, commercial, and residential sectors [9]. The generated MSW is managed through different methods such as landfilling, composting, incineration, and recycling. Figure 2 displays the make-up of MSW generated in the U.S. (million U.S. short tons) before recycling, composting, and landfilling [9].
The second highest component of MSW is organic food waste at 22% of the MSW. On average, 30–40% of the food in the U.S. is wasted every year in the overall food supply chain, which equals more than 20 pounds of food per person per month, amounting to 39 million tons of wasted food. Of the food waste generation, about 4% is composted, 12% is combusted for energy recovery (presumably carried out with combustibles in MSW like food packaging), 56% is landfilled and the remaining 28% is treated via other food management pathways such as animal feed, bio-based material/biochemical processing, co-digestion/anaerobic digestion, etc. [9]. However, landfilling is environmentally harmful [10] since landfills accounted for 16.9% of U.S. methane (CH4) emissions in 2021 and are the third largest contributor to methane emissions in the U.S. inventory. The total GHG emissions from landfills in the U.S. is 123 million metric tons (MMT) CO2 eq. This accounts for 1.95% of overall U.S. annual greenhouse gas (GHG) emissions (6340 million metric tons of CO2 equivalent) [11]. Methane emissions are more harmful than the emissions of carbon dioxide (CO2) due to methane’s global warming potential (GWP), which is 25 times greater than carbon dioxide [12].
Another concerning issue is the GHG emissions created from animal waste, which accounts for 10% of total methane emissions in the U.S. [13]. Manure management in the U.S. has a great environmental impact, accounting for 14% of overall GHG emissions from the agricultural sector [13]. Out of the U.S. overall manure management emissions of 67.7 MMT CO2 eq., nearly 52% of CH4 emissions are from dairy cattle [13]. Manure CH4 emission factors are from a low of 0.02 (most of the poultry breeds) to 1 (beef cattle) and up to a high of 53 (dairy cows) kilograms per head per year [14].
Landfill gas (LFG) energy systems reduce GHG emissions and also may generate electricity. According to the Landfill Methane Outreach Program (LMOP) and Landfill Gas Energy Database (LMOP Database) summary [15], currently, in the U.S., there are 564 operational LFG energy projects, which receive landfill gas from 515 of a total of 2600 MSW landfills. The state of California in the U.S. tops the list with 56 operational projects and 27 candidate landfills. Candidate landfills are those that have at least one million tons of waste and do not have any energy projects operational, under construction, or planned. The state of Michigan has 42 operational projects with 14 candidate landfills followed by Pennsylvania with 40 operational projects, North Carolina with 31 operational projects, Virginia with 28 operational projects, and Texas with 25 operational projects. Texas has the highest number of candidate landfills with 52. When the 564 operational LFG energy projects are grouped into types, 71% (400 projects) are for electricity generation, 18% (99 projects) are for direct use in boilers, kilns, or dryers for thermal application, 10% (58 projects) are for injection into pipelines or renewable natural gas (RNG) and 1% is used locally as vehicle fuel [13].
Notable landfill gas-to-energy projects among many others in different U.S. states include the Zion Landfill in Zion, Illinois, generating 6.75 MW of electricity at the plant that supplements the local electric grid. The Wolf Creek Landfill in Dry Branch, Georgia, powers about 1650 homes with 2.8 MW of electricity generation, the Evergreen landfill in Valdoster, GA, powers about 2200 homes daily with 4.8 MW, and the Blue Ridge Landfill generates 1.6 MW of electricity. Some of the other examples of landfill gas-to-energy projects are the Mostoller Landfill in Somerset, Pennsylvania, generating 1550 cu. ft./min LFG to support the Somerset Correctional Institute and the Emerald Park Landfill, delivering about 1500 cu. ft./min LFG to Milwaukee, Wisconsin. The Cranberry Creek Landfill delivers 1000 cu ft./min of LFG to Ocean Spray in Wisconsin Rapids through a 17-mile pipeline [16].
In addition to landfill to energy, another method for managing food waste and animal manure is composting. Despite consuming more energy than landfilling, composting reduces direct greenhouse gas emissions and can save energy indirectly and may have other benefits when compost replaces some chemical fertilizers used in agriculture [17]. Composting results in other benefits, such as a reduction in fertilizer runoff to receiving waters, reduced soil erosion, enhancing the metabolism of microorganisms, increasing soil carbon, and sustaining soil fertility [18]. In a nationwide survey conducted in 2017, about 18.5% of industrial composting facilities accepted food waste as part of their input, and 57% of facilities converted yard trimmings [19].
The landfilling of food waste has a high potential for uncontrolled methane emissions, so there is a necessity for reliable alternatives for the management of the food waste that is produced each year [20,21]. Biological treatments are the alternate way to reduce solid waste residues [22,23,24,25]. Composting and AD are two conventional biological treatment methods; however, composting has high N2O and CH4 emissions when compared to AD [20,21]. On the other hand, AD of food waste and manure has a high potential to reduce impacts and may have both economic and social benefits [21]. A recent study estimated the U.S. biomethane production potential to be nearly 8 million tons/year, enough to displace 5% of natural gas consumed in electricity production [26]. Of that total, nearly 4.5 million tons/year were attributable to candidate landfill materials and manure. The U.S. currently has more than 2000 operating biogas sites, and the U.S. Environmental Protection Agency (EPA) estimates that about 11,000 additional biogas production sites in the U.S. could be created, reducing total methane emissions [27]. Biogas from AD has multiple applications, including heating, power generation, biomethane injection into natural gas pipelines, and vehicle fuel. For example, 37 states in the U.S. currently have renewable energy targets to reach at least 20% of electricity needs using renewable energy sources [28].
Policies playing an important role in promoting biogas renewable energy implementation in the U.S. federal policy and supporting biogas production include the Renewable Fuel Standard (RFS), the Farm Bill’s Energy Title (IX), the AgSTAR program, and the EPA’s LMOP. For detailed information on federal and state policies, the reader is referred to Section 5 of this manuscript. The major barriers limiting the development of biogas markets in the U.S. are the low price of natural gas, the high investment cost of plants, the lack of support from federal agencies, and little knowledge of research and development in order to optimize the plants. There is a need for an integrated approach to overcome these barriers [27].
This review paper discusses the aspects of circular economies by considering an example of biomethane, a renewable resource produced from food waste and animal manure sources. The first objective of this article is to review existing frameworks on sustainability assessment of biogas/biomethane systems and propose a conceptual modeling framework to assess the broader impacts of biogas potentials in the U.S. and other countries in the world. The second objective of this article is to review the environmental, economic, and social costs and benefits of biogas/biomethane production in the United States to support a systems analysis framework.

2. Review of Existing Frameworks on Sustainability Assessment of Biogas Systems

Höhn et al., 2014 [29] studied the spatial distribution of biomass and the effect of transportation distances on cost for selecting the optimal location of biogas facility installations in Finland. Höhn et al.’s study focused mainly on a wide range of feedstocks and results show that with the use of 90% agro-based feedstock within the 10 km radius of the chosen region, biogas potential can be achieved up to 2.1–8.4 MW. However, with an increase in the transportation radius to 40 km, the capacity of biogas facilities increased to 16.8 MW because of the availability of feedstock. It was also estimated that the total number of biogas plants that could be built was 49 within the maximum transportation radius of 10 or 40 km. Höhn’s model looked at the transportation logistics alone based on Geographical Information System (GIS) data to evaluate the biogas potential.
Pantaleo et al., 2013 [30] presented a decision-making tool for the optimization of feedstock blending (manure and energy crops) and the size of co-digestion biogas power plants in Southern Italy. The capacity of the biogas facilities ranged from 50 kW to 1 MW. This study focused on the effect of policies and the size of facilities on economics. The results showed that, with the addition of feed-in tariffs, Italian biogas power facilities are more profitable with manure alone compared with the integration of energy crops, and long-distance transportation of energy crops is not feasible at the low scale of production. Biogas power plants are profitable if cattle manure recovery rates are higher than 25% over 50 farms, and the integration of energy crops is profitable if the manure rate is below 40%. A Mixed Integer Linear Programming (MILP) optimization model was proposed by Yong Shin Park [31] to estimate the supply chain impacts of mono-digestion (animal manure-fed) biogas facilities in North Dakota with the inclusion of policies such as carbon credits. This model uses GIS to identify the potential locations based on social, economic, and environmental criteria. The results show that between 9 and 20 biogas power facilities can be installed with a varying cost of carbon credits from USD 0 to USD 100/ton of CO2 carbon price with an average AD size of 76,666 tons per year. Laasasenaho et al., 2019 [32] studied the logistics optimization of bioenergy plants in Finland for both farm-scale and centralized systems using GIS and R programming (statistical computing software). The feedstocks used were agricultural residues and woody biomass and the capacities were for farm biogas plants (>100 kW) and centralized biogas plants (>300 kW) within a 10 km radius of the selected region. The main objective was to minimize the transportation distances to feedstock locations and candidate biogas facilities. The results showed that eight farm-scale and thirteen centralized biogas plants could be built with the possibility of three co-digestion biowaste facilities.
Bioteau et al., 2012 [33] presented a GIS-based optimization model to locate potential sites for collective biogas plants (two or more farms owning a biogas facility) installation in a 1000 km2 wide area in France based on the energy potential and energy needs of the locality. Crop residues, pig slurry, food waste, sewage sludge, and cattle manure were feedstocks under different geographic constraints to locate optimum sites but the study did not account for environmental or economic impacts. Surprisingly, key outcomes showed the mapping of resource availability in the selected region but did not allow decision making on future locations of the facilities since no economic, environmental, or social impacts were considered. Balaman et al., 2014 [34] presented a review of different optimization models on bioenergy systems and proposed an MILP-based model to determine the locations and capacities of biogas plants and storage based on economic and geographic evaluation. Balaman’s model could also predict both supply and product distribution networks, and waste biomass in the form of animal manure and energy crops was used as feedstock. Computational real-world data were used for a region in Turkey to validate the model. The proposed model was applied to all counties in Izmir and the economic results showed a mean payback period of 4.98 years, and electricity sales and unused or unprocessed biomass (corn silage) had the biggest impact on the economics. Table 1 identifies and summarizes the types of feedstock used and sustainability indicators studied in the reviewed literature.

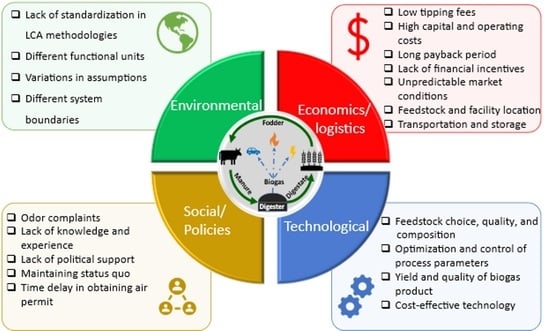
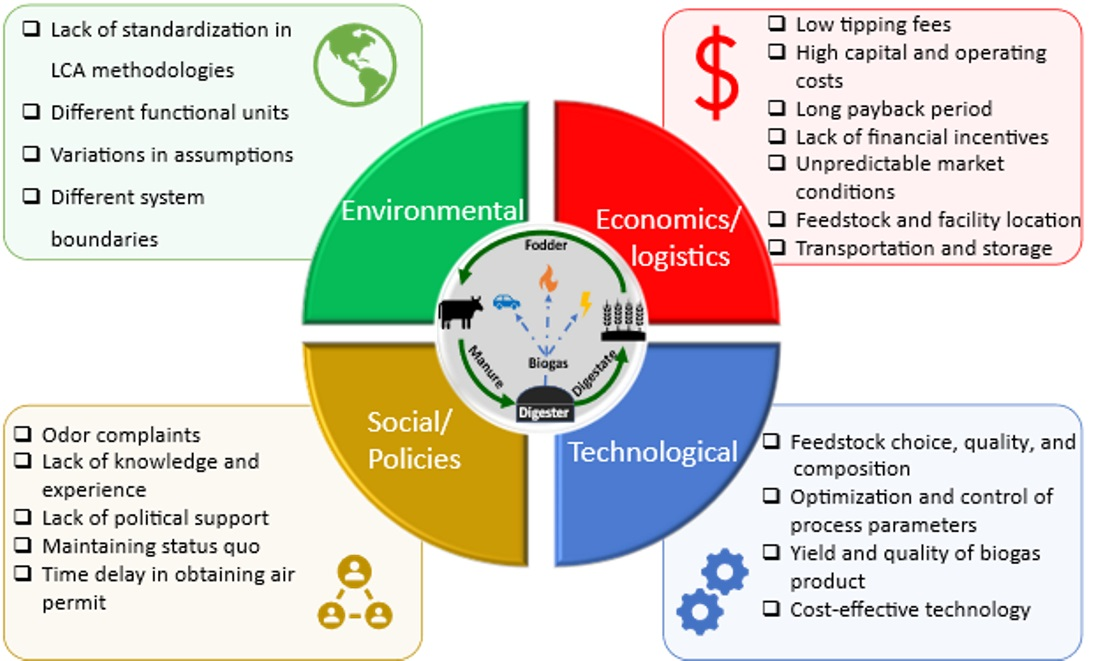
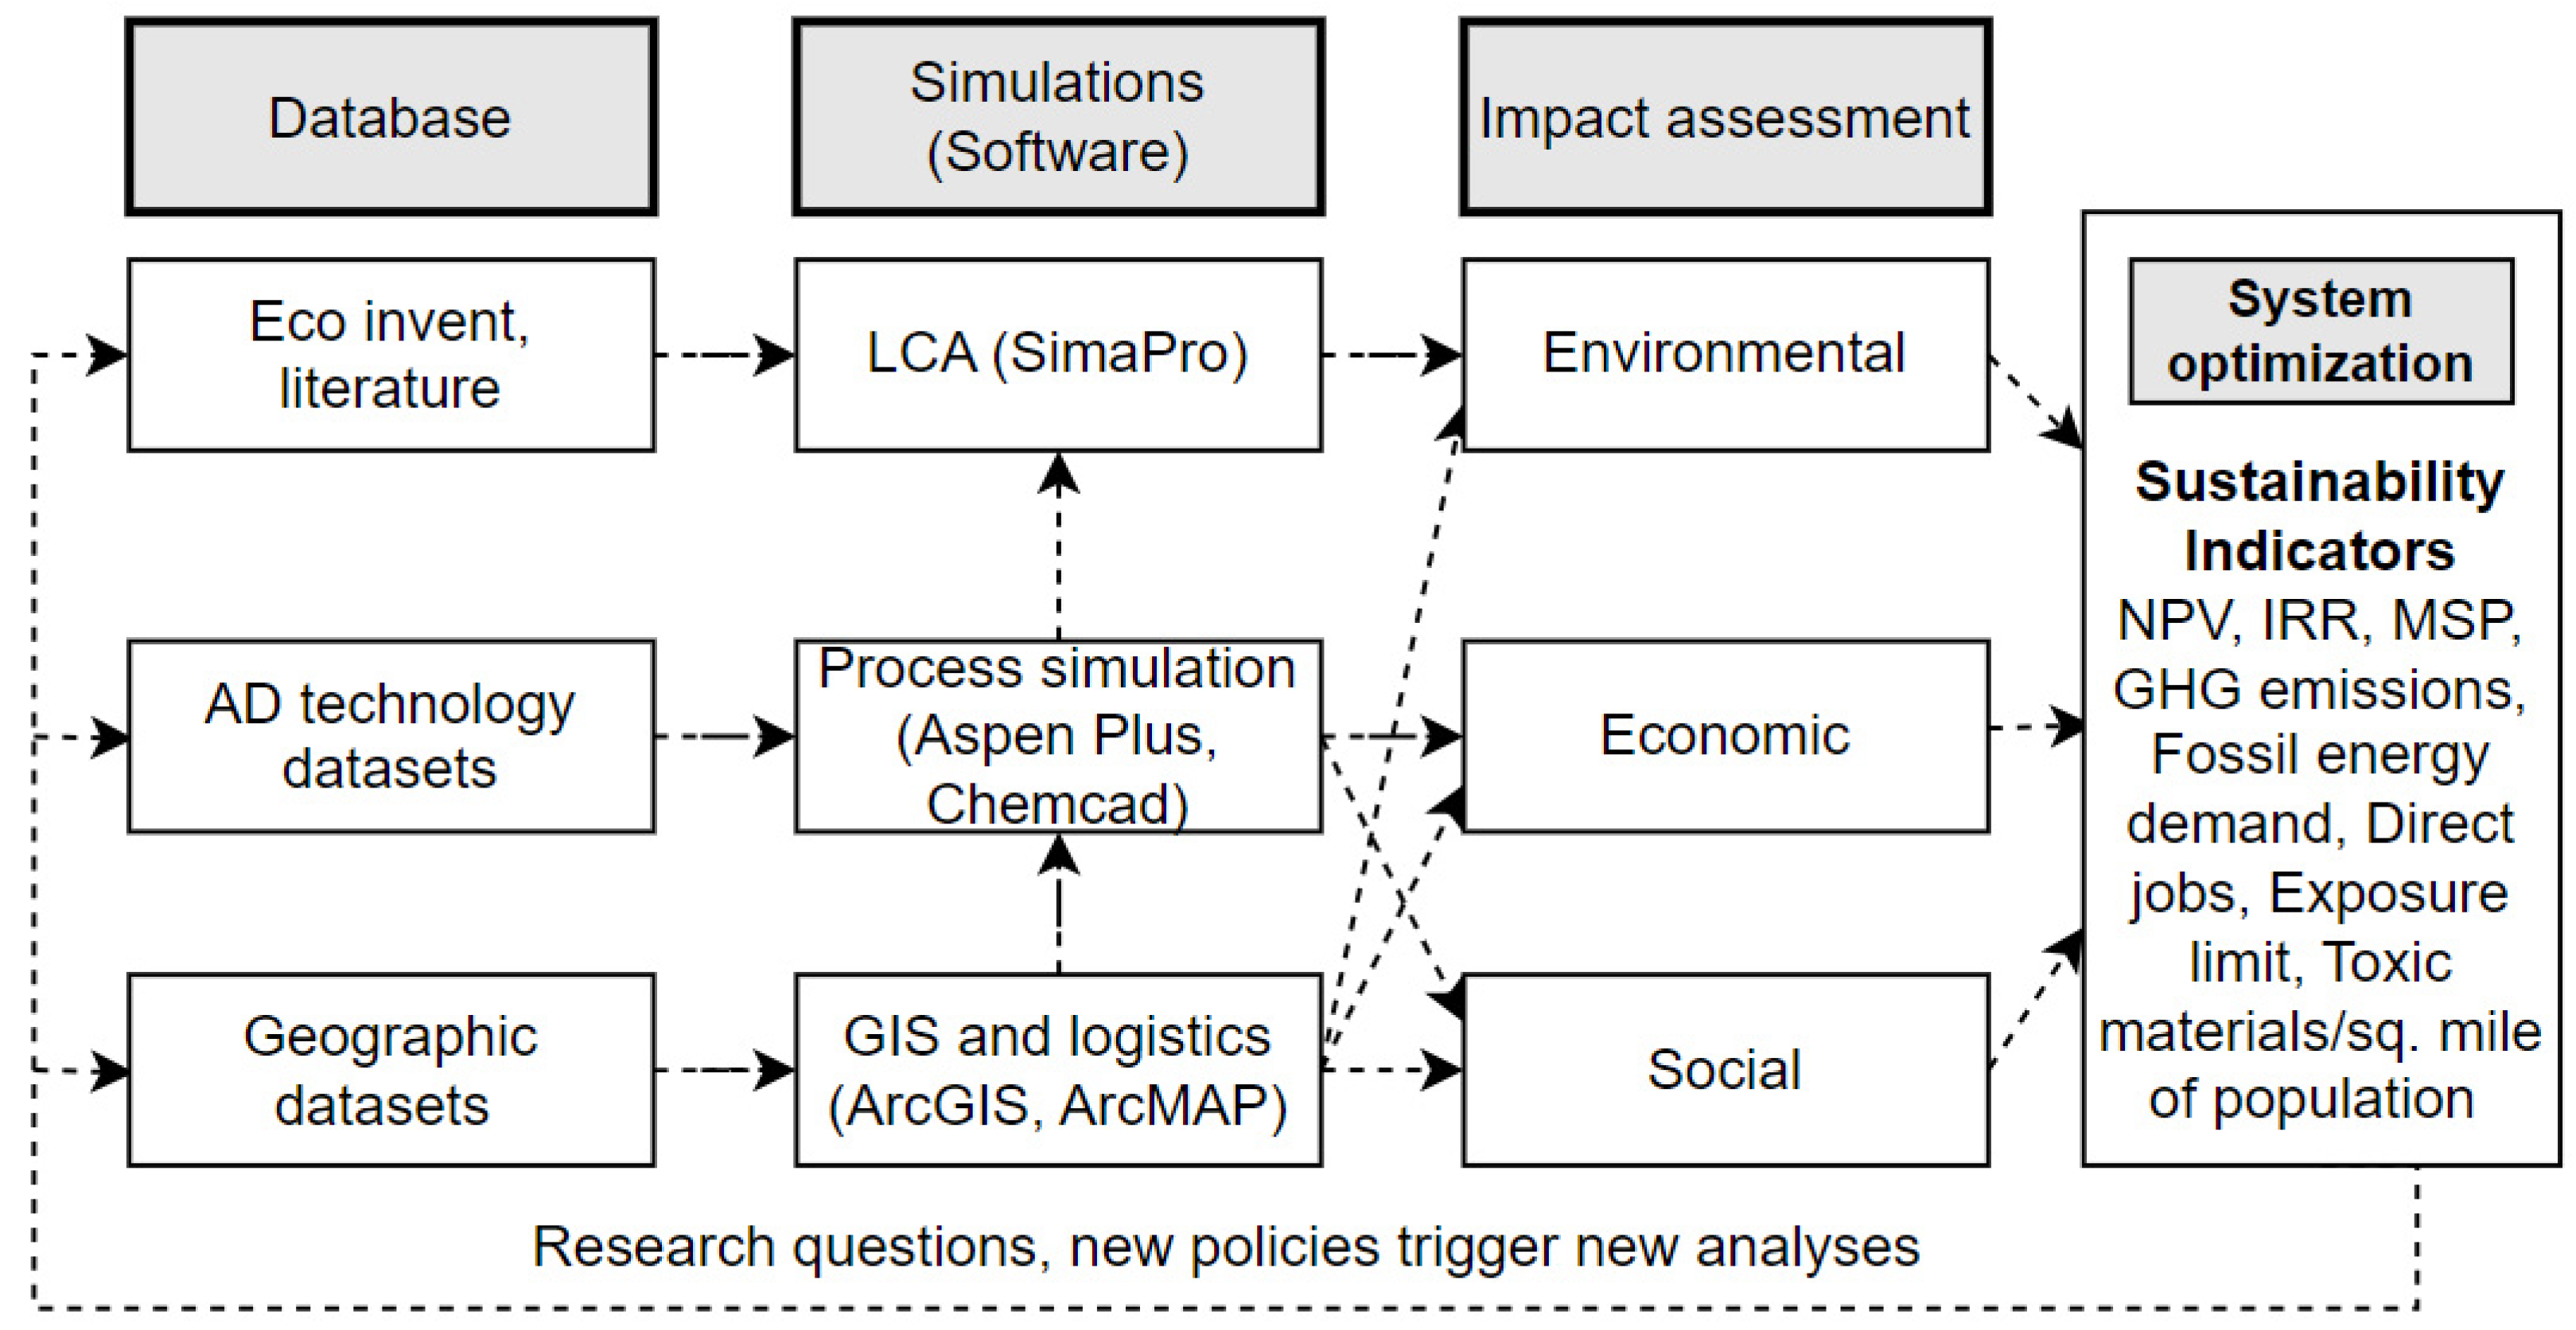
Proposed Biogas/Biomethane Sustainability Assessment Framework

A proposed model-based sustainability assessment framework is categorized into three subdomains as shown in Figure 3: databases, simulations, and impact assessment. The purpose of the sustainability assessment framework is to answer a number of important questions regarding the anaerobic co-digestion (AcoD) production system. One question might relate to the optimum locations of future biogas/biomethane production, while a second question could be about the economic, environmental, and societal costs and benefits compared to conventional waste management and continued use of fossil energy resources.
In the proposed sustainability assessment framework, the database domain contains sets of data layers, which include geographic datasets (feedstock characteristics, locations and distances, policies, etc.) in the form of attribute tables or maps, AD technology datasets (temperature, pH, residence time, capital costs, etc.) in the form of excel spreadsheets, and environmental life cycle inventory data. The simulation domain is the heart of the framework and uses multiple tools to process the obtained data from the database domain. For example, the geographic dataset is used as an input to the Arc Map tool to generate the distance from the feed location to a candidate AcoD facility. The outputs from one software tool can be communicated as an input to other software tools. For example, the Aspen Plus process simulation processes the output information from ArcMap, such as location-specific feedstock characteristics, to predict AcoD yield and process energy demands. Similarly, tools such as SimaPro and others can be used to conduct environmental LCA of the process simulation using the ISO standards by taking the outputs (energy requirements, material flow rates, etc.) from Aspen Plus software. Ultimately, the LCA model will be used to assess environmental indicators such as GHG emissions, energy demands, and other impacts of the biogas/biomethane systems. In some specific scenarios in which policies allow financial incentives for emission savings, the techno-economic analyses might require LCA outputs in the form of GHG emission savings compared to a reference business-as-usual scenario. The last domain is impact assessment in which the output list of indicators from the simulation domain is split into environmental, economic, and social categories to complete the sustainability assessment. The indicator set may be net present value (NPV), internal rate of return (IRR), minimum selling prices (MSPs), GHG emissions, and their savings compared to fossil equivalent products, fossil energy demand, direct and indirect/induced jobs, exposure limit, and toxic materials/sq. mile of the population. This framework may also include regional economic effects through the use of a general or partial equilibrium economic model. Optimization of the AcoD production systems may be included based on single or multiple objective functions. The external factors that can trigger new analyses and sustainability assessment indicators could include new research questions, new policies to encourage biogas/biomethane production, or future biogas/biomethane energy systems. Comparison to existing conditions will be useful in decision making.

3. Current Federal and State Policies on Biogas in the U.S.

Although the above-stated potentials, trends, and characteristics present an optimistic view about the application of biogas, the existence of relevant policies and legislation plays a crucial part in turning these potentials into reality. Most of the policies that incentivize or encourage the use of biogas are indirect, i.e., the policies holistically cover all renewable energy sources. The following paragraphs discuss such direct and indirect policies and programs. Agencies like the U.S. EPA (Environmental Protection Agency), USDA (United States Department of Agriculture), and DOE (Department of Energy) have passed several policies/programs at the national level to enhance the application of biogas [36]. Table 2 lists these policies and programs in detail.
The RFS program provides financial incentives for biogas-derived electricity used for transportation and approved biogas as an RFS-qualifying feedstock in 2014. Some of the complementary state programs to the federal RFS include California’s Low Carbon Fuel Standard (LCFS) and Oregon’s Clean Fuels incentive programs [37]. The Farm Bill program provides grants and loan guarantees to agricultural producers and rural small businesses to produce renewable energy and improve energy efficiency. The AgSTAR program is jointly supported by the EPA, DOE, and USDA to produce biogas at livestock operations as a means to reduce methane emissions.
The federal electricity Production Tax Credit (PTC) policy provides tax credits per kWh of qualified energy resources such as biogas. Currently, the PTC is valued at about 2.3 cents/kWh [37]. Under this policy, a modification of a facility can also receive investment credits but it should be an electricity generation facility. New market tax credits are another policy that allocates credits for projects located in low-income regions. Apart from these policies and acts of legislation, numerous policies such as the National Gas Act, Clean Air Act, Clean Energy Standard, Carbon Pricing, and Renewable Portfolio Standards directly or indirectly aid the application of biogas at the national level [38].
Similarly, there are many direct/indirect policies initiated at the state level. Most of the states in the U.S. have Renewable Portfolio Standards (RPSs) that indirectly influence the generation and application of biogas through AD. There is a wide disparity in motivation to generate and use biogas among states. This may be because of a lack of policies benchmarking the application of biogas [36]. Through the 2012 Bioenergy Action Plan, California plans to utilize and implement diverse biomass resources to produce low-carbon biofuel, biogas, and renewable electricity. Additionally, other California policies such as the Western Climate Initiative, Greenhouse Cap, and Trade Market aim to reduce GHG levels, indirectly aiding the utilization of biogas. According to Iowa’s House Bill 544, a facility employing waste conversion technologies, including anaerobic digestion, must obtain an annual permit from the department, and the annual fee for such permits is sufficient to cover the costs of the permit program. The state of Maryland has many indirect policies such as the GHG Reduction Plan and Maryland’s Source Reduction Credit System, with the goal of waste diversion and recycling rates that boost the application of biogas [39].
New York is also one of the leading states in the generation and application of biogas. There are several policies, like the Clean Energy Fund, Greenhouse Gas Bans, and the Reforming the Energy Vision (REV) proposal, that aid the application of biogas. Wisconsin has also pioneered the application of biogas through its conversion into compressed natural gas (CNG) fuel from Dane County landfill and the Janesville wastewater treatment plant. Similar policies exist in North Carolina, namely the Renewable Energy Investment Tax Credit and House Bill 681 [39]. The Database of State Incentives for Renewable Energy (DSIRE®) provides a U.S. map that can be used to find various renewable energy policies, including those related to anaerobic digestion [40]. In the year 2022, the EPA announced the Inflation reduction act (IRA) on biomass and landfill gas production tax credits. The policy mandates that through at least 2025, landfill gas or biomass production facilities obtain a tax credit of $0.0275/kWh (2023 value), as long as projects meet prevailing wage and apprenticeship requirements for projects over 1 MW AC [41].

4. Social Factors with Biogas Applications in the U.S.

Only a few U.S. studies [42] highlighted social barriers to biogas applications, while others [43] highlighted social benefits and/or issues in Germany [44], Denmark [45], Africa [46,47,48], Malaysia [49], China [50], India [51], Nepal [52,53], Latin America [54], and Bangladesh [55,56]. Even with different geographical scopes, some of the common social benefits included employment opportunities, improved health of communities, and local sources of renewable energy, while common barriers included a lack of public/stakeholder participation in decisions about biogas adoption, public acceptance, inadequate knowledge, and a desire to maintain the status quo.
In the U.S., the use of biogas as renewable energy is hindered mainly because of odor complaints, difficulties in coordination with local power and gas utilities, and following business-as-usual (BAU) (maintaining the status quo). The use of biogas for renewable energy is also hindered by human factors such as lack of knowledge and experience, breakdown in decision making, poor communication, lack of interest in green power, political support (difficulties in gaining project approval, time delay in obtaining permissions from regulators for air permitting) [42], and poor siting [57] (remote location of facility and nature of road infrastructure). Odors at an AD facility may arise from the receiving of waste itself, biogas storage bladder vents, in-vessel and outdoor composting sections, and transportation of feedstock or processed waste to and from the facility [58]. For example, the Heartland biogas facility near La Salle, Colorado, which converted food waste and cattle manure into biogas, has suspended its operations due to neighbor complaints about the unpleasant odor [59].
According to a U.S. study [42], some biogas-producing facilities may also face difficulties in coordinating with outside agents such as power and gas utilities. Many power companies may not accept biogas-produced electricity due to concerns, justified or not, over the consistency of power production. In order to overcome such difficulties with outside agents, some strategies were suggested: leverage current relationships with third parties to discuss the potential of combined heat and power (CHP), provide public education on the benefits of CHP, and classify biogas as a renewable energy source (some of the jurisdiction may not classify the same). Their study also highlighted that some facilities may not be willing to adapt to new technologies/changes and may restrict their focus only to their core objectives such as complying with National Pollutant Discharge Elimination (NPDES) permits to produce clean water and not to CHP to produce electricity. This barrier of maintaining the status quo could be overcome by highlighting the risk of the status quo to decision makers and advocating for the beneficial use of biogas.
The lack of knowledge and awareness about the benefits of biogas hinders the achievement of a robust biogas industry in the U.S. Gaining a deep understanding of the overall biogas systems and the value of investing in biogas systems in the U.S. could be beneficial for different stakeholders such as investors, the public, and policy makers [27]. Biogas-producing facilities in remote areas lack skilled and qualified workers [42]. The barrier of human factors such as decision making, communication, and a lack of experience and knowledge can be overcome by decision theory and analysis and innovation diffusion theory, which is further discussed in detail elsewhere [42].

5. Economic Costs and Benefits

Techno-economic analyses (TEAs) of biogas energy technologies determine their profitability, typically using a discounted cash flow methodology. Many prior TEA studies have focused on the use of biogas in combined heat and power applications, but less attention has been given to its application as a cooking fuel and as a vehicle fuel. Table 3 contain a summary of TEA studies highlighting different feedstocks, capacities, and profitability indicators such as NPV, payback period (PBP), IRR, capital expenditure (CAPEX), and operational expenditure (OPEX). This review is based on 14 articles from diverse geographic locations. Some of these studies use discounted cash flow analysis while others are limited to cost–benefit analysis.
Feedstocks reported in the TEA studies shown in Table 3 could be categorized into conventional substrates such as the organic fraction of MSW [63], animal manure [60,61,62,63,64,65,66,71,72,73], or food waste/kitchen waste [65,67,68,69] and other feedstocks such as milk whey and energy crops [60,61,65,68,71,73]. Some studies use lignocellulosic biomass as another source of feedstock for biogas/biomethane production, but it requires pretreatment prior to production. There is a wide range of biological, chemical, and physical–mechanical technologies for pretreatment. A detailed review of these technologies has been conducted by Kamusoko et al. [74]. The key conclusions from their study are that physical and chemical technologies are more efficient but cost- and energy-consuming, whereas biological pretreatments are most cost-effective and eco-friendly. The combined pretreatments have more cost savings but generate more toxins [74]. Capacities reported in techno-economic analysis varied between 20,000 and 200,000 tons of annual processing capacity, while the CAPEX ranged between 25 and 165 million dollars. The IRR, discount rate (DR), and PBP ranged between 7 and 20%, 8 and 15%, and 35.3 and 1.3 years for the small-scale and commercial-scale facilities, respectively.
These studies showed that co-digestion of feedstock showed a positive impact on the economic feasibility compared to mono-digestion. A study by Seyed Mostafa [73] showed that the co-digestion of cheese whey and raw dairy manure to produce electricity and heat has a positive NPV for all sizes of herds (minimum 115 heads) at high cheese whey ratios (>30%) compared to mono-digestion of animal manure. The IRR and PBP in Mostafa’s study were found to be 10% and <9 years, respectively, at a co-digestion ratio of 70:30 of manure/cheese whey [73]. The microbial conditions affect the economics of biogas plants. For example, a study by Mikael [66] on CHP generated from biogas based on the AD of manure alone illustrated that a capacity of 1–6 GWh/annum at a 5% interest rate is not profitable under the market conditions in Sweden, whereas biogas processes operated under thermophilic conditions showed higher profitability compared to mesophilic conditions. Martínez-Ruano studied the co-digestion of milk whey and potato to generate electricity with a 14 MW capacity and showed that with higher organic loadings, NPV decreased from USD -45 M. to USD -21 M but was still negative due to high raw material costs [68]. Additionally, Alvina’s study [71] on co-digestion with glycerin increased the profitability of biogas CHP plants (increased ROI by 27%). Moreover, profitability increases with an increase in the size of biogas plants due to the economies of scale effect [61].
Most of the studies reported that the lack of incentive policies, high capital costs, and low tipping fees are the critical barriers in biogas-to-energy or biogas-to-fuel technologies [60,64,68,69,70]. A study by Sanscartier [70] from Canada showed that with the current feed-in tariff (FiT) rate ($0.147/kWh), a 200 kt/yr co-digestion facility requires a CAD 50/t tipping fee to attain an 11% IRR, while a 50 kt/yr facility requires a CAD 95/t fee not accounting for the revenue from digestate sales. Ullah [67] studied the effect of carbon credits by varying the tipping fee and including carbon credits to attain a 10% IRR. The results from that study showed that the facility requires a tipping fee of CAD 81/t for small-scale (SS) (500 t/yr.), CAD 64/t for medium-scale (MS) (1000 t/yr.), and CAD 57/t, for large-scale (LS) (2000 t/yr.) facilities for 10% IRR. Keeping the gate fee at CAD 65/t and with carbon credits, the IRR is 3.6, 10.5, and 17.8 for SS, MS, and LS facilities, respectively.
Studies also showed that biogas produced in a CHP unit is more profitable than utilizing biogas in a combustion unit that produces only heat [62]. Upgrading from CHP to biomethane for an existing plant is not economically feasible without incentives due to the high upfront costs for biomethane separation [60], but producing biogas for cooking and replacing LPG and kerosene is economically and environmentally feasible in both subsidized and non-subsidized scenarios [63]. Understanding the economics of biogas upgrading to biomethane using appropriate solvents and the transportation and storage of biomethane is important for determining the overall economic sustainability of biogas production. A recent study by Haider et al. [75] concluded that the deep eutectic solvent (70%)-based biogas upgrading process can achieve overall capital, operating, and total annualized cost savings of 3%, 26%, and 14%, respectively, when compared with conventional monoethanolamine solvent-based processes.
To summarize the above-reviewed TEA studies, most of them lacked detailed information on the TEA methodology. There are inconsistencies in the TEA assumptions, parameters, and degrees of transparency related to discounted cash flow analysis, such as methods to estimate operational costs, the life of the plant, etc. For example, Rajendran’s study [64] considered operating costs as 5% of the CAPEX, Mikael’s study [66] considered 2.5–4% of CAPEX, while Klavon’s study [64] considered 2–4% of the CAPEX. Most of the reviewed TEA studies conducted sensitivity analyses around the TEA parameters such as discount rate, electricity price, feedstock cost, etc.; however, only a few studies conducted uncertainty analysis using Monte Carlo simulations. Conducting scenario, sensitivity, and uncertainty analyses would help to strengthen the full representation of TEA results and their future applications. Therefore, a standardized TEA method is needed to establish a baseline and accurately analyze as well as compare the economic impacts of biogas and/or biomethane production.

6. Environmental Issues of Biogas Production

There are many reviews focused on the environmental life cycle assessment (LCA) of AD, some emphasizing different feedstocks such as food waste co-digestion [76,77], manure alone [78], and co-digestion of manure with energy crops [79]. Some are location-specific, such as LCA of biogas in Europe [80] and co-digestion of pig slurry and energy crops in Italy [80], and a few are based on applications such as electricity [81]. A detailed summary of different LCA studies based on diverse geographic locations with multiple feedstock types and multiple products is shown in Table 4.
The listed LCAs were conducted based on ISO 14040 and ISO 14044 standards and their respective AD feedstocks are reported in the study. Feedstocks reported in the LCAs are categorized into conventional substrates such as the organic fraction of MSW [84,85,90], animal manure [79,82,83,86,88,89,90,91], or food waste/kitchen waste/bakery waste [3,77,82,83,87,88,90], and the other feedstocks include sewage sludge and energy crops [79,86,87,91]. The system boundaries from the studies reviewed include either cradle-to-grave or cradle-to-gate and analyses were reported over a wide range of impact categories. The functional units of these studies were mainly focused on feedstock or application of the biogas (as fuel, electricity, and heat). The major outcomes from the studies include that co-digestion of food waste is environmentally advantageous compared to traditional waste management due to avoiding high impacts of methane emissions to the environment [82,83,87]. Energy from biogas plays a significant role in environmental assessment; the higher the energy output, the lesser the environmental impacts [90]. The following section summarizes the assumptions, limitations, and key results of the LCAs in Table 4.
Lijo et al., 2014 [79], conducted an LCA of an operational biogas power plant in Italy co-digesting pig slurry and energy crops for electricity and heat generation. The functional unit (FU) used in this study was 100 kWh of combined heat and power (CHP) electricity. The system boundary for Lijo et al.’s study did not include pig slurry management. The avoided product perspective was used to account for digestate in the overall impacts of electricity by substituting the digestate for synthetic fertilizer. The total net emissions of the system were found to be −0.016 kg CO2/100 kWh-e. The combustion emissions from biogas power plants had a major impact with respect to GWP and the emissions could be significantly reduced by taking account of the avoided manure management emissions.
Ebner et al., 2015 [82], performed a comparative LCA of conventional management of FW and dairy manure relative to the anaerobic co-digestion of manure and food waste to generate electricity. The FU used in this study was one metric ton of influent processed. The system expansion method was used to evaluate the emissions avoided by displacing inorganic fertilizers and grid electricity but did not completely look at avoiding different landfill scenarios in the conventional case and did not consider the biogenic emissions during the combustion of biogas. The key results from the Ebner study showed a 71% reduction in GHG emissions for AcoD compared to conventional.
Chen et al., 2015 [83], compared the disposal of bakery waste in an uncovered landfill site and the AD of a manure system (base case) with the AcoD of bakery waste and dairy manure to produce electricity, heat, and agricultural products. The functional unit used in this study was 7153 dry metric tons (t) of dairy manure (DM) and 2382 dry tons of FW per year. This study did not consider the allocation of co-products, avoided emissions from synthetic fertilizer or electricity, and biogenic emissions such as the combustion of biogas. The key results from this study showed that AcoD had high potential for the mitigation of GWP (around 67% reduction compared to the base case) and landfill of bakery waste alone contributed only 20% to the overall emissions in the base case.
The Bolin et al., 2009 [84] LCA focused mainly on the application of biogas as electricity and as vehicle fuel compared to base case incineration (combustion and plant operation) in Singapore. The functional unit used in this study was 1 ton of organic fraction of municipal solid waste (OFMSW). The base case scenario was compared to the biogas (as a fuel, electricity, and heat source) scenario by adding makeup inorganic fertilizer and electricity from natural gas. The scenarios were based on biogas usage (electricity and heat or fuel); in the biogas as vehicle fuel scenario, part of the produced biogas was upgraded to biomethane to replace biodiesel in vehicles and the remainder was used for electricity generation. The key results from Bolin’s [84] study showed that the production of biogas had 82.5% emission savings compared to conventional incineration and that using biogas for vehicle fuel seemed to be more beneficial environmentally compared to electricity generation.
The Xu et al., 2015 [3], study looked at three different scenarios of treating FW: (1) the AD of FW and sewage sludge, (2) the AD of FW, and (3) FW to landfill. Wastewater from AD was sent to sewage sludge plants in cases a and b, and the FW was landfilled (the emissions included electricity consumption and recovery, raw material consumption, leachate treatment, and direct gas emissions). The functional unit used in this study was 1 ton of volatile solids (VSs). Combustion emissions from biogas were included in the analysis. The study did not consider the avoided emissions from FW and electricity. The key results showed a significant difference in the environmental impacts. Case (3) had much lower GHG emissions with 169 kg CO2 eq/FU (66% emissions from electricity used in AD + 21% direct emissions) compared to the landfill case with 181 kg CO2 eq/FU (CaO (41%) + transport (34%)).
An LCA of upgraded biogas (biomethane) as a transportation fuel was conducted in the Lyng et al., 2019 [88], study. Vehicle traveled per km was used as a functional unit, and nine different scenarios were evaluated (upgraded biogas (biomethane) from food waste, upgraded biogas (biomethane) from the AD of manure, natural gas, electrical vehicle (electricity from hydropower), electrical vehicle (electricity from coal), Biodiesel (HVO) based on waste cooking oil, Biodiesel (FAME) based on rapeseed oil, Biodiesel (FAME) based on palm oil, Diesel (fossil)). Four different life cycle stages were considered, including (1) production of the fuel, (2) distribution of the fuel, (3) production and maintenance of the vehicle, and (4) driving. Biogenic carbon emissions were not considered in the analysis and were assumed to make a negligible contribution in the assessment. The avoided emissions from short-time manure storage were not included. The results from Lyng’s [84] study showed that the biggest emissions were for electricity from coal power (1.09 kg CO2/FU), natural gas (0.84 kg CO2/FU), and diesel from driving vehicles (0.92 kg CO2/FU), whereas with renewables, most of the emissions were from the processing or production of biogas or hydroelectric power. Electricity from hydro power had the least emissions (0.11 kg CO2/FU) and among food waste biogas and manure biogas production, FW biogas production had much lower emissions than manure (0.28 kg CO2/FU).
LCAs of different biogas configurations were evaluated in the Hahn et al., 2015 [89], study. The functional unit used in that study was 1 MJ of biogas. The Hahn [89] study did not include biogenic CO2 emissions but did account for biogenic methane credits. Key savings were achieved by replacing natural gas and synthetic fertilizers and avoiding emissions from conventional manure management. The scenarios are listed in Table 4 and key results range from 54 to 66 g CO2-eq MJ−1.
The LCAs reviewed above showed diverse results mainly due to inconsistencies in the applied methodology, variations in assumptions, and system boundaries used. Given the importance of GHG emissions for LCAs and how complex AcoD bioenergy systems are, the use of food waste and manure for bioenergy touches on many other processes in the techno sphere (landfill processes, conventional manure management, fertilizer production/use, conventional electricity production) with implications for GHG emissions. Therefore, these associated processes should be included in biogas/biomethane LCAs. Also, many of the studies in Table 4 report LCA results on an input basis (e.g., tons of FW and manure processed) rather than on an output basis (output of electricity or biomethane, etc.). The other distinct feature missing in the reviewed LCAs is the comparison of consequential versus attributional LCA, which is addressed in [21] and very few studies. However, Ankathi et al. modeled GHG emissions dynamically rather than statically. As a result of these methodology variations, it is very difficult to compare LCA results when the FU is so different and when the methods are so diverse as in the collection of literature. There is an urgent need to develop recommendations for the standardization of LCAs for biogas/biomethane production so that equivalent comparisons between studies can be made, a better understanding can be achieved of the relative importance of all the processes in the system, and recommendations for improvement can be made with greater certainty.

7. Conclusions and Future Work

This article presented an overview of the literature on sustainability dimensions and issues for future biogas and biomethane production from AcoD of food waste and animal manure mixtures in the U.S. and other parts of the world. The key conclusions in this study are as follows:
  • The co-digestion of feedstocks to produce renewable energy has been shown to be environmentally and economically advantageous over mono-digestion [92].
  • The review of AcoD LCAs indicated a need for the standardization of methodology so that alternative production concepts can be objectively compared.
  • Most of the reviewed TEA studies lacked detailed information on the TEA methodology. There is inconsistency in the TEA assumptions between publications.
  • This paper presented a review of different frameworks for the sustainability assessment of biogas systems, and the proposed framework helps us to integrate large multi-disciplinary datasets such as geographic data, environmental data, socio-economic data, and policy data for developing a multi-criteria decision-making tool.
China and India are among the world’s largest contributors to landfill emissions, releasing significant amounts of methane and carbon dioxide into the atmosphere [93,94]. According to Du et al., 2017, from 2003 to 2013, the amount of methane gas released from landfills that handle municipal solid waste (MSW) in different Chinese provinces increased from 1141.10 gigagrams to 1858.98 gigagrams. On average, this means there was a yearly increase of about 71.79 gigagrams during this period [93]. According to Duan et al., 2023, manure management alone in China contributed 14% of agricultural methane emissions in 2020 [95]. Similarly, India faces a growing challenge, with the methane emissions from landfills having increased twofold, rising from 31.06 gigagrams per year to 65.16 gigagrams per year between 1999/2000 and 2015 [94]. These statistics underscore the urgent need for both nations to implement sustainable waste management practices to mitigate environmental impacts and curb greenhouse gas emissions. Incorporating the proposed framework for sustainability assessment will help policy makers and investors to fully understand the potential of biogas from food waste and animal manure and its significant methane emission reductions. The needs of future biogas and the sustainable management of feedstock can be met by addressing the inconsistencies in the TEA and LCA methodologies and adopting our proposed framework for analysis.

Author Contributions

Conceptualization, D.R.S. and S.K.A.; methodology, D.R.S.; software, S.K.A.; validation, S.K.A., U.S.C. and D.R.S.; formal analysis, S.K.A. and U.S.C.; investigation, S.K.A.; data curation, S.K.A.; writing—original draft preparation, S.K.A.; writing—review and editing, D.R.S. and R.M.H.; visualization, S.K.A.; supervision, D.R.S. and R.M.H.; project administration, D.R.S. All authors have read and agreed to the published version of the manuscript.

Funding

This research received no external funding.

Data Availability Statement

Not applicable.

Acknowledgments

We would like to thank graduate students, Chaitanya Bhat, Yogesh Shejal, and Munkaila Musah, who helped in preparing this manuscript. The authors thank the Richard and Bonnie Robbins Endowment and the Sustainable Futures Institute at Michigan Technological University for financial support for Sharath K. Ankathi in this research.

Conflicts of Interest

The authors declare no conflict of interest.

Abbreviations

AcoDAnaerobic co-digestion
ADAnaerobic digestion
BAUBusiness-as-usual
BMPBiomethane potentials
CAPEXCapital expenditure
CHPCombined heat and power
C/NCarbon/Nitrogen
CNGCompressed natural gas
DMDairy manure
DOEDepartment of Energy
DRDiscount rate
EPAEnvironmental Protection Agency
FAOFood and Agriculture Organization
FiTFeed in tariff
FUFunctional unit
FWFood waste
GHGGreenhouse gas
GWPGlobal warming potential
GISGeographical information systems
HRTHydraulic retention time
IRRInternal rate of return
IWAInternational Water Association
LCALife cycle assessment
LCFSLow Carbon Fuel Standard
LFGLandfill gas
LMOPLandfill Methane Outreach Program
MILPMixed integer linear programming
MMTMillion metric tons
MSWMunicipal solid waste
MWMegawatts
NPVNet present value
OFMSWOrganic fraction of municipal solid waste
OLROrganic loading rate
OPEXOperational expenditure
PBPPayback period
PTCProduction Tax Credit
REVReforming the Energy Vision
RFSRenewable Fuel Standard
RNGRenewable natural gas
RPSRenewable Portfolio Standards
VSVolatile solids
USDAUnited States Department of Agriculture
USDUnited States Dollar

References

  1. Food and Agriculture Organization (FAO). Food Wastage Footprint: Impacts on Natural Resources. In Summary Report; FAO: Rome, Italy, 2013; Available online: http://www.fao.org/3/i3347e/i3347e.pdf (accessed on 26 July 2020).
  2. Forbes, H.; Quested, T.; O’Connor, C. United Nations Environment Programme (UNEP). In Food Waste Index Report; UNEP: Nairobi, Kenya, 2021; Available online: https://www.unep.org/resources/report/unep-food-waste-index-report-2021 (accessed on 16 April 2021).
  3. Xu, C.; Shi, W.; Hong, J.; Zhang, F.; Chen, W. Life cycle assessment of food waste-based biogas generation. Renew. Sustain. Energy Rev. 2015, 49, 169–177. [Google Scholar] [CrossRef]
  4. Taelman, S.; Tonini, D.; Wandl, A.; Dewulf, J. A holistic sustainability framework for waste management in European cities: Concept development. Sustainability 2018, 10, 2184. [Google Scholar] [CrossRef]
  5. Ingrao, C.; Faccilongo, N.; Di Gioia, L.; Messineo, A. Food waste recovery into energy in a circular economy perspective: A comprehensive review of aspects related to plant operation and environmental assessment. J. Clean. Prod. 2018, 184, 869–892. [Google Scholar] [CrossRef]
  6. Al Seadi, T.; Stupak, I.; Smith, C.T. Governance of environmental sustainability of manure-based centralised biogas production in Denmark. IEA Bioenergy 2018, 7. [Google Scholar]
  7. Ontario Ministry of the Environment and Climate Change. Discussion Paper: Addressing Food and Organic Waste in Ontario; Ontario Ministry of the Environment and Climate Change: Toronto, ON, USA, 2017. Available online: https://opha.on.ca/wp-content/uploads/2020/09/FINAL_MOECC_Consultation_OPHA_OSNPPH_DC_PROOF_AUG01-2017-1.pdf?ext=pdf (accessed on 8 January 2024).
  8. European Commission (EU). Communication from the Commission to the European Parliament, the Council, the European Economic and Social Committee and the Committee of the Regions, Closing the Loop—An EU Action Plan for the Circular Economy; EU: Brussels, Belgium, 2015; Available online: https://eur-lex.europa.eu/legal-content/EN/TXT/?uri=CELEX:52015DC0614 (accessed on 26 July 2020).
  9. USEPA. National Overview: Facts and Figures on Materials, Wastes and Recycling. 2018. Available online: https://www.epa.gov/facts-and-figures-about-materials-waste-and-recycling/national-overview-facts-and-figures-materials (accessed on 16 April 2021).
  10. The Water Research Foundation. Executive Summary: Sustainable Food Waste Evaluation. In WERF Report; 2012; p. OWSO5R07e. Available online: https://www.waterrf.org/research/projects/sustainable-food-waste-evaluation (accessed on 8 January 2024).
  11. Environmental Protection Agency. Inventory of U.S. Greenhouse Gas Emissions and Sinks: 1990–2021; U.S. Environmental Protection Agency: Washington, DC, USA, 2023; EPA 430-R-23-002. Available online: https://www.epa.gov/ghgemissions/inventory-us-greenhouse-gas-emissions-andsinks-1990-2021 (accessed on 8 January 2024).
  12. Global Methane Initiative (GMI). Global Methane Initiative: An Overview. Available online: https://www.globalmethane.org/documents/gmi-factsheet.pdf (accessed on 26 July 2020).
  13. Environmental Protection Agency. Inventory of US Greenhouse Gas Emissions and Sinks: 1990–2016; EPA 430-R-18-003; EPA: Washington, DC, USA, 2018; pp. 1–655.
  14. Hristov, A.N.; Johnson, K.A.; Kebreab, E. Livestock methane emissions in the United States. Proc. Natl. Acad. Sci. USA 2014, 111, E1320. [Google Scholar] [CrossRef]
  15. US EPA. 2023. Available online: https://www.epa.gov/lmop/landfill-gas-energy-project-data (accessed on 8 January 2024).
  16. Advanced Disposal. Landfill Gas-to-Energy Turning Waste into Energy. Available online: https://www.advanceddisposal.com/for-mother-earth/education-zone/landfill-gas-to-energy.aspx (accessed on 26 July 2020).
  17. Baldi, E.; Toselli, M.; Marcolini, G.; Quartieri, M.; Cirillo, E.; Innocenti, A.; Marangoni, B. Compost can successfully replace mineral fertilizers in the nutrient management of commercial peach orchard. Soil Use Manag. 2010, 26, 346–353. [Google Scholar] [CrossRef]
  18. Taiwo, A.M. Composting as a sustainable waste management technique in developing countries. J. Environ. Sci. Technol. 2011, 4, 93–102. [Google Scholar] [CrossRef]
  19. Goldstein, N. The state of organics recycling in the US. BioCycle 2017, 58, 22. [Google Scholar]
  20. Containers, Packaging, and Non-Durable Good. Documentation for Greenhouse Gas Emission and Energy Factors Used in the Waste Reduction Model (WARM). 2016. Available online: https://www.epa.gov/warm/documentation-waste-reduction-model-warm (accessed on 8 January 2024).
  21. Ankathi, S.K.; Potter, J.S.; Shonnard, D.R. Carbon footprint and energy analysis of bio-CH 4 from a mixture of food waste and dairy manure in Denver, Colorado. Environ. Prog. Sustain. Energy 2018, 37, 1101–1111. [Google Scholar] [CrossRef]
  22. Komilis, D.; Ham, R.; Stegmann, R. The effect of municipal solid waste pretreatment on landfill behavior: A literature review. Waste Manag. Res. 1999, 17, 10–19. [Google Scholar] [CrossRef]
  23. Fricke, K.; Santen, H.; Wallmann, R. Comparison of selected aerobic and anaerobic procedures for MSW treatment. Waste Manag. 2005, 25, 799–810. [Google Scholar] [CrossRef]
  24. De Gioannis, G.; Muntoni, A.; Cappai, G.; Milia, S. Landfill gas generation after mechanical biological treatment of municipal solid waste. Estimation of gas generation rate constants. Waste Manag. 2009, 29, 1026–1034. [Google Scholar] [CrossRef]
  25. Di Maria, F.; Sordi, A.; Micale, C. Experimental and life cycle assessment analysis of gas emission from mechanically–biologically pretreated waste in a landfill with energy recovery. Waste Manag. 2013, 33, 2557–2567. [Google Scholar] [CrossRef] [PubMed]
  26. National Renewable Energy Laboratory. Energy Analysis: Biogas Potential in the United States. 2013. Available online: https://www.nrel.gov/docs/fy14osti/60178.pdf (accessed on 29 March 2020).
  27. USDA. Biogas Opportunities Roadmap: Voluntary Actions to Reduce Methane Emissions and Increase Energy Independence. 2014. Available online: https://www.epa.gov/sites/production/files/2015-12/documents/biogas-roadmap.pdf (accessed on 26 July 2020).
  28. National Conference of State Legislatures. State Renewable Portfolio Standards and Goals. 2020. Available online: https://www.ncsl.org/research/energy/renewable-portfolio-standards.aspx (accessed on 26 July 2020).
  29. Höhn, J.; Lehtonen, E.; Rasi, S.; Rintala, J. A Geographical Information System (GIS) based methodology for determination of potential biomasses and sites for biogas plants in southern Finland. Appl. Energy 2014, 113, 1–10. [Google Scholar] [CrossRef]
  30. Pantaleo, A.; De Gennaro, B.; Shah, N. Assessment of optimal size of anaerobic co-digestion plants: An application to cattle farms in the province of Bari (Italy). Renew. Sustain. Energy Rev. 2013, 20, 57–70. [Google Scholar] [CrossRef]
  31. Park, Y.S. Three Essays on Sustainability of Transportation and Supply Chain. Ph.D. Thesis, North Dakota State University, Fargo, ND, USA, 2018. [Google Scholar]
  32. Laasasenaho, K.; Lensu, A.; Lauhanen, R.; Rintala, J. GIS-data related route optimization, hierarchical clustering, location optimization, and kernel density methods are useful for promoting distributed bioenergy plant planning in rural areas. Sustain. Energy Technol. Assess. 2019, 32, 47–57. [Google Scholar] [CrossRef]
  33. Bioteau, T.; Boret, F.; Tretyakov, O.; Béline, F.; Balynska, M.; Girault, R. A GIS-Based Approach for Optimizing the Development of Collective Biogas Plants. In Global Assessment for Organic Resources and Waste Management; Verlag ORBIT: London, UK, 2012; p. 8. [Google Scholar]
  34. Balaman, Ş.Y.; Selim, H. A network design model for biomass to energy supply chains with anaerobic digestion systems. Appl. Energy 2014, 130, 289–304. [Google Scholar] [CrossRef]
  35. Shonnard, D.R.; Tipaldo, E.; Thompson, V.; Pearce, J.; Caneba, G.; Handler, R.M. Systems analysis for PET and olefin polymers in a circular economy. In Proceedings of the 26th CIRP Life Cycle Engineering (LCE) Conference, West Lafayette, IN, USA, 7–9 May 2019; Volume 80, pp. 602–606. [Google Scholar]
  36. USDA. Biogas Opportunities Roadmap Progress Report. 2015. Available online: https://www.epa.gov/sites/production/files/2015-12/documents/biogas-roadmap-progress-report.pdf (accessed on 27 July 2020).
  37. Gasper, R.; Searchinger, T. The Production and Use of Renewable Natural Gas as a Climate Strategy in the United States; World Resources Institute: Washington, DC, USA, 2018. [Google Scholar]
  38. American Biogas Council. American Biogas Council—State Profiles. Available online: https://americanbiogascouncil.org/resources/state-profiles/ (accessed on 27 July 2020).
  39. American Biogas Council. Biogas State Profile: Maryland. Available online: https://americanbiogascouncil.org/wp-content/uploads/2019/02/ABCBiogasStateProfile_MD.pdf (accessed on 27 July 2020).
  40. DSIRE. Database of State Incentives for Renewables & Efficiency (DSIRE). Available online: https://www.dsireusa.org/ (accessed on 27 July 2020).
  41. von Loesecke, E.; Chermak, C. The Inflation Reduction Act: Impacts on Utilities and Power Producers. Clim. Energy 2023, 39, 1–10. [Google Scholar] [CrossRef]
  42. Willis, J.; Stone, L.; Durden, K.; Beecher, N.; Hemenway, C.; Greenwood, R. Barriers to Biogas Use for Renewable Energy; Water Environment Research Foundation: online, 2012. [Google Scholar]
  43. Nevzorova, T.; Kutcherov, V. Barriers to the wider implementation of biogas as a source of energy: A state-of-the-art review. Energy Strategy Rev. 2019, 26, 100414. [Google Scholar] [CrossRef]
  44. Thrän, D.; Schaubach, K.; Majer, S.; Horschig, T. Governance of sustainability in the German biogas sector—Adaptive management of the Renewable Energy Act between agriculture and the energy sector. Energy Sustain. Soc. 2020, 10, 3. [Google Scholar] [CrossRef]
  45. Zemo, K.H.; Termansen, M. Farmers’ willingness to participate in collective biogas investment: A discrete choice experiment study. Resour. Energy Econ. 2018, 52, 87–101. [Google Scholar] [CrossRef]
  46. Arthur, R.; Baidoo, M.F.; Antwi, E. Biogas as a potential renewable energy source: A Ghanaian case study. Renew. Energy 2011, 36, 1510–1516. [Google Scholar] [CrossRef]
  47. Mwirigi, J.; Balana, B.B.; Mugisha, J.; Walekhwa, P.; Melamu, R.; Nakami, S.; Makenzi, P. Socio-economic hurdles to widespread adoption of small-scale biogas digesters in Sub-Saharan Africa: A review. Biomass Bioenergy 2014, 70, 17–25. [Google Scholar] [CrossRef]
  48. Mengistu, M.; Simane, B.; Eshete, G.; Workneh, T. A review on biogas technology and its contributions to sustainable rural livelihood in Ethiopia. Renew. Sustain. Energy Rev. 2015, 48, 306–316. [Google Scholar] [CrossRef]
  49. Bong, C.P.C.; Ho, W.S.; Hashim, H.; Lim, J.S.; Ho, C.S.; Tan, W.S.P.; Lee, C.T. Review on the renewable energy and solid waste management policies towards biogas development in Malaysia. Renew. Sustain. Energy Rev. 2017, 70, 988–998. [Google Scholar] [CrossRef]
  50. Chen, Q.; Liu, T. Biogas system in rural China: Upgrading from decentralized to centralized? Renew. Sustain. Energy Rev. 2017, 78, 933–944. [Google Scholar] [CrossRef]
  51. Mittal, S.; Ahlgren, E.O.; Shukla, P. Barriers to biogas dissemination in India: A review. Energy Policy 2018, 112, 361–370. [Google Scholar] [CrossRef]
  52. Bajgain, S.; Shakya, I.S. A Successful Model of Public Private Partnership for Rural Household Energy Supply; SNV: Kigali, Rwanda, 2005. [Google Scholar]
  53. Gautam, R.; Baral, S.; Herat, S. Biogas as a sustainable energy source in Nepal: Present status and future challenges. Renew. Sustain. Energy Rev. 2009, 13, 248–252. [Google Scholar] [CrossRef]
  54. Garfí, M.; Martí-Herrero, J.; Garwood, A.; Ferrer, I. Household anaerobic digesters for biogas production in Latin America: A review. Renew. Sustain. Energy Rev. 2016, 60, 599–614. [Google Scholar] [CrossRef]
  55. Kabir, H.; Yegbemey, R.N.; Bauer, S. Factors determinant of biogas adoption in Bangladesh. Renew. Sustain. Energy Rev. 2013, 28, 881–889. [Google Scholar] [CrossRef]
  56. Mandal, S.; Ghosh, S. Evaluation of biogas as an alternative driving force of electrically operated vehicles: A case study. Int. J. Eng. 2018, 31, 834–840. [Google Scholar]
  57. Fike, J.H.; Parrish, D.J.; Alwang, J.; Cundiff, J.S. Challenges for deploying dedicated, large-scale, bioenergy systems in the USA. CAB Rev. 2007, 2, 1–28. [Google Scholar] [CrossRef]
  58. Satchwell, A.J.; Scown, C.D.; Smith, S.J.; Amirebrahimi, J.; Jin, L.; Kirchstetter, T.W.; Brown, N.J.; Preble, C.V. Accelerating the deployment of anaerobic digestion to meet zero waste goals. Environ. Sci. Technol. 2018, 52, 13663–13669. [Google Scholar] [CrossRef]
  59. Waste360. Residents Complain about Odors at the Heartland Biogas Facility in Colorado. 2017. Available online: https://www.waste360.com/waste-energy/residents-complain-about-odors-heartland-biogas-facility-colorado (accessed on 27 July 2020).
  60. di Perta, E.S.; Cervelli, E.; di Campagna, M.P.; Pindozzi, S. From biogas to biomethane: Techno-economic analysis of an anaerobic digestion power plant in a cattle/buffalo farm in central Italy. J. Agric. Eng. 2019, 50, 127–133. [Google Scholar] [CrossRef]
  61. Samer, M.; Abdelaziz, S.; Refai, M.; Abdelsalam, E. Techno-economic assessment of dry fermentation in household biogas units through co-digestion of manure and agricultural crop residues in Egypt. Renew. Energy 2020, 149, 226–234. [Google Scholar] [CrossRef]
  62. Akbulut, A. Techno-economic analysis of electricity and heat generation from farm-scale biogas plant: Çiçekdağı case study. Energy 2012, 44, 381–390. [Google Scholar] [CrossRef]
  63. Rajendran, K.; Aslanzadeh, S.; Johansson, F.; Taherzadeh, M.J. Experimental and economical evaluation of a novel biogas digester. Energy Convers. 2013, 74, 183–191. [Google Scholar] [CrossRef]
  64. Klavon, K.H.; Lansing, S.A.; Mulbry, W.; Moss, A.R.; Felton, G. Economic analysis of small-scale agricultural digesters in the United States. Biomass Bioenergy 2013, 54, 36–45. [Google Scholar] [CrossRef]
  65. Valenti, F.; Porto, S.M.; Dale, B.E.; Liao, W. Spatial analysis of feedstock supply and logistics to establish regional biogas power generation: A case study in the region of Sicily. Renew. Sustain. Energy Rev. 2018, 97, 50–63. [Google Scholar] [CrossRef]
  66. Lantz, M. The economic performance of combined heat and power from biogas produced from manure in Sweden—A comparison of different CHP technologies. Appl. Energy 2012, 98, 502–511. [Google Scholar] [CrossRef]
  67. Ullah, M. Techno-economic Assessment of Utilization of Food Processing Waste for Production of Energy and Chemicals. Master’s Thesis, University of Alberta, Edmonton, AB, Canada, 2017. [Google Scholar]
  68. Martínez-Ruano, J.A.; Restrepo-Serna, D.L.; Carmona-Garcia, E.; Giraldo, J.A.P.; Aroca, G.; Cardona, C.A. Effect of co-digestion of milk-whey and potato stem on heat and power generation using biogas as an energy vector: Techno-economic assessment. Appl. Energy 2019, 241, 504–518. [Google Scholar] [CrossRef]
  69. Moriarty, K. Feasibility Study of Anaerobic Digestion of Food Waste in St. Bernard, Louisiana; NREL/TP-7A30-57082; National Renewable Energy Laboratory: Golden, CO, USA, 2013; pp. 1–48.
  70. Sanscartier, D.; MacLean, H.L.; Saville, B. Electricity production from anaerobic digestion of household organic waste in Ontario: Techno-economic and GHG emission analyses. Environ. Sci. Technol. 2012, 46, 1233–1242. [Google Scholar] [CrossRef]
  71. Aui, A.; Li, W.; Wright, M.M. Techno-economic and life cycle analysis of a farm-scale anaerobic digestion plant in Iowa. Waste Manag. 2019, 89, 154–164. [Google Scholar] [CrossRef]
  72. Al-Maghalseh, M. Techno-economic assessment of biogas energy from animal wastes in central areas of Palestine: Bethlehem perspective. Int. J. Energy Appl. Technol. 2018, 5, 119–126. [Google Scholar] [CrossRef]
  73. Imeni, S.M.; Pelaz, L.; Corchado-Lopo, C.; Busquets, A.M.; Ponsá, S.; Colón, J. Techno-economic assessment of anaerobic co-digestion of livestock manure and cheese whey (Cow, Goat & Sheep) at small to medium dairy farms. Bioresour. Technol. 2019, 291, 121872. [Google Scholar]
  74. Kamusoko, R.; Jingura, R.M.; Parawira, W.; Sanyika, W.T. Comparison of pretreatment methods that enhance biomethane production from crop residues-a systematic review. Biofuel Res. J. 2019, 6, 1080. [Google Scholar] [CrossRef]
  75. Haider, J.; Qyyum, M.A.; Kazmi, B.; Ali, I.; Nizami, A.-S.; Lee, M. Simulation study of deep eutectic solvent-based biogas upgrading process integrated with single mixed refrigerant biomethane liquefaction. Biofuel Res. J. 2020, 7, 1245. [Google Scholar] [CrossRef]
  76. Chiu, S.L.; Lo, I.M. Reviewing the anaerobic digestion and co-digestion process of food waste from the perspectives on biogas production performance and environmental impacts. Environ. Sci. Pollut. Res. 2016, 23, 24435–24450. [Google Scholar] [CrossRef]
  77. Bartocci, P.; Zampilli, M.; Liberti, F.; Pistolesi, V.; Massoli, S.; Bidini, G.; Fantozzi, F. LCA analysis of food waste co-digestion. Sci. Total Environ. 2020, 709, 136187. [Google Scholar] [CrossRef]
  78. Esteves, E.M.M.; Herrera, A.M.N.; Esteves, V.P.P.; Morgado, C.d.R.V. Life cycle assessment of manure biogas production: A review. J. Clean. Prod. 2019, 219, 411–423. [Google Scholar] [CrossRef]
  79. Lijó, L.; González-García, S.; Bacenetti, J.; Fiala, M.; Feijoo, G.; Lema, J.M.; Moreira, M.T. Life Cycle Assessment of electricity production in Italy from anaerobic co-digestion of pig slurry and energy crops. Renew. Energy 2014, 68, 625–635. [Google Scholar] [CrossRef]
  80. Hijazi, O.; Munro, S.; Zerhusen, B.; Effenberger, M. Review of life cycle assessment for biogas production in Europe. Renew. Sustain. Energy Rev. 2016, 54, 1291–1300. [Google Scholar] [CrossRef]
  81. Fusi, A.; Bacenetti, J.; Fiala, M.; Azapagic, A. Life cycle environmental impacts of electricity from biogas produced by anaerobic digestion. Front. Bioeng. Biotechnol. 2016, 4, 26. [Google Scholar] [CrossRef] [PubMed]
  82. Ebner, J.H.; Labatut, R.A.; Rankin, M.J.; Pronto, J.L.; Gooch, C.A.; Williamson, A.A.; Trabold, T.A. Lifecycle greenhouse gas analysis of an anaerobic codigestion facility processing dairy manure and industrial food waste. Environ. Sci. Technol. 2015, 49, 11199–11208. [Google Scholar] [CrossRef] [PubMed]
  83. Chen, R.; Rojas-Downing, M.M.; Zhong, Y.; Saffron, C.M.; Liao, W. Life cycle and economic assessment of anaerobic co-digestion of dairy manure and food waste. Ind. Biotechnol. 2015, 11, 127–139. [Google Scholar] [CrossRef]
  84. Bolin, L.; Lee, H.M.; Lindahl, M. LCA of biogas through anaerobic digestion from the organic fraction of municipal solid waste (OFMSW) compared to incineration of the waste. In Proceedings of the 6th International Symposium on Environmentally Conscious Design and Inverse Manufacturing, Sapporo, Japan, 6–9 December 2009. [Google Scholar]
  85. Huang, W.; Zhang, X. Life Cycle Assessment of Anaerobic Digestion of Municipal Waste for Vehicle Biogas Production. In Proceedings of the 2015 International Conference on Advanced Engineering Materials and Technology, Guangzhou, China, 9 November 2015; Atlantis Press: Amsterdam, The Netherlands, 2015. [Google Scholar]
  86. Boulamanti, A.K.; Maglio, S.D.; Giuntoli, J.; Agostini, A. Influence of different practices on biogas sustainability. Biomass Bioenergy 2013, 53, 149–161. [Google Scholar] [CrossRef]
  87. Tong, H.; Tong, Y.-W.; Peng, Y.H. A comparative life cycle assessment on mono-and co-digestion of food waste and sewage sludge. Energy Procedia 2019, 158, 4166–4171. [Google Scholar] [CrossRef]
  88. Lyng, K.-A.; Brekke, A. Environmental life cycle assessment of biogas as a fuel for transport compared with alternative fuels. Energies 2019, 12, 532. [Google Scholar] [CrossRef]
  89. Hahn, H.; Hartmann, K.; Bühle, L.; Wachendorf, M. Comparative life cycle assessment of biogas plant configurations for a demand oriented biogas supply for flexible power generation. Bioresour. Technol. 2015, 179, 348–358. [Google Scholar] [CrossRef]
  90. Hung, C.; Solli, C. Biogas from municiapal organic waste–trondheim’s environmental holy grail? Energy Procedia 2012, 20, 11–19. [Google Scholar] [CrossRef]
  91. Rehl, T.; Lansche, J.; Müller, J. Life cycle assessment of energy generation from biogas—Attributional vs. consequential approach. Renew. Sustain. Energy Rev. 2012, 16, 3766–3775. [Google Scholar] [CrossRef]
  92. Zhang, Y.; Jiang, Y.; Wang, S.; Wang, Z.; Liu, Y.; Hu, Z.; Zhan, X. Environmental sustainability assessment of pig manure mono-and co-digestion and dynamic land application of the digestate. Renew. Sustain. Energy Rev. 2021, 137, 110476. [Google Scholar] [CrossRef]
  93. Du, M.; Peng, C.; Wang, X.; Chen, H.; Wang, M.; Zhu, Q. Quantification of methane emissions from municipal solid waste landfills in China during the past decade. Renew. Sustain. Energy Rev. 2017, 78, 272–279. [Google Scholar] [CrossRef]
  94. Singh, C.K.; Kumar, A.; Roy, S.S. Estimating potential methane emission from municipal solid waste and a site suitability analysis of existing landfills in Delhi, India. Technologies 2017, 5, 62. [Google Scholar] [CrossRef]
  95. Duan, Y.; Gao, Y.; Zhao, J.; Xue, Y.; Zhang, W.; Wu, W.; Jiang, H.; Cao, D. Agricultural methane emissions in China: Inventories, driving forces and mitigation strategies. Environ. Sci. Technol. 2023, 57, 13292–13303. [Google Scholar] [CrossRef]
Figure 1. Circular flow diagram of food and manure waste using AD, adapted from [6].
Applmicrobiol 04 00029 g001
Figure 2. U.S. total MSW generation in 2018 by material type in percentages [9]. Food is highlighted in the red color, which is the focus of this paper.
Applmicrobiol 04 00029 g002
Figure 3. Systems analysis framework for determining the sustainability of anaerobic digestion from food waste and manure mixture. Adapted from [35].
Applmicrobiol 04 00029 g003
Table 1. Summary of existing frameworks on sustainability assessment of biogas systems.
ModelFeedstockAcoDLCASocialPolicyEconomicsLogisticsRef.
GIS-based logistics optimization Manure and energy cropsX X[29]
Decision support toolManure and energy cropsX XXX[30]
GIS-integrated MILP optimizationManure alone XXXXX[31]
GIS- and R programing-based logistics optimizationAg residues and BiomassX X[32]
GIS-based optimizationCrop residues, pig slurry, food waste, sewage sludge, and cattle manureX X[33]
MILP optimizationAnimal manure and energy cropsX X XX[34]
AcoD: Anaerobic co-digestion; LCA: Life cycle assessment. X: Included in the study.
Table 2. Policies/programs initiated by agencies.
AgencyPolicy/ProgramDetails
USDA(REAP) Rural Energy for America Program Financing for anaerobic digester projects. Final REAP rule effective from 2015.
Biorefinery, Renewable Chemical, and Biobased Product Manufacturing Assistance ProgramFunding for commercial, municipal, and industrial biogas plant formation. Final rule effective from 2020.
Rural Utilities Services (RUS)Federal Financing Bank Loan available from 2015.
NRCS (National Resources Conservation Service) and EQIP (Environmental Quality Incentives Program)Financial and technical assistance to agricultural producers through contracts.
Program Coordination (Stacking)Deliver USDA services to producers
EPARenewable Fuel Standard (RFS)Generates credits or Renewable Identification Numbers (RINs) for biofuels. Effective from 2007.
Inflation Reduction Act (IRA)Biomass, landfill gas, hydroelectric, marine, and hydrokinetic eligible for a production tax credit of $0.0275/kWh (2023 value)
DOERenewable Hydrogen Potential resource assessment from Biogas in the USDetermines overall potential and net accessibility of methane in raw biogas
Bioenergy Technologies Office (BETO) and Multi-Year Program Plan (MYPP)Identifies potential of high-impact resources for domestic manufacturing of bio-product precursors, biogas, biofuels, electricity, and heat.
Table 3. Summary of 14 different TEA articles on AD.
Ref.System [Capacity]FeedstockCAPEX & OPEXESPNPVPBTResults
[60]Converting biopower plant to biomethane plant
[4.4 MWhd−1]
Cattle/buffalo manure co-digested with energy crops and wheyEUR 1,205,000 and N/AEUR 0.093/kWh and
EUR 0.23/m3
(EUR 903,473)35.3Upgrading to biomethane is not economically feasible, even with incentives, due to the high investment cost of upgrading
[61]Household biogas production [N/A]Dairy manure co-digested with crop residues (7:3)EUR 582.28–EUR 1151.31 and
EUR 283.99–EUR 851.96
EUR 0.55 per m3 of biogasEUR 10,649–EUR 32,543.23.2–4.8Household small-scale biogas in rural Egypt is profitable and the profitability indicators increased with an increase in the size of biogas
[62]Farm-scale biogas plant [289 kW]Dairy manure co-digested with sheep dungEUR 2500 to EUR 7500 per kWh/h and
EUR 0.019/kWh
EUR 0.1/kWhEUR 9.88 million3.4The biogas produced in a CHP unit is more profitable than utilizing biogas in a combustion unit that produces only heat.
[63]Biogas digester for replacing LPG and Kerosene [N/A]OFMSW, manure, and waterUSD 200–300 and 5% of capital costsN/AUSD 250–USD 35001.3–3Replacing LPG and kerosene in both subsidized and non-subsidized scenarios is economically viable
[64]Small-scale Ag digesters [0.8 MWh/cow/year]Cow manureUSD 12,000–USD 61,000 per annum and 25% to 50% of annual
capital costs
Heat and electricity USD 47–100/cow/year 8 of 16 digesters showed positive NPV at 50% cost shareN/AEconomically viable on 250 cow dairies but tipping fee from food waste may reduce the size
[65]Regional biogas power generation
[3.6 MW-e]
Citrus pulp, Olive pomace, cattle manure, whey, poultry manure, silageEUR 2,690,000–EUR 3,156,000
and
4% for digester
3% for CHP unit
0.16 EUR/kWh <6.5This system can satisfy 27% of Italy’s electricity needs
[66]Biogas CHP plant from manure [1–6 GWh/annum]Manure17,000 EUR/yr. to 90,000 EUR/yr. and
2.5–4% of investment costs
EUR 20–50/MWh 1. CHP from biogas based on manure is not profitable under current market conditions in Sweden. 2. Biogas process operated under thermophilic conditions is more profitable than under mesophilic conditions.
[67] AD of Food Processing WasteFood waste and water38,142,439 Canadian dollars
and
1,970,400 Canadian Dollars
CAD 0.035/kWh With C.C: —Economically viable at 10% IRR with a tipping fee of CAD 81/t for S.S (500 t/yr.), CAD 64/t for M.S (10,000 t/yr.), and CAD 57/t for L.S (2000 t/yr.)
[68] Co-digestion of Milk whey and potato [13,277 kW of power]1000 m3/day for MW and 300 t/day for PSUSD 5.49 M.–USD 34.28 M.
and
USD 7.96 M.–USD 15.35 M. per year
USD 0.14/kWh(USD 21.15) to (USD 45.21) M. at $10/ton digestate sale price High organic load has the best economic feasibility
[69]AD of food waste [1,739,866–3,717,514 kWh/year]Food wasteUSD 561/ton of FW
and
USD 48/ton of FW
USD 0.078/kWh(USD 6,762,992) Poor financial performance includes low area tipping fees and energy prices as well as high capital costs
[70] Electricity Production from AD of household waste [0.5–10 MW]78% kitchen organic waste and 22% nondegradable material USD 0.147/kWh 11Current FiT rate (USD 0.147/kWh), a 200 kt/yr. facility requires a
USD 50/t fee to attain an 11% IRREQUITY, while a 50 kt/yr. facility
requires a USD 95/t fee to reach an 11% IRREQUITY
[71]Farm-scale AD [950 kW]Biomass, manure, and glycerinUSD 0.44–USD 0.55/kWh
and
Glycerin reduces the operating cost by 32%.
USD 0.064/kWh and (USD 0.015)/kWh-e renewable taxGreater NPV for glycerin case3.51 and 5.57Increased the ROI by 27% with glycerin addition
[72]Biogas energy from animal wastes
[7 MW]
Cow, Sheep, Goat, and Chicken manureUSD 21,600,000
and
USD 5,108,000
USD 7,392,000 Economically feasible with an ROI of 15%
[73]Co-digestion of animal manure and cheese wheyLivestock manure (Cow, Goat, and Sheep) and cheese wheyN/A
and
EUR 7200/year.
0.14 ± 0.03 EUR/kWh.>05–10Co-digestion of manure with cheese whey found to be economical compared to mono-digestion of animal manure. NPV is negative and the IRR ranges from 0.97 to 5.88% for low cheese whey % ratio
Table 4. Summary of 12 different LCA articles on AD.
Ref.Functional UnitSystem BoundaryFeedstockBiogas ApplicationResults
[79] 100 kWh of combined heat and power electricityCradle-to-gatePig manure, energy cropsAs electricity and as heatTotal net emissions: −0.016 kg CO2-eq/100 kWh-e; combustion emissions from biogas power plants contribute more towards GWP.
[82] 1 metric ton of influent processedCradle-to-graveDairy manure and food wasteAs electricity and as heatConventional management emissions: 6348 tCO2-eq/year
AcoD emissions:
1836 tCO2-eq/year.
[83] 7153 dry metric tons of dairy manure and 2382 dry tons of food waste per yearCradle-to-graveDairy manure, bakery process waste, and food wasteAs electricity and as heatCo-digestion: 1.6 × 10⁴ t CO2-eq,
AD of DM and FW to landfill
2.7 × 10⁴ t CO2-eq.
[84] 1 ton of organic fraction of municipal solid wasteCradle-to-graveMunicipal solid wasteAs fuel and as electricity Incineration gives about 130 kg more CO2-eq/FU than the medium- and large-scale scenarios and about 80 kg CO2-eq/FU more
than the small-scale scenario.
[77] 1 kWh of electricity producedCradle-to-graveFood waste and energy cropsAs electricityEmissions in kg CO2-eq/kWh-e:
Biogas plants with energy crops as feedstock 0.37.
209 tons of food waste instead of energy crops 0.36; 6809 tons of food waste from malls and food industry: 0.15.
[85] 1 ton of municipal solid wasteCradle-to-graveMunicipal solid wasteAs fuelTotal GHG emissions reported: 61 kg CO2/t MSW, and 0.25 kg CH4/t municipal solid waste.
[86] 1 MJ of electricity (MJe)Cradle-to-graveDairy manure, silage maizeAs electricity and as heatEmission in g CO2/MJe:
Biogas from maize—open and closed storage: 140 and 90; Biogas from manure—open and closed storage: 160 and 330; Biogas from co-digestion—open and closed storage: 70 and 10, respectively.
[3] 1 ton of food waste volatile solidCradle-to-graveFood waste, sludgeAs electricity and as heatAnaerobic digestion for food waste and sludge: 213 kgCO2-eq/ton of functional units.
Anaerobic digestion of food waste: 169 kg CO2-eq/functional units.
Food waste to landfill: 181 kg CO2-eq/functional units.
[87] 1000 tons of food waste and 4400 tons of sewage sludgeCradle-to-graveFood waste and sludge As fuelMono-anaerobic digestion 7.01 × 10⁴ kg CO2-eq/functional unit,
Co-anaerobic digestion had higher greenhouse gas emissions than mono-anaerobic digestion.
[88] Per km of transportGate-to-graveDairy manure, food wasteAs fuel 0.28 kg CO2-eq/km from biogas (food waste); 0.41 kg CO2-eq/km from biogas (manure).
[89] 1 MJ of biogasCradle-to-graveDairy manure, press fluid, energy cropsAs electricityIn contrast to an alternative supply of power generators with natural gas, biogas supplied on demand by adapted biogas plant configurations saves greenhouse gas emissions by 54–65 g CO2-eq/MJ and primary energy by about 1.17 MJ.
[90] 10,000 tons of organic fraction of municipal solid wasteCradle-to-grave Dairy manure, municipal solid waste, food wasteAs fuel, electricity, and heatAnaerobic digestion of source separated organic waste to produce biogas then used as vehicle fuel: 11,949 t CO2-eq/functional units.
[21] kg Bio-CH4Cradle-to-grave Dairy manure, food wasteAs fuelAD Bio-CH4 pathway has 15.5% lower GHG emissions compared to composting, AD conversion of FW and manure avoids FW landfilling, and conventional management of dairy manure emits −3.5 kg CO2 equivalents/kg Bio-CH4 assuming the electricity was generated using collected landfill gas.
Disclaimer/Publisher’s Note: The statements, opinions and data contained in all publications are solely those of the individual author(s) and contributor(s) and not of MDPI and/or the editor(s). MDPI and/or the editor(s) disclaim responsibility for any injury to people or property resulting from any ideas, methods, instructions or products referred to in the content.

