Article

Transcriptional Response of Salmonella enterica to Bacteriophage Treatments with Differential Multiplicities of Infection

Food, Nutrition and Health, University of British Columbia, 2205 East Mall, Vancouver, BC V6R 1Z4, Canada
*
Author to whom correspondence should be addressed.
Appl. Microbiol. 2024, 4(1), 390-405; https://doi.org/10.3390/applmicrobiol4010027
Submission received: 29 December 2023 / Revised: 25 January 2024 / Accepted: 2 February 2024 / Published: 16 February 2024

Abstract

:
Salmonella enterica (S. enterica) is a causative agent of numerous foodborne outbreaks, as current industrial measures may be <90% effective. Therefore, bacteriophages have been suggested as an antimicrobial treatment against S. enterica, but it is currently unclear if there is an optimal bacteriophage multiplicity of infection (MOI) against S. enterica. Two bacteriophage cocktails at MOIs 1, 10, 100, 1000 and 10,000 were co-inoculated against four S. enterica strains (S. Enteritidis, S. Newport, S. Muenchen and S. Typhimurium), and populations were estimated on days 0–3. The transcriptional profiles of 20 genes previously indicated to be differentially expressed after bacteriophage treatment were studied by extracting RNA from all four S. enterica strains after bacteriophage SE14, SF5 and SF6 treatment on days 0, 1 and 3, and RT-qPCR was conducted to determine the expression of the 20 selected genes. The results showed that an MOI of 1000 was the most optimal in reducing S. Enteritidis populations to undetectable levels from day 0 to 3. The cas1 (SOS response) and mod (DNA modification and recombination) genes were highly upregulated between 2.5- and 5-fold on day 0 for S. Enteritidis S5-483 and S. Typhimurium S5-536 at MOIs of 1000 and 10,000. On day 3, hsdS (DNA modification and recombination) was upregulated by ~1-fold for S. enteritidis S5-483 after an MOI of 1000. Understanding an optimal bacteriophage MOI can be beneficial to implementing effective and optimal bacteriophage treatments in the industry. Knowledge of S. enterica’s transcriptional response after bacteriophage treatment provides further insight into how S. enterica can survive bacteriophage infection.

1. Introduction

From 2018 to 2023, Salmonella was the causative pathogen in 41 separate foodborne outbreaks in a multitude of food commodities in North America, including fresh produce; ready-to-eat meat; seafood; ground beef; chicken and chicken products; and more [1]. Current antimicrobial methods to reduce Salmonella on food can be chemical, biological or non-thermal [2,3]. Chemical antimicrobials can include sulphites, nitrites, organic acids, lysozymes, isothiocyanate and lactoferrin, and each can have metabolic targets in microorganisms such as genetic determinants or enzymes, the cell membrane or the cell wall [2]. Biological antimicrobials can include bacteriocins, bacteriophages and lactic acid bacteria [2,3]. Many chemical and biological antimicrobial methods can be used on farms and at the postharvest level, and there are also non-thermal methods that have been studied to reduce Salmonella in food: cold plasma, high-pressure processing, irradiation, ozone treatment and UV light treatment [3].
A steadily growing food trend among consumers in the past decade has been the consumption of organic foods and the use of non-chemical antimicrobial methods [4,5]. The consumer trend regarding a desire for more natural foods has made the use of chemical antimicrobial methods undesirable, leaving only biological and postharvest antimicrobial methods. However, some biological antimicrobial methods, such as lactic acid bacteria, produce an acidic taste that may not be desirable to food products that are not acidic [6].
Biological methods such as bacteriophages are flavourless and odourless when added to food [7,8]. Bacteriophages are cost-effective as they are abundant and easily located in the ecosystem [9]. Bacteriophages are naturally occurring, can self-replicate, are generally non-toxic to humans and are highly specific to their bacterial targets [7,10]. Since bacteriophages are highly specific, the understanding is that they will not alter the native food microbiota, will not inactivate desirable microorganisms and will not negatively affect food spoilage [10].
Bacteriophages have been shown in previous research to reduce Salmonella populations in a wide variety of food products. A cocktail of five bacteriophages reduced Salmonella populations in chicken meat by 1.5 and 1.2 log CFU/g after 48 h and 72 h at 10 °C, respectively [11]. On postharvest lettuce and cantaloupe, a five-bacteriophage cocktail at a multiplicity of infection (MOI) of 1000 reduced Salmonella enterica (S. enterica) populations by 1–4 log CFU/cm2 depending on the S. enterica strain. The authors of [12] used a single bacteriophage, SSP6, against S. Oranienburg on alfalfa seeds at an MOI of 70 and reduced Salmonella by 1 log CFU/g after 3 h. However, the inhibitory effect did not last, and there was a Salmonella population resurgence after 3 h [13]. Similarly, Fong et al. [14] also used a single bacteriophage, SI1, against S. Enteritidis on sprouting alfalfa seeds at an MOI of 110 and reduced populations by ~2.5 log CFU/g immediately after bacteriophage treatment on day 1. However, there was also a population resurgence by day 6, where the bacteriophage-treated alfalfa seeds were <1 log CFU/g compared with the control [14]. Given the Salmonella population resurgence after initial bacteriophage treatments shown in previous research, the authors of [15] implemented repeated daily bacteriophage applications at an MOI of 1000 against S. enterica on alfalfa sprouts during germination and found repeated applications to further reduce S. enterica populations, but the issue of population resurgence still arose [15].
Currently, it is unclear if there is an optimal bacteriophage MOI against S. enterica that can reduce or prevent population resurgence. In previous research, different studies have employed a range of different MOIs against Salmonella [12,13,14,15]. However, to the best of our knowledge, there has not been a study that compares the efficacy of different bacteriophage MOIs. Therefore, the objective of this study is to (i) systemically determine if there is an optimal bacteriophage MOI against S. enterica for reducing or preventing population resurgence and (ii) to profile certain S. enterica genes expressed that may mechanistically provide an insight into the fate of S. enterica after bacteriophage treatment.

2. Materials and Methods

2.1. Bacteriophage Propagation and Titer Measurement

The bacteriophages used in this study were previously isolated in British Columbia, Canada, by [16]. Four Salmonella bacteriophage isolates (SE14, SE20, SF5 and SF6) were selected based on their ability to lyse the S. enterica strains discussed in Section 2.2. The same S. enterica strains were also used for bacteriophage propagation. The bacteriophages were purified according to methods described by [14]. S. enterica cultures were individually prepared with overnight incubation for 18 h at 37 °C in 10 mL of Tryptic Soy Broth (TSB, Difco, Becton Dickinson, Franklin Lakes, NJ, USA) under agitation at 175 rpm. From the overnight S. enterica cultures, 100 μL was inoculated into 10 mL of TSB and incubated at 37 °C under agitation at 175 rpm for 1.5 h until OD600 was measured with a UV-1800 UV/Vis Spectrometer (Shimadzu, Columbia, MD, USA) to be between 0.2–0.4. In total, 50 μL of bacteriophage (SE14, SE20, SF5 or SF6) was pipetted into the inoculum at OD600 0.2–0.4 and incubated at 37 °C for 6 h. After 6 h, the inoculum was poured into a 50 mL centrifuge tube (VWR International, Radnor, PA, USA) and sedimented at 4000× g for 10 min at 21 °C. The lysate was then poured into a separate centrifuge tube and filtered through a 0.4 μm filter (VWR International, Radnor, PA, USA) into a 15 mL centrifuge tube (VWR International, Radnor, PA, USA). A plaque assay was then used to measure the titers of the bacteriophages. The propagated bacteriophages were decimally diluted in 450 μL TSB (VWR International, Radnor, PA, USA). In total, 50 μL of a separate S. enterica overnight culture was prepared according to the methods provided above; added to each decimal dilution; and incubated for 1 h at 37 °C under agitation at 175 rpm. After 1 h, the contents were spread onto the surface of a Tryptic Soy Agar plate (TSA, Difco, Becton Dickinson, Franklin Lakes, NJ, USA). The plates were then incubated at 37 °C for 24 h prior to counting the plaques.

2.2. S. enterica Strain Storage Conditions

The four S. enterica strains used in this study were S. Enteritidis S5-483, S. Newport S5-639, S. Muenchen S5-504 and S. Typhimurium S5-536. The serovars of these strains are all serovars that are commonly implicated in S. enterica foodborne outbreaks [17]. For long-term storage, the S. enterica strains were maintained at −80 °C in TSB, supplemented with 20% glycerol (VWR International, Radnor, PA, USA). The working stocks were maintained on TSA and stored for a maximum of 4 weeks at 4 °C.

2.3. S. enterica Growth Assay

For inoculation, each S. enterica strain was prepared with overnight incubation at 37 °C in 10 mL TSB under agitation at 175 rpm for 18 h. The overnight cultures were spun at 4000× g for 10 min, and the supernatant was decanted. The resulting pellets were washed twice with 10 mL of TSB and decimally diluted in TSB for a final concentration of 105 CFU/mL. In total, 1 mL of each S. enterica strain was then pipetted to each well in a 96-well dilution block (VWR International, PA, USA). In total, 1 mL of each of the two bacteriophage cocktails, (1) SE14, SE20 and SF6 and (2) SE14, SF5 and SF6, was separately added to each well at MOIs of 1, 10, 100, 1000 and 10,000. For the control, instead of a bacteriophage sample, 1 mL of TSB was pipetted into the wells with an S. enterica strain. The 96-well dilution blocks were incubated at 22 ± 1 °C from day 0 to 3. A temperature of 22 ± 1 °C was chosen to determine the efficacy of both bacteriophage cocktails at MOIs of 1, 10, 100, 1000 and 10,000 against S. enterica at a temperature that was within the range of ambient temperatures that food seeds and plants are commonly germinated and grown [18,19]. On each day 0, 1, 2 and 3 samples from each well were pipetted into separate test tubes, serially diluted in TSB, plated on xylose lysine deoxycholate (XLD) agar (Oxoid, Nepean, ON, Canada) and incubated at 37 ± 1 °C for 24 h before population estimation.

2.4. RNA Extraction, Reverse-Transcription and Real-Time Quantitative PCR (RT-qPCR)

The preparation of the four S. enterica strains and inoculation with bacteriophage cocktails (1) SE14, SE20 and SF6 and (2) SE14, SF5 and SF6, were conducted as discussed in Section 2.3 with the exception that each S. enterica strain was decimally diluted in TSB for a final concentration of 109 CFU/mL. On days 0, 1 and 3, samples from each MOI and control were pelleted at 6000× g for 10 min and then preserved with RNAprotect Bacteria Reagent (Qiagen, Germantown, MD, USA). Total RNA was then isolated from S. enterica cells with the RNeasy Miniprep Kit (Qiagen, Germantown, MD, USA) by following the manufacturer’s instructions. On-column Dnase digestion was performed with Rnase-Free Dnase I (Qiagen, Germantown, MD, USA). The quality and quantity of each extracted RNA sample was assessed with a Nanodrop 2000 Spectrophotometer (Thermo Fisher Scientific, Asheville, NC, USA) and an Agilent 2100 Bioanalyzer (Agilent, Santa Clara, CA, USA). Only RNA samples with an RNA Integrity Number (RIN) of >6.0 were reverse-transcribed to ensure the quantification of gene expression for RT-qPCR was reliable [20,21,22]. The RNA samples were reverse-transcribed to cDNA with the LunaScript RT SuperMix Kit (New England Biolabs, Whitby, ON, Canada) in a Veriti 96-Well Thermal Cycler (Applied Biosystems, Waltham, MA, USA). The resulting cDNA was used for RT-qPCR analyses with the QuantiNova SYBR Green PCR Kit (Qiagen, Germantown, MD, USA) in a C1000 Touch Touch Thermal Cycler (Bio-Rad, Hercules, CA, USA). Three genes were used as reference genes, 16s, gapA and rsrnC, and the forward and reverse primers for each are shown in Table 1. Twenty genes were assessed for each MOI and control, and the primers for each target gene are listed in Table 2. The genes were chosen based on their function and have been shown to be differentially regulated in response to bacteriophage treatment from previous research listed in Table 2. The relative expression values of the genes were calculated using 2−ΔΔCt. Melting curve analyses were performed to ensure that only a single gene was amplified for each target gene.

2.5. Statistical Analysis

Each treatment was conducted with six biological replicates. S. enterica populations in Section 2.3 were analyzed with log-transformed data using a one-way analysis of variance (one-way ANOVA), and Turkey’s honestly significant difference (Turkey’s HSD) was conducted for means separation with Rstudio, version 1.1463 (Rstudio, Inc., Boston, MA, USA). p-values of <0.05 were considered statistically significant. For visualization and comparison of gene expression patterns, heatmaps of the expression of 20 genes in Section 2.4 were created in Rstudio. The quantization of the expression of the 20 genes was conducted with K-means clustering in Rstudio.

3. Results and Discussion

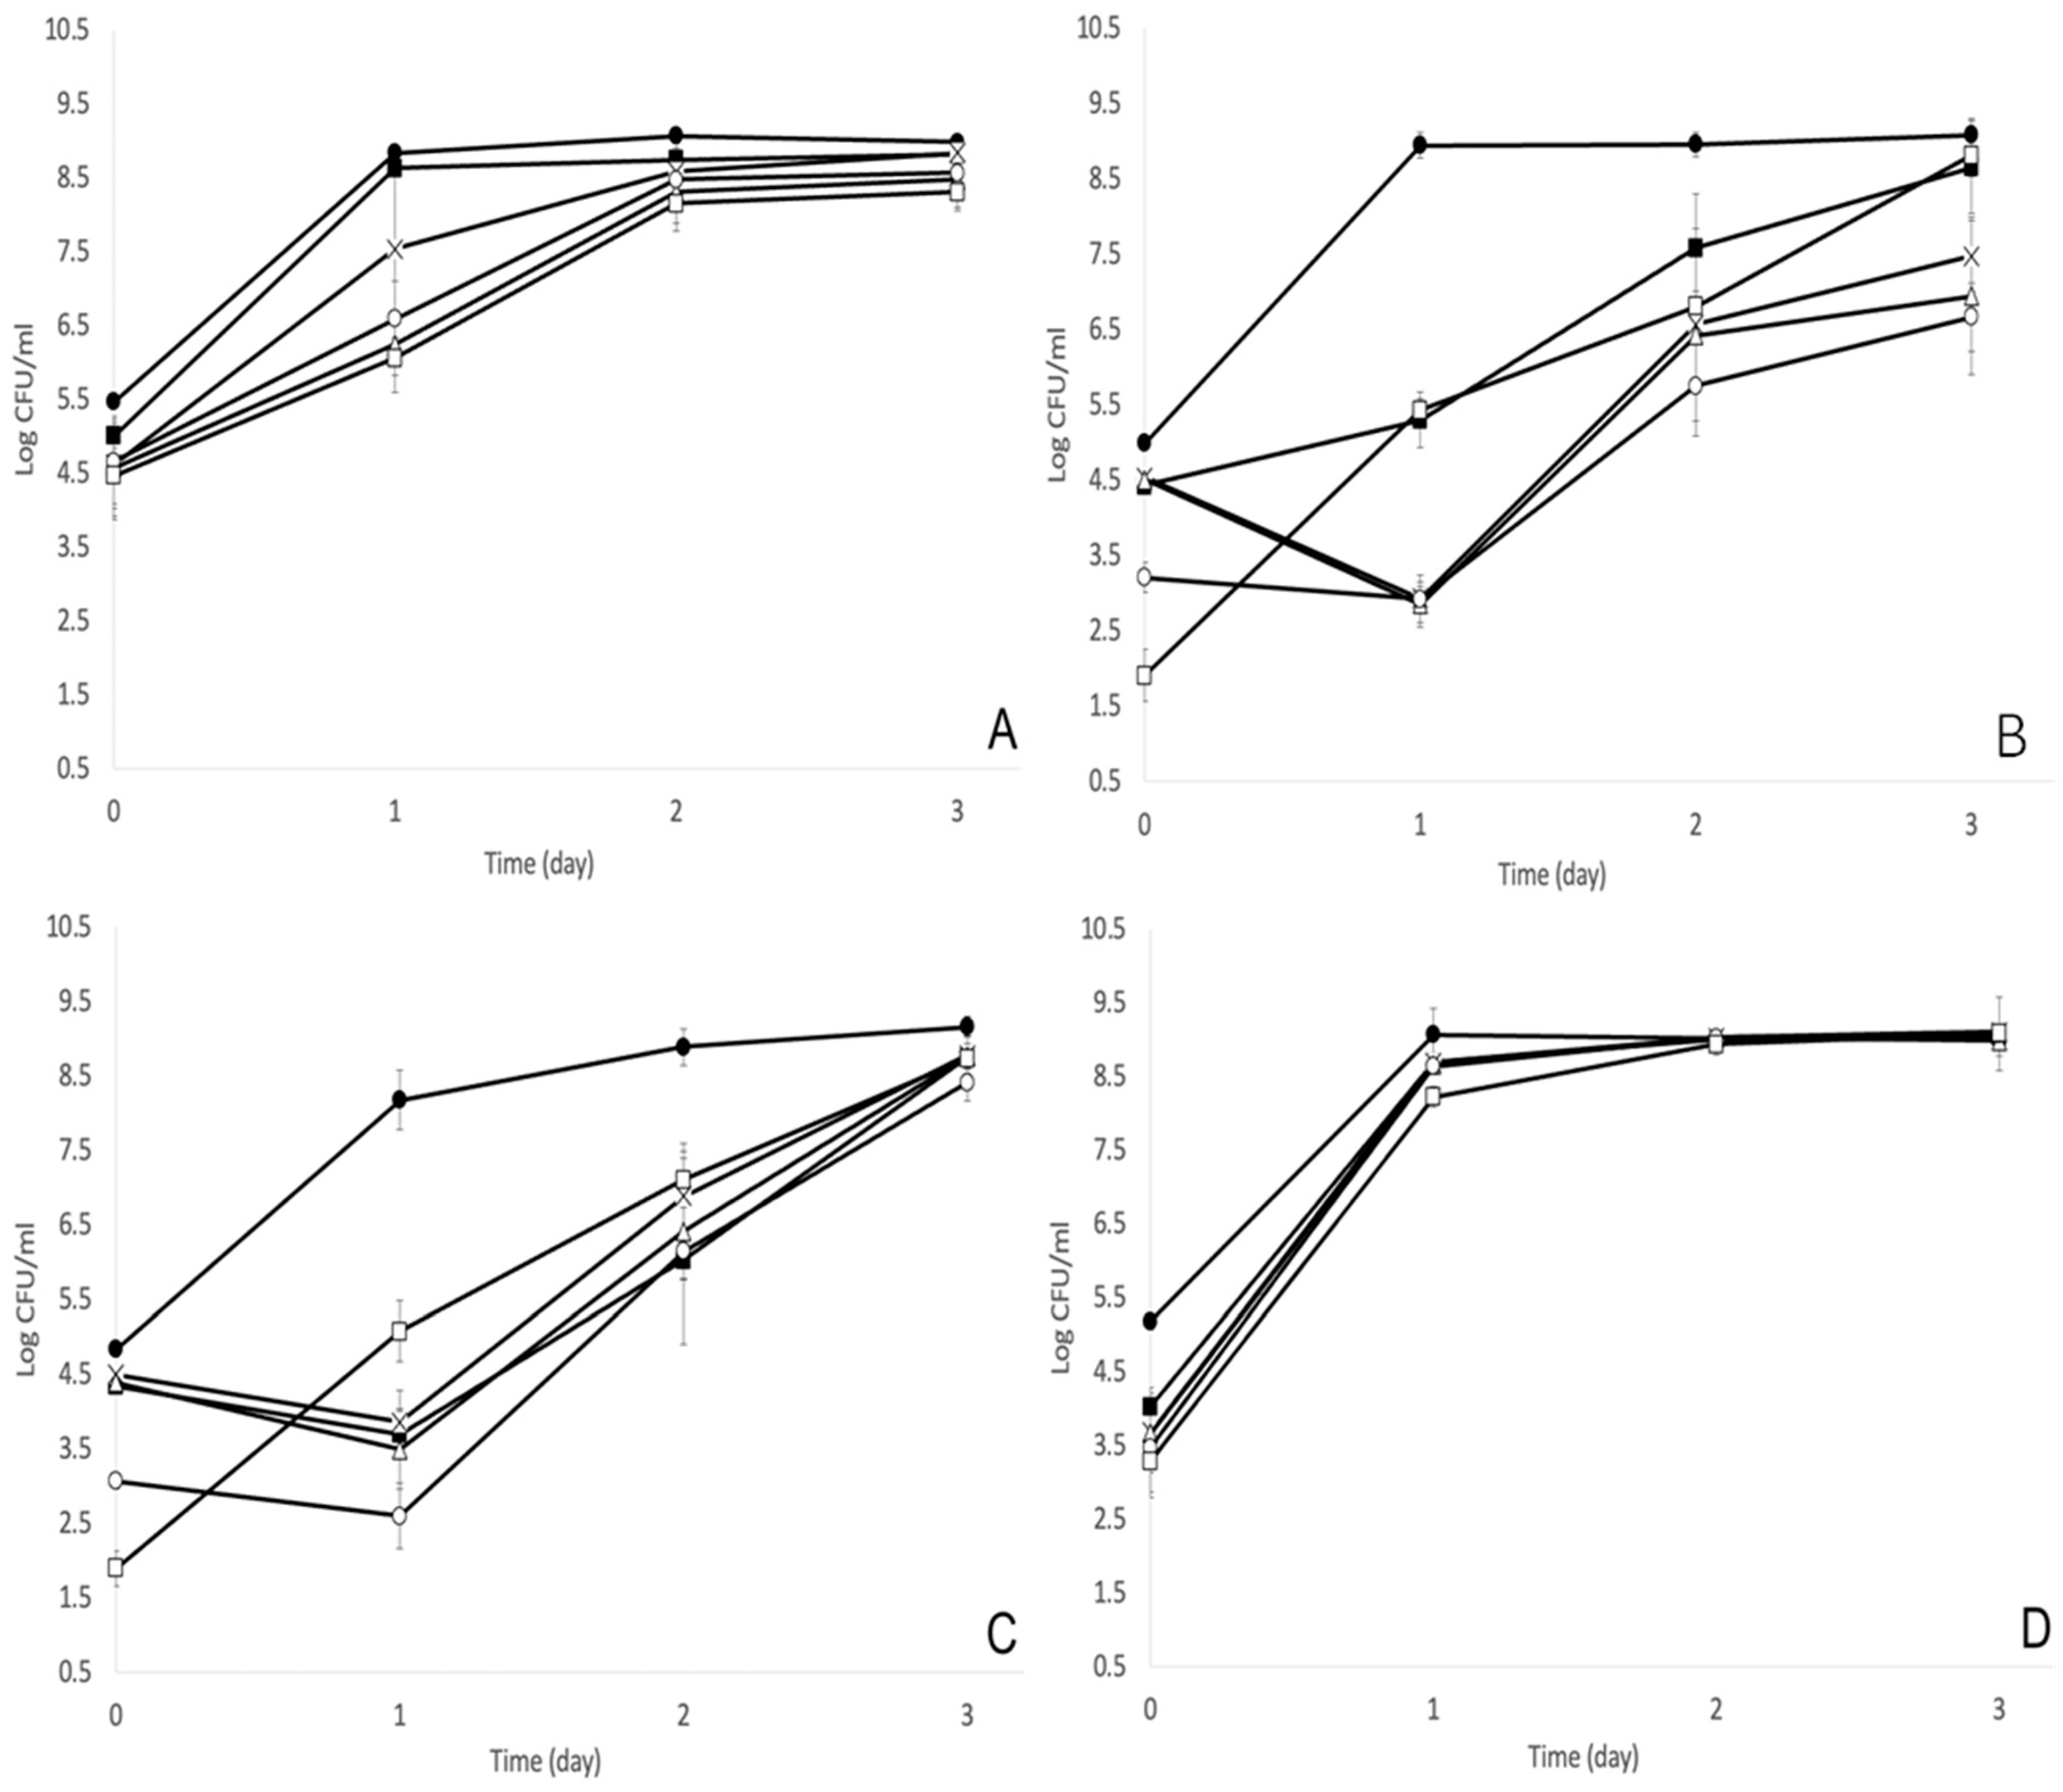
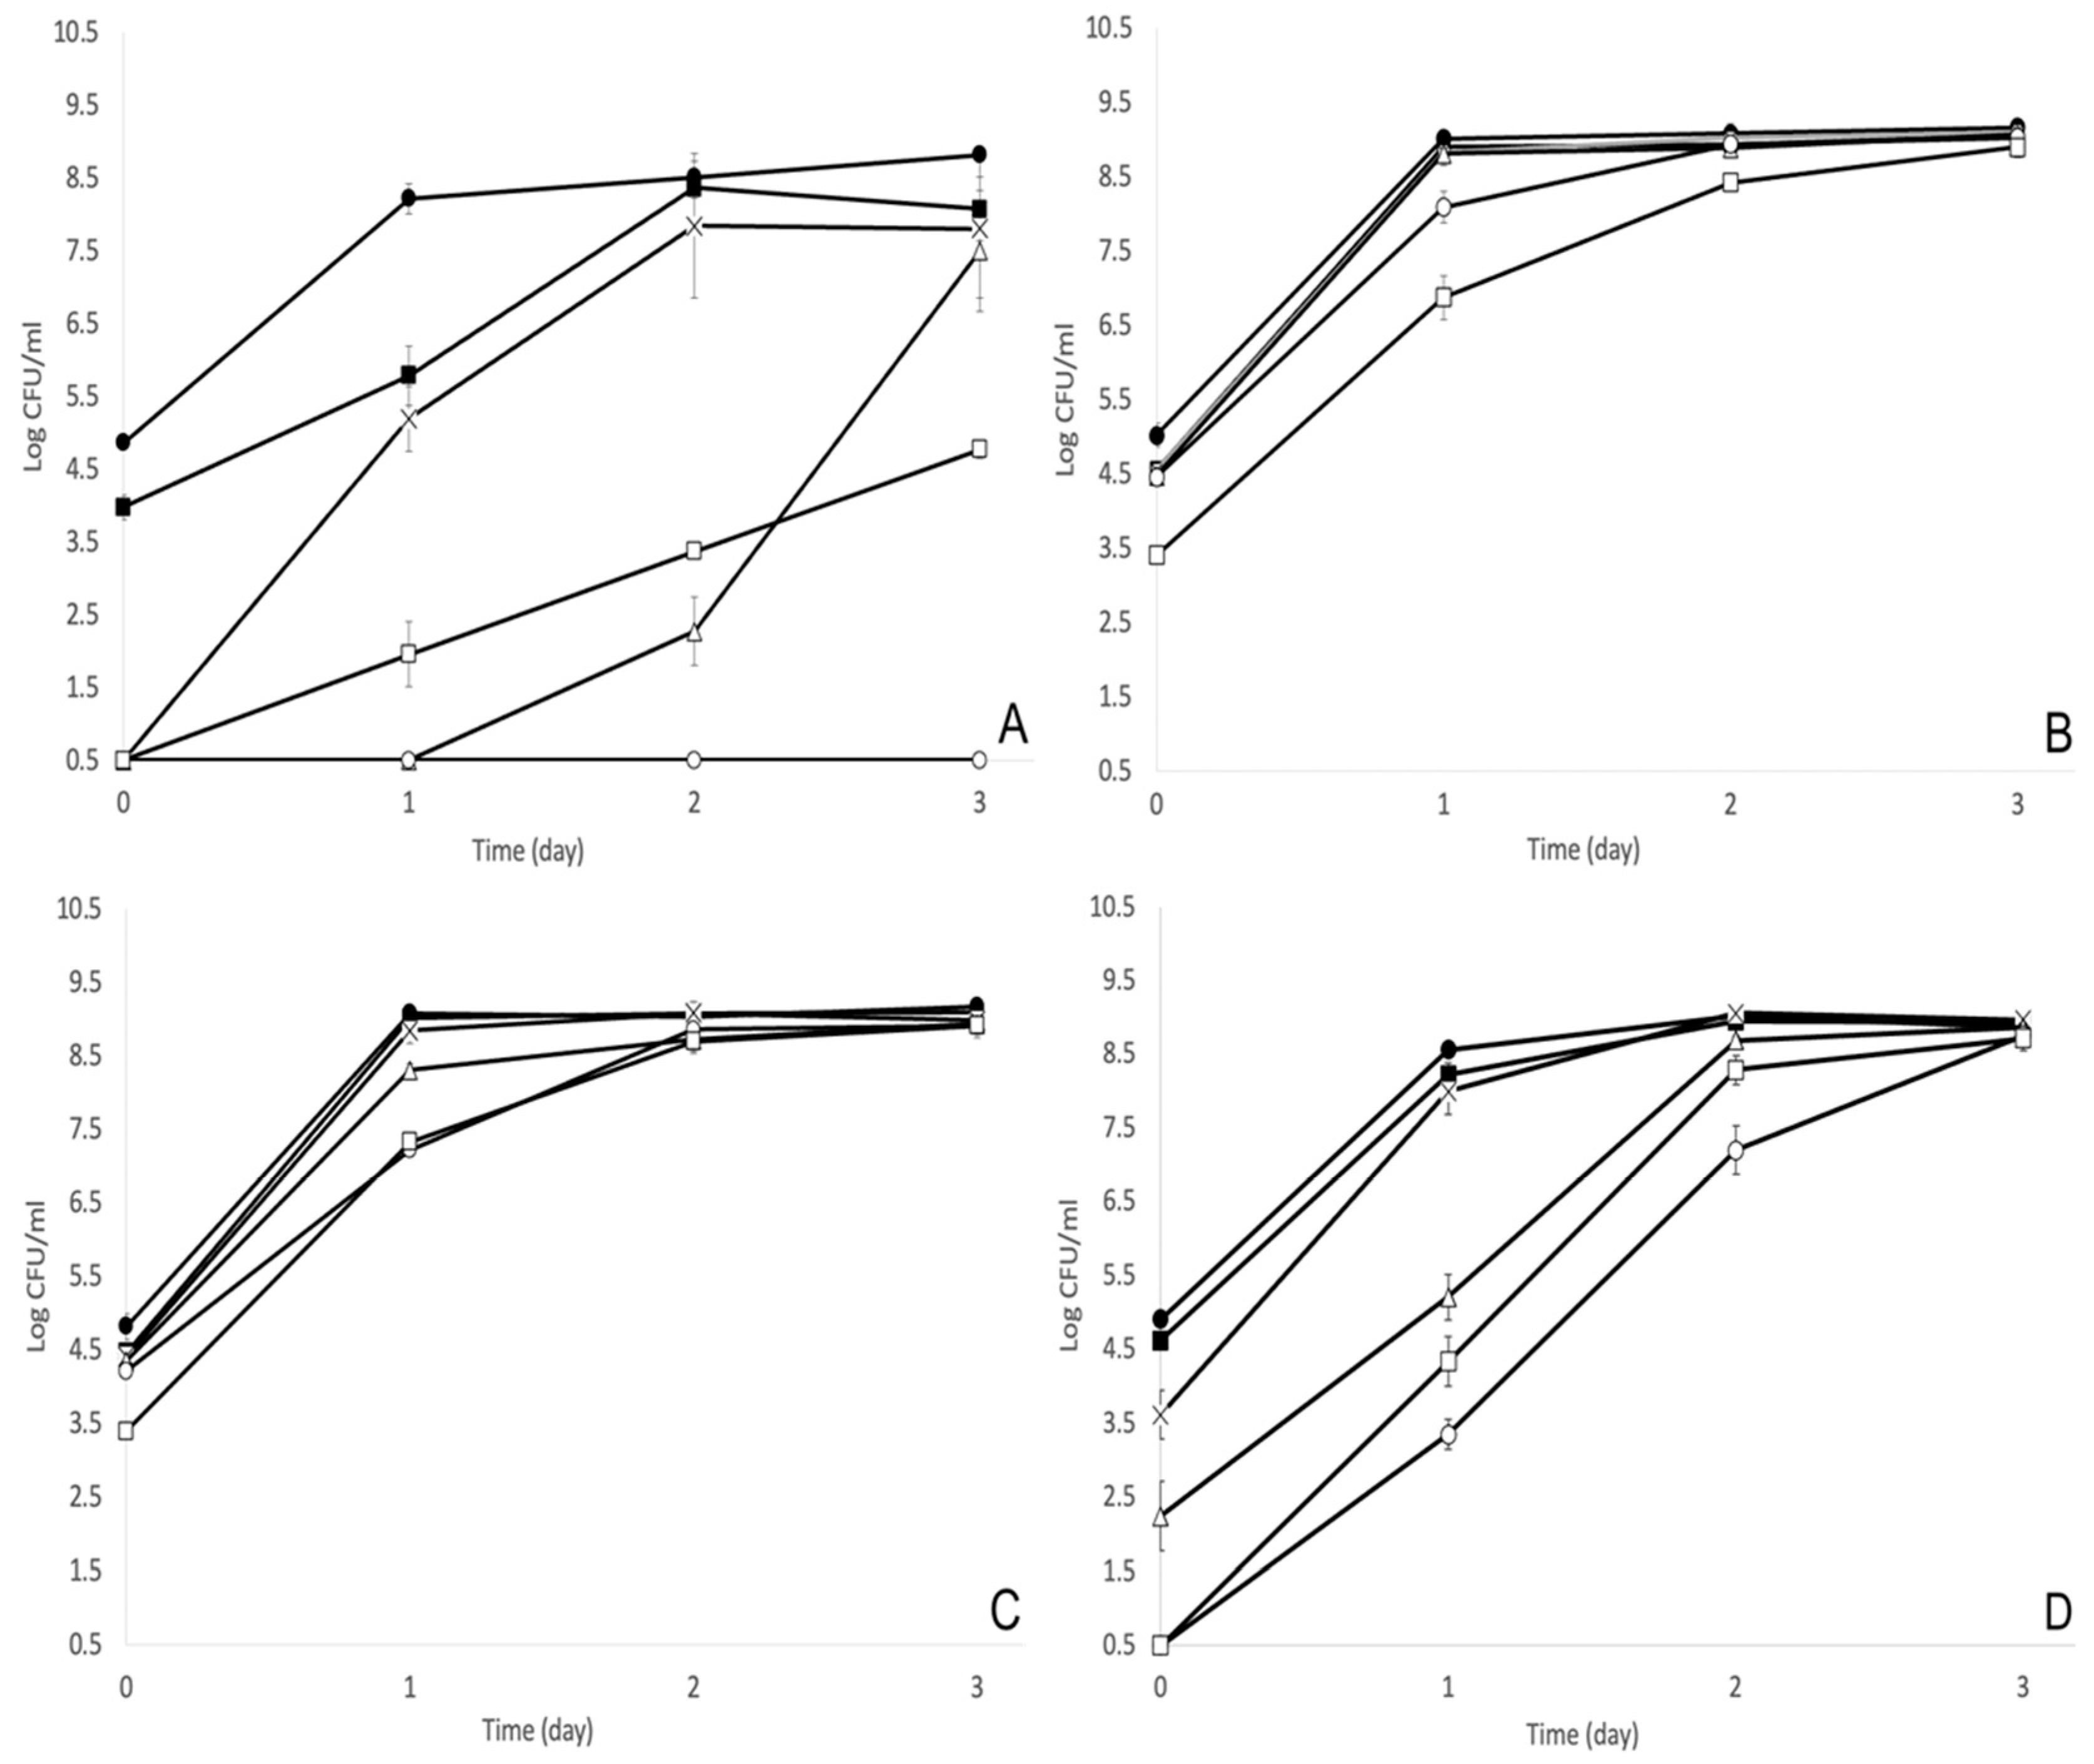
3.1. MOI of 1000 Was the Optimal Bacteriophage Treatment against S. enterica

Two separate bacteriophage cocktails, (1) SE14, SE20 and SF6 and (2) SE14, SF5 and SF6, were co-inoculated at MOIs of 1, 10, 100, 1000 and 10,000 with four S. enterica strains, S. Enteritidis S5-483, S. Newport S5-639, S. Muenchen S5-504 and S. Typhimurium S5-536, in tryptic soy broth. For bacteriophage cocktail (1), SE14, SE20 and SF6, MOIs 100, 1000 and 10,000 were the most effective at significantly reducing S. Enteritidis S5-483 populations by ~2.9–3 log CFU/mL by day 1 compared with the control and MOI 1 (p < 0.05, Figure 1A). For S. Muenchen S5-504 and S. Newport S5-639, MOI 10,000 was the most effective MOI on day 0 with a significant population reduction of ~3 log CFU/mL and ~1.5 log CFU/mL compared with the control and MOI 1000, respectively (p < 0.05, Figure 1B,C). However, by day 1 for S. Newport S5-639, it was MOI 1000 that had the significantly highest population reduction of ~6 log CFU/mL compared with the control; ~3 log CFU/mL compared with MOI 10,000; and ~1 log CFU/mL compared with MOIs of 1, 10 and 100 (p < 0.05, Figure 1C). MOIs of 10, 100 and 1000 for bacteriophage cocktail SE14, SE20 and SF6 were the most effective against S. Muenchen S5-504 on day 1, where populations were significantly reduced to ~2.7 log CFU/mL compared with ~8.7 log CFU/mL for the control and ~5 log CFU/mL for MOIs of 1 and 10,000 (p < 0.05, Figure 1B). Both the S. Muenchen S5-504 and S. Newport S5-639 populations after the MOI 10,000 treatment had the fastest population resurgence compared with other bacteriophage MOI treatments by day 1 (Figure 1B,C). For S. Muenchen S5-504, the populations after the MOI 1 and 10,000 treatments on day 1 were not significantly different from each other (p > 0.05, Figure 1B). However, the population resurgence was slower for MOI 1 compared with MOI 10,000 for S. Muenchen S5-504 on day 1 because MOI 1 populations increased from ~4.5 log CFU/mL to ~5.1 log CFU/mL, but populations increased from ~1.8 CFU/mL to ~5.2 log CFU/mL for MOI 10,000 (Figure 1B). By day 3, the S. Muenchen S5-504 population after the MOI 1 and MOI 10,000 treatments were not significantly different from the control (p > 0.05, Figure 1B). This was unexpected because, at the highest bacteriophage MOI of 10,000, it was expected that surviving and new bacteriophage progenies would continue to reduce S. enterica populations on later days after inoculation, which unfortunately was not the case based on the population counts (Figure 1B). However, there is a theory called lysis from without, where there can be an overload of bacteriophages above the threshold (high MOI) attacking the bacteria simultaneously, which can lead to the bacteria lysing before new bacteriophage progeny can be created [44,45]. With lysis from without, if new bacteriophage progenies are not created, then there is no bursting of the bacteria, and this could potentially decrease the efficacy of the high MOIs overloading the bacterial cell compared with lower MOIs [46]. This is because new bacteriophage progeny from a burst can infect an average of five previously uninfected bacterial cells [46]. Without the continued infection of bacteriophage progenies from a burst, this could be an explanation for why there can be faster S. enterica population resurgence with MOI 10,000 compared with lower MOIs, as shown with S. Muenchen S5-504 and S. Newport S5-639 with bacteriophage cocktails SE14, SE20 and SF6 and S. Enteritidis S5-483 and S. Typhimurium S5-536 with bacteriophage cocktails SE14, SF5 and SF6 (Figure 1B,C and Figure 2A,D).
The idea that the highest bacteriophage MOI may not always be the most effective is also evident with bacteriophage cocktail (2), SE14, SF5 and SF6. MOIs 10, 100, 1000 and 10,000 significantly reduced S. Enteritidis S5-483 populations to below the detection limit on day 0 (p < 0.05, Figure 2A). By day 1, MOI 10 had the fastest population resurgence followed by MOI 10,000 (Figure 2A). MOI 100 had a population resurgence by day 2, and it was only MOI 1000 that continued to have S. Enteritidis S5-483 populations below the detection limit up to day 3 (Figure 2A). For S. Muenchen S5-504 and S. Newport S5-639, MOI 10,000 further reduced populations significantly by ~1 log CFU/mL compared with MOIs 1, 10, 100 and 1000 and ~1.3–1.5 log CFU/mL compared with the control (p < 0.05, Figure 2B,C). However, by day 3, the S. Muenchen S5-504 and S. Newport S5-639 populations from all the MOI treatments were not significantly different from each other or the control (p > 0.05, Figure 2B,C). For S. Typhimurium S5-536, both MOI 1000 and 10,000 reduced populations to below the detection limit on day 0, but populations at an MOI of 1000 had a significantly slower population resurgence compared with MOI 10,000 and other MOIs on days 1 and 3 (p < 0.05, Figure 2D).
Between the two different bacteriophage cocktails, (1) SE14, SE20 and SF6 and (2) SE14, SF5 and SF6, it has been seen that the highest MOI, 10,000, is not the most effective MOI, and a slight edge can be given to MOI 1000 as the MOI that was more effective at reducing S. enterica populations compared with other MOIs (Figure 1 and Figure 2). For commercialized bacteriophages, SalmoFresh™ (a cocktail of six bacteriophages) against Salmonella gained recognition from the U.S. Food and Drug Administration in 2013 when it received GRAS (Generally Regarded as Safe) status for certain poultry products, fish, shellfish and processed fruits and vegetables at 107 PFU/g [47]. In 2015, the U.S. Food and Drug Administration allowed SalmoFreshTM to be used on raw poultry at 107 PFU/g, and this allowance was expanded in 2019 for SalmoFreshTM to be used on ready-to-eat and raw red meat carcasses, subprimals and trimmings at 107 PFU/g [47]. There was a further amendment to the GRAS status in 2021, where the bacteriophage titer was increased from 107 PFU/g to 108 PFU/g [47]. Given the results of this study, it is important that the maximum approved bacteriophage titer of 108 PFU/g is only used when it is the most optimal MOI against S. enterica and not because of the notion that applying the highest titer of bacteriophages is the most effective against S. enterica. For food companies that can conduct microbiological testing for samples of their food products and environmental testing, there might be a preconception of the levels of pathogenic contamination, and bacteriophage titers can be adjusted to more optimal MOIs and possibly reduce antimicrobial costs.
Besides the theory of lysis from without, to the best of our knowledge, there has not been any previous research conducted to compare the efficacy of different bacteriophage MOIs. Between the two different bacteriophage cocktails used, an MOI of 1000 for cocktail SE14, SF5 and SF6 was able to reduce and keep S. Enteritidis S5-483 populations below the detection limit throughout the 3 days (Figure 2A). On day 0 for S. Typhimurium S5-536, similar results were observed where both MOIs 1000 and 10,000 also reduced populations to below the detection limit (Figure 2D). In contrast, MOI 10,000 only significantly further reduced S. Muenchen S5-504 and S. Newport S5-639 populations by 1 log CFU/mL on day 0 (p < 0.05, Figure 2B,C). Given the contrasts between the S. enterica strains after bacteriophage cocktail (2), SE14, SF5 and SF6, treatment, gene expression was measured with this cocktail.

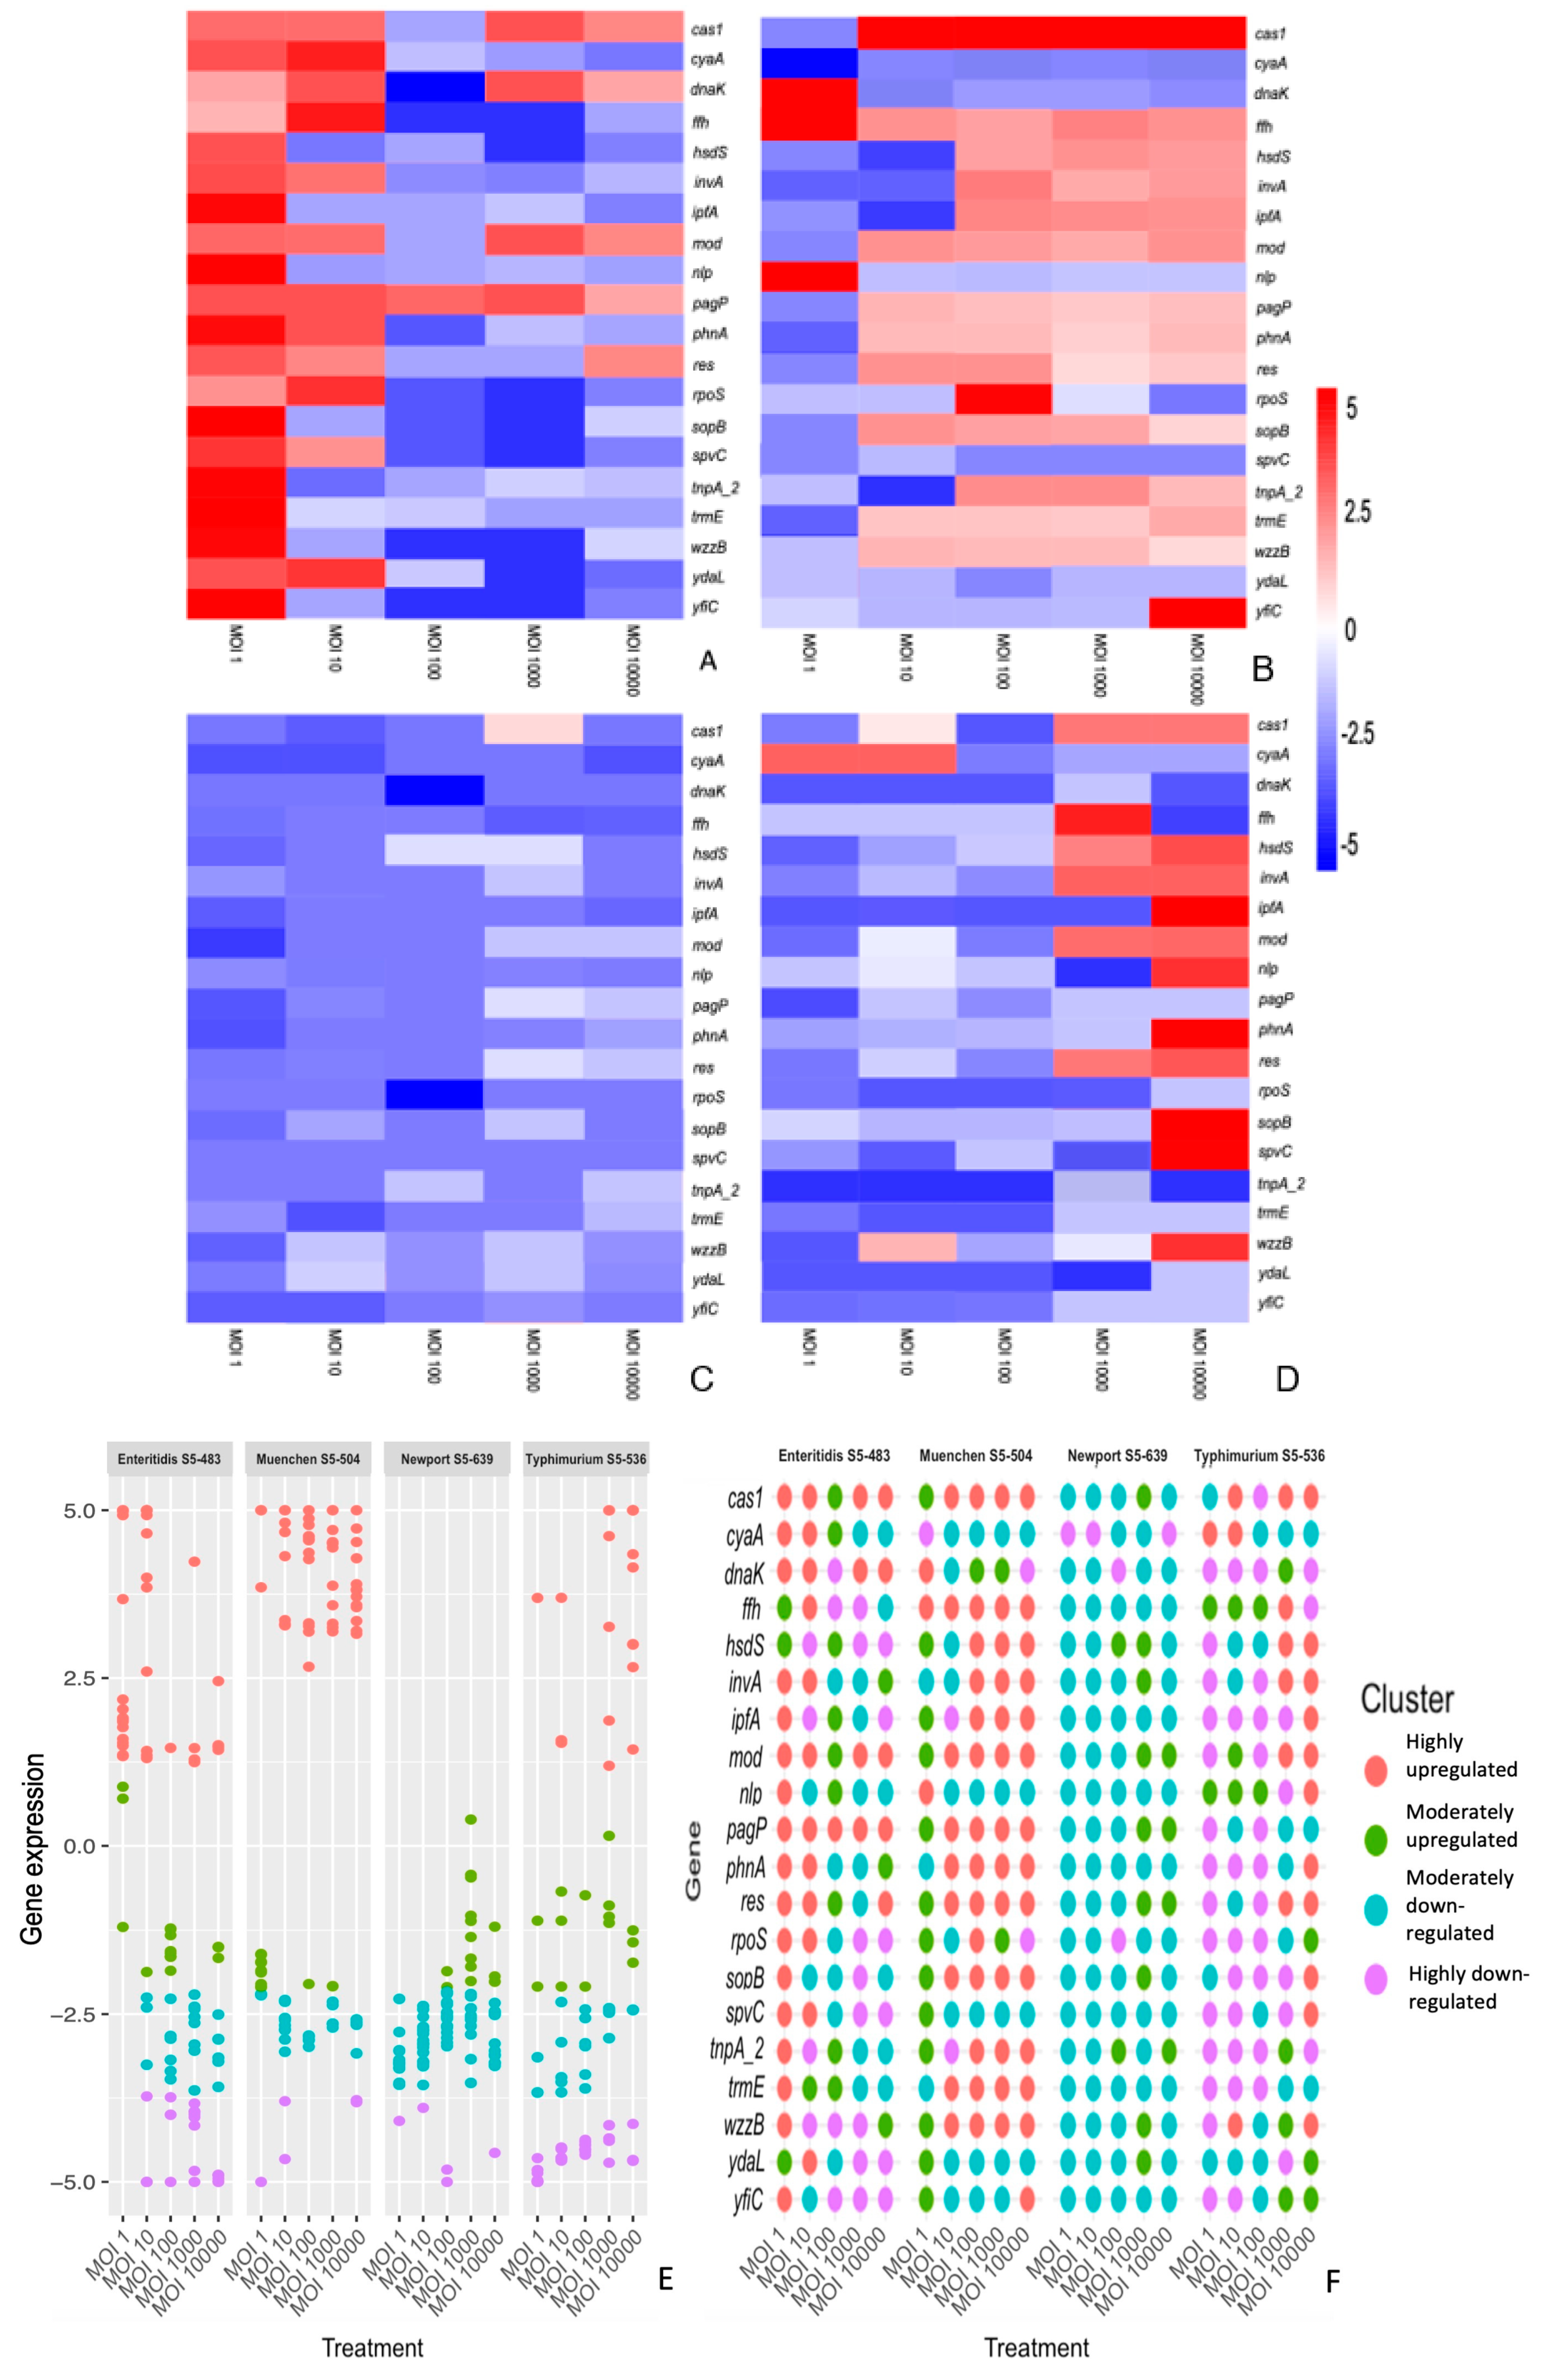
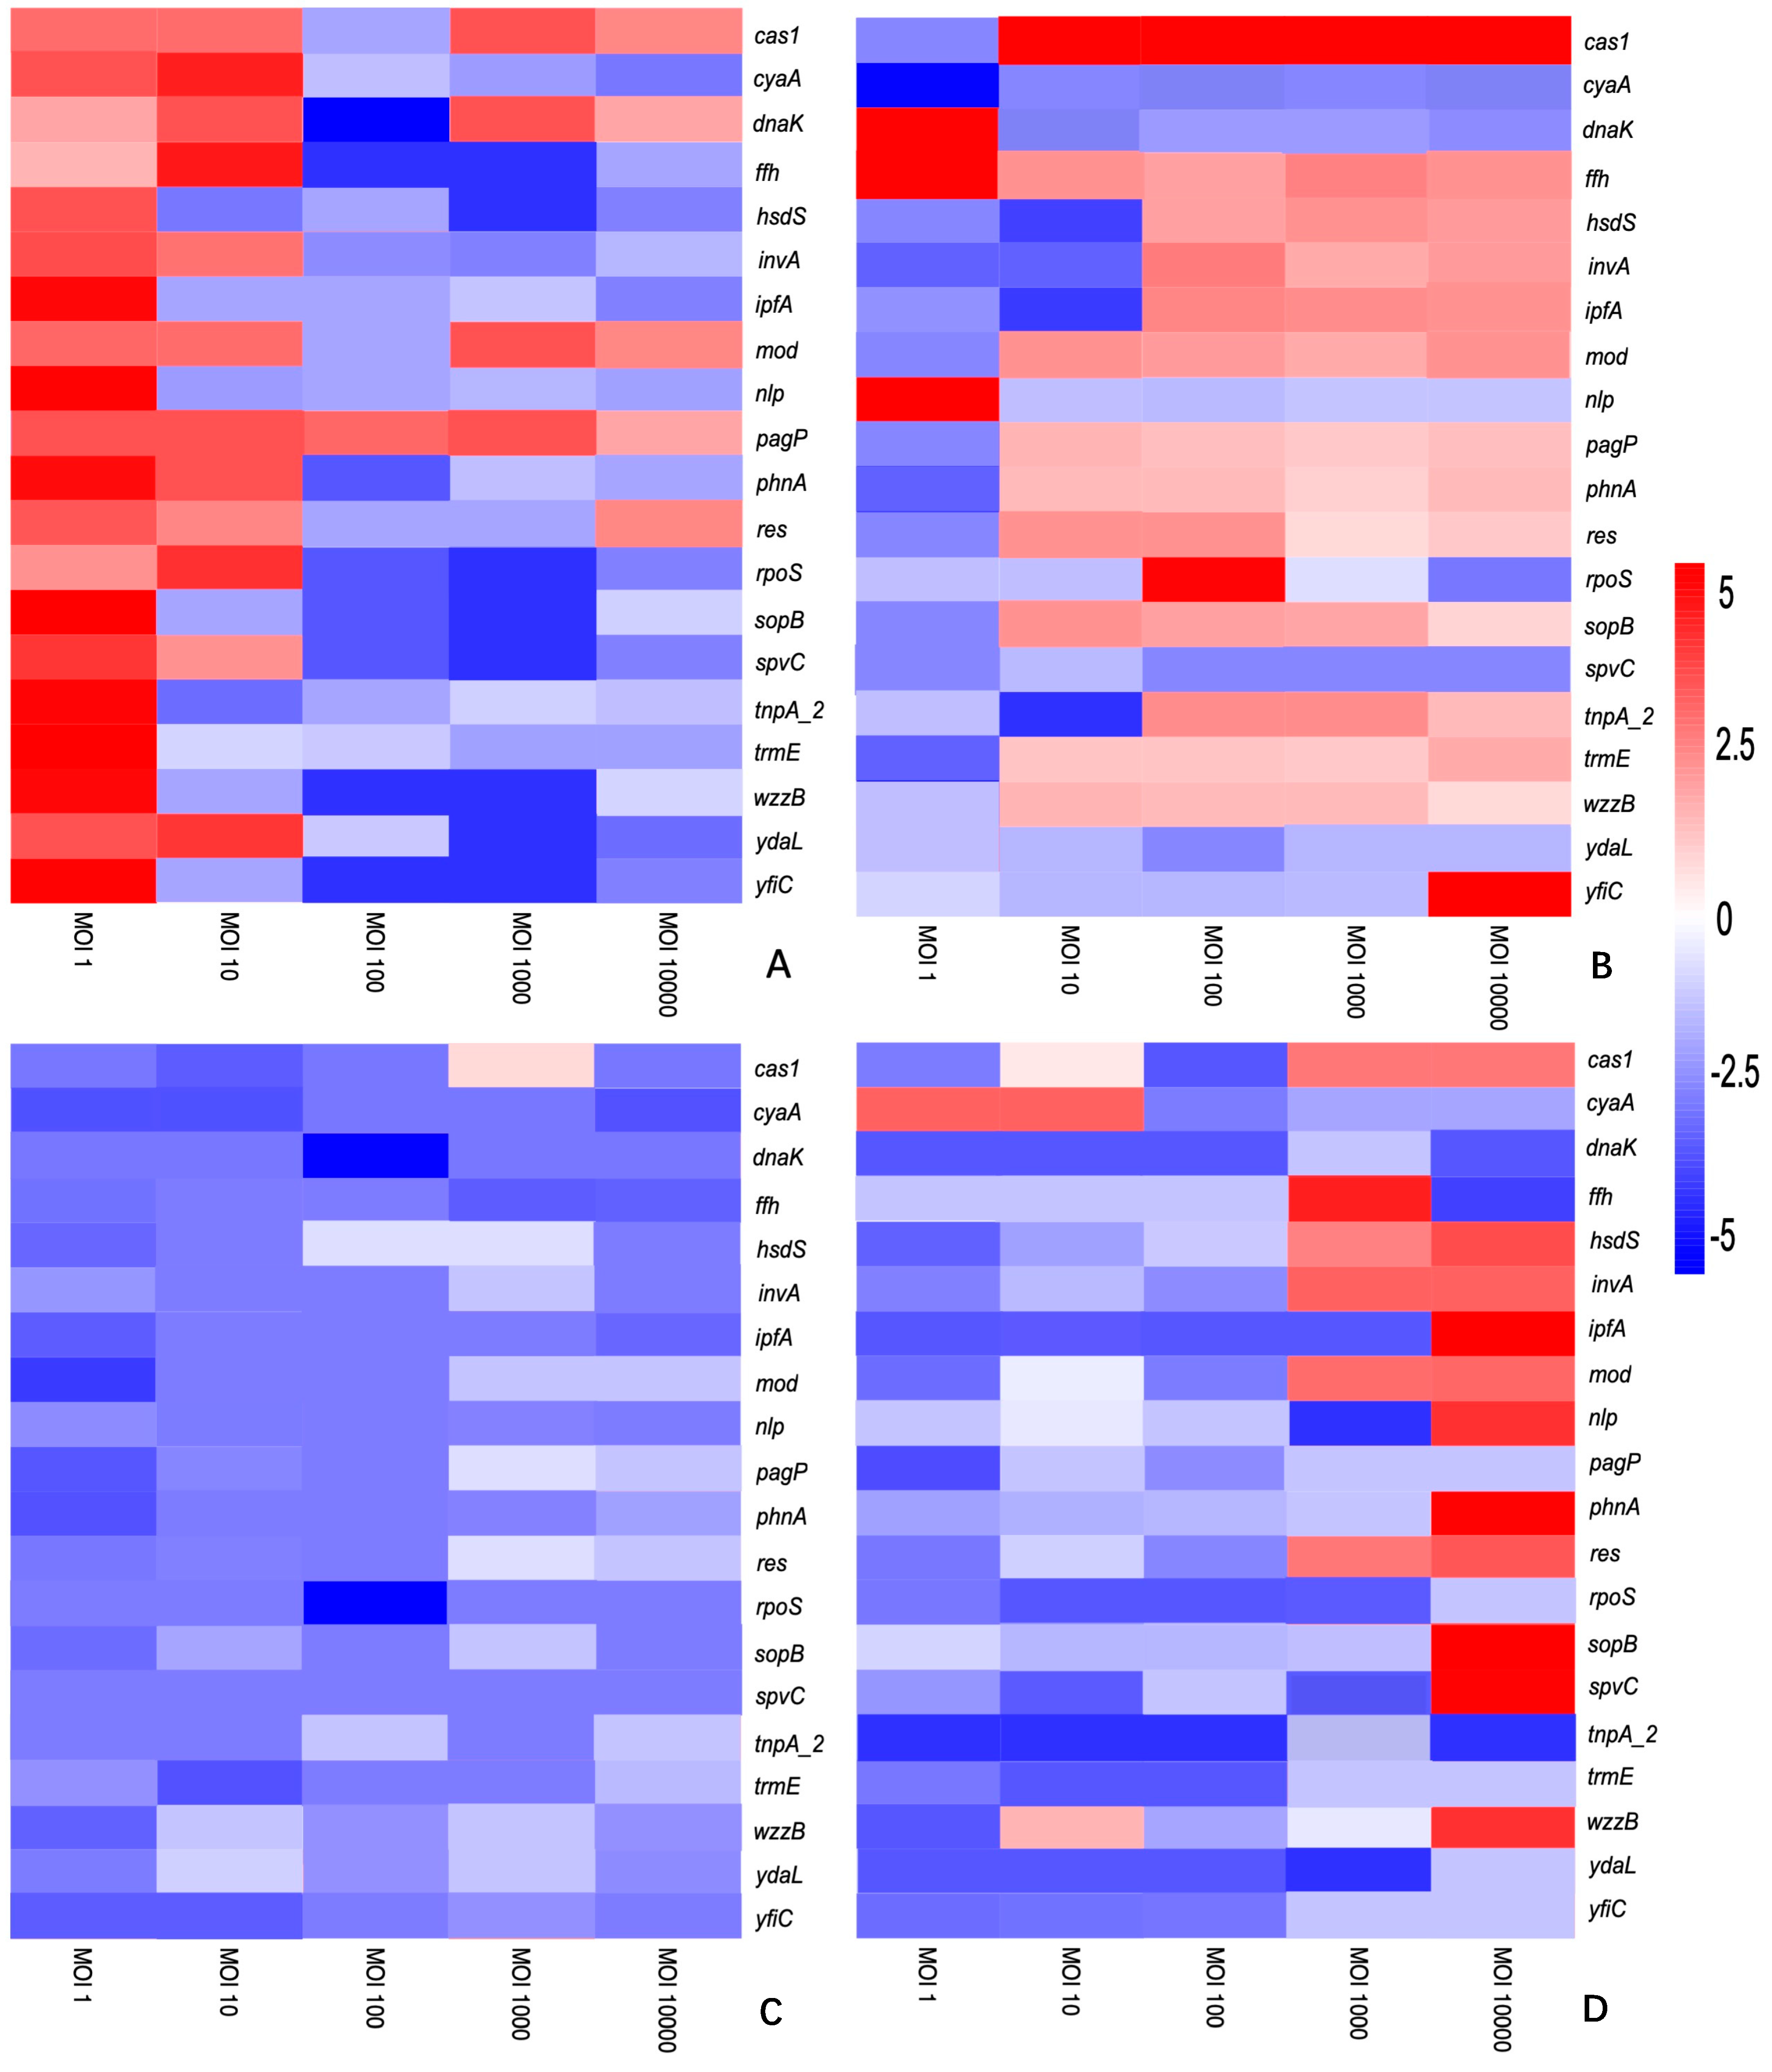
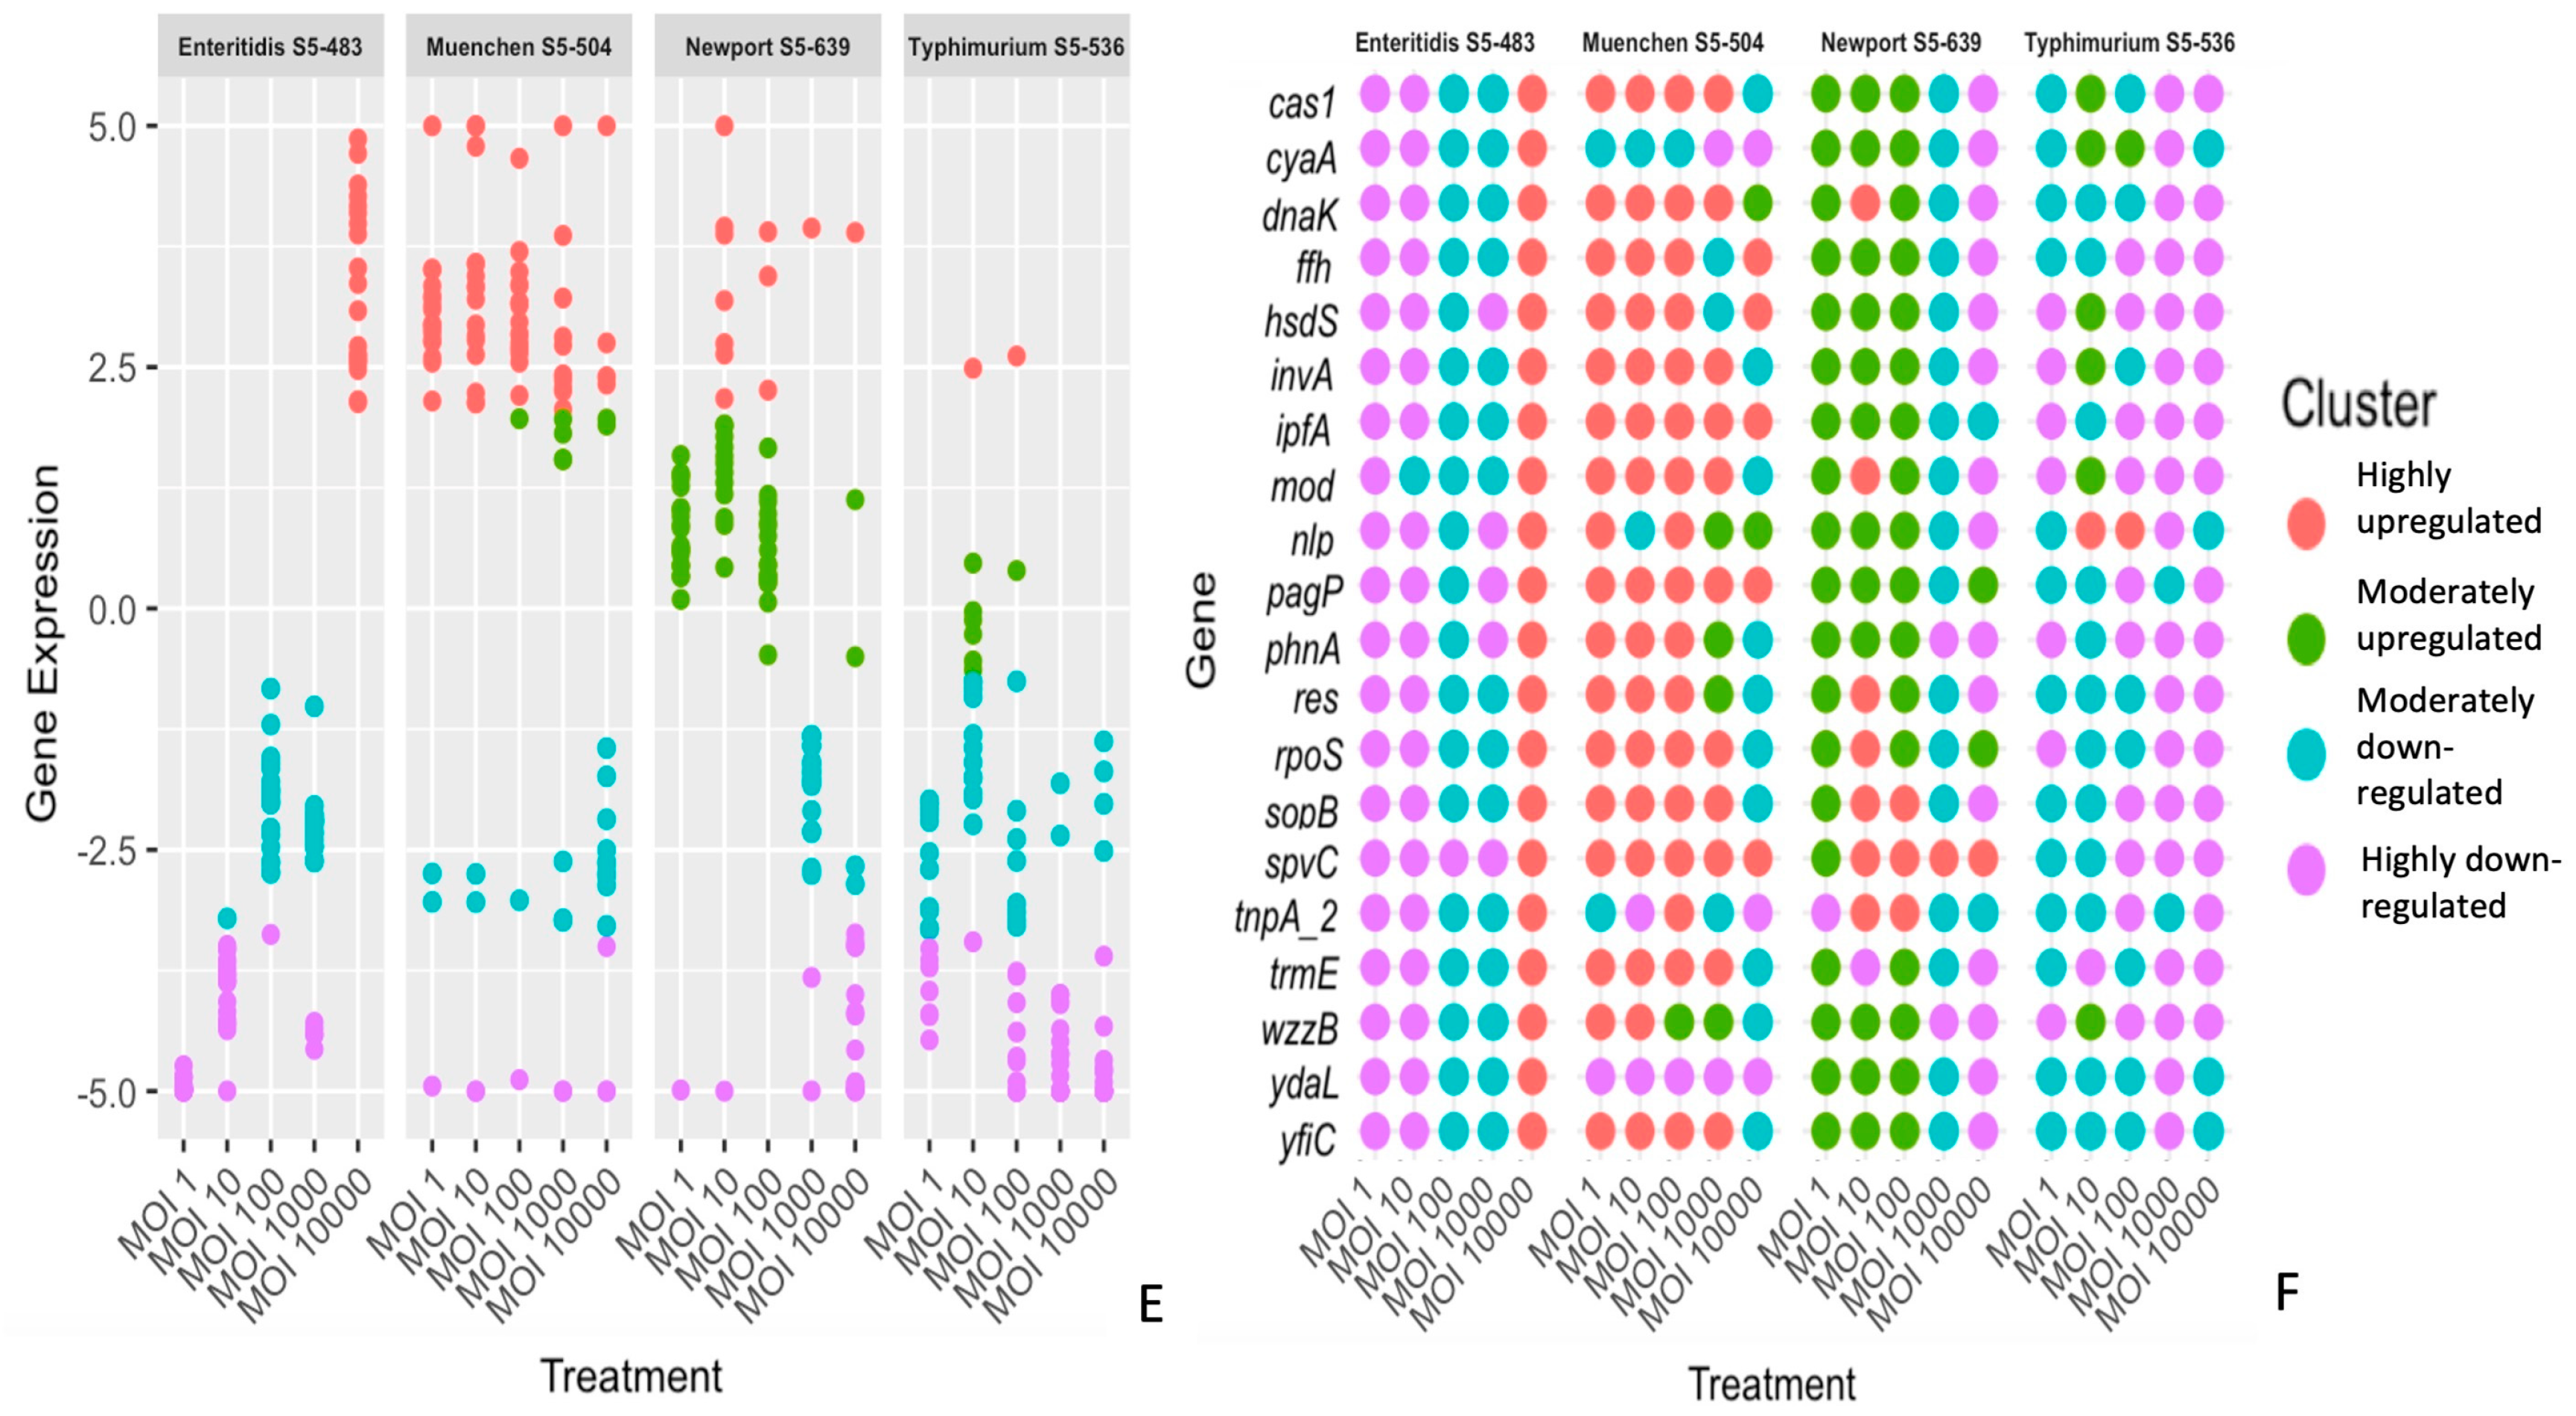
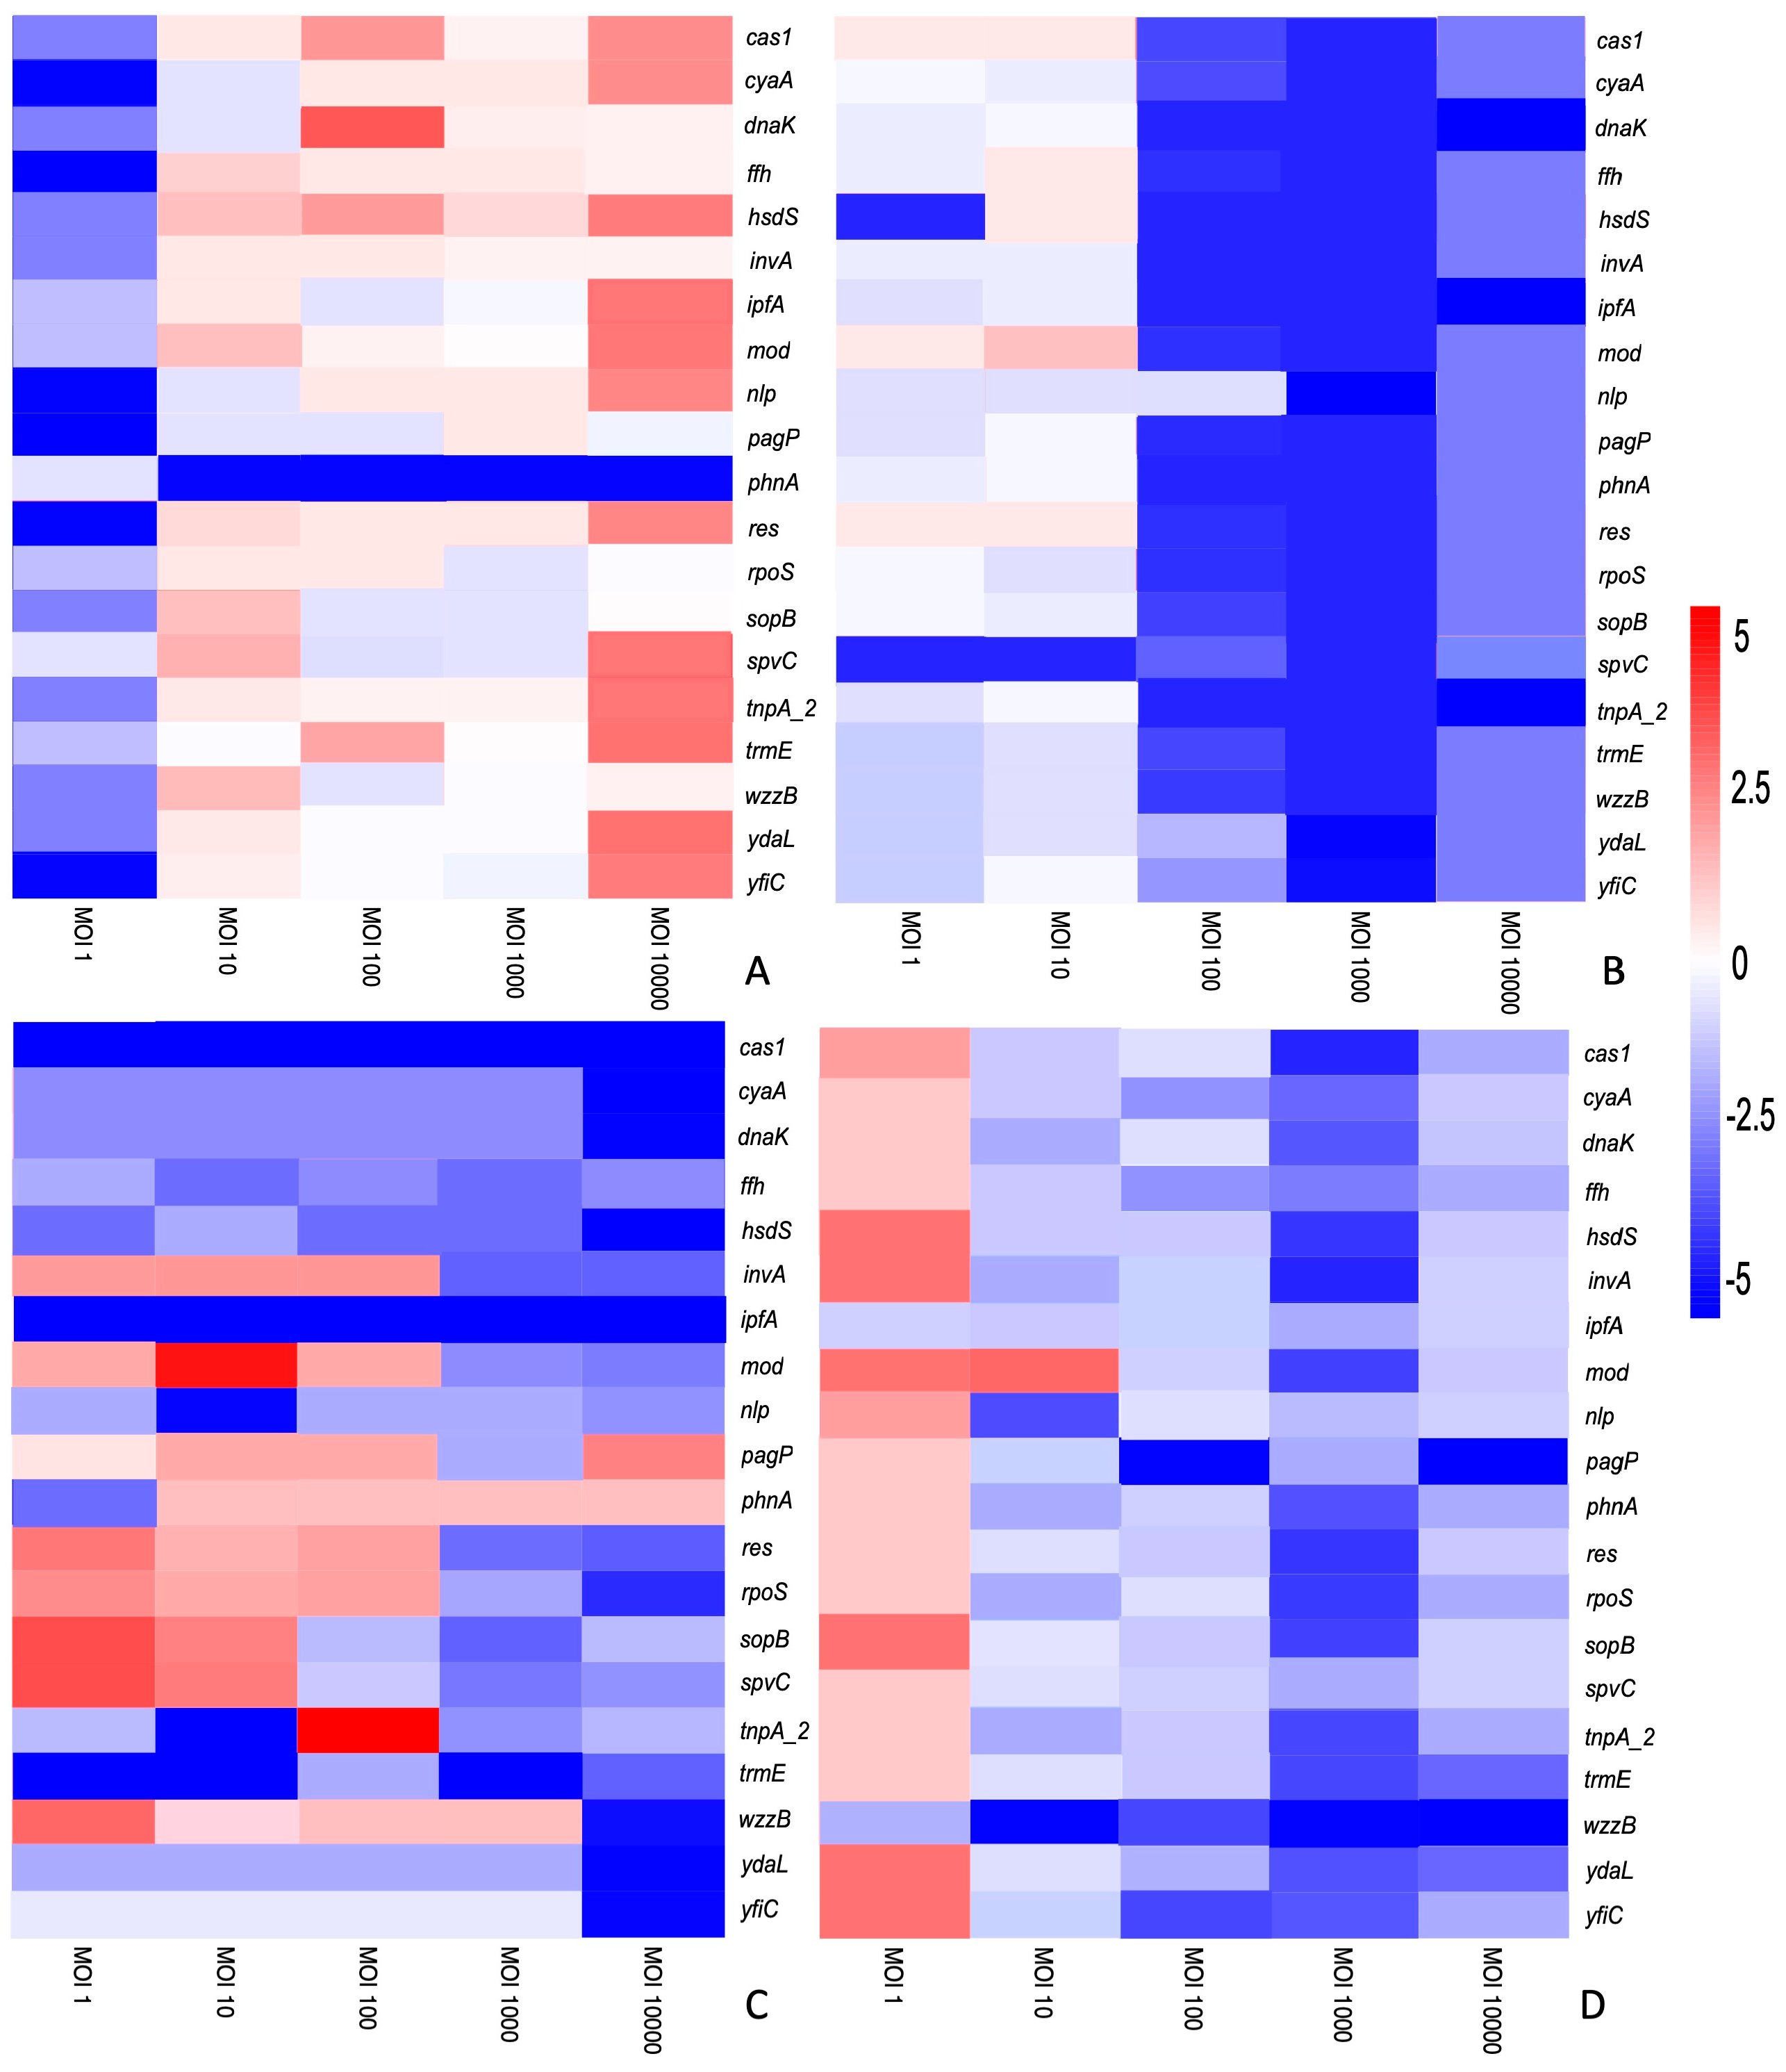
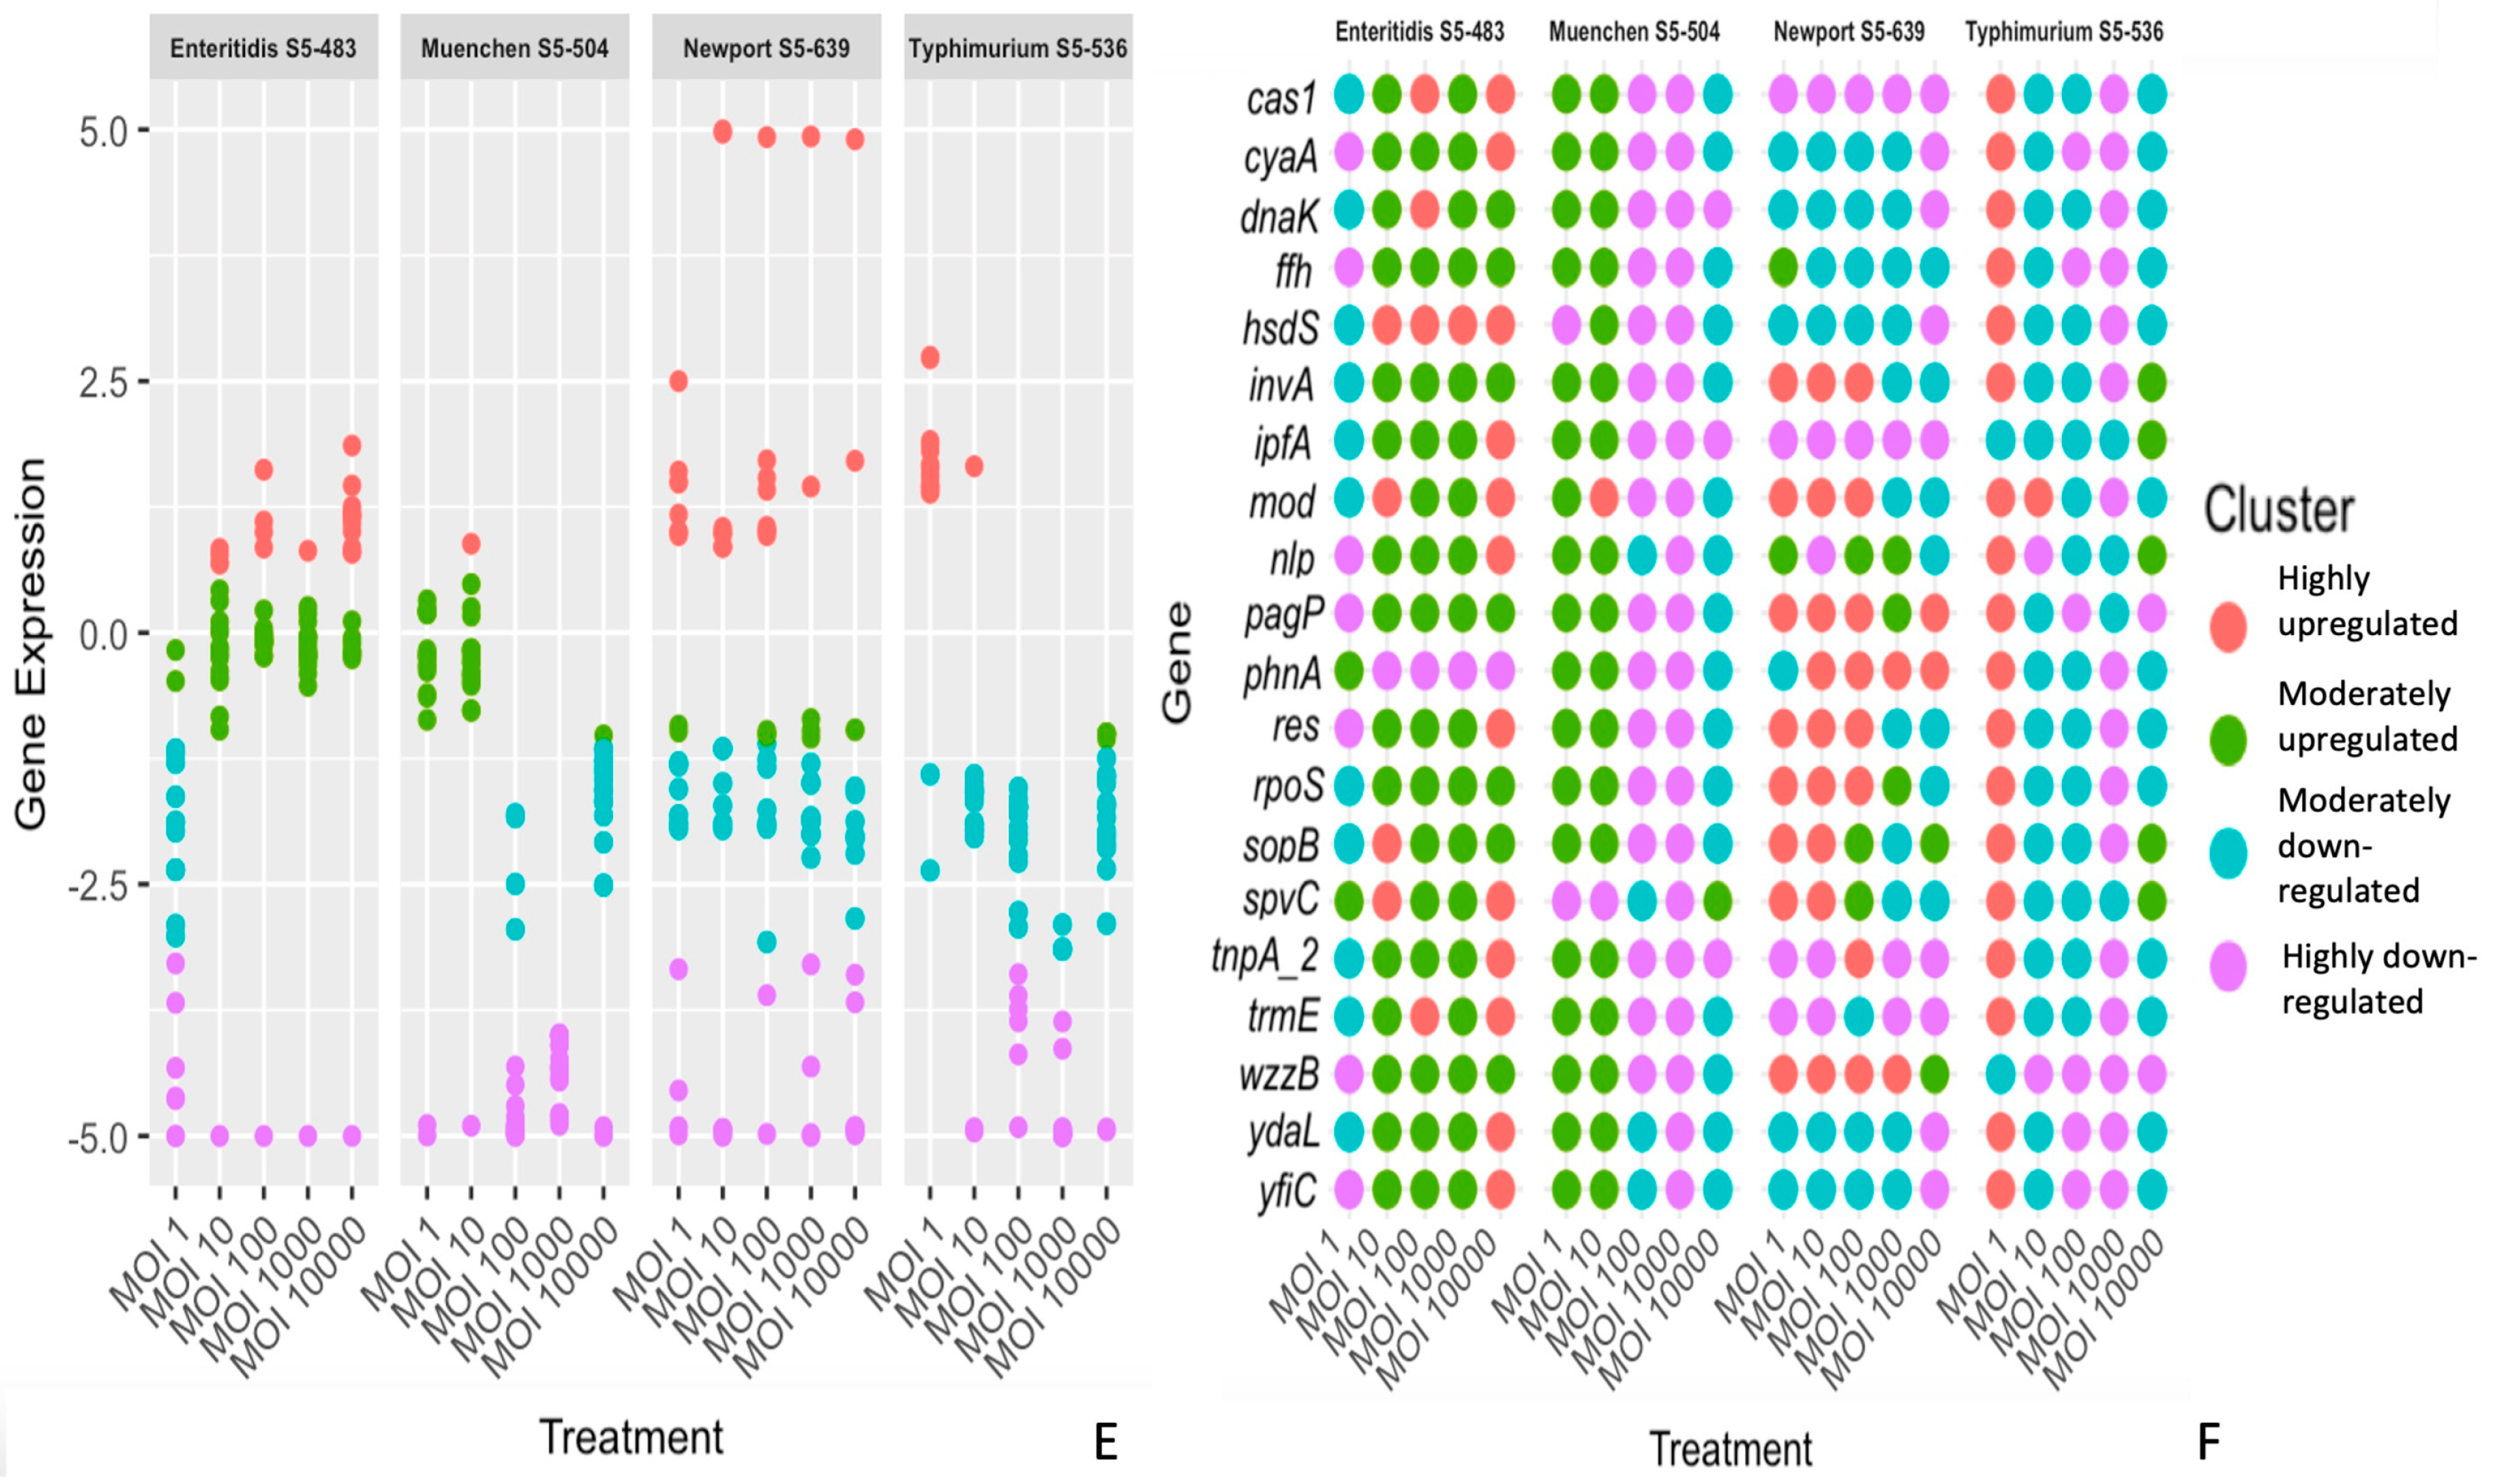
3.2. The Differential Expression of Genes Is Dependent on the S. enterica Strain, Bacteriophage and Time of Treatment

Bacteriophage cocktail (2), SE14, SF5 and SF6, at MOIs of 1, 10, 100, 1000 and 10,000 was co-inoculated with the four S. enterica strains, S. Enteritidis S5-483, S. Newport S5-639, S. Muenchen S5-504 and S. Typhimurium S5-536, in tryptic soy broth. The gene expression of 20 genes—cas1, cyaA, dnaK, ffh, hsdS, invA, ipfA, mod, nlp, pagP, phnA, res, rpoS, sopB, spvC, tnpA_2, trmE, wzzB, ydaL and yfiC—were measured with RT-qPCR immediately (day 0), on 1 day (day 1) and 3 days (day 3) after bacteriophage treatment. On day 0, bacteriophage cocktail (2), SE14, SF5 and SF6, was most effective against S. Enteritidis S5-483 and S. Typhimurium S5-536 at MOIs of 1000 and 10,000 (Figure 2), and two genes were highly upregulated across both strains at both MOIs compared with the control: cas1 and mod (Figure 3). On day 1, all 20 genes were highly upregulated for MOI 10,000 against S. Enteritidis S5-483, but the same 20 genes were all moderately or highly downregulated for all other MOIs, including MOI 1000, where S. Enteritidis S5-483 populations were below the detection limit (Figure 2 and Figure 4). On day 1, none of the 20 genes were highly upregulated for S. Typhimurium S5-536 except for nlp at MOIs of 10 and 100 (Figure 4). On day 3, when the population of S. Enteritidis S5-483 at an MOI of 1000 continued to be below the detection limit, hsdS was the only gene highly upregulated (Figure 5). The coinciding genes highly upregulated at MOIs that were most effective at reducing S. enterica populations below the detection limit were for the SOS response or DNA modification and recombination genes (Figure 3, Figure 4 and Figure 5 and Table 2).
The high upregulation of the cas1 gene on day 0 for S. Enteritidis S5-483 and S. Typhimurium S5-536 after MOI 1000 and MOI 10,000 is not surprising. The cas1 gene codes for the CRISPR/Cas system-associated protein Cas1 and is an SOS gene [23]. SOS genes are responsible for cell survival when faced with extensive DNA damage [23]. When there is a viral infection, such as bacteriophage infection, S. enterica will upregulate CRISPR-associated genes such as cas1 to adapt its immune system [48]. The immune system is adapted by acquiring a new sequence integrated into the CRISPR locus, which signals the assembly of Cas proteins into surveillance complexes that detect and degrade the viral target [48]. The high upregulation of cas1 on day 0 for both S. Enteritidis S5-483 and S. Typhimurium S5-536 after MOI 1000 and MOI 10,000 is a defence mechanism meant to detect and degrade bacteriophages. This defence mechanism may have contributed to the population resurgence of S. Typhimurium S5-536 by day 1, as cas1 was highly upregulated in both MOI 1000 and MOI 10,000, and S. Typhimurium S5-536 populations on day 0 may have been below the detection limit, but both populations resurged by day 1 (Figure 2D). However, the populations of S. Enteritidis S5-483 after MOI 1000 did not resurge by day 1, but the S. Enteritidis S5-483 populations for MOI 10,000 did resurge (Figure 2A). Therefore, the effectiveness of the differential gene expression is very much dependent on the strain, treatment and/or time.
Another gene that was highly upregulated for both S. Enteritidis S5-483 and S. Typhimurium S5-536 on day 0 for MOI 1000 and MOI 10,000 was the mod gene (Figure 3). The mod gene, along with the res gene, codes for type III restriction and modification enzymes, Mod and Res, respectively [49]. Restriction–modification genes are involved in protecting the modification of host DNA at specific recognition sites and interfering with bacteriophage DNA entering the cell [50]. Both Mod and Res hemimethylate and cleave DNA, but the difference between the two is that Mod is required for both restriction and modification, and Res is only required for restriction [49,51]. The res gene was highly upregulated in S. Typhimurium S5-536 for both MOI 1000 and MOI 10,000 and at an MOI of 10,000 for S. Enteritidis S5-483 but moderately downregulated for S. Enteritidis S5-483 on day 0 for MOI 1000 (Figure 3). The authors of [49] found that, when bacterial mutants were transcribing res but not transcribing mod, it was lethal to the mutant. This was similarly shown in the gene expression results from all four S. enterica strains across all MOI treatments and days where, when res was highly upregulated, mod was also highly upregulated (Figure 3, Figure 4 and Figure 5). However, when mod was highly upregulated, res was not always highly upregulated (Figure 3, Figure 4 and Figure 5). This supports the idea that mod and res are interlinked for the formation of type III restriction and modification enzymes after bacteriophage treatment, but because mod is required for both restriction and modification, it can be more highly expressed in situations when res is not.
On day 0, all 20 genes were upregulated for S. Enteritidis S5-483 after MOI 1, whereas a higher number of genes were downregulated for MOIs 100, 1000 and 10,000 (Figure 3A). In contrast, all genes were highly upregulated for S. Enteritidis S5-483 after MOI 10,000 on day 1, whereas all genes were downregulated for the other MOIs on day 1 (Figure 4A). When comparing populations between the four strains on day 0, MOI 1 for S. Enteritidis S5-483 was the most effective MOI 1 for bacteriophage cocktail (2), SE14, SF5 and SF6, and was able to reduce populations by ~1 log CFU/mL (Figure 2). At a low MOI of 1, ~1 log CFU/mL reduction can be considered quite effective, and potentially, the upregulation of all 20 genes was a response intended for S. Enteritidis S5-483 to overcome the bacteriophage treatment and have a population resurgence by day 1 (Figure 3A). Both MOIs 10 and 10,000 for S. Enteritidis S5-483 had a population resurgence by day 1 after populations were below the detection limit on day 0 (Figure 3A and Figure 4A). The high upregulation of all 20 genes for S. Enteritidis S5-483 after MOI 10,000 could be attributed to the theory of lysis from without, where there is an overload of bacteriophages, and the high upregulation of all genes may have been to overcome the high concentration of bacteriophages for population resurgence on day 1 (Figure 4A). Aside from cas1, which was moderately upregulated for S. Newport S5-639 at an MOI of 1000, all genes were moderately to highly downregulated across the MOIs for S. Newport S5-639 on day 0 (Figure 3C). This was unexpected because S. Newport S5-639 populations were reduced by <0.5 log CFU/mL for MOIs 1–1000 and ~1.5 log CFU/mL for MOI 10,000; therefore, it was expected that there would be more differential gene expression between the MOIs on day 0 (Figure 2C). However, it is important to note that there were only 20 genes studied, and there are many more genes that were not studied that may have been differentially expressed.
On day 3, hsdS was the only gene highly upregulated for S. Enteritidis S5-483 after MOI 1000 and is another DNA restriction and modification gene (Figure 5). A type I restriction and modification system comprises of three gene products, hsdR, hsdM and hsdS [51]. The first gene, hsdR is used for restriction, hsdM for methylation and hsdS for sequence specificity [51]. Of the three gene products, only hsdM and hsdS are required for both restriction and methylation [51]. By day 3, S. Enteritidis S5-483 populations were still below the detection limit, and the high upregulation of DNA modification and restriction genes throughout the three days may indicate that any surviving S. Enteritidis S5-483 cells were still highly expressing these genes as a defence mechanism against invading bacteriophages [52]. Potentially, if a later timepoint, such as day 10 or 15, was used, there might be an S. Enteritidis S5-483 population resurgence, and populations might be above the detection limit; however, this will require further study.
Previous research indicates an upregulation in genes involved in SOS response (cas1) and restriction–modification (hsdS) in Salmonella Typhimurium with impaired sensitivity to the target bacteriophage, fmb-p1 [23]. Even though Salmonella Typhimurium had an impaired sensitivity to fmb-p1, it was not completely resistant to it; the SOS response and restriction and modification genes were upregulated, but genes involved in virulence were downregulated [23]. For the virulence genes (invA, ipfA, spvC, sopB) used in this study, all were moderately or highly downregulated for S. Enteritidis S5-483 and S. Typhimurium S5-536 after MOI 1000 on day 0, except for invA in S. Typhimurium S5-536, which was highly upregulated (Figure 3). All four virulence genes continued to be moderately or highly downregulated for S. Enteritidis S5-483 on day 1 for MOI 1000 (Figure 4). The differing expression of invA in S. Typhimurium S5-536 is unclear, but it is important to note that the MOI used by [23] was an MOI of 0.01, and the MOI used in this study was an MOI of 1000. The difference in MOIs could potentially cause differences in the gene expression of virulence genes in S. enterica.

4. Conclusions

When bacteriophage treatment is implemented in the food industry, it is important to determine the most optimal MOI for the bacteriophage cocktail used. For this study, MOI 1000 was the most optimal, but for some S. enterica strains, such as S. Typhimurium S5-536, after the bacteriophage cocktail SE14, SF6 and SF5 treatment on day 0, the most effective were both MOIs 1000 and 10,000. For this timepoint, MOI 10,000 may have similar effectiveness compared to MOI 1000, but it would not be the most optimal because a higher number of bacteriophages were implemented than necessary. An insight into the optimal bacteriophage MOI could play a role in reducing antimicrobial costs. For the gene expression of S. enterica after bacteriophage treatment, the high upregulation of SOS and DNA modification and recombination genes indicate that S. enterica activates defence mechanisms against bacteriophage infection for survival. However, it is important to note that the 20 genes studied are a small subset of all genes regulating S. enterica. There may be many other S. enterica genes that are differentially expressed after bacteriophage treatment that were not studied here. Therefore, future studies should include RNA sequencing and transcriptomics to gain a fuller picture of all the S. enterica genes differentially expressed after bacteriophage treatment.

Author Contributions

Conceptualization, C.W.Y.W. and S.W.; methodology, C.W.Y.W. and S.W.; data collection, C.W.Y.W.; data analysis, C.W.Y.W.; writing—original draft preparation, C.W.Y.W.; writing—review and editing, C.W.Y.W. and S.W.; supervision, S.W.; funding acquisition, S.W. All authors have read and agreed to the published version of the manuscript.

Funding

This research was supported by the Natural Science and Engineering Research Council of Canada (NSERC RGPIN-2023-04110).

Data Availability Statement

Data are contained within the article.

Conflicts of Interest

The authors declare that there are no known competing financial interests or personal relationships that could have influenced the work reported in this paper.

References

  1. Centers for Disease Control and Prevention List of Selected Multistate Foodborne Outbreak Notices. Available online: https://www.cdc.gov/foodsafety/outbreaks/lists/outbreaks-list.html (accessed on 8 August 2023).
  2. Abdelhamid, A.G.; El-Dougdoug, N.K. Controlling Foodborne Pathogens with Natural Antimicrobials by Biological Control and Antivirulence Strategies. Heliyon 2020, 6, E05020. [Google Scholar] [CrossRef]
  3. Sahoo, M.; Panigrahi, C.; Aradwad, P. Management Strategies Emphasizing Advanced Food Processing Approaches to Mitigate Food Borne Zoonotic Pathogens in Food System. Food Front. 2022, 3, 641–665. [Google Scholar] [CrossRef]
  4. Carlson, A.; Skorbiansky, S.R. Strong Growth in Organic Market Slowed in 2021; U.S. Department of Agriculture: Washington, DC, USA, 2021.
  5. Połaska, M.; Sokołowska, B. Bacteriophages—A New Hope or a Huge Problem in the Food Industry. AIMS Microbiol. 2019, 5, 324–347. [Google Scholar] [CrossRef] [PubMed]
  6. Wang, Y.; Wu, J.; Lv, M.; Shao, Z.; Hungwe, M.; Wang, J.; Bai, X.; Xie, J.; Wang, Y.; Geng, W. Metabolism Characteristics of Lactic Acid Bacteria and the Expanding Applications in Food Industry. Front. Bioeng. Biotechnol. 2021, 9, 612285. [Google Scholar] [CrossRef] [PubMed]
  7. Moye, Z.D.; Woolston, J.; Sulakvelidze, A. Bacteriophage Applications for Food Production and Processing. Viruses 2018, 10, 205. [Google Scholar] [CrossRef] [PubMed]
  8. Endersen, L.; Coffey, A. The Use of Bacteriophages for Food Safety. Curr. Opin. Food Sci. 2020, 36, 1–8. [Google Scholar] [CrossRef]
  9. Fernández, L.; Gutiérrez, D.; Rodríguez, A.; García, P. Application of Bacteriophages in the Agro-Food Sector: A Long Way Toward Approval. Front. Cell. Infect. Microbiol. 2018, 8, 296. [Google Scholar] [CrossRef] [PubMed]
  10. Sillankorva, S.M.; Oliveira, H.; Azeredo, J. Bacteriophages and Their Role in Food Safety. Int. J. Microbiol. 2012, 2012, 863945. [Google Scholar] [CrossRef] [PubMed]
  11. Aguilera, M.; Martínez, S.; Tello, M.; Gallardo, M.J.; García, V. Use of Cocktail of Bacteriophage for Salmonella Typhimurium Control in Chicken Meat. Foods 2022, 11, 1164. [Google Scholar] [CrossRef]
  12. Wong, C.W.Y.; Delaquis, P.; Goodridge, L.; Lévesque, R.C.; Fong, K.; Wang, S. Inactivation of Salmonella enterica on Post-Harvest Cantaloupe and Lettuce by a Lytic Bacteriophage Cocktail. Curr. Res. Food Sci. 2020, 2, 25–32. [Google Scholar] [CrossRef]
  13. Kocharunchitt, C.; Ross, T.; McNeil, D.L. Use of Bacteriophages as Biocontrol Agents to Control Salmonella Associated with Seed Sprouts. Int. J. Food Microbiol. 2009, 128, 453–459. [Google Scholar] [CrossRef]
  14. Fong, K.; LaBossiere, B.; Switt, A.I.M.; Delaquis, P.; Goodridge, L.; Levesque, R.C.; Danyluk, M.D.; Wang, S. Characterization of Four Novel Bacteriophages Isolated from British Columbia for Control of Non-Typhoidal Salmonella in Vitro and on Sprouting Alfalfa Seeds. Front. Microbiol. 2017, 8, 2193. [Google Scholar] [CrossRef]
  15. Wong, C.W.Y.; Wang, S. Efficacy of Repeated Applications of Bacteriophages on Salmonella enterica-Infected Alfalfa Sprouts during Germination. Pathogens 2022, 11, 1156. [Google Scholar] [CrossRef]
  16. Fong, K.; Tremblay, D.M.; Delaquis, P.; Goodridge, L.; Levesque, R.C.; Moineau, S.; Suttle, C.A.; Wang, S. Diversity and Host Specificity Revealed by Biological Characterization and Whole Genome Sequencing of Bacteriophages Infecting Salmonella enterica. Viruses 2019, 11, 854. [Google Scholar] [CrossRef]
  17. Jackson, B.R.; Griffin, P.M.; Cole, D.; Walsh, K.A.; Chai, S.J. Outbreak-associated Salmonella enterica serotypes and food commodities, United States, 1998–2008. Emerg. Infect. Dis. 2013, 19, 1239–1244. [Google Scholar] [CrossRef]
  18. Hatfield, J.L.; Prueger, J.H. Temperature extremes: Effect on plant growth and development. Weather Clim. Extrem. 2015, 10, 4–10. [Google Scholar] [CrossRef]
  19. Motsa, M.M.; Slabbert, M.M.; van Averbeke, W.; Morey, L. Effect of light and temperature on seed germination of selected African leafy vegetables. S. Afr. J. Bot. 2015, 99, 29–35. [Google Scholar] [CrossRef]
  20. Pazzagli, M.; Malentacchi, F.; Simi, L.; Orlando, C.; Wyrich, R.; Günther, K.; Hartmann, C.C.; Verderio, P.; Pizzamiglio, S.; Ciniselli, C.M.; et al. SPIDIA-RNA: First External Quality Assessment for the Pre-Analytical Phase of Blood Samples Used for RNA Based Analyses. Methods 2013, 59, 20–31. [Google Scholar] [CrossRef] [PubMed]
  21. Padhi, B.K.; Singh, M.; Rosales, M.; Pelletier, G.; Cakmak, S. A PCR-Based Quantitative Assay for the Evaluation of MRNA Integrity in Rat Samples. Biomol. Detect. Quantif. 2018, 15, 18–23. [Google Scholar] [CrossRef] [PubMed]
  22. Fleige, S.; Pfaffl, M.W. RNA Integrity and the Effect on the Real-Time QRT-PCR Performance. Mol. Asp. Med. 2006, 27, 126–139. [Google Scholar] [CrossRef] [PubMed]
  23. Wang, C.; Nie, T.; Lin, F.; Connerton, I.F.; Lu, Z.; Zhou, S.; Hang, H. Resistance Mechanisms Adopted By a Salmonella Typhimurium Mutant Against Bacteriophage. Virus Res. 2019, 273, 197759. [Google Scholar] [CrossRef]
  24. Fernández, P.A.; Zabner, M.; Ortega, J.; Morgado, C.; Amaya, F.; Vera, G.; Rubilar, C.; Salas, B.; Cuevas, V.; Valenzuela, C.; et al. Novel Template Plasmids PCyaA’-Kan and PCyaA’-Cam for Generation of Unmarked Chromosomal CyaA’ Translational Fusion to T3SS Effectors in Salmonella. Microorganisms 2021, 9, 475. [Google Scholar] [CrossRef]
  25. Ramos-Morales, F.; Cardenal-Munoz, E.; Cordero-Alba, M.; Baison-Olmo, F. Generation and Use of Site-Directed Chromosomal CyaA′ Translational Fusions in Salmonella enterica. In Salmonella Methods and Protocols; Springer: Berlin/Heidelberg, Germany, 2015; Volume 2, pp. 93–104. [Google Scholar]
  26. Takaya, A.; Tomoyasu, T.; Matsui, H.; Yamamoto, T. The DnaK/DnaJ Chaperone Machinery of Salmonella enterica Serovar Typhimurium Is Essential for Invasion of Epithelial Cells and Survival within Macrophages, Leading to Systemic Infection. Infect. Immun. 2004, 72, 1364–1373. [Google Scholar] [CrossRef]
  27. Peschke, M.; Le Goff, M.; Koningstein, G.M.; Karyolaimos, A.; de Gier, J.W.; van Ulsen, P.; Luirink, J. SRP, FtsY, DnaK and YidC Are Required for the Biogenesis of the E. Coli Tail-Anchored Membrane Proteins DjlC and Flk. J. Mol. Biol. 2018, 430, 389–403. [Google Scholar] [CrossRef]
  28. Mohammed, B.T. Identification and Bioinformatic Analysis of InvA Gene of Salmonella in Free Range Chicken. Braz. J. Biol. 2022, 84, e263363. [Google Scholar] [CrossRef]
  29. Siddiky, N.A.; Sarker, M.S.; Khan, M.S.R.; Begum, R.; Kabir, M.E.; Karim, M.R.; Rahman, M.T.; Mahmud, A.; Samad, M.A. Virulence and Antimicrobial Resistance Profiles of Salmonella enterica Serovars Isolated from Chicken at Wet Markets in Dhaka, Bangladesh. Microorganisms 2021, 9, 952. [Google Scholar] [CrossRef] [PubMed]
  30. Yehia, H.M.; Fawzy Elkhadragy, M.; Al-Masoud1, A.A.; Al-Dagal1, M.M.; Al-Dagal, M. InvA Gene to Detect Salmonella enterica Serovar Typhimurium Supported by Serum Anti-Salmonella Antibodies and Protein Proles for Chicken Carcass Isolates. Res. Sq. 2020, 1–14. [Google Scholar] [CrossRef]
  31. Aviv, G.; Elpers, L.; Mikhlin, S.; Cohen, H.; Vitman Zilber, S.; Grassl, G.A.; Rahav, G.; Hensel, M.; Gal-Mor, O. The Plasmid-Encoded Ipf and Klf Fimbriae Display Different Expression and Varying Roles in the Virulence of Salmonella enterica Serovar Infantis in Mouse vs. Avian Hosts. PLoS Pathog. 2017, 13, e1006559. [Google Scholar] [CrossRef] [PubMed]
  32. Canals, R.; Hammarlöf, D.L.; Kröger, C.; Owen, S.V.; Yee Fong, W.; Zhu, X.; Wenner, N.; Carden, S.E.; Honeycutt, J.; Monack, M.; et al. Adding Function to the Genome of African Salmonella ST313. PLoS Biol. 2019, 17, e3000059. [Google Scholar] [CrossRef]
  33. Elfenbein, J.R.; Knodler, L.A.; Schaeffer, A.R.; Faber, F.; Bäumler, A.J.; Andrews-Polymenis, H.L. A Salmonella Regulator Modulates Intestinal Colonization and Use of Phosphonoacetic Acid. Front. Cell. Infect. Microbiol. 2017, 7, 69. [Google Scholar] [CrossRef]
  34. Kulakova, A.N.; Kulakov, L.A.; Akulenko, N.V.; Ksenzenko, V.N.; Hamilton, J.T.G.; Quinn, J.P. Structural and Functional Analysis of the Phosphonoacetate Hydrolase (PhnA) Gene Region in Pseudomonas Fluorescens 23F. J. Bacteriol. 2001, 183, 3268–3275. [Google Scholar] [CrossRef]
  35. Franco Meléndez, K.; Crenshaw, K.; Barrila, J.; Yang, J.; Gangaraju, S.; Davis, R.R.; Forsyth, R.J.; Ott, C.M.; Kader, R.; Curtiss, R.; et al. Role of RpoS in Regulating Stationary Phase Salmonella Typhimurium Pathogenesis-Related Stress Responses under Physiological Low Fluid Shear Force Conditions. mSphere 2022, 7, e00210-22. [Google Scholar] [CrossRef] [PubMed]
  36. Giacomodonato, M.N.; Sarnacki, S.H.; Llana, M.N.; Cerquetti, M.C. SopB Effector Protein of Salmonella Typhimurium Is Translocated in Mesenteric Lymph Nodes during Murine Salmonellosis. FEMS Microbiol. Lett. 2011, 317, 100–106. [Google Scholar] [CrossRef] [PubMed]
  37. Zhao, S.; Xu, Q.; Cui, Y.; Yao, S.; Jin, S.; Zhang, Q.; Wen, Z.; Ruan, H.; Liang, X.; Chao, Y.; et al. Salmonella Effector SopB Reorganizes Cytoskeletal Vimentin to Maintain Replication Vacuoles for Efficient Infection. Nat. Commun. 2023, 14, 478. [Google Scholar] [CrossRef]
  38. Guiney, D.G.; Fierer, J. The Role of the Spv Genes in Salmonella Pathogenesis. Front. Microbiol. 2011, 2, 129. [Google Scholar] [CrossRef] [PubMed]
  39. Zuo, L.; Zhou, L.; Wu, C.; Wang, Y.; Li, Y.; Huang, R.; Wu, S. Salmonella spvC Gene Inhibits Pyroptosis and Intestinal Inflammation to Aggravate Systemic Infection in Mice. Front. Microbiol. 2020, 11, 562491. [Google Scholar] [CrossRef]
  40. Chang, H.K.; Mohseni, P.; Zylstra, G.J. Characterization and Regulation of the Genes for a Novel Anthranilate 1,2-Dioxygenase from Burkholderia Cepacia DBO1. J. Bacteriol. 2003, 185, 5871–5881. [Google Scholar] [CrossRef]
  41. Gall, A.R.; Datsenko, K.A.; Figueroa-Bossi, N.; Bossi, L.; Masuda, I.; Hou, Y.M.; Csonka, L.N. Mg2+ Regulates Transcription of MgtA in Salmonella Typhimurium via Translation of Proline Codons during Synthesis of the MgtL Peptide. Proc. Natl. Acad. Sci. USA 2016, 113, 15096–15101. [Google Scholar] [CrossRef]
  42. Thomason, M.K.; Fontaine, F.; De Lay, N.; Storz, G. A Small RNA That Regulates Motility and Biofilm Formation in Response to Changes in Nutrient Availability in Escherichia coli. Mol. Microbiol. 2012, 84, 17–35. [Google Scholar] [CrossRef]
  43. Golovina, A.Y.; Sergiev, P.V.; Golovin, A.V.; Serebryakova, M.V.; Demina, I.; Govorun, V.M.; Dontsova, O.A. The YfiC Gene of E. coli Encodes an Adenine-N6 Methyltransferase That Specifically Modifies A37 of TRNA1Val(Cmo5UAC). RNA 2009, 15, 1134–1141. [Google Scholar] [CrossRef]
  44. Mirzaei, M.K.; Nilsson, A.S. Isolation of Phages for Phage Therapy: A Comparison of Spot Tests and Efficiency of Plating Analyses for Determination of Host Range and Efficacy. PLoS ONE 2015, 10, e0118557. [Google Scholar] [CrossRef]
  45. Abedon, S.T. Lysis from Without. Bacteriophage 2011, 1, 46. [Google Scholar] [CrossRef] [PubMed]
  46. Bull, J.J.; Christensen, K.A.; Scott, C.; Jack, B.R.; Crandall, C.J.; Krone, S.M. Phage-Bacterial Dynamics with Spatial Structure: Self Organization around Phage Sinks Can Promote Increased Cell Densities. Antibiotics 2018, 7, 8. [Google Scholar] [CrossRef] [PubMed]
  47. U.S. Food & Drug Administration. GRAS Notice No. GRN 000435 [WWW Document]. 2021. Available online: https://www.fda.gov/media/151413/download (accessed on 25 September 2023).
  48. Rollins, M.C.F.; Chowdhury, S.; Carter, J.; Golden, S.M.; Wilkinson, R.A.; Bondy-Denomy, J.; Lander, G.C.; Wiedenheft, B. Cas1 and the Csy Complex Are Opposing Regulators of Cas2/3 Nuclease Activity. Proc. Natl. Acad. Sci. USA 2017, 114, E5113–E5121. [Google Scholar] [CrossRef] [PubMed]
  49. Dartois, W.; De Backer, O.; Colson, C. Sequence of the Salmonella Typhimurium StyLT 1 Restriction-Modification Genes: Homologies with EcoPI and EcoPS 5 Type-III R-M Systems and Presence of Helicase Domains. Gene 1993, 127, 105–110. [Google Scholar] [CrossRef] [PubMed]
  50. Zaworski, J.; McClung, C.; Ruse, C.; Weigele, P.R.; Hendrix, R.W.; Ko, C.-C.; Edgar, R.; Hatfull, G.F.; Casjens, S.R.; Raleigh, E.A. Genome Analysis of Salmonella Enterica Serovar Typhimurium Bacteriophage L, Indicator for StySA (StyLT2III) Restriction-Modification System Action. G3 2021, 11, jkaa037. [Google Scholar] [CrossRef]
  51. Roer, L.; Hendriksen, R.S.; Leekitcharoenphon, P.; Lukjancenko, O.; Kaas, R.S.; Hasman, H.; Aarestrup, F.M. Is the Evolution of Salmonella enterica Subsp. Enterica Linked to Restriction-Modification Systems? mSystems 2016, 1, e00009-16. [Google Scholar] [CrossRef]
  52. Vasu, K.; Nagaraja, V. Diverse Functions of Restriction-Modification Systems in Addition to Cellular Defense. Microbiol. Mol. Biol. Rev. 2013, 77, 53–72. [Google Scholar] [CrossRef]
Figure 1. Population estimation (Log CFU/mL) of S. Enteritidis S5-483 (A), S. Muenchen S5-504 (B), S. Newport S5-639 (C) and S. Typhimurium S5-536 (D) after bacteriophage cocktail (1), SE14, SE20 and SF6, treatments: Control, MOI 1, MOI 10, MOI 100, MOI 1000 and MOI 10,000 in tryptic soy broth on days 0, 1, 2 and 3 at 22 ± 1 °C. Each data timepoint represents six biological replicates. Significant differences were determined with p < 0.05.
Applmicrobiol 04 00027 g001
Figure 2. Population estimation (Log CFU/mL) of S. Enteritidis S5-483 (A), S. Muenchen S5-504 (B), S. Newport S5-639 (C) and S. Typhimurium S5-536 (D) after bacteriophage cocktail (2), SE14, SF5 and SF6, treatments: Control, MOI 1, MOI 10, MOI 100, MOI 1000 and MOI 10,000 in tryptic soy broth on days 0, 1, 2 and 3 at 22 ± 1 °C. Each data timepoint represents six biological replicates. Significant differences were determined with p < 0.05.
Applmicrobiol 04 00027 g002
Figure 3. Heatmap plots (AD) and K-means clustering (E) of 20 differentially expression genes (cas1, cyaA, dnaK, ffh, hsdS, invA, ipfA, mod, nlp, pagP, phnA, res, rpoS, sopB, spvC, tnpA_2, trmE, wzzB, ydaL and yfiC) immediately after bacteriophage cocktail (SE14, SF5, SF6) treatment (day 0) at MOIs of 1, 10, 100, 1000 and 10,000 compared with the control (without bacteriophage treatment) against four S. enterica strains: (A) S. Enteritidis S5-483, (B) S. Muenchen S5-504, (C) S. Newport S5-639 and (D) S. Typhimurium S5-536. High expression is indicated in red, and low expression is indicated in blue. The names of the 20 genes and their corresponding clusters are shown in (F).
Applmicrobiol 04 00027 g003
Figure 4. Heatmap plots (AD) and K-means clustering (E) of 20 differentially expression genes (cas1, cyaA, dnaK, ffh, hsdS, invA, ipfA, mod, nlp, pagP, phnA, res, rpoS, sopB, spvC, tnpA_2, trmE, wzzB, ydaL and yfiC) one day after bacteriophage cocktail (SE14, SF5, SF6) treatment (day 1) at MOIs of 1, 10, 100, 1000 and 10,000 compared with the control (without bacteriophage treatment) against four S. enterica strains: (A) S. Enteritidis S5-483, (B) S. Muenchen S5-504, (C) S. Newport S5-639 and (D) S. Typhimurium S5-536. High expression is indicated in red, and low expression is indicated in blue. The names of the 20 genes and their corresponding clusters are shown in (F).
Applmicrobiol 04 00027 g004aApplmicrobiol 04 00027 g004b
Figure 5. Heatmap plots (AD) and K-means clustering (E) of 20 differentially expression genes (cas1, cyaA, dnaK, ffh, hsdS, invA, ipfA, mod, nlp, pagP, phnA, res, rpoS, sopB, spvC, tnpA_2, trmE, wzzB, ydaL and yfiC) three days after bacteriophage cocktail (SE14, SF5, SF6) treatment (day 3) at MOIs of 1, 10, 100, 1000 and 10,000 compared with the control (without bacteriophage treatment) against four S. enterica strains: (A) S. Enteritidis S5-483, (B) S. Muenchen S5-504, (C) S. Newport S5-639 and (D) S. Typhimurium S5-536. High expression is indicated in red, and low expression is indicated in blue. The names of the 20 genes and their corresponding clusters are shown in (F).
Applmicrobiol 04 00027 g005aApplmicrobiol 04 00027 g005b
Table 1. Primers for housekeeping genes used for RT-qPCR.
GenePrimer DirectionSequence (5′ → 3′)
16sForwardCAGAAGAAGCACCGGCTAAC
ReverseGACTCAAGCCTGCCAGTTTC
gapAForwardGGTGGTGACGTAGTGGCTGAA
ReverseAGCGTTGGAAACGATGTCCTG
rsrnCForwardGAAAAGCAGCCGCAGTTTAG
ReverseCAGTTGGCTACCAACATCCA
Table 2. Primers for the twenty target genes used in this study.
GeneCoding ProteinFunctionPrimer DirectionSequence (5′ → 3′)References
cas1CRISPR/Cas system-associated protein Cas1SOS responseForwardGCAAAGCTGGCGTTAGATGA[23]
ReverseGATCCTTCAATACCGCGCAG
cyaAAdenylate cyclaseMetabolism and nutrient utilizationForwardGTCCGCCGCTGCTTTTAC[24,25]
ReverseCGTCGTCCCATCCCCACT
dnaKChaperon proteinProtein synthesis and foldingForwardCGA TTA TGG ATG GAA CGC AGG[26]
ReverseGGC TGA CCA ACC AGA GTT
ffhProtein unit of signal recognition particle (SRP)Protein synthesis and foldingForwardTAA CAA GCG CCT GAC CCC[27]
ReverseAGA CCC GCC ATC AAT ACT
hsdSType I restriction enzyme-specific proteinDNA modification and recombinationForwardGTGTTCCTGTCCCACCTCTT[23]
ReverseTGGGATTTGCTCAAGACGTG
invAattachment/invasion proteinPathogenicity/virulenceForwardACCGTGGTCCAGTTTATCGT[23,28,29,30]
ReverseGCTTTCCCTTTCCAGTACGC
ipfALong polar fimbriaPathogenicity/virulenceForwardCTTCTGCTTTCGCTGCTGA[29,31]
ReverseCACAACTTCCTGGTTCTGG
modType III restriction–modification system methyltransferaseDNA modification and recombinationForwardCCGAAACCGACCGCATTATT[23]
ReverseTTCATTCAGCGCCATTACCG
nlpner-like regulatory proteinCell envelope and membrane modificationForwardATGGATGTATGGAAAGCAAGC[32]
ReverseGCCAGCGTGGATGAACTC
pagPLipid A palmitoyltransferase pagPCell envelope and membrane modificationForwardGCG ACA GCC TGA GCA TTA T[23]
ReverseGGG ACT GAC CAA AAC CAA C
phnAPhosphonoacetate hydrolase (carbon-phosphorus bond cleavage enzyme)Metabolism and nutrient utilizationForwardCACTGCCCGCAATGTAAC[25,33,34]
ReverseCTTTGGTGCCGATTTTCA
resType III restriction–modification system DNA helicaseDNA modification and recombinationForwardATTCGTGACAATAAGCCCGC [23]
ReverseCTACGCTCGAATTGCAGCAT
rpoSRNA polymerase sigma factor rpoSStress resistance, nutrient utilization, and biofilm formationForwardGAATCTGACGAACACGCTCA[35]
ReverseCCACGCAAGATGACGATATG
sopBType III secretion system effector proteinPathogenicity/virulenceForwardGCTCGCCCGGAAATTATTGT[23,36,37]
ReverseGGTCCGCTTTAACTTTGGCT
spvCSalmonella plasmid virulence proteinPathogenicity/virulenceForwardATTTGCCGGTGACAAGTTCC[23,29,38,39]
ReverseGGAGAAACGACGCACTGTAC
tnpA_2TransposaseTranspositionForwardCTTTACGAGCAGTTTGGGG[40]
ReverseCTGTATCTTCGCCGTGTTC
trmEtRNA methyltransferaseProtein synthesis and foldingForwardCGTTGACCCTGCCGACAT[41]
ReverseCGAACCAGTGAGTGACCG
wzzBPolysaccharide antigen chain length regulatorCell envelope and membrane modificationForwardACAGTTATGGCGTGGGAAGA[23]
ReverseGTTGAGCGCGTTGGTATAGG
ydaLSmall MutS-related proteinProtein synthesis and foldingForwardTCC TGA CGA CGG GCT TTC[42]
ReverseTTC CCA CTG CGT AAC
yfiCRecombinant proteinMetabolism and nutrient utilizationForwardCTGGCTCCGTTCTTCGTC[25,43]
ReverseCACATTGTCATCCGTCCG
Disclaimer/Publisher’s Note: The statements, opinions and data contained in all publications are solely those of the individual author(s) and contributor(s) and not of MDPI and/or the editor(s). MDPI and/or the editor(s) disclaim responsibility for any injury to people or property resulting from any ideas, methods, instructions or products referred to in the content.

