Article

Spatial Distribution of Citrus Pseudocercospora Leaf and Fruit Spot Disease and Shade Effect on Disease Intensity

1
IRAD (Institute of Agricultural Research for Development), Regional Agricultural Research Center of Nkolbisson, Yaoundé P.O. Box 2067, Cameroon
2
CIRAD (Centre de coopération Internationale en Recherche Agronomique pour le Développement), DGDRS, 34398 Montpellier, France
*
Author to whom correspondence should be addressed.
Crops 2023, 3(1), 11-23; https://doi.org/10.3390/crops3010002
Submission received: 12 October 2022 / Revised: 22 November 2022 / Accepted: 5 December 2022 / Published: 6 January 2023
(This article belongs to the Special Issue Abiotic Stress Tolerance in Perennial Crops)

Abstract

:
Adapting agricultural systems to face persistent environmental hazards is at the center of global concerns. In line with this, understanding and highlighting the structural characteristics of agroforestry systems could strengthen their resilience in terms of disease management. This study was conducted to evaluate the effect of shade on the intensity of citrus leaf and fruit spot disease caused by Pseudocercospora (PLFSD). Investigations to assess the effects of shade components on the incidence of PLFSD were carried out on 15-year-old tangerine trees in a cocoa-based agroforestry plot (Bokito) during four fruits seasons. Tangerines under the shade of large forest trees were compared to others located under full sunlight. A complementary experiment was conducted on young grapefruit plants in an orchard with mango and avocado groves in Foumbot. Three shading conditions, i.e., under avocado trees, under mango trees, and without shade, were explored. Data on shade and PLFSD incidence were collected and analyzed. Our findings show that PLFSD incidence was null on tangerine leaves from trees under shade compared to those under full sunlight. The same trends were observed in fruits under shade and under full sunlight. Disease incidence on grapefruit leaves was lower on trees under shade compared to those under full sunlight. In short, shade trees appear to constitute potential physical barriers to disease progression. This study also highlights disease spatial distribution as beyond 12 m of distance between neighboring trees, no spatial dependence of disease spread was observed. Management actions based on the distance between citrus trees and regulating shade are envisaged.

1. Introduction

Pseudocercospora leaf and fruit spot disease (PLFSD) of citrus is the most devastating fungal disease known to present in citrus plants in tropical African countries [1,2,3]. PLFSD is caused by Pseudocercospora angolensis (Crous & U. Braun). Previously named Phaeoramularia angolensis, this pathogen is a dematiaceous hyphomycete, an asexual fungus that was first reported in Angola and Mozambique as Cercospora angolensis [4]. PLFSD is widespread in 23 countries in the south of the Sahara, as well as in Yemen [3,5]. This disease is gradually expanding to areas where it was not known to occur a few years ago [3]. It is considered to be a serious threat to citrus fruit production in large citrus production basins. The disease results in the early fall of affected leaves and fruits and the deformation of fruits. In Cameroon, PLFSD has been reported in the western highland zone since 1969 [6]. Its damage on susceptible varieties can result in 100% crop loss in areas of high incidence [7].
Many factors, including high rainfall, low temperatures (high altitude), and high relative humidity (above 75%) are associated with PLFSD development [5,7]. It is known that the conidia of P. angolensis are disseminated for a short distance by wind or rain [2,8]. The pathogen requires moisture for infection and conidial production. The conidia can be disseminated by wind or through the transport of infected fruits and propagative plant material to non-contaminated areas. Local dispersal is mainly caused by rain splash as well as by ants and other insects moving on trees [9,10]. Leaf lesions are known to produce more conidia than similar fruit lesions and constitute the main source of inoculum [2].
No teleomorphs have been reported to date. The fungus probably survives in dormant lesions of infected plants until the beginning of the next rainy season. The sporulation is favored by prolonged wet weather. Lesions produced in the previous season can begin to sporulate within two weeks from the beginning of the next rainy season at most temperatures in the tropics. Those spores then infect new tissues [11]. The host range of P. angolensis is composed of citrus species, and no alternative host has yet been reported. In addition, no citrus variety has been found to be resistant to PLFSD. Certain species, such as grapefruits (Citrus paradisi), oranges (Citrus sinensis (L).), and some tangerines (Citrus reticulata—Blanco), are considered to be the most susceptible [12].
The most common citrus cropping systems in Cameroon are complex and diversified agroforestry systems based on cocoa or coffee. [6,13]. These are multi-species agroforestry systems with a great diversity of horizontal and vertical spatial structures. [14]. The plant population distribution in agroforests is seen as a means to regulate pests and diseases [15,16]. Shade trees in agroforests create a microclimate under the canopy that can influence pest or disease development. Shade trees also play an important role in intercropping for several reasons. They can improve bad weather conditions by modulating temperature changes [15,16,17,18,19]. Shade trees can also increase soil nutrient levels by producing large amounts of litter that can significantly increase crop productivity and vigor, improving resistance to pests and disease [17,20]. Likewise, the barrier effect of shade trees has been highlighted [6,14]. The effect of shade on pest and disease intensity, however, depends on the pathogen species [21]. In Uganda, a study on coffee plantations showed that berry drillers were more common in plantations exposed to the sunlight; meanwhile, stem borers were more abundant in shaded plots [22]. However, in the case of citrus foot rot disease in cocoa-based agroforestry systems in Cameroon, it was shown that citrus trees planted under dense shade were less affected by the disease than those planted in full sun [14].
The effects of shade trees on citrus growth, as well as on the development of citrus pests and diseases, such as PLFSD, are poorly known. However, it has been acknowledged that a high relative humidity (>75%) and mild temperature conditions (<25 °C) favor disease development [7,23,24]. As such, it can be assumed that the level of shading in a complex agroforest context determines the incidence of PLFSD on citrus trees. Sunlight penetration is reduced in spots with high levels of shading, thus creating a microclimate suitable for disease development, characterized by high humidity levels and low temperatures. From another point of view, given the role played by shade trees in improving nutritional conditions, the growth of associated trees in these conditions can be improved, as well as their vigor and response to disease. In addition, shade trees can act as a barrier against wind and rain splash, which are the main factors in the spread of conidia; thus, they can slow epidemic progression [15,25]. This study was conducted to determine the effect of shade trees on the development of PLFSD.

2. Material and Methods

2.1. Experimental Design

2.1.1. Biophysical Characterization of Sites

The experiment was conducted in two sites:
The first one was located in the forest–savanna transition area of Bokito (latitude 4°38′ N, longitude 11°09′ E, altitude 480 m), situated in the western part of the humid forest agroecological zone of Cameroon. The annual mean temperature is 25 °C and relative humidity averaged 75%. The rainfall pattern is bimodal, i.e., there are two rainy seasons, spanning March-June and September-November (average annual rainfall: 1300 mm to 2500 mm). The soils are sandy loam, sandy clay loam, or clay in texture. This site was chosen because it is one of the main citrus production basins of the country, with medium PLFSD incidence.
The second site was located in Foumbot in the western highland zone of Cameroon, (latitude 5°30′ N, longitude 10°37′ E, altitude 1010 m). This site was selected because of its situation in an area of high PLFSD incidence [6]. The annual mean temperature is 19 °C and the average relative humidity is >75%, with annual rainfall ranging from 1500 to 2500 mm which occurs in a unimodal pattern (one rainy season from March to November). Soils are predominantly volcanic, loam-like, clay-like in texture.
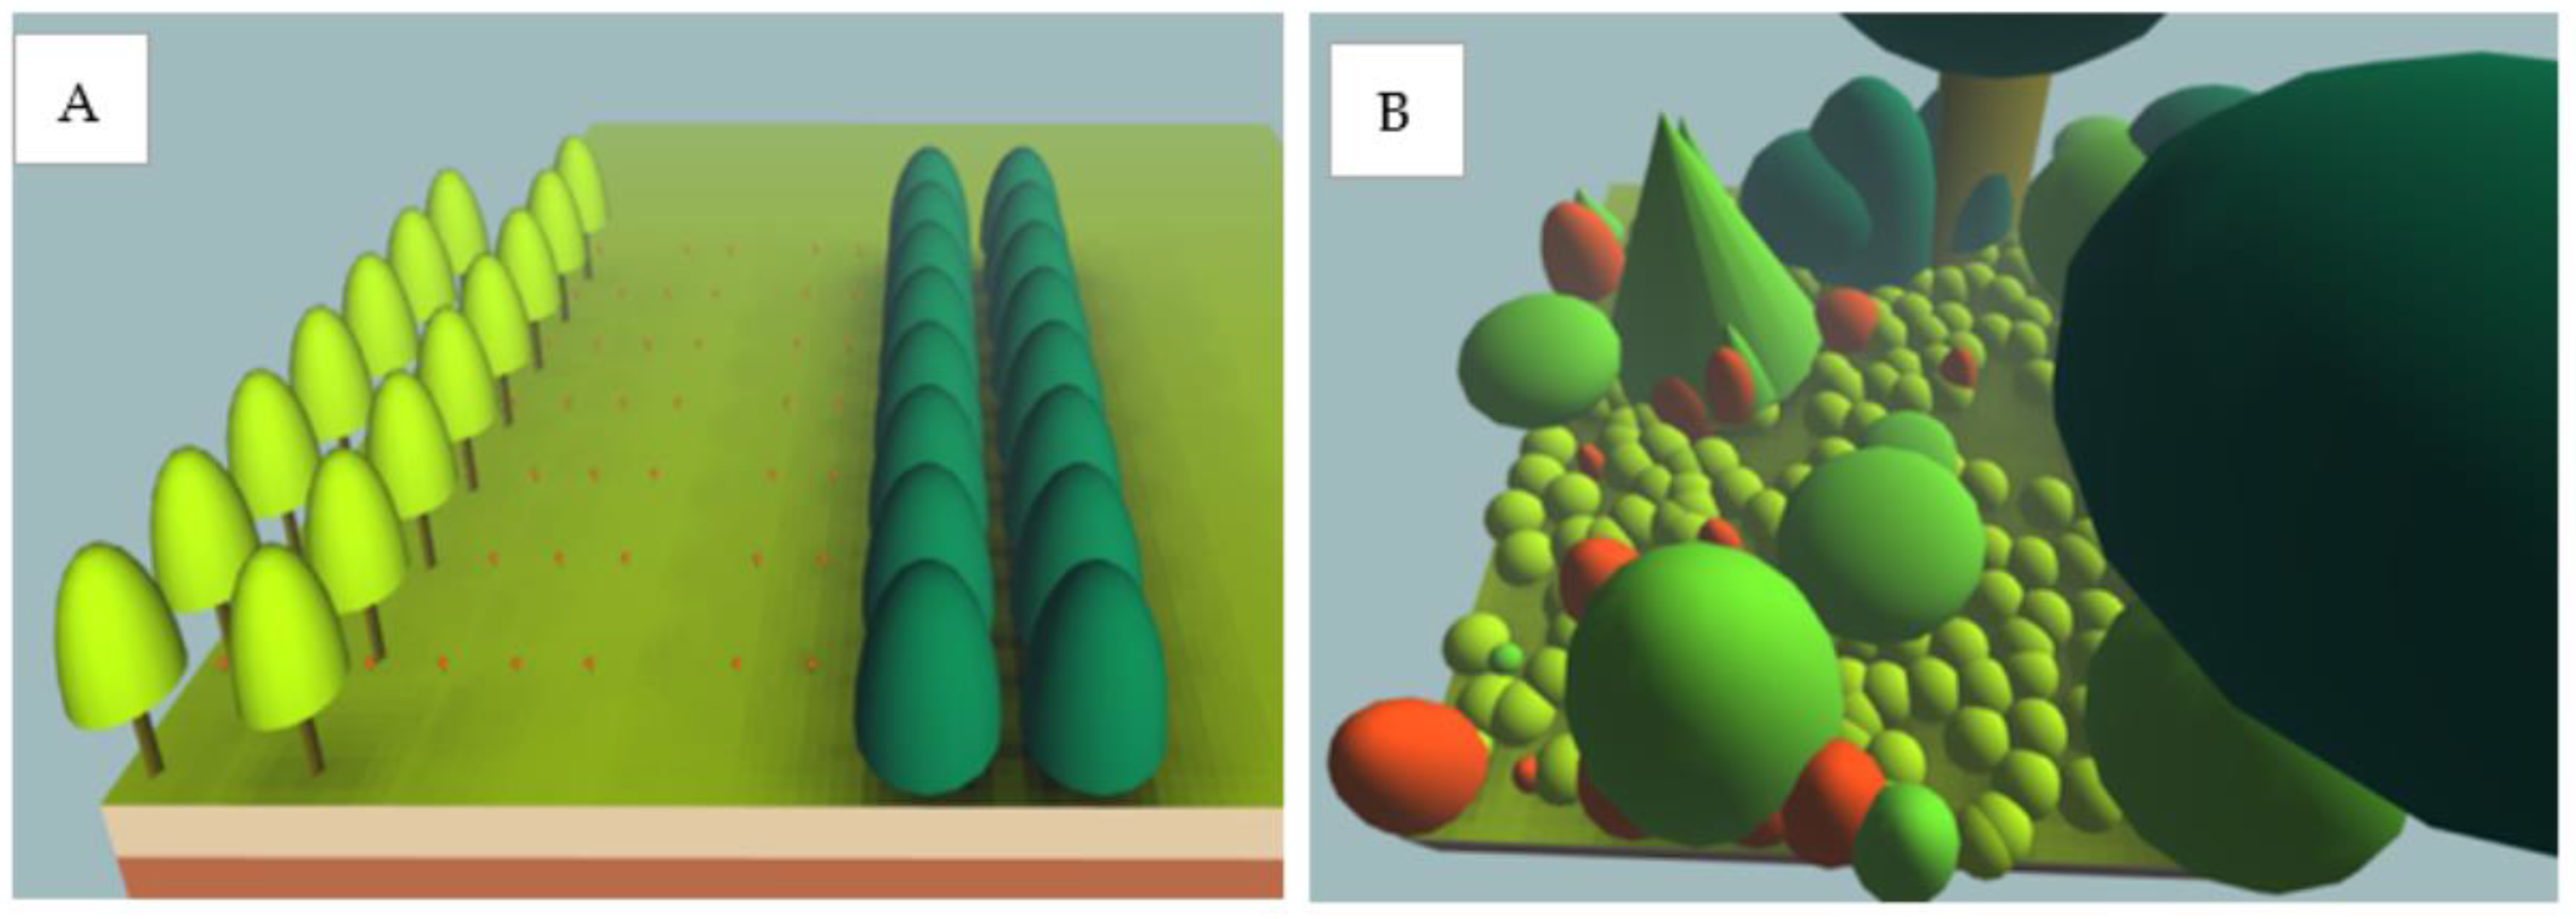
2.1.2. Bokito Plot

The experiment on this site was carried out in a complex cocoa-based agroforestry plot with citrus trees of around 15 years old. Other associated indigenous and exotic species include the following: Spondias dulcis (Sol. Ex Parkinson); Triplochiton scleroxylon (K. Schum); Milicia excelsa ((Welw.) C.C.Berg); Ceiba pentrada ((L.) Gaertn.); Ricinodendron heudelotii ((Baill.) Heckel); Cola acuminata ((P. Beauv.) Schott & Endl.); Chlorophora excelsa ((Welw.) C.C.Berg); Adansonia digitata (L.); Voacanga africana (Stapf ex Scott-Elliot); Eleaïs guineensis (Jacq.); Dacryodes edulis ((G.Don) H.J.Lam.); Manguifera indica (L.); Persea Americana (Mill.); and citrus trees (Citrus spp.), among others. Regarding citrus, three species were present in this plot. Tangerine trees (Citrus reticulata Blanco) dominated, while orange trees (Citrus sinensis (L.)) and some young grapefruit trees (Citrus paradisi (Macf.)) were also found. The species chosen for this trial was tangerine of the local variety (Obala tangerine). This choice was linked to their abundance in the plot. Six tangerine trees under the shade of large forest trees were chosen and compared to six others located in full sunlight.

2.1.3. Foumbot Plot

An experimental orchard of the National Institute of Agricultural Research of Cameroon was chosen for this trial. The presence of old citrus trees infected by PLFSD in this orchard favored inoculum dispersion in the site. The experimental orchard was composed of several subplots of mango, avocado, and citrus trees. On one side of the experimental orchard, including a subplot of mango and a subplot of avocado trees, 72 young grapefruit plants were planted. Grapefruit seedlings were produced by grafting grapefruits (Pomelo Marsh Jabarito) on C. volkameriana rootstocks. The planting occurred in July 2020 with a spacing of 5 m × 8 m. X and Y coordinates were assigned to each grapefruit plant.

2.2. Disease Incidence and Shade Data Collection

2.2.1. Bokito Plot

Data collection in this plot was conducted four times during four successive fruit seasons. The first observation took place in September 2020, the second in April 2021, the third in September 2021, and the last in April 2022. The selected tangerines trees were marked with a plate. Disease incidence was evaluated by noting the presence of PLFSD spots on the leaves and fruits. On each tree, 12 young flushes of approximately 2 months (more susceptible to the disease) were arbitrarily selected. To take into consideration the variability of each tree, the tree canopy was divided into four sectors (North South, East, West). The choice of flushes was made inside a wooden frame with a size of 1 m2. This wooden frame was positioned at a human height, and each of the sectors of the tree were chosen according to the described directions [5]. On each sector of the canopy, three flushes were chosen. On each of the 12 flushes selected, the last 14 leaves were observed, i.e., 168 leaves per tree. In the same vein, on each tree, 40 fruits distributed equitably on different branches of the tree were chosen. The elementary plot was represented by a tree. For each tree selected, we observed 168 leaves and 40 fruits. On the leaves, a scale ranging from 1 to 3 was determined to quantify the severity of PLFSD: 1 = no lesion; 2 = one to three lesions; and 3 = more than four lesions. As for the fruits, once a PLFSD lesion was observed, said fruit was considered lost as it could no longer be accepted in the fresh fruit market [26].

2.2.2. Foumbot Plot

Disease data were collected twice, once during the rainy seasons and one year after the planting date. The first observation date was held in October 2021 and the second in June 2022. This enabled data collection during periods of high disease incidence. The youngest flushes were observed. The elementary plot was also represented by a stand. A maximum of 10 flushes and 16 leaves per flush were observed on each grapefruit stand. The number of spots per leaf was noted during each observation period.
The two perpendicular diameters of the shade trees’ canopy were measured. The mean diameter of the foliage was calculated as the average of the two measurements made. A shading index on a scale of 1 to 10 (depending on the degree of light filtering through the canopy) was assigned to each shade tree. In this scale, 10 represented a completely opaque (100%) canopy that did not let light through. A canopy with 50% of the surface infiltrated by light was denoted by 5 and a canopy very permeable to light, approaching full sunlight, was represented by 1 [14].

2.3. Statistical Analysis

The variables explained were PLFSD incidence, which is the mean number of disease lesions per leaf (or fruit), and disease incidence, which is the percentage of leaves (or fruits) affected by the disease on a tree, expressed in the formula below [27]:
I n c i d e n c e = Td To   ×   100  
where Tl = total number of lesions; To = total number of leaves observed; and Td = total number of leaves (or fruits) affected by the disease

2.3.1. Analysis of Variance

Data analysis was conducted using SAS software version 9.3. The analysis of variance was performed using the general linear model (GLM) procedure. To compare PLFSD incidence average according to the type of shade and for each observation period, the student–Newman–Keuls test at a 5% probability level was used. In Bokito, the tangerine trees under full sunlight were compared to those under forest trees shade; meanwhile, in Foumbot, grapefruit stands situated under mango trees were compared to those situated under avocado trees and in full sunlight.
A second analysis of variance was performed on Foumbot data with R version 4.1.1 software using the Gstat package to highlight the part of the variance that was due to the effects tested (shading, date of observation, interaction).

2.3.2. Mapping of PLFSD Incidence and Shade

Mapping the plot illustrated the impact of PFLSD on grapefruit stands. The mapping was conducted on bubble maps made with R version 4.1.1 software through the Lattice and Lattice Extra packages (Figure 1). Each bubble size was proportional to the incidence of disease. On this graph, the position and size of the shade trees were also indicated.

2.3.3. Residue Analysis

The analysis of the Foumbot data showed that disease incidence variance was not exclusively explained by shading, observation date, and interaction. An explanation for the disease variance portion unexplained by these three factors was made through a residue analysis performed using R version 4.1.1 software. In the residue analysis, it was hypothesized that the variance portion unexplained by the model was due to the spatial structure of the disease. To confirm this hypothesis, spatial analysis of the residuals was subsequently performed.

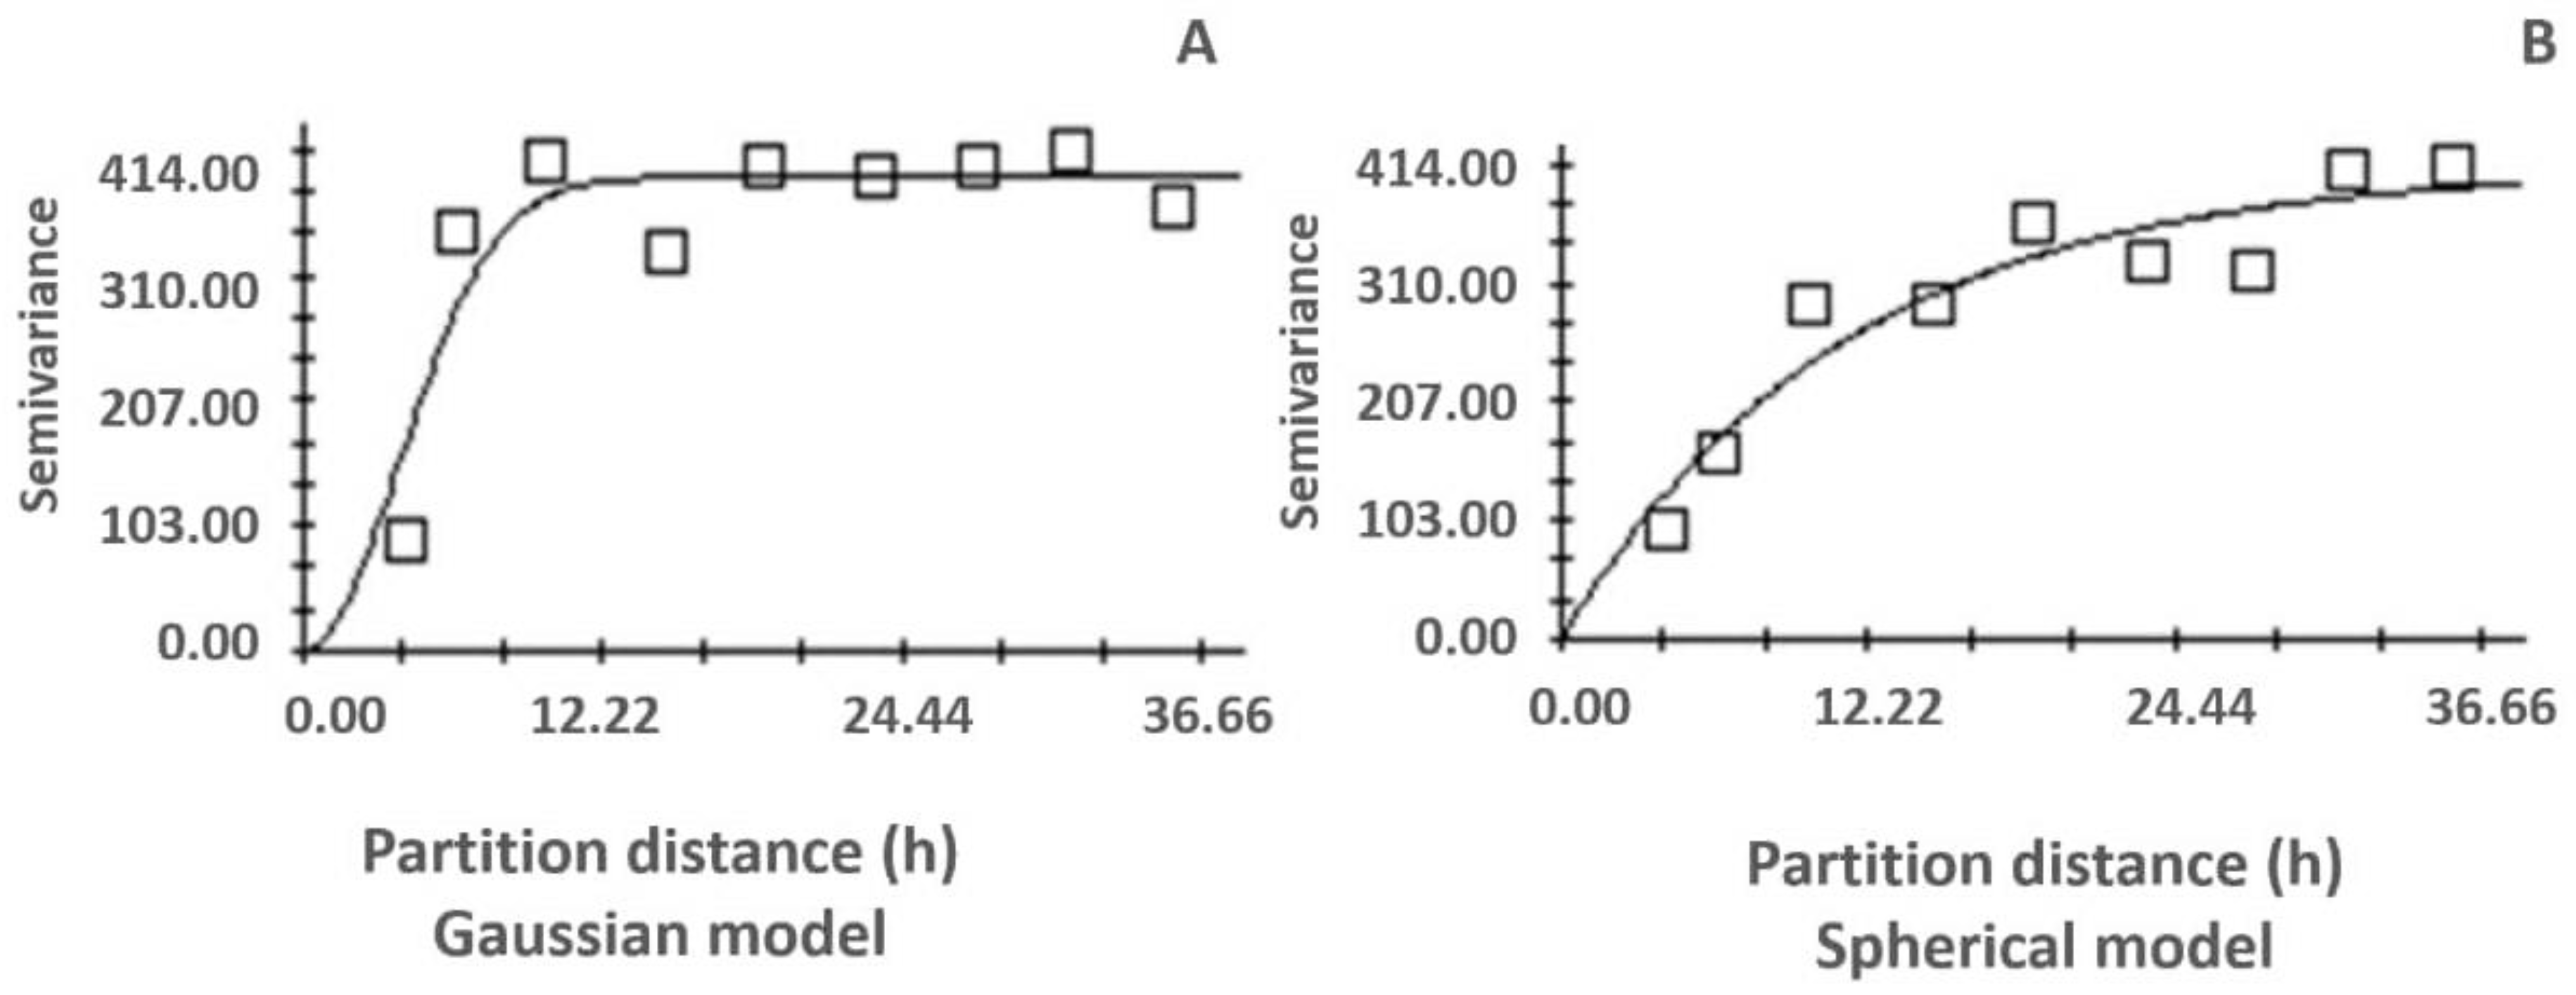
2.3.4. Spatial Analysis

Spatial analysis was performed on the residuals after removing the effects of shading, date of observation, and interactions (if any). This yielded detection of whether the distribution of the disease was random or patterned. It was performed using semi-variogram analysis of GS+ software (version 9). The principle of this analysis was to measure the spatial dependence that existed between the points (grapefruit trees) measured. The semi-variograms represents the mean quadratic differences between the xi and yj points as a function of the distances separating these points [28]. The semi-variance is given by the equation:
γ ^ h = 1 2 N h i = 1 N h ( z i z i + h ) 2
In this equation, (h) the semi-variogram is calculated for N(h) points xi and yj separated by a distance h = |xiyi|; zi = incidence of the disease at point i; and zi+h = incidence of the disease at point i + h. h is expressed in m [29]. The software provides the descriptive parameters of the semi-variogram [28]. The software also provides the following descriptive parameters for the semi-variogram:
-
C0: The nugget effect is the y value at which the curve of the model cuts the y axis;
-
a: The semi-variogram may reach a plateau. Reaching a plateau indicates that, from a certain distance, there is no longer spatial dependence between the data. This distance is called the range (a);
-
C0+C: The bearing is the variance at which the plateau appears. The bearing is reached by an asymptote (Figure 2).
A theoretical model was fitted to the experimental semi-variogram. The sum of the residue squares (RSS), the coefficient of determination R2, and the ratio C/(C0+C) yield a decision regarding the theoretical model that best fits the observed semi-variogram. When the ratio C/(C0+C) = 1, the semi-variogram has no nugget effect. If C/(C0+C) = 0, the semi-variogram is linear and it is a pure nugget effect. This is the case of a perfectly randomized distribution (no spatial dependence).
After semi-variograms were made, Kriging maps were produced using GS+ software with the data residue of disease incidence. This highlighted disease spatial distribution.

3. Results

3.1. Variation of Disease Incidence with Shade Intensity

3.1.1. Bokito Site

Disease incidence on the leaves of tangerine trees placed under full sunlight was always greater than the incidence on those under associated tree species (Table 1). However, means were not significantly different for disease incidence. The results on disease incidence were significantly different for two observation dates. It can be observed that the mean incidence of disease for trees under forest shade was always = 0, which was not the case for trees under full sunlight. Throughout the plot, there was a fairly low disease incidence for all trees.
On fruits, the first observation date was not effective because some trees had no fruits and others had very young fruits. During the other three observation dates, disease incidence on trees under full sunlight was always higher than on trees under shade (Table 2). However, the means were significantly different for only two dates. Incidence means were not significantly different. Disease spots were present on some fruits from trees located under shade, contrary to what was noticed on the leaves.

3.1.2. Foumbot Site

During the two observation dates, the highest disease incidence (45.26%) was recorded in grapefruits situated under the full sunlight. Differences observed were always significative during the two observation dates (Table 3). The disease incidence in grapefruits under mango tree shading was always lower than that of those under avocado tree shading. These differences were only significant on the first observation date. Standard deviations were quite high and often close to the averages. The highest standard deviations were found on trees in direct sunlight, highlighting great variability.

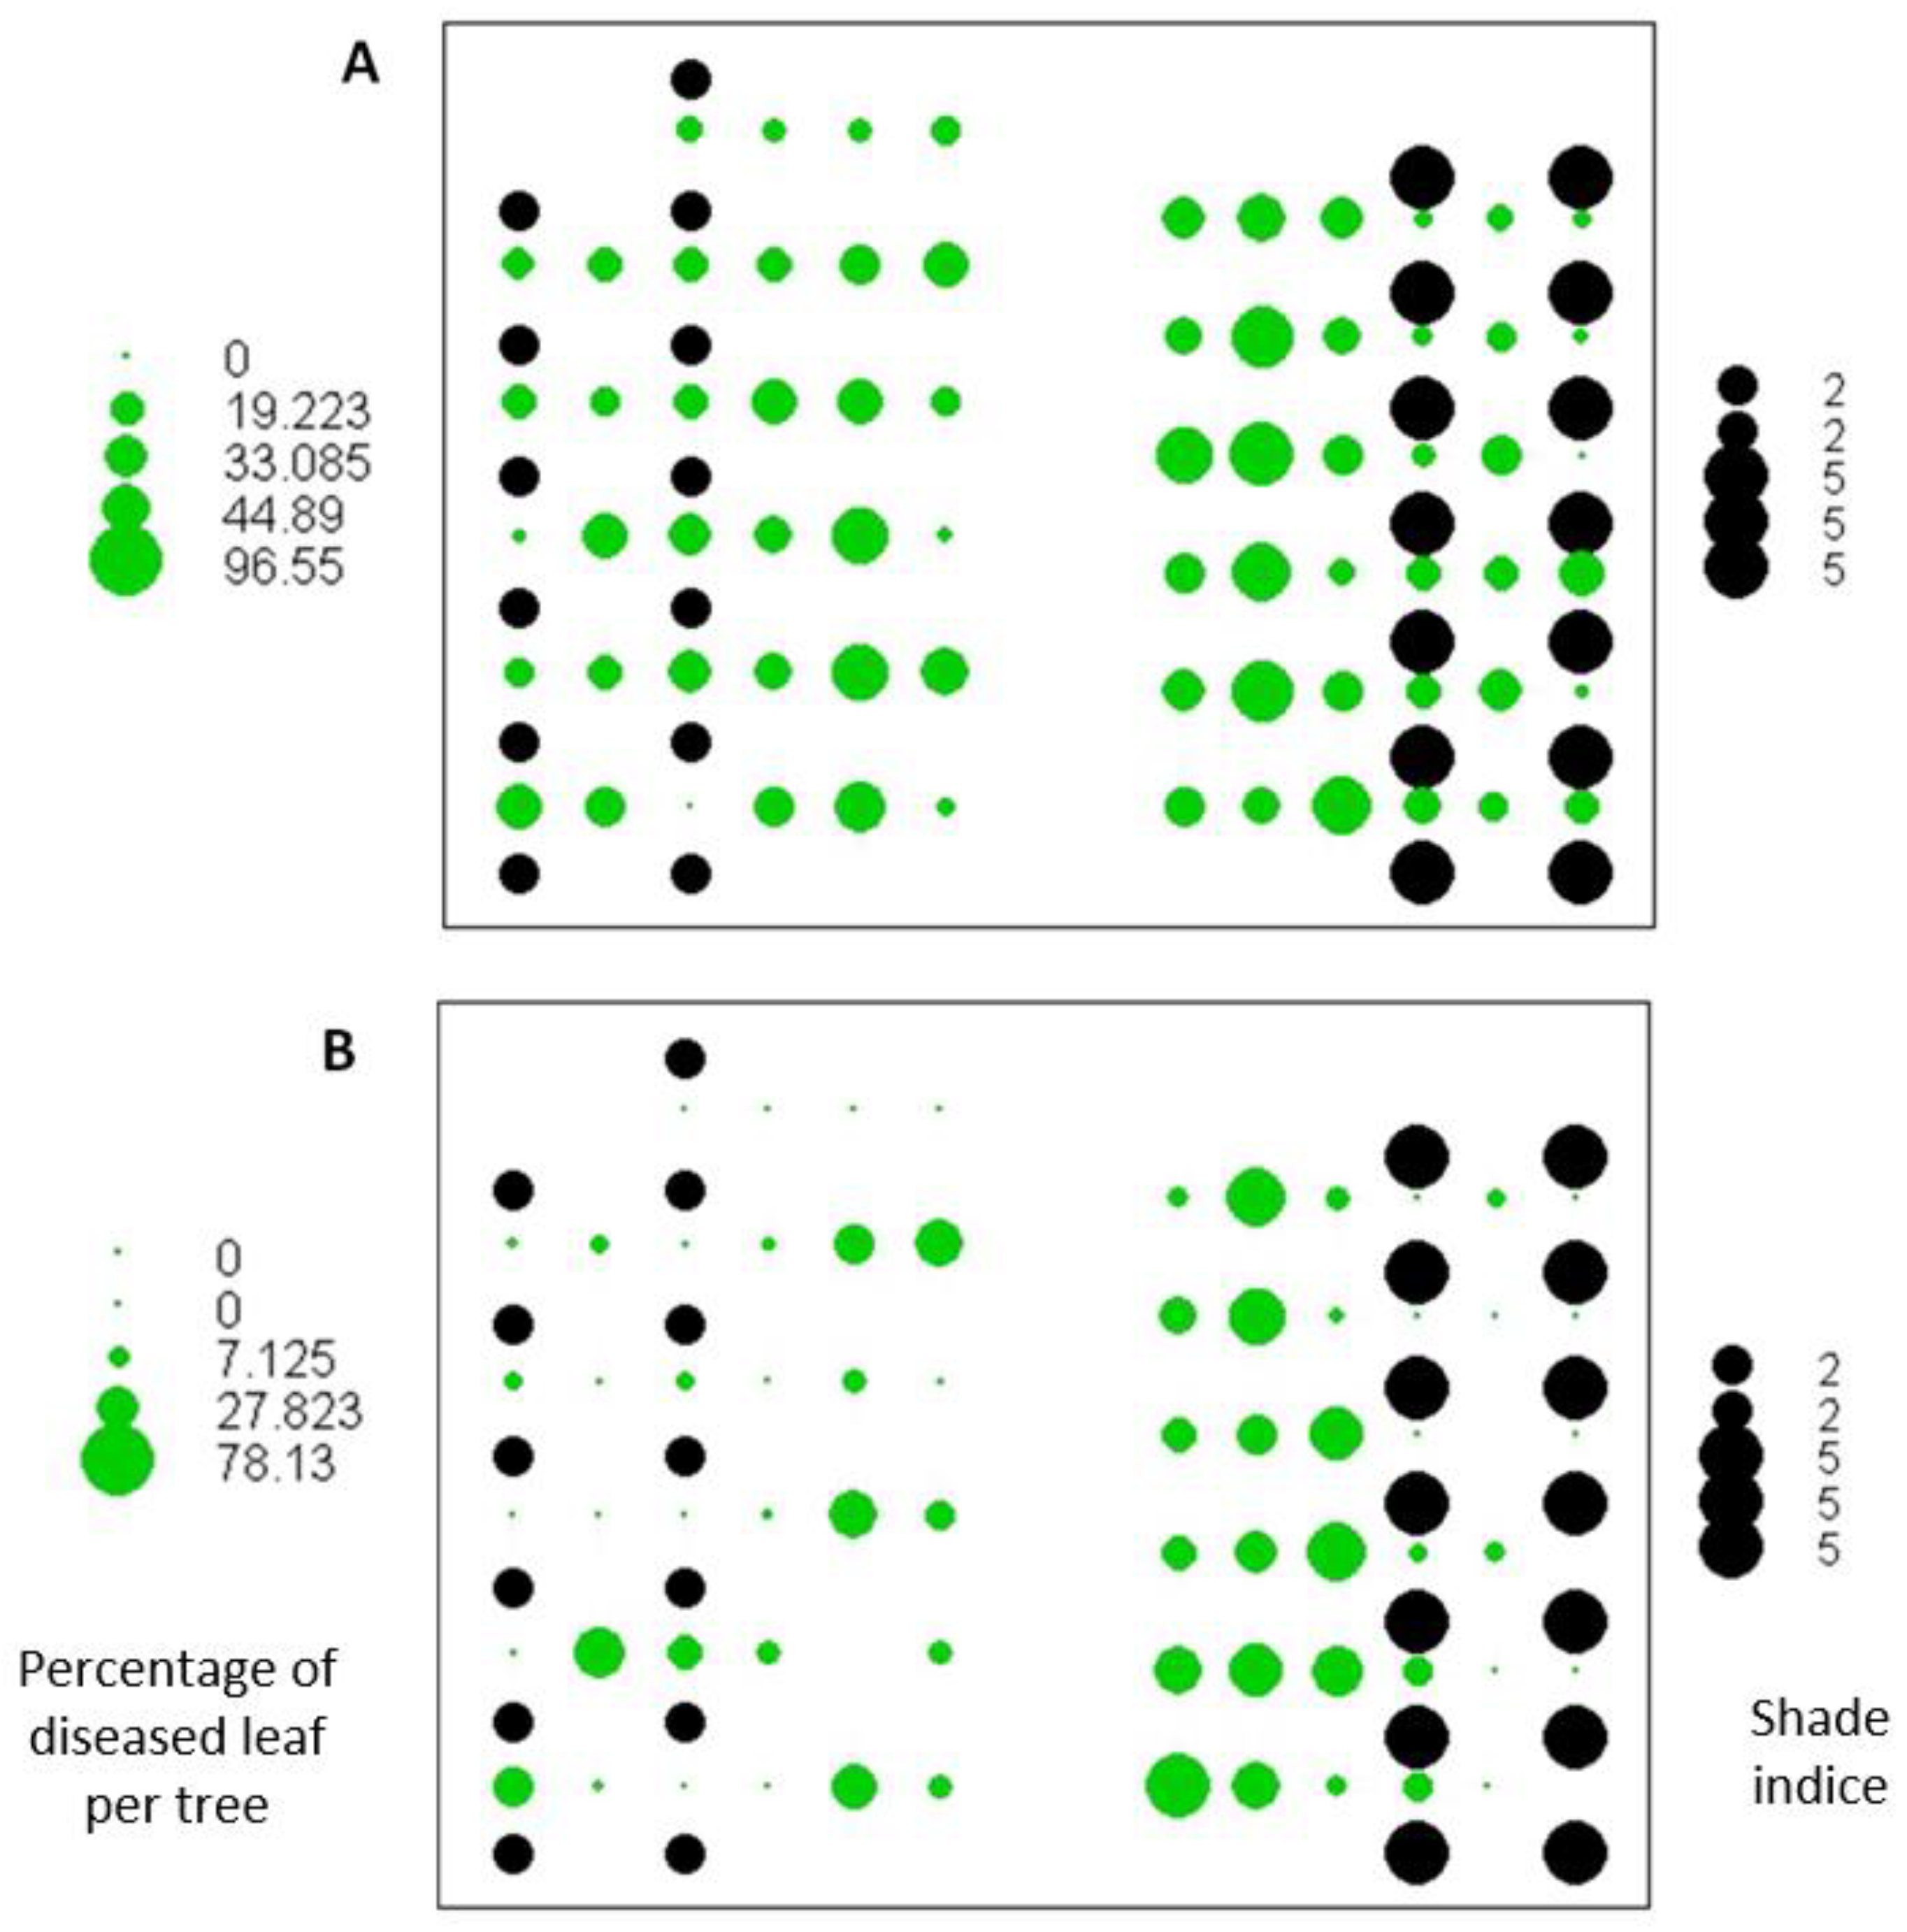
3.2. Representation of Disease Incidence According to Shade Intensity

The incidence bubbles were larger for plants in full sunlight (Figure 3). However, there was great variability for this type of plant. Some plants had a tiny bubble (less lesions), while others had the largest bubbles (maximum lesions). Under shade trees, disease incidence varied less. Most of the bubbles representing these plants were very small and had almost the same size. It can also be observed that disease variability is correlated with shade index.

3.3. Shade Effect and Observation Date on PLFSD Intensity

The Shade effect and Observation date had a significant influence on disease incidence. The interaction between the two parameters had no significant effect on the disease (Table 4).

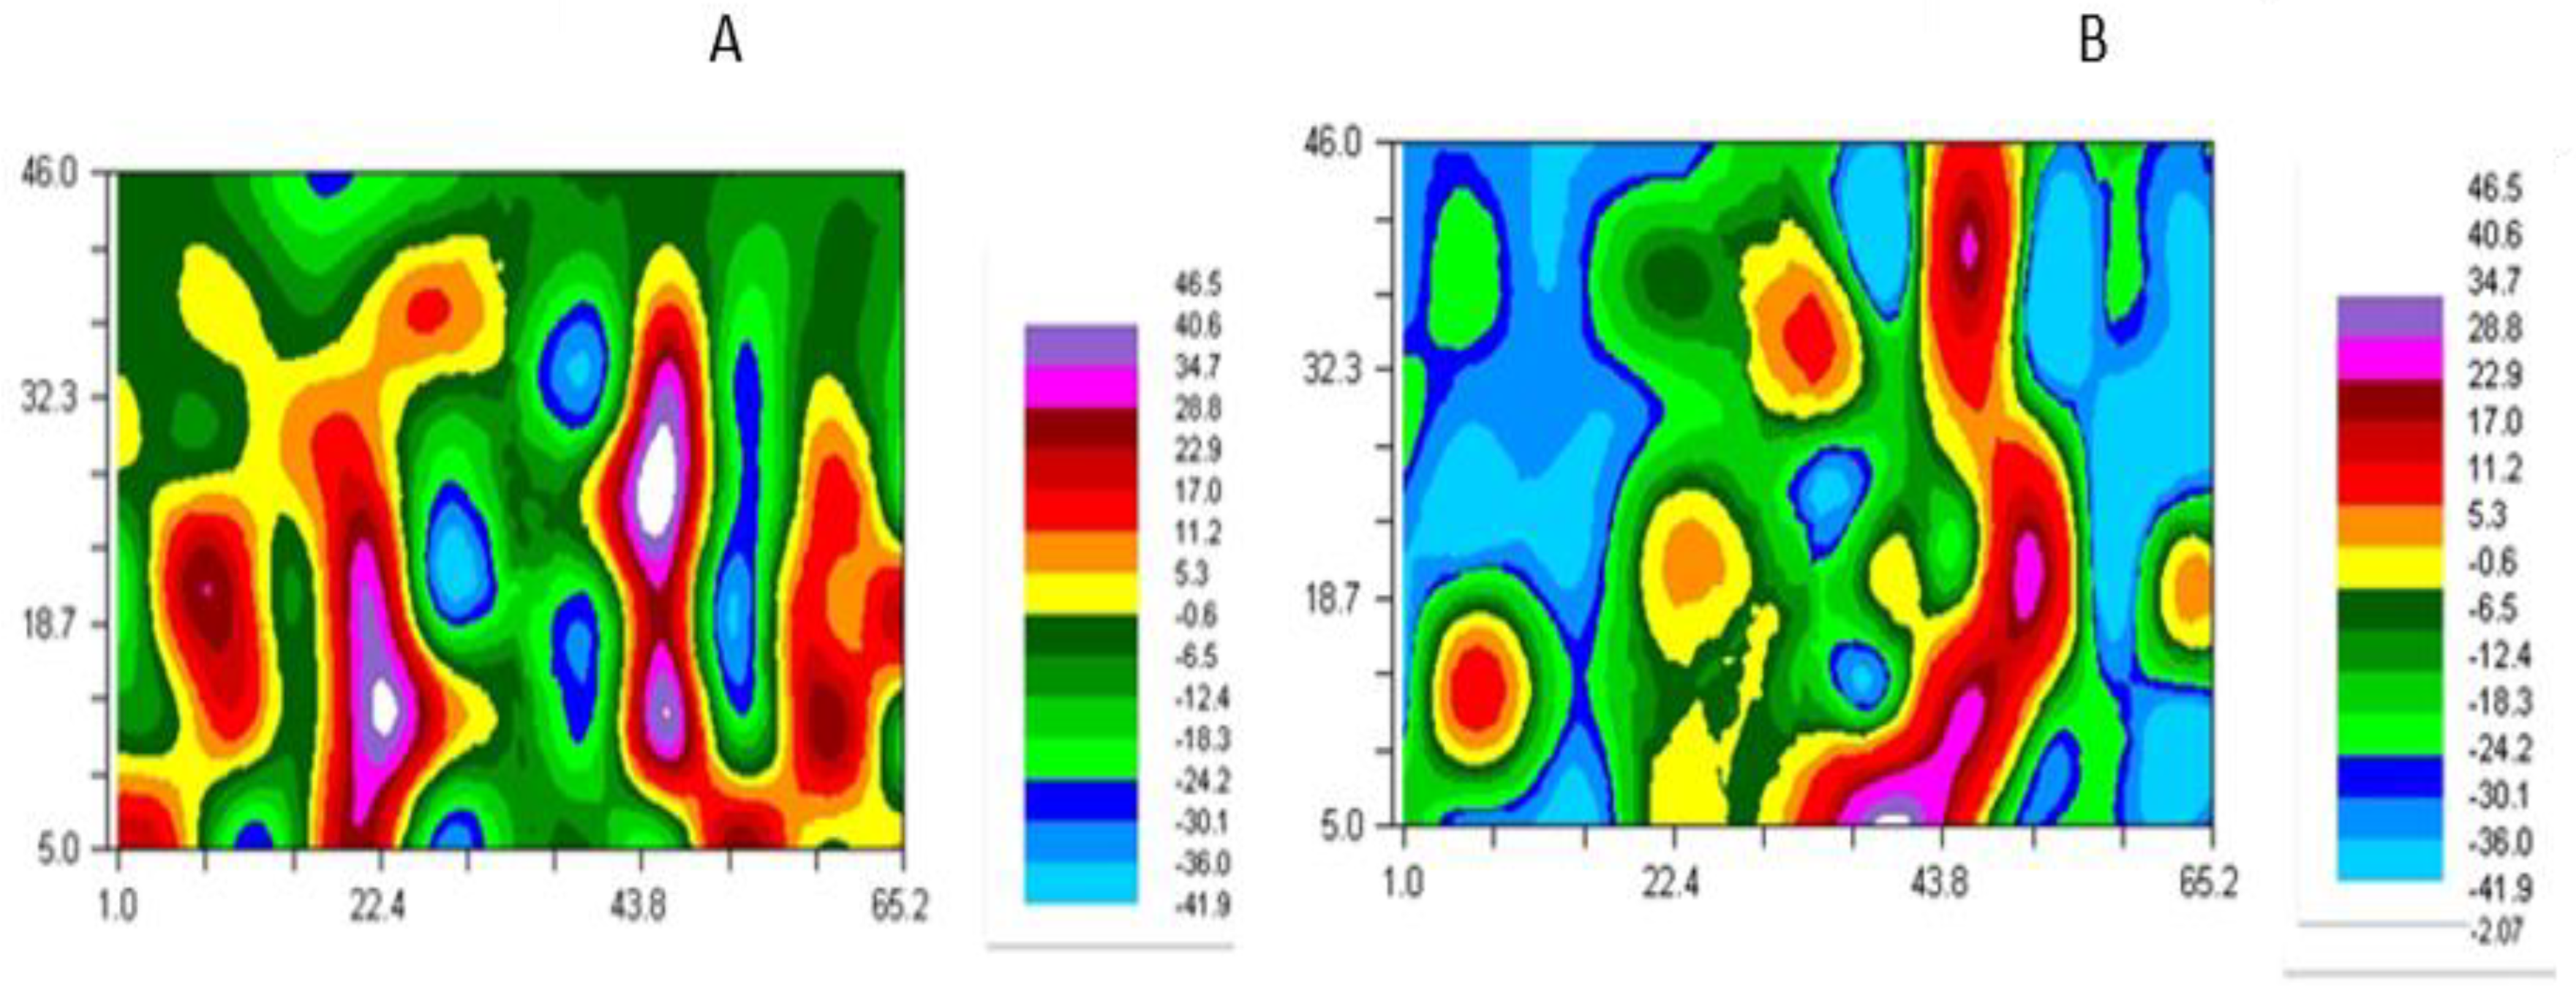
3.4. Spatial Analysis of Residues

Semi-variograms followed a Gaussian, spherical, or exponential model (Figure 4). The theoretical models corresponded to the semi-variograms observed. For all the variables, we have R2 < 1. No model had a nugget effect because the ratio C/(C0+C) is always substantially equal to 1 for all models. The maximum range was 11.79 m and the minimum was 7.49 m. In general, the range at date 1 was greater than at date 2 (Table 5).
Observations of the Kriging maps (Figure 3) revealed a large variability in the spatial distribution of residues. For all variables, disease intensity aggregates were formed in the field.

4. Discussion

4.1. Shade Trees Effect

The shading effect evaluated in this study appeared to have an impact on the development of the disease. Disease incidence was higher in the fruits and leaves of tangerine trees situated under full sunlight than in those under shade trees. On grapefruit plants, the same trend was observed. The effect of shading on PLFSD in complex systems, as in the case in the Bokito site, is poorly known as most citrus plants in countries where the disease is present are produced in orchards under a mono-culture situation [3,30]. However, in Cameroon, the most common practice is the production of citrus in agroforests and in the presence of many shade trees [5,6,7].
The effect of shade on several pathosystems has been studied, and this effect is case-specific for each pathogen [22,31,32]. In this specific case, the shade effect reduced PLFSD incidence. The effect of shading was significant on disease incidence during the two observation dates of grapefruit. Disease incidence was nearly 20% higher in plants situated under full sunlight. Barrios [17] showed that coffee berry infestation by Hypothenemus hampei (Ferrari) averaged 45% higher on sunlight-exposed trees compared to shaded coffee trees.
On tangerines, the shade effect on disease incidence was significant during two observation dates out of four on leaves and fruits. In this site, the incidence of disease was low on all the trees. The low level of significance of the observed differences in terms of incidence can be explained by the fact that citrus plants in agroforestry systems, even when not under shade trees, are surrounded by associated trees that can act as a barrier against conidia dispersal, preventing the spread of disease. These trees can sometimes reduce the progression of the disease [20,33]. Disease incidence is also influenced by citrus trees’ spatial structure in agroforest plots. Ndo [15] highlighted that the aggregated spatial structure of citrus trees was much more correlated with a higher disease incidence than regular and random ones. Spatial structure analysis was not conducted in the case of this study because of the little number of tangerines observed. Nevertheless, citrus trees’ spatial structure surely influenced disease level. Similarly, Akoutou [34] showed that citrus trees located under dense shade and regularly dispersed in cocoa-based agroforest plots are less affected by many diseases, including PLFSD.
The higher the shade index (under mango trees), the lower the disease incidence However, the differences observed were not significant. This result suggests that light shading can have almost the same effect as more intense shading. The plant must receive a sufficient amount of sun radiation for good growth; therefore, it is necessary to determine an optimum trade-off between plant growth and a reduction in disease incidence.
This result also reveals that the intensity of light can play a role in the development of disease. Indeed, the barrier effect of shade trees is substantially similar for avocado trees and mango trees because the scales are appreciable. The difference is much more significant at the level of the canopy and the shade index. It therefore seems important for future studies to test the role of light intensity. The result also highlights the role of agroforests in disease incidence reduction [32,35]. These results are also consistent with those obtained by Akoutou [15], which showed that the decline of citrus trees (the result of several diseases and pests) is less pronounced when the trees are located under dense shade compared to those under moderate and no-shade conditions.

4.2. Spatial Distribution of PLFSD

The presence of associated trees, and thereby the level of shading, as well as the observation dates, significantly influenced the incidence of disease in grapefruit. The interaction between the two parameters had no significant effect. However, disease incidence is not entirely explained by the shading and observation date. The residual part of variability was explained by the spatial distribution of the disease.
Most semi-variograms have a range of less than 12 m, indicating that citrus trees more than 12 m apart have no influence on each other [36,37]. Beyond 12 m of distance between two neighbor citrus trees, there is no more spatial dependence on disease intensity. This result is of great importance to citrus growers in these regions who usually space plants 8 m apart. Indeed, a spacing of 12 m between plants can reduce the spread of the disease.
Most of the semi-variograms obtained have no nugget effect, indicating that neighboring plants often have about the same level of disease [28]. This is also observed on the Kriging maps where there are aggregates of residue levels. The conidia of P. angolensis are scattered at close range by wind and rain [5,24]. This mode of dissemination may explain the aggregate spatial structure of the disease. The disease spreads from one tree to its nearest neighbors, depending on wind velocity or rain intensity. However, the development of infection depends on the presence and susceptibility of the host. In the case where neighboring trees are sensitive hosts, the infection is favored and the epidemiological cycle continues [37,38]. On the other hand, if the neighbors are not very sensitive, or if they are not host plants (case of an agroforestry plot), the evolution of the epidemic can be slowed down or even stopped. This knowledge of the spatial patterns of the disease is useful for making management decisions, especially in the creation of new plantations.
The experimentations in this study were conducted in a real environment, including in a farmer’s plot and in an existing orchard without good replications. Data collection was conducted several times to minimize the design effect. Future studies are necessary to specify and quantify the impact of the shade on PLFSD with adapted experimental designs.

5. Conclusions

Whether in the experimental set-up in the Foumbot orchard or in the observations made directly in the cocoa-based agroforest, the results show that the PLFSD index varies with the intensity of shade. Indeed, for most plots, especially those with a high shade intensity, the PLFSD index is low. Furthermore, it was highlighted that the higher the shade intensity, the lower the PLFSD index. Therefore, increasing the shading rate implies a decrease in PLFSD intensity. This study therefore allowed us to highlight the role of shade trees in constituting physical barriers for the evolution of the disease and creating microclimates that are harmful to the fungus.

Author Contributions

E.G.D.N.: Conceptualization, Methodology, Investigation, Writing; E.A.M.: Investigation; F.B.M.: Methodology; L.B.N.: proof-reading; C.C.: draft preparation. All authors have read and agreed to the published version of the manuscript.

Funding

This work was supported by grants from the Institute of Agricultural Research for Development (IRAD).

Institutional Review Board Statement

IRAD and CIRAD authorized the publication of this research work.

Informed Consent Statement

All authors of this article have given their consent for publication in the journal crops.

Data Availability Statement

The data that support the findings of this study are available from the corresponding 382 author upon reasonable request.

Conflicts of Interest

The authors declare that this work has not been published previously, and it is not under consideration for publication elsewhere. All the authors approve its publication in your journal.

References

  1. Driciru, P.; Mugasa, M.C.; Acidri, R.; Adriko, J. Development of Loop-Mediated Isothermal Amplification (LAMP) Assay for Detection of Pseudocercospora Angolensis in Sweet Orange. bioRxiv 2021. [Google Scholar] [CrossRef]
  2. Yesuf, M. Pseudocercospora Leaf and Fruit Spot Disease of Citrus: Achievements and Challenges in the Citrus Industry: A Review. Agric. Sci. 2013, 04, 324–328. [Google Scholar] [CrossRef] [Green Version]
  3. Brentu, F.C.; Cornelius, E.W.; Lawson, L.E.V.; Oduro, K.A.; Vicent, A. First Report of Pseudocercospora Angolensis Causing Fruit and Leaf Spot of Citrus in Ghana. Plant Dis. 2013, 97, 1661. [Google Scholar] [CrossRef] [PubMed]
  4. De Carvalho, T.; Mendes, O. Una Cercosporiose Em Citrinos. Notιcia Preliminar. Mocßambique Doc. Trimest. 1952, 72, 5–8. [Google Scholar]
  5. Ndo, E.G.D.; Kuate, J.; Sidjeu Wonfa, C.S.; Tchio, F.; Ndzana Abanda, F.X.; Mbieji Kemayou, C.; Akoutou Mvondo, E.; Amele Ndjoumoui, C.; Amang, A.; Mbang, J. Tolerance of Citrus Genotypes towards Pseudocercospora Leaf and Fruit Spot Disease in Western Highlands Zone of Cameroon. Crop Prot. 2019, 124, 104828. [Google Scholar] [CrossRef]
  6. Ndo, E.; Manga, B.; Ndoumbe-Nkeng, M.; Cilas, C. Distribution of Pseudocercospora Fruit and Leaf Spot, Phytophthora Foot Rot and Scab Diseases and Their Effect on Citrus Tree Decline Prevalence in the Humid Zones of Cameroon. Fruits 2019, 74, 249–256. [Google Scholar] [CrossRef]
  7. Ndo, E.; Bella-Manga, F.; Ndindeng, S.A.; Ndoumbe-Nkeng, M.; Fontem, D.; Cilas, C. Altitude, Tree Species and Soil Type Are the Main Factors Influencing the Severity of Phaeoramularia Leaf and Fruit Spot Disease of Citrus in the Humid Zones of Cameroon. Eur. J. Plant Pathol. 2010, 128, 385–397. [Google Scholar] [CrossRef]
  8. Dagnew, A.; Belew, D.; Admassu, B.; Yesuf, M. Citrus Production, Constraints and Management Practices in Ethiopia: The Case of Pseudocercospora Leaf and Fruit Spot Disease. Sci. Technol. Arts Res. J. 2014, 3, 4. [Google Scholar] [CrossRef] [Green Version]
  9. Kupagme, J.Y. Epidemiology and Control of Pseudocercospora Fruit and Leaf Spot Disease of Sweet Orange (Citrus sinensis (L.) Osbeck). Master’s Thesis, University of Ghana, Accra, Ghana, 2019. [Google Scholar]
  10. Pretorius, M.C. Epidemiology and Control of Pseudocercospora Angolensis Fruit and Leaf Spot Disease on Citrus in Zimbabwe. Ph.D. Thesis, Stellenbosch University, Stellenbosch, South Africa, 2005. [Google Scholar]
  11. Kuate, J.; Fouré, E.; Tchio, F.; Ducelier, D. La Phaeoramulariose Des Agrumes Au Cameroun Due à Phaeoramularia Angolensis: Expression Parasitaire à Différentes Altitudes. Fruits 2002, 57, 207–218. [Google Scholar] [CrossRef] [Green Version]
  12. Manga, M.; Dubois, C.; Kuaté, J.; Ngbwa, M.M.; Rey, J.-Y.; Développement, I. de la recherche agricole pour le; CIRAD-FLHOR Sensibilité à Phaeoramularia angolensis de divers agrumes cultivés en zone forestière humide au Cameroun. Fruits 1999, 54, 167–176. [Google Scholar]
  13. Sonwa, D.J.; Nkongmeneck, B.A.; Weise, S.F.; Tchatat, M.; Adesina, A.A.; Janssens, M.J. Diversity of Plants in Cocoa Agroforests in the Humid Forest Zone of Southern Cameroon. Biodivers. Conserv. 2007, 16, 2385–2400. [Google Scholar] [CrossRef]
  14. Mvondo, E.A.; Danièle Ndo, E.G.; Nomo, L.B.; Ambang, Z.; Manga, F.B.; Cilas, C. Tree Diversity and Shade Rate in Complex Cocoa-Based Agroforests Affect Citrus Foot Rot Disease. Basic Appl. Ecol. 2022, 64, 134–146. [Google Scholar] [CrossRef]
  15. Akoutou Mvondo, E.; Ndo, E.G.D.; Tsouga Manga, M.L.; Aba’ane, C.L.; Abondo Bitoumou, J.; Manga, B.; Bidzanga Nomo, L.; Ambang, Z.; Cilas, C. Effects of Complex Cocoa-Based Agroforests on Citrus Tree Decline. Crop Prot. 2020, 130, 105051. [Google Scholar] [CrossRef]
  16. Armengot, L.; Ferrari, L.; Milz, J.; Velásquez, F.; Hohmann, P.; Schneider, M. Cacao Agroforestry Systems Do Not Increase Pest and Disease Incidence Compared with Monocultures under Good Cultural Management Practices. Crop Prot. 2020, 130, 105047. [Google Scholar] [CrossRef]
  17. Barrios, E.; Valencia, V.; Jonsson, M.; Brauman, A.; Hairiah, K.; Mortimer, P.E.; Okubo, S. Contribution of Trees to the Conservation of Biodiversity and Ecosystem Services in Agricultural Landscapes. Int. J. Biodivers. Sci. Ecosyst. Serv. Manag. 2018, 14, 1–16. [Google Scholar] [CrossRef] [Green Version]
  18. Asigbaase, M.; Sjogersten, S.; Lomax, B.H.; Dawoe, E. Tree Diversity and Its Ecological Importance Value in Organic and Conventional Cocoa Agroforests in Ghana. PLoS ONE 2019, 14, e0210557. [Google Scholar] [CrossRef] [Green Version]
  19. Ratnadass, A.; Fernandes, P.; Avelino, J.; Habib, R. Plant Species Diversity for Sustainable Management of Crop Pests and Diseases in Agroecosystems: A Review. Agron. Sustain. Dev. 2012, 32, 273–303. [Google Scholar] [CrossRef] [Green Version]
  20. Jonsson, M.; Raphael, I.A.; Ekbom, B.; Kyamanywa, S.; Karungi, J. Contrasting Effects of Shade Level and Altitude on Two Important Coffee Pests. J. Pest Sci. 2015, 88, 281–287. [Google Scholar] [CrossRef]
  21. Seif, A.A.; Hillocks, R.J. Phaeoramularia Fruit and Leaf Spot of Citrus with Special Reference to Kenya. Int. J. Pest Manag. 1993, 39, 44–50. [Google Scholar] [CrossRef]
  22. Seif, A.A.; Hillocks, R.J. Some Factors Affecting Infection of Citrus by Phaeoramularia angolensis. J. Phytopathol. (1986) 1998, 146, 385–391. [Google Scholar]
  23. Schroth, G.; Krauss, U.; Gasparotto, L.; Duarte, J.A.; Vohland, K. Pests and Diseases in Agroforestry Systems of the Humid Tropics. Agrofor. Syst. 2000, 50, 199–241. [Google Scholar] [CrossRef]
  24. Kuaté, J.; Kouodiekong, L.; David, O.; Ndindeng, S.A.; Parrot, L. Les Exploitations Fruitières en Zones Périurbaines de Yaoundé au Cameroun: Une Enquête Diagnostic. Available online: https://agritrop.cirad.fr/529960/ (accessed on 20 October 2020).
  25. Aka, A.R.; Kouassi, N.K.; Agnéroh, T.A.; Amancho, N.A.; Sangare, A. Distribution et Incidence de La Mosaïque Du Concombre (Cmv) Dans Des Bananeraies Industrielles Au Sud-Est de La Côte d’ivoire. Sci. Nat. 2009, 6. [Google Scholar] [CrossRef]
  26. Baillargeon, S. Le Krigeage: Revue de La Théorie et Application à l’interpolation Spatiale de Données de Précipitations. Ph.D. Thesis, Université Laval, Québec, QC, Canada, 2005. [Google Scholar]
  27. Gratton, Y. Le Krigeage: La Méthode Optimale d’interpolation Spatiale. Les Artic. L’Institut D’Analyse Géographique 2022, 1. Available online: https://www.researchgate.net/profile/Yves-Gratton/publication/229009107_Le_krigeage_la_methode_optimale_d%27interpolation_spatiale/links/00b49533adff3e8501000000/Le-krigeage-la-methode-optimale-dinterpolation-spatiale.pdf (accessed on 20 June 2022).
  28. Mouen Bedimo, J.A.; Bieysse, D.; Njiayouom, I.; Deumeni, J.P.; Cilas, C.; Nottéghem, J.L. Effect of Cultural Practices on the Development of Arabica Coffee Berry Disease, Caused by Colletotrichum Kahawae. Eur. J. Plant Pathol. 2007, 119, 391–400. [Google Scholar] [CrossRef]
  29. Tscharntke, T.; Clough, Y.; Bhagwat, S.A.; Buchori, D.; Faust, H.; Hertel, D.; Hölscher, D.; Juhrbandt, J.; Kessler, M.; Perfecto, I.; et al. Multifunctional Shade-Tree Management in Tropical Agroforestry Landscapes—A Review. J. Appl. Ecol. 2011, 48, 619–629. [Google Scholar] [CrossRef] [Green Version]
  30. Wolfe, M.S. Crop Strength through Diversity. Nature 2000, 406, 681–682. [Google Scholar] [CrossRef] [PubMed]
  31. Ndo, E.G.D.; Mvondo, E.A.; Ambang, Z.; Manga, B.; Cilas, C.; Nomo, L.B.; Gidoin, C.; Bieng, M.-A.N. Spatial Organisation Influences Citrus Pseudocercospora Leaf and Fruit Spot Disease Severity in Cocoa-Based Agroforestry Systems. Available online: /paper/Spatial-organisation-influences-citrus-leaf-and-in-Ndo-Mvondo/5f9aab68d387c331b3af966ab0b93810b7b9e672 (accessed on 21 October 2020).
  32. Akoutou, E.; Ndo, E.; Bieng, M.-A.; Ambang, Z.; Manga, B.; Cilas, C.; Manga, M.; Bidzanga Nomo, L. Assessment of the Interaction between the Spatial Organization of Citrus Trees Populations in Cocoa Agroforests and Phytophthora Foot Rot Disease of Citrus Severity. Agrofor. Syst. 2017, 93, 493–502. [Google Scholar] [CrossRef]
  33. Ratnadass, A.; Avelino, J.; Fernandes, P.; Letourmy, P.; Babin, R.; Deberdt, P.; Deguine, J.-P.; Grechi, I.; Naudin, K.; Rhino, B.; et al. Synergies and Tradeoffs in Natural Regulation of Crop Pests and Diseases under Plant Species Diversification. Crop Prot. 2021, 146, 105658. [Google Scholar] [CrossRef]
  34. Pumariño, L.; Sileshi, G.W.; Gripenberg, S.; Kaartinen, R.; Barrios, E.; Muchane, M.N.; Midega, C.; Jonsson, M. Effects of Agroforestry on Pest, Disease and Weed Control: A Meta-Analysis. Basic Appl. Ecol. 2015, 16, 573–582. [Google Scholar] [CrossRef]
  35. Hatvani, I.G.; de Barros, V.D.; Tanos, P.; Kovács, J.; Székely Kovács, I.; Clement, A. Spatiotemporal Changes and Drivers of Trophic Status over Three Decades in the Largest Shallow Lake in Central Europe, Lake Balaton. Ecol. Eng. 2020, 151, 105861. [Google Scholar] [CrossRef]
  36. Ndo, E.G.D. Evaluation des Facteurs de Risque Épidémiologique de la Phaeoramulariose des Agrumes Dans les Zones Humides du Cameroun. Ph.D. Thesis, University of Montpellier, Montpellier, France, 2011. [Google Scholar]
  37. Merle, I.; Villarreyna-Acuña, R.; Ribeyre, F.; Roupsard, O.; Cilas, C.; Avelino, J. Microclimate Estimation under Different Coffee-Based Agroforestry Systems Using Full-Sun Weather Data and Shade Tree Characteristics. Eur. J. Agron. 2022, 132, 126396. [Google Scholar] [CrossRef]
  38. Mustafa, M.; Szalai, Z.; Divéky-Ertsey, A.; Gál, I.; Csambalik, L. Conceptualizing Multiple Stressors and Their Consequences in Agroforestry Systems. Stresses 2022, 2, 242–255. [Google Scholar] [CrossRef]
Figure 1. 3D plan of the experimental plots situated in Foumbot (A) and in Bokito (B). Plot in Foumbot includes young grapefruit trees (red) and shade trees composed of avocado and mango trees, while the Bokito plot is a complex and biodiverse cocoa-based agroforestry system with tangerines (red) situated under other trees or in full sunlight.
Crops 03 00002 g001
Figure 2. Graphical representation of the percentage of diseased leaves for each grapefruit plant and shading indices of the different shade trees during the first (A) and second (B) observation session. The black dots represent the shade trees, i.e., the avocado trees (on the right side) and the mango trees (on the left side). The green dots represent the young grapefruit.
Crops 03 00002 g002
Figure 3. Observed half variances (squares) and corresponding models (curves) for residues of the percentage of sick leaves in October 2017 (A) and June 2018 (B) on grapefruit tree.
Crops 03 00002 g003
Figure 4. Kriging maps for the spatial distribution of residues from the percentage of sick leaves in October 2011 (A) and June 2012 (B) on grapefruit tree.
Crops 03 00002 g004
Table 1. Comparison of Pseudocercospora leaf and fruit spot disease incidence on tangerine tree leaves between trees under forest tree shade and those under full sunlight for four observation dates at Bokito.
Observation DateShade TypeIncidence (% ± x )
September 2020Full sunlight3.12 ± 6.19 a
Forest trees shade0.00 ± 0.00 a
April 2021Full sunlight6.70 ± 10.57 a
Forest trees shade0.0 ± 0.00 b
September 2021Full sunlight22.44 ± 21.77 a
Forest trees shade0.00 ± 0.00 b
April 2022Full sunlight2.40 ± 4.65 a
Forest trees shade0.00 ± 0.00 a
x = standard deviation. Numbers followed by the same letters (a, b) in the same cell are not significantly different with Student–Newman–Keuls test at the probability of 0.05.
Table 2. Comparison of Pseudocercospora leaf and fruit spot disease incidence on tangerine trees between trees under forest trees shade and those under full sunlight for three observation dates at Bokito.
Observation DateShade TypeIncidence (% ± x )
April 2021Full sunlight1.34 ± 3.54 a
Forest trees shade0.0 ± 0.00 a
September 2021Full sunlight23.47 ± 26.18 a
Forest trees shade0.83 ± 2.04 b
April 2022Full sunlight6.59 ± 17.44 b
Forest trees shade0.00 ± 0.00 a
x = standard deviation. Numbers followed by the same letters in the same cell are not significantly different with Student–Newman–Keuls test at the probability of 0.05.
Table 3. Comparison of Pseudocercospora leaf and fruit spot disease incidence on grapefruit tree leaves between three types of shade for two observation dates at Foumbot.
Observation DateShade Type Incidence (% ± x)
October 2021Full sunlight45.26 ± 23.92 a
Avocado trees shade21.39 ± 13.70 b
Mango trees shade 27.76 ± 14.33 b
June 2022Full sunlight25.20 ± 23.05 a
Avocado trees shade3.02 ± 5.54 b
Mango trees shade8.11± 13.80 b
x = standard deviation. Numbers followed by the same letters in the same cell are not significantly different with Student–Newman–Keuls test at α = 0.05.
Table 4. Parameters significantly associated with citrus Pseudocercospora leaf and fruit spot disease incidence on grapefruit tree leaves in Foumbot.
Variables Parameters DDl Sum of Square Means Square F ValuePr (>F)
IncidenceShade 321,2927097.323.14.5 × 10−12 ***
Observation date 112,49312,493.440.72.8 × 10−9 ***
Interaction shade x observation date-----
Residue 13140,238307.2--
Incidence = percentage of infected organs. Significant code: ‘***’: p < 0.0001.
Table 5. Description parameters of the semi-variograms and statistics of the models obtained from residues of Pseudocercospora leaf and fruit spot disease variables on grapefruit trees during the two observation dates in the plot of Foumbot.
VariablesDatesModelReach (m)Degree (C0+C)C/(C0+C)RSSR2
SeverityOctober 2021Gaussian11.700.9140.9990.1060.883
June 2022Gaussian10.080.2491.0000.0150.704
IncidenceOctober 2021Gaussian9.59391.100.997156600.829
June 2022Exponential7.49314.600.99955930.425
Incidence = percentage of infected organs.
Disclaimer/Publisher’s Note: The statements, opinions and data contained in all publications are solely those of the individual author(s) and contributor(s) and not of MDPI and/or the editor(s). MDPI and/or the editor(s) disclaim responsibility for any injury to people or property resulting from any ideas, methods, instructions or products referred to in the content.

