
Investigating Runway Incursion Incidents at United States Airports

Abstract
:1. Introduction
- Category A: An occurrence that was exceedingly serious and narrowly escaped a collision.
- Category B: A circumstance in which there is a high chance of a collision; to avoid one, a quick corrective action or evasive maneuver may be required.
- Category C: An occurrence in which there was enough time or space to escape a collision.
- Category D: An incident that fits the criteria for a runway incursion but has no immediate safety repercussions as a result of an incorrectly parked car, person, or aircraft on a runway or in a protected location.
- Research question 1: do runway incursion mitigation technologies installed at an airport contribute to reducing the number of runway incursions at the airport?
- Research question 2: do the airport runway geometric characteristics of an airport contribute significantly to the number of runway incursions at the airport?
2. Background
3. Data Collection
3.1. Development of Variables
3.1.1. Dependent Variables
3.1.2. Independent Variables
- 1.
- Operations Network (OPSNET)
- 2.
- Airport Geometry
- 3.
- Airport-Runway-Incursion-Mitigating Technologies
4. Methodology
5. Result Analysis
- Airport Annual Operation (AirportOperation_100000):
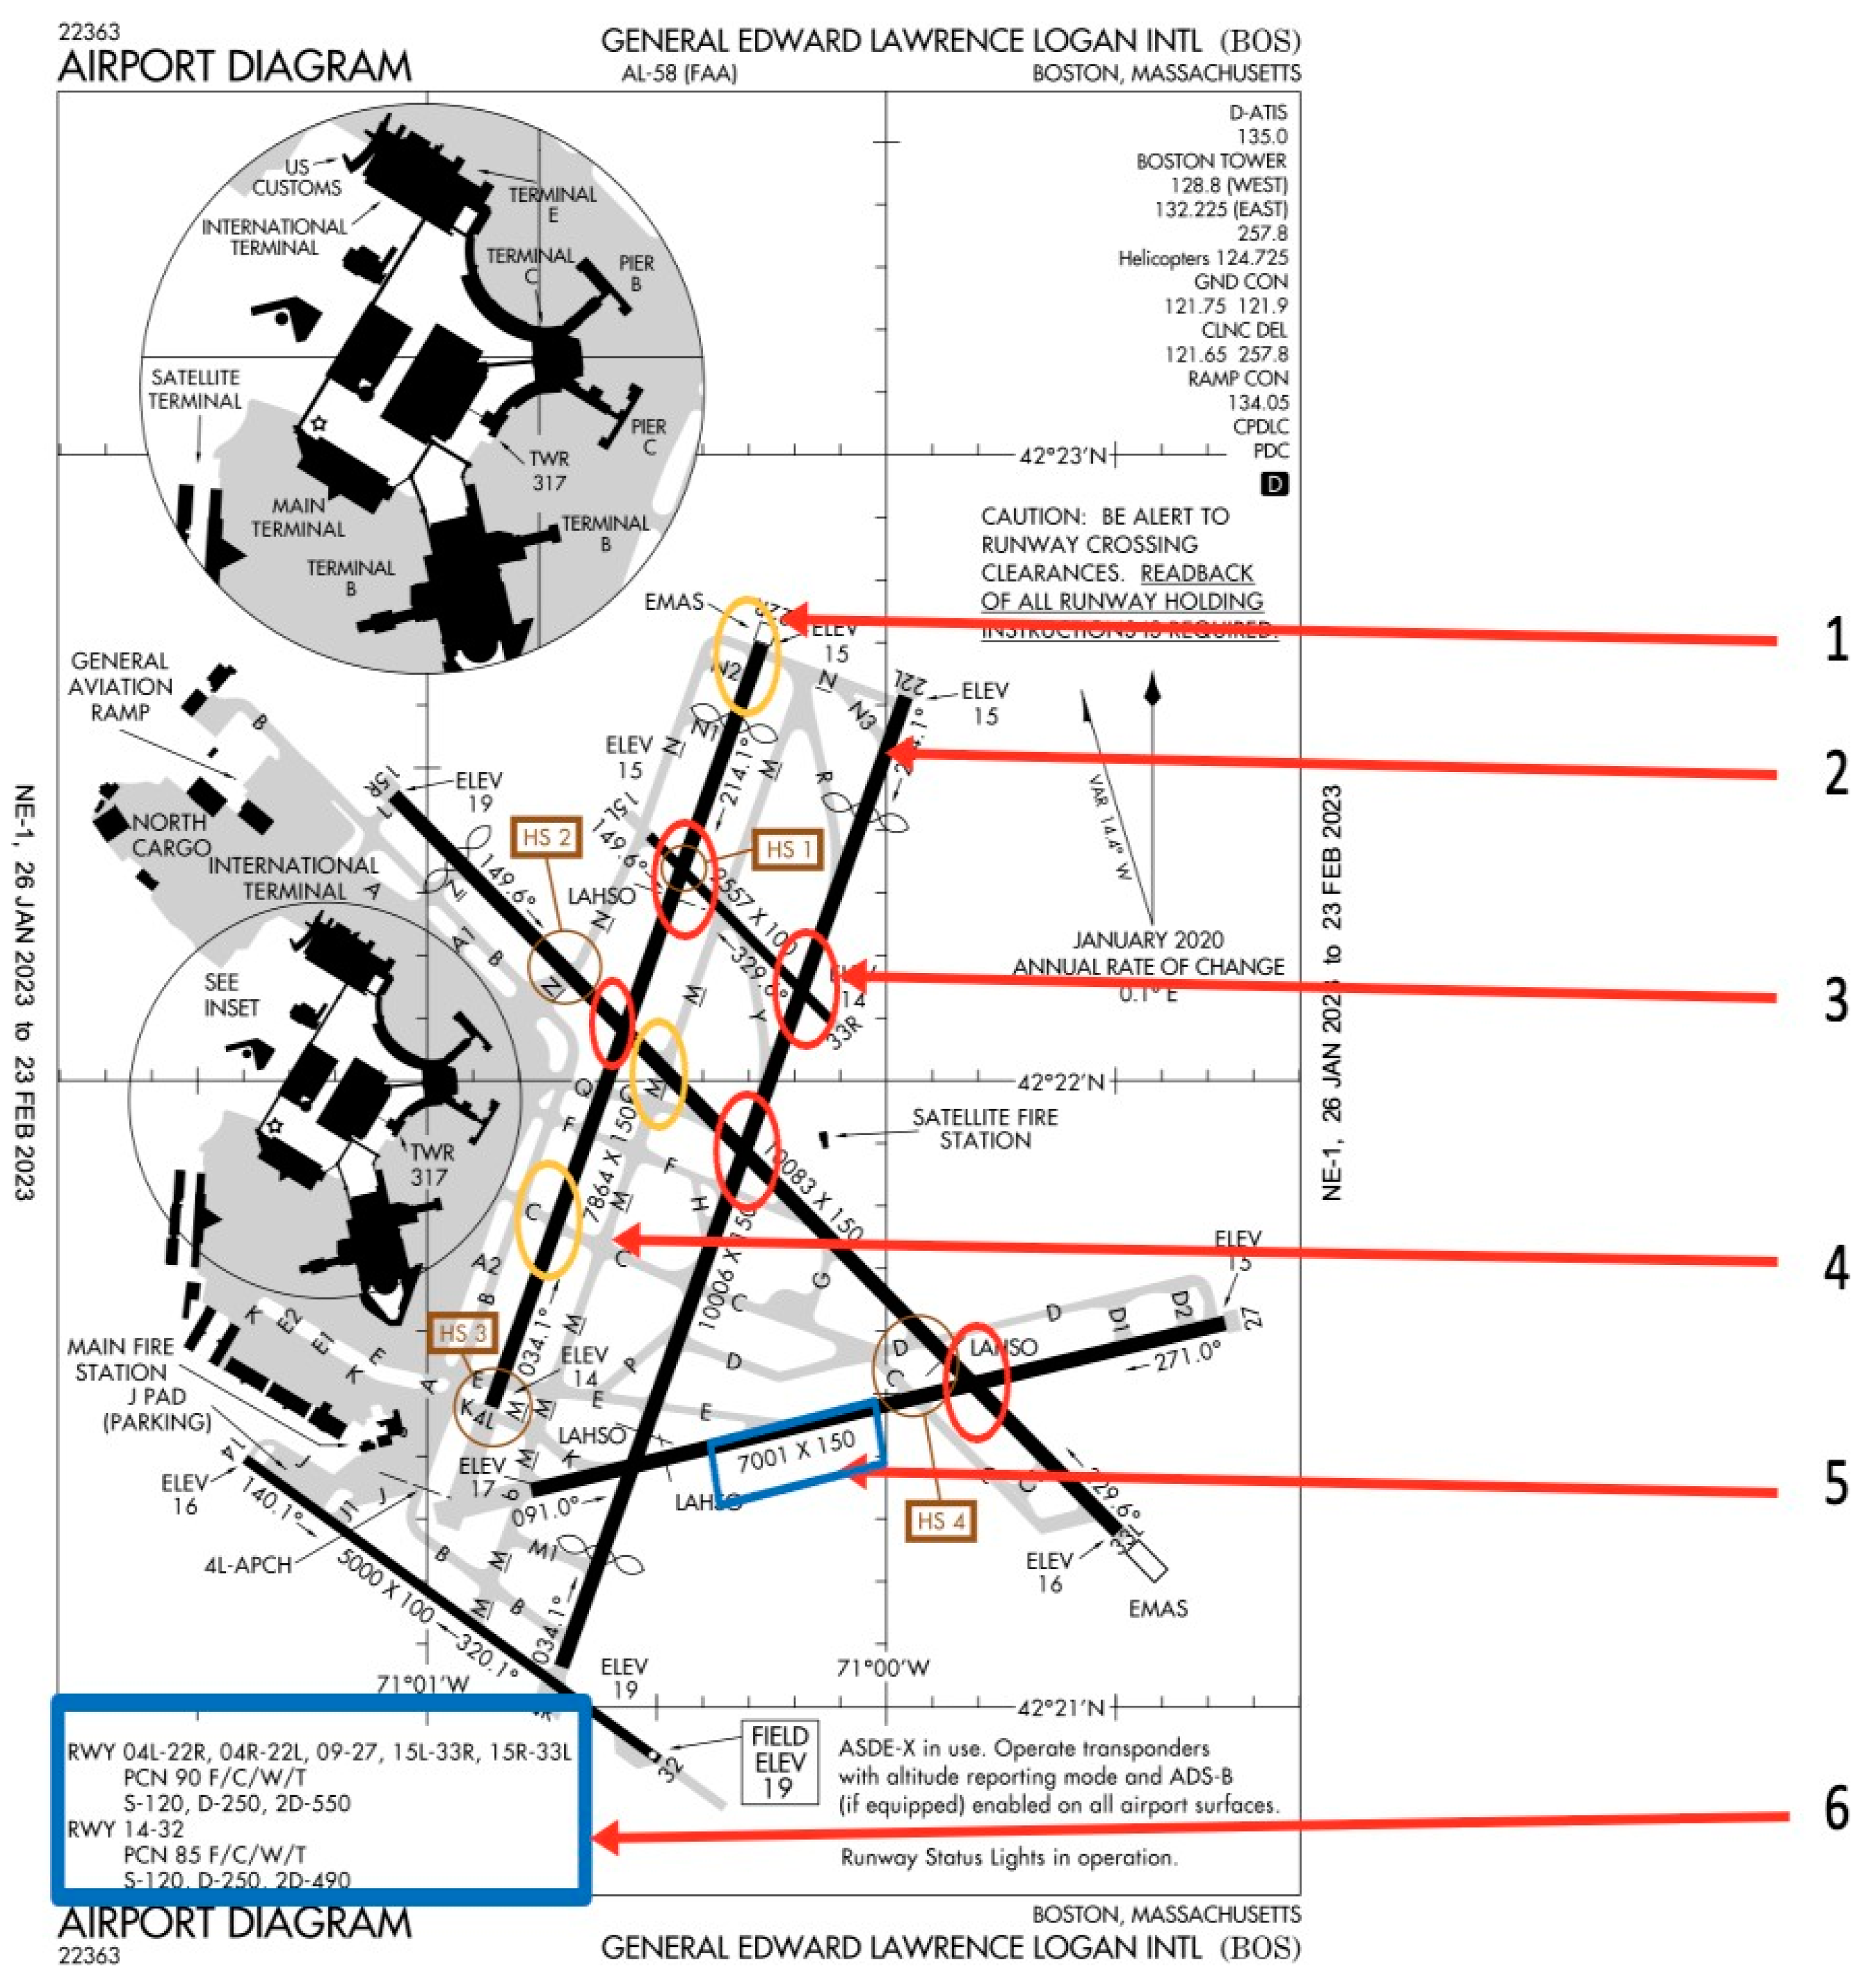
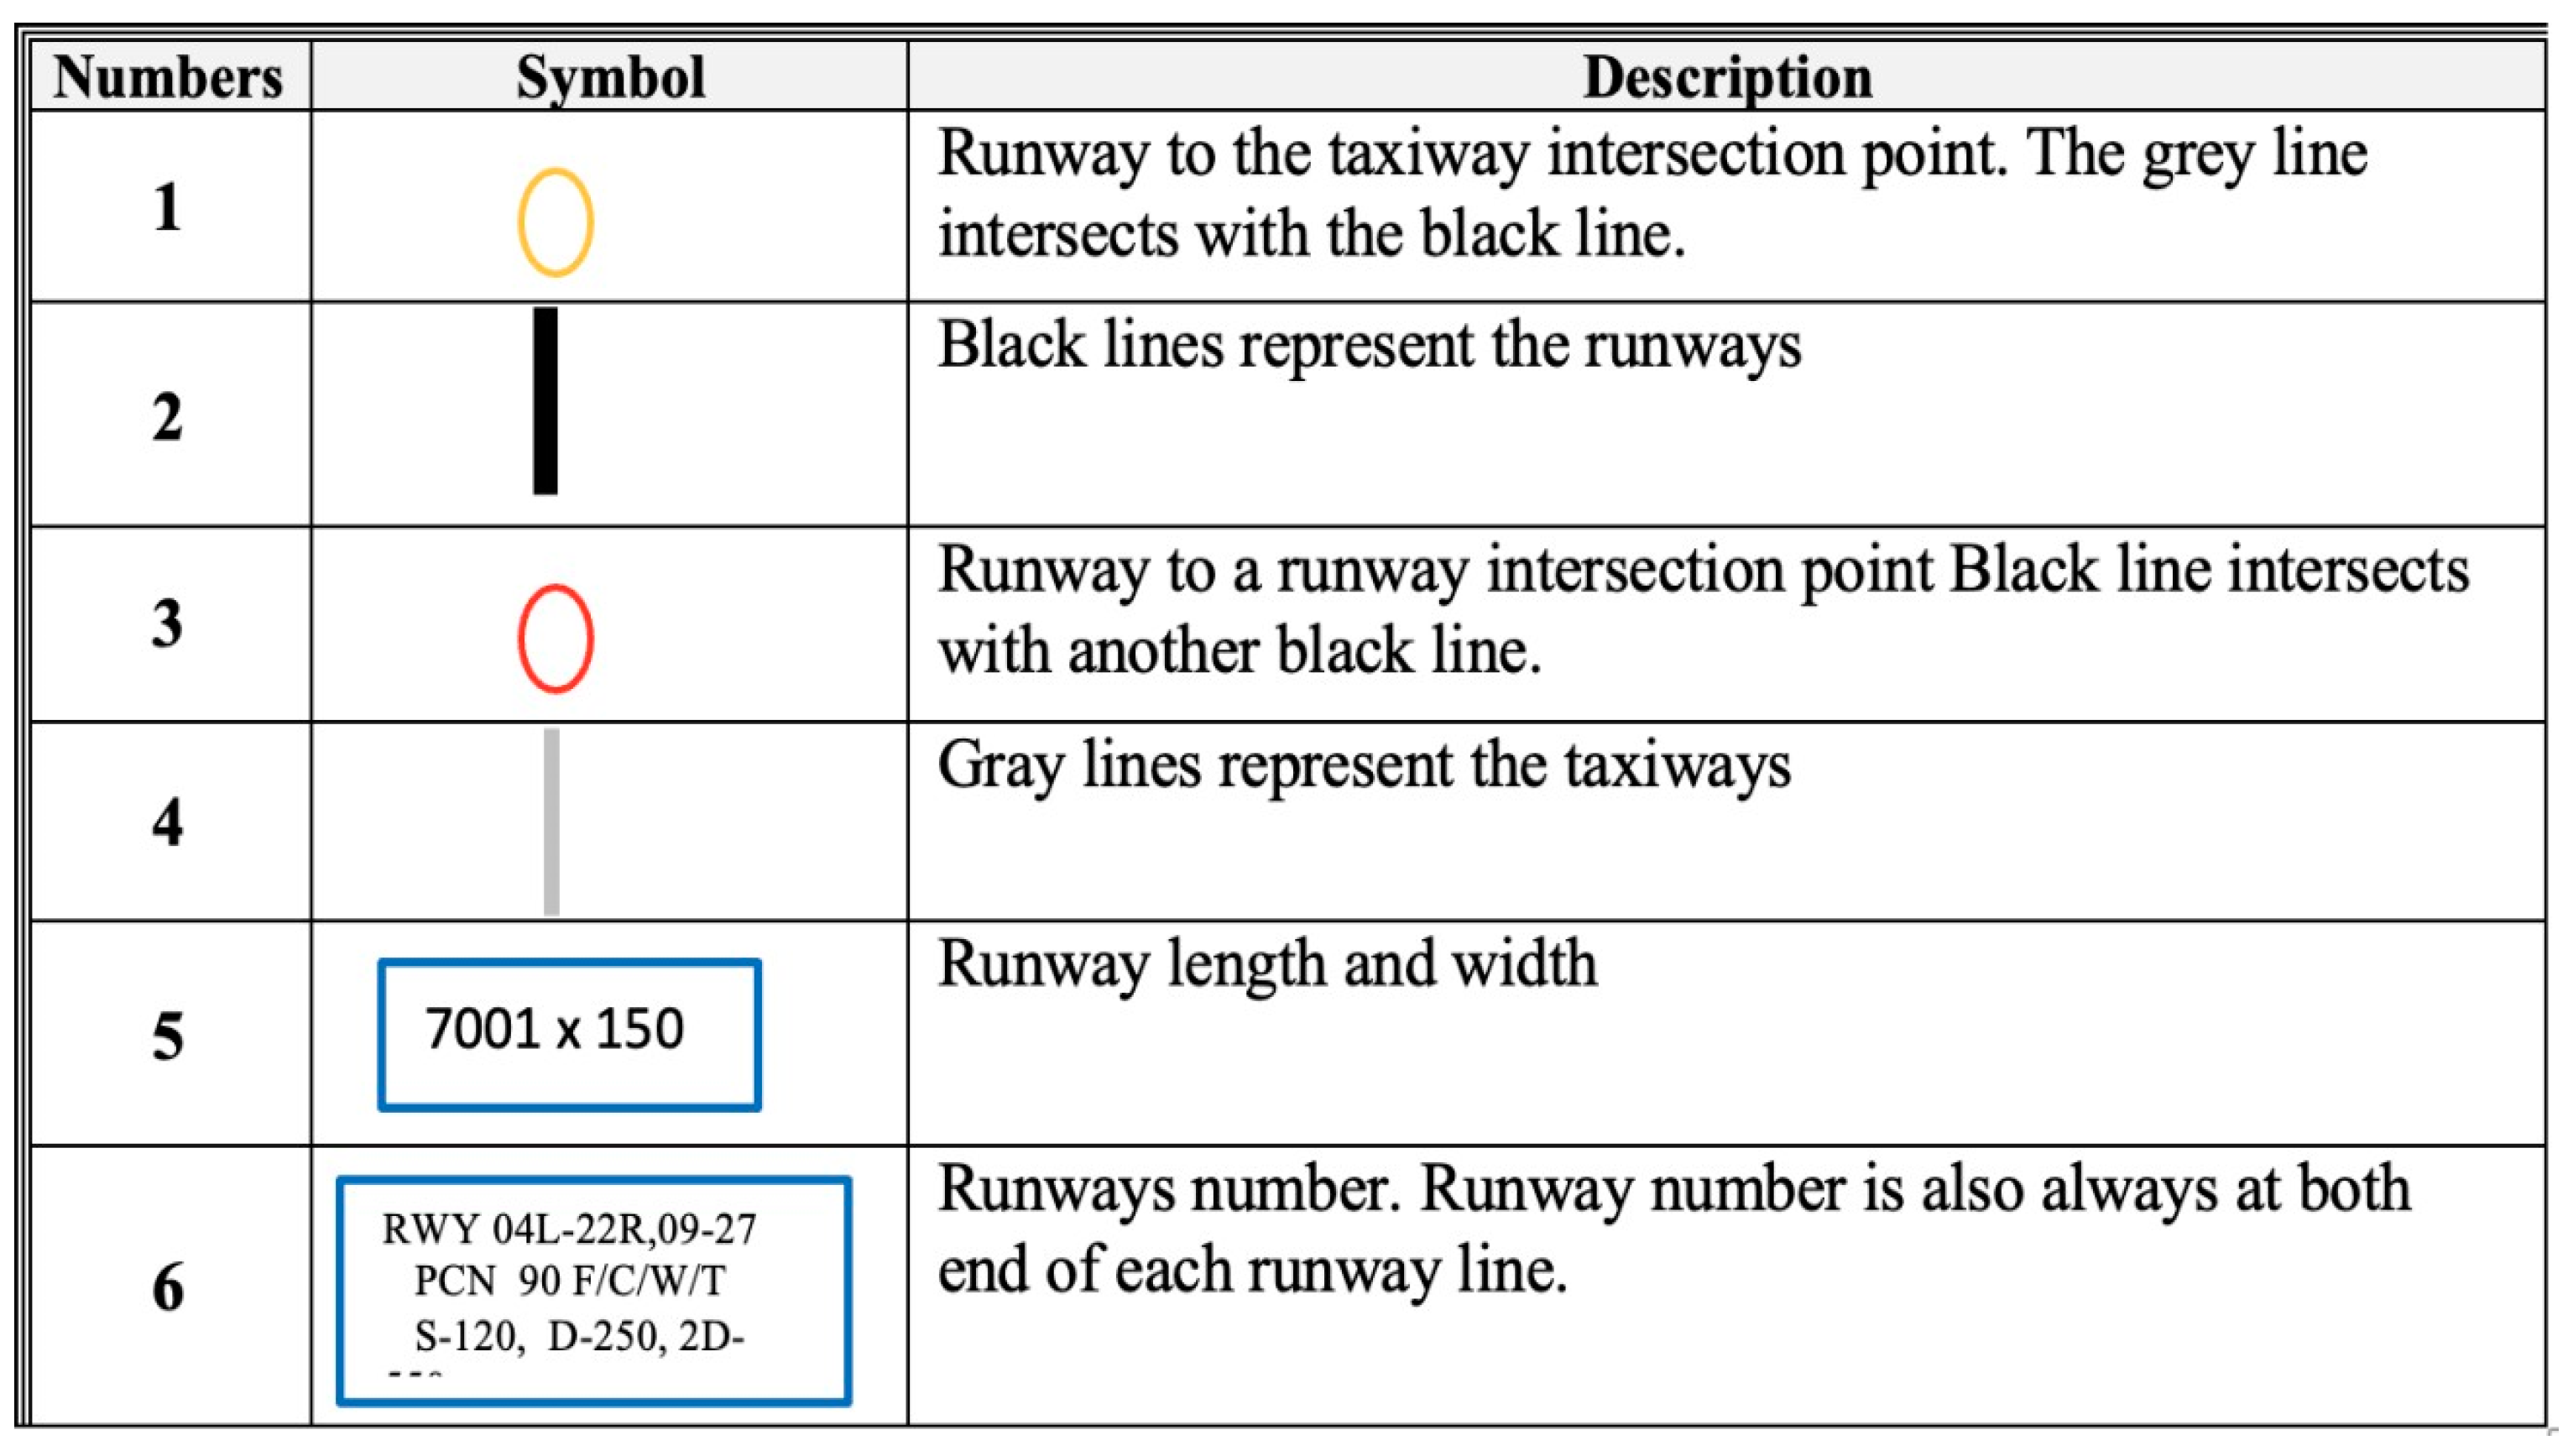
- Runway-to-Runway intersecting point (RWY_RWY)”
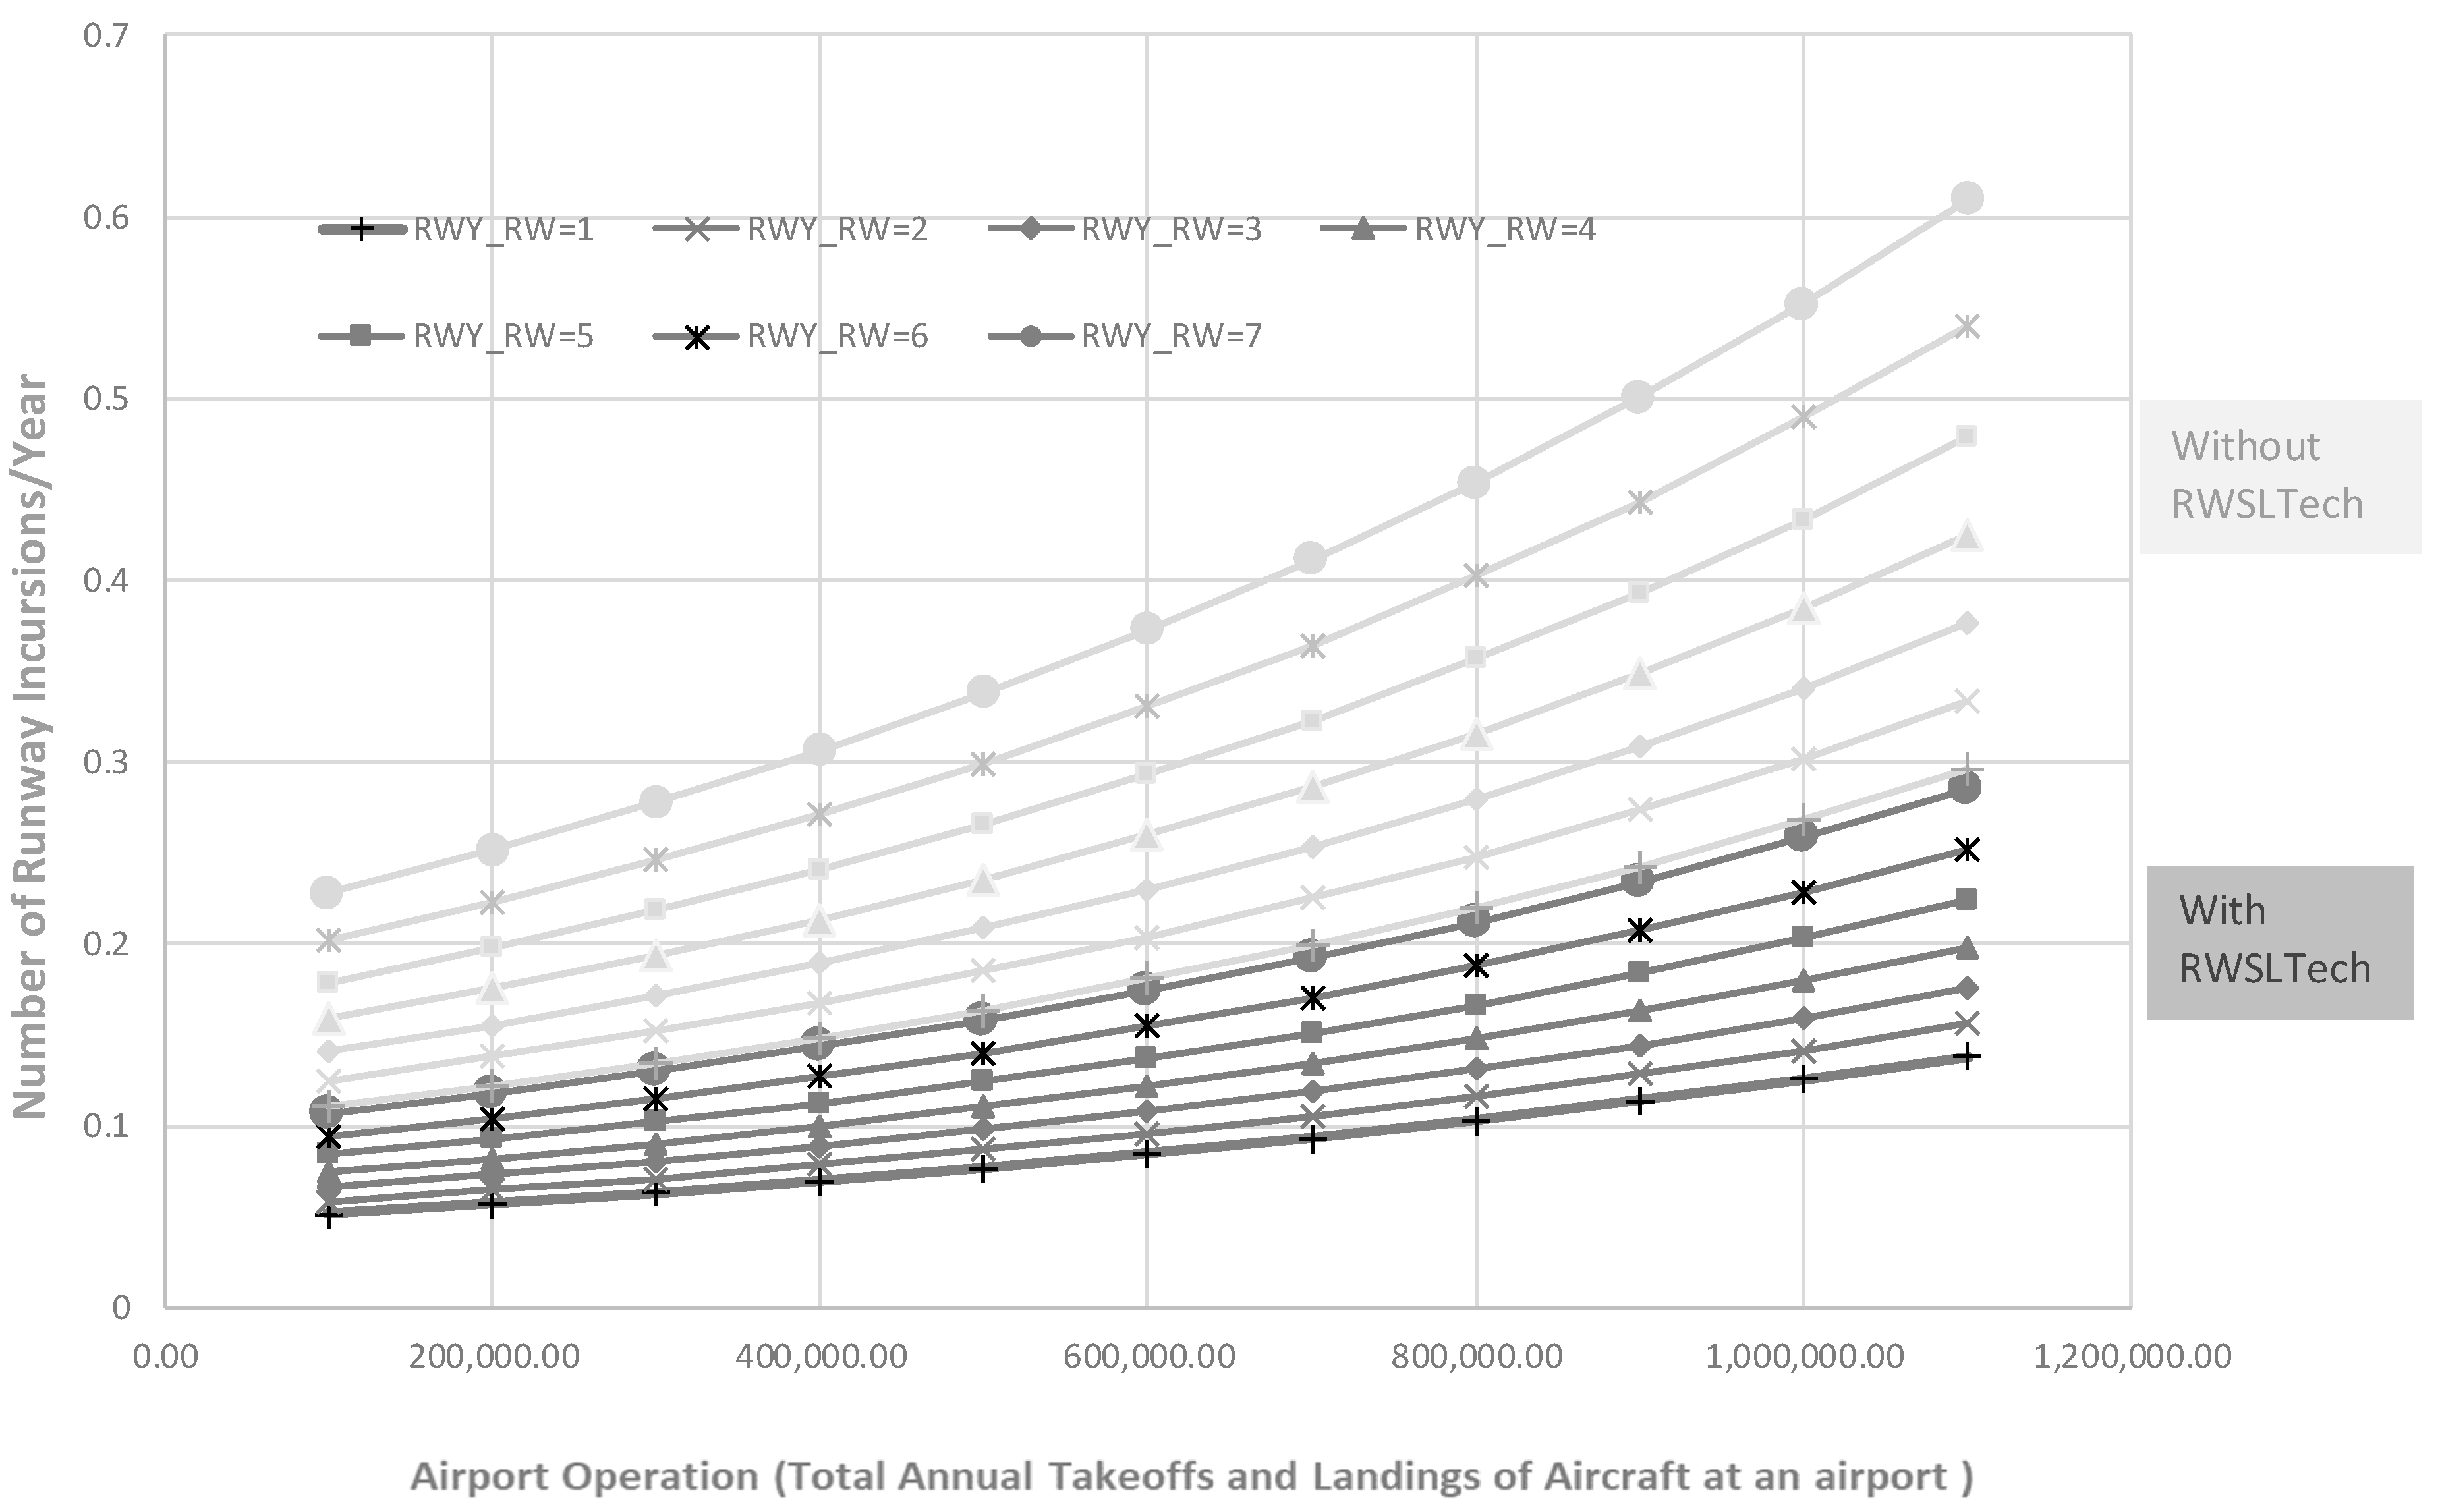
- RWSL Technology:
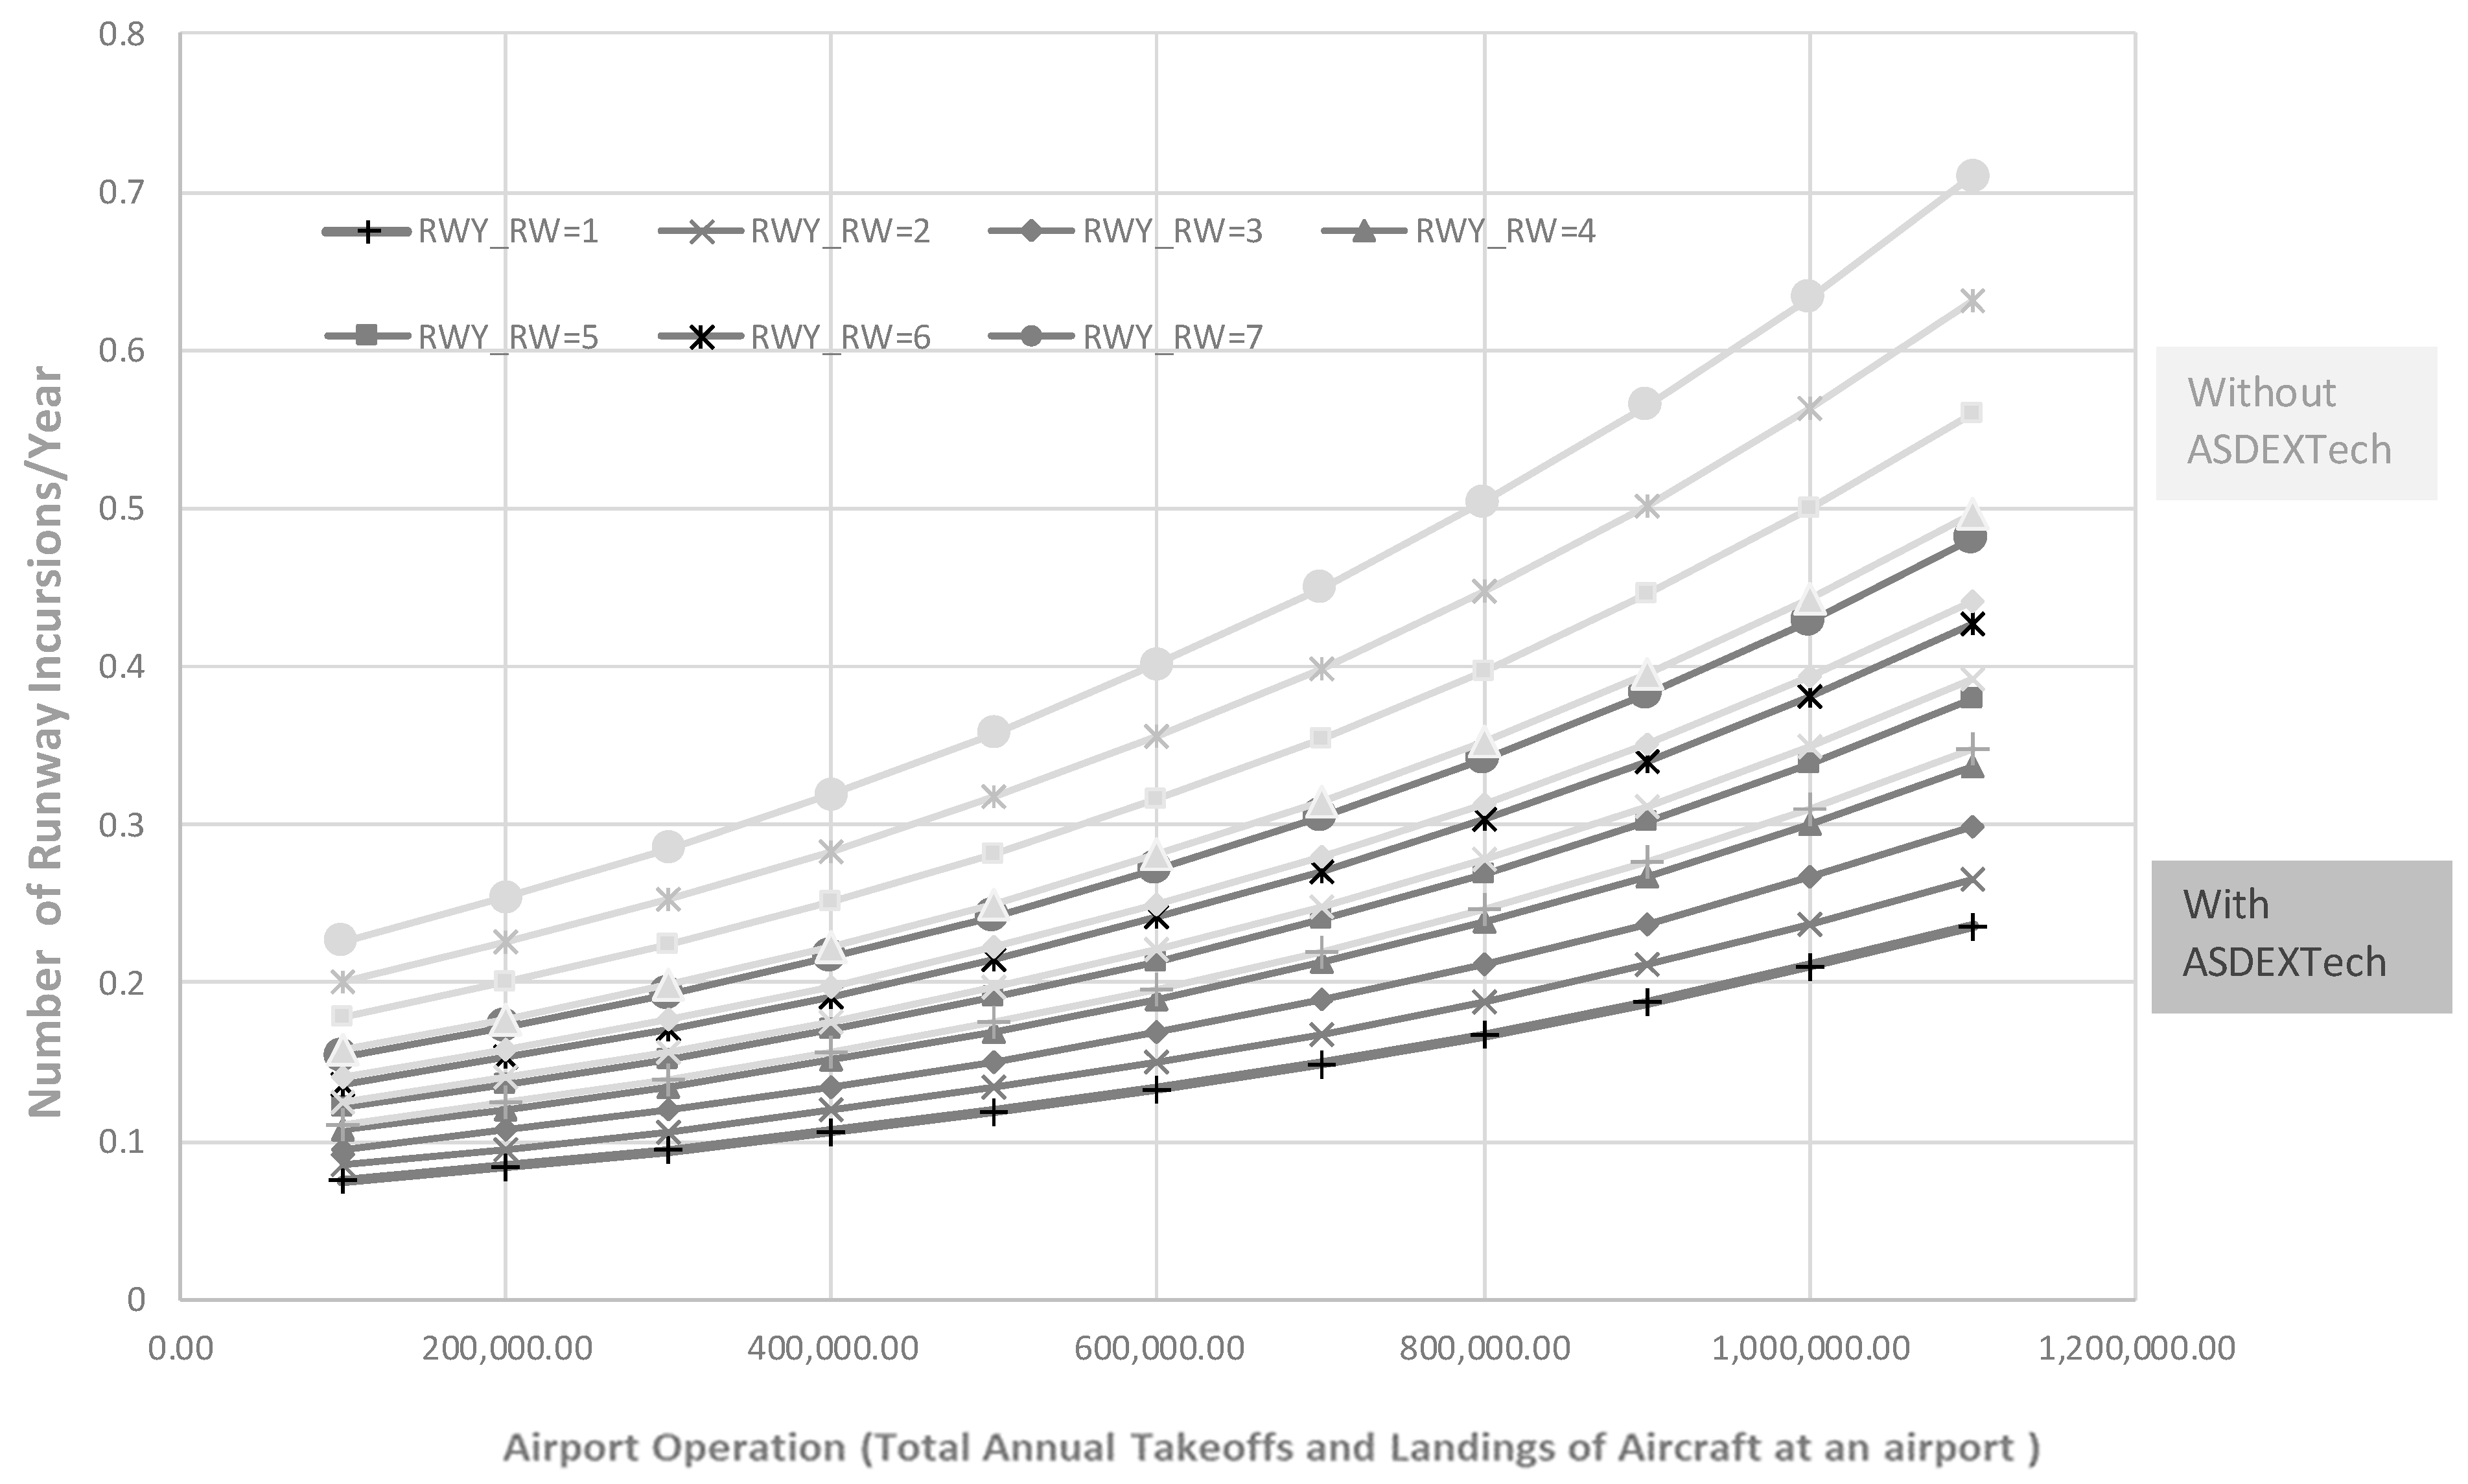
- ASDE-X Technology:
6. Conclusions and Recommendations
- ASDE-X and RWSL technologies have been proven to help reduce the rate of runway incursions. The Federal Aviation Administration (FAA) should invest and roll out more mitigating technologies to help reduce runway incursions at airports.
- RWSL technology performs better than ASDE-X technology in terms of reducing runway incursions. RWSL technology should be implemented in airports with high risks of runway incursions.
- The cramped and complex configurations of runways at airports have been shown to increase runway incursion incidents. A complicated airport design with a significant number of runway-to-runway intersection points should be avoided in future airport designs.
- For airports that currently have complex runway configurations with a significant number of runway-to-runway intersection points, the use of mitigating technologies such as runway status light (RWSLs) at conflict points is recommended to assist pilots in unsafe operations, thereby reducing runway incursions.
6.1. Policy Implications
6.2. Limitations and Future Study Needs
Author Contributions
Funding
Institutional Review Board Statement
Informed Consent Statement
Data Availability Statement
Conflicts of Interest
References
- Federal Aviation Administration. Runway Incursions; U.S. Department of Transportation: Washington, DC, USA, 2022. Available online: https://www.faa.gov/airports/runway_safety/resources/runway_incursions (accessed on 10 October 2023).
- Federal Aviation Administration. Report to Congress: National Plan of Integrated Airport Systems (NPIAS) 2021–2025; U.S. Department of Transportation, Office of Airport Planning and Programing: Washington, DC, USA, 2020. [Google Scholar]
- Air Line Pilots Association, International. White Paper-Runway Incursions: Call for Action. 2007. Available online: http://www.alpa.org/portals/alpa/runwaysafety/runwayincursionwhitepaper.pdf (accessed on 10 October 2023).
- Chang, Y.H.; Wong, K.M. Human risk factors associated with runway incursions. J. Air Transp. Manag. 2012, 24, 25–30. [Google Scholar]
- Torres, K.R.; Metscher, D.S.; Smith, M. A correlation study of the relationship between human factor errors and the occurrence of runway incursions. Int. J. Aviat. Res. 2011, 5. [Google Scholar]
- Knott, B.; Gannon, A.; Rench, M.; Crew System Ergonomics Information Analysis Center Wright-Patterson AFB OH. Runway incursion: Human factors in runway incursions. Hum. Syst. Inf. Anal. Cent. 2000. [Google Scholar]
- EUROCONTROL. The European Action Plan for the Prevention of Runway Incursions. 2006. Available online: https://www.eurocontrol.int/publication/european-action-plan-prevention-runway-incursions-eappri (accessed on 10 October 2023).
- Mathew, J.K.; Major, W.L.; Hubbard, S.M.; Bullock, D.M. Statistical modeling of runway incursion occurrences in the United States. J. Air Transp. Manag. 2017, 65, 54–62. [Google Scholar]
- Biernbaum, L.; Hagemann, G. Runway Incursion Severity Risk Analysis (No. DOT-VNTSC-FAA-12-13); John A. Volpe National Transportation Systems Center: Cambridge, MA, USA, 2012. [Google Scholar]
- Ashford, N.J.; Mumayiz, S.; Wright, P.H. Airport Engineering: Planning, Design, and Development of 21st Century Airports; John Wiley & Sons: Hoboken, NJ, USA, 2011. [Google Scholar]
- Wilke, S.; Majumdar, A.; Ochieng, W. Modeling Runway Incursion Severity. Accid. Anal. Prev. 2015, 79, 88–99. [Google Scholar] [CrossRef] [PubMed]
- Johnson, M.E.; Zhao, X.; Faulkner, B.; Young, J.P. Statistical models of runway incursions based on runway intersections and taxiways. J. Aviat. Technol. Eng. 2016, 5, 3. [Google Scholar] [CrossRef]
- Schönefeld, J.; Möller, D. Runway Incursion Prevention Systems: A Review of Runway Incursion Avoidance and Alerting System Approaches. Prog. Aerosp. Sci. 2012, 51, 31–49. [Google Scholar] [CrossRef]
- Croft, J. Commercial Aviation Headway Made Curbing Airline Runway Incursions. Aviation Week & Space Technology. 2005. Available online: https://aviationweek.com/air-transport/headway-made-curbing-airline-runway-incursions (accessed on 1 December 2017).
- Claros, B.; Sun, C.; Edara, P. Airfield Incursion Modeling of United States Hub Airports. J. Air Transp. 2017, 25, 73–86. [Google Scholar] [CrossRef]
- Ison, D.C. Analysis of Runway Incursion Trends: Implications for Cost-Benefit Analysis of Mitigation Investments. Int. J. Aviat. Aeronaut. Aerosp. 2020, 7, 2. [Google Scholar] [CrossRef]
- Maharaj, I. General Aviation Airport Runway Incursions: A Qualitative Approach to Examining Reasons for, Barriers to Addressing, and Lessons Learned from Airport Managers’ First-Hand Experiences. Doctor Dissertation, Florida Institute of Technology, Melbourne, FL, USA, 2020. [Google Scholar]
- Van Eekeren, R.; Wright, S.; Čokorilo, O. Early cost safety analysis of runway events. Int. J. Traffic Transp. Eng. 2018, 8, 261–270. [Google Scholar]
- Qi, Y.; Smith, B.L.; Guo, J. Freeway accident likelihood prediction using a panel data analysis approach. J. Transp. Eng. 2007, 133, 149–156. [Google Scholar] [CrossRef]
- Mrazova, M. Runway incursions-clear and constant danger. Incas Bull. 2014, 6, 71. [Google Scholar]
- Wilke, S.; Majumdar, A.; Ochieng, W.Y. The impact of airport characteristics on airport surface accidents and incidents. J. Saf. Res. 2015, 53, 63–75. [Google Scholar] [CrossRef] [PubMed]
- Bisch, A.; Calabreses, C.; Donohoe, C. Runway Safety Analysis: Runway Incursion Characteristics and Mitigation Recommendations; U.S. Department of Transportation, Federal Aviation Administration: Washington, DC, USA, 2016. [Google Scholar]


| Year | Runway Incursion Occurrence |
|---|---|
| 1977 | In Tenerife, two commercial airplanes collided on the runway, killing 583 people. |
| 1983 | In Madrid, Spain, a runway collision involving two commercial aircraft resulted in 100 fatalities. |
| 1990 | When a North-West Airlines Boeing 727 and a DC-9 crashed on a foggy runway in Detroit, Michigan, eight persons were killed and thirty-six were injured. |
| 1990 | In Atlanta, Georgia, a small twin-engine aircraft that had not taxied off the runway collided with a Boeing 727 that was landing and caused one fatality. |
| 1991 | A Boeing 737 was landing at Los Angeles International Airport when it crashed with a commuter plane that was waiting on the runway, killing 34 passengers. |
| 1994 | In St. Louis, Missouri, the occupants of a tiny twin-engine plane were killed when the plane taxied into the path of a DC-9 landing on the same runway. |
| 1996 | 14 people were killed when a twin-engine business plane taxied onto a runway at an unattended airport in Quincy, Illinois, as a commuter plane was touching down. |
| 1999 | A commercial airliner on takeoff came within 300 feet of another commercial airliner that had taxied onto the runway in four consecutive occurrences (two at Chicago O’Hare, one at Los Angeles, and one at JFK in New York). |
| 1999 | Two single-engine private planes collided on a runway near Sarasota, Florida, killing four persons. |
| 2000 | In Taiwan, a Singapore Airlines B-747 took off at night during a typhoon on a blocked runway before colliding with construction machinery and causing the deaths of 82 people. |
| 2012 | During a touch-and-go attempt, a Cessna 172N Ram killed a person mowing the grass at Tone Airfield. |
| 2014 | On takeoff from Moscow Vnukovo Airport, a Dassault Falcon 50 crashed with a snowplow that had strayed onto the runway, killing the CEO and Chairman of the oil company Total, Christophe de Margerie. |
| 2020 | The Austin-Bergstrom International Airport was invaded by an adult male invader who made his way to runway 17R before being hit and killed by a Boeing 737-7H4 Southwest Airlines Flight 1392 as it touched down at the airport. There were no injuries or fatalities among the 58 individuals on board, but the 737’s left engine nacelle incurred significant damage. |
| Definition | Criteria | Also Referred to As |
|---|---|---|
| Commercial Service: Publicly owned airports with at least 2500 annual enplanements and scheduled air carrier service. Primary airports are commercial service airports with more than 10,000 annual enplanements. | ||
| Large Hub |
Receives 1 percent or more of the annual U.S. commercial enplanements | Primary |
| Medium Hub |
Receives from 0.25 to 1.0 percent of the annual U.S. commercial enplanements | Primary |
| Small Hub |
Receives from 0.05 to 0.25 percent of the annual U.S. commercial enplanements | Primary |
| Airport | ID | Airport | ID |
|---|---|---|---|
| Hartsfield-Jackson Atlanta International | ATL | Los Angeles International | LAX |
| General Edward Lawrence Logan International | BOS | Laguardia | LGA |
| Baltimore/Washington International Thurgood Marshall | BWI | Orlando International | MCO |
| Charlotte/Douglas International | CLT | Chicago Midway International | MDW |
| Ronald Reagan Washington National | DCA | Miami International | MIA |
| Denver International | DEN | Minneapolis-St Paul International/Wold-Chamberlain | MSP |
| Dallas-Fort Worth International | DFW | Chicago O’Hare International | ORD |
| Detroit Metropolitan Wayne County | DTW | Portland International | PDX |
| Newark Liberty International | EWR | Philadelphia International | PHL |
| Fort Lauderdale/Hollywood International | FLL | Phoenix Sky Harbor International | PHX |
| Daniel K Inouye International | HNL | San Diego International | SAN |
| Washington Dulles International | IAD | Seattle-Tacoma International | SEA |
| George Bush Intercontinental/Houston | IAH | San Francisco International | SFO |
| John F Kennedy International | JFK | Salt Lake City International | SLC |
| McCarran International | LAS | Tampa International | TPA |
| Variables | Description |
|---|---|
| Dependent Variable | |
| Levels of severity A and B | The total number of runway incursions at severity levels A and B per year at an airport. |
| Independent Variables | |
| RWY_RWY | The total number of runway-to-runway intersecting points at an airport. |
| ASDE-X Tech | A runway incursion surface surveillance mitigation technology. |
| RWSL Tech | A runway Incursion mitigation technology. |
| Num of RWY | The total number of runways in each airport. |
| Total RWY Length | The addition of the entire runway length. |
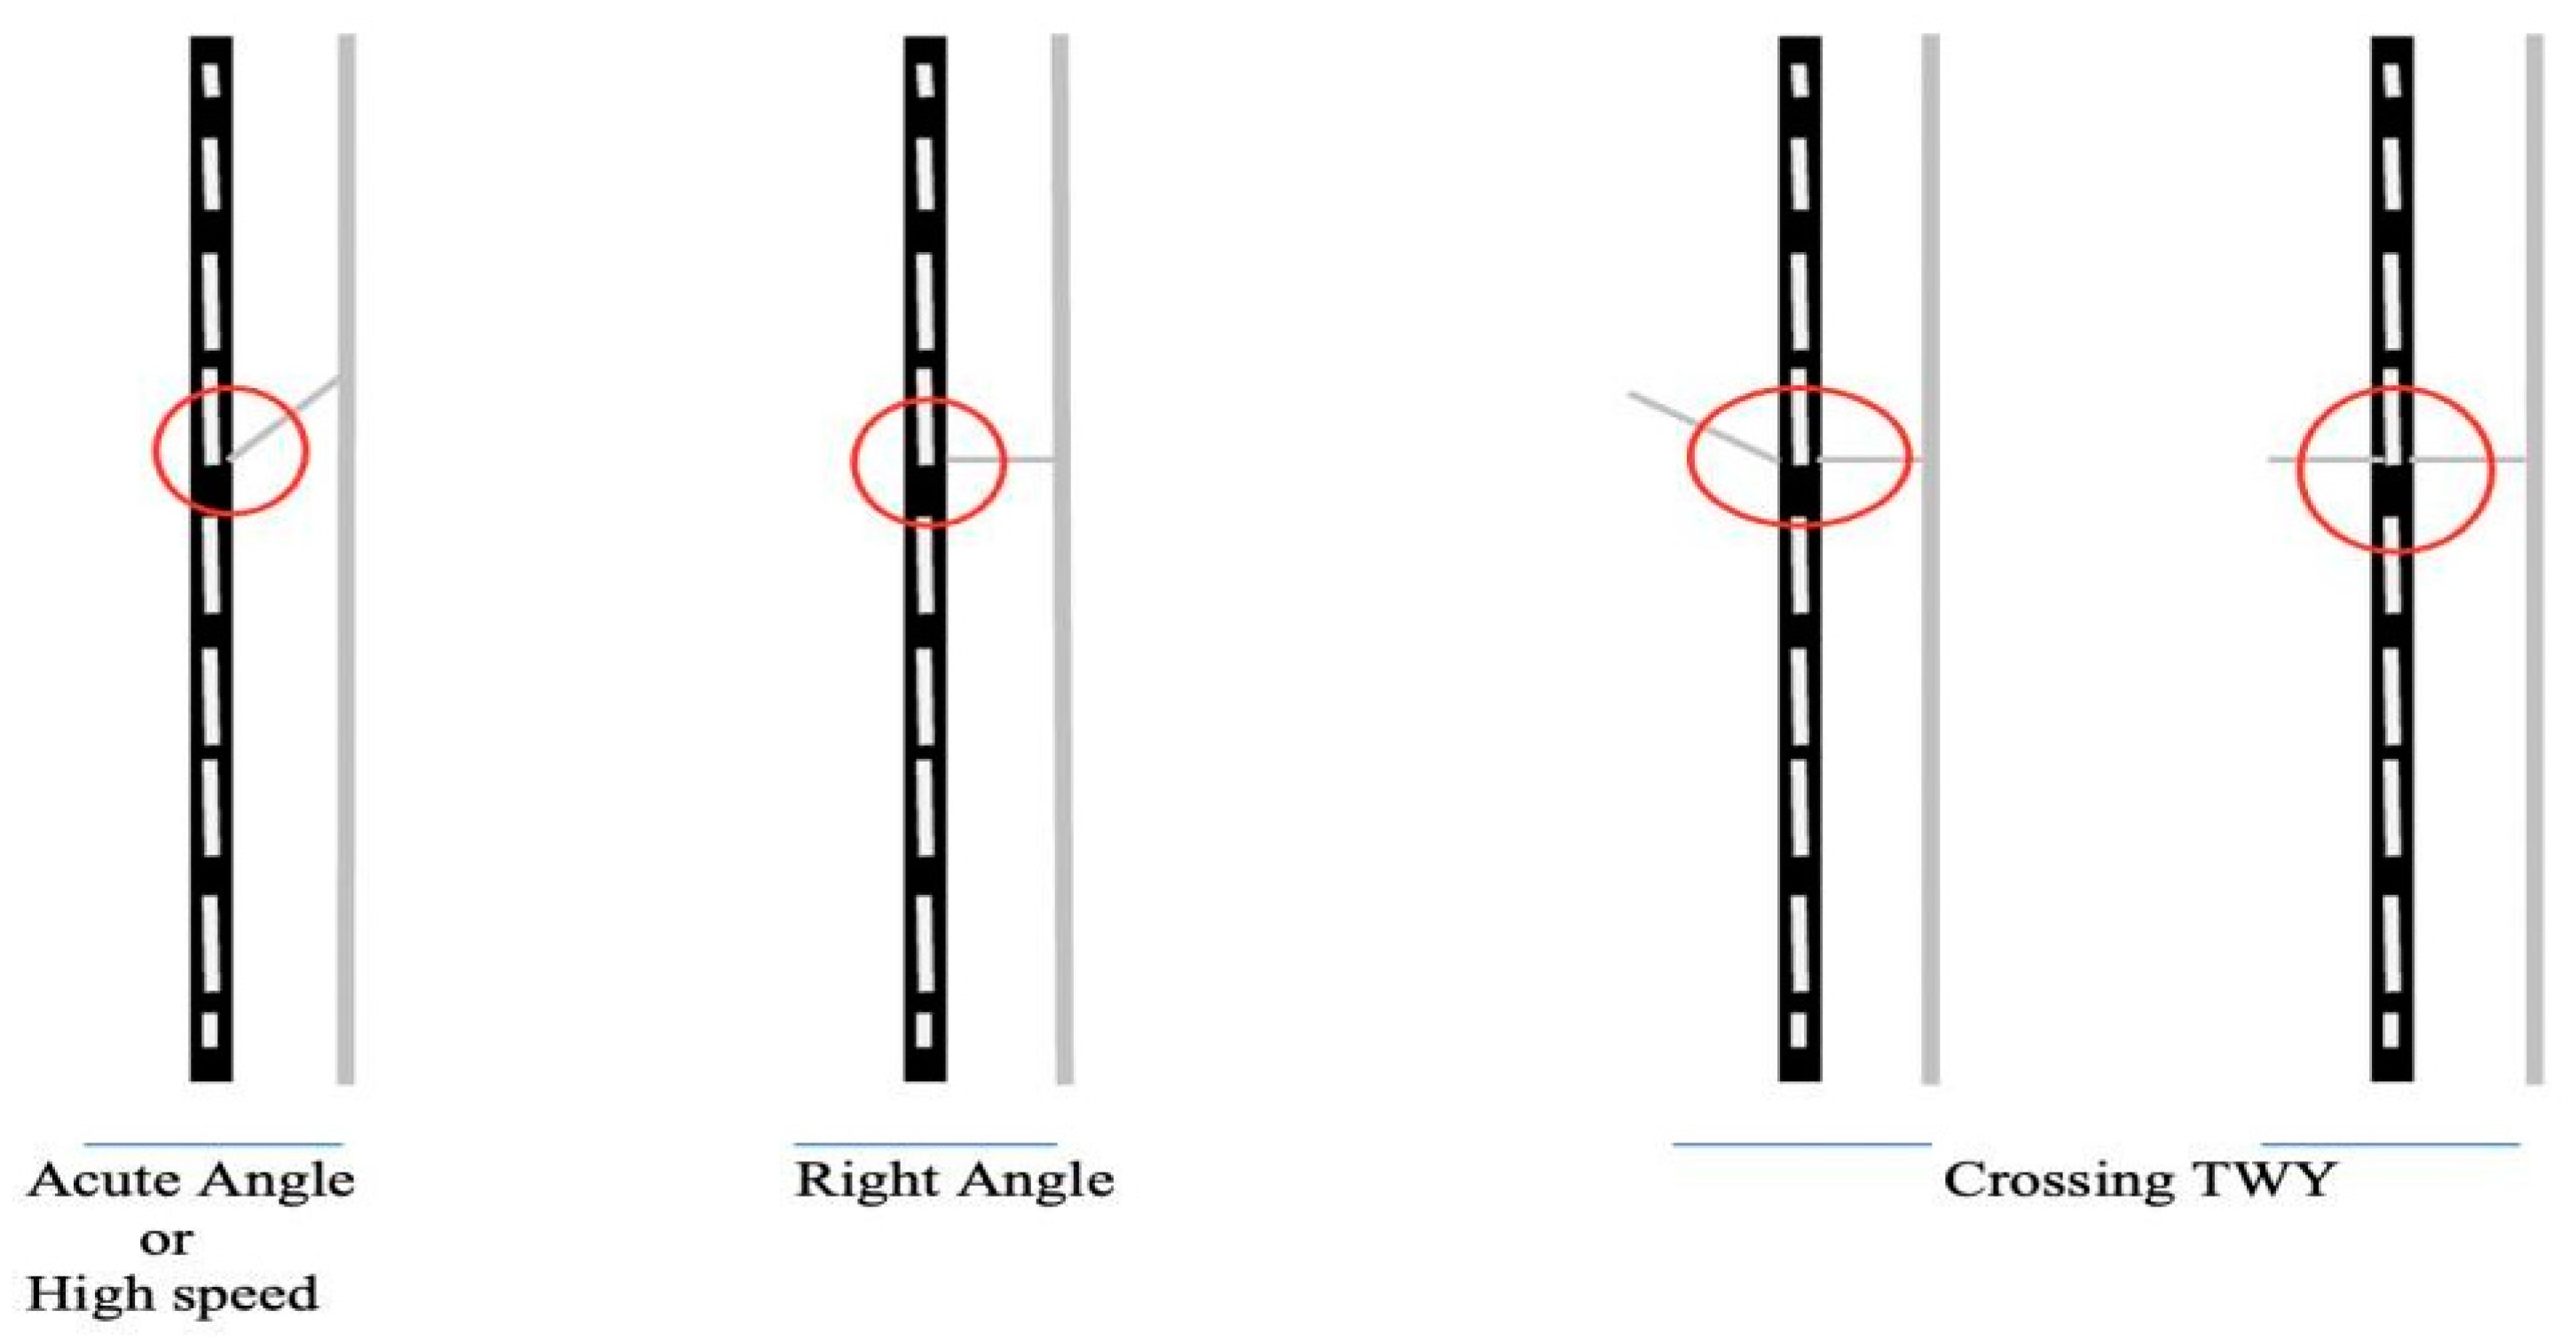
| Acute Angle | A taxiway exit turn that is less than 90 degrees. |
| Right Angle | Runway and taxiway turns that are 90 degrees. |
| Crossing TWY | A taxiway that crosses or intersects a runway or taxiway; they are opposite to each other. |
| AirportOperation_100000 | Total annual takeoffs and landings of aircraft at an airport (in 100,000) |
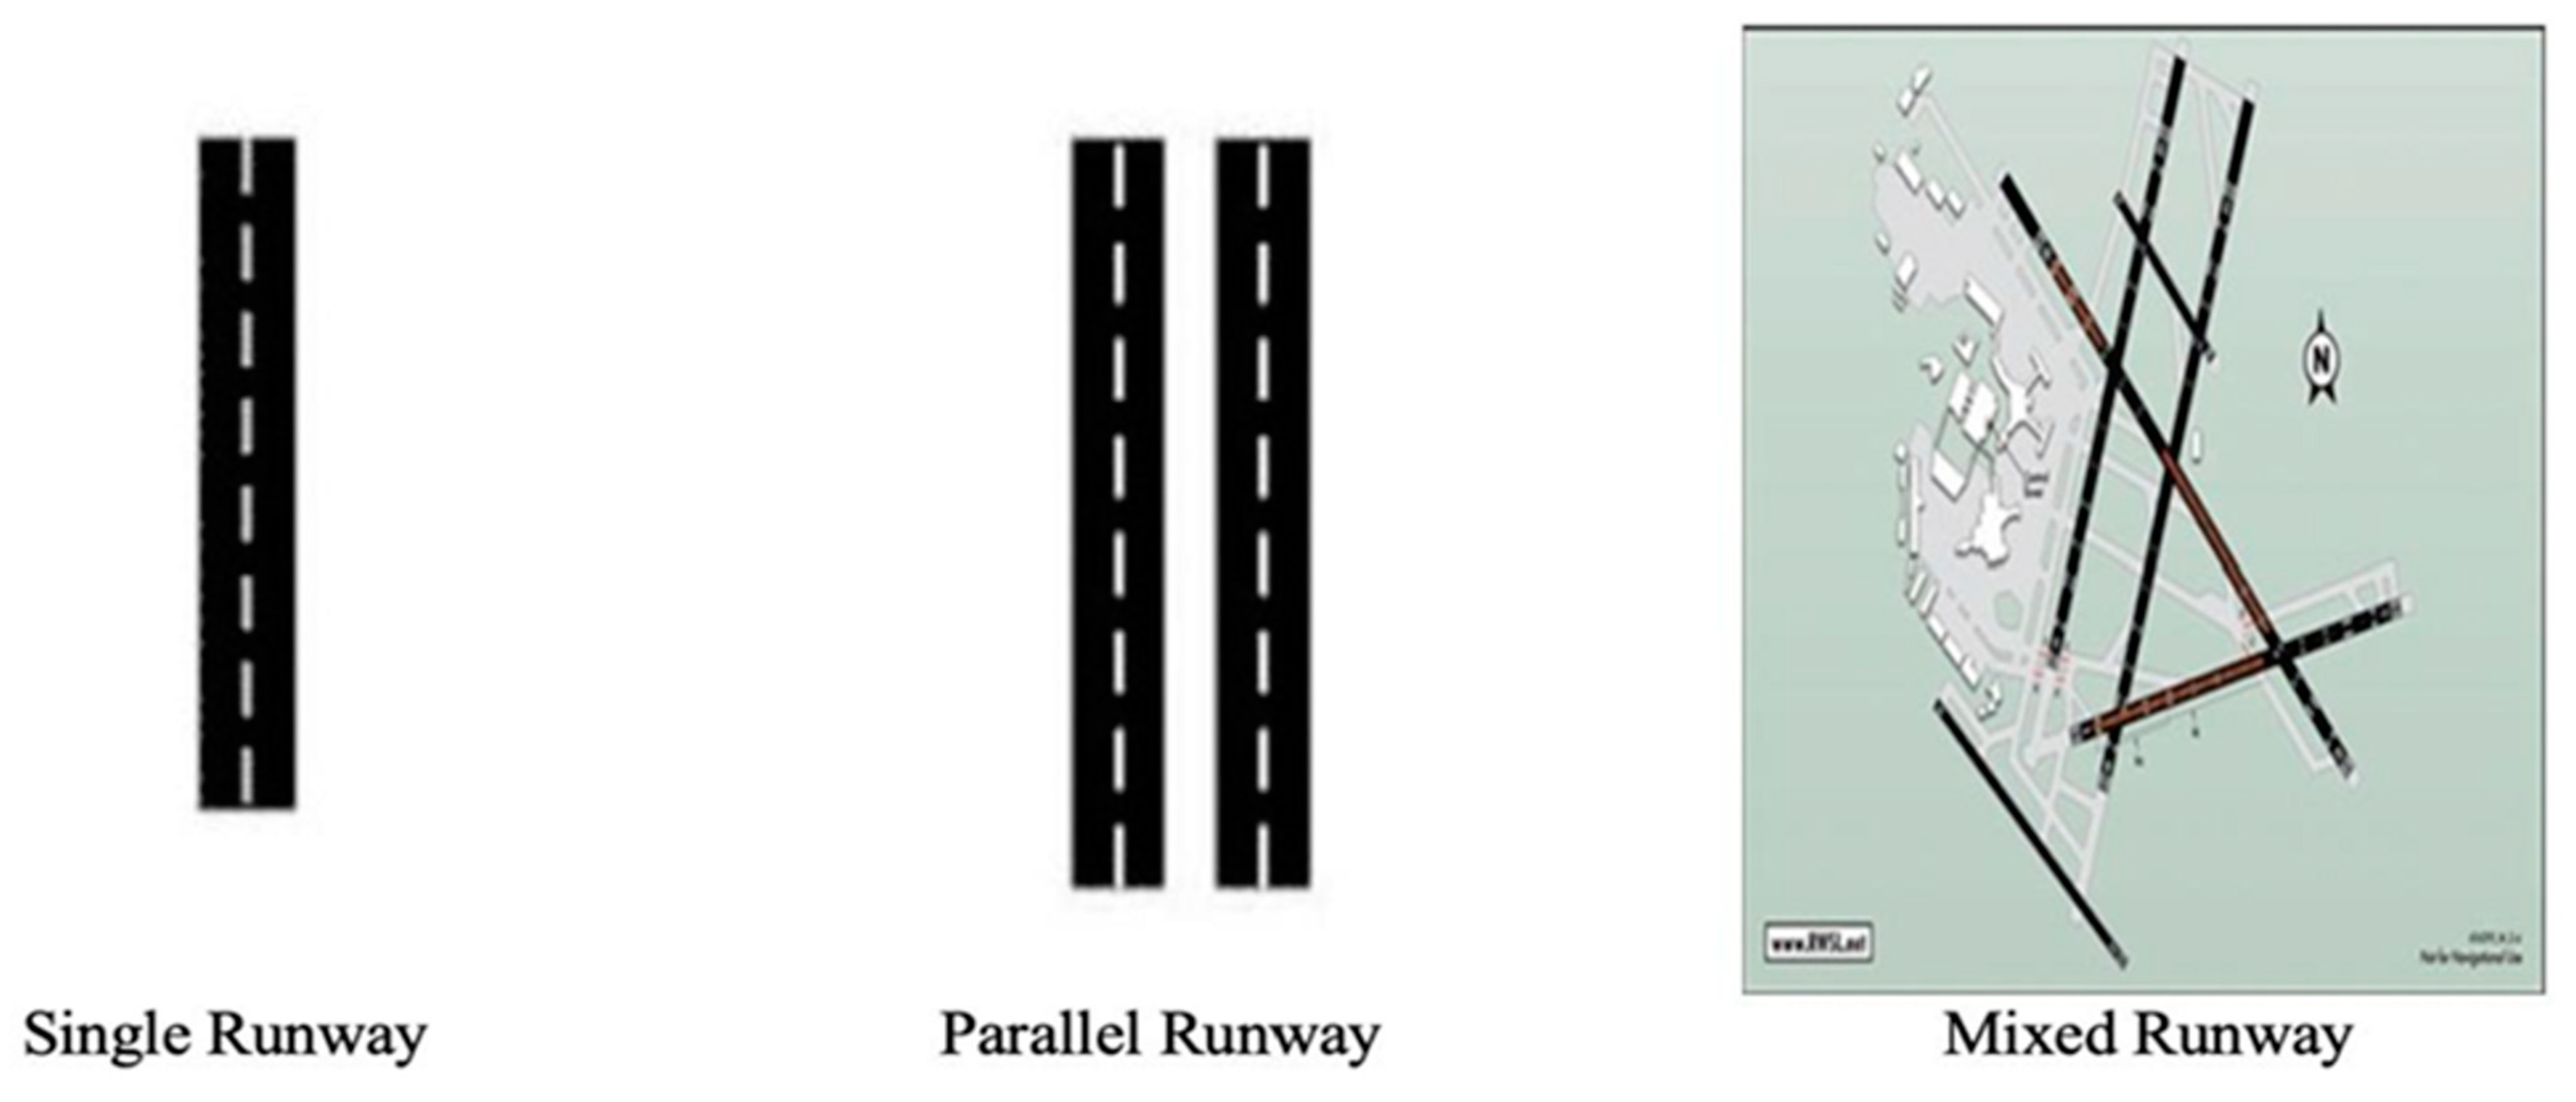
| Single RWY | The single runway at an airport which is used for both takeoffs and landings. |
| Parallel RWY | Two or more runways at an airport whose centerlines are parallel. |
| Mixed Runway | Airports with both single and parallel runways. |
| Crossing Runway | Airports with runways that intersect with other runways. |
| Estimate Std | Error | t Value | Pr (>t) | |
|---|---|---|---|---|
| (Intercept) | −2.42091 | 0.44788 | −5.405 | 6.47 × 10⁻⁸ |
| AirportOperation_100000 | 0.09830 | 0.08018 | 1.226 | 0.2202 |
| RWY_RWY | 0.12056 | 0.09002 | 1.339 | 0.1805 |
| RWSLTech | −0.76002 | 0.32653 | −2.328 | 0.0199 |
| sigma | 3.02392 | 1.90586 | 1.587 | 0.1126 |
| Sample size | 570 | |||
| Estimate Std | Error | t Value | Pr (>t) | |
|---|---|---|---|---|
| (Intercept) | −2.43117 | 0.47353 | −5.134 | 2.83 × 10⁻⁷ |
| AirportOperation_100000 | 0.11426 | 0.11426 | 1.385 | 0.1661 |
| RWY_RWY | 0.11884 | 0.09515 | 1.249 | 0.2117 |
| ASDEXTech | −0.38954 | 0.23128 | −1.684 | 0.0921 |
| sigma | 2.45914 | 1.38745 | 1.772 | 0.0763 |
| Sample size | 570 | |||
Disclaimer/Publisher’s Note: The statements, opinions and data contained in all publications are solely those of the individual author(s) and contributor(s) and not of MDPI and/or the editor(s). MDPI and/or the editor(s) disclaim responsibility for any injury to people or property resulting from any ideas, methods, instructions or products referred to in the content. |
© 2023 by the authors. Licensee MDPI, Basel, Switzerland. This article is an open access article distributed under the terms and conditions of the Creative Commons Attribution (CC BY) license (https://creativecommons.org/licenses/by/4.0/).
Share and Cite
Omosebi, O.; Azimi, M.; Olowokere, D.; Wanyan, Y.; Zhao, Q.; Qi, Y. Investigating Runway Incursion Incidents at United States Airports. Future Transp. 2023, 3, 1209-1222. https://doi.org/10.3390/futuretransp3040066
Omosebi O, Azimi M, Olowokere D, Wanyan Y, Zhao Q, Qi Y. Investigating Runway Incursion Incidents at United States Airports. Future Transportation. 2023; 3(4):1209-1222. https://doi.org/10.3390/futuretransp3040066
Chicago/Turabian StyleOmosebi, Olajumoke, Mehdi Azimi, David Olowokere, Yachi Wanyan, Qun Zhao, and Yi Qi. 2023. "Investigating Runway Incursion Incidents at United States Airports" Future Transportation 3, no. 4: 1209-1222. https://doi.org/10.3390/futuretransp3040066