
The Impact of Pedestrian Distraction on Safety Behaviours at Controlled and Uncontrolled Crossings

Abstract
:1. Introduction
1.1. Literature Review
1.2. Research Questions
2. Method
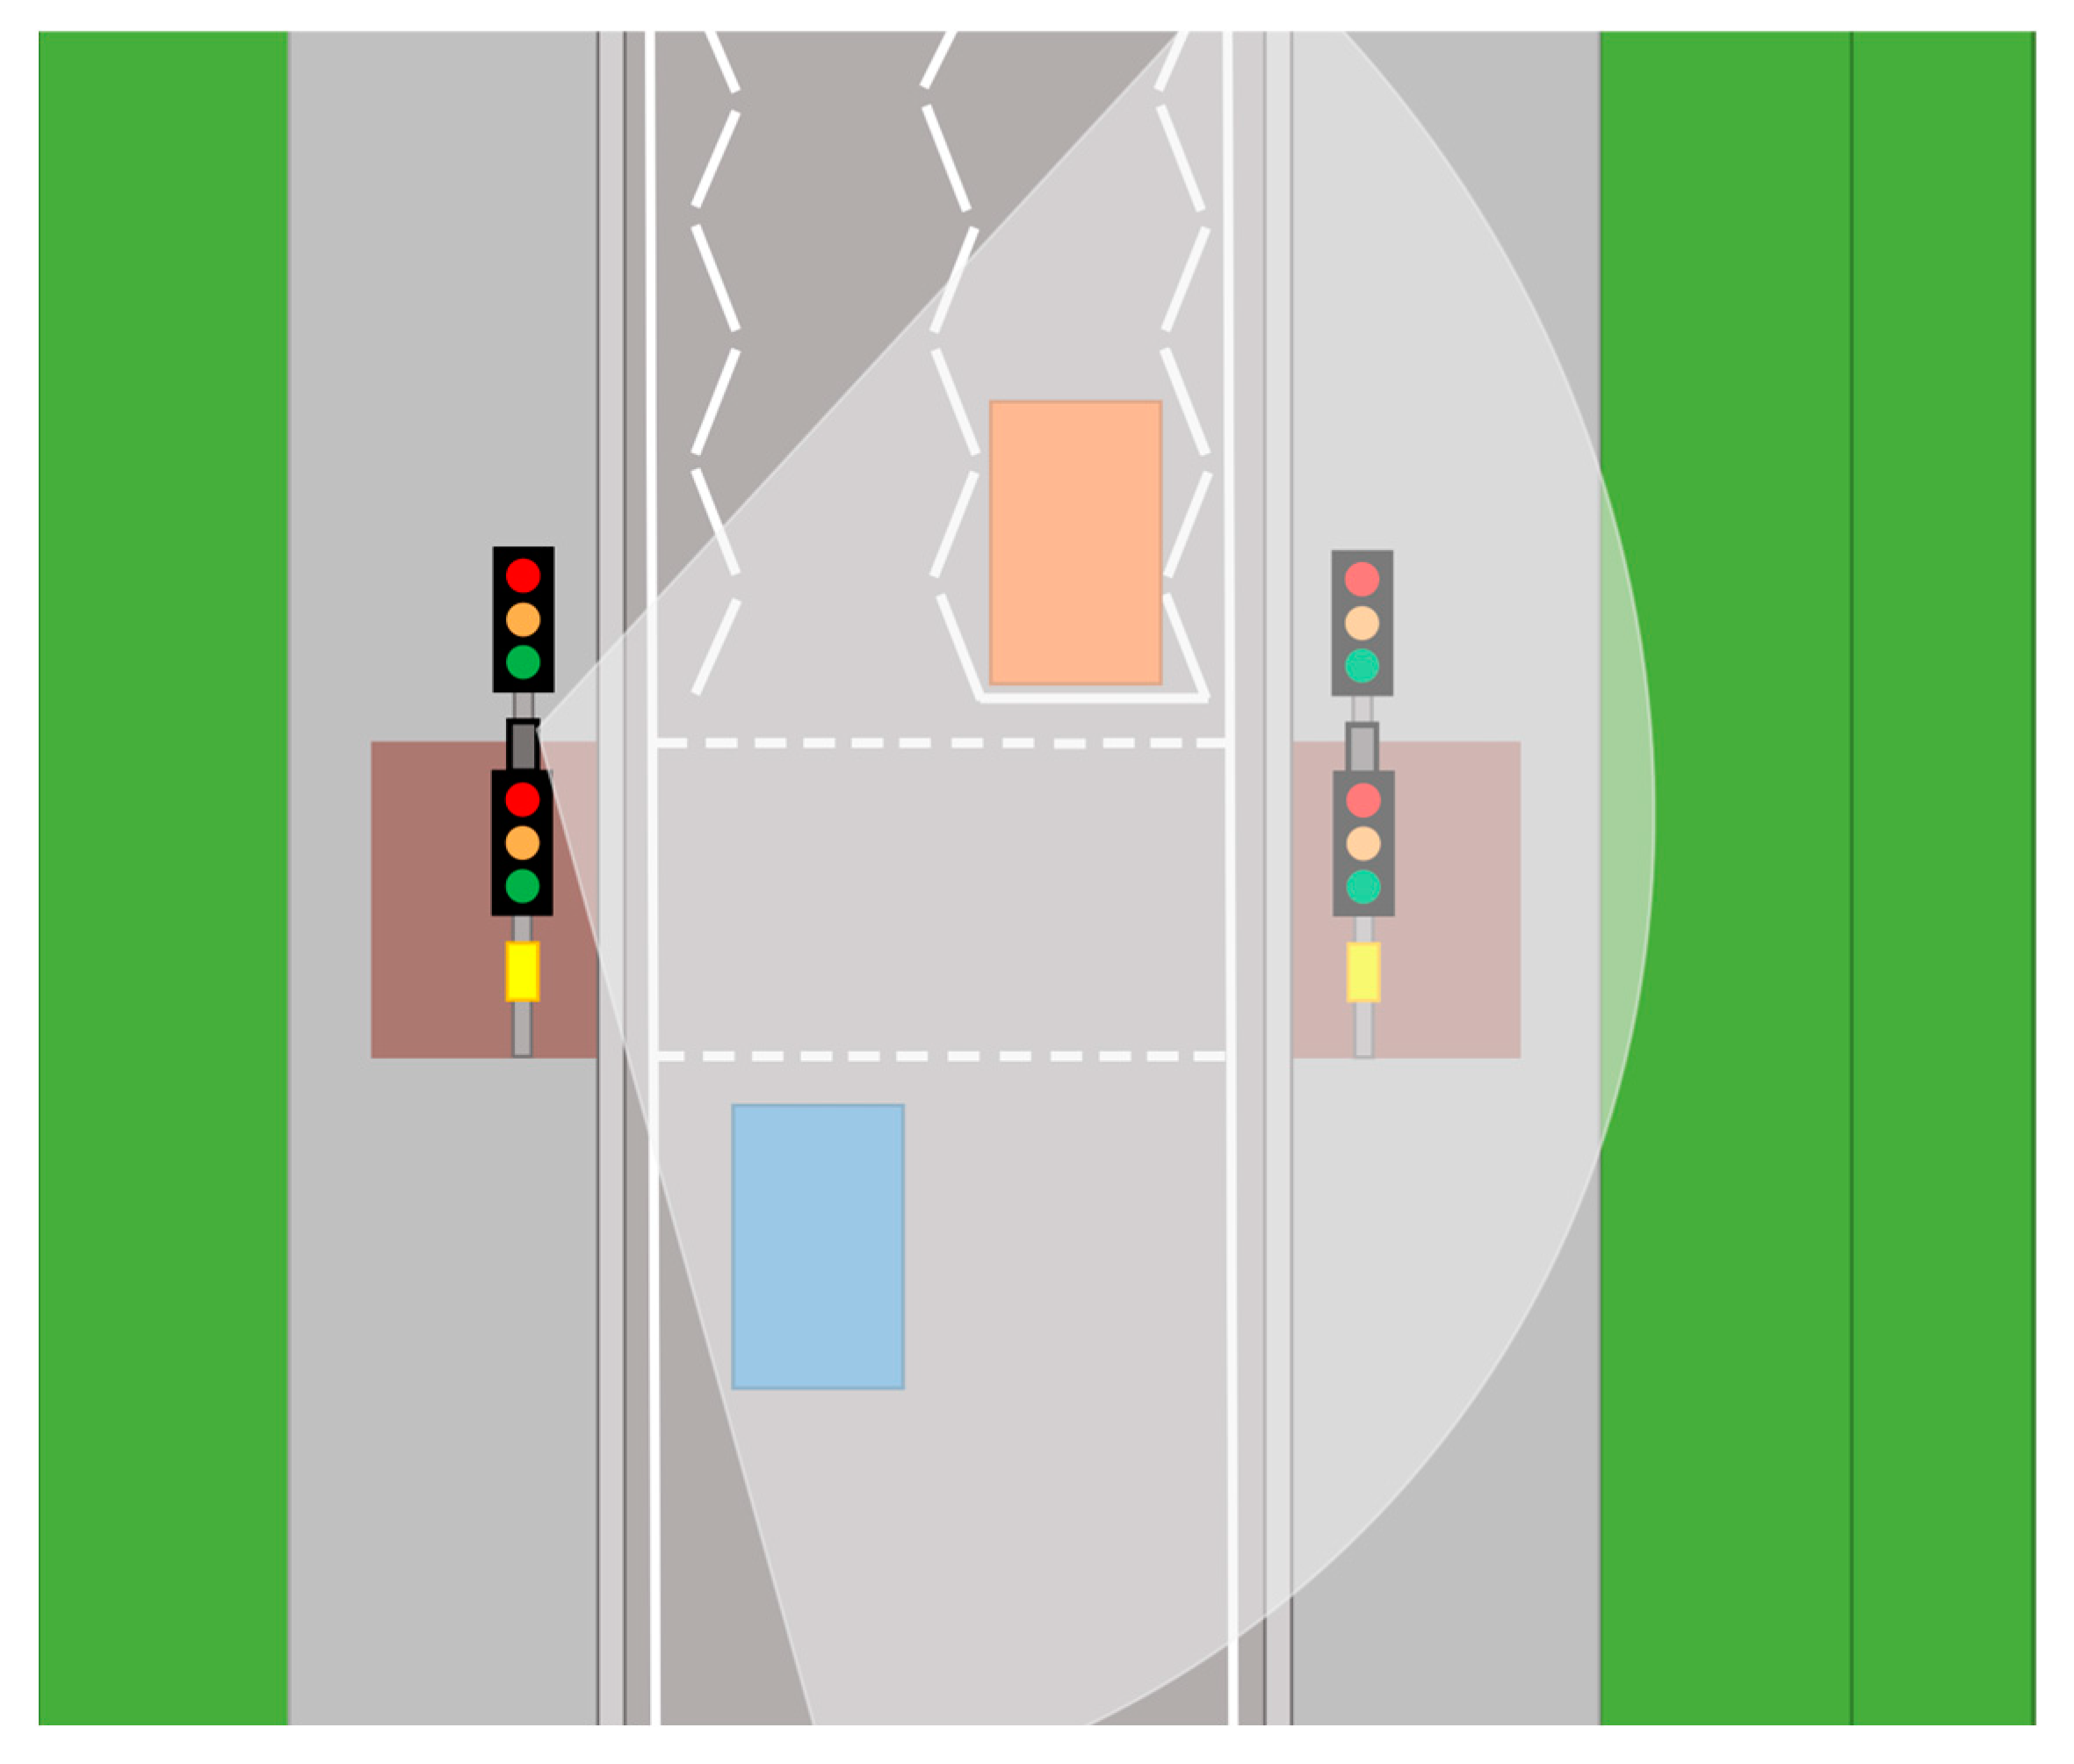
2.1. Site Locations
2.2. Procedure
2.3. Observation Criteria
2.4. Data Coding and Satistical Analyses
3. Results
3.1. Overall Data
3.2. Distraction and Safety Behaviours
3.2.1. Crossing Time and Crossing Initiation
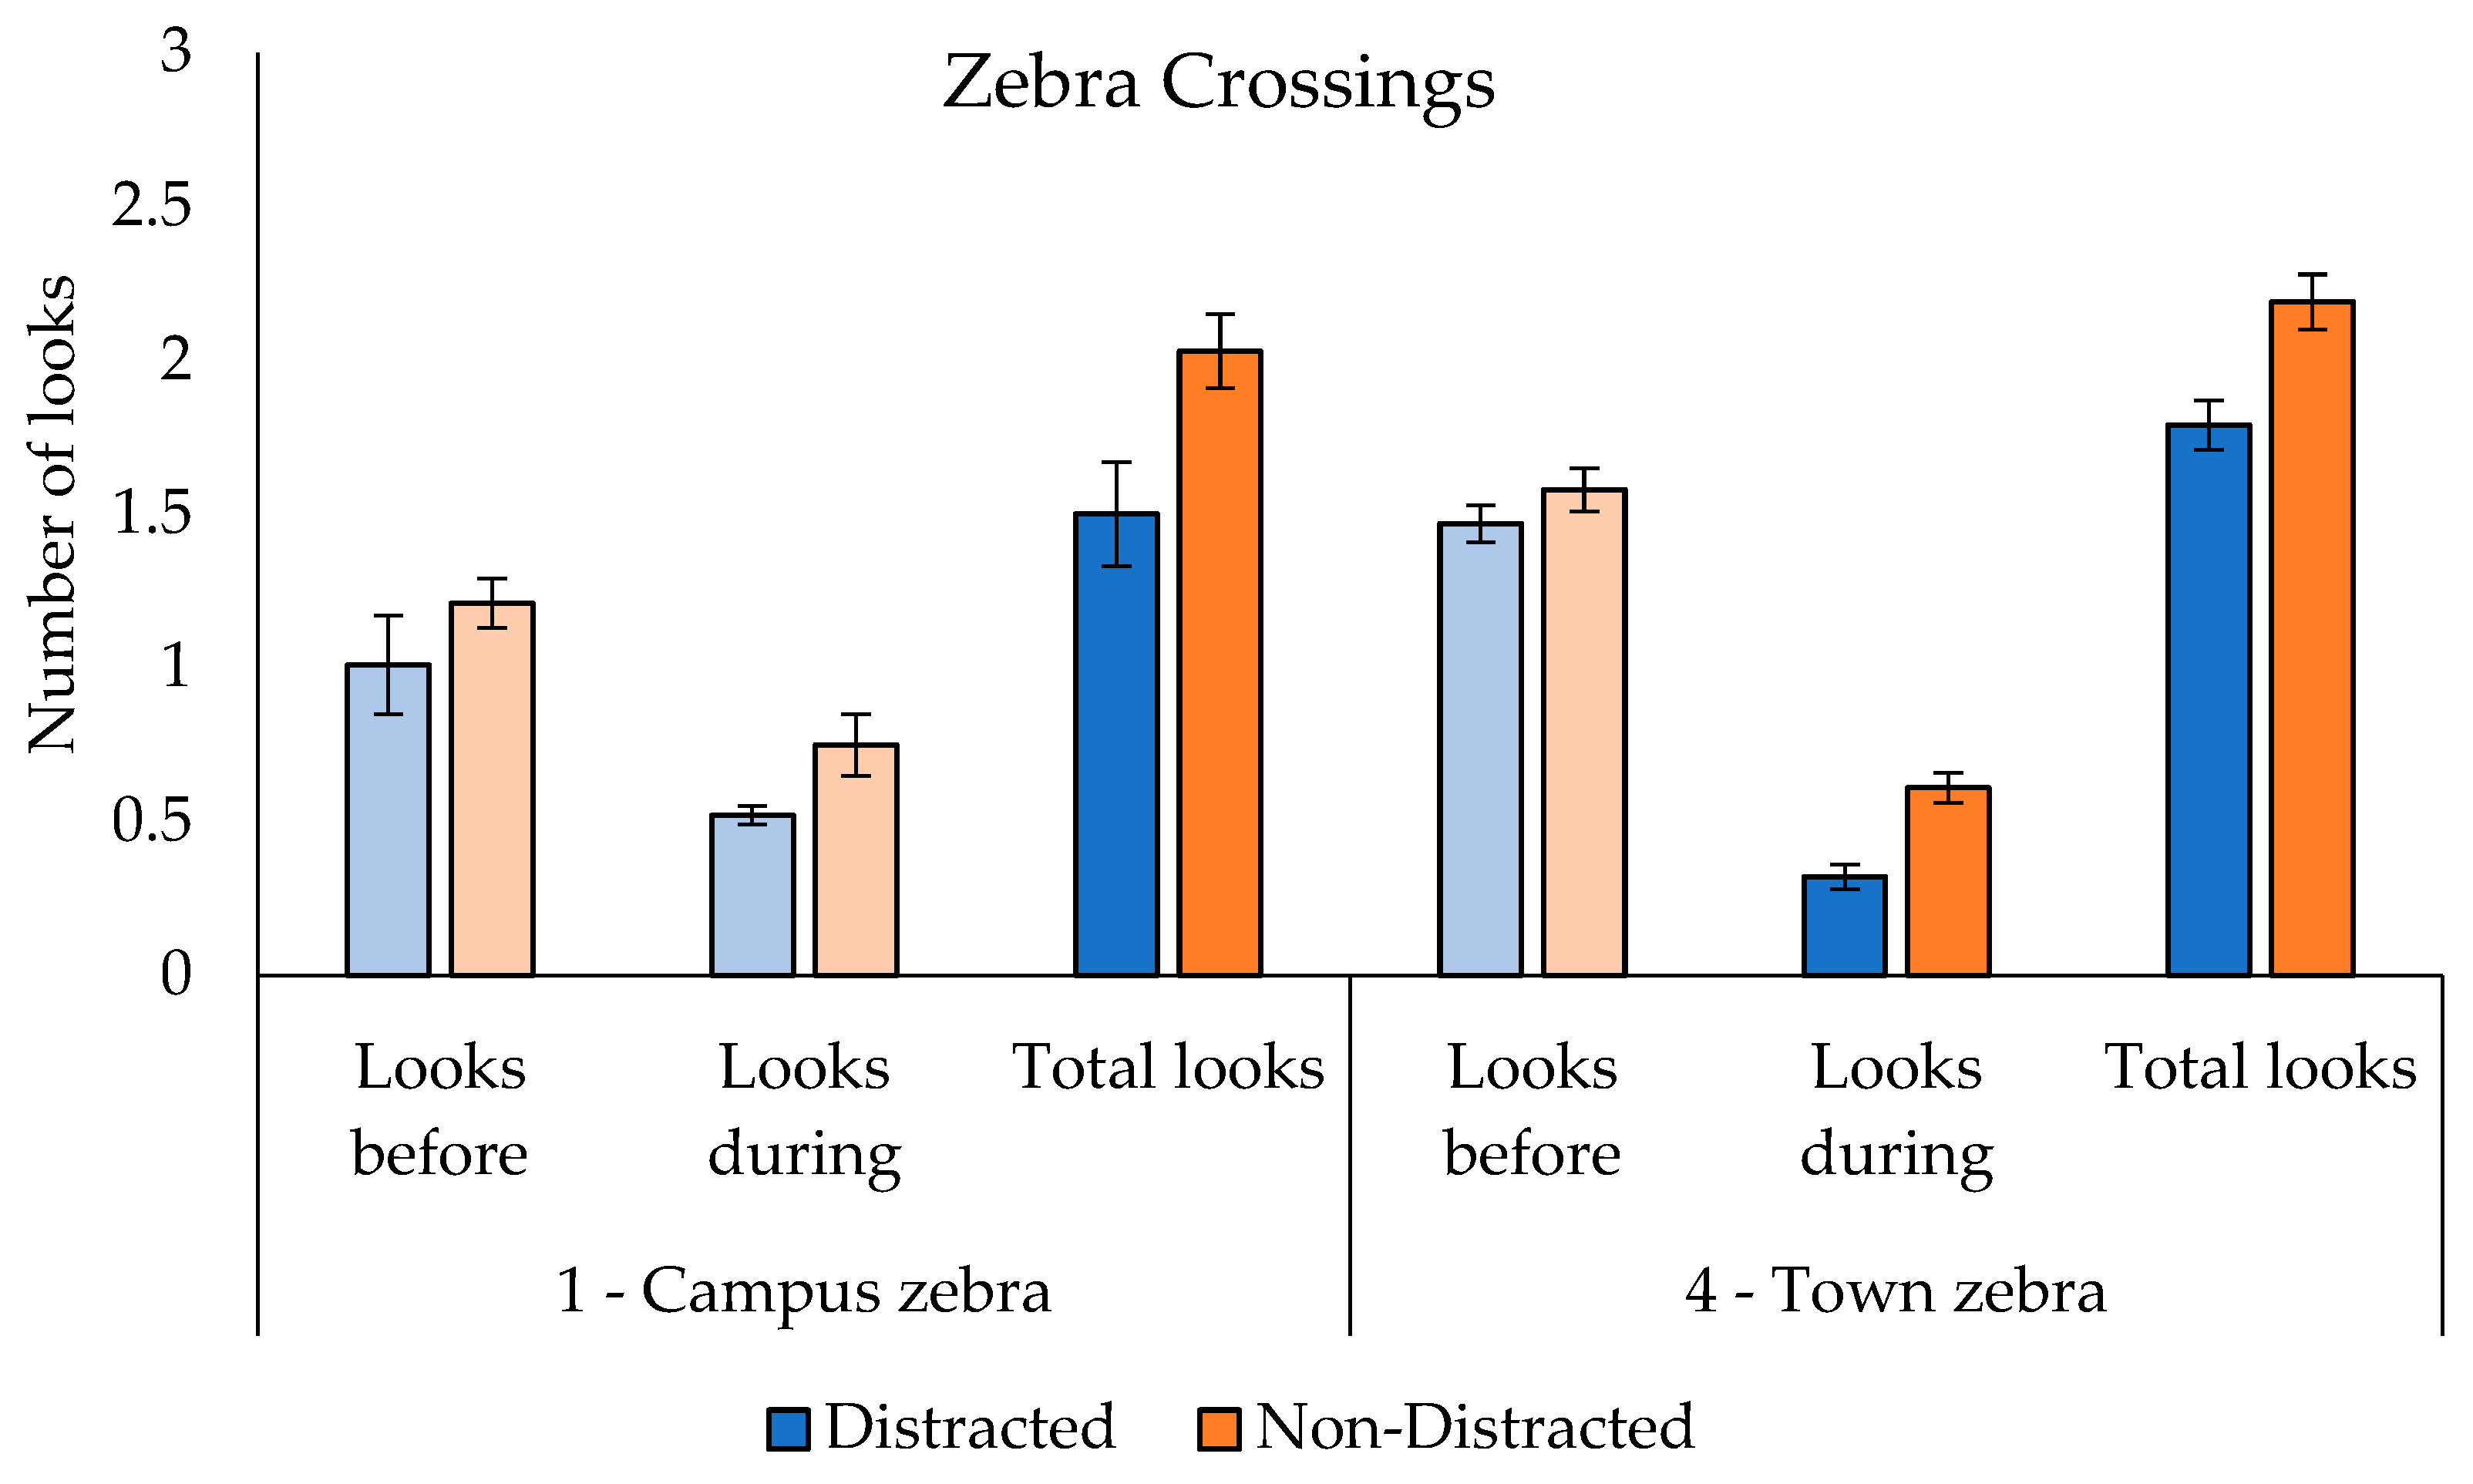
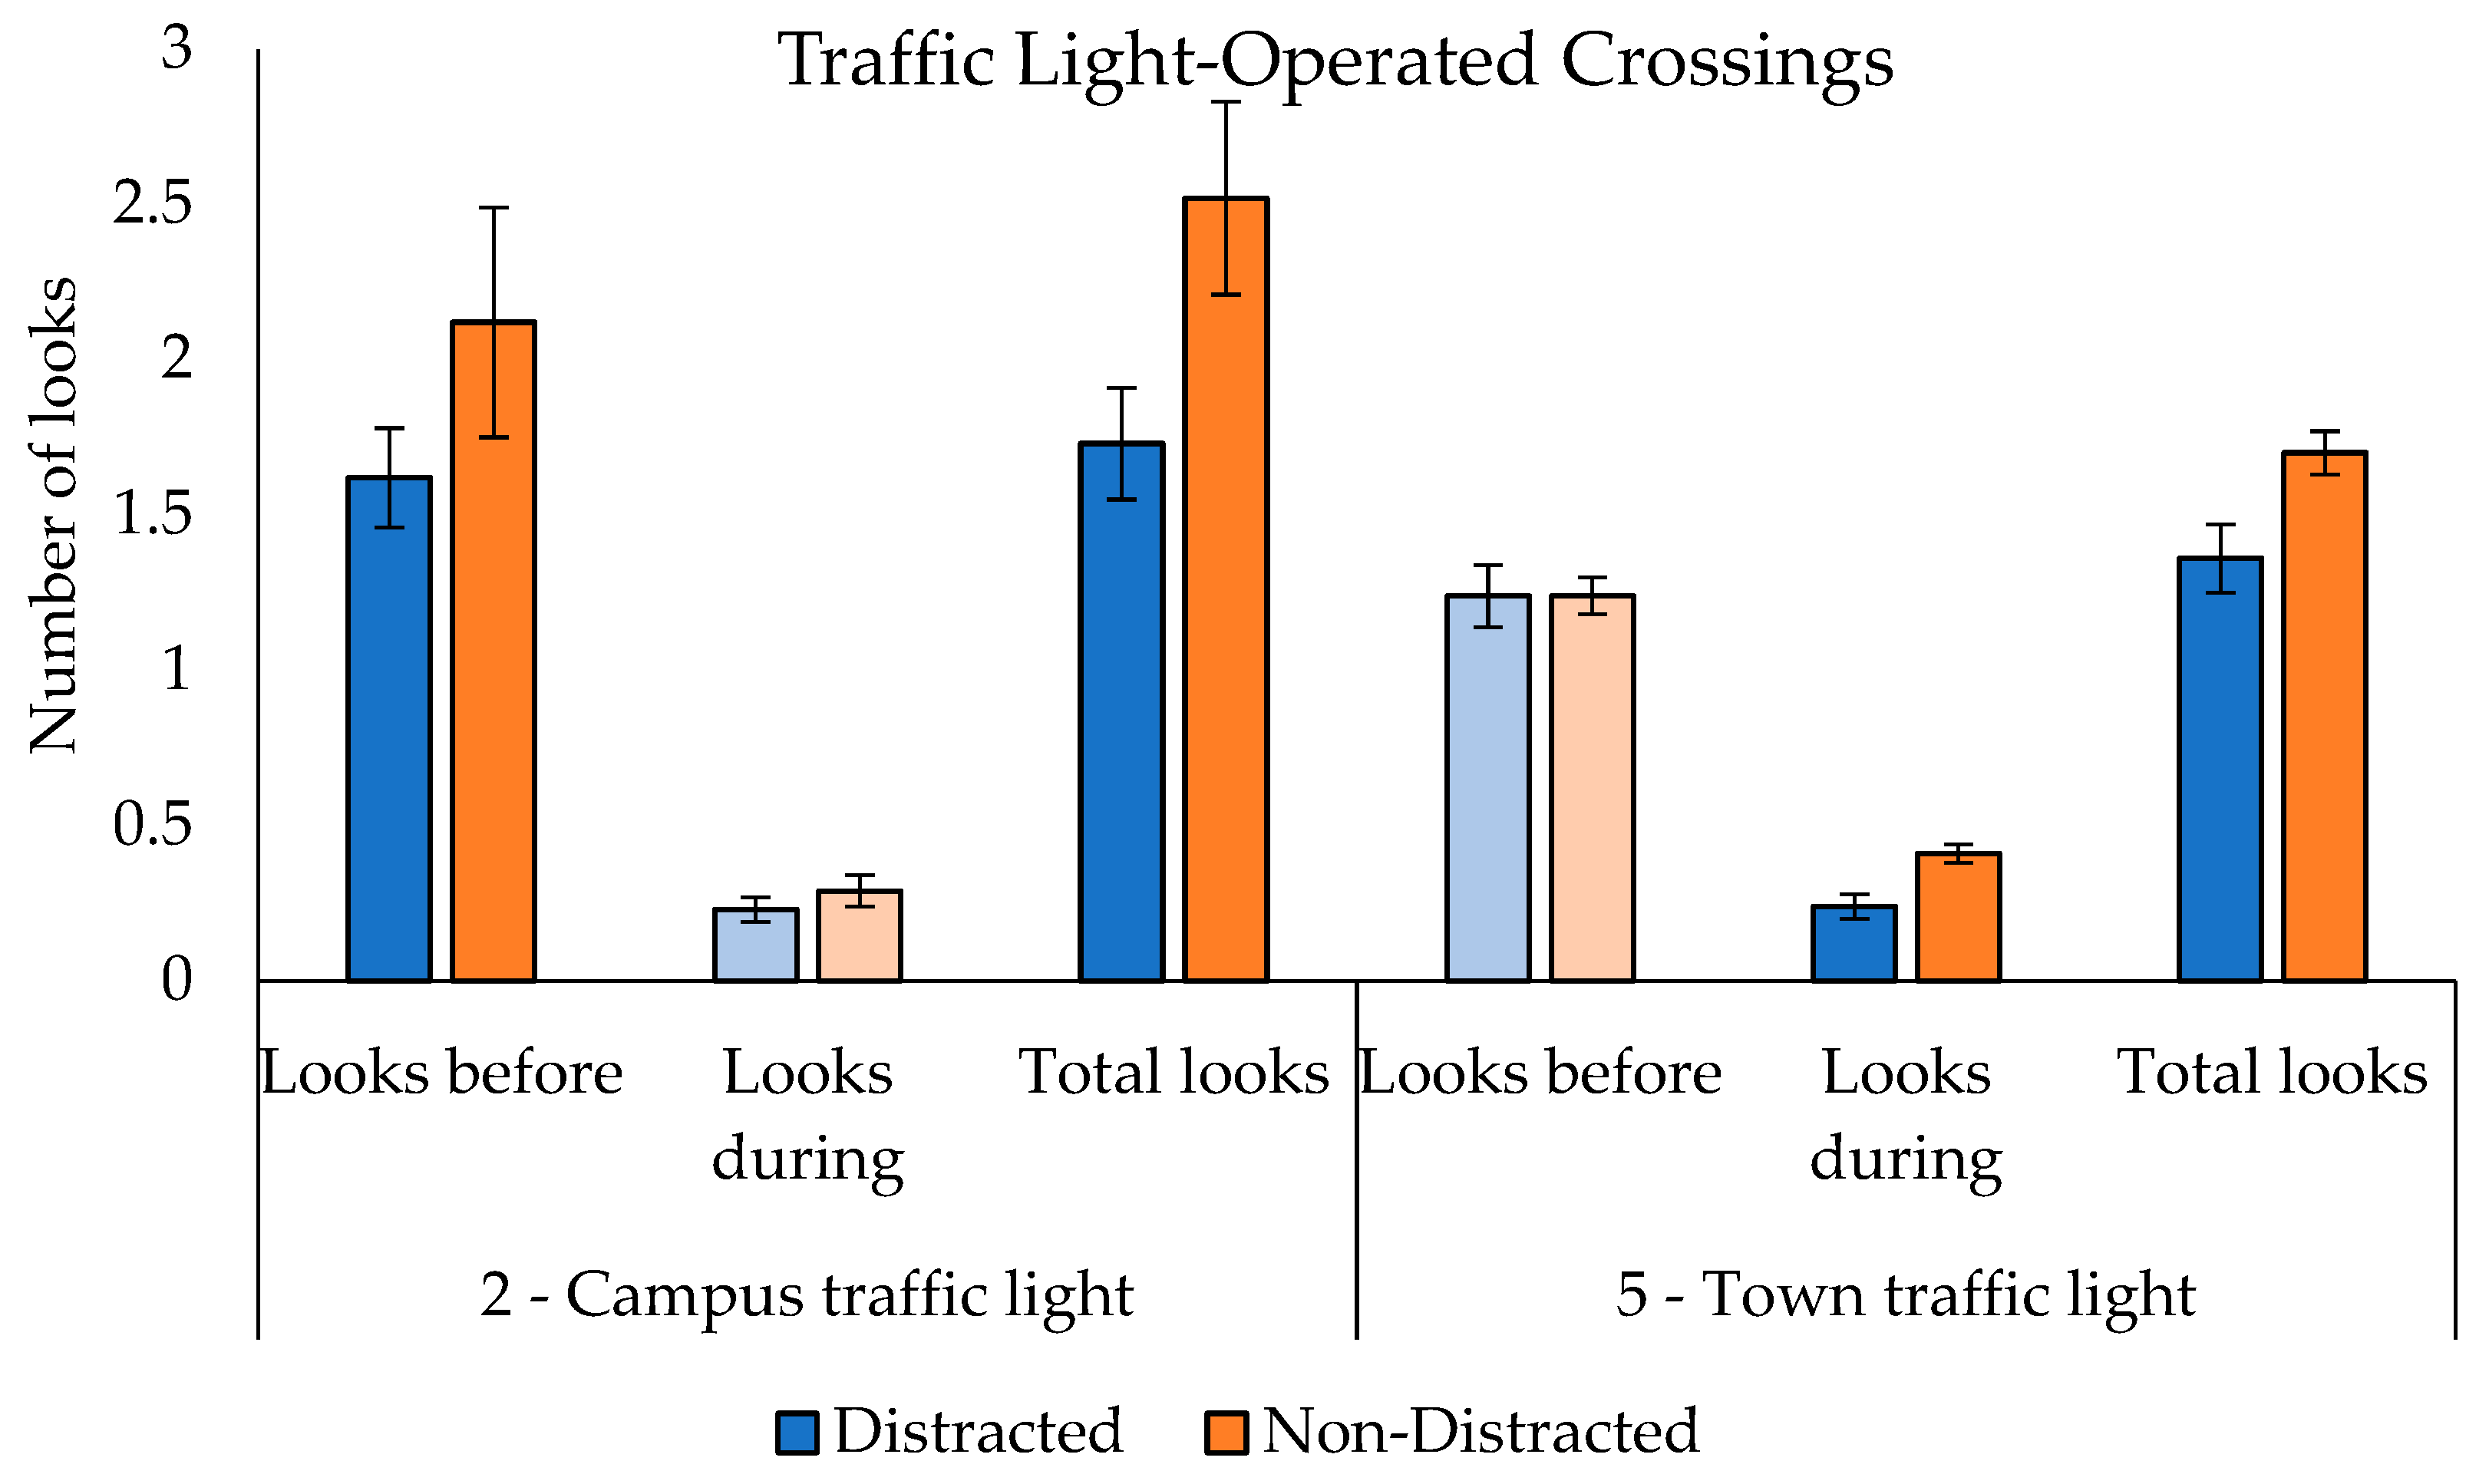
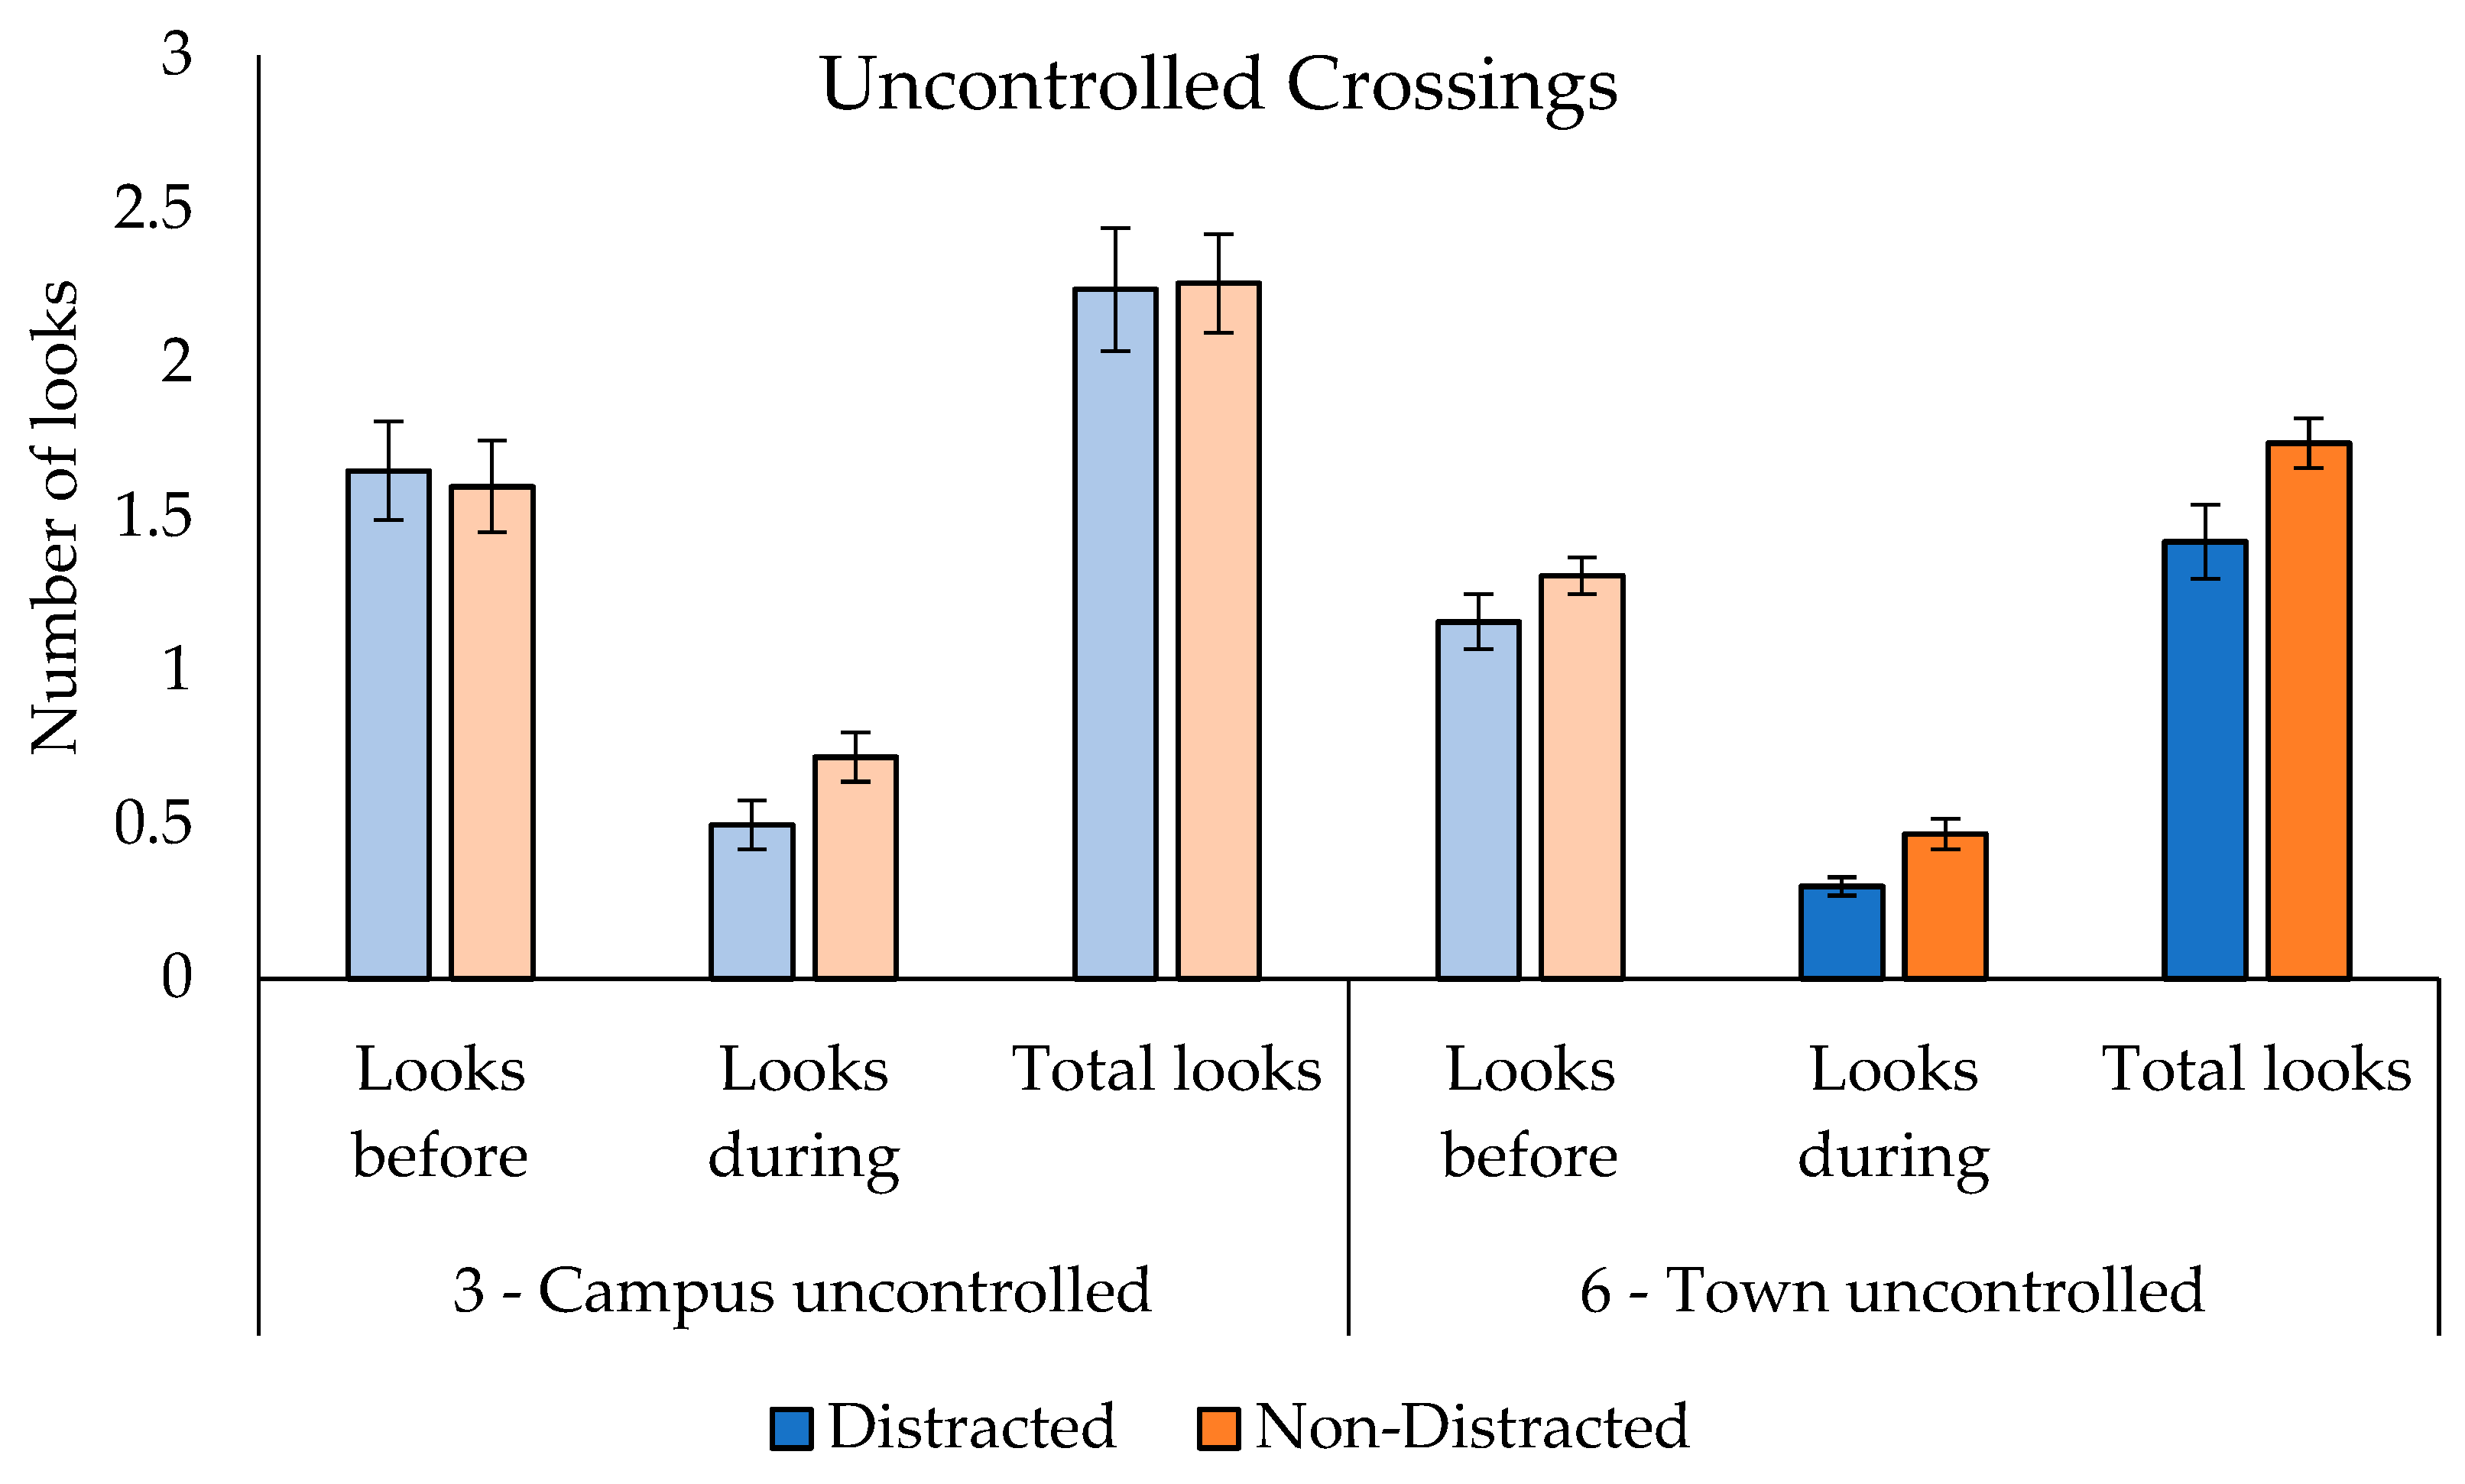
3.2.2. Visual Behaviour
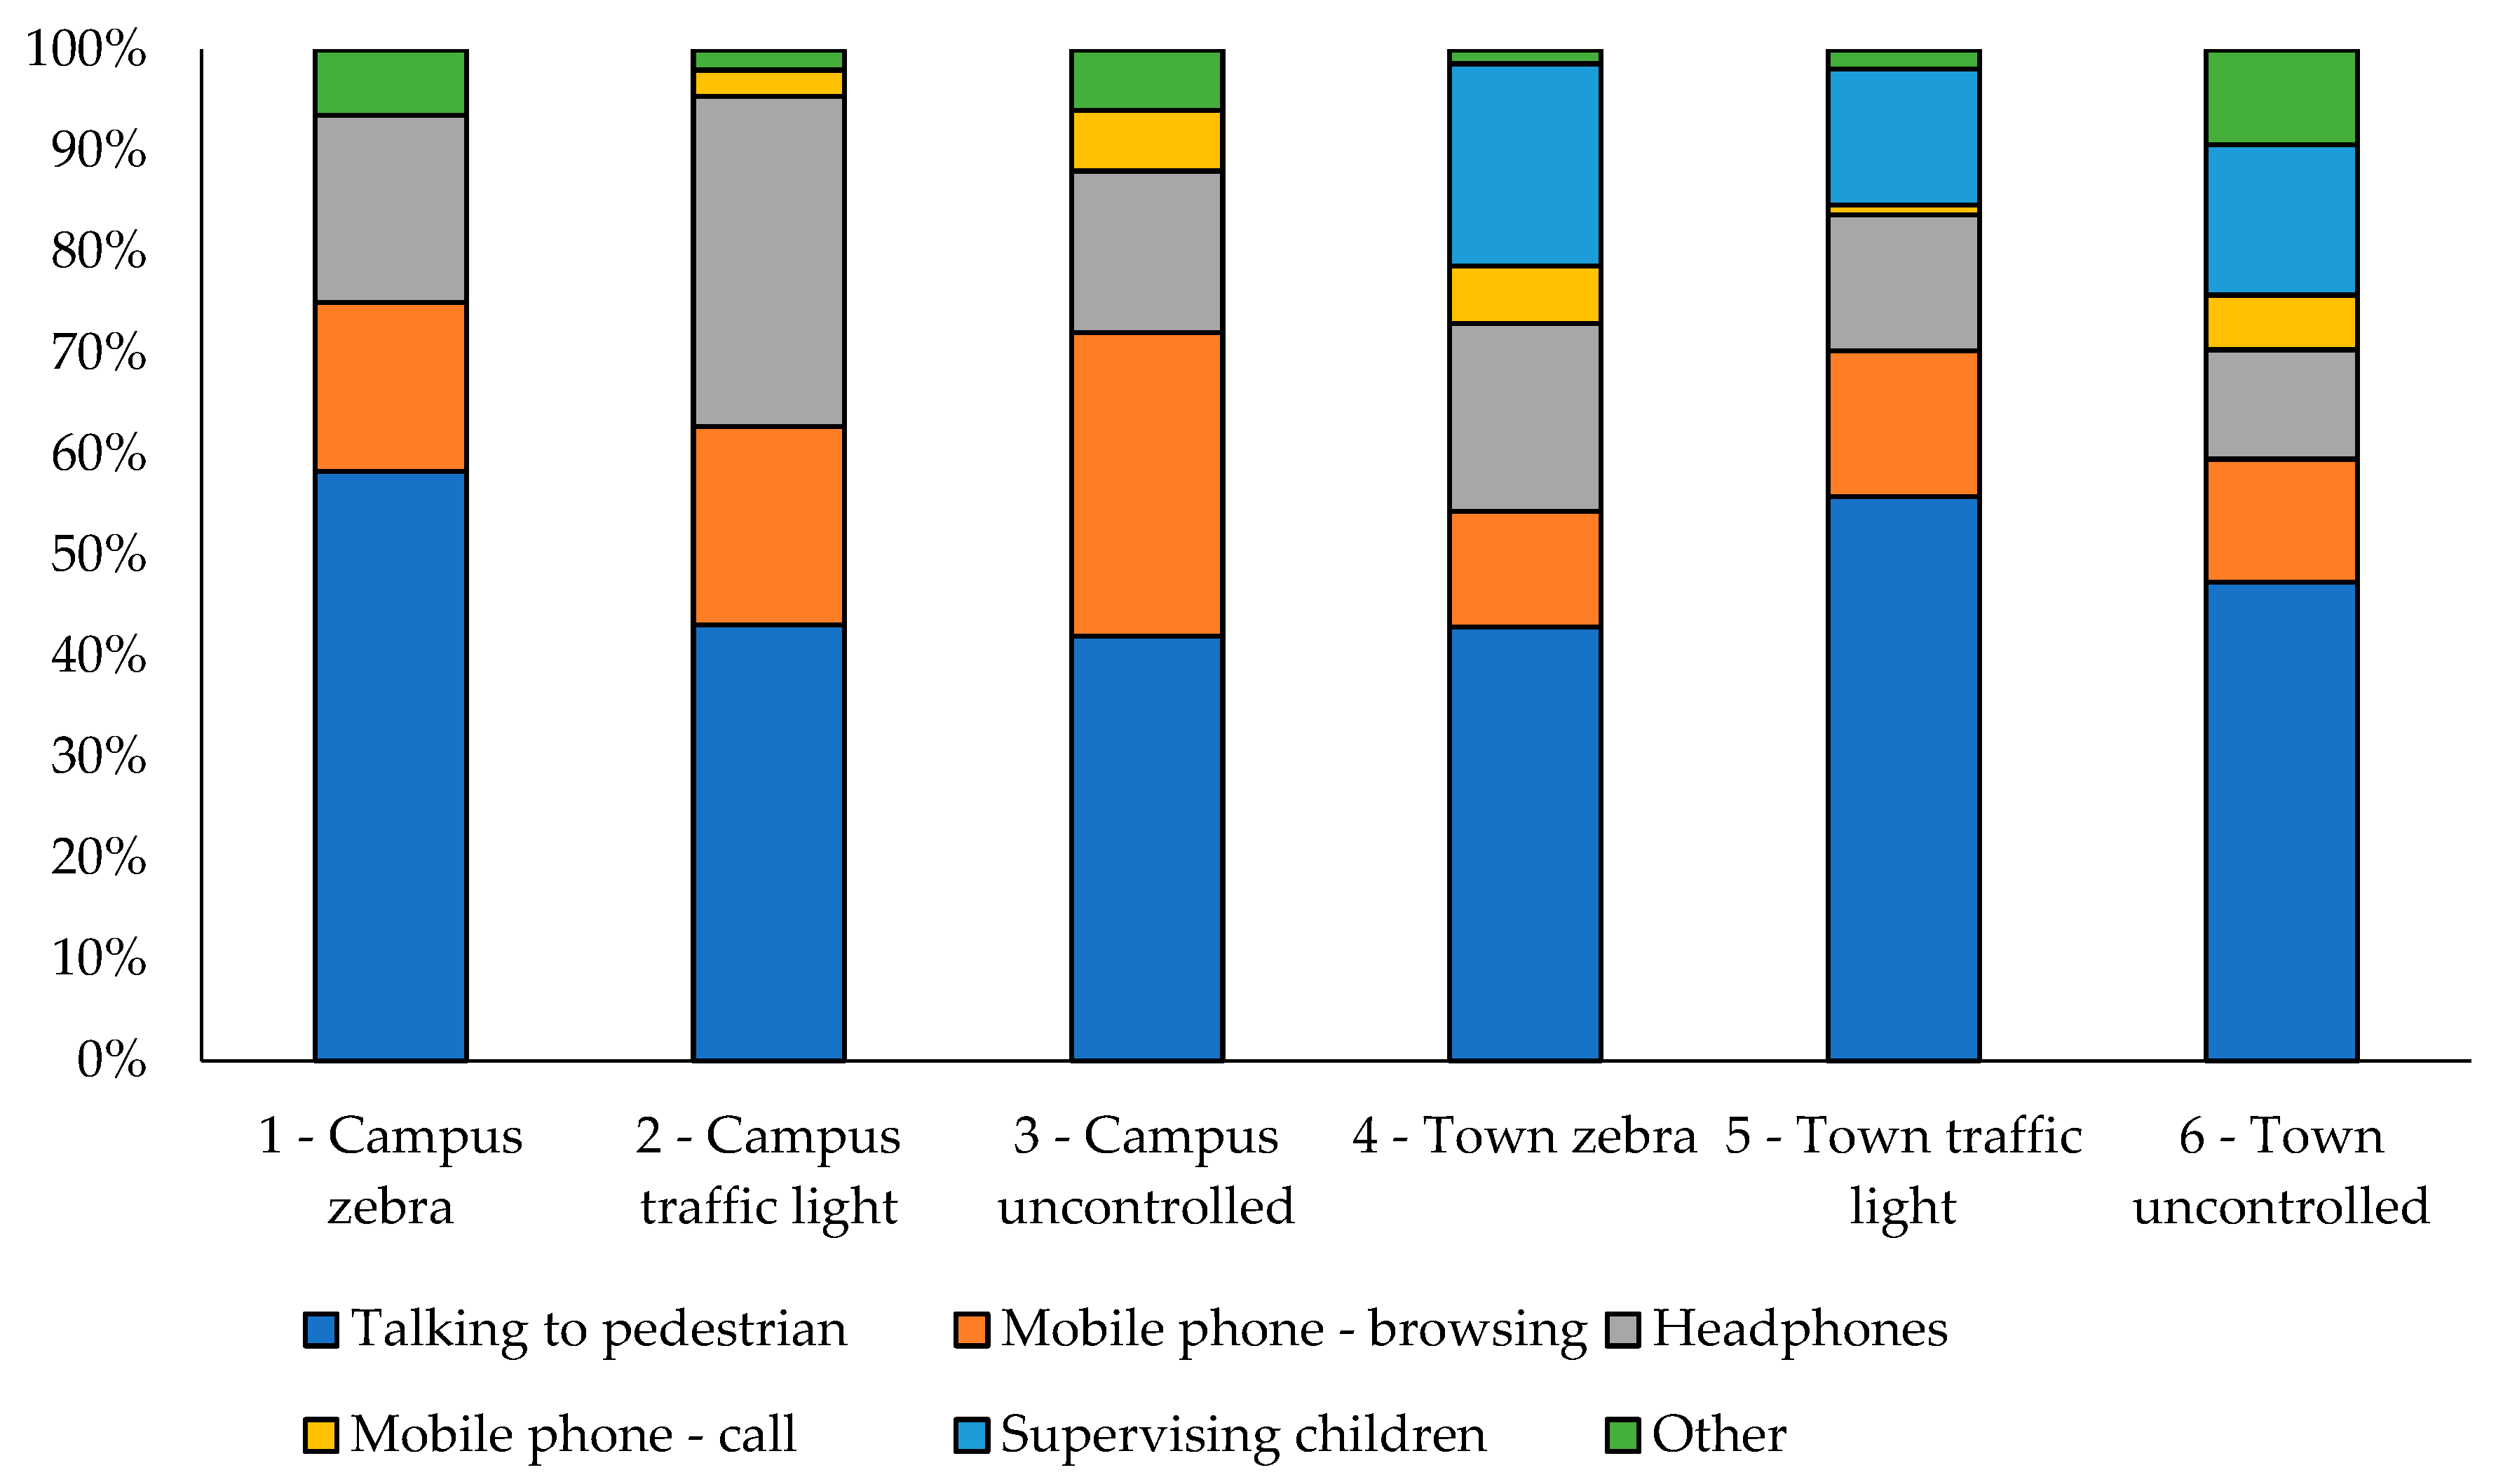
3.3. Impact of Distraction Type
4. Discussion
5. Conclusions
Supplementary Materials
Author Contributions
Funding
Institutional Review Board Statement
Informed Consent Statement
Data Availability Statement
Conflicts of Interest
References
- World Health Organization Road Traffic Injuries; World Health Organization: Geneva, Switzerland, 2022.
- Department for Transport Reported Road Casualties Great Britain: Pedestrian Factsheet 2021. 2022. Available online: https://www.gov.uk/government/statistics/reported-road-casualties-great-britain-pedestrian-factsheet-2021/reported-road-casualties-great-britain-pedestrian-factsheet-2021#:~:text=to%20look%20properly%27-,Pedestrian%20traffic%20and%20reported%20casualties,11%2C261%20slightly%20injured%20(adjusted) (accessed on 22 June 2022).
- Horberry, T.; Osborne, R.; Young, K. Pedestrian smartphone distraction: Prevalence and potential severity. Transp. Res. Part F Psychol. Behav. 2018, 60, 515–523. [Google Scholar] [CrossRef]
- Lennon, A.; Oviedo-Trespalacios, O.; Matthews, S. Pedestrian self-reported use of smart phones: Positive attitudes and high exposure influence intentions to cross the road while distracted. Accid. Anal. Prev. 2017, 98, 338–347. [Google Scholar] [CrossRef]
- Pugliese, B.J.; Barton, B.K. Falling for smartphones: A smartphone-centric data collection tool for measuring distracted walking. Transp. Res. Part F Traffic Psychol. Behav. 2022, 90, 15–21. [Google Scholar] [CrossRef]
- Hamann, C.; Dulf, D.; Baragan-Andrada, E.; Price, M.; Peek-Asa, C. Contributors to pedestrian distraction and risky behaviours during road crossings in Romania. Inj. Prev. 2017, 23, 370–376. [Google Scholar] [CrossRef] [PubMed]
- Wells, H.L.; Mcclure, L.A.; Porter, B.E.; Schwebel, D.C. Distracted Pedestrian Behavior on two Urban College Campuses. J. Community Health 2018, 43, 96–102. [Google Scholar] [CrossRef]
- Ortiz-Ramirez, H.A.; Vallejo-Borda, J.A.; Rodriguez-Valencia, A. Staying on or getting off the sidewalk? Testing the Mehrabian-Russell Model on pedestrian behavior. Transp. Res. Part F Traffic Psychol. Behav. 2021, 78, 480–494. [Google Scholar] [CrossRef]
- Oviedo-Trespalacios, O.; Haque, M.M.; King, M.; Washington, S. Understanding the impacts of mobile phone distraction on driving performance: A systematic review. Transp. Res. Part C Emerg. Technol. 2016, 72, 360–380. [Google Scholar] [CrossRef]
- Byington, K.W.; Schwebel, D.C. Effects of mobile Internet use on college student pedestrian injury risk. Accid. Anal. Prev. 2013, 51, 78–83. [Google Scholar] [CrossRef]
- Banducci, S.E.; Ward, N.; Gaspar, J.G.; Schab, K.R.; Crowell, J.A.; Kaczmarski, H.; Kramer, A.F. The Effects of Cell Phone and Text Message Conversations on Simulated Street Crossing. Hum. Factors 2016, 58, 150–162. [Google Scholar] [CrossRef]
- Neider, M.B.; McCarley, J.S.; Crowell, J.A.; Kaczmarski, H.; Kramer, A.F. Pedestrians, vehicles, and cell phones. Accid. Anal. Prev. 2010, 42, 589–594. [Google Scholar] [CrossRef]
- Licence, S.; Smith, R.; McGuigan, M.P.; Earnest, C.P. Gait pattern alterations during walking, texting and walking and texting during cognitively distractive tasks while negotiating common pedestrian obstacles. PLoS ONE 2015, 10, e0133281. [Google Scholar] [CrossRef]
- Lin, M.I.B.; Huang, Y.P. The impact of walking while using a smartphone on pedestrians’ awareness of roadside events. Accid. Anal. Prev. 2017, 101, 87–96. [Google Scholar] [CrossRef]
- Tian, K.; Markkula, G.; Wei, C.; Sadraei, E.; Hirose, T.; Merat, N.; Romano, R. Impacts of visual and cognitive distractions and time pressure on pedestrian crossing behaviour: A simulator study. Accid. Anal. Prev. 2022, 174, 106770. [Google Scholar] [CrossRef]
- Jiang, K.; Ling, F.; Feng, Z.; Ma, C.; Kumfer, W.; Shao, C.; Wang, K. Effects of mobile phone distraction on pedestrians’ crossing behavior and visual attention allocation at a signalized intersection: An outdoor experimental study. Accid. Anal. Prev. 2018, 115, 170–177. [Google Scholar] [CrossRef]
- Simmons, S.; Caird, J.; Ta, A.; Sterzer, F.; Hagel, B. Plight of the distracted pedestrian: A research synthesis and meta-analysis of mobile phone use on crossing behaviour. Inj. Prev. 2020, 26, 170–176. [Google Scholar] [CrossRef] [PubMed]
- Thompson, L.L.; Rivara, F.P.; Ayyagari, R.C.; Ebel, B.E. Impact of social and technological distraction on pedestrian crossing behaviour: An observational study. Inj. Prev. 2013, 19, 232–237. [Google Scholar] [CrossRef] [PubMed]
- Liu, Y.; Alsaleh, R.; Sayed, T. Modeling the influence of mobile phone use distraction on pedestrian reaction times to green signals: A multilevel mixed-effects parametric survival model. Transp. Res. Part F Traffic Psychol. Behav. 2021, 81, 115–129. [Google Scholar] [CrossRef]
- Hyman, I.E., Jr.; Boss, S.M.; Wise, B.M.; McKenzie, K.E.; Caggiano, J.M. Did You See the Unicycling Clown? Inattentional Blindness while Walking and Talking on a Cell Phone. Appl. Cogn. Psychol. 2010, 24, 597–607. [Google Scholar]
- Bungum, T.J.; Day, C.; Henry, L.J. The association of distraction and caution displayed by pedestrians at a lighted crosswalk. J. Community Health 2005, 30, 269–279. [Google Scholar] [CrossRef]
- Truong, L.T.; Thai, N.H.; Le, T.V.; Debnath, A.K. Pedestrian distraction: Mobile phone use and its associations with other risky crossing behaviours and conflict situations. Saf. Sci. 2022, 153, 105816. [Google Scholar] [CrossRef]
- Aghabayk, K.; Esmailpour, J.; Jafari, A.; Shiwakoti, N. Observational-based study to explore pedestrian crossing behaviors at signalized and unsignalized crosswalks. Accid. Anal. Prev. 2021, 151, 105990. [Google Scholar] [CrossRef] [PubMed]
- Walker, E.J.; Lanthier, S.N.; Risko, E.F.; Kingstone, A. The effects of personal music devices on pedestrian behaviour. Saf. Sci. 2012, 50, 123–128. [Google Scholar] [CrossRef]
- Chen, P.L.; Pai, C.W. Smartphone gaming is associated with pedestrians’ head-turning performances: An observational study of street-crossing behaviors at uncontrolled intersection in Taipei. Int. J. Sustain. Transp. 2018, 12, 12–18. [Google Scholar] [CrossRef]
- Antic, B.; Milenkovic, M.; Pešic, D. The effects of mobile phone use on pedestrian crossing behaviour at unsignalized intersections–Models for predicting unsafe pedestrians behaviour. Saf. Sci. 2016, 82, 1–8. [Google Scholar]
- Ropaka, M.; Nikolaou, D.; Yannis, G. Investigation of traffic and safety behavior of pedestrians while texting or web-surfing. Traffic Inj. Prev. 2020, 6, 1–6. [Google Scholar] [CrossRef]
- Fobian, A.D.; Rouse, J.; Stager, L.M.; Long, D.; Schwebel, D.C.; Avis, K.T. The effects of sleep deprivation and text messaging on pedestrian safety in university students. Sleep 2020, 9, 1–8. [Google Scholar] [CrossRef]
- Fernandez, C.; Vicente, M.A.; Carrillo, I.; Guilabert, M.; Mira, J.J. How many smombies are there on the street? An observational study on the behavior of pedestrians with their smartphones. J. Med. Internet Res. 2020, 8, e19350. [Google Scholar]
- Safe Kids Worldwide SafeKids Teens & Distraction. no. August, 16p. 2013. Available online: https://www.safekids.org/sites/default/files/documents/ResearchReports/skw_pedestrian_study_2013.pdf (accessed on 22 June 2022).
- Department for Transport THINK Map. 2022. Available online: https://www.think.gov.uk/thinkmap/ (accessed on 5 October 2021).
- O’Dell, A.L.; Filtness, A.J.; Morris, A.P. Predicting the intention of distracted pedestrians at road crossings. Accid. Anal. Prev. 2022, 173, 106707. [Google Scholar]
- Ortiz, N.C.; Ramnarayan, M.; Mizenko, K. Distraction and road user behavior: An observational pilot study across intersections in Washington, D.C. J. Transp. Health 2017, 7, 13–22. [Google Scholar] [CrossRef]
- Harms, I.M.; van Dijken, J.H.; Brookhuis, K.A.; de Waard, D. Walking without Awareness. Front. Psychol. 2019, 10, 1846. [Google Scholar] [CrossRef]
- Mughal, H.; Sivayogan, G.; Dolatabadi, N.; Rahmani, R. An efficient analytical approach to assess root cause of nonlinear electric vehicle gear whine. Nonlinear Dyn. 2022, 110, 3167–3186. [Google Scholar] [CrossRef]
- Davis, S.J.; Barton, B.K. Effects of secondary tasks on auditory detection and crossing thresholds in relation to approaching vehicle noises. Accid. Anal. Prev. 2017, 98, 287–294. [Google Scholar] [CrossRef] [PubMed]


| Site | Location | Carriageway | Crossing Type | Crossing Location | Road Speed | Traffic Flow |
|---|---|---|---|---|---|---|
| 1 | Campus | Dual | Zebra | Midblock | 15 mph | 150 |
| 2 | Campus | Dual | Traffic light | Midblock | 40 mph | 1566 |
| 3 | Campus | Dual | Uncontrolled | Junction | 15 mph | 213 |
| 4 | Town | Dual | Zebra | Midblock | 30 mph | 354 |
| 5 | Town | Single | Traffic light | Junction | 30 mph | 246 |
| 6 | Town | Single | Uncontrolled | Midblock | 30 mph | 138 |
| Observation Criteria | Additional Information |
|---|---|
| Pedestrian features | |
| Gender | Female/male |
| Estimated age category | 18–30, 31–60, 61+. Any pedestrians who appeared to be under the age of 18 were not included at the data coding stage |
| Presence of other pedestrians | Were other pedestrians present during the crossing interaction? This included pedestrians under 18 years old |
| Group size | Groups were defined as multiple pedestrians observably engaging in a social interaction such as talking or holding hands. Pedestrians under 18 years old were included in group size, but infants in pushchairs or being carried by adults were not |
| Distraction behaviours before and during crossing | Whether pedestrians were engaging in observable distractions and distraction behaviour type. Examples include using headphones, talking to another pedestrian, and texting/browsing on a mobile phone |
| Encumbered | Whether pedestrians were holding/pushing anything while crossing; for example, mobile phones, shopping bags, infants, pushchairs, and wheelchairs |
| Environmental features | |
| Traffic dynamics | Was a vehicle present during the crossing? Was the vehicle stationary/moving? Did the pedestrian wait until there was no traffic before crossing? |
| Signal status | Whether pedestrians followed the green/red signals at traffic light-controlled crossings |
| Safety behaviours | |
| Visual behaviour before and during crossing | Number of looks made to the left/right by visibly turning the head and whether pedestrians looked one way or both ways |
| Crossing bounds | Whether pedestrians started and ended their crossing within the marked boundaries of the crossing area. This was not applicable to uncontrolled crossings |
| Initiation duration | Time taken between approaching the crossing and stepping from the pavement onto the road |
| Crossing time | Time taken from placing the first foot off the curb to first foot on the pavement on the other side of the road |
| Crossing speed | The width of the crossing was divided by the time taken to cross, giving the speed in m/s. Crossing width was obtained using an augmented reality ruler phone app |
| Critical events | “An observable event which would end in an accident unless one of the involved parties slows down, changes direction or accelerates to avoid a collision”—Risser 1985 |
| Site Location | ||||||
|---|---|---|---|---|---|---|
| 1 Campus Zebra | 2 Campus Traffic Light | 3 Campus Uncontrolled | 4 Town Zebra | 5 Town Traffic Light | 6 Town Uncontrolled | |
| Gender % | ||||||
| Female | 30 | 55.1 | 38.9 | 49.5 | 50.9 | 54.9 |
| Male | 70 | 44.9 | 61.1 | 50.5 | 49.1 | 45.1 |
| Age % | ||||||
| 18–30 | 82.5 | 93.9 | 95 | 22.2 | 33.6 | 28.2 |
| 31–60 | 16.6 | 5.7 | 5 | 51.4 | 49.9 | 53.1 |
| 61+ | 0.9 | 0.4 | 0 | 26.4 | 16.5 | 18.8 |
| Distraction % | ||||||
| Before | 45.3 | 68.4 | 40 | 31.5 | 32.5 | 33.8 |
| During | 48.4 | 57.8 | 44 | 32.4 | 32.5 | 35.7 |
| Other pedestrians % | 59.2 | 95.1 | 47 | 54.2 | 78.2 | 47.4 |
| Groups % | 43.9 | 41.4 | 28.3 | 26.4 | 63.5 | 36.6 |
| 1—Campus Zebra | 2—Campus Traffic Light | 3—Campus Uncontrolled | 4—Town Zebra | 5—Town Traffic Light | 6—Town Uncontrolled | |||||||
|---|---|---|---|---|---|---|---|---|---|---|---|---|
| D | ND | D | ND | D | ND | D | ND | D | ND | D | ND | |
| Crossing time (s) | 4.62 (1.27) | 4.17 (1.28) | 7.36 (1.00) | 7.05 (1.09) | 6.42 (1.07) | 6.72 (1.72) | 5.55 (0.89) | 5.22 (0.96) | 4.83 (0.82) | 4.74 (0.78) | 7.52 (1.14) | 7.47 (1.92) |
| Crossing initiation (s) | 0.80 (0.54) | 0.95 (0.71) | 2.05 (2.28) | 1.70 (1.84) | 0.62 (0.53) | 0.91 (0.55) | 1.31 (0.70) | 1.09 (0.51) | 0.94 (0.61) | 0.92 (0.73) | 0.95 (0.59) | 0.92 (0.58) |
| Distracted | Not Distracted | |||||||
|---|---|---|---|---|---|---|---|---|
| M | SD | M | SD | df | t | p | Cohen’s d | |
| 1—Campus zebra * | 1.5 | 1.28 | 2.03 | 1.27 | 204 | 2.97 | <0.01 | 0.42 |
| 2—Campus traffic light * | 1.73 | 2.05 | 2.52 | 2.9 | 219 | 2.37 | 0.02 | 0.31 |
| 3—Campus uncontrolled | 2.24 | 2.17 | 2.26 | 1.12 | 89 | 0.06 | 0.95 | 0.01 |
| 4—Town zebra * | 1.79 | 1.06 | 2.19 | 1.06 | 198 | 2.55 | 0.01 | 0.38 |
| 5—Town traffic light * | 1.36 | 1.07 | 1.7 | 1.2 | 365 | 2.43 | 0.02 | 0.30 |
| 6—Town uncontrolled * | 1.42 | 1.05 | 1.74 | 0.97 | 211 | 2.26 | 0.03 | 0.32 |
Disclaimer/Publisher’s Note: The statements, opinions and data contained in all publications are solely those of the individual author(s) and contributor(s) and not of MDPI and/or the editor(s). MDPI and/or the editor(s) disclaim responsibility for any injury to people or property resulting from any ideas, methods, instructions or products referred to in the content. |
© 2023 by the authors. Licensee MDPI, Basel, Switzerland. This article is an open access article distributed under the terms and conditions of the Creative Commons Attribution (CC BY) license (https://creativecommons.org/licenses/by/4.0/).
Share and Cite
O’Dell, A.; Morris, A.; Filtness, A.; Barnes, J. The Impact of Pedestrian Distraction on Safety Behaviours at Controlled and Uncontrolled Crossings. Future Transp. 2023, 3, 1195-1208. https://doi.org/10.3390/futuretransp3040065
O’Dell A, Morris A, Filtness A, Barnes J. The Impact of Pedestrian Distraction on Safety Behaviours at Controlled and Uncontrolled Crossings. Future Transportation. 2023; 3(4):1195-1208. https://doi.org/10.3390/futuretransp3040065
Chicago/Turabian StyleO’Dell, Amy, Andrew Morris, Ashleigh Filtness, and Jo Barnes. 2023. "The Impact of Pedestrian Distraction on Safety Behaviours at Controlled and Uncontrolled Crossings" Future Transportation 3, no. 4: 1195-1208. https://doi.org/10.3390/futuretransp3040065