Article

Efficiency Analysis of Tramways in the Metropolitan Areas in South Korea: Focusing on the Daejeon Metropolitan Area

Department of Railroad Drive and Control, School of Railroad Experts, Dongyang University, 145, Dongyangdae-ro, Yeongju-si 36040, Gyeongsangbuk-do, Republic of Korea
Future Transp. 2023, 3(4), 1223-1239; https://doi.org/10.3390/futuretransp3040067
Submission received: 17 August 2023 / Revised: 23 September 2023 / Accepted: 28 September 2023 / Published: 26 October 2023

Abstract

:
This study aims to present the meaningful implications of introducing a tramway as a new mode of transportation in the Daejeon Metropolitan Area, a major metropolitan area in South Korea. An efficiency comparison by data envelopment analysis (DEA) was carried out, using variables selected from the 2021 Public Transportation Investigation by the Korea Transportation Safety Authority (KTSA) (2021), and the ‘Guidelines for selecting new transportation means’ announced by the Ministry of Land, Infrastructure, and Transport in 2021. As a result, the efficiency of public transportation in major metropolitan areas outside of the capital region was higher than in the capital metropolitan area. In particular, the Daejeon Metropolitan Area ranked high in efficiency compared to other major metropolitan areas with similar conditions. In the V-super efficiency results of the efficiency model based on the input of operational costs for each new mode of transportation, considering variable returns to scale (VRS), the bus rapid transit (BRT) ranked first, the tramway second, and the bimodal tram third. Regarding construction cost input, the tramway ranked first, the bimodal tram second, and BRT third.

1. Introduction

The evolving urban landscapes around the world have long underscored the need for efficient public transportation systems. A central figure in this transportation narrative has been the tramway system, recognized for its remarkable environmental benefits and contribution to urban rejuvenation. By 31 December 2021, tramways and light rail systems (LRT) were available in 404 cities globally, with approximately 16,000 km of routes in operation [1]. Tramways have more advantages than other public transportation systems. For example, trams emit fewer pollutants than buses, carry more passengers, have a longer service life, and are faster [2]. Tramways are generally considered environmentally friendly and economical in their energy consumption [3]. They are integral to many urban regeneration projects, and may facilitate revitalizing underdeveloped urban areas and support economic development [4,5,6]. Trams have greater passenger capacity than conventional buses [7]. Some functions of light rail transit (LRT) incorporating tramways overlap with bus rapid transit (BRT), which is also considered a medium-capacity mode of transportation [8]. Tramways can facilitate access to large-scale urban development areas, have the potential to reduce traffic congestion, and support business [5,9]. In addition, by supplementing the railway network, tramways can help achieve various tourism goals [10,11].
Currently, tramways are not used in Korea. It is a new means of transportation that can be introduced if its economic feasibility and stability are sufficiently verified. On 4 May 2023, it was announced that the construction of Daejeon Metro Line 2 as a light rail line would begin and that its funding was approved, with the central government contributing 60% and the local government 40% of the costs [12]. The pressing research problem lies in discerning whether tramways, with their distinct advantages over other modes of transportation, can seamlessly integrate into contemporary urban environments, particularly in regions unfamiliar with this transportation mode. Thus, this research endeavors to highlight the significant consequences of integrating a tramway system within the Daejeon Metropolitan Area, a prominent urban region in South Korea. The central hypothesis guiding this research is that tramways, when designed and executed with careful planning, can substantially enhance urban transportation efficiency.
Kim and Sim [13] assessed the efficiency of metropolitan railway operators in several South Korean cities. They used factors such as track length, vehicles, labor, and operational stations as inputs, determining that Seoul Metro was efficient, while other city operators were less so. This efficiency was attributed to stable business conditions and the railways’ convenience. Another study by Kim and Lee [14] conducted a similar analysis and found that larger operating organizations generally had higher efficiency levels. Li et al. [15] examined spatial variations in transfer ridership between metro and bus systems in Chengdu, China. Their findings highlighted the significance of increasing bus stops and lines around metro stations to boost transfer numbers. Specifically, adding more bus lines was more impactful than adding stops.
In the European context, tramways have played an essential role in cities such as Amsterdam, Vienna, and Munich. Amsterdam has integrated tramways into its urban landscape to address mobility and congestion issues. Givoni and Rietveld [16] have argued that integration of public transport services, which includes tramways, improves the overall performance of the transport system. Vienna’s tram system is one of the most extensive in the world. Kager et al. [17] found that cities with tramway systems, including Munich, recorded positive impacts on urban mobility and air quality.
In the USA, San Francisco, Portland, and Denver have effectively integrated tramways and LRT systems into their urban transport planning. San Francisco’s iconic cable car system has been a topic of interest, with Brueckner and Selod [18] discussing its role in reducing traffic congestion. Portland’s LRT system is often cited as a success story in terms of urban regeneration and economic development. Nelson and Sanchez [19] identified Portland’s embrace of LRT as a means of reducing car dependency and promoting a denser urban development. Denver’s commitment to tram infrastructure aims to promote sustainable mobility. Fan et al. [20] highlighted the social benefits of Denver’s LRT, including its potential to enhance accessibility and social inclusion. Furthermore, Yang et al. [21] developed a model evaluating metro train passengers’ satisfaction in Melbourne. They considered various factors such as trip details, service quality, and individual traveler attributes. Their research pinpointed service factors, especially timeliness, live updates, and frequency, as being highly correlated with satisfaction. They found that service-related attributes provided the best indicators of satisfaction, followed by other factors like trip timings and passenger expectations.
The tramway project evaluated in this study, actively carried out by the central and local governments to strengthen metropolitan railway functions, was delayed due to various factors. Therefore, through analytical research, this study aims to present the meaningful implications of tramways as a new means of transportation in the Daejeon Metropolitan Area, South Korea. It aims to present the effects of tramways on improving public transportation and welfare in the Daejeon Metropolitan Area. Expected outcomes include supporting vibrant local urban regeneration projects for existing metropolitan railway infrastructure and securing and strengthening the role of tramways as eco-friendly public transportation.
The structure of this paper unfolds sequentially, beginning with Section 2, which delves into existing studies on tramways and their impacts in metropolitan regions. Subsequently, Section 3 elaborates on the methodologies and data sources utilized for our research. This is followed by Section 4, presenting the empirical findings of our analysis. The outcomes are then discussed in depth in Section 5, comparing our results with the prior literature and addressing its implications. Concluding the paper, Section 6 encapsulates the primary takeaways, offering policy recommendations and directions for future studies.

2. Literature Review

Tramways have long been a focal point in transportation research, due to their potential for sustainability, urban development, and cost-effectiveness. Their potential impact on metropolitan areas has led to an extensive body of literature exploring various aspects of urban planning.
One of the primary arguments supporting tramways in metropolitan areas centers on their environmental advantages. Moreno et al. [22] pointed out that tramways emit fewer pollutants compared to conventional buses, contributing to cleaner urban air quality. Li et al. [15] posited that the comfort level of a densely populated city rail line can be quantitatively measured by energy expenditure. In their study, they proposed an optimized timetable model that considers the energy used by passengers both at the station and within the vehicle. This model pinpointed the relationship between energy expenditure, passenger wait times, boarding dynamics, and the departure schedules of trains. Their findings revealed that as the time between train arrivals—known as the minimum headway—increased, passengers would expend a substantial amount of energy during their journeys. Additionally, the proposed timetable optimization method, rooted in energy considerations, can reduce overall energy use and yield societal advantages by improving the quality of train timetables.
From an urban development standpoint, tramways can significantly influence city landscapes. Zhang et al. [23] discovered that tramways are often integral components of urban regeneration projects, instigating economic growth and revitalization in areas previously lagging in development. Furthermore, Kim and Sim [13] assessed metropolitan railway operators in South Korean cities, including Seoul, Busan, Daegu, Incheon, and Gwangju, yielded interesting findings. By considering factors such as track length, the number of vehicles, labor, and operation stations, they discerned that Seoul Metro was an exemplar of efficiency. Conversely, other local metropolitan railway operators did not fare as well in efficiency metrics. This efficiency was attributed to the overall stability of business environments and the inherent convenience of metropolitan rail systems. Additionally, Kim and Lee [14] executed an empirical investigation using DEA to evaluate six metropolitan railway institutions in South Korea. Their assessment criteria comprised the number of employees, operations, stations, and operational expenses. Remarkably, their findings indicated that larger organizations generally maintained a high efficiency average.
Highlighting the financial aspects, D. Knowles and Ferbrache [24] unveiled that properties in proximity to tram lines frequently saw an appreciation in value, solidifying the favorable economic ramifications of tramways. Additionally, Cervero and Duncan [25] underscored the potential long-term financial benefits of tramways. They posited that the operational costs of tramways can be more economical than buses, given their reduced fuel and maintenance expenditures. Delving deeper, Sampaio et al. [26] elaborated on the possibility of harnessing economies of scale, especially in densely populated areas where high ridership could counterbalance operational costs. Supporting this economic narrative, a comprehensive analysis by Hass-Klau [27] observed that urban areas equipped with tramway systems witnessed a proliferation of local businesses and a notable uptick in property values around tramway stations.
From a passenger experience perspective, tramways often outperform other modes of transport in terms of comfort, accessibility, and reliability. Fernandez and Planzer [28] stated that tramways possess a higher passenger capacity than conventional buses, and their fixed routes provide superior predictability for daily commuters. In a detailed study, Rydlewski and Tubis [29] emphasized the importance of tram stops as pivotal infrastructure elements. Their findings pinpointed essential safety features, including warning fields and navigational paths for visually impaired individuals, adequate lighting, and platforms adjusted in width to accommodate passenger flow. Crucial aspects impacting stop functionality were the dimensions of the platform—its length, width, and height—tailored to the trams in service. Another significant factor was the provision of passenger information at these stops. Furthermore, Lope and Dolgun [30] highlighted the superior accessibility of tramways for individuals with disabilities, attributing this to their low-floor designs and dedicated stations. Delving into spatial variations and passenger satisfaction, Li et al. [15] undertook empirical research examining the relationship between metro and bus system transfer ridership in Chengdu, China. The research elucidated differing impacts of various variables on Metro-to-Bus and Bus-to-Metro transfers. The study deduced that increasing the number of bus stops and lines around metro stations was the most effective method for enhancing passenger transfer numbers, with augmenting the bus lines near stations proving more influential than merely adding more stops. Additionally, Yang et al. [21] developed a theoretical model to assess passengers’ overall satisfaction. Using four attribute categories—traveler, trip, service, and others—they validated their model with feedback from 429 metro train passengers in Melbourne, Australia. When evaluating service attributes (Model 3), a prominent result was the positive correlation of all evaluated service factors with overall satisfaction. The top three aspects showing the strongest correlation were timeliness, live information updates, and frequency. By analyzing and comparing various models, the study concluded that Model 3, focused on service attributes, exhibited the best overall fit, followed by Models 4, 1, and 2, respectively.
Drawing from the aforementioned studies, it is evident that tramways play a multifaceted role in shaping urban landscapes, promoting environmental sustainability, driving economic growth, and enhancing the passenger experience. While the existing body of literature offers a thorough understanding of these aspects, there remain gaps in context-specific applications and the integration of these findings into economic efficiency studies. Consequently, our study aims to conduct an efficiency analysis targeting a representative city in South Korea.

3. Materials and Methods

3.1. Data Envelopment Analysis (DEA)

Efficiency refers to the ratio of outcomes (output) an organization has achieved compared to the invested limited resources or effort (input). It is generally divided into absolute and relative efficiency. Absolute efficiency, often used to indicate productivity, is the ratio of output to input of economic actors [31,32]. Conversely, relative efficiency is a comparative measure expressed as a ratio, where the best value among the comparison targets serves as the standard for comparison.
Data envelopment analysis (DEA), a representative relative efficiency analysis method, was attempted by Charnes et al. [33] based on Farrell [34]’s efficiency measurement concept and Shephard’s (1953) distance function [35]. Charnes, Charnes et al. [33] measured the efficiency of decision-making units (DMUs). DEA measures the relative efficiency of individual DMUs by first deriving the most efficient DMUs from the target DMUs to evaluate DMUs with similar activities and then measuring the distance between the production frontier created by the most efficient DMUs and the remaining inefficient DMUs [34]. DEA is a non-parametric linear programming method that is well-suited for efficiency analysis, especially when the production process is complex, and it is challenging to specify a functional form for the technology. This method allows us to handle multiple inputs and outputs simultaneously without requiring a priori assumptions about their weights [33]. DEA has two models, the Charnes–Cooper–Rhodes (CCR) model and the Banker–Charnes–Cooper (BCC) model, depending on the assumption of returns to scale.
The CCR model developed by Charnes et al. [33] assumes constant returns to scale (CRS), regardless of the scale of the relationship between input and output. The BCC model presented by Banker et al. [36] assumes variable returns to scale (VRS), which relaxes the constant return to scale (CRS) assumption of the CCR model by assuming that the relationship between inputs and outputs varies with scale. The DEA model can also be divided into input-oriented and output-oriented, but the input-oriented model has a fixed output level.
θ κ * = min θ , λ , s , s + { θ κ ε ( m = 1 M s m + n = 1 N s n + ) }
subject to
θ κ χ m κ j = 1 J χ m j λ j + s m ( m = 1 , 2 , , M ) ; у n κ j = 1 J у n j λ j s n ( n = 1 , 2 , , N ) ; λ j 0 ( j = 1 , 2 , , J ) ; s n + ( n = 1 , 2 , , N ) ; s m ( m = 1 , 2 , , M ) ;
θ κ * = min θ , λ , s , s + { θ κ ε ( m = 1 M s m + n = 1 N s n + ) }
subject to
θ κ χ m κ j = 1 J χ m j λ j ( m = 1 , 2 , , M ) ; у n κ j = 1 J у n j λ j s n ( n = 1 , 2 , , N ) ; j = 1 J λ j = 1 λ j 0 ( j = 1 , 2 , , J ) ; s m ( m = 1 , 2 , , M ) ; s n + ( n = 1 , 2 , , N ) ;
The input-oriented model seeks to enhance efficiency by reducing inputs while maintaining output levels constant. In contrast, the output-oriented model seeks to improve efficiency by increasing outputs while keeping inputs constant [31,32,37]. Relative efficiency calculation using DEA assumes that if there are J DMUs, DMUj (j = 1, 2, …, J) calculates N outputs yn (n = 1, 2, …, N) by inputting M inputs xm (m = 1, 2, …, M). The efficiency of the k-th observation of kDMUs in linear programming is solved by the input-oriented CCR model Equation (1). Equation (1) is a linear planning equation of the input-oriented CCR model, where the objective function θ is the ratio of reducing input, and sₘ⁻ and s⁺ₙ are the slacks for input and output, respectively. If θ* is 1 and all the margins s⁺ₙ and sₘ of input and output are 0, the corresponding DMU becomes the most efficient DMU [31,35].
The BCC model that assumes variable returns to scale can be expressed as Equation (2) for input criteria [33,36]. In the BCC model Equation (2), a convexity constraint (Σλ = 1) is added to ensure that the sum of reference weights (λ) that refers to efficient DMUs equals 1, which prevents the model from infinitely expanding or reducing the output/input ratios of the DMUs. Instead, only the points that satisfy the inner point and free disposability condition between observations are recognized as producible [37]. Therefore, production changes in the BCC model are always more inward than in the CCR model, which assumes constant returns to scale, resulting in greater efficiency measured by the BCC model [31,32,36,38].
SE = θ C C R * θ B C C *
Scale efficiency (SE) is the ratio of the CCR to BCC models’ efficiency scores and shows the degree to which the input and output factors are optimized. The CCR efficiency is always less than or equal to the BCC efficiency, so the scale efficiency state is always less than or equal to 1. As shown in Equation (3), SE is calculated by the efficiency calculated in the CCR and the BCC models.
The Slacks-Based Measure (SBM) model, developed by Tone [39], measures the efficiency between DMUs as a distance concept, similar to the traditional DEA model, but considers the occurrence of residual slacks overlooked by DEA. In other words, the radial model has the disadvantage of being unable to determine the ranking of efficient DMUs. In order to compensate for this, Tone’s (2001) model is a residual-based efficiency analysis model, because the efficiency value is calculated as 1, despite the presence of a residue [39]. On average, the SBM model improves efficiency by reducing input as much as possible while increasing output. The representative SBM and additive models are non-radial models with similar assumptions about variables. However, the SBM model provides a standardized score between 0 and 1 that the additive model does not. The additive and SBM models can set the CRS or VRS assumptions according to the user requirements. The CCR and BCC models are classified into input-based models that reduce input while maintaining current output, namely CCR-I and BCC-I models, and output-based models that increase output while maintaining current input, namely CCR-O and BCC-O models.
Along with the CCR models, the SBM models can calculate super-efficiency scores for DMUs with an efficiency score of 1 (Super CCR, Super SBM). Thus, the Super CCR model is used when measuring efficiency scores between DMUs with an efficiency score of 1 or higher. This study uses the Super SBM model that integrates the CCR and SBM models based on super-efficiency and residual reference models. Unlike in the super-efficiency model, the efficiency scores of all DMUs reflect the residuals in the Super-SBM model. The Super-SBM model provides a non-radial and non-oriented efficiency score, which ensures a more nuanced assessment. This model compensates for the limitations of traditional DEA, especially when undesirable outputs are present [40]. Super-SBM offers a more accurate efficiency score by simultaneously considering the excessive inputs and insufficient outputs. Moreover, it allows for the incorporation of both desirable and undesirable outputs, making it an adaptable model for diverse scenarios [41]. The super-efficiency score is defined as the influence of the DMU based on the degree of efficiency change between different DMUs when a specific DMU is excluded from the analysis. The higher the super-efficiency score, the greater the contribution to improvements in production or output. Therefore, it can be said that the greater the super-efficiency score, the more efficient the point (DMU).

3.2. Research Subjects, Data, Analysis Methods

This study’s analysis aimed to determine the efficiency of public transportation per capita in each region using the comparative variables of public transportation status survey data provided by the 2021 Public Transportation Investigation [42]. In addition, based on the ‘Guidelines for selecting new means of transportation’ included in the State of Public Transportation Survey 2021-Overall Findings Report for the Ministry of Land, Infrastructure, and Transport [43], an efficiency comparison was conducted by inputting operating expenses for each means of transportation. In other words, the target variable of this study used statistics provided in the existing guidelines for selecting new transportation means.
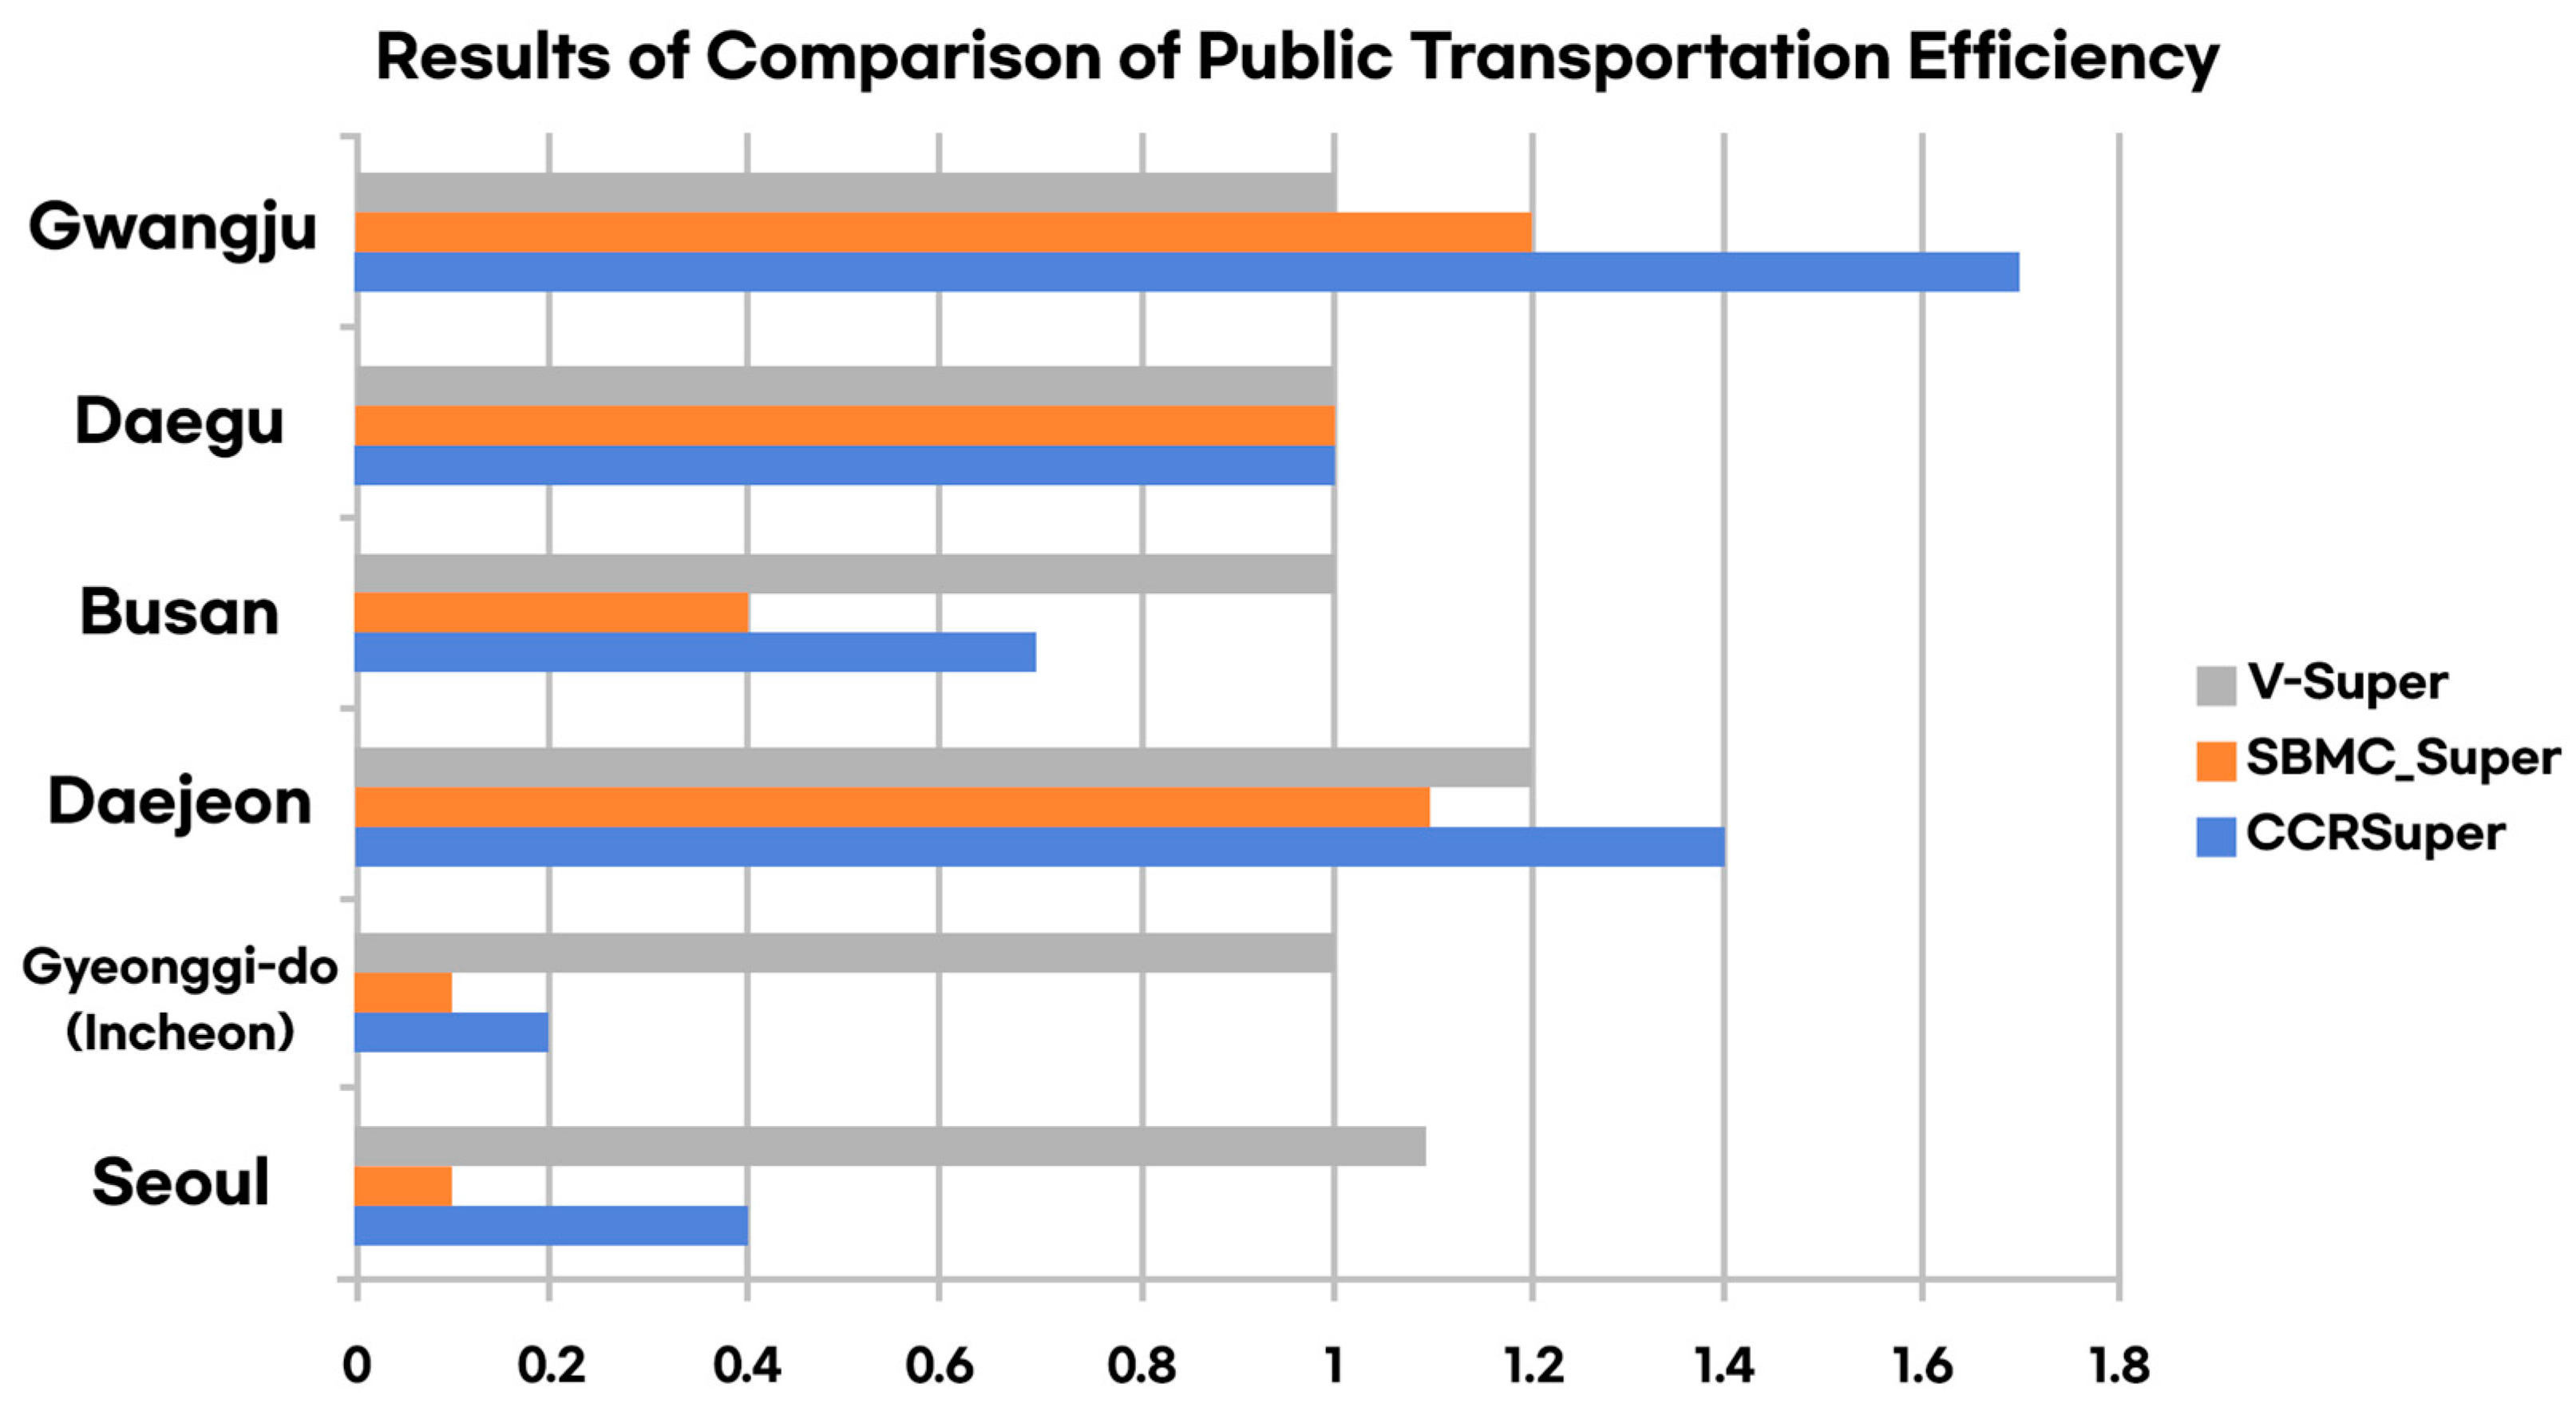
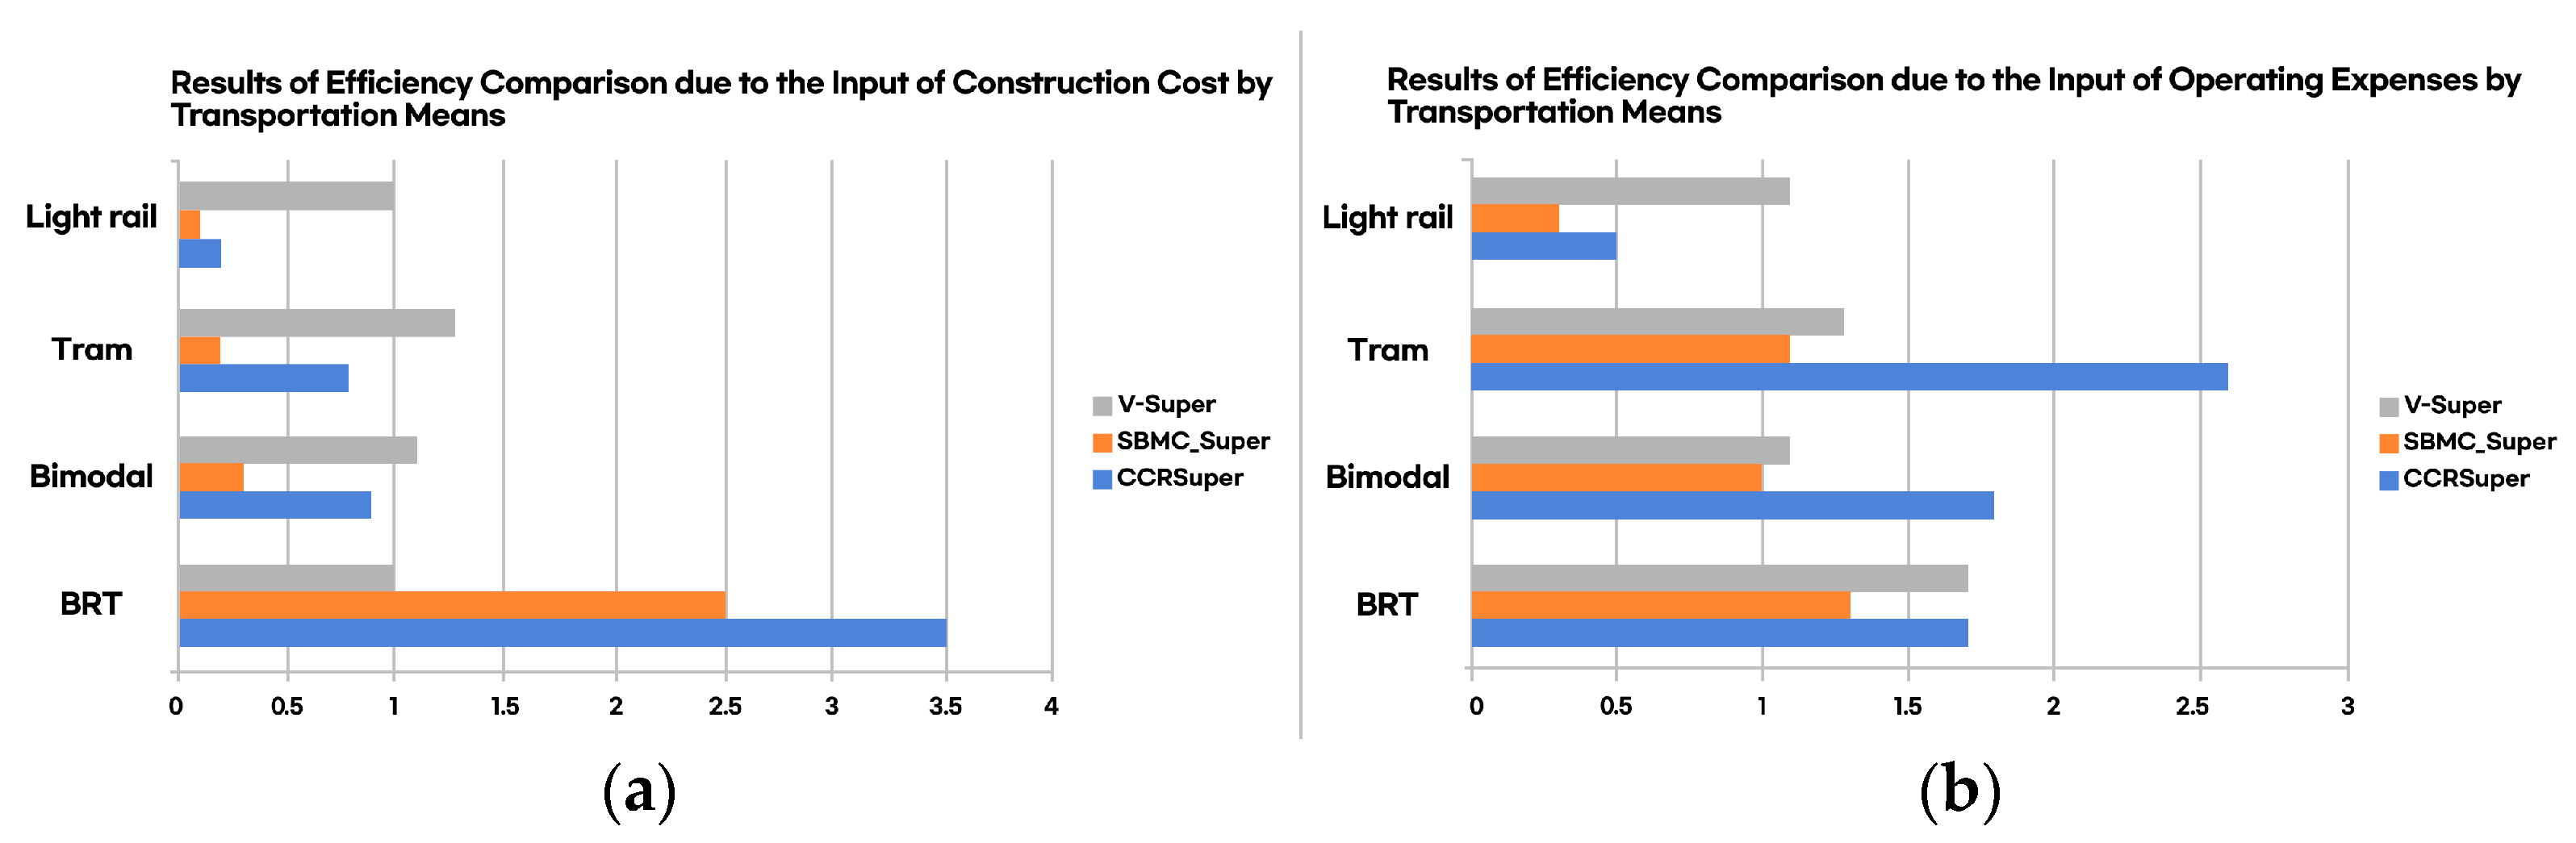
Data capture analysis (DCA) was conducted by randomly classifying and selecting input and output variables based on two classifications. The analysis suggested the pressing need to introduce new modes of transportation in the Daejeon Metropolitan Area. Furthermore, compared to other new transportation methods, tramways demonstrated a relative advantage in their effectiveness and efficiency in the Daejeon Metropolitan Area.
First, the required variables in this study included the total population in each major city (input), metropolitan rail transit traffic ratio, average travel time on public transportation, average travel time on public transportation compared to travel time by cars, the average cost of public transportation compared to travel cost for cars, daily average railway usage, and differences in the perceived railway usage satisfaction by region from January 2019 to December 2021. Second, the average construction and operating costs of each new mode of transportation were input variables. Third, the frequency of operation, maximum transportation capacity, peak-hour headway, number of vehicles operated, maximum passenger capacity, and the share of new transportation modes were analyzed as output variables.

3.3. Operational Definitions of Research Variables

The following operational variables are explained based on the 2021 Public Transportation Investigation data provided mainly by the Korea Transportation Safety Authority (2021) [42] and the ‘Guidelines for selecting new means of transportation’ included in the State of Public Transportation Survey 2021-Overall Findings Report for the Ministry of Land, Infrastructure, and Transport [43].
(1) Ratio of transfer traffic by transfer type
In the Seoul Metropolitan Area, the proportion of transfers using metropolitan railways was higher than that of transfers between buses, with rates of 66% for Seoul, 64% for Incheon, and 58% for Gyeonggi-do province. However, in non-metropolitan areas, the proportion of transfers between buses was higher, with Daegu having the highest rate of 43%, followed by Busan (40%) and Daejeon (26%).
(2) Average travel time by public transportation by major metropolitan area
The public transportation travel time analysis showed that the Busan Metropolitan Area had the fastest travel time, ranging from 42 to 84 min per section. In the Gwangju Metropolitan Area, public transportation travel time was the longest, ranging from 52 to 97 min for each section. Similarly, in the Daejeon Metropolitan Area, traveling on public transportation took a long time, from 47 min to 99 min, depending on the section.
(3) Ratio of average travel time for public transportation compared to travel time by car in each metropolitan area
In order to compare and analyze the difference between travel times by car and public transportation, we calculated the public transportation-to-car travel time ratio. When comparing metropolitan areas, the Daejeon Metropolitan Area showed a ratio of 1.72, relatively higher than the lowest ratio of 1.42 for the Busan Metropolitan Area. These were followed by Ulsan (1.89) and Gwangju (2.39). The comparison results suggested that the public transportation system and transfer facilities were insufficient in the Daejeon Metropolitan Area.
(4) Comparison of average travel costs between public transportation and private cars by metropolitan area
As a result of calculating the public transportation-to-car cost ratio for each axis to compare and analyze the difference in public transportation traffic costs, the Busan Metropolitan Area (0.55) had the lowest ratio, and Gwangju (0.89) had the highest ratio. The Daejeon Metropolitan Area also had a relatively high ratio of 0.66. The closer the value to 0, the cheaper public transportation is than a car. Whereas, when the value is greater than 1, using public transportation costs more than using a car.
(5) Comparison of satisfaction trends among public transportation users by region from 2019 to 2021
This study cites combined online and offline survey results from November to December 2021. The survey targeted public transportation users in 162 local governments seeking to gauge their satisfaction with public transportation operating, environment, comfort-related, safety, information provision, and access services.
According to the comparison of satisfaction among public transportation users by region from 2019 to 2021, Incheon showed the greatest improvement with a score of 0.05 compared to 2019, while Seoul had the biggest decrease in satisfaction with a score of −0.17, followed by Daegu (−0.13). Also, the satisfaction of public transportation users in Daejeon decreased with a score of −0.09, ranking third (Table 1). The results show the top five service elements that required improvement in each region, taking into account both satisfaction and importance of each element for public transportation services. For Daejeon Metropolitan City, the five priority areas for improvement were congestion, facilities’ cleanliness, emergency response measures, appropriate intervals between departures, and staff friendliness.
(6) Maximum daily rail usage by region
Seoul Station (Seoul) recorded the highest number of daily weekday and weekend passenger entries and exits, with an average of 28,000 to 36,000 people disembarking daily. Seoul Station was followed by Dongdaegu Station (Daegu), Suseo Station (Seoul), Daejeon Station (Daejeon), and Busan Station (Busan). Daejeon had the third-highest daily passenger utilization rate after Seoul and Daegu.
(7) Features of new means of transportation
First, the BRT operates express buses as rapid services by fulfilling the Ministry of Land, Infrastructure, and Transport criteria, including dedicated bus lanes, easily accessible transfer facilities, and prioritized bus traffic at intersections. By introducing the concept of railway systems into bus operations, the BRT aims to enhance bus operations to the level of metropolitan railways in terms of speed, punctuality, and transportation capacity, resulting in an advanced public transportation system. Second, the bimodal tram, a compressed natural gas (CNG) hybrid articulated bus, is an upgraded transportation system of BRT in terms of the system aspects. It can self-steer using autonomous driving technology on dedicated tracks, similar to trains, and operate on regular roads as a traditional bus.
Third, a tramway is a system built on tracks embedded in the road with trams running on top of them. A tram has a low floor height, allowing easy boarding on the ground and enabling people with disabilities to use it safely without difficulty, thus reducing the time to get on and off. Finally, automated guideway transit (AGT), a type of rail transit as LRT, is a public transportation system in which lightweight vehicles equipped with rubber tires travel along dedicated guideways (elevated or underground).

3.3.1. Variables for Input Models

The annual operating expenses are calculated by adding the labor, power, maintenance, and general management costs and subtracting any additional income (such as advertising revenue or government subsidies) to determine the final amount. Table 2 describes the average operating expenses by new means of transportation.
If it was difficult to calculate the actual annual operating expenses, the annual average operating expenses calculated based on the assumed operating size (including the number of dedicated vehicles and drivers) for each mode of transportation were applied. The feasibility of total project costs and the scale of the financial burden was examined to calculate construction costs within the scope that local governments could afford. Table 3 describes the average construction costs by new means of transportation.

3.3.2. Variables for Output Models

As shown in Table 4, the cost-sharing ratio was classified based on the similarity of service types with existing public transportation. The results of the new transportation method cost-sharing ratio by region presented in the guidelines for each new transportation method were applied.

3.4. Research Model

The DEA models are divided into the CCR, BCC, and Super-SBM models depending on the CRS and VRS assumptions. Also, the model type can depend on whether it is input-oriented or output-oriented. In this study, we attempt to analyze the VRS super-efficiency (V-Super) of the relationship between inputs and outputs using the CCR, BCC, and Super-SBM models. The CCR, BCC, and Super-SBM models, each present in the research landscape, come with their individual sets of advantages and drawbacks. The CCR model, built upon the constant returns to scale (CRS) presumption, is particularly effective in environments where scale efficiencies are constant [33]. Conversely, it may fall short in scenarios with varying scales. The BCC model, based on variable returns to scale (VRS), provides flexibility in analyses, especially where efficiencies fluctuate [36]. The Super-SBM model, an advancement over the foundational SBM model, addresses some of its foundational shortcomings by offering a non-radial and non-oriented efficiency measure, ensuring a thorough efficiency assessment [40].
The variables used in the analysis are presented in Table 5 and Table 6. The interpretation of efficiency values based on the characteristics of each model was provided according to the analysis results, and the significance of policies pertaining to variables displaying high efficiency was highlighted.

3.4.1. Comparison of the Current Public Transportation State by Region Based on the Population through a Survey of Public Transportation Usage

Table 5 and Table 6 present the current status of public transportation by region based on population, average operating costs by transportation means, average construction costs, and other statistics.

3.4.2. Classification of Variables and Technical Statistics for Input and Output Variables

As shown in Table 7, in the survey assessing the status of public transportation, the total population of a metropolitan city was selected as an input variable. In the guidelines for selecting new transportation means, the average construction cost and operating cost associated with new transportation means were selected as the input variables. Table 8 uses the total population of a metropolitan city as an input variable and uses various statistical data derived from the survey of public transportation status as the output variables. In Table 9, the input variables are set to the average operating and construction costs for new means of transportation. The output variables include the number of operations per day, maximum transportation capacity, headways during rush hours, number of vehicles in service, maximum passenger capacity, and transportation share ratio for each new means of transportation.

4. Results

First, Table 10 compares the efficiency of public transportation per population by region based on a survey of the current status of public transportation. According to the analysis results, the CCR-I model has efficiency scores between 0 and 1; the closer the score to 1, the higher the efficiency. Therefore, Gwangju showed the highest efficiency with a score of 1, followed by Daejeon and Daegu with a score of 1 each, indicating high efficiency.
The CCR-O model has efficiency scores greater than or equal to 1; the closer the score to 1, the better the efficiency. Thus, Gyeonggi (Incheon) demonstrated the highest level of inefficiency with a score of 4, followed by Seoul (2.8) and Busan (1.5). The concept of the CCR super-efficiency score is similar to the notion that DMUs demonstrating efficiency scores higher than 1 in the CCR-I model exhibit efficiency of 1 or more. Thus, Gwangju had the highest efficiency score of 1.7, followed by Daejeon (1.4) and Daegu (1).
The BCC-I and BCC-O models have efficiency scores between 0 and 1; the closer the score to 1, the higher the efficiency. Therefore, the DMUs in the BCC model all have similar efficiency as 1. The SBM (CRS) and SBM (VRS) models have efficiency scores greater than or equal to 1, and the closer the score is to 1, the higher the efficiency. Figure 1 shows high efficiency in the order of Gwangju (1), Daejeon (1), and Daegu (1). The SBM (CRS) super efficiency (C-Super) score represents the efficiency of a DMU, with values greater than or equal to 1 indicating high efficiency. The higher the score, the higher the efficiency. The efficiency score was the highest for Daejeon (1.1), followed by Daegu and Gwangju (1). The same principle applied to the SBM (VRS) super efficiency score (V-Super) as to the SBM (CRS) super efficiency score (C-Super). It demonstrated that efficiency was the highest in Daejeon and Gwangju, with a score of 1.2, followed by Daegu, with a score of 1.
As demonstrated in Table 11 and Figure 1, the efficiency comparison results of the CCR model show that the order of the super-efficiency scores, from highest to lowest, is as follows: tramway = 2.6, bimodal tram = 1.8, BRT = 1.7, and light rail = 0.5. In descending order, the super-efficiency (C-Super) scores of the SBM (CRS) model show that BRT = 1.3, tramway = 1.1, bimodal tram = 1.0, and light rail = 0.3. In descending order, the super-efficiency scores (V-Super) of the SBM (VRS) model were BRT = 1.7, tramway = 1.3, bimodal tram = 1.1, and light rail = 1.1, with BRT as the most efficient, followed by a tramway, bimodal tram, and light rail. In addition, as shown in Table 12 and Figure 2, the efficiency comparison results based on the construction cost inputs for each mode of transportation indicated that the super-efficiency scores of the CCR model were the highest for the BRT (3.5), followed by the bimodal tram (0.9), tramway (0.8), and light rail (0.2). The super-efficiency scores (C-Super) of the SBM (CRS) model were BRT = 2.5, bimodal tram = 0.3, tramway = 0.2, and light rail = 0.1, with the BRT having the highest score, followed by the bimodal tram, tramway, and light rail. The super-efficiency scores (V-Super) of the SBM (VRS) model were tramway = 1.3, bimodal tram = 1.1, BRT = 1.1, and light rail = 1.1, with the tramway having the highest score, followed by the bimodal tram, BRT, and light rail, which had the same score.

5. Discussion

The efficiency analyses for the modes of public transportation across various regions bring forth notable insights. The efficiency scores from the CCR-I model suggest that cities like Gwangju, Daejeon, and Daegu demonstrate higher efficiency when compared to other metropolitan areas. Prior studies indicate that regions with efficient public transportation networks tend to witness higher usage and have a more streamlined transportation framework [13,14].
In contrast, the CCR-O model presented Gyeonggi (Incheon), Seoul, and Busan as less efficient in comparison. The inefficiencies observed in larger metropolitan regions such as Seoul may be attributed to overburdened systems and inadequate infrastructure. The super-efficiency analyses further emphasize Gwangju’s prominence in public transportation efficiency.
Interestingly, in the BCC model, most DMUs showcased similar efficiency, indicating a level of consistency in performance across these regions. The results indicates that DMUs operating at such efficiencies have more stable operations and consistent patronage. The SBM models, both CRS and VRS, reiterate the high efficiencies observed for Gwangju, Daejeon, and Daegu, providing additional validation for these cities as frontrunners in public transportation efficiency.
Diving into the modal efficiency comparisons, the tramway and BRT showed prominence across different evaluation models. As observed, the tramway consistently held higher super-efficiency scores, underlining its potential in augmenting urban transportation systems [13,26,28]. Similarly, BRT’s superior scores, especially in the SBM (CRS) and CCR models, suggest its viability as a cost-effective mode of public transportation. Light rail, however, consistently held the lowest efficiency scores, indicating potential areas of improvement or reconsideration in its application.

6. Conclusions

In this study, we utilized the DEA and Super-SBM techniques to compare and analyze the efficiency of public transportation relative to population and the efficiency of new transportation means by region in South Korea. The results of the study are as follows.
First, the current public transportation status survey was used to examine the efficiency of public transportation per capita in each metropolitan area. As a result of applying the Super-CCR model, which could rank DMUs based on their efficiency scores, Gwangju was ranked first (1) and Daejeon second (2). This can be seen as a positive factor for the efficient supply of additional public transportation means. Similarly, the Super-SBM model results showed that in terms of the CRS efficiency score of 1, Daejeon scored first, Gwangju second, and Busan third when using the super-efficiency measure (C-Super) to rank their efficiency. In the variable scale economies (VRS) V-Super efficiency results, reflecting changes in the relationship between input and output according to scale, Gwangju scored first, Daejeon second, and Seoul third. Ultimately, the efficiency of public transportation in the provincial metropolitan areas was superior to the Seoul Metropolitan Area. In particular, the Daejeon Metropolitan Area ranked high in efficiency in various models. This can be seen as an indicator that can support future decision-makers with additional public transportation policies.
Second, when examining the efficiency of operating expenses for new means of transportation, according to the Super-CCR model, which can rank the superiority and inferiority of DMUs with an efficiency of 1, the tramway ranked first, bimodal tram second, and BRT third. Similarly, the Super-SBM model was used to determine the efficiency ranking of BRT, tramway, and bimodal tram based on the CRS efficiency score of 1. The results were evaluated using the C-Super efficiency to measure ultimate efficiency, and the BRT was found to be most efficient, followed by the tramway in second place and the bimodal tram in third. In the V-Super efficiency results, which took into account VRS, where the relationship between input and output changed depending on the scale, the BRT, tramway, and bimodal tram were still ranked in order of highest efficiency as 1, 2, and 3, respectively.
Third, based on the results obtained using the Super-CCR model, when examining the efficiency resulting from the input of construction costs for new transportation means, the BRT was the most efficient, followed by the bimodal tram in second and the tramway in third place. In a similar context, the results from the Super-SBM model ranked the BRT first based on the CRS efficiency score of 1. In the C-Super efficiency results, the BRT ranked first, the bimodal tram second, and the tramway third. The results of the V-Super using VRS, where the relationship between input and output varied depending on the scale, ranked the tramway first, the bimodal tram second, and the BRT third. Although the Ministry of Land, Infrastructure and Transport and Korea Transportation Safety Authority provide reliable data, there is a lack of thorough and comprehensive research on railway traffic that uses these data.
Based on the efficiency results of this study, the following practical implications can be suggested. First, according to the data of this study, the Daejeon Metropolitan Area incurs more commuting time and public transportation costs than the Seoul Metropolitan Area, despite the high utilization of public transportation compared to the existing population. Ultimately, it is time for policymakers to actively support public transportation by approaching the need to introduce a tramway as a new means of transportation in the Daejeon Metropolitan Area. Second, when examining the cost-effectiveness of constructing and operating tramways, tramways can be the optimal choice in the Daejeon Metropolitan Area compared to other transportation means due to their high transportation capacity.
One limitation of this study is that, although there are two reliable data sources, the study is restricted in its ability to analyze other aspects of the research beyond the virtual scenarios. In addition to serving as a central transportation hub for South Korea, the Daejeon Metropolitan Area needs to expand its existing public transportation infrastructure. The researcher looks forward to follow-up studies focusing on efficiency to ensure a smooth introduction of a tram system in the Daejeon Metropolitan Area.

Funding

This study was supported by Dongyang University.

Institutional Review Board Statement

Not applicable.

Informed Consent Statement

Not applicable.

Data Availability Statement

The data supporting this study’s findings are available upon request from the corresponding author.

Acknowledgments

This study was supported by Dongyang University, which provided the research space and environment in 2022.

Conflicts of Interest

The author declares no conflict of interest.

References

  1. Transport, U.A.P. The Global Tram and Light Rail Landscape 2019–2021. Available online: https://www.uitp.org/publications/the-global-tram-and-light-rail-landscape-2019-21/ (accessed on 4 June 2023).
  2. Xing, Z.; Zhu, J.; Zhang, Z.; Qin, Y.; Jia, L. Energy consumption optimization of tramway operation based on improved PSO algorithm. Energy 2022, 258, 124848. [Google Scholar] [CrossRef]
  3. Yang, J.; Xu, X.; Peng, Y.; Zhang, J.; Song, P. Modeling and optimal energy management strategy for a catenary-battery-ultracapacitor based hybrid tramway. Energy 2019, 183, 1123–1135. [Google Scholar] [CrossRef]
  4. Yang, L.; Majumdar, A.; van Dam, K.H.; Zhang, L. Theories and practices for reconciling transport, public space, and people—A review. Proc. Inst. Civ. Eng.-Munic. Eng. 2022, 175, 187–203. [Google Scholar] [CrossRef]
  5. Mendez, J.; Brown, J.R. The Relationship between streetcars and development activity: An Examination of Portland and Seattle. Transp. Res. Rec. 2019, 2673, 172–182. [Google Scholar] [CrossRef]
  6. Hinners, S.J.; Nelson, A.C.; Buchert, M. Streetcars and Economic Development: Do Streetcars Stimulate Employment Growth? Transp. Res. Rec. 2018, 2672, 339–350. [Google Scholar] [CrossRef]
  7. Viri, R.; Sievers, N.; Liimatainen, H.; Schütze, C.; Siefer, T. Tram Expansion Effects on Reaching the City Centres—Case Study of Tampere and Braunschweig. Future Transp. 2022, 2, 793–806. [Google Scholar] [CrossRef]
  8. Scheurer, J.; Verschuer, M.; Newman, P.; Desha, C. Delivering Tram-Based Boulevards: Learning from Opportunities and Challenges in Three European City Case Studies. J. Transp. Technol. 2023, 13, 262–281. [Google Scholar] [CrossRef]
  9. Alpkokin, P.; Kiremitci, S.T.; Black, J.A.; Cetinavci, S. LRT and street tram policies and implementation in Turkish cities. J. Transp. Geogr. 2016, 54, 476–487. [Google Scholar] [CrossRef]
  10. Hall, C.M.; Le-Klähn, D.-T.; Ram, Y. Tourism, Public Transport and Sustainable Mobility (Tourism Essentials, 4); Channel View Publications: Bristol, UK, 2017. [Google Scholar]
  11. Zarrili, L.; Brito, M. Lisbon experience. Mobility, quality of life and tourist image: A survey. Geoj. Tour. Geosites 2013, 12, 203–213. [Google Scholar]
  12. Tebay, A. Funding Approved for $US 1 bn Daejeon City Light Rail Line 2. Available online: https://www.railjournal.com/passenger/light-rail/funding-approved-for-us-1bn-daejeon-city-light-rail-line-2/ (accessed on 7 June 2023).
  13. Kim, J.Y.; Sim, G.S. An efficiency evaluation on the metropolitan rail transit using DEA. Ind. Econ. Res. 2008, 21, 1697–1723. [Google Scholar]
  14. Kim, H.; Lee, J. An Analysis of Efficiency and Productivity of Metropolitan Urban Railway Corporation. J. Korean Soc. Railw. 2016, 19, 397–407. [Google Scholar] [CrossRef]
  15. Li, J.; Zhang, L.; Liu, B.; Shi, N.; Li, L.; Yin, H. Travel-Energy-Based Timetable Optimization in Urban Subway Systems. Sustainability 2023, 15, 1930. [Google Scholar] [CrossRef]
  16. Givoni, M.; Rietveld, P. The access journey to the railway station and its role in passengers’ satisfaction with rail travel. Transp. Policy 2007, 14, 357–365. [Google Scholar] [CrossRef]
  17. Kager, R.; Bertolini, L.; Te Brömmelstroet, M. Characterisation of and reflections on the synergy of bicycles and public transport. Transp. Res. Part A Policy Pract. 2016, 85, 208–219. [Google Scholar] [CrossRef]
  18. Brueckner, J.K.; Selod, H. The political economy of urban transport-system choice. J. Public Econ. 2006, 90, 983–1005. [Google Scholar] [CrossRef]
  19. Nelson, A.C.; Sanchez, T.W. The effectiveness of urban containment regimes in reducing exurban sprawl. Disp-Plan. Rev. 2005, 41, 42–47. [Google Scholar] [CrossRef]
  20. Fan, Y.; Guthrie, A.; Levinson, D. Impact of light-rail implementation on labor market accessibility. J. Transp. Land Use 2012, 5, 28–39. [Google Scholar]
  21. Yang, J.; Shiwakoti, N.; Tay, R. Passengers’ Perception of Satisfaction and Its Relationship with Travel Experience Attributes: Results from an Australian Survey. Sustainability 2023, 15, 6645. [Google Scholar] [CrossRef]
  22. Moreno, T.; Reche, C.; Rivas, I.; Minguillón, M.C.; Martins, V.; Vargas, C.; Buonanno, G.; Parga, J.; Pandolfi, M.; Brines, M.; et al. Urban air quality comparison for bus, tram, subway and pedestrian commutes in Barcelona. Environ. Res. 2015, 142, 495–510. [Google Scholar] [CrossRef]
  23. Zhang, C.; Dai, S.; Xia, H. Reuse of Abandoned Railways Leads to Urban Regeneration: A Tale from a Rust Track to a Green Corridor in Zhangjiakou. Urban Rail Transit 2020, 6, 104–115. [Google Scholar] [CrossRef]
  24. Knowles, R.D.; Ferbrache, F. Evaluation of wider economic impacts of light rail investment on cities. J. Transp. Geogr. 2016, 54, 430–439. [Google Scholar] [CrossRef]
  25. Cervero, R.; Duncan, M. Benefits of Proximity to Rail on Housing Markets: Experiences in Santa Clara County. J. Public Transp. 2002, 5, 1–18. [Google Scholar] [CrossRef]
  26. Sampaio, B.R.; Neto, O.L.; Sampaio, Y. Efficiency analysis of public transport systems: Lessons for institutional planning. Transp. Res. Part A Policy Pract. 2008, 42, 445–454. [Google Scholar] [CrossRef]
  27. Hass-Klau, C.; Crampton, G.; Benjari, R. Economic Impact of Light Rail-the Results of 15 Urban Areas in France, Germany, UK and North America; Environmental and Transport Planning: Brighton, UK, 2004. [Google Scholar]
  28. Fernandez, R.; Planzer, R. On the capacity of bus transit systems. Transp. Rev. 2002, 22, 267–293. [Google Scholar] [CrossRef]
  29. Rydlewski, M.; Tubis, A.A. Criteria for Assessing the Safety and Functionality of Tram Stops. Sustainability 2022, 14, 13162. [Google Scholar] [CrossRef]
  30. Lope, D.J.; Dolgun, A. Measuring the inequality of accessible trams in Melbourne. J. Transp. Geogr. 2020, 83, 102657. [Google Scholar] [CrossRef]
  31. Cooper, W.W.; Seiford, L.M.; Zhu, J. (Eds.) Handbook on Data Envelopment Analysis; Springer: New York, NY, USA, 2011. [Google Scholar]
  32. Charnes, A.; Cooper, W.W.; Rhodes, E. Evaluating program and managerial efficiency: An application of data envelopment analysis to program follow through. Manag. Sci. 1981, 27, 668–697. [Google Scholar] [CrossRef]
  33. Charnes, A.; Cooper, W.W.; Rhodes, E. Measuring the efficiency of decision making units. Eur. J. Oper. Res. 1978, 2, 429–444. [Google Scholar] [CrossRef]
  34. Farrell, M.J. The measurement of productive efficiency. J. R. Stat. Soc. Ser. A Stat. Soc. 1957, 120, 253–281. [Google Scholar] [CrossRef]
  35. Shephard, R.W. Cost and Production Functions; Springer Science & Business Media: Berlin/Heidelberg, Germany; New York, NY, USA, 2012; Volume 194. [Google Scholar]
  36. Banker, R.D.; Charnes, A.; Cooper, W.W. Some models for estimating technical and scale inefficiencies in data envelopment analysis. Manag. Sci. 1984, 30, 1078–1092. [Google Scholar] [CrossRef]
  37. Cook, W.D.; Tone, K.; Zhu, J. Data envelopment analysis: Prior to choosing a model. Omega 2014, 44, 1–4. [Google Scholar] [CrossRef]
  38. Lee, J.-D.; Oh, D.-H. Efficiency Analysis Theory; Jipil Media Co., Ltd.: Seoul, Republic of Korea, 2012. [Google Scholar]
  39. Tone, K. A slacks-based measure of efficiency in data envelopment analysis. Eur. J. Oper. Res. 2001, 130, 498–509. [Google Scholar] [CrossRef]
  40. Tone, K. A strange case of the cost and allocative efficiencies in DEA. J. Oper. Res. Soc. 2002, 53, 1225–1231. [Google Scholar] [CrossRef]
  41. Fukuyama, H.; Weber, W.L. A directional slacks-based measure of technical inefficiency. Socio-Econ. Plan. Sci. 2009, 43, 274–287. [Google Scholar] [CrossRef]
  42. Korea Transportation Safety Authority & Minitsry of Land, Infrastructure and Transport. 2021 Public Transportation Investigation; Korea Transportation Safety Authority & Minitsry of Land, Infrastructure and Transport: Seoul, Republic of Korea, 2021. [Google Scholar]
  43. Korea Transportation Safety Authority. State of Public Transportation Survey 2021-Overall Findings Report; Korea Transportation Safety Authority: Seoul, Republic of Korea, 2021. [Google Scholar]
Figure 1. Comparison of public transportation efficiency by population by a metropolitan area through the public transportation status survey. V-Super = variable returns to scale (VRS) super efficiency score; SBM C-Super = Slacks-based measure model (SBM) constant returns to scale (CRS) super efficiency score; CCR Super = Charnes–Cooper–Rhodes super efficiency score.
Futuretransp 03 00067 g001
Figure 2. Efficiency comparison by transportation means: (a) Based on the inputs of construction costs; (b) Based on operating expenses. V-Super = various return to scale (VRS) super efficiency score; SBM C-Super = Slacks-based measure model (SBM) constant returns to scale (CRS) super efficiency score; CCR Super = Charnes–Cooper–Rhodes super efficiency score.
Futuretransp 03 00067 g002
Table 1. Comparative satisfaction trends of public transportation users by region from 2019 to 2021.
Metropolitan AreaSatisfaction Index by YearDifference between 2019 and 2021
201920202021
Seoul5.104.914.93−0.17(1)
Inchon4.734.694.780.05(6)
Daejeon5.135.055.04−0.09(3)
Busan4.984.904.92−0.06(4)
Daegu5.024.834.89−0.13(2)
Gwangju4.964.884.95−0.01(5)
Note: The statistics in the table are from Korea Transportation Safety Authority’s 2021 Public Transportation Investigation [42].
Table 2. Average operating expenses by new means of transportation.
DivisionBRTBimodal TramTramwayLight Rail
Operating expenses (100 million KRW/km)3.2665.4436.96712.846
Note: The statistics in the table are from the ‘Guidelines for selecting new means of transportation’ included in the State of Public Transportation Survey 2021-Overall Findings Report [43]. BRT = bus rapid transit; KRW = Korean won.
Table 3. Average construction costs by new means of transportation.
DivisionBRTBimodal TramTramwayLight Rail
Construction cost (100 million KRW/km)32.977115.989227.429526.499
Note: The statistics in the table are from the ‘Guidelines for selecting new means of transportation’ included in the State of Public Transportation Survey 2021-Overall Findings Report [43]. BRT = bus rapid transit; KRW = Korean won.
Table 4. Traffic sharing by new means of transportation (excluding other figures).
DivisionMeans Sharing Ratio Applied Value (%)
BRT, bimodal tramSeoul27.12
Metropolitan area (excluding Seoul)33.90
Provincial metropolitan city15.98
TramwaySeoul23.37
Metropolitan area (excluding Seoul)20.40
Provincial metropolitan city10.39
Others7.97
Light railSeoul19.63
Metropolitan area (excluding Seoul)6.9
Provincial metropolitan city5.0
Note: The statistics in the table are from the ‘Guidelines for selecting new means of transportation’ included in the State of Public Transportation Survey 2021-Overall Findings Report [43]. BRT = bus rapid transit.
Table 5. Public transportation status compared by taking into account population by region based on a survey on public transportation status.
RegionPop. (k)MRT Traffic Rat. (%)Avg. Transit t (min)Car-Transit Time RatioAvg. Public Trans. vs. Taxi CostAvg. Daily RR Pass.Rail Sat. Changes
Seoul9436.061.067.51.430.6227,997.01.00
Gyeonggi-do (Incheon)13,583.061.067.51.400.629379.06.00
Deajeon1446.026.073.01.720.6616,122.03.00
Busan3378.040.063.01.420.5513,865.04.00
Deagu2365.043.075.51.690.6920,756.02.00
Gwangju1432.016.074.52.390.897379.05.00
Note: The statistics in the table are from the ‘Guidelines for selecting new means of transportation’ included in the State of Public Transportation Survey 2021-Overall Findings Report [43]. Pop. (k) = population (thousand); MRT traffic rat. (%) = metropolitan railway transfer traffic ratio (%); avg. transit t (min) = average transit time (minutes); car-transit time ratio = amount of time a car takes to the average transit time ratio of public transportation; avg. public trans. vs. taxi cost = average cost of public transportation compared to the cost of using a taxi; avg. daily RR pass. = average daily number of railroad passengers; rail sat. changes = perceived railway satisfaction changes.
Table 6. Comparison of average operating costs, construction costs, and other statuses by transportation mode.
Div.Op. Exp. (KRW 100 M/km)Const. Exp. (KRW 100 M/km)Trips (t/h)Max. Trans. Cap. (Name/Time/Dir.)Rush Hour Int. (min)Vehicle Arr. (veh./t)Max. Pass. (ppl)Trans. (%)
BRT326632.97715024,3006015416
Bi- tram5443115.98915072,9006018316
Tramway6967227.4294035,640180129710
Light rail12,846526.4994031,86018021325
Note: The statistics in the table are from ‘Guidelines for selecting new means of transportation’ included in the State of Public Transportation Survey 2021-Overall Findings Report [43]. Div. = division; op. exp. (KRW 100M/km) = operating expenses (KRW 100 million/km); const. exp. (KRW 100M/km) = construction expenses (KRW 100 million/km); trips (t/h) = number of trips (times/hours); max. trans. cap. (name/time/dir.) = maximum transport capacity (name/time/direction); rush hour int. (min) = rush hour interval (minutes); vehicle arr. (veh./t) = vehicle arrangement (vehicle/times); max. pass. (ppl) = maximum number of passengers (persons); trans. (%) = transport share (%); BRT = bus rapid transit; bi-tram = bimodal tram.
Table 7. Variable definitions for data envelopment analysis.
VariableVariable Definitions
Public Transportation Status SurveyGuidelines for Selecting New Transportation
InputX: Total population by metropolitan areaX1/2: Average operating cost/average construction cost by new means of transportation
OutputY1: Transit traffic ratio of metropolitan railwaysY1: Number of trips
Y2: Average transit time for public transportationY2: Maximum transport capacity
Y3: Average hours spent on public transportation versus in taxisY3: Rush hour interval
Y4: Average cost of public transportation versus the cost of taxisY4: Number of vehicle arrangements
Y5: Average daily number of railroad passengersY5: Maximum number of passengers
Y6: Differences in perceived railway satisfaction by regionY6: Transportation share ratio by new means of transportation
Table 8. Descriptive statistics of variables.
Div.Public Transportation Status Survey VariablesNum.Max.Min.Avg.SD
InputX: Total population by metropolitan area31,64013.58314325273.32064.2
OutputY1: Transit traffic ratio of metropolitan railways247.061.016.041.27.4
Y2: Average transit time for public transportation421.075.56370.22.0
Y3: Average public transportation hours compared to cab hours10.02.391.41.70.2
Y4: Average public transportation cost compared to cab cost4.00.890.550.70.0
Y5: The average number of people using the railroad per day95,49827,9977379.015,916.33105.0
Y6: Changes in perception of railway satisfaction by region21.06.01.03.50.8
Note: div. = division; num. = number; max. = maximum; min. = minimum; avg. = average; SD = standard deviation.
Table 9. Descriptive statistics of variables.
Div.Guidelines for Selecting New Transportation VariablesNum.Max.Min.Avg.SD
InputX1: Average operating cost by new means of transportation28,522.012,846.03266.07130.54101.9
X2: Average construction cost by new means of transportation902.9526.533.0225.7215.8
OutputY1: Number of trips6211.50.6
Y2: Maximum transport capacity164,700.072,900.024,300.041,175.021,669.1
Y3: Rush hour interval6211.50.6
Y4: Number of vehicle arrangements5211.20.5
Y5: Maximum number of passengers566.0297.054.0141.5108.5
Y6: Transportation share ratio by new means of transportation47.016.05.011.85.3
Note: div. = division; num. = number; max. = maximum; min. = minimum; avg. = average; SD = standard deviation.
Table 10. Comparison of public transportation efficiency by population by metropolitan area through the public transportation status survey.
CCRBCCSBM
InputOutputSuperInputOutputCRSC-SuperVRSV-Super
Seoul0.42.80.4 (5/6)110.10.1 (6/6)11.1 (3/6)
Gyeonggi-do (Incheon)0.240.2 (6/6)110.10.1 (5/6)11.0 (6/6)
Daejeon111.4 (2/6)1111.1 (1/6)11.2 (2/6)
Busan0.71.50.7 (4/6)110.40.4 (4/6)11.0 (5/6)
Daegu111.0 (3/6)1111.0 (3/6)11.1 (4/6)
Gwangju111.7 (1/6)1111.0 (2/6)11.2 (1/6)
Note: CCR = Charnes–Cooper–Rhodes model; BCC = Banker–Charnes–Cooper model; SBM = Slacks-based measure model; CRS = constant returns to scale; C-Super = constant returns to scale (CRS) super efficiency score; VRS = variable returns to scale; V-Super = variable returns to scale (VRS) super efficiency score.
Table 11. Efficiency comparison by transportation means based on the input of operating expenses.
CCRBCCSBM
InputOutputSuperInputOutputCRSC-SuperVRSV-Super
BRT111.7 (3/4)1111.3 (1/4)11.7 (1/4)
Bimodal tram111.8 (2/4)1111 (3/4)11.1 (3/4)
Tramway112.6 (1/4)1111.1 (2/4)11.3 (2/4)
Light rail0.51.90.5 (4/4)110.30.3 (4/4)11.1 (4/4)
Note: CCR = Charnes–Cooper–Rhodes model; BCC = Banker–Charnes–Cooper model; SBM = Slacks-based measure model; CRS = constant returns to scale; C-Super = constant returns to scale (CRS) super efficiency score; VRS = variable returns to scale; V-Super = variable returns to scale (VRS) super efficiency score.
Table 12. Efficiency comparison by transportation means based on the input of construction costs.
CCRBCCSBM
InputOutputSuperInputOutputCRSC-SuperVRSV-Super
BRT113.5 (1/4)1112.5 (1/4)11 (3/4)
Bimodal tram0.91.20.9 (2/4)110.30.3 (2/4)11.1 (2/4)
Tramway0.81.30.8 (3/4)110.20.2 (3/4)11.3 (1/4)
Light rail0.26.50.2 (4/4)110.10.1 (4/4)11 (4/4)
Note: CCR = Charnes–Cooper–Rhodes model; BCC = Banker–Charnes–Cooper model; SBM = Slacks-based measure model; CRS = constant returns to scale; C-Super = constant returns to scale (CRS) super efficiency score; VRS = variable returns to scale; V-Super = variable returns to scale (VRS) super efficiency score; BRT = bus rapid transit.
Disclaimer/Publisher’s Note: The statements, opinions and data contained in all publications are solely those of the individual author(s) and contributor(s) and not of MDPI and/or the editor(s). MDPI and/or the editor(s) disclaim responsibility for any injury to people or property resulting from any ideas, methods, instructions or products referred to in the content.

