
Barriers and Facilitators of People with and without Disabilities before and after Autonomous Shuttle Exposure

 , , , ,
Abstract
:1. Introduction
1.1. Literature Review
1.2. Rationale, Significance, and Purpose
2. Materials and Methods
2.1. Design
2.2. Recruitment
2.3. Participants
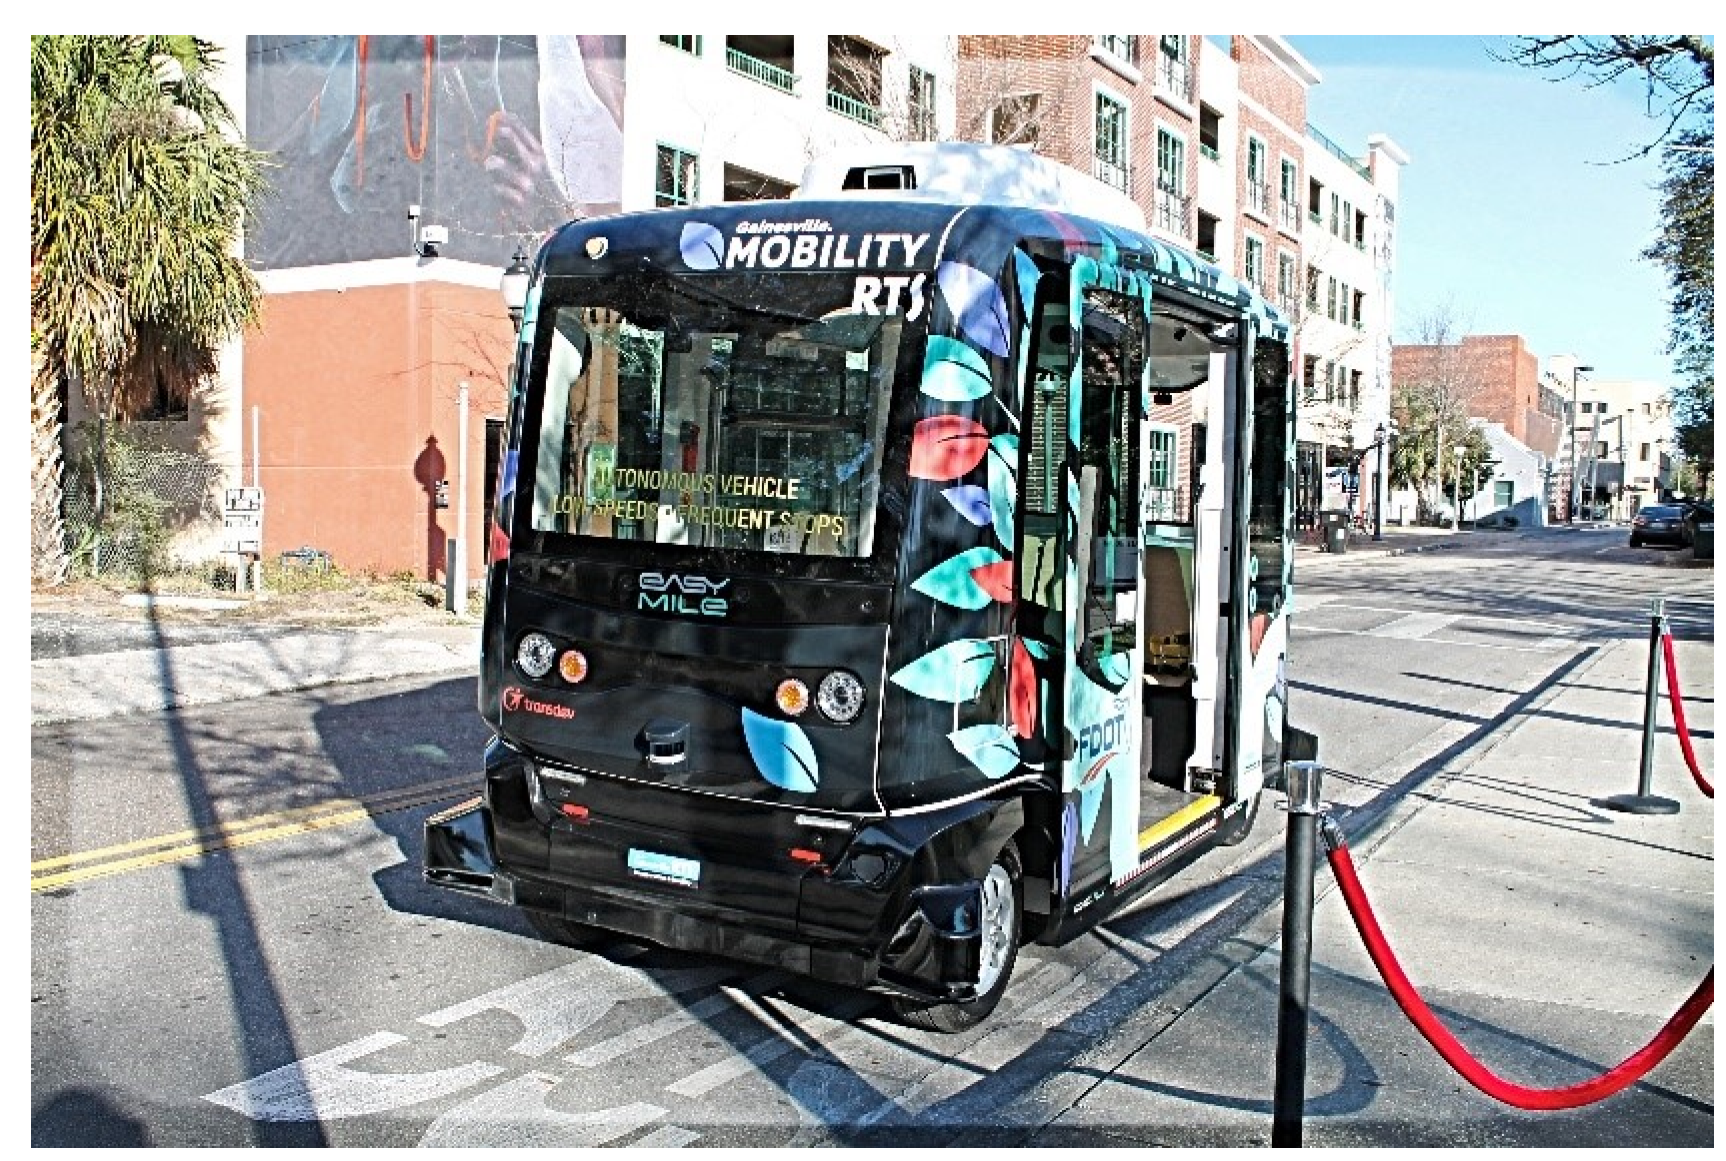
2.4. Equipment
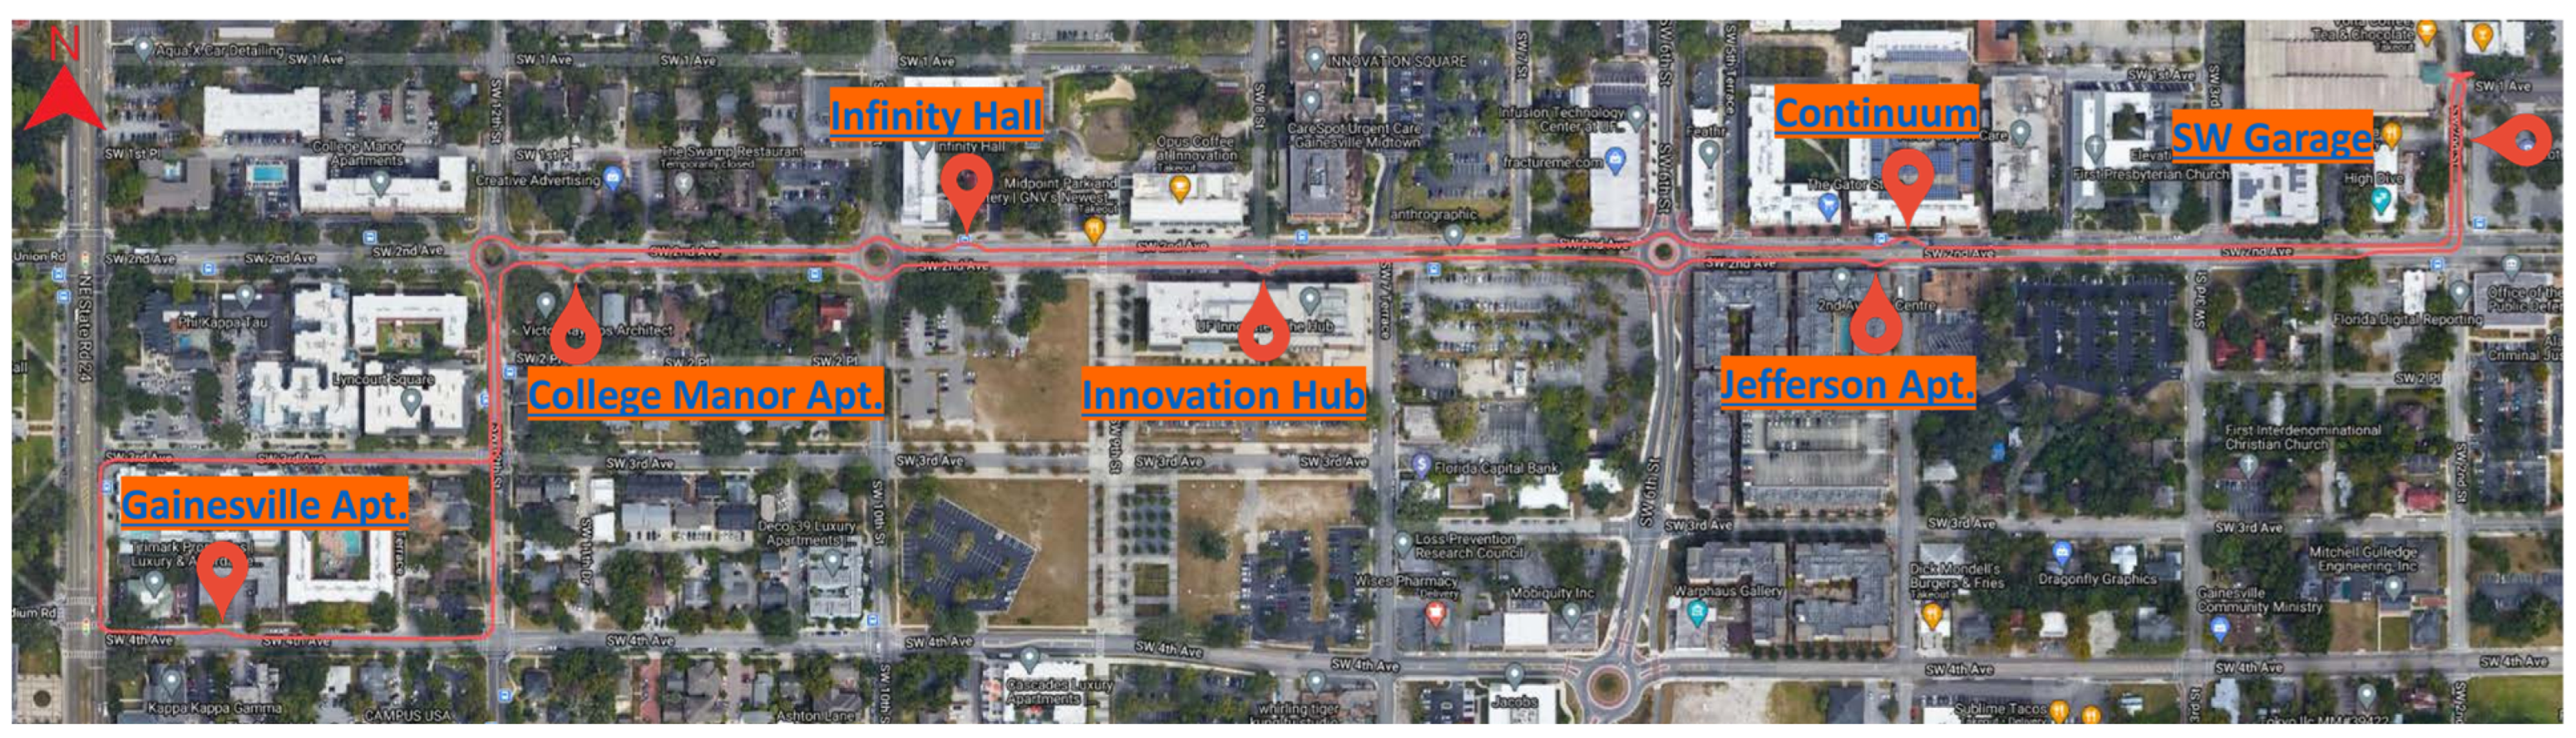
2.5. Procedure
2.6. Measures
2.7. Data Collection and Management
2.8. Data Analysis
3. Results
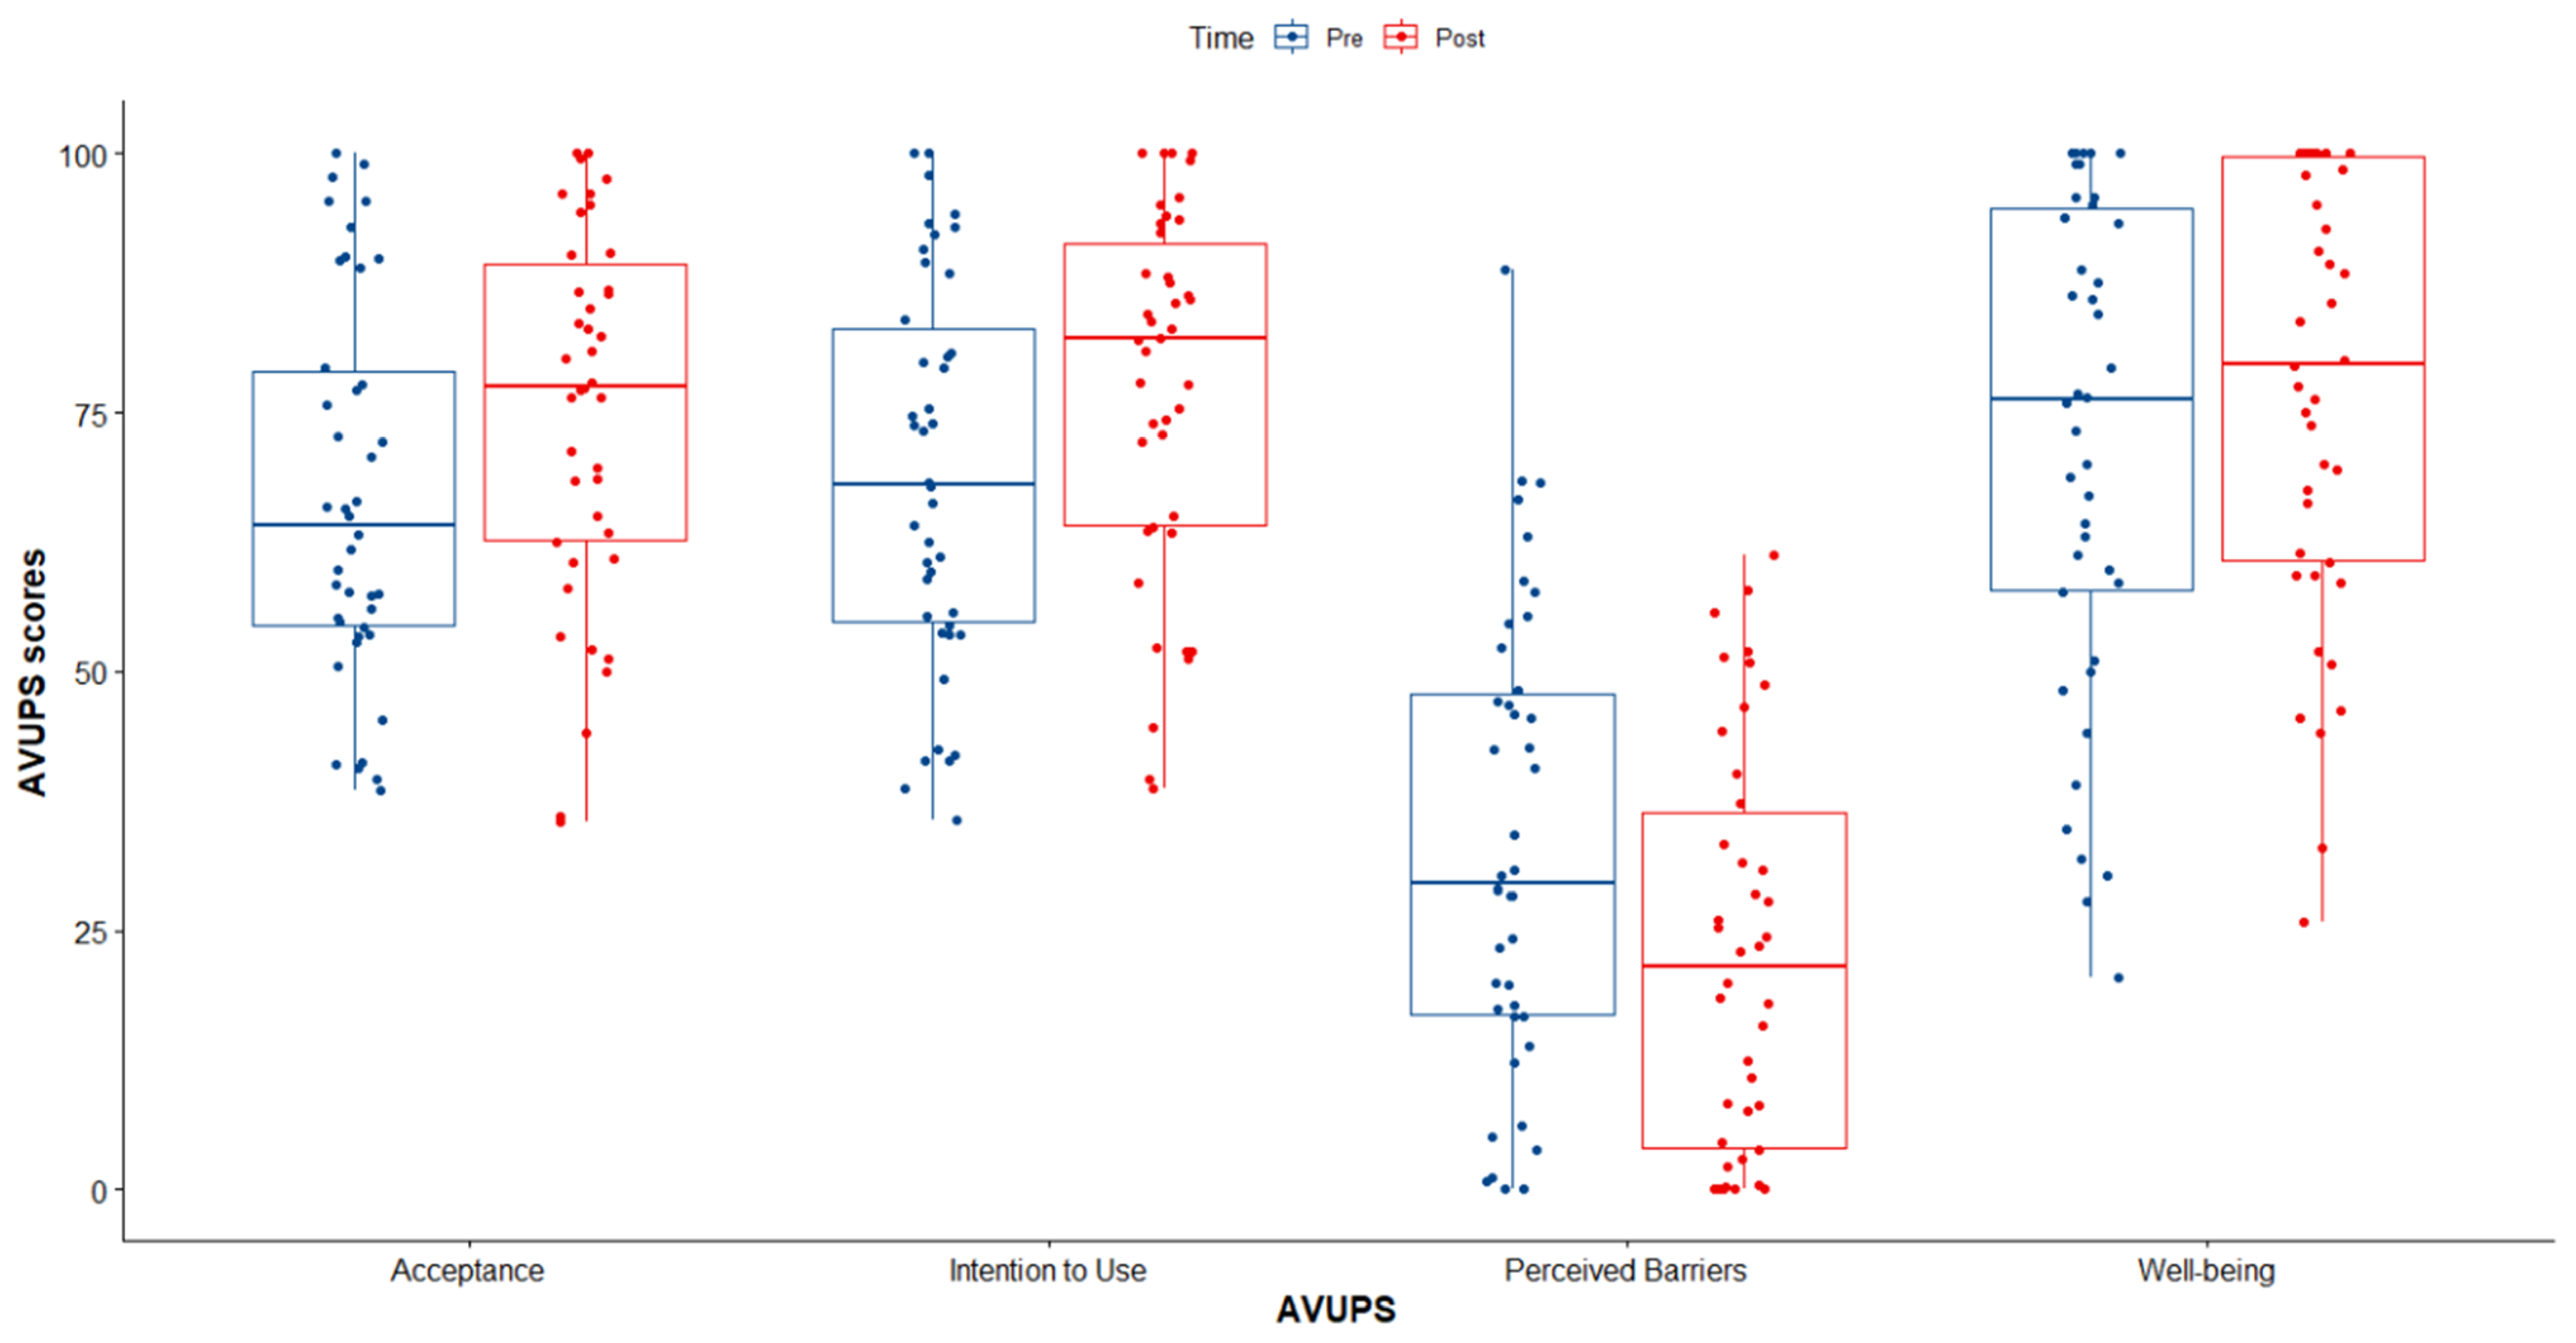
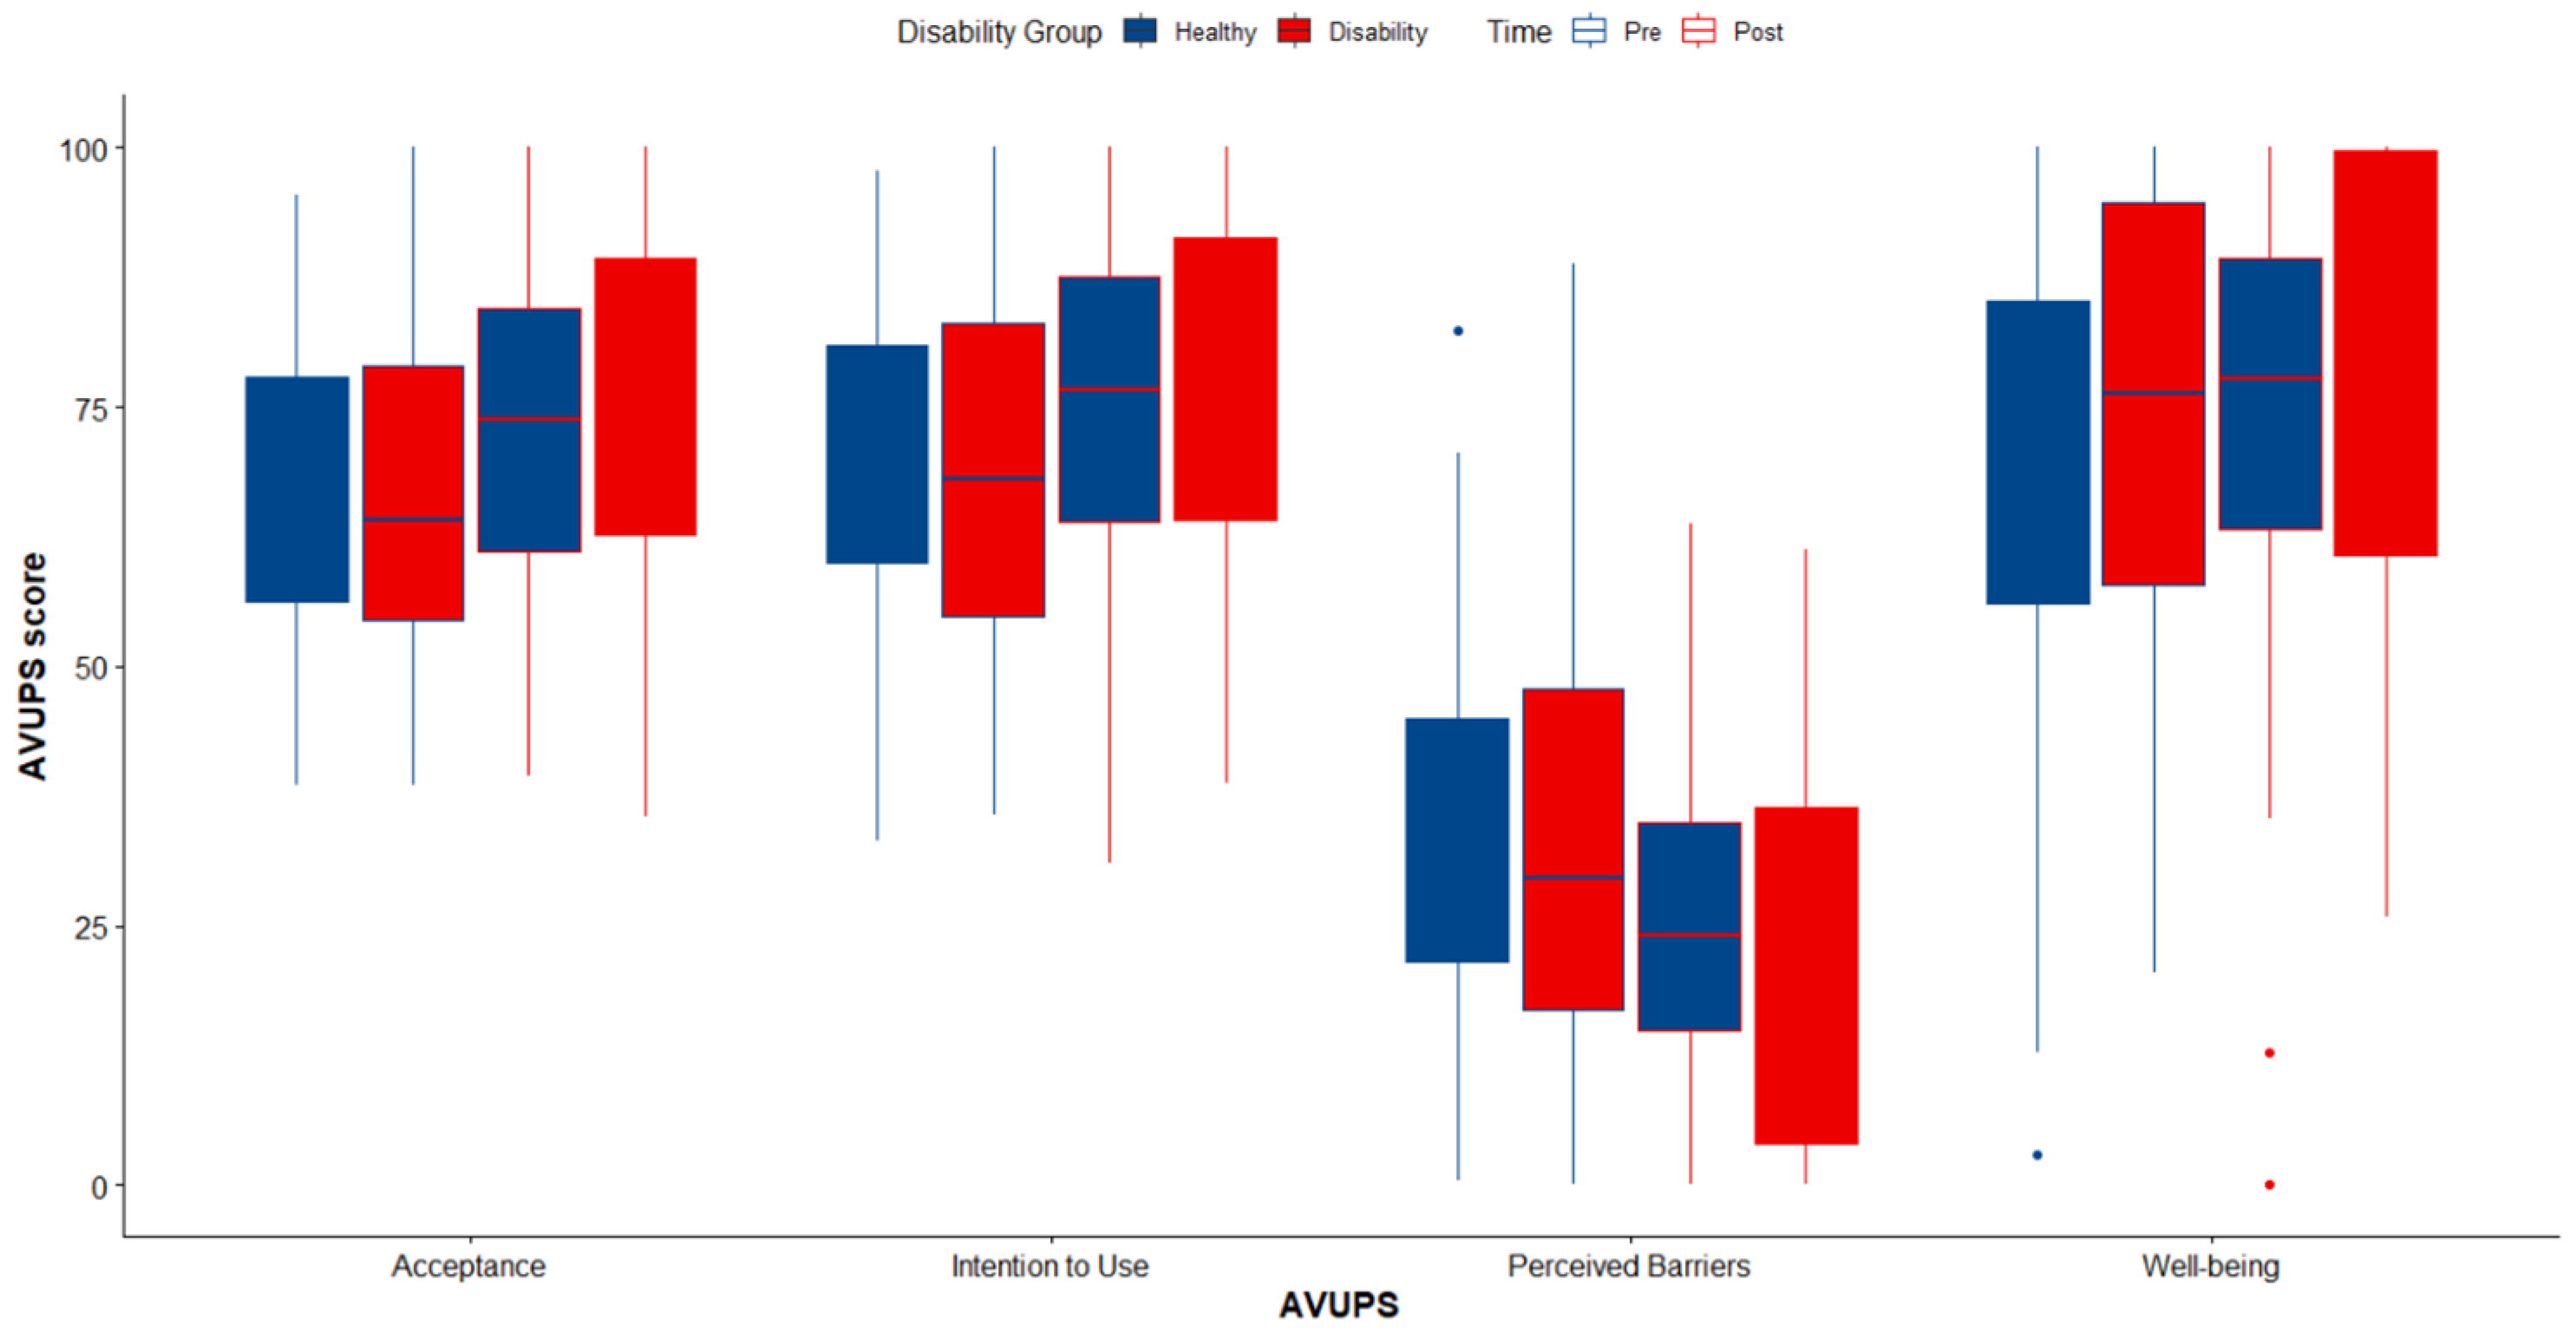
3.1. Objective 1. Perceptions of PWDs before and after Riding in an Autonomous Shuttle
3.2. Objective 2. Predictive Model of Autonomous Shuttle Acceptance from Able-Bodied Drivers and PWDs (N = 143)
4. Discussion
- In addition to current pilot deployment efforts, additional actions should be taken to ensure equity in the use of the AS for “other” racial/ethnic groups.
- Institute meaningful and more flexible routes to transport residents of the “other” racial groups to connector hubs for additional transportation use or to places of vocation.
- Consider offering neighborhood rides to local grocery stores, banks, libraries, or shopping centers.
- Make demonstration shuttle rides a meaningful mode of transportation to serve a functional purpose, i.e., connecting people to places of interest, work locations, or locations connected to service opportunities.
- Handrails may be required on the shuttle ramps for safe and convenient entry and egress (accessibility).
- Assistance may be needed for on-boarding and off-boarding of passengers carrying groceries (acceptability).
- Designated areas must be secured for passengers stowing oxygen cylinders (safety and accessibility).
- Clear messaging (auditory, visual, and/or haptic) must be provided inside the shuttle to orient passengers towards locations and destinations (accessibility and adaptability).
- More flexible route options must emerge because fixed routes do not optimally serve these populations and their needs (availability and adaptability).
- Innovative business models to off-set costs for mobility vulnerable populations (affordability).
- Provide demonstration rides at local community centers;
- Organize show-and-tell rides and neighborhood trail rides;
- In concert with trusted community and advocacy organizations, conduct community workshops, roundtable discussions, and educational sessions pertaining to the AS.
4.1. Limitations
4.2. Strengths
5. Conclusions
Author Contributions
Funding
Institutional Review Board Statement
Informed Consent Statement
Data Availability Statement
Acknowledgments
Conflicts of Interest
References
- Senior Resource Alliance. Transportation Facts for Seniors 2.1 Senior Friendly Transportation. 2007. Available online: http://seniorresourcealliance.org/wp-content/uploads/2012/04/seniorfriendlytrans2_1.pdf (accessed on 5 September 2022).
- Erickson, W.; Lee, C.; von Schrader, S. 2017 Disability status report: United States, 2023; Ithaca, NY: Cornell University Yang Tan Institute on Employment and Disability (YTI). Available online: https://www.disabilitystatistics.org/reports/2017/English/HTML/report2017.cfm#introduction (accessed on 31 October 2022).
- American Association of Retired Persons (AARP). Caregiving in the U.S. National Alliance for Caregiving (NAC) and AARP Public Policy Institute, Washington, D.C. 2015. Available online: http://www.caregiving.org/wp-content/uploads/2015/05/2015_CaregivingintheUS_Final-Report-June-4_WEB.pdf (accessed on 31 October 2022).
- Claypool, H.; Bin-Nun, A.; Gerlach, J. Self-Driving Cars: The Impact on People with Disabilities. Newton, MA: Ruderman Family Foundation. 2017. Available online: https://rudermanfoundation.org/wp-content/uploads/2017/08/Self-Driving-Cars-The-Impact-on-People-with-Disabilities_FINAL.pdf (accessed on 31 October 2022).
- National Highway Traffic Safety Administration (NHTSA); U.S. Department of Transportation (USDOT). Automated driving Systems 2.0: A Vision for Safety. National Highway Traffic Safety Administration, Washington, D.C. 2017. Available online: https://www.nhtsa.gov/sites/nhtsa.gov/files/documents/13069a-ads2.0_090617_v9a_tag.pdf (accessed on 31 October 2022).
- Kassens-Noor, E.; Kotval-Karamchandani, Z.; Cai, M. Willingness to ride and perceptions of autonomous public transit. Transp. Res. Part A Policy Pract. 2020, 138, 92–104. [Google Scholar] [CrossRef]
- Krueger, R.; Rashidi, T.H.; Rose, J.M. Preferences for shared autonomous vehicles. Transp. Res. Part C Emerg. Technol. 2016, 69, 343–355. [Google Scholar] [CrossRef]
- Howard, D.; Dai, D. Public perceptions of self-driving cars: The case of Berkeley, California. In Proceedings of the Transportation Research Board 93rd Annual Meeting, Washington, D.C., USA, 12–16 January 2014; Volume 14, pp. 1–16. Available online: https://www.ocf.berkeley.edu/~djhoward/reports/Report%20-%20Public%20Perceptions%20of%20Self%20Driving%20Cars.pdf (accessed on 21 September 2022).
- Hwang, J. Improving Mobility of People with Disabilities: The Potential of Autonomous Vehicle Transportation Service and The Role of The Built Environment. Ph.D. Thesis, Texas A&M University, College Station, TX, USA, 26 May 2020. Available online: https://oaktrust.library.tamu.edu/handle/1969.1/192324 (accessed on 21 September 2022).
- Fagnant, D.J.; Kockelman, K. Preparing a nation for autonomous vehicles: Opportunities, barriers and policy recommendations. Transp. Res. Part A Pol. Pract. 2015, 77, 167–181. [Google Scholar] [CrossRef]
- Hwang, J.; Li, W.; Stough, L.; Lee, C.; Turnbull, K. A focus group study on the potential of autonomous vehicles as a viable transportation option: Perspectives from people with disabilities and public transit agencies. Transp. Res. Part F Traffic Psychol. Behav. 2020, 70, 260–274. [Google Scholar] [CrossRef]
- Bennett, R.; Vijaygopal, R.; Kottasz, R. Attitudes towards autonomous vehicles among people with physical disabilities. Transp. Res. Part A Pol. Pract. 2019, 127, 1–17. [Google Scholar] [CrossRef]
- Classen, S.; Mason, J.; Hwangbo, S.W.; Wersal, J.; Rogers, J.; Sisiopiku, V. Older drivers’ experience with automated vehicle technology. J. Transp. Health 2021, 22, 101107. [Google Scholar] [CrossRef]
- Classen, S.; Mason, J.; Wersal, J.; Sisiopiku, V.; Rogers, J. Older Drivers’ Experience with Automated Vehicle Technology: Interim Analysis of a Demonstration Study. Front. Sustain. Cities 2020, 2, 27. [Google Scholar] [CrossRef]
- Bagloee, S.A.; Tavana, M.; Asadi, M.; Oliver, T. Autonomous vehicles: Challenges, opportunities, and future implications for transportation policies. J. Mod. Transp. 2016, 24, 284–303. [Google Scholar] [CrossRef] [Green Version]
- Hulse, L.M.; Xie, H.; Galea, E.R. Perceptions of autonomous vehicles: Relationships with road users, risk, gender, and age. Saf. Sci. 2018, 102, 1–13. [Google Scholar] [CrossRef]
- Kyriakidis, M.; Happee, R.; Winter, J.C.F.D. Public opinion on automated driving: Results of an international questionnaire among 5000 respondents. Transp. Res. Part F Traffic Psychol. Behav. 2015, 32, 127–140. [Google Scholar] [CrossRef]
- Nordhoff, S.; de Winter, J.; Kyriakidis, M.; van Arem, B.; Happee, R. Acceptance of driverless vehicles: Results from a large cross-national questionnaire study. J. Adv. Transp. 2018, 2018, 5382192. [Google Scholar] [CrossRef] [Green Version]
- Robertson, R.D.; Woods-Fry, H.; Vanlaar, W.G.M.; Mainegra Hing, M. Automated vehicles and older drivers in Canada. J. Saf. Res. 2019, 70, 193–199. [Google Scholar] [CrossRef]
- Madigan, R.; Louw, T.; Dziennus, M.; Graindorge, T.; Ortega, E.; Graindorge, M.; Merat, N. Acceptance of Automated Road Transport Systems (ARTS): An adaptation of the UTAUT model. Transp. Res. Proc. 2016, 14, 2217–2226. [Google Scholar] [CrossRef] [Green Version]
- Charness, N.; Yoon, J.S.; Souders, D.; Stothart, C.; Yehnert, C. Predictors of attitudes toward autonomous vehicles: The roles of age, gender, prior knowledge, and personality. Front. Psychol. 2018, 9, 2589. [Google Scholar] [CrossRef] [Green Version]
- Haghzare, S.; Campos, J.L.; Bak, K.; Mihailidis, A. Older adults’ acceptance of fully automated vehicles: Effects of exposure, driving style, age, and driving conditions. Accid. Anal. Prev. 2021, 150, 105919. [Google Scholar] [CrossRef] [PubMed]
- Classen, S.; Sisiopiku, V.P.; Mason, J.R.; Yang, W.; Hwangbo, S.W.; McKinney, B.; Li, Y. Experience of drivers of all age groups in accepting autonomous vehicle technology. J. Intel. Transp. Sys. 2023, in press. [Google Scholar] [CrossRef]
- Classen, S.; Mason, J.; Burns, H.; Joseph, J.; Fox, E.; E, H.; Snyder, H.; Denmark, L.; Hanson, C.S. Perceptions of adults with Spinal Cord Injury or disease before and after riding in an autonomous shuttle. Am. J. Occup. Ther. 2022, 76 (Suppl. S1), 7610510208p1. [Google Scholar] [CrossRef]
- Mason, J.; Classen, S.; Wersal, J.; Sisiopiku, V.P. Establishing face and content validity of a survey to assess users’ perceptions of automated vehicles. Transp. Res. Rec. 2020, 2674, 538–547. [Google Scholar] [CrossRef]
- Mason, J.; Classen, S.; Wersal, J.; Sisiopiku, V. Construct validity and test-retest reliability of the automated vehicle user perception survey. Front. Psychol. 2021, 12, 626791. [Google Scholar] [CrossRef]
- Classen, S.; Mason, J.; Manjunatha, P.; Elefteriadou, L. Develop, Refine, and Validate a Survey to Assess Adult’s Perspectives of Autonomous Ride-Sharing Services. U.S. Department of Transportation. 2021. Available online: https://rosap.ntl.bts.gov/view/dot/61849 (accessed on 21 September 2022).
- The Americans with Disabilities Act. The ADA & Accessible Ground Transportation. Available online: https://adata.org/factsheet/ADA-accessible-transportation (accessed on 11 April 2023).
- Guidry-Grimes, L.; Savin, K.; Stramondo, J.A.; Reynolds, J.M.; Tsaplina, M.; Burke, T.B.; Ballantyne, A.; Kittay, E.F.; Stahl, D.; Scully, J.L.; et al. Disability rights as a necessary framework for crisis standards of care and the future of health care. Hastings Cent. Rep. 2020, 50, 28–32. [Google Scholar] [CrossRef]
- Dujardin, K.; Duhem, S.; Guerouaou, N.; Djelad, S.; Drumez, E.; Duhamel, A.; Bombois, S.; Nasreddine, Z.; Bordet, R.; Deplanque, D. Validation in French of the Montreal Cognitive Assessment 5-Minute, a brief cognitive screening test for phone administration. Rev Neurol. 2021, 177, 972–979. [Google Scholar] [CrossRef] [PubMed]
- US Department of Health & Human Services. Clinical Research Study Investigator’s Toolbox. Available online: https://www.nia.nih.gov/research/clinical-research-study-investigators-toolbox#forms (accessed on 1 January 2021).
- Parasuraman, A. Technology Readiness Index (TRI): A multiple-item scale to measure readiness to embrace new technologies. J. Serv. Res. 2000, 2, 307–320. [Google Scholar] [CrossRef]
- Parasuraman, A.; Colby, C.L. An updated and streamlined Technology Readiness Index: TRI 2.0. J. Serv. Res. 2015, 18, 59–74. [Google Scholar] [CrossRef]
- Davis, F.D. Perceived usefulness, perceived ease of use, and user acceptance of information technology. MIS Q. 1989, 13, 319–340. [Google Scholar] [CrossRef] [Green Version]
- Stalvey, B.T.; Owsley, C.; Sloane, M.E.; Ball, K. The Life Space Questionnaire: A measure of the extent of mobility of older adults. J. Appl. Geront. 1999, 18, 460–478. Available online: https://journals.sagepub.com/doi/pdf/10.1177/073346489901800404 (accessed on 18 March 2020). [CrossRef]
- Owsley, C.; Stalvey, B.; Wells, J.; Sloane, M.E. Older drivers and cataract: Driving habits and crash risk. J. Gerontol. Med. Sci. 1999, 54, M203–M211. [Google Scholar] [CrossRef] [PubMed] [Green Version]
- Harris, P.A.; Taylor, R.; Minor, B.L.; Elliott, V.; Fernandez, M.; O’Neal, L.; McLeod, L.; Delacqua, G.; Delacqua, F.; Kirby, J.; et al. The REDCap consortium: Building an international community of software platform partners. J. Biomed. Inform. 2019, 95, 103208. [Google Scholar] [CrossRef]
- R Core Team. R: A Language and Environment for Statistical Computing; R Foundation for Statistical Computing: Vienna, Austria, 2020; Available online: https://www.R-project.org/ (accessed on 9 July 2022).
- Ripley, B.; Venables, B.; Bates, D.M.; Hornik, K.; Gebhardt, A.; Firth, D. Package ‘MASS’ version 7.3-54. 2021. Available online: https://cran.r-project.org/web/packages/MASS/MASS.pdf (accessed on 28 February 2022).
- Fox, J.; Weisberg, S.; Price, B.; Adler, D.; Bates, D.; Baud-Bovy, G.; Bolker, B.; Ellison, S.; Firth, D.; Friendly, M.; et al. CAR: Companion to Applied Regression. R Package Version 3.0-11. 2021. Available online: https://cran.r-project.org/web/packages/car/car.pdf (accessed on 28 February 2022).
- Brinkley, J.; Posadas, B.; Woodward, J.; Gilbert, J.E. Opinions and preferences of blind and low vision consumers regarding self-driving vehicles: Results of focus group discussions. In Proceedings of the 19th International ACM SIGACCESS Conference on Computers and Accessibility, Baltimore, MD, USA, 20 October–1 November 2017; pp. 290–299. Available online: http://drivelab.org/wp-content/uploads/2017/11/OpinionsPreferencesBVI.pdf (accessed on 31 October 2022).
- Brinkley, J.; Huff, E.W.; Posadas, B.; Woodward, J.; Daily, S.B.; Gilbert, J.E. Exploring the needs, preferences, and concerns of persons with visual impairments regarding autonomous vehicles. ACM Trans. Access. Comp. 2020, 13, 1–34. [Google Scholar] [CrossRef]
- Brewer, R.N.; Kameswaran, V. Understanding the power of control in autonomous vehicles for people with vision impairment. In Proceedings of the 20th International ACM SIGACCESS Conference on Computers and Accessibility, Galway, Ireland, 22–24 October 2018; Association for Computing machinery: New York, NY, USA, 2018; pp. 185–197. [Google Scholar] [CrossRef]
- Bernhard, C.; Oberfeld, D.; Hoffmann, C.; Weismüller, D.; Hecht, H. User acceptance of automated public transport: Valence of an autonomous minibus experience. Transp. Res. Part F Traffic Psychol. Behav. 2020, 70, 109–123. [Google Scholar] [CrossRef]
- Chinen, K.; Sun, Y.; Matsumoto, M.; Chun, Y.Y. Towards a sustainable society through emerging mobility services: A case of autonomous buses. Sustainability 2020, 12, 9170. [Google Scholar] [CrossRef]
- Xu, Z.; Zhang, K.; Min, H.; Wang, Z.; Zhao, X.; Liu, P. What drives people to accept automated vehicles? Findings from a field experiment. Transp. Res. Part C Emerg. Technol. 2018, 95, 320–334. [Google Scholar] [CrossRef]


| Variables | Original | Relabeled |
|---|---|---|
| Driver status | Active Inactive | 1 0 |
| Age group | Older adult Younger to middle-aged adult | 1 0 |
| Sex | Male Female | 1 0 |
| Disability status | PWD Able-bodied adult | 1 0 |
| Employment | Full-time and part-time Other classification | 1 0 |
| Education | Bachelor’s, master’s, or doctorate degree Other classification | 1 0 |
| Marital status | Married or domestic partnership Other classification | 1 0 |
| Race/ethnicity | White Other classification | 1 0 |
| Group | |||
|---|---|---|---|
| Factor | Value | PWDs Frequency (%) | Able-Bodied Drivers Frequency (%) |
| Race/Ethnicity | Asian or Pacific Islander | 0 (0%) | 18 (18%) |
| African American or Black | 25 (60%) | 10 (10%) | |
| White | 14 (33%) | 64 (63%) | |
| Hispanic or Latino | 0 (0%) | 5 (5%) | |
| Multiracial | 2 (5%) | 1 (1%) | |
| Would rather not say | 0 (0%) | 2 (2%) | |
| Other | 1 (2%) | 1 (1%) | |
| Education | No high school diploma | 4 (10%) | 0 (0%) |
| High school graduate or equivalent | 14 (33%) | 3 (3%) | |
| Some college credits | 8 (19%) | 16 (15%) | |
| Trade, technical, or vocational training | 1 (2%) | 1 (1%) | |
| Associate degree | 1 (2%) | 11 (11%) | |
| Bachelor’s degree | 9 (22%) | 28 (28%) | |
| Master’s degree | 4 (10%) | 28 (28%) | |
| Doctorate | 1 (2%) | 14 (14%) | |
| Marital Status | Single | 19 (45%) | 34 (34%) |
| Married or domestic partnership | 9 (22%) | 52 (51%) | |
| Widowed | 3 (7%) | 7 (7%) | |
| Divorced | 11 (26%) | 8 (8%) | |
| Employment | Part-time | 4 (10%) | 12 (12%) |
| Full-time | 3 (7%) | 15 (15%) | |
| Retired | 11 (26%) | 47 (46%) | |
| Unable to work | 8 (19%) | 3 (3%) | |
| Student | 7 (17%) | 24 (24%) | |
| Homemaker | 1 (2%) | 0 (0%) | |
| Unemployed | 8 (19%) | 0 (0%) | |
| Variable | N | Mean | SD | Median | Min | Max | Total Score | |
|---|---|---|---|---|---|---|---|---|
| Optimism | 143 | 4.43 | 0.55 | 4 | 3 | 5 | 5 | |
| Perceived ease of use | 143 | 5.13 | 1.07 | 5 | 2 | 7 | 7 | |
| Life space | 143 | 5.34 | 1.15 | 5 | 0 | 7 | 9 | |
| Age | 143 | 53.42 | 20.99 | 59 | 19 | 85 | - | |
| AVUPS (pre) | Intention to Use Perceived Barriers Well-being Acceptance | 143 143 143 143 | 69.58 33.33 69.81 67.13 | 15.32 19.46 22.42 15.44 | 68 31 74 65 | 0 33 0 3 | 100 100 89 100 | 100 100 100 100 |
| AVUPS (post) | Intention to Use Perceived Barriers Well-being Acceptance | 143 143 143 143 | 75.60 24.63 75.88 73.61 | 15.86 16.24 19.56 15.17 | 78 24 79 76 | 31 0 0 34 | 100 64 100 100 | 100 100 100 100 |
| Variable | Value | Frequency (%) |
|---|---|---|
| Driver status | Active Inactive | 117 (81.8) 26 (18.2) |
| Age group | Older adult Younger to middle-aged adult | 58 (40.5) 85 (59.5) |
| Sex | Male Female | 63 (44.1) 80 (55.9) |
| Disability status | PWD Able-bodied adult | 42 (29.4) 101 (70.6) |
| Employment | Full-time and part-time Other classification | 109 (76.2) 34 (23.8) |
| Education | Bachelor’s, master’s, or doctorate degree Other classification | 84 (58.7) 59 (41.3) |
| Marital status | Married or domestic partnership Other classification | 61 (42.7) 82 (57.3) |
| Race/ethnicity | White Other classification | 89 (62.2) 54 (37.8) |
| Variables | β | SE | t | p |
|---|---|---|---|---|
| (Intercept) | 1.03 | 3.03 | 0.338 | 0.736 |
| Optimism (TRI) | 6.68 | 2.15 | 3.11 | 0.002 |
| Perceived Ease of Use (TAM) | 5.32 | 1.13 | 4.72 | <0.001 |
| Driver Status (Active) | −7.75 | 3.19 | −2.43 | 0.017 |
| Marital Status (Married/Domestic Partnership) | 4.66 | 2.542 | 1.83 | 0.069 |
| Race/Ethnicity (White) | 5.34 | 0.47 | 2.16 | 0.032 |
| Variables | β | SE | t | p |
|---|---|---|---|---|
| (Intercept) | 6.04 | 2.01 | 3.01 | <0.003 |
| Optimism (TRI) | −7.22 | 2.22 | −3.26 | <0.001 |
| Perceived Ease of Use (TAM) | −5.20 | 1.15 | −4.53 | <0.001 |
| Life Space Questionnaire (LSQ) | 1.79 | 1.09 | 1.65 | 0.102 |
| Race/Ethnicity (White) | −9.71 | 2.58 | −3.76 | <0.001 |
| Variables | β | SE | t | p |
|---|---|---|---|---|
| (Intercept) | 2.30 | 3.38 | 0.682 | 0.497 |
| Optimism (TRI) | 11.00 | 2.62 | 4.20 | <0.001 |
| Perceived Ease of Use (TAM) | 4.89 | 1.37 | 3.56 | <0.001 |
| Driver Status (Active) | −8.81 | 3.86 | −2.28 | 0.024 |
| Age Group (Older) | 12.10 | 3.09 | 3.91 | <0.001 |
| Variables | β | SE | t | p |
|---|---|---|---|---|
| (Intercept) | −0.170 | 3.01 | −0.057 | 0.955 |
| Optimism (TRI) | 7.11 | 2.02 | 3.53 | <0.001 |
| Perceived Ease of Use (TAM) | 5.40 | 1.05 | 5.14 | <0.001 |
| Life Space Questionnaire | −1.49 | 1.03 | −1.46 | 0.148 |
| Driver Status (Active) | −7.53 | 3.08 | −2.44 | 0.016 |
| Marital Status (Married/Domestic Partnership) | 5.03 | 2.36 | 2.13 | 0.035 |
| Race/Ethnicity (Caucasian/White) | 6.72 | 2.34 | 2.87 | 0.005 |
Disclaimer/Publisher’s Note: The statements, opinions and data contained in all publications are solely those of the individual author(s) and contributor(s) and not of MDPI and/or the editor(s). MDPI and/or the editor(s) disclaim responsibility for any injury to people or property resulting from any ideas, methods, instructions or products referred to in the content. |
© 2023 by the authors. Licensee MDPI, Basel, Switzerland. This article is an open access article distributed under the terms and conditions of the Creative Commons Attribution (CC BY) license (https://creativecommons.org/licenses/by/4.0/).
Share and Cite
Classen, S.; Sisiopiku, V.; Mason, J.R.; Stetten, N.E.; Hwangbo, S.W.; Kwan, J.; Yang, W. Barriers and Facilitators of People with and without Disabilities before and after Autonomous Shuttle Exposure. Future Transp. 2023, 3, 791-807. https://doi.org/10.3390/futuretransp3020045
Classen S, Sisiopiku V, Mason JR, Stetten NE, Hwangbo SW, Kwan J, Yang W. Barriers and Facilitators of People with and without Disabilities before and after Autonomous Shuttle Exposure. Future Transportation. 2023; 3(2):791-807. https://doi.org/10.3390/futuretransp3020045
Chicago/Turabian StyleClassen, Sherrilene, Virginia Sisiopiku, Justin R. Mason, Nichole E. Stetten, Seung Woo Hwangbo, Joseph Kwan, and Wencui Yang. 2023. "Barriers and Facilitators of People with and without Disabilities before and after Autonomous Shuttle Exposure" Future Transportation 3, no. 2: 791-807. https://doi.org/10.3390/futuretransp3020045