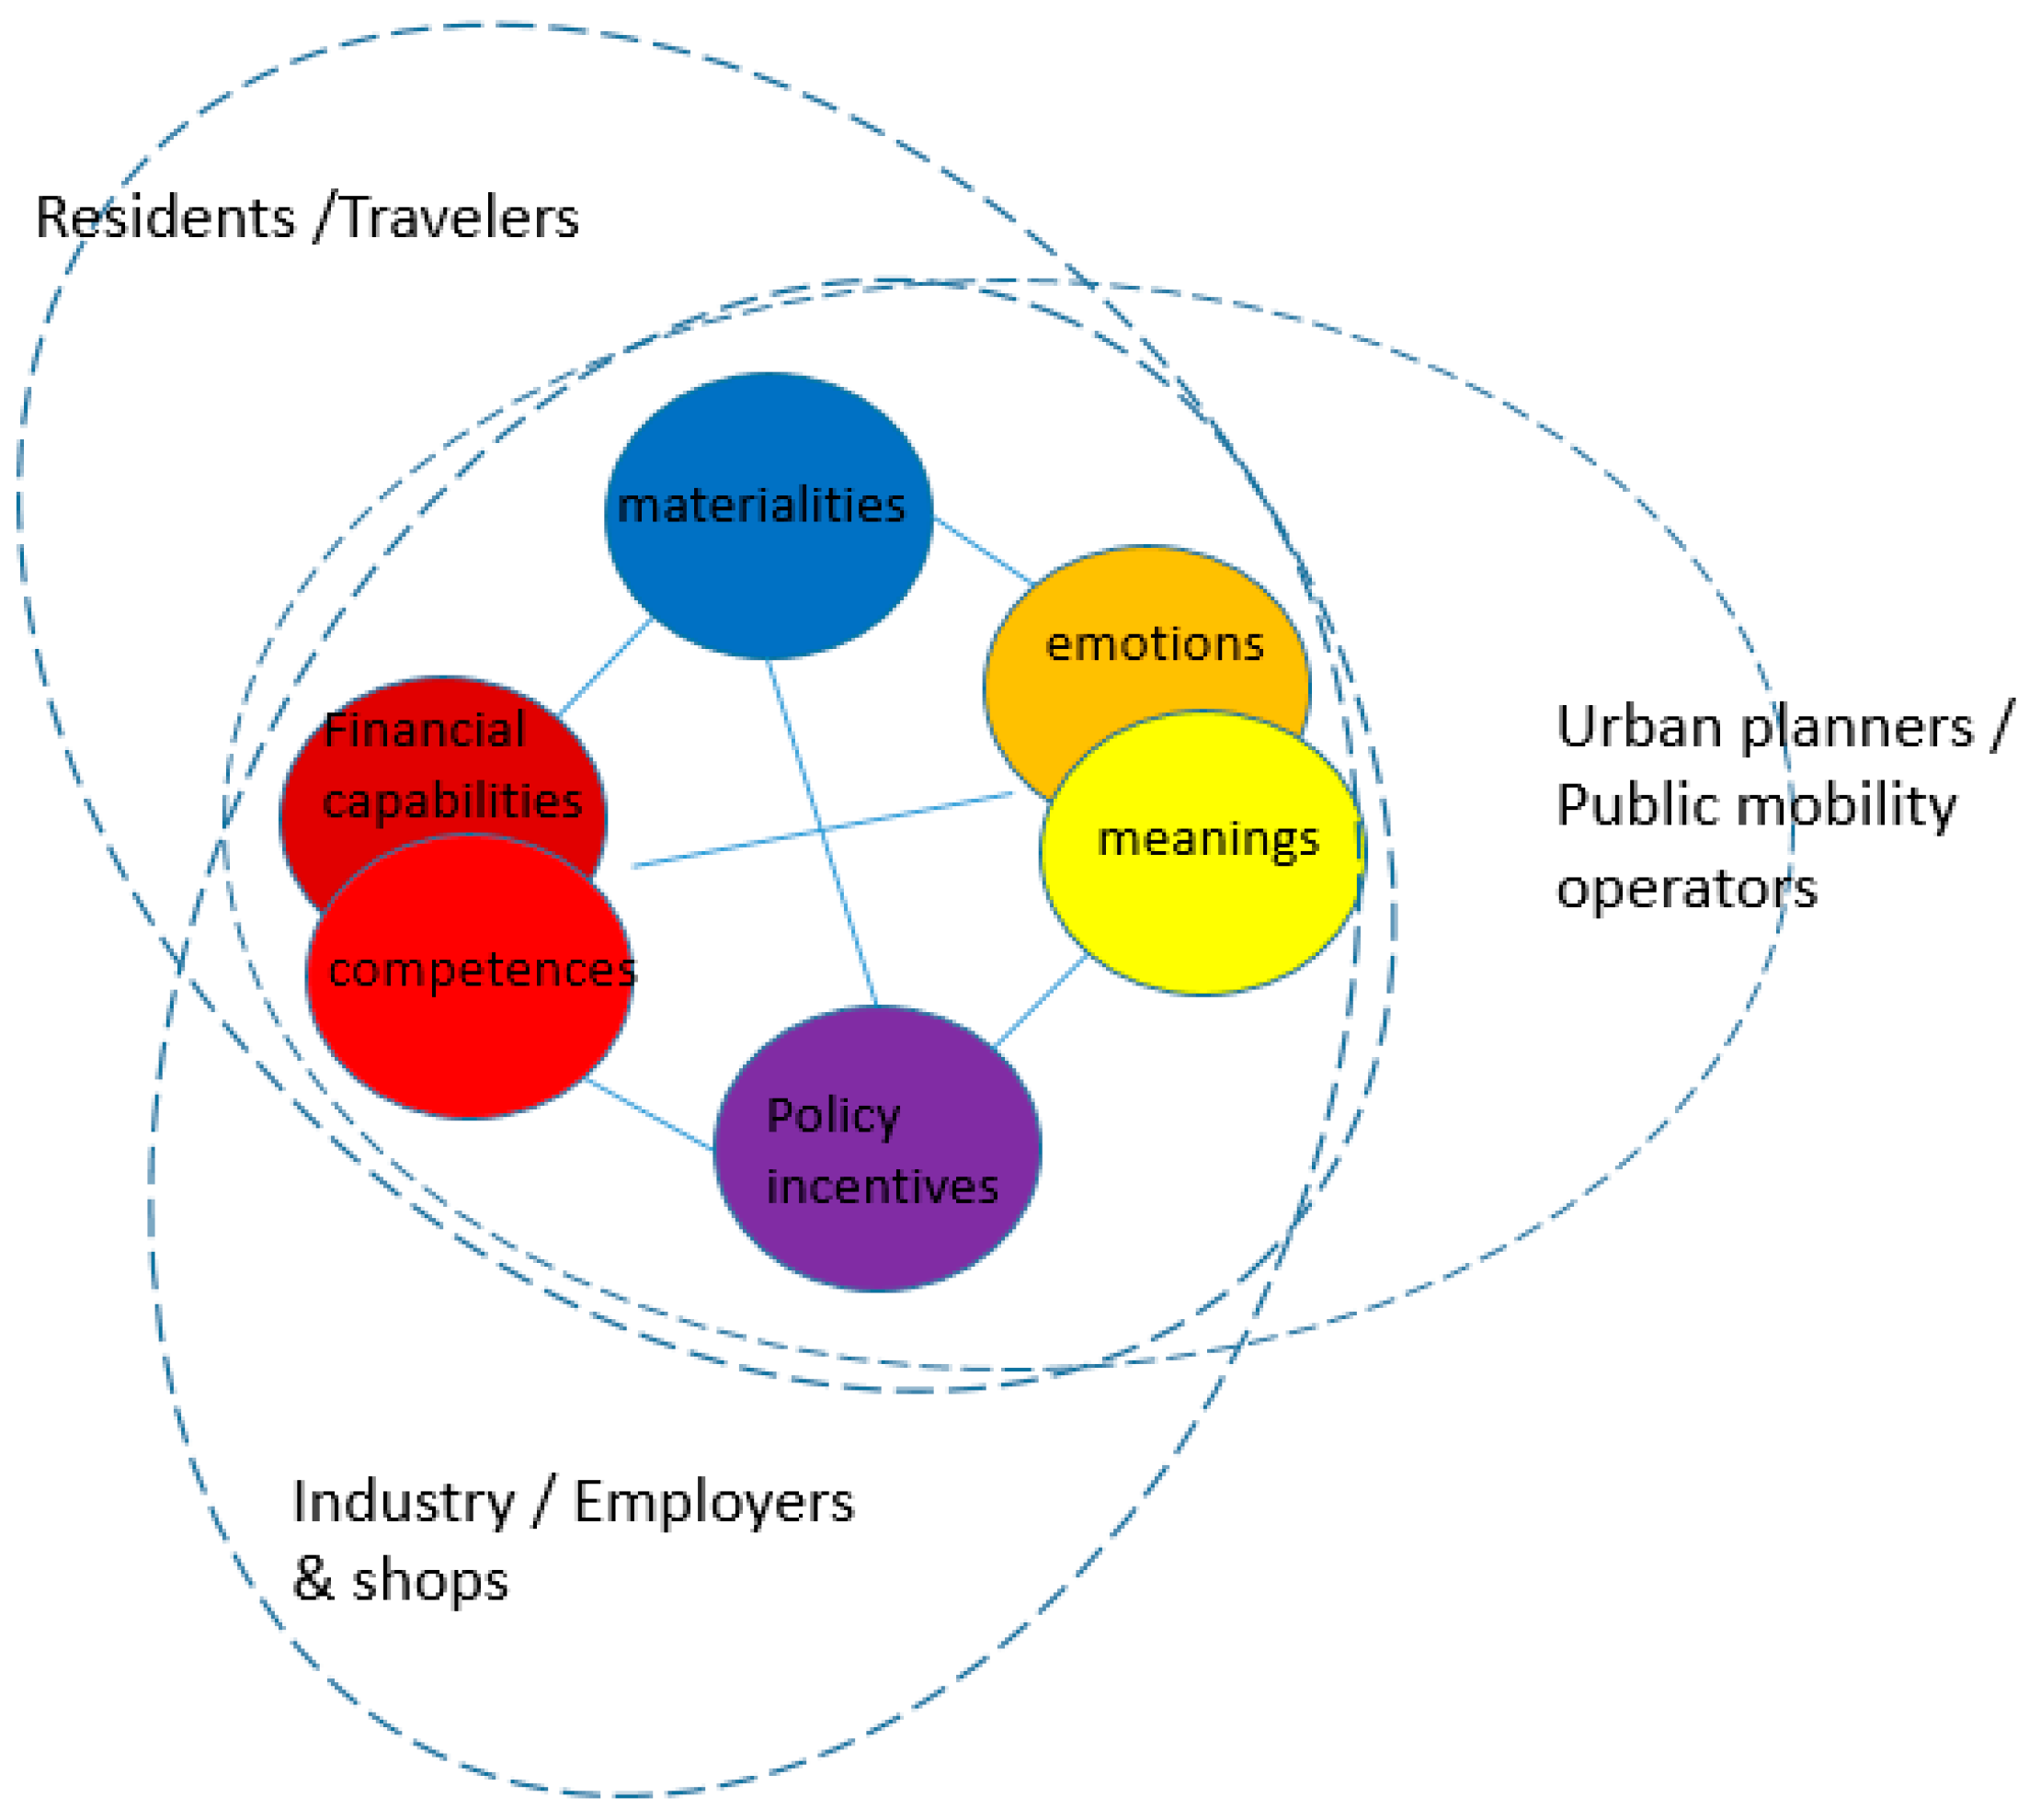
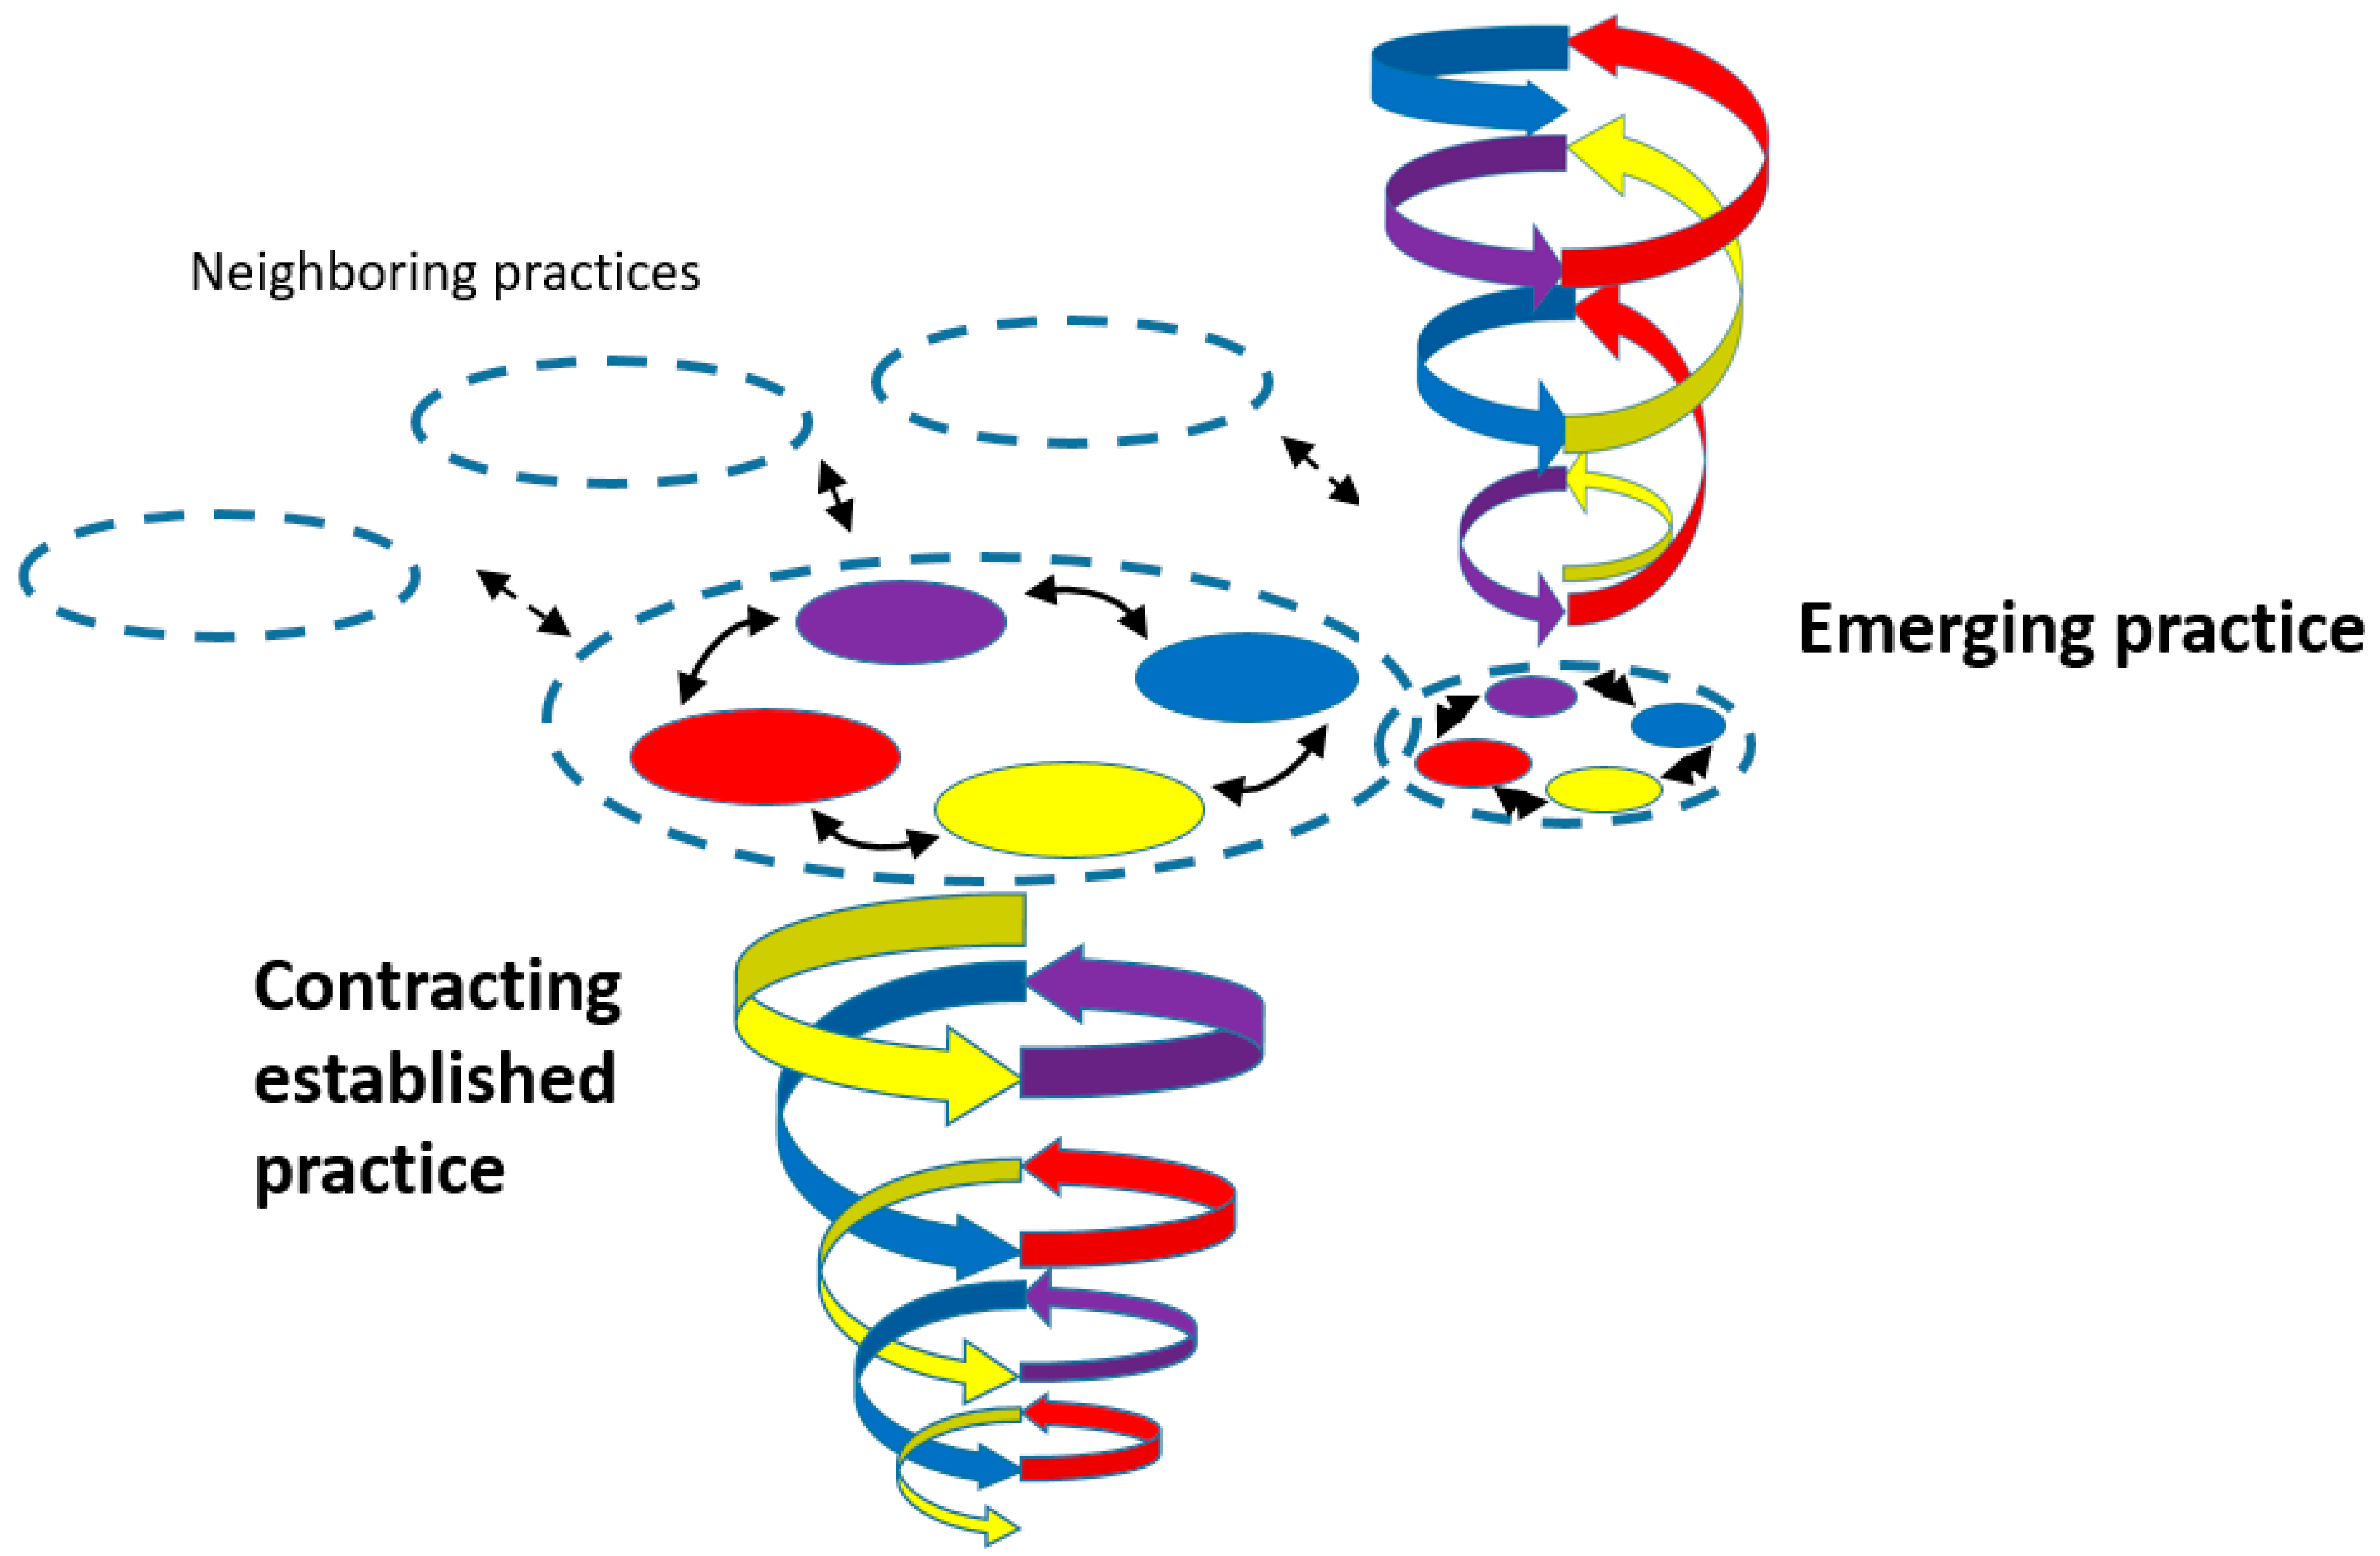
For this paper, elements forming the social practices associated with different means of mobility are colour-coded in the main text. Blue accounts for materialities, red for competences, dark red for financial capabilities, yellow for social meanings, orange for emotions, and purple for policy incentives. Those coloured elements are later summarised through relevant figures, which illustrate the configuration of the different elements.
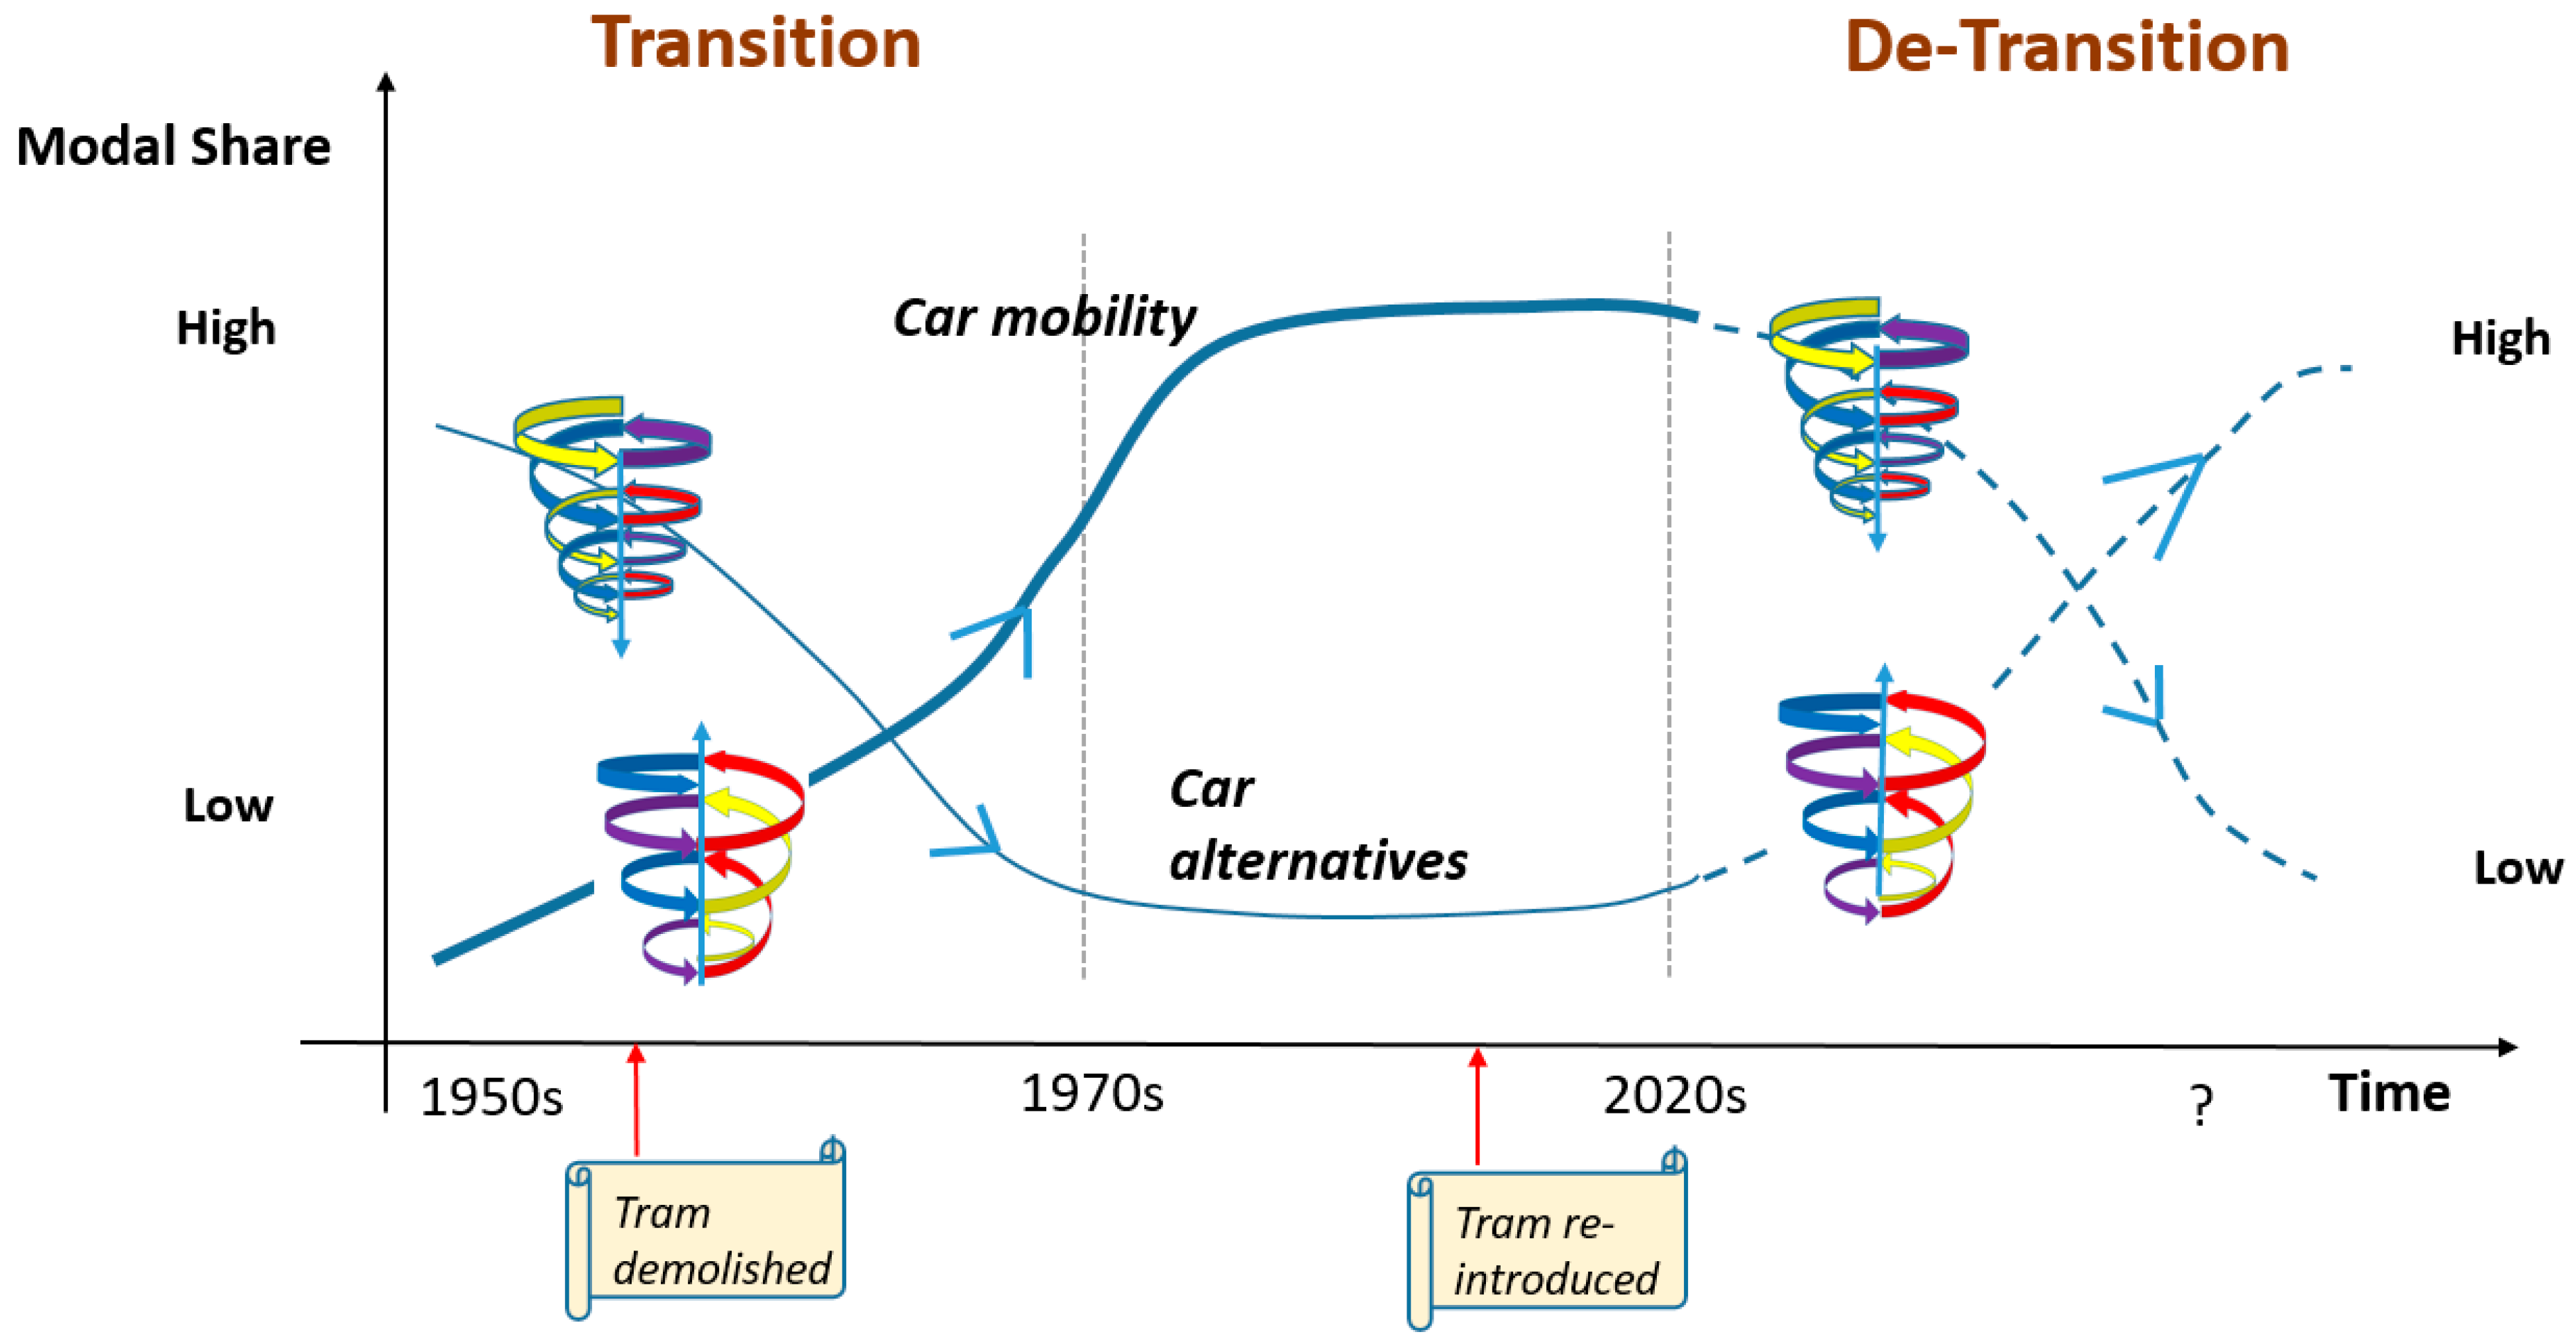
4.1. The Historic, Unsustainable Transition (1950s–1970s)
What was Clermont’s low-car mobility system like in the 1950s, and how can we understand the drivers, actors, and patterns of the car mobility transition? Clermont’s mobility system in the 1950s was shaped strongly by vast industrial plants of the tire manufacturer Michelin, which had quickly grown in the first half of the 20th century from 52,000 workers in 1900 to 82,000 in 1921. The company had built a range of neighbourhoods specifically for its workforce, with purpose-built houses, schools, hospitals, etc. If not travelling by foot, a large portion of workers went to work by Clermont’s electric tramway, which had been introduced in 1890 and touted as a technological breakthrough. The tramway ran a circle through the city centre (train station, Jaude Square), and, in addition, had three legs reaching outer neighbourhoods (Montferrand, Royat, and Beaumont).
Tram mobility
Until its removal in 1956, the tramway was seen as a normal means of transportation. It was mostly used by commuters travelling to work (int. (Interview) 23: the tramway would mostly be used by those that worked, int. 25, 26, 19: many would use the tramway to go to work (in Michelin’s factories, namely). All the interviewees who took the tramway described their feelings for it in the same way: it was (very) pleasant (int. 17, 23, 25, 2, 7, 21). It was also perceived as very convenient (int. 25: it would save a lot of time […] had it not been there, we would have never been able to come home before 12 h and 14 h, int. 17: it was convenient, int. 7: it was always available, we never had to wait for it. Sometimes, it was also more poetically described as having its own charm because of the sound of the rails (int. 7). Additionally, several interviewees reported that the tramway was a rather flexible means of transportation, with very frequent timings (int. 17, 22, 23, 6), so that people could simply show up to the stop. Aside from knowing the stations, no specific know-how was associated with using the tram, which everyone described as very easy. Overall, most people considered the tramway to be affordable (int. 6, 23, 2, 25), although larger families may have found the tramway somewhat expensive (int. 26 and 7).
Walking and Cycling
Aside from the use of the tramway, people also moved around the city by bike or on foot. This was a time when walking and cycling were considered
normal means of transportation to move around. Cycling was described as normal for short distances, so that
people who did not live far would often go by bicycle or on foot to their destination, be it school or work (int. 21, 17, 7, 19, 25, 26). Both means of moving around the city were considered
useful modes of transportation (int. 6, 23, 22, 21, 17:
we used the bike to go to work). In addition, cycling was also perceived as the
most efficient non-motorised means of transportation (int. 19), and the
ease of parking a bicycle facilitated its usage (int. 17, 2). Before the advent of cars, walking and cycling were viewed as convenient and pleasant unless, of course, it was
raining (int. 17, 19). Although most perceptions of cycling were positive, cycling was sometimes associated with
danger. People themselves did not necessarily perceive their trips to be dangerous as far as
road sharing and the
limited traffic, but the interviews revealed that
tramway tracks were seen as unsafe by those on bicycles (int. 17:
I was less concerned by cars, because there were fewer, than by the tramway tracks). Several interviewees, indeed, pointed to recurrent bike accidents on the tracks (int. 23:
I witnessed many people fall on the tracks; 19:
I crashed more than once on the tracks; 17, 7). Ryat [
40] also emphasised that rails were real traps for cyclists and that deadly accidents happened because of the tracks. It is safe to conclude that many people found the tracks generally dangerous and were fearful of crossing them.
Another aspect of walking and cycling to consider is the cost of these modes of movement. Although the initial cost of purchasing a bicycle was high, almost all families had bikes, so it was very common to own one (int. 25: bikes were expensive, 19: bikes were not so affordable, but it was the only thing I could afford). As for walking, which is not usually associated with any costs, the question here is how to determine whether people were walking only because it was affordable. In fact, the collected data show that financial capacity did not necessarily define the choice of mobility. Rather, people chose to walk because it was perceived as normal and even pleasant for short distances (int. 7, 20, 19), albeit inconvenient for long distances (int. 23). In that respect, it was similar to cycling: something one did for pleasure (int. 7, 20, 19) or because it conferred a feeling of freedom (int. 4: we could go wherever we wanted, we were free). Finally, while cycling and walking might have required certain physical and health conditions, every interviewee agreed that both modes of transportation were very accessible, with the only reported difficulty being the strenuousness of walking long distances, and although cyclists needed to share the same infrastructure as the tramway, they did not necessarily need to be expert riders due to the limited traffic of the time.
Car mobility
In the early 1950s,
cars, which were expensive at first and
affordable to only a few people with higher incomes (int. 2, 7), were
not yet in
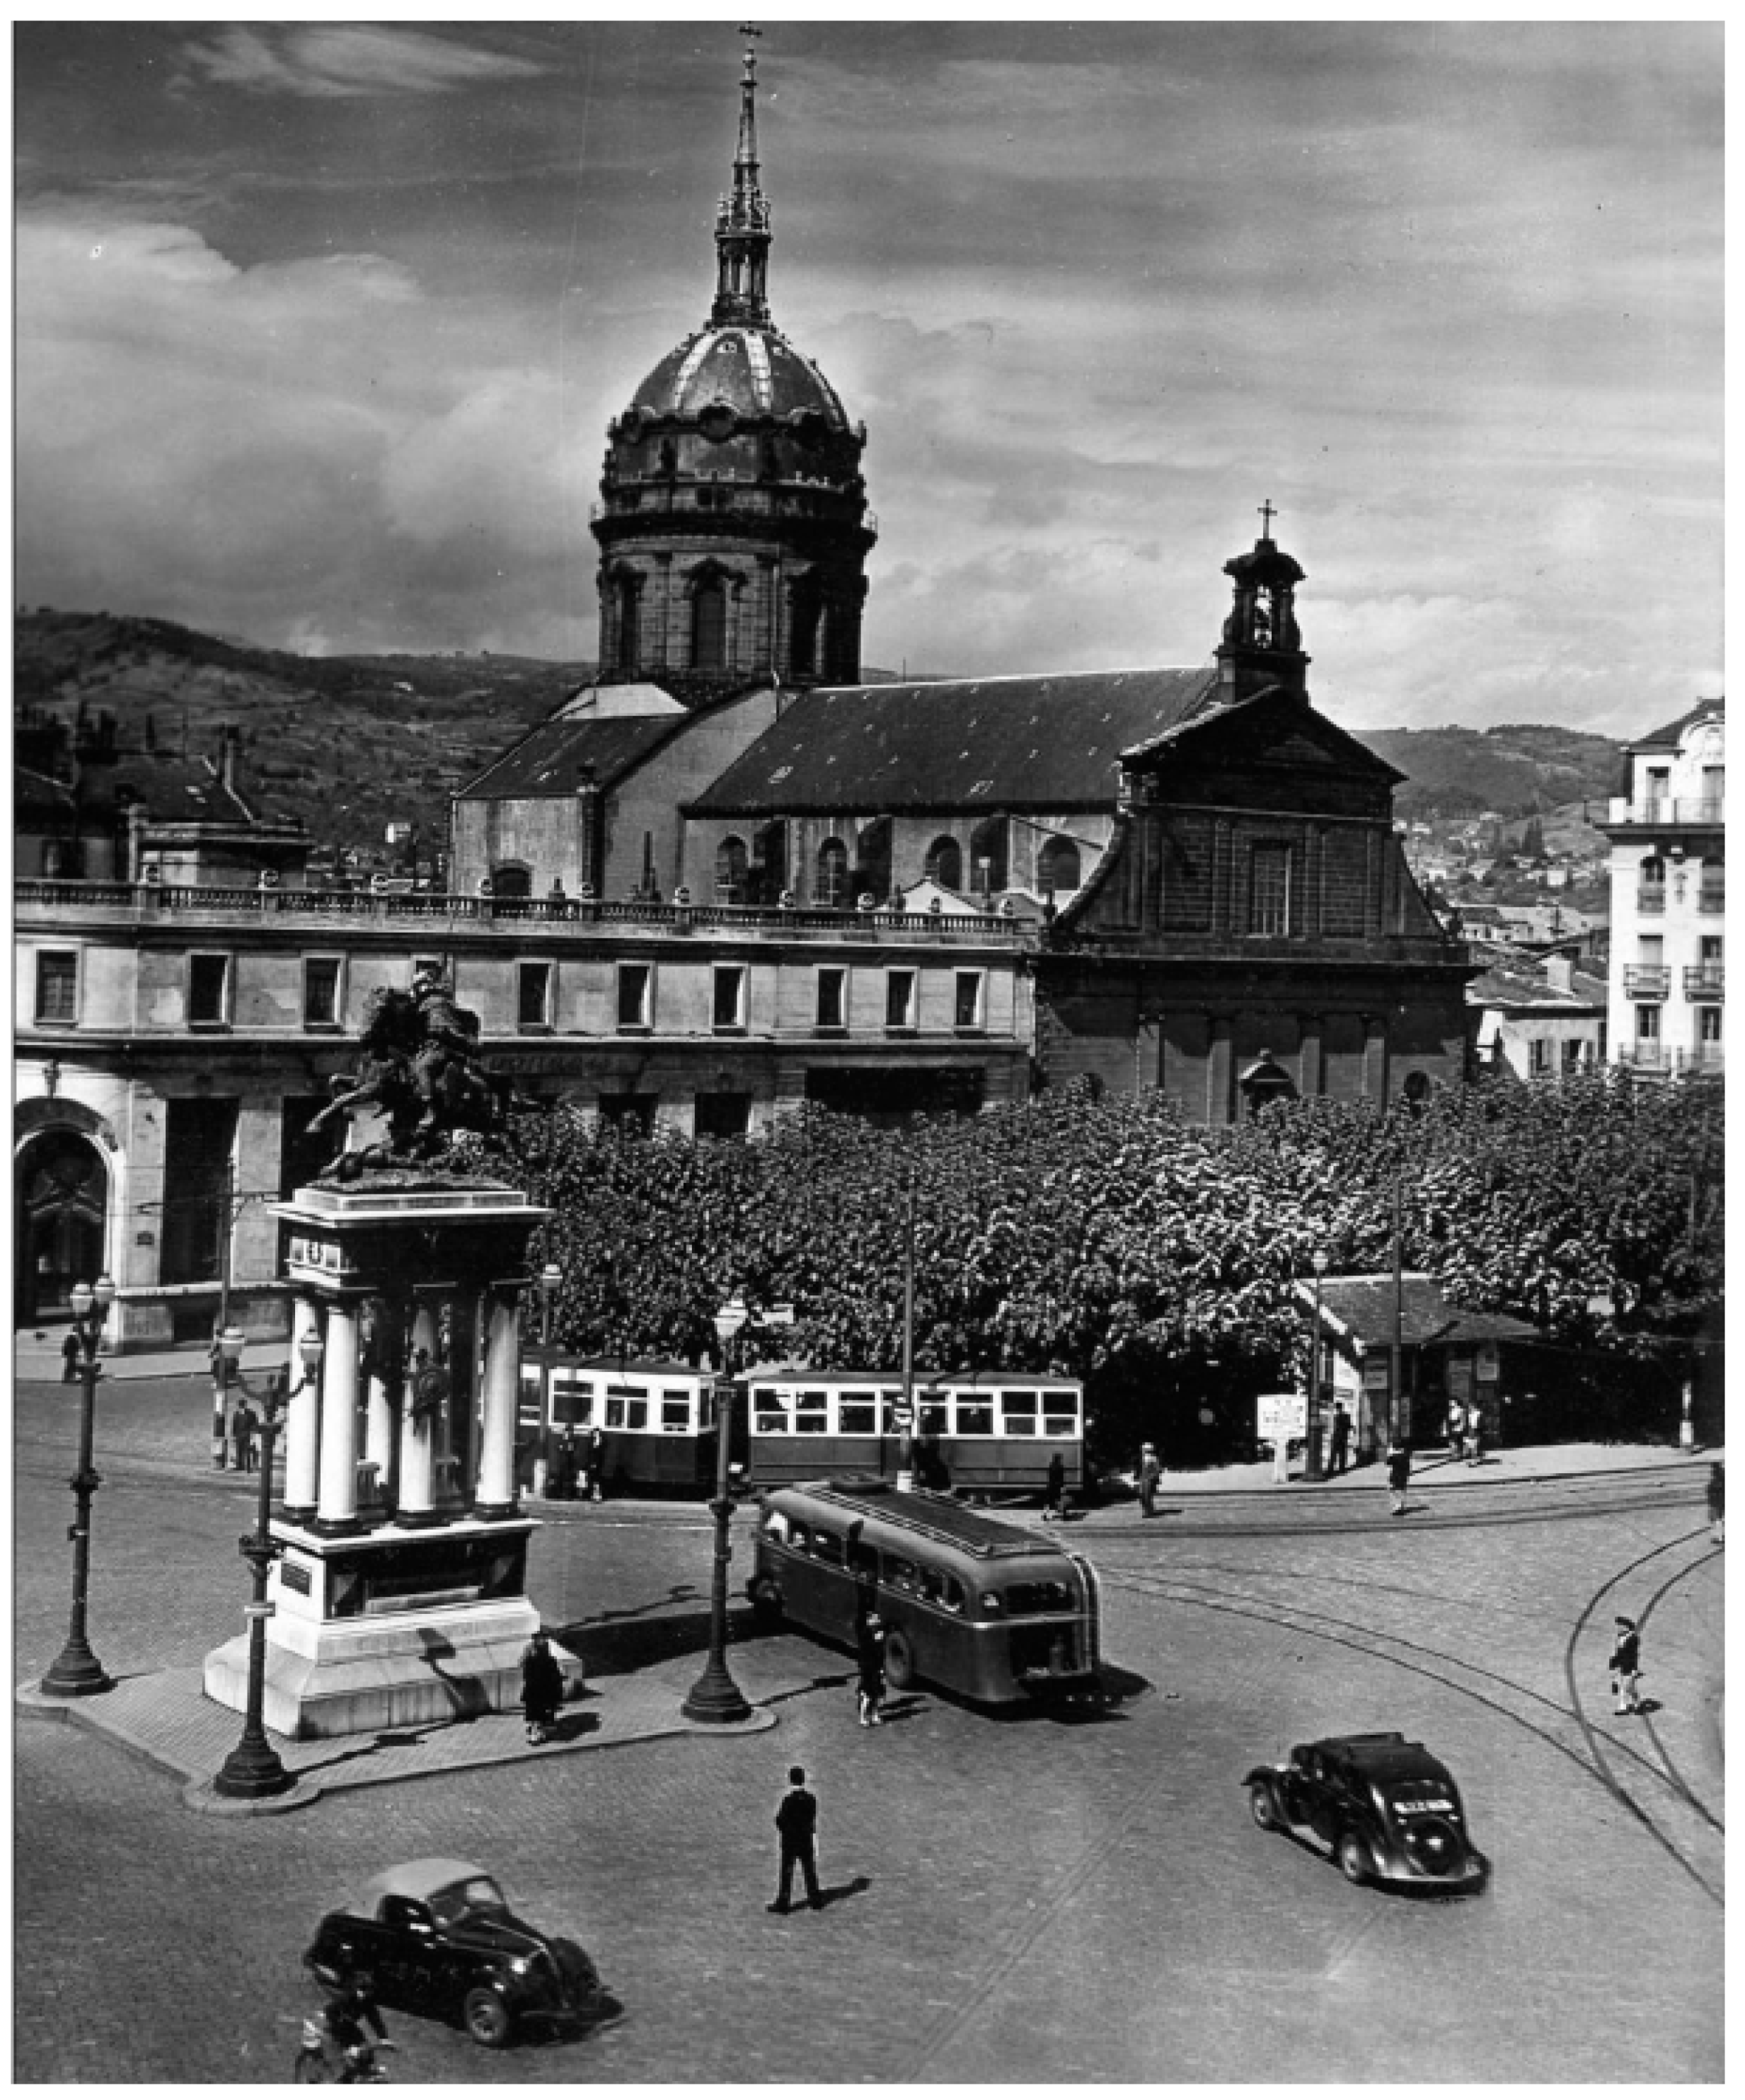
common use. For this reason, the traffic was still very limited in the city. All interviewees who commented on the extent of the car modality’s share acknowledged this fact (int. 2, 20, 19, 21, 17, 6). Photographic data also corroborate this element and provide us with further insight into the infrastructure at the time (see
Figure 4 below). As reported by six interviewees, cars, buses, tramways, cyclists, and pedestrians
all shared the same infrastructure all mixed together, with cyclists weaving around cars and pedestrians (int. 25, 22, 23). Still, in spite of sharing the same infrastructure and an
absence of cycling lanes, interviewees did not voice any concerns over their safety.
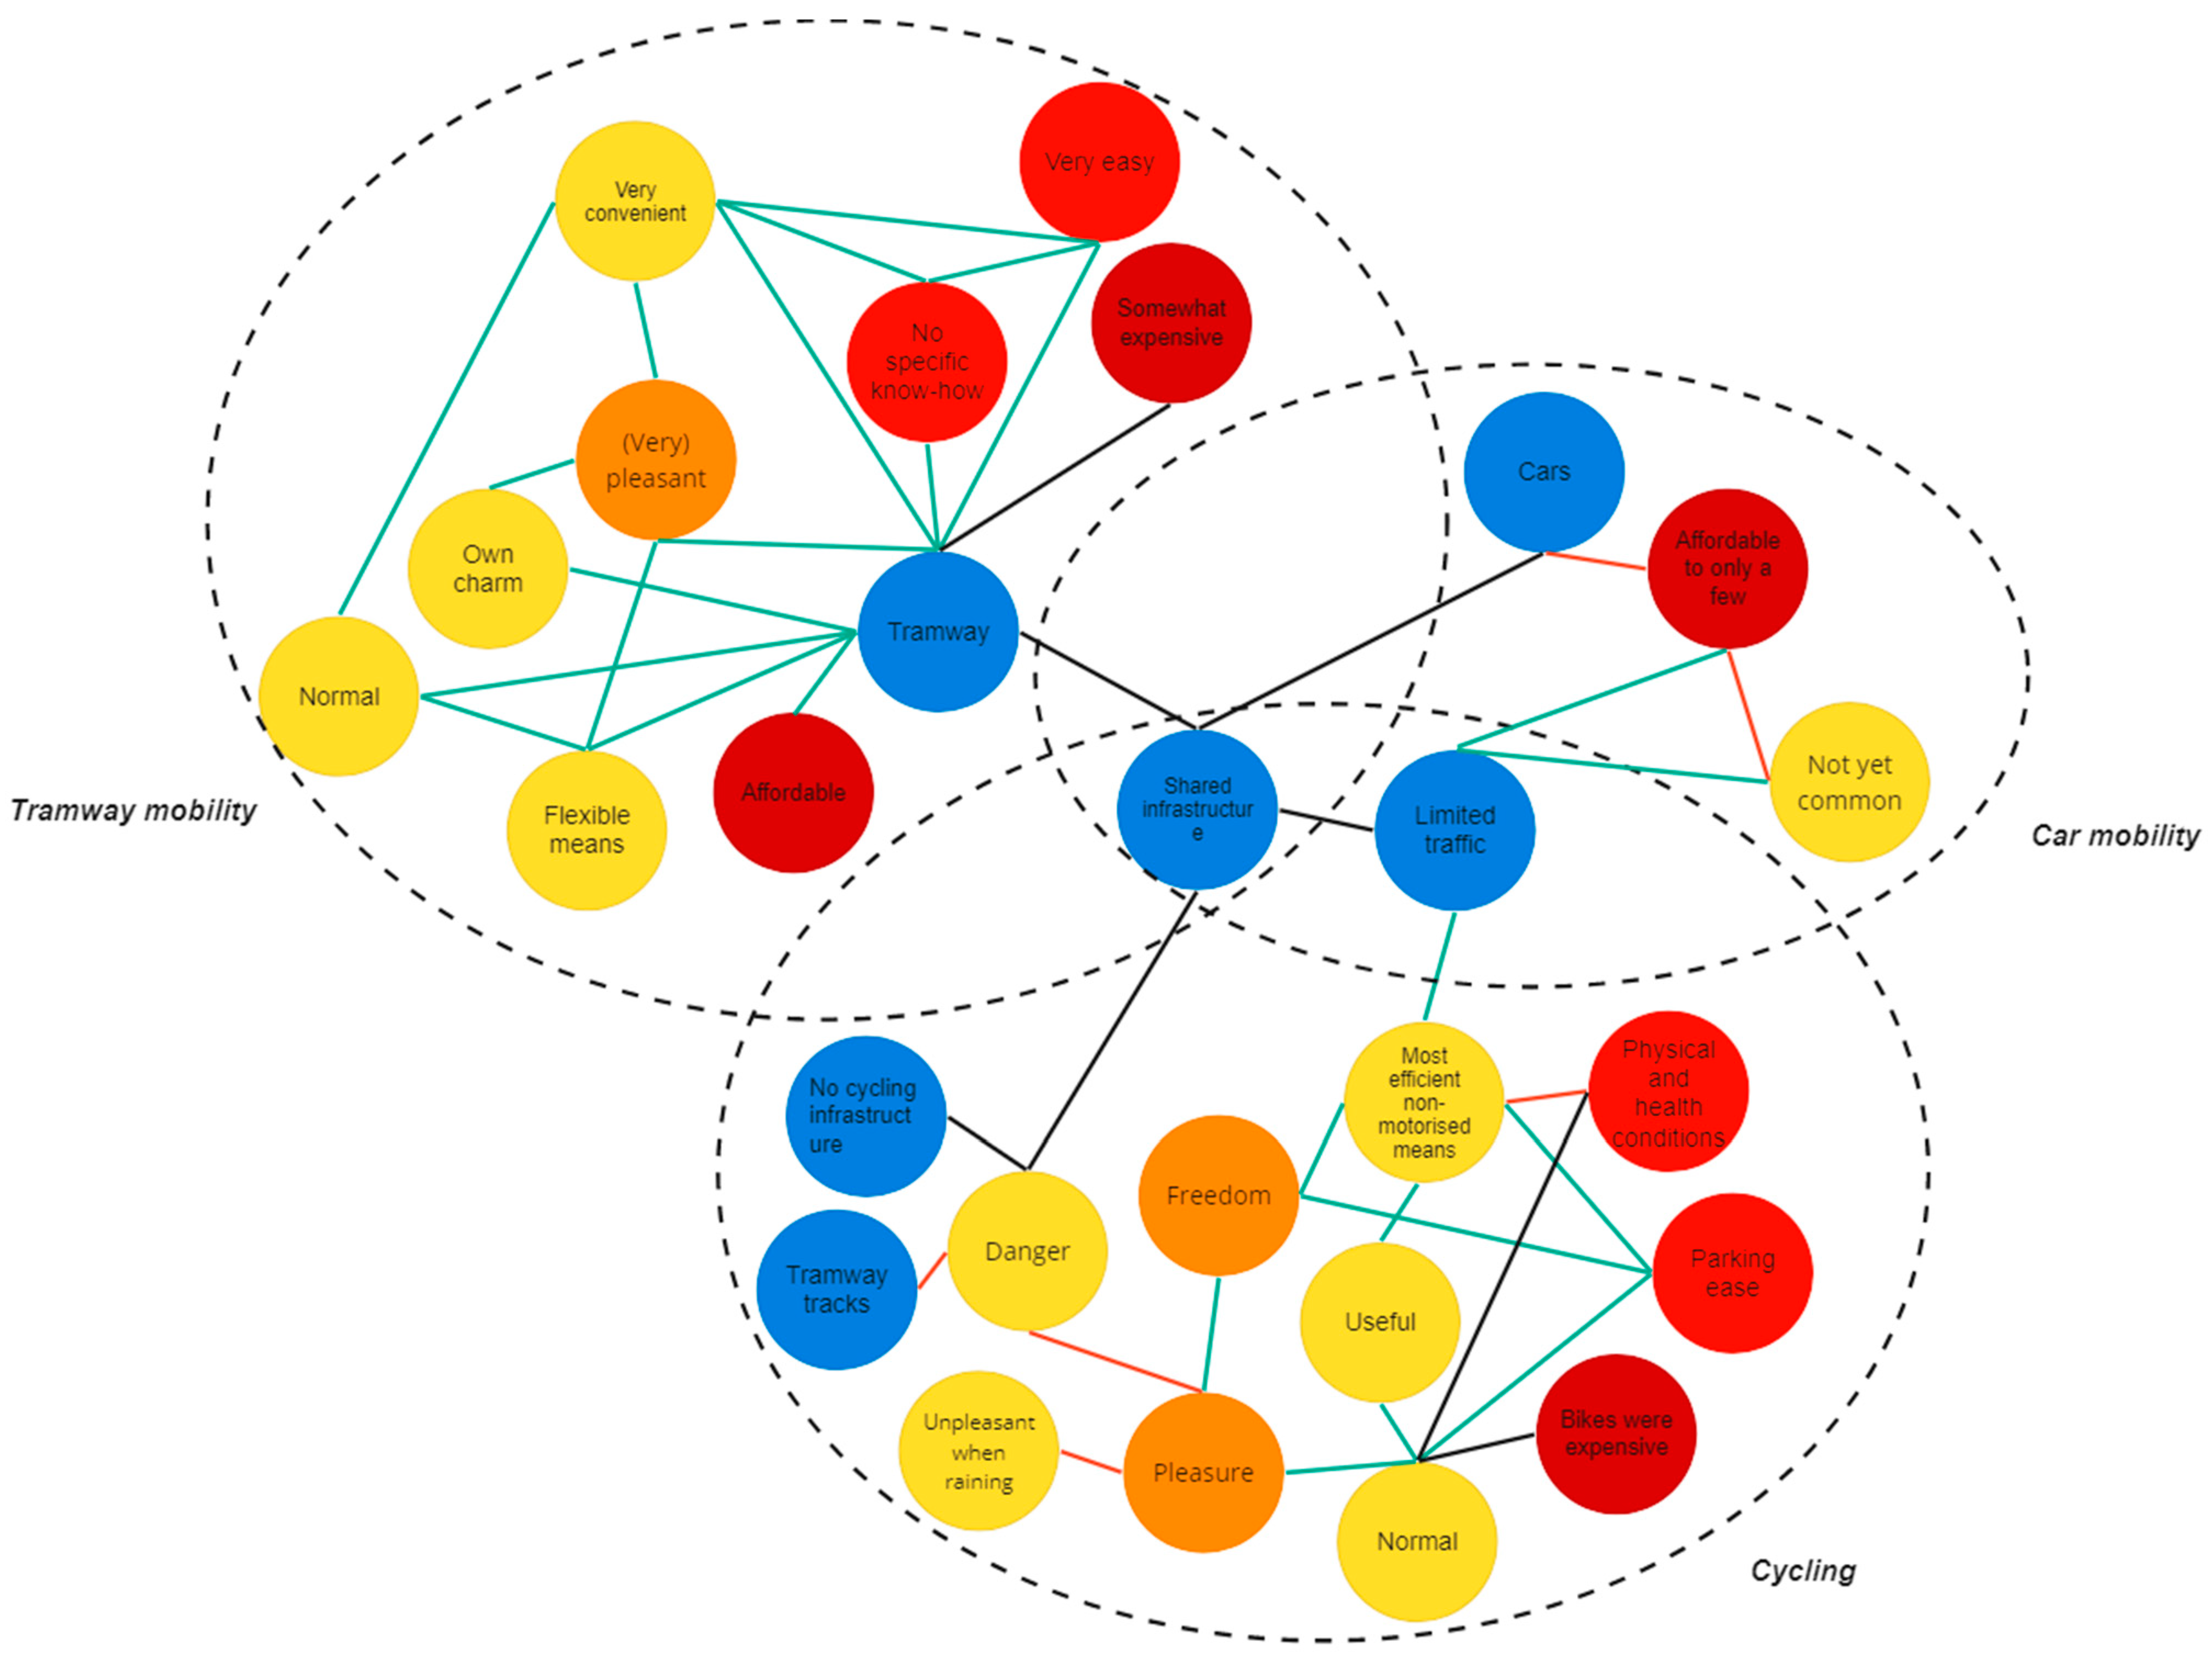
The following figure (
Figure 5) summarises the interaction of the different elements associated with the various modes of transportation available in metropolitan Clermont-Ferrand in the early 1950s.
Removal of the tramway and the (temporary) rise of bus mobility
In the 1950s, one could see the rise of an anti-tramway mentality in metropolitan Clermont-Ferrand. The main reasons for this shift in mentality were that the tramway “had become
cumbersome to urban traffic with the rise in car flow and that there was a
need for modernising the network” (written source #1, see
Table A5,
Appendix C). The tramway had begun to be perceived as a form of urban congestion since former tramway users were by then using the car, and these new drivers found that the tramway merely cluttered the roads [
40] (p.75). Even before the war, in 1938, there had been a plan to modernise or completely remove the tramway (written source #2, see
Table A5,
Appendix C). Later, in 1954, people felt that the electric tramway needed to be replaced by something faster and more comfortable (written source #3, see
Table A5,
Appendix C). The proposed modifications were turned down, however, and according to written source #4 (see
Table A5,
Appendix C), it was decided that buses should replace the existing transportation system. In the first instance, the trolleybus, a more sustainable means of transportation, was discussed, but the idea of installing it in the city was finally discarded in 1957, which left no opportunity for the continuation of electric transport in the city. Municipalities in the metropolitan area also regarded the tramway as being something from the “old days” (written source #5, see
Table A5,
Appendix C), and the demand for buses to be installed rose, since buses, unlike trams, were not limited by rails to a single travel route.
With regard to costs, there were
no monetary incentives to use buses after the
removal of the tramway. People were simply dependent on the decisions made by the municipality (int. 21:
we followed the new urban trends from the municipality, we had to evolve, int. 6: once they removed the tramway, people still needed to move around so they used the buses), so that once the tramway was replaced,
buses simply became the default mobility option (int. 6:
once [the tram was] removed, we would go by bus; int. 21:
there were buses so we were using them; int. 4:
buses were the best means of transportation for people that could not afford individual mobility). The removal of the tramway, however, did not leave people indifferent. Interviewees expressed feeling a certain void and a nostalgia for the tramway (int. 23, 2, 21, 25, 26). Although the tramway had been regarded as lacking both in the areas of service and convenience (i.e., there would almost always be a tramway) (int. 25, 26, 21), most people still felt that it was a relevant and useful means of transportation. By contrast, the advent of the bus improved access to PT since
new bus routes went to neighbourhoods that had before never had public transportation (written source #6, see
Table A5,
Appendix C). After the removal of the last tramway in 1956, bus lines continued to develop in the metropole.
The difference in
cost of using buses instead of trams does
not seem to be significant. This modernised means of transportation was mainly (but not exclusively) used by workers to travel to their places of work (int. 17:
it was normal to take the bus to go to work; 23:
it would benefit everybody) and was affordable to most people, although perhaps seen as something that was expensive on a daily basis (int. 4) or for a large family (int. 7:
since we were 6 in the family, it was somewhat costly for us). To alleviate this expense,
differentiated tariffs were available for public transportation, as was also the case before the removal of the tramway (int. 25, 26). Those tariffs allowed larger families and physically disabled people to travel at discounted prices (written source #7, see
Table A5,
Appendix C). In contrast to the tramway, buses triggered
mixed feelings. While some people considered buses to be pleasant and convenient (int. 17, 7), most people saw them in a negative light. Interviewees mentioned the fact that there were often so many people in the bus that the experience was less enjoyable (int. 4, 8). Another negative aspect of buses related to their fixed timetables, which did not allow as much flexibility for travellers as cars did. (int. 23, 8, 20). As with the trams they formerly took, users
needed to know where the stations were in order to take the bus. Unlike the tramway, however, they now also
needed to know about the timings of the buses, which were, in most cases, less frequent than the trams had been.
After 1960, the general opinion about the bus as a means of transportation changed, and more people began to prefer the convenience of the car (int. 23, 8, 20). From the pinnacle of bus use in 1964, there was a slow decline over the next ten years. Within 10 years, from 1964 onward, the uptake of the bus fell by 33% (written source #8, see
Table A5,
Appendix C). The available data show that bus usage shifted to an older generation of people, who were generally frightened to switch to this new mode of transport and preferred to stick with bus transport instead of learning to drive a car (int. 17:
older people were scared of driving cars since it was new, [so] they stuck with the bus instead).
The rise of car mobility
While, at first, driving one’s own car was considered to be only possible for a few rich people, this perception soon faded as cars became
more affordable. The market for cars grew as wages surged by a factor of 10 [
42]. Soon, most people were able to buy cars. Nonetheless, buying a car was still seen as a large investment (int. 19:
we could afford a car, but the purchase was very expensive; int. 8:
we had to purchase the car on credit because we were not rich). In addition, the costs of operating and maintaining the car were not insignificant for most people. (int. 17:
we would do car-pooling so that the costs were shared […] the price of gasoline was certainly a barrier to driving more; int. 4:
we still had to pay for the gasoline and the insurance). Interestingly, and perhaps relevant only to the Clermont-Ferrand case, not every car owner had to spend the same amount of money to maintain their car. Michelin, the tire multinational located in the city, provided
benefits to its employees that were likely linked to the surge in driving as a new and popular mode of transport. Employees could, for example, receive tires for free and have them fitted free of charge (int. 17). There were also inter-factory buses, enabling employees who arrived in Cataroux by car to travel to the other sites (int. 19, 17). While these two elements may not seem so important, the number of people that were affected by those factors was significant. Employment at Michelin rose from almost 15,000 employees in the early 1950s to nearly twice as many people in the early 1970s [
43]. This indicates that, in comparison to the population of the entire urban area, >10% of the population worked for Michelin in the early 1950s, and this number rose to about 15% of the whole population by the 1970s.
Cars, as a practice, were one of the least negatively described modes of transportation in that period of time. People would describe them as ultimately convenient (int. 4, 20, 21, 8), as allowing for freedom and ease of movement (int. 7, 8, 20), and as savingtime (int. 7, 17). Different meanings started to be associated with cars. One of the perceptions which materialised was that of freedom, both in time and space (int. 2: we can go further and are freer to move around; int. 21, int. 6: we would use the car to go further away). The perception that driving was normal also developed (int. 21: it was normal to drive; int. 7: there was this distorted perception that it was normal to have a car because it was convenient). People also tended to consider the car as an advancement that they had to keep up with (int. 4, 23), and as a genuinely helpful innovation and a luxury (int. 7).
During this period, the traffic flow became much higher (int. 17:
traffic was much higher, there were many more people [on the roads; int. 20:
traffic flow was higher, people were buying cars; int. 22:
there were many more cars). This was partly driven by urban housing planning. After 1960, Clermont-Ferrant launched a public housing programme (while the role of Michelin in housing decreased). Concerning transport or public space, this program was fully focussed on providing car accessibility, neglecting everything else [
44] (p. 1429). In addition, the plan involved sprawled housing areas over a larger region, outside the reach of the tram network, in areas that were difficult to be reached even by the urban bus lines (ibid.). In France, at the time, car ownership indeed rose sharply between the mid-1950s and the early 1970s, from 2.5 million to 15.5 million cars. Speculating that this growth was linear, it would roughly equate to a 23.5% increase in cars on the road every year during that period [
45]. Thus, even if those numbers represented a national phenomenon, the perceived increase in car traffic seems to be corroborated by those statistics. To face the increasing car flow, the removal of the tramway in the city center enabled the municipality to create further roads. The tramway tracks were tarred into new roads to facilitate the circulation of both buses and cars [
40]. Even though driving was considered very easy because of the light traffic, this practice required specific knowledge:
a driving licence. Furthermore, while many very easily transitioned to this practice, some people (mostly older people), seem to have found it more difficult to adapt to this new practice and would not necessarily make an effort to learn the new required skills (int. 17). Since driving a car implies acquiring further skills, the meaning of cars was then mostly associated with
youth (int. 17).
Finally, unlike with public transportation, people need to park their cars. As reported by interviewees 2 and 8, car mobility was regulated with paid and limited parking in the city center, between the Salins (neighbourhood) and Jaude and Gaillard squares. Although parking infrastructure existed around the city (int. 4) and some companies provided their employees with parking (e.g., Michelin (int. 17)), people began facing major difficulties regarding parking (int. 2, 19, 23). Parking was progressively seen as a constraining factor that could even lead to limited use of the car (int. 2: I would only use the car if I knew for sure I could park). The fact that people would look for a place to park their car in the evening (i.e., not in the street) could also lead to the following assumptions: cars were seen as valuable artefacts that their owners would not like to leave outside, or parking facilities were very limited. Both assumptions happen to be justifiable. Cars were very expensive between 1950 and the 1970s, and parking locations could not be found all around the city. As mentioned by interviewee 20, it was frequently the case that people needed to go to a completely different neighbourhood to park their car in a garage. Unlike the actual action of driving, this indissociable element of the practice of driving was considered very stressful (int. 23, 2, 19).
Contraction of cycling
When it comes to cyclists and pedestrians, the road sharing situation did not significantly evolve until the 1970s. Until then, cyclists and walkers were still sharing the roads with cars, buses, and mopeds (int. 19:
bikes were on the road with cars; 22, 23). Interviewees all corroborated the fact that
no cycling infrastructure existed at the time in the city nor in its metropolitan urban area. In addition to that, the data also revealed that, back then, pedestrians were treated with respect as co-road users (int. 22 and 23). Nonetheless, the brisk surge in traffic did not leave cyclists unaffected. As a result of this modal shift, a
feeling of insecurity developed among bike users, who started feeling vulnerable around cars (int. 17:
cyclists were at risk of being hit by cars; int. 23: we
had to pay much more attention; int. 2:
it was dangerous because of the traffic, you could get hit and fall). Although no one reported a significant shift in meaning over the period, fewer and fewer people mentioned using bicycles as
more cars took over the roads. Walking, as a practice, was also impacted by these developments. Although considered normal at first, walking longer distances started to be questioned by society (int. 23:
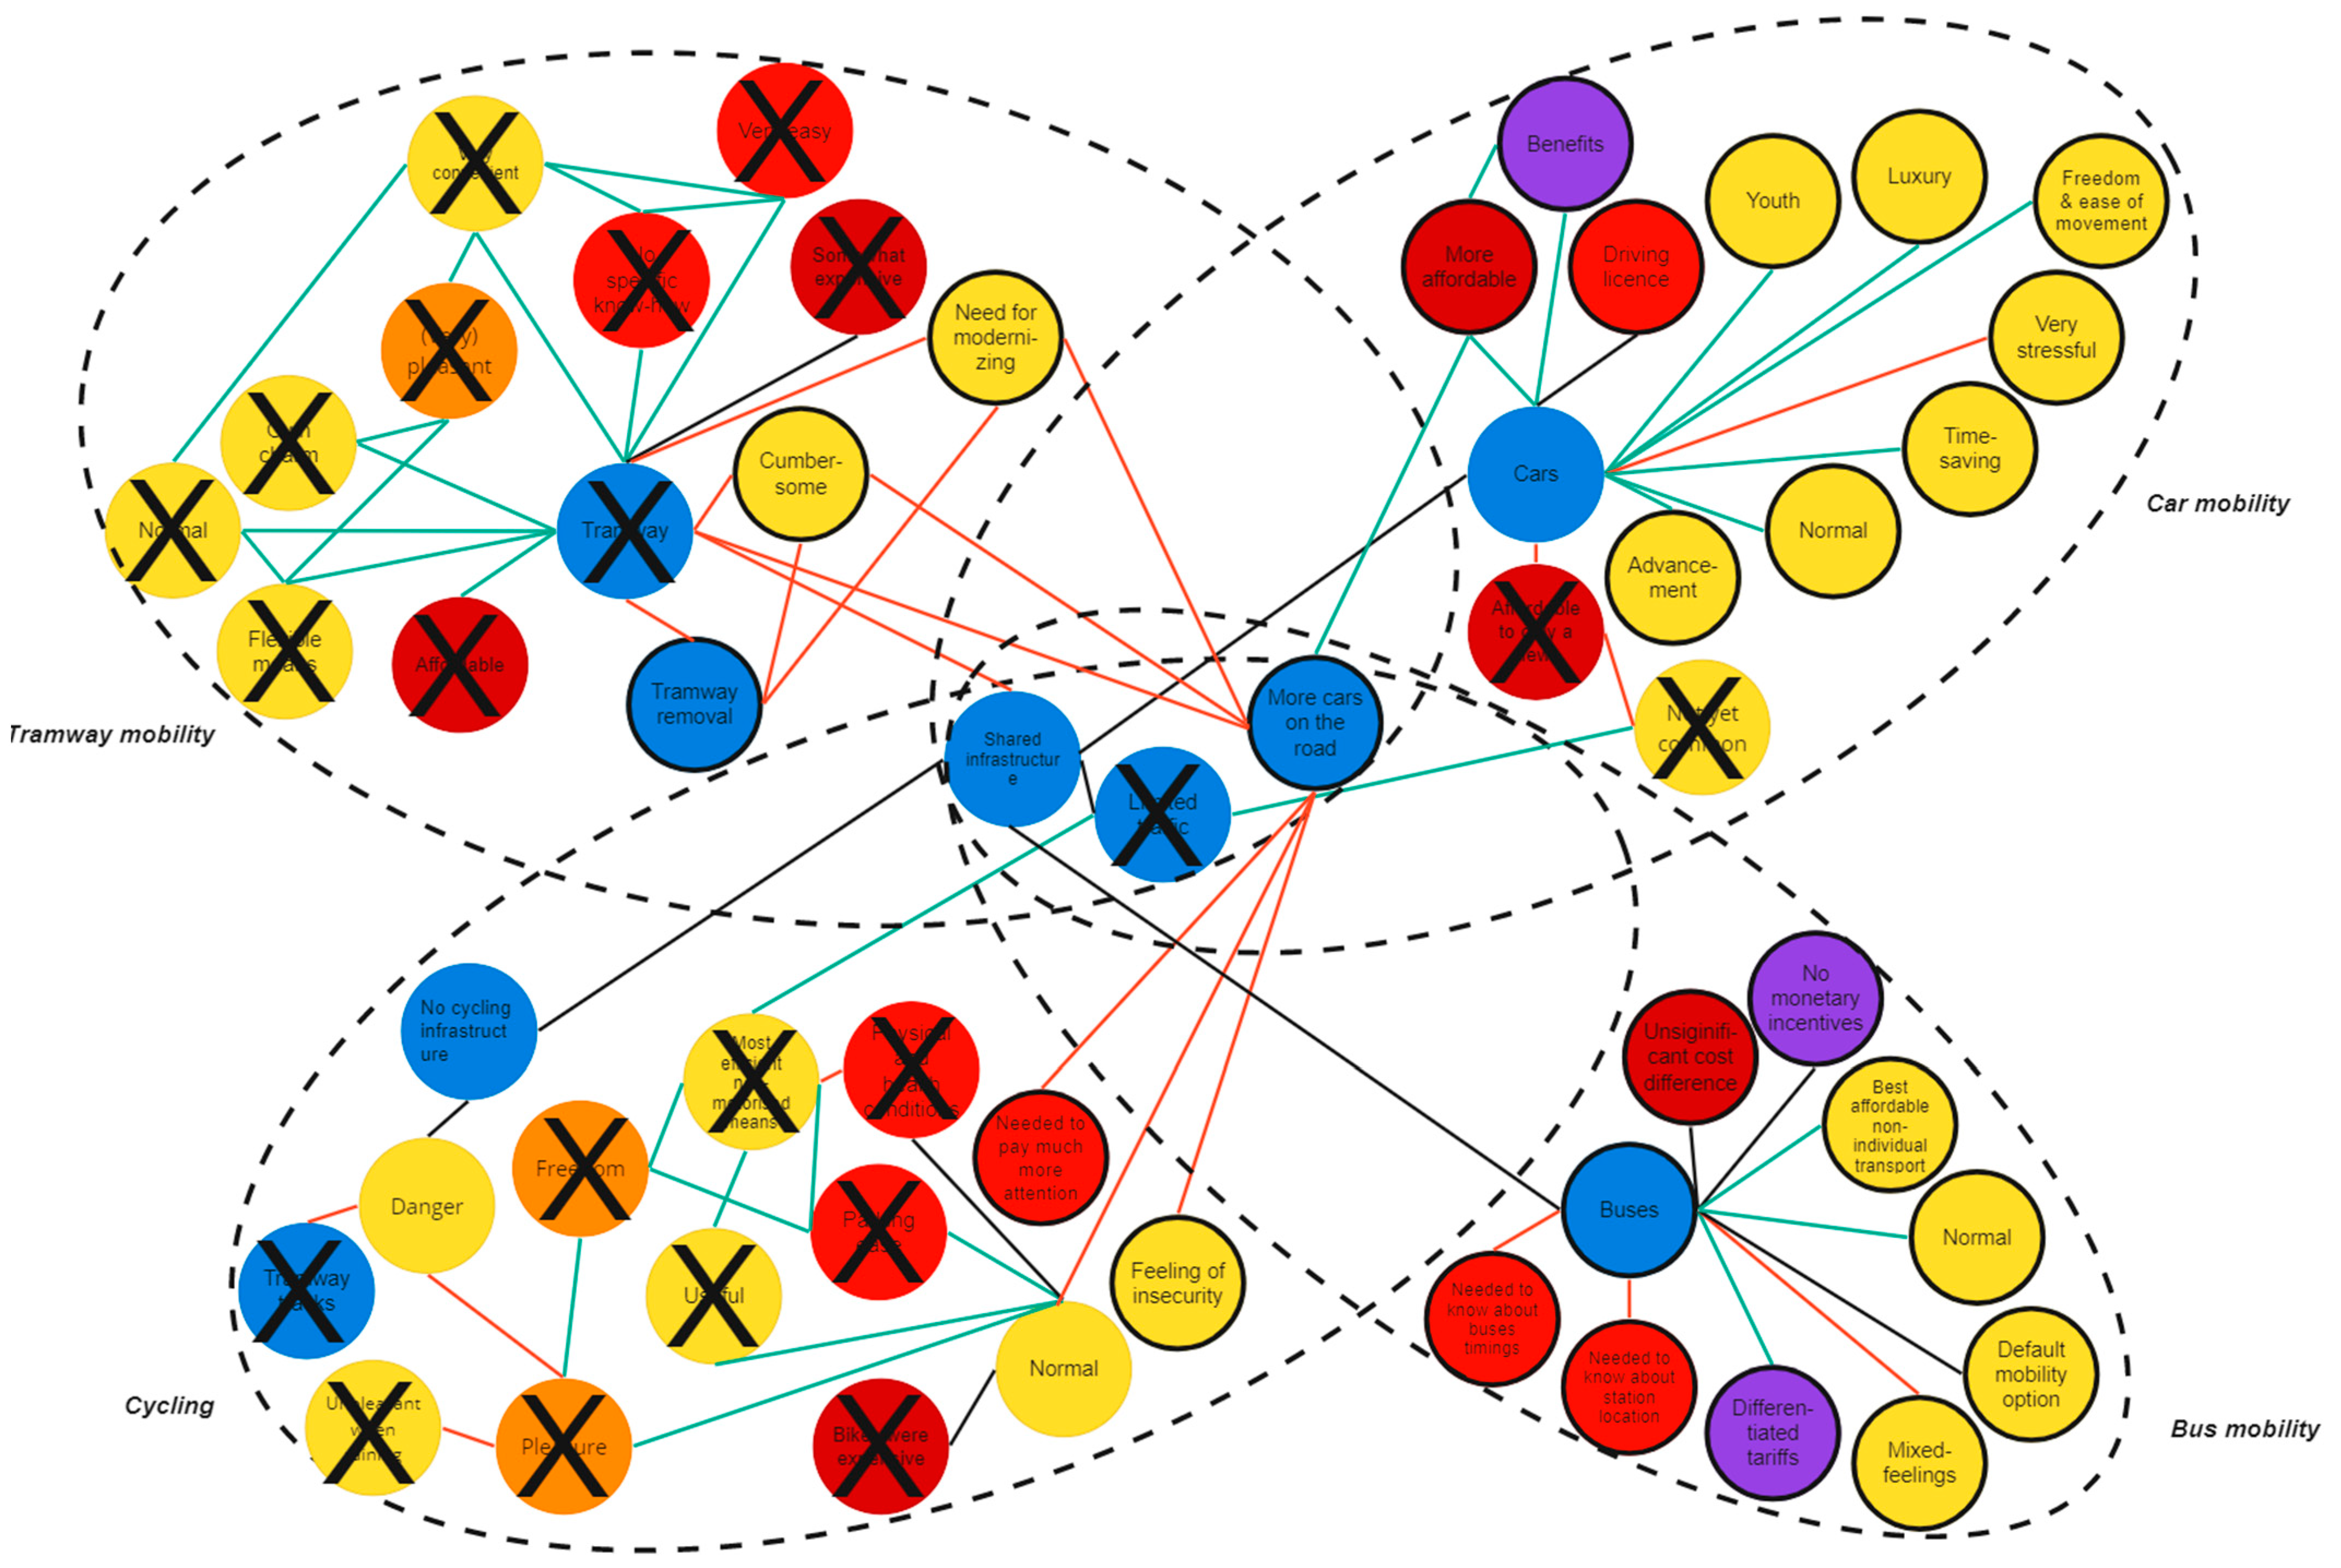
how can you handle this? How can you balance your family and professional life and come to work walking? Increasingly, people turned away from the practice of walking and started using their cars (int. 22, 23). The following figure (
Figure 6) summarises the interaction of the different elements associated with the various modes of transportation available in metropolitan CF Ferrand after the removal of the tramway.
4.2. Starting the De-Transition (after 2000)
In the 1990s, the municipality of Clermont-Ferrand initiated discussions about the reintroduction of the tramway in the metropolitan area as a means to reduce car mobility, and in turn reduce air pollution and congestion levels in the area. These debates translated into action with the construction of the tramway line between 2004 and 2006 and its opening at the end of 2006 (as described below in more detail). Cycling was later revived in metropolitan Clermont-Ferrand with the installation of self-service bike stations and the development of a cycling network. Although the re-introduction of the tramway led to an overall increase in PT trips, it did not necessarily replace car trips, but complemented them. Indeed, cars are still the dominant mode of transportation in metropolitan Clermont-Ferrand. In that regard, cars are largely present on the roads, and although cycling lanes have been created, the network is still underdeveloped and fragmented, which leaves the practice of cycling as an “in-development” practice rather than a well-established one.
Metropolitan Clermont-Ferrand’s size also increased institutionally from 8 municipalities in the 1990s to the current 21 municipalities constituting the Clermont Auvergne Métropole. Consequently, the surface of the area governed by the metropolitan government increased by almost 200 km
2. What were then the more urbanized settlements have extended to the outer rural boundaries that reach as far as the Chaîne des Puys (the Puys surrounding Clermont-Ferrand), with significantly distinct land usage. While the core municipalities in metropolitan Clermont-Ferrand are mostly urbanized, this is not the case of most of the newly added municipalities, which are composed of fields; forests; and small, scattered discontinuous urban areas. Around 2000, Michelin shrunk compared to period 1 (although still employing about 9000 to 12,000 people in the area [
46], in contrast to employing around 30,000 in 1970), and Clermont-Ferrand experienced an economic rebalancing in favour of the tertiary sector. Economic activities, which were, in period 1, predominantly concentrated around Michelin’s factories, then shifted to the eastern side of metropolitan Clermont-Ferrand, with mostly continuous and discontinuous urban areas covering the centre of the metropolitan area [
47]. In 2000, automobility was still dominant in CF (as in the 1970s), with ~80% of inhabitants having a car and with a car modal share above 84% in 1992 [
40]. Cars are an integral part of everyday life around which habits and emotions have built themselves. People associate car use with
positive feelings, particularly the feelings of
freedom and
autonomy (int.9, 10):
really going where we want, whenever we want. For many, the only negative emotion associated with cars would be the
stress of finding a parking spot in the city. For that, people reported that they needed to know the city very well (int. 24, 5). The municipalities seem to have facilitated the use of cars with the construction, maintenance, and
extension of roads [
36]. This has not prevented
roads from being
crowded, especially during rush hours (Int. 13). In such a context, and without cycling paths, it is not surprising that cycling rates were around 1% in 2003 [
48].
Public transportation
Next to extending car infrastructure, the regional mobility authority SMTC (Syndicat Mixte Transports en Commun de l’agglomération clermontoise, created in 1976) tried to facilitate the flow of bus mobility through the creation of dedicated
bus lanes and bus lights with a first attempt in the 1980s and a re-launch in the early 1990s [
40]. This was intended to ease the circulation of buses around the city despite the crowded roads, which were significantly delayed by it (int. 13, 24). However, the bus lane policy was ineffective, because (1) later parts of the plan were halted because of lack of funding, and (2) the number of bus lanes was limited compared to the ample space for cars, and, therefore, their impact. Using the buses was
affordable (int. 13, 9); while they were often crowded (int. 24) and found
not to be flexible (compared to a car) (int. 16, 13, 10, 1), they were attractive due to
not needing to find a parking spot (int. 24).
Tram mobility re-emerging
With the negative impact of car mobility on the urban space, and with congestion increasing, the idea of a tramway in the city emerged again after its demolition 35 years earlier. The support for it was driven by the growing conviction that car mobility was becoming more and more complex [
40], with increasing traffic (int. 8, 24, 10), parking shortage (int. 24, 5), and links to pollution [
49]. Despite wide support, the decision to implement the
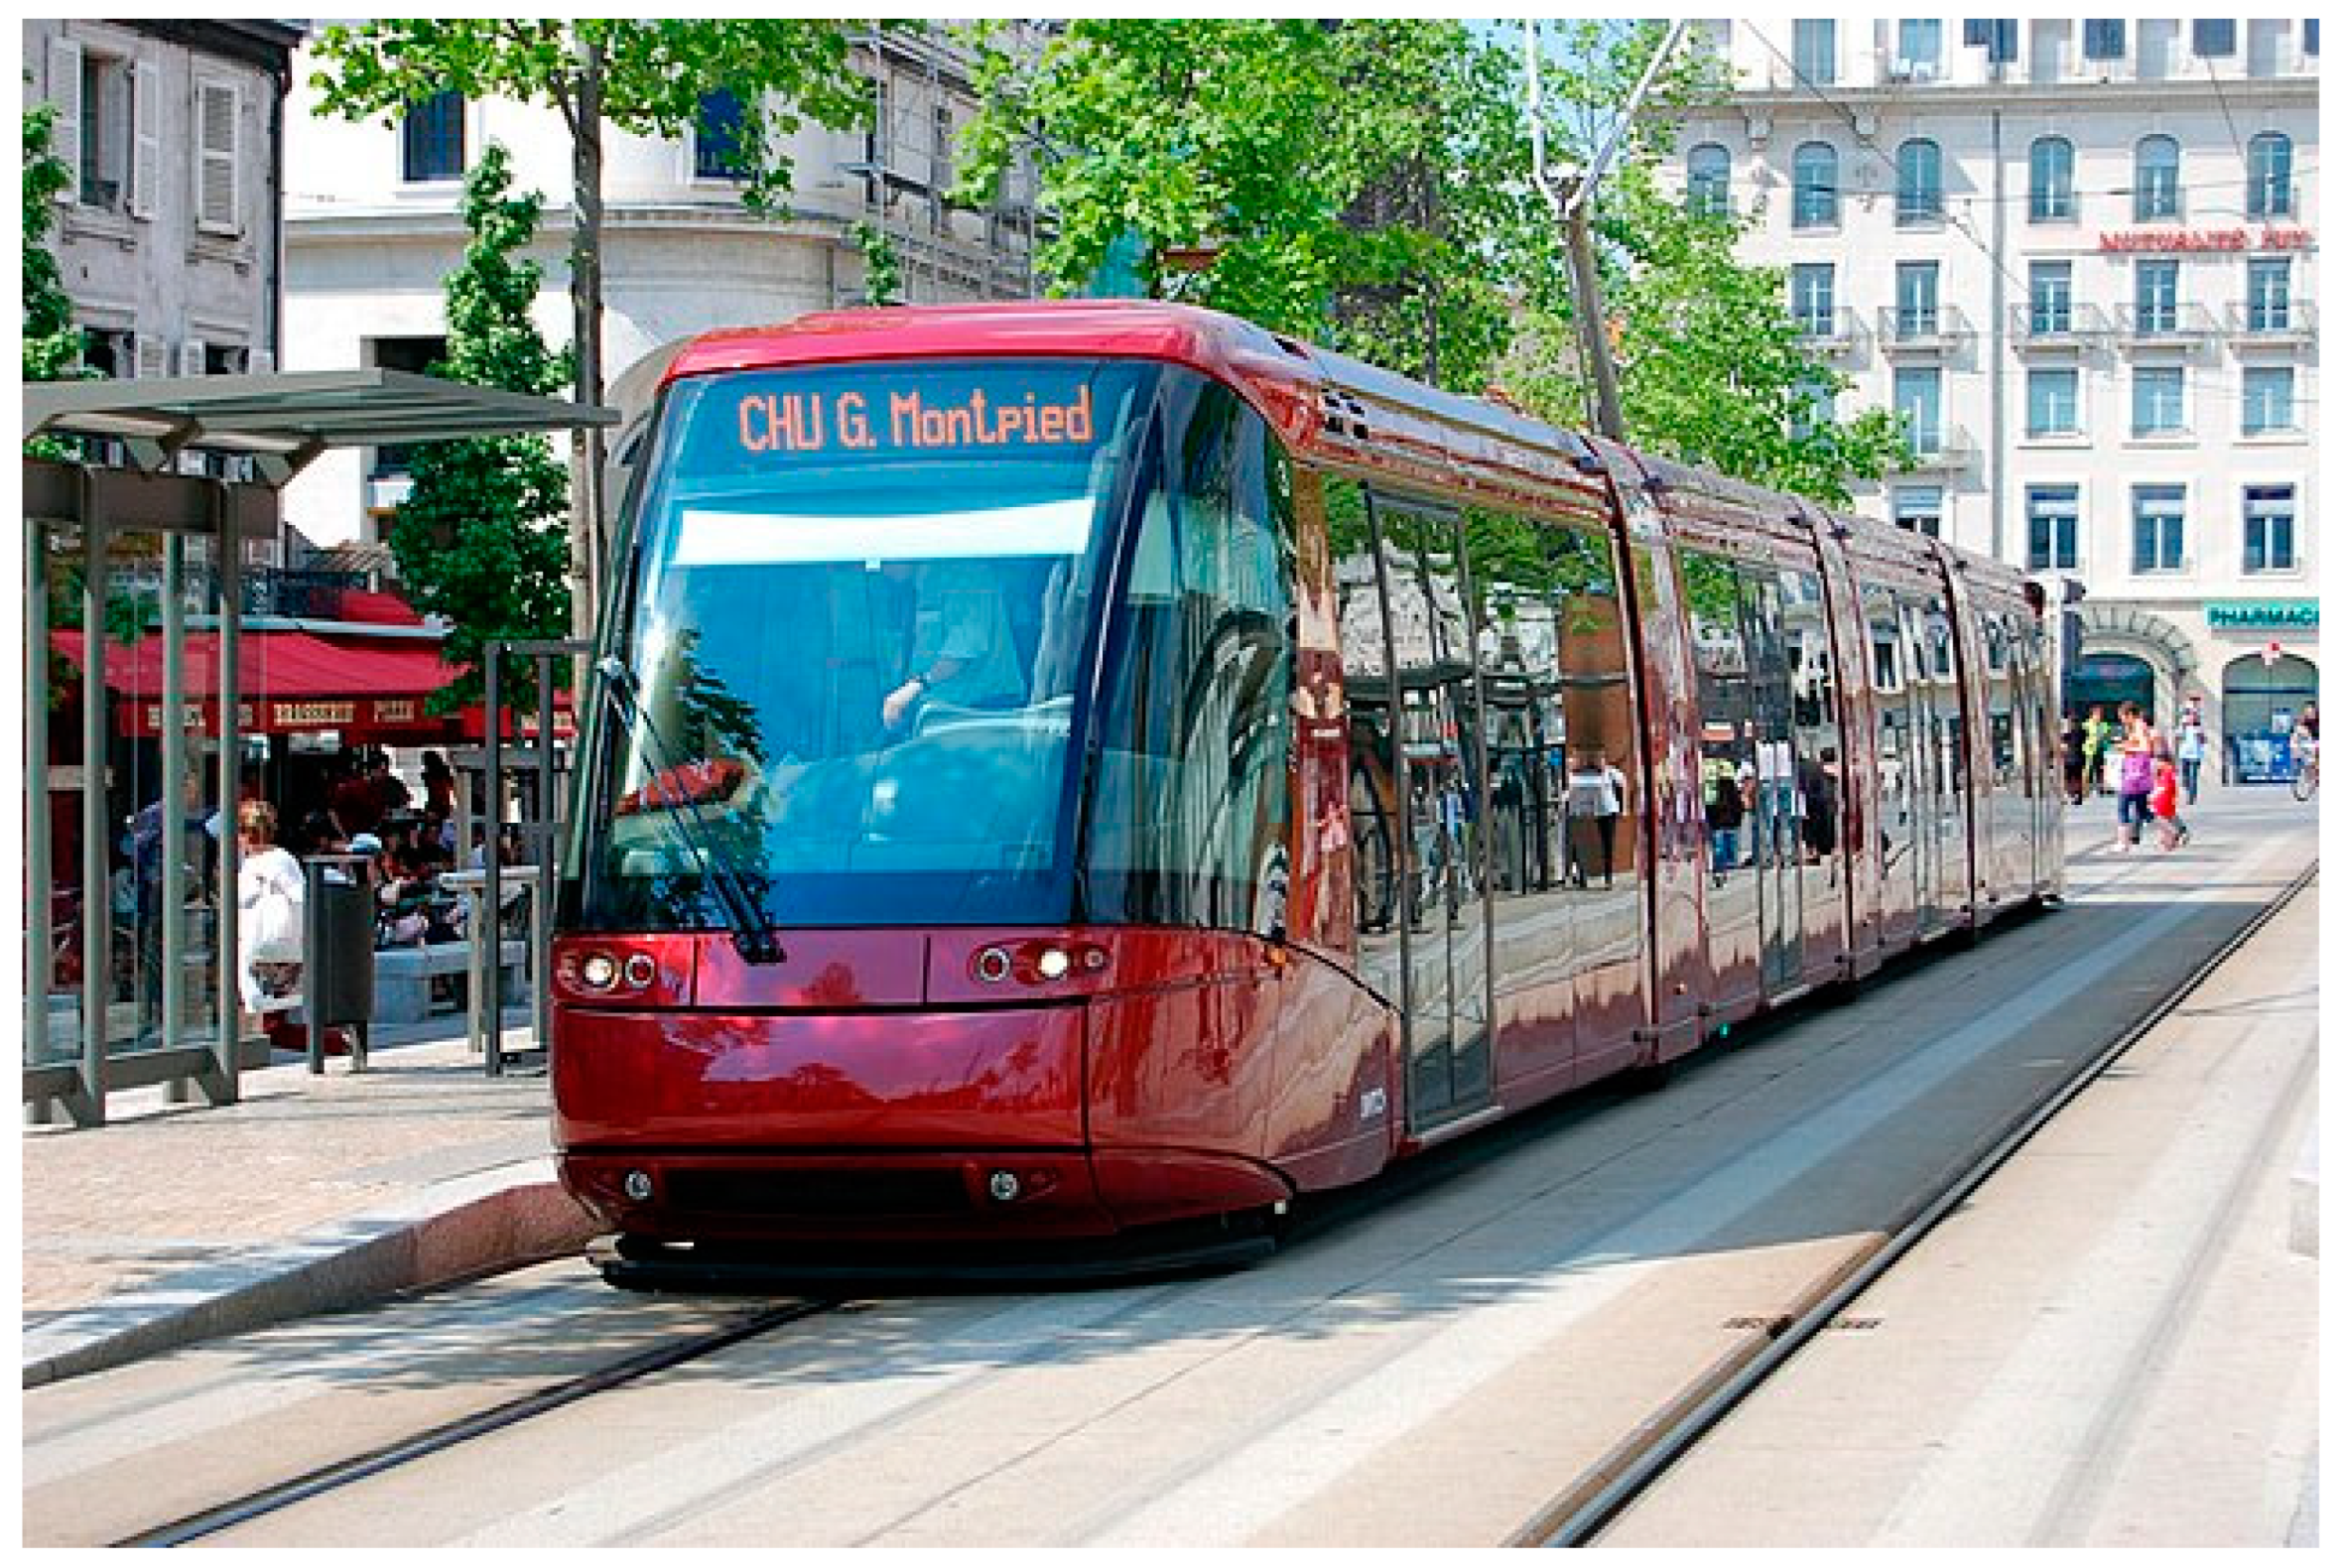
tramway, which opened in November 2006 (see
Figure 7), it was qualified as a form of revolution by mobility policymakers. Just like in the late 19th century, the introduction of a tramway was perceived by urban planners as a significant technological improvement, bringing about a good reputation to the city [
40,
50]. The 2000 urban development ordinance (PDU) of metropolitan Clermont-Ferrand had placed clear emphasis on the development of public transport in the city, with the aim to find a “
credible alternative to car mobility” [
51] (p. 42). In that sense, the tramway was seen in a different light, in the sense that it was a means to promote more sustainable political agendas during election times and that it benefitted from a special status with its dedicated track and, accordingly, its right-of-way route [
50] (p. 8). This which contrasted with its position as one of the available means of transportation with the infrastructure in Period 1. The need for such a right-of-way route to be created with the reintroduction of the tramway arose from the observed air and noise pollution [
51] (p. 61), as well as the congestion levels in the metropolitan area associated with car use [
40]. The vision was then to reduce car use, and this was linked to the further decentralisation of amenities (such as new supermarkets) and activities through the creation of public transport lines (including the tramway line) so as to stimulate local shopping, reinforce the attraction of central facilities, and in turn hamper car mobility [
51] (p. 73). As Ryat [
40] argues, the new tramway in Clermont-Ferrand is on tires, which perform better when going uphill. This is due to the presence of Michelin in the city, which played an important role in the new tramway’s design.
Although the project faced (national) budget cuts and the according cancellation of accompanying measures, such as reduced car access in the city center and urban regeneration projects [
44], the
tramway line was
extended in 2013 to connect the northern neighbourhoods of Clermont-Ferrand. Unlike in the 1950s, the current tramway line does not include several municipalities, but solely travels to Clermont-Ferrand and Aubière. Local residents and travellers are happy with the tram, considering it a priority over
cars in the city center, as it is
faster for trips there (int. 16, 15, 12, 9, 13). It is seen as
convenient (int. 9, 13, 15, 12, 11, 10, 8), although
crowded at peak hours (int. 12, 11, 9, 15). People associate more positive feelings with the tramway in comparison to the buses (due to frequency and priority over road users), apart from the
limited reach of the line, which practically limits its usefulness to trips within the city center (int. 16, 15, 5). In comparison, a bus network is available throughout the metropole. Three years after the re-introduction of the tramway, the number of PT trips had grown by 42.5% compared to three years prior to its reintroduction [
53]. It is likely that this has stimulated the reputation of PT more generally, which has translated into a significant increase in PT trips (transportation operator interview).
Since 2015, to promote public transportation and to be more inclusive to lower income groups,
tariffs are not
indexed on people’s statuses anymore, but
on people’s incomes [
54]. To benefit from those discounted prices, users need to fill in some forms and provide documents proving their eligibility [
55], which has, however, proved to be irksome (int. 12). More recently, a two-year experiment with
free travelling on weekends began in December 2021 [
56].
Revival of Cycling
Since 2013, it has also been possible to rent a bike thanks to the creation of the
CVélo network, which offers both self-service bikes, which are free for the first 30 min [
57], and
long-period bike rental. Currently, more than 680 bikes are distributed throughout the 57 stations within the city of Clermont-Ferrand (not outside it). While the self-service bikes are solely normal/non-assisted, long-period bike rental includes traditional bikes and electric bikes. People have also been encouraged to take on cycling through national
incentives for the purchase of e-bikes, for which people can reclaim up to EUR 400 [
58]. The financial help for e-bikes appears to have affected more people than that one interviewee (16); two questionnaire respondents benefitted from it. The government has not, however, rested its whole strategy on monetary incentives, but also aims to educate and raise awareness about active means of transportation and to normalise the practice in citizens from a young age. Primary school children are now
taught how to ride bikes as they enter middle school [
58]. However, this
educational scheme was not highlighted by any interviewee, even when they were talking about their children. Due to its novelty, it could therefore be assumed that this policy incentive is still making its way through French cities.
While the cycling infrastructure has been developing in Clermont Auvergne Métropole, with some lanes separated from the car lanes and some not, interviewees and questionnaire respondents agreed that it remains very fragmented. This means that in many places, the cyclist needs to cycle alongside other traffic, with no (cycling) lane at all, which is experienced as unsafe by cyclists and annoying for car motorists (int. c and 15: I am scared of cars; int. 16: I wear all the protection gears that exist (…) although I am extremely careful, you can’t be careful for others; int. 13: cars really make you feel fragile and vulnerable; int. 16: when we are cycling at 20 km/h on the road, people are pissed off; int. e: many get annoyed when they are behind us, they honk).
This result emerged despite an adaptation of the driving theory curriculum in the past few years, which added a course for drivers to increase their awareness of cyclists and to better interact with them (interview with a driving instructor). In the survey, 44% of respondents indicated that they found cycling dangerous; 39% found it pleasant; and 5% found it unpleasant. This broadly shows the ways in which people see cycling, with one interviewee summarizing this clearly: it really takes courage to do that! (Int. 3). More recently, in 2021, the speed limit on many secondary roads in Clermont-Ferrand was reduced from 50 to 30 km/h, but interviewees did not mention any effects of this.
Impact of trams and cycling on the hegemony of cars
Since the re-introduction of the tramline and cycling facilities, car mobility has not changed much. Convenience, independence, and autonomy are still keywords. One policymaker linked the continued facilitation of car mobility with Michelin:
we are the city of Michelin, so cars are important (interviewee number 2). Interviewees did mention that there has been more and more environmental concern and awareness of the (negative) impact of cars, which has encouraged them to move to alternatives (int. 2, 9, 10, 11, 12, 13, and 15). For instance:
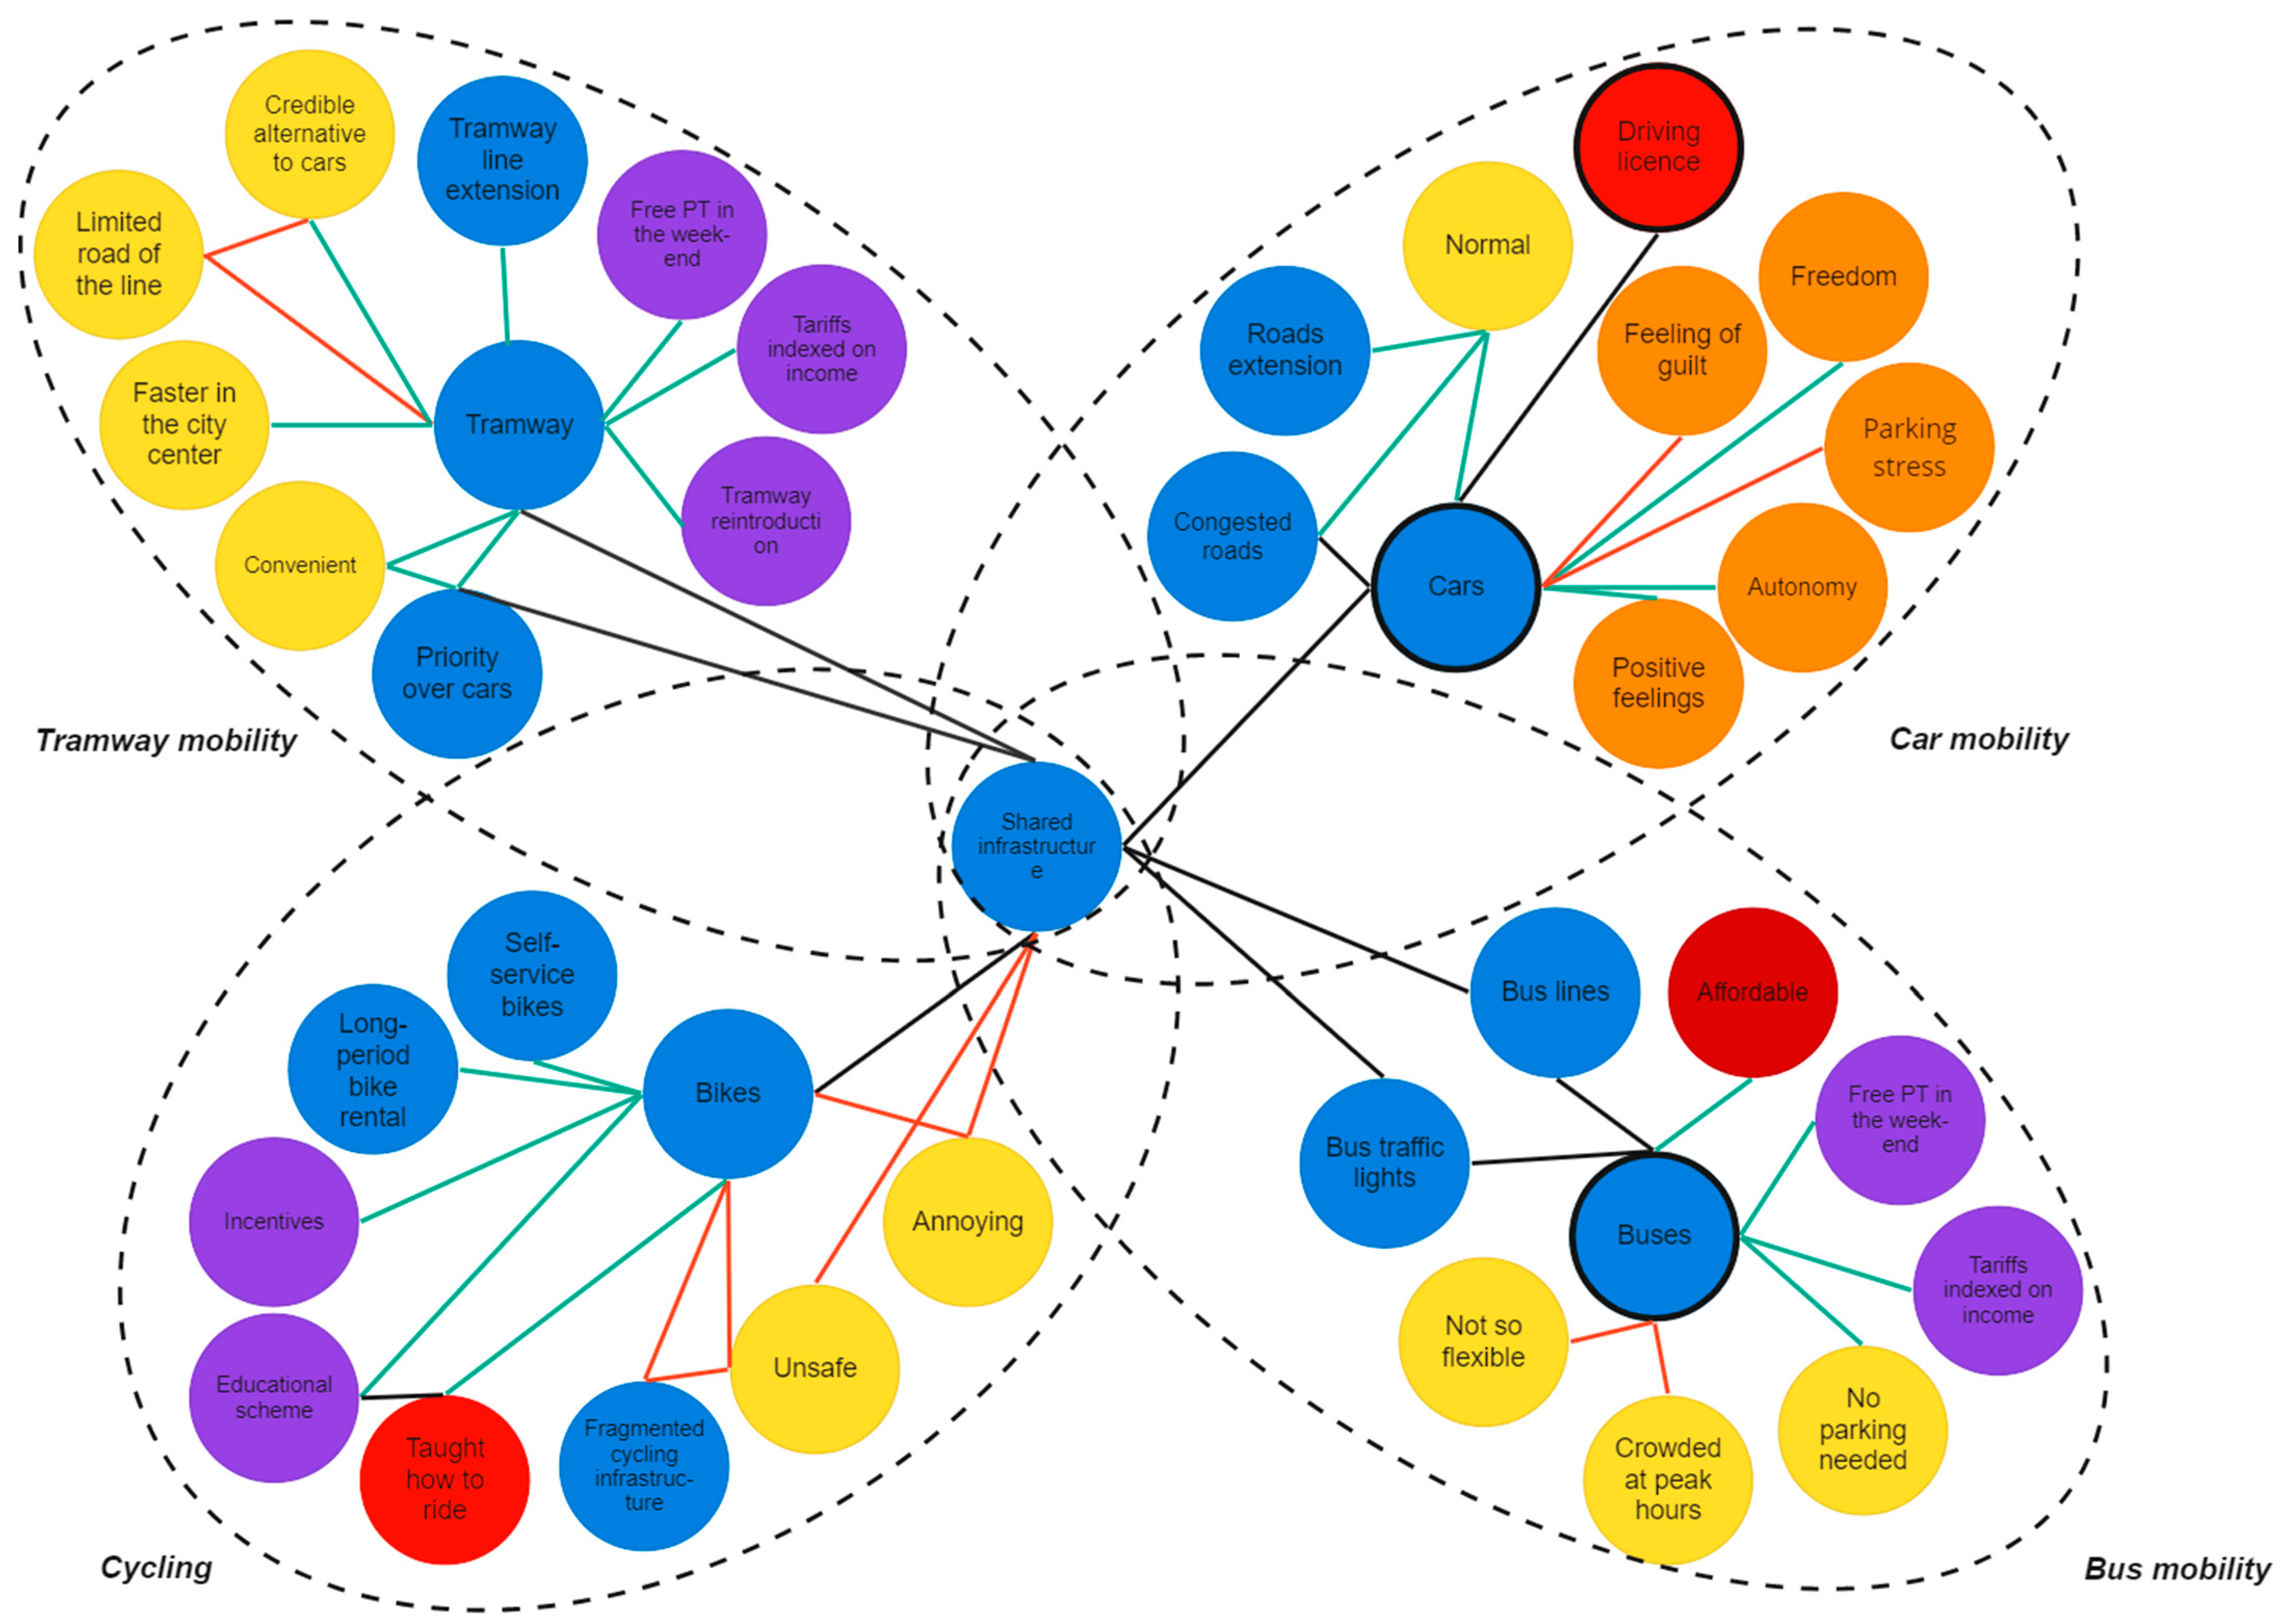
now there is almost a feeling of guilt when we use the car; you know it is better to travel by public transportation. Still, respondents spoke about necessary changes, and did not report actual changes in transport modality. The increasing cost of car mobility, mainly due to fuel prices, was also mentioned in the survey as a constraint, with a significant difference between people under 45 years (strong constraint) and those above 45 years (little constraint). All in all, the re-introduction of the tramline and cycling facilities has hardly affected car mobility in CF and its surroundings. The following figure (
Figure 8) summarises the interaction of the different elements associated with the various modes of transportation available in metropolitan Clermont-Ferrand since 2006.


