

Federated Learning for Diabetic Retinopathy Detection Using Vision Transformers

Abstract
:1. Introduction
2. Vision Transformer
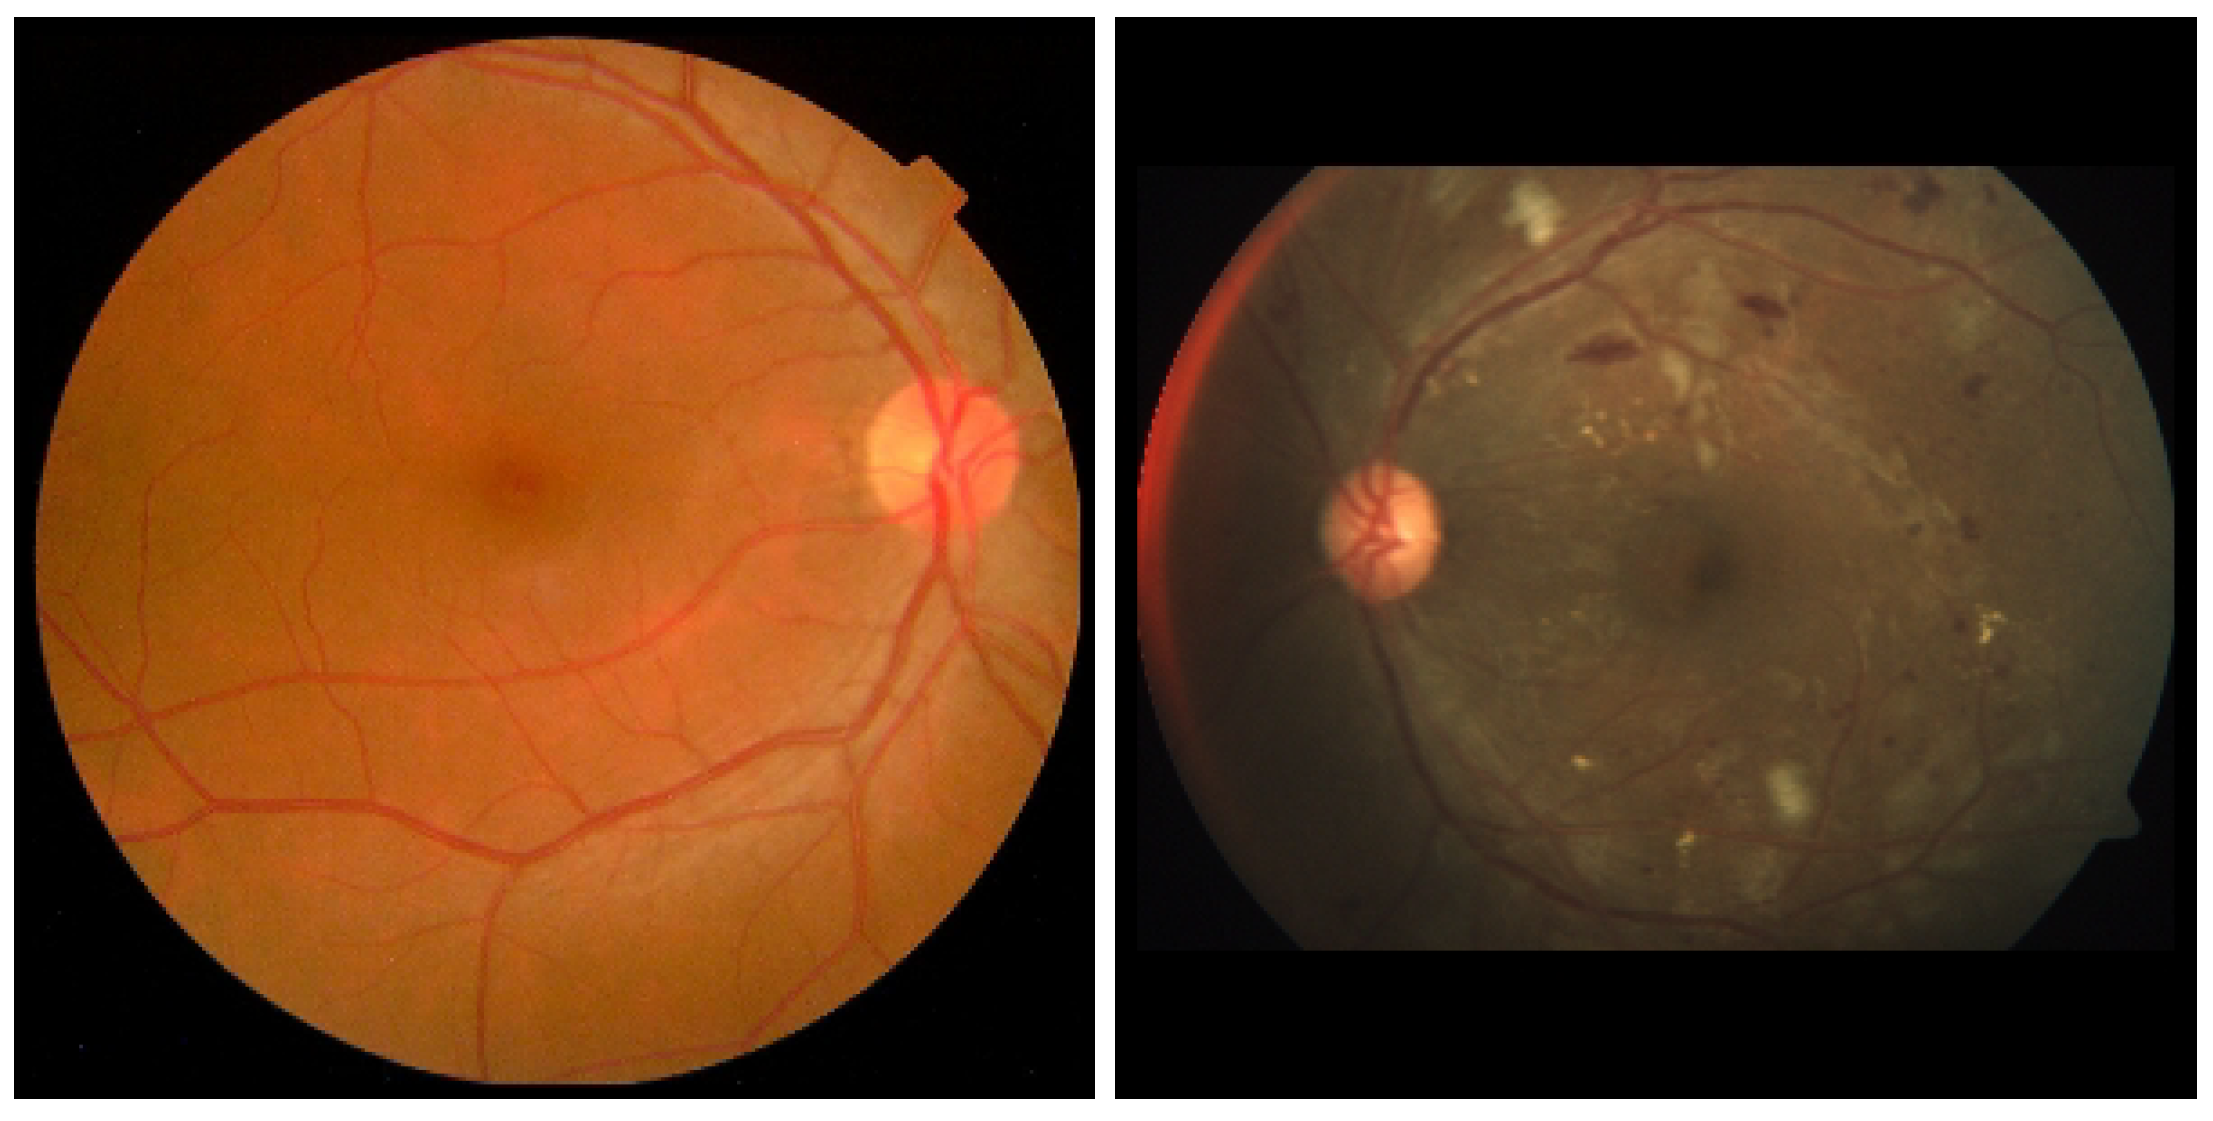
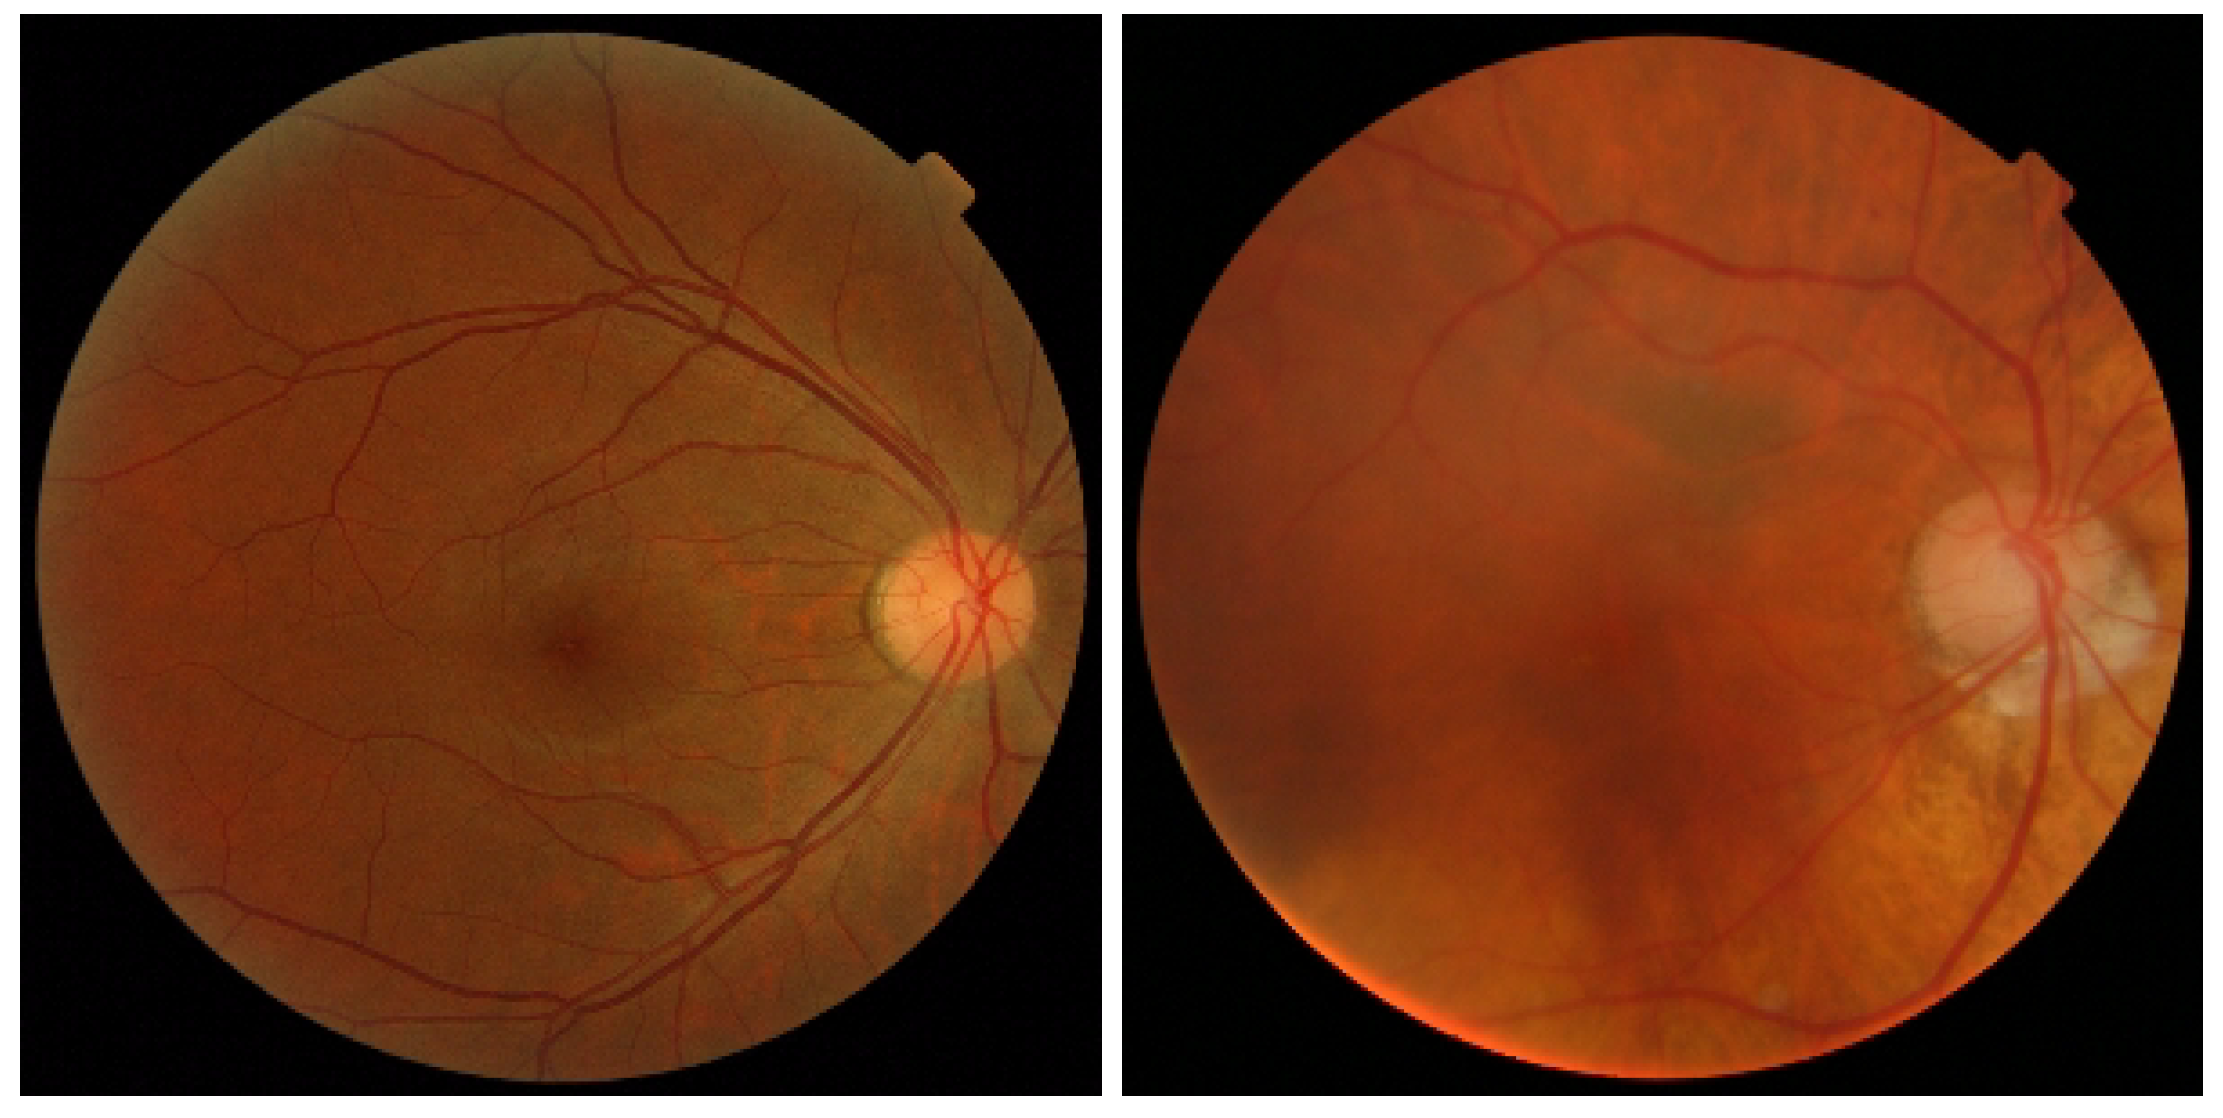
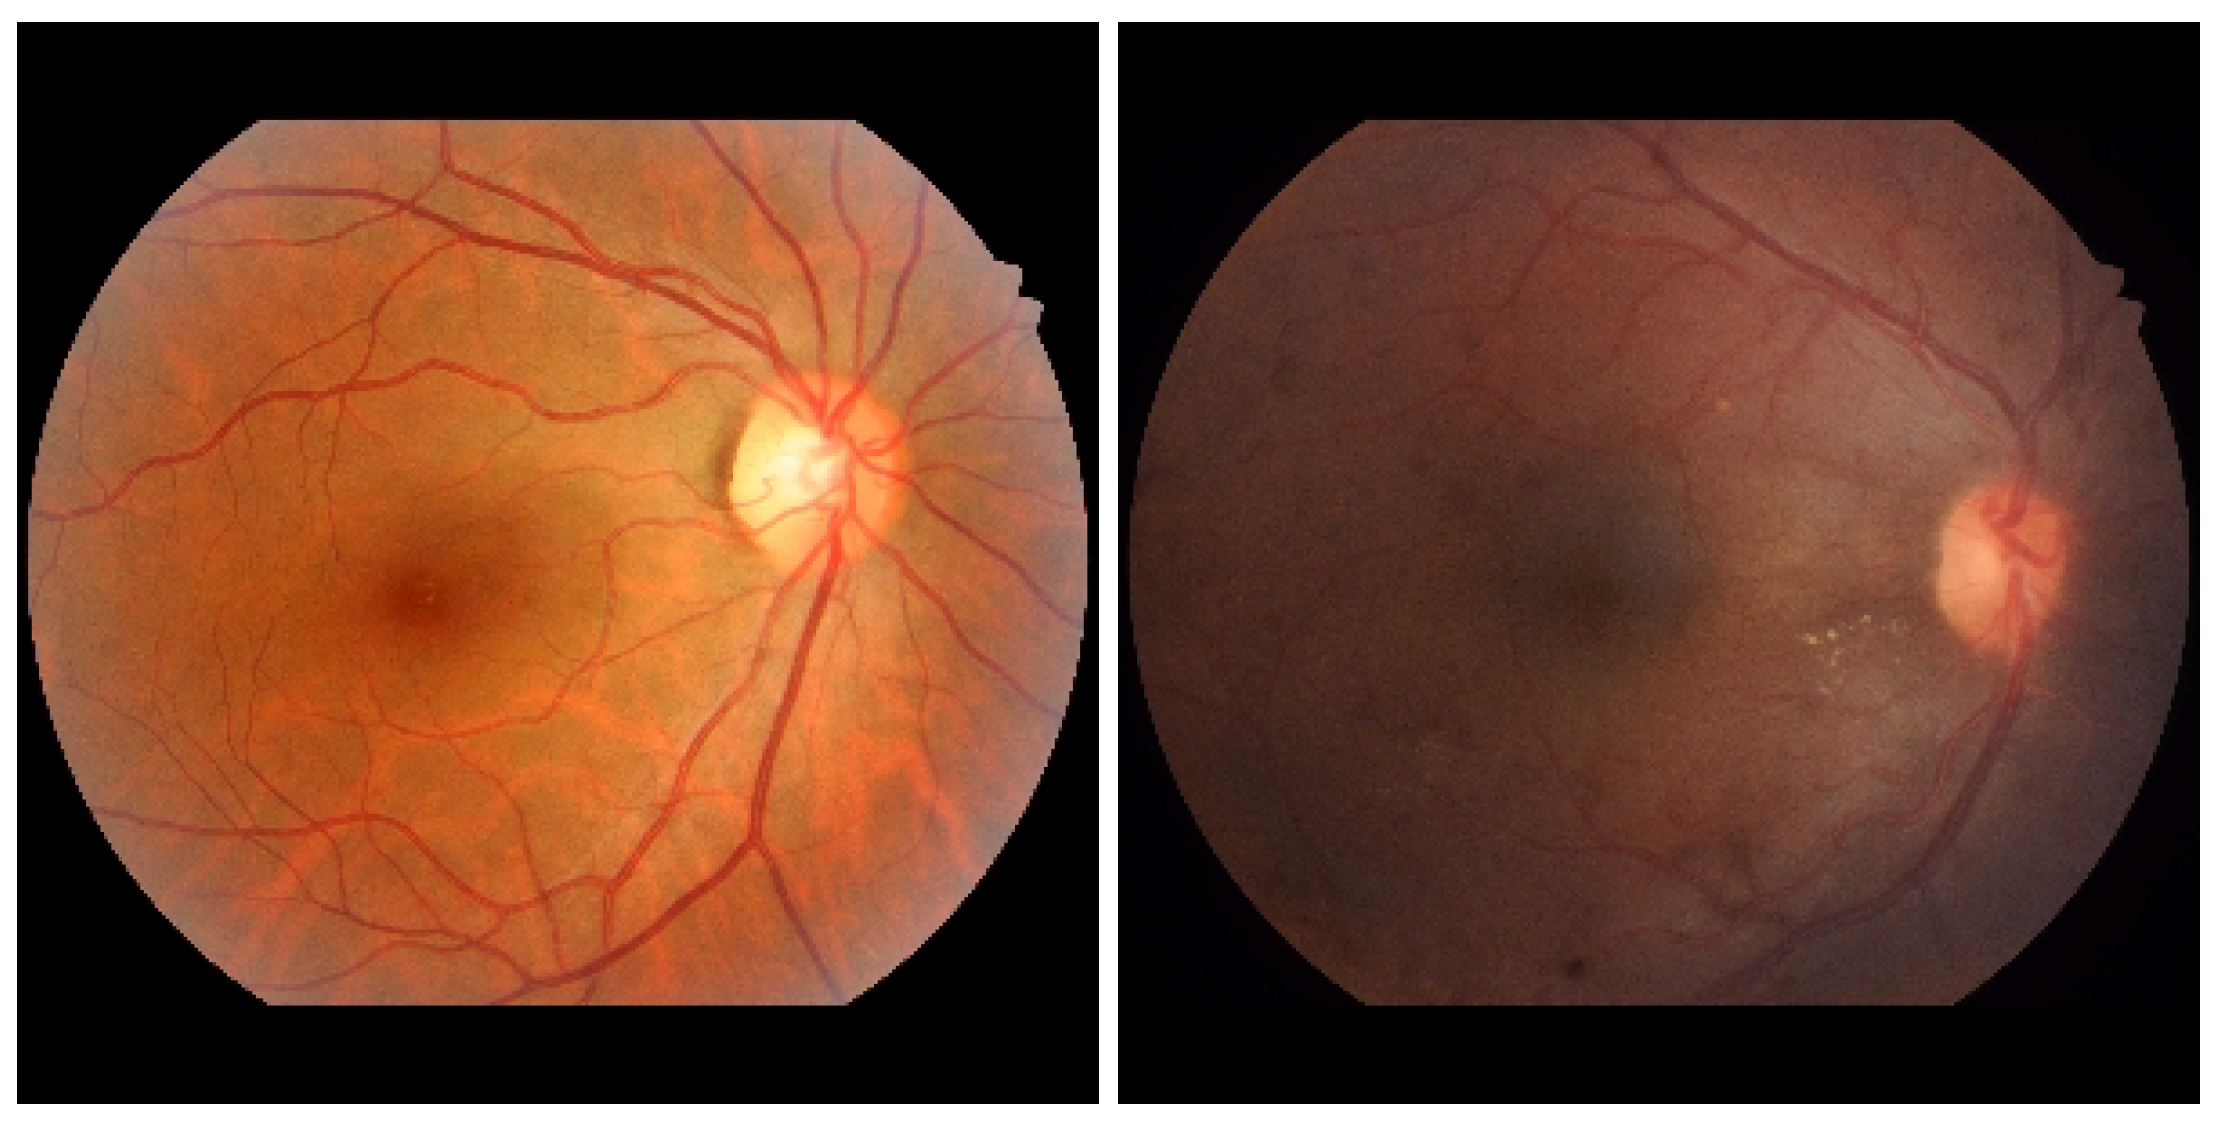
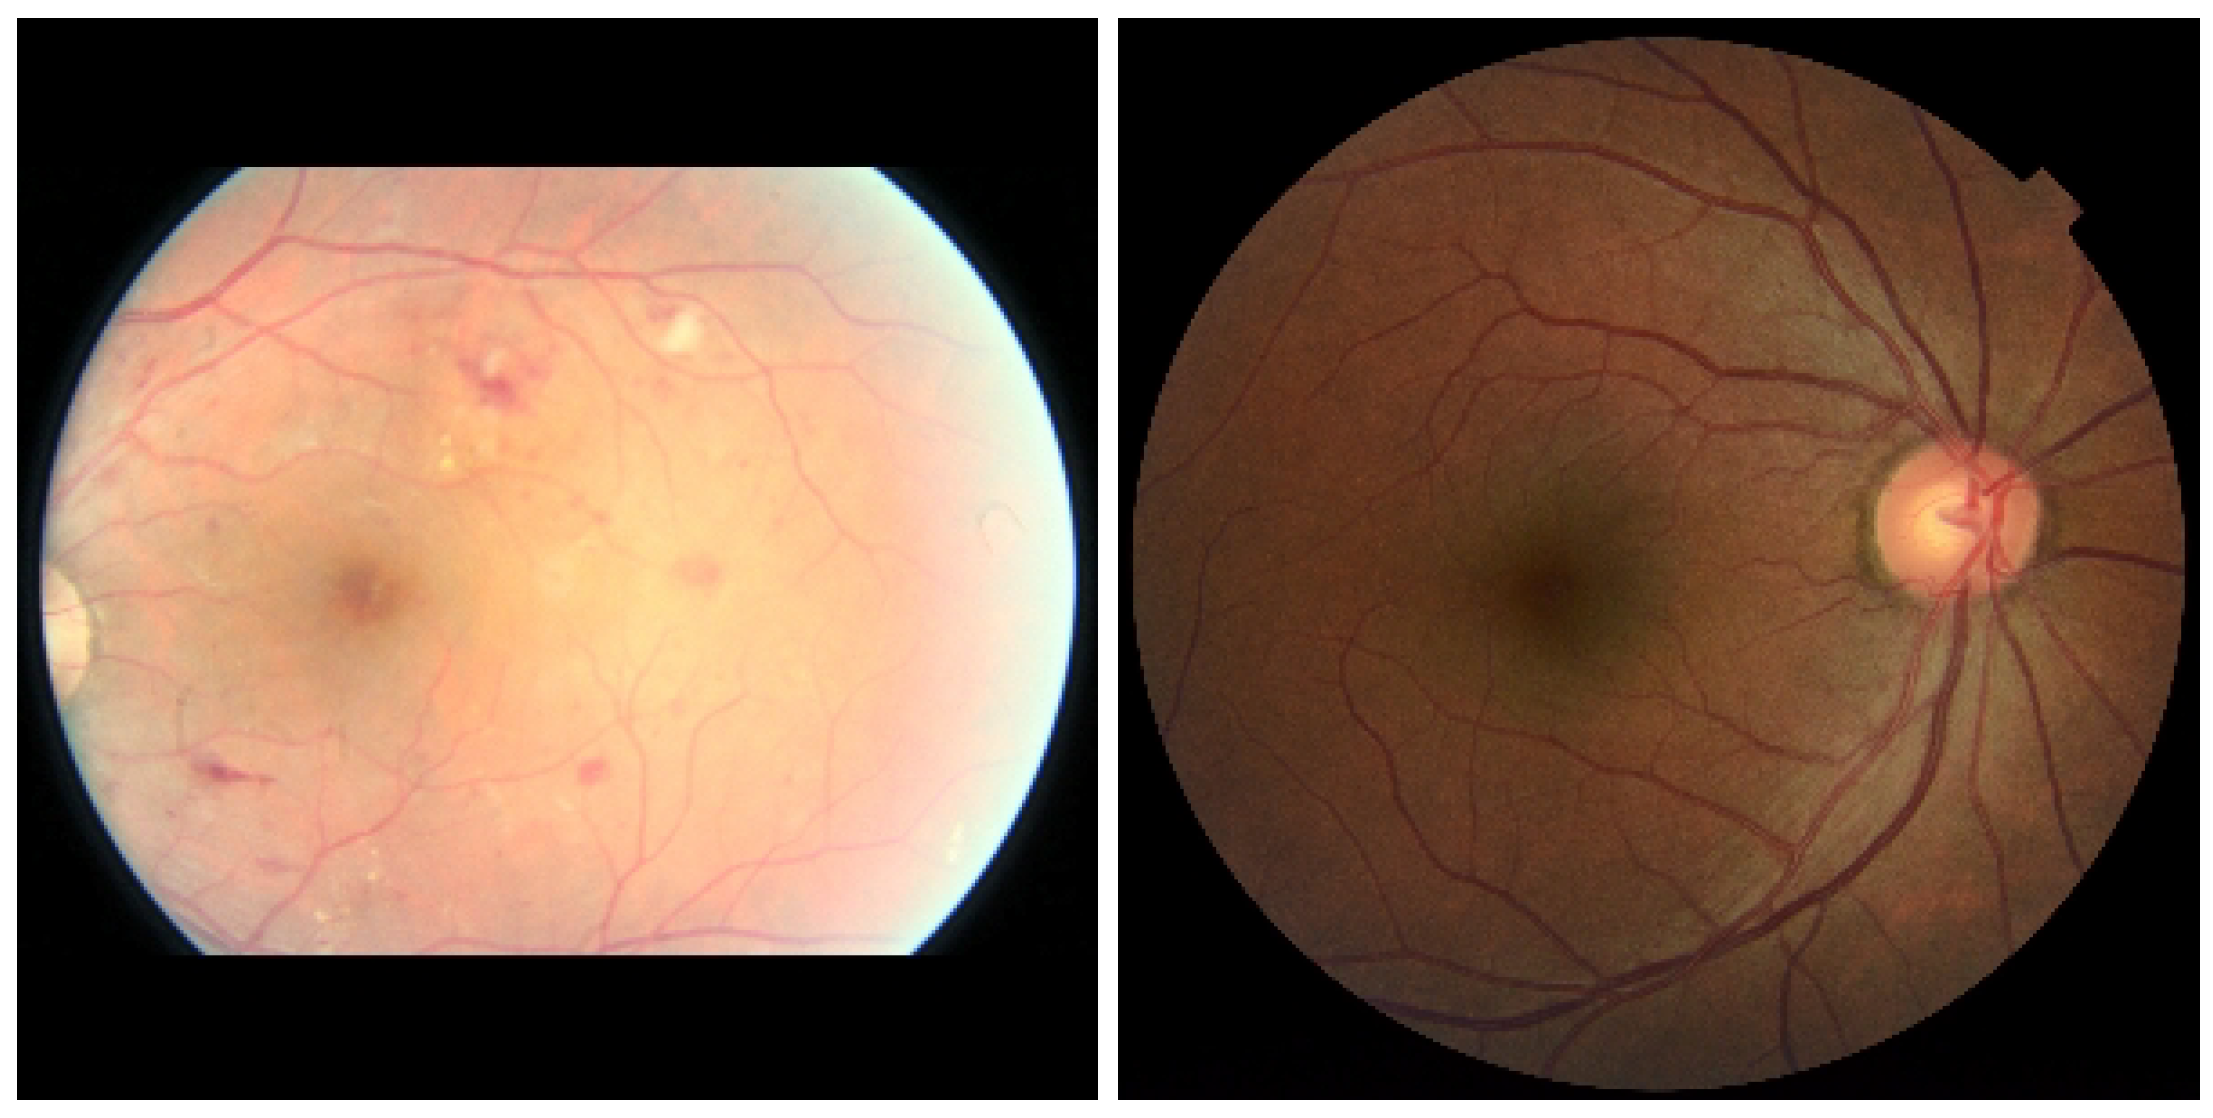
3. Diabetic Retinopathy Datasets
3.1. APTOS
3.2. MESSIDOR-1 and MESSIDOR-2
3.3. IDRID
3.4. Eyepacs
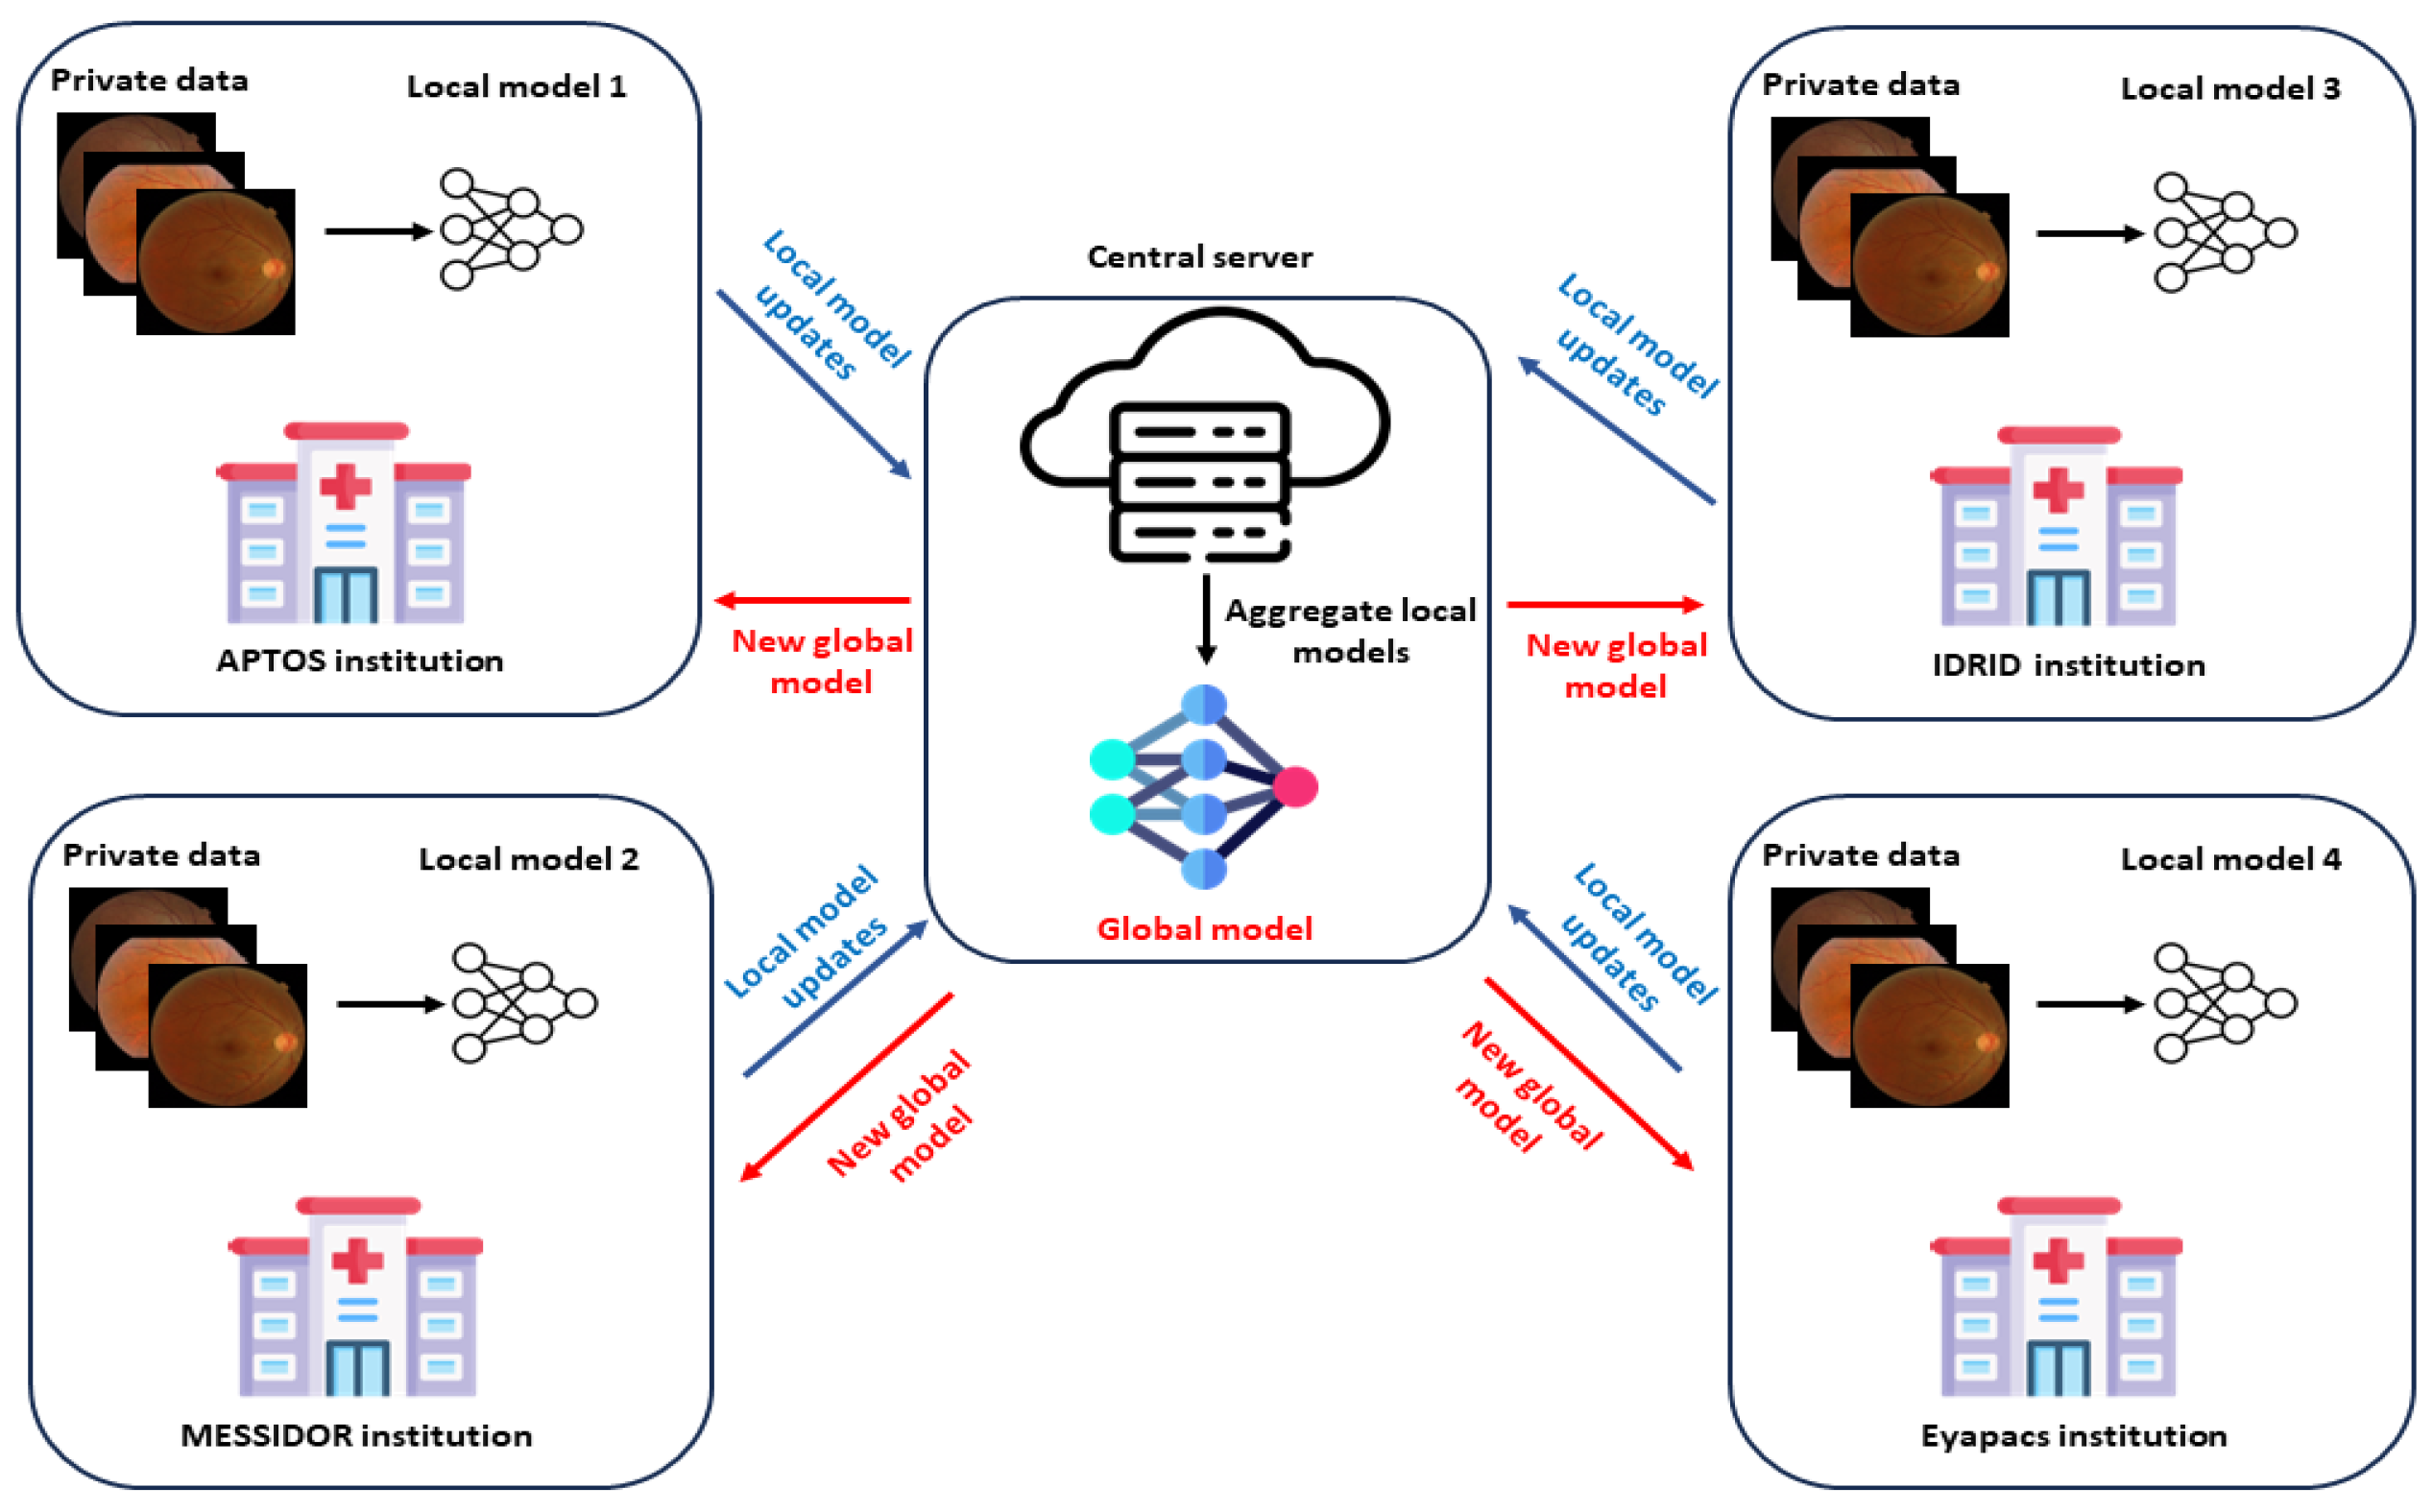
4. Federated Learning
5. Metrics
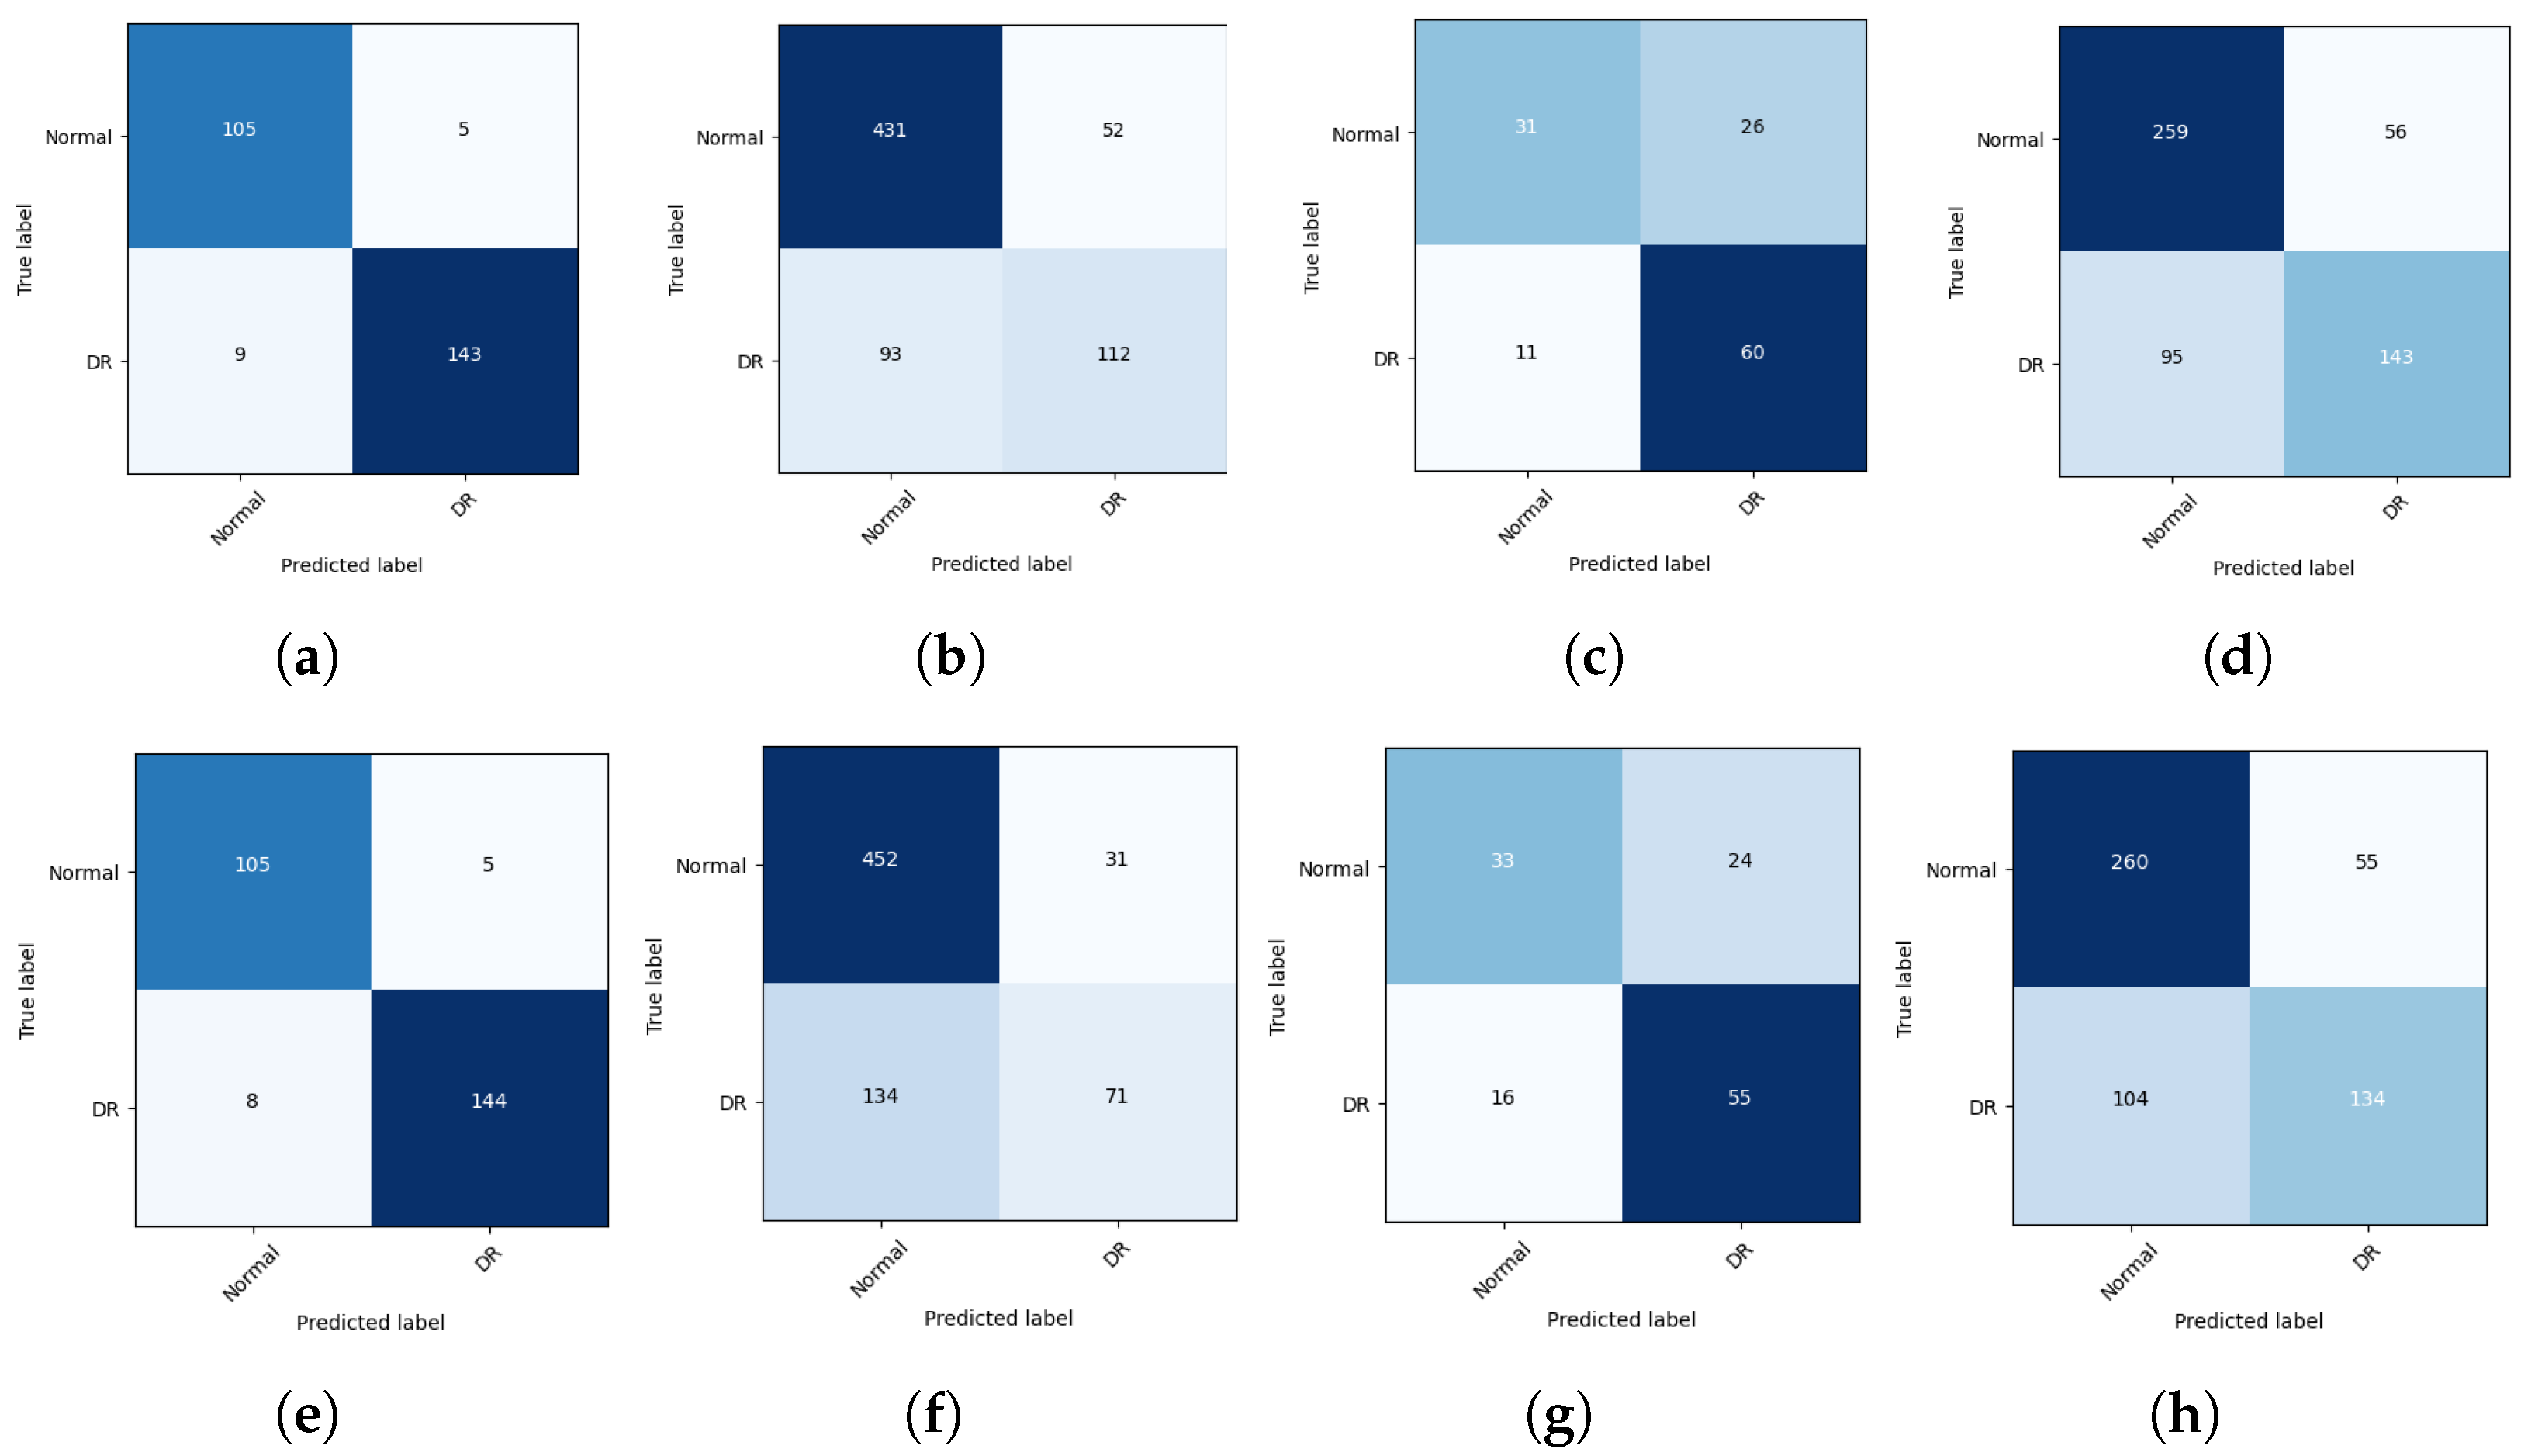
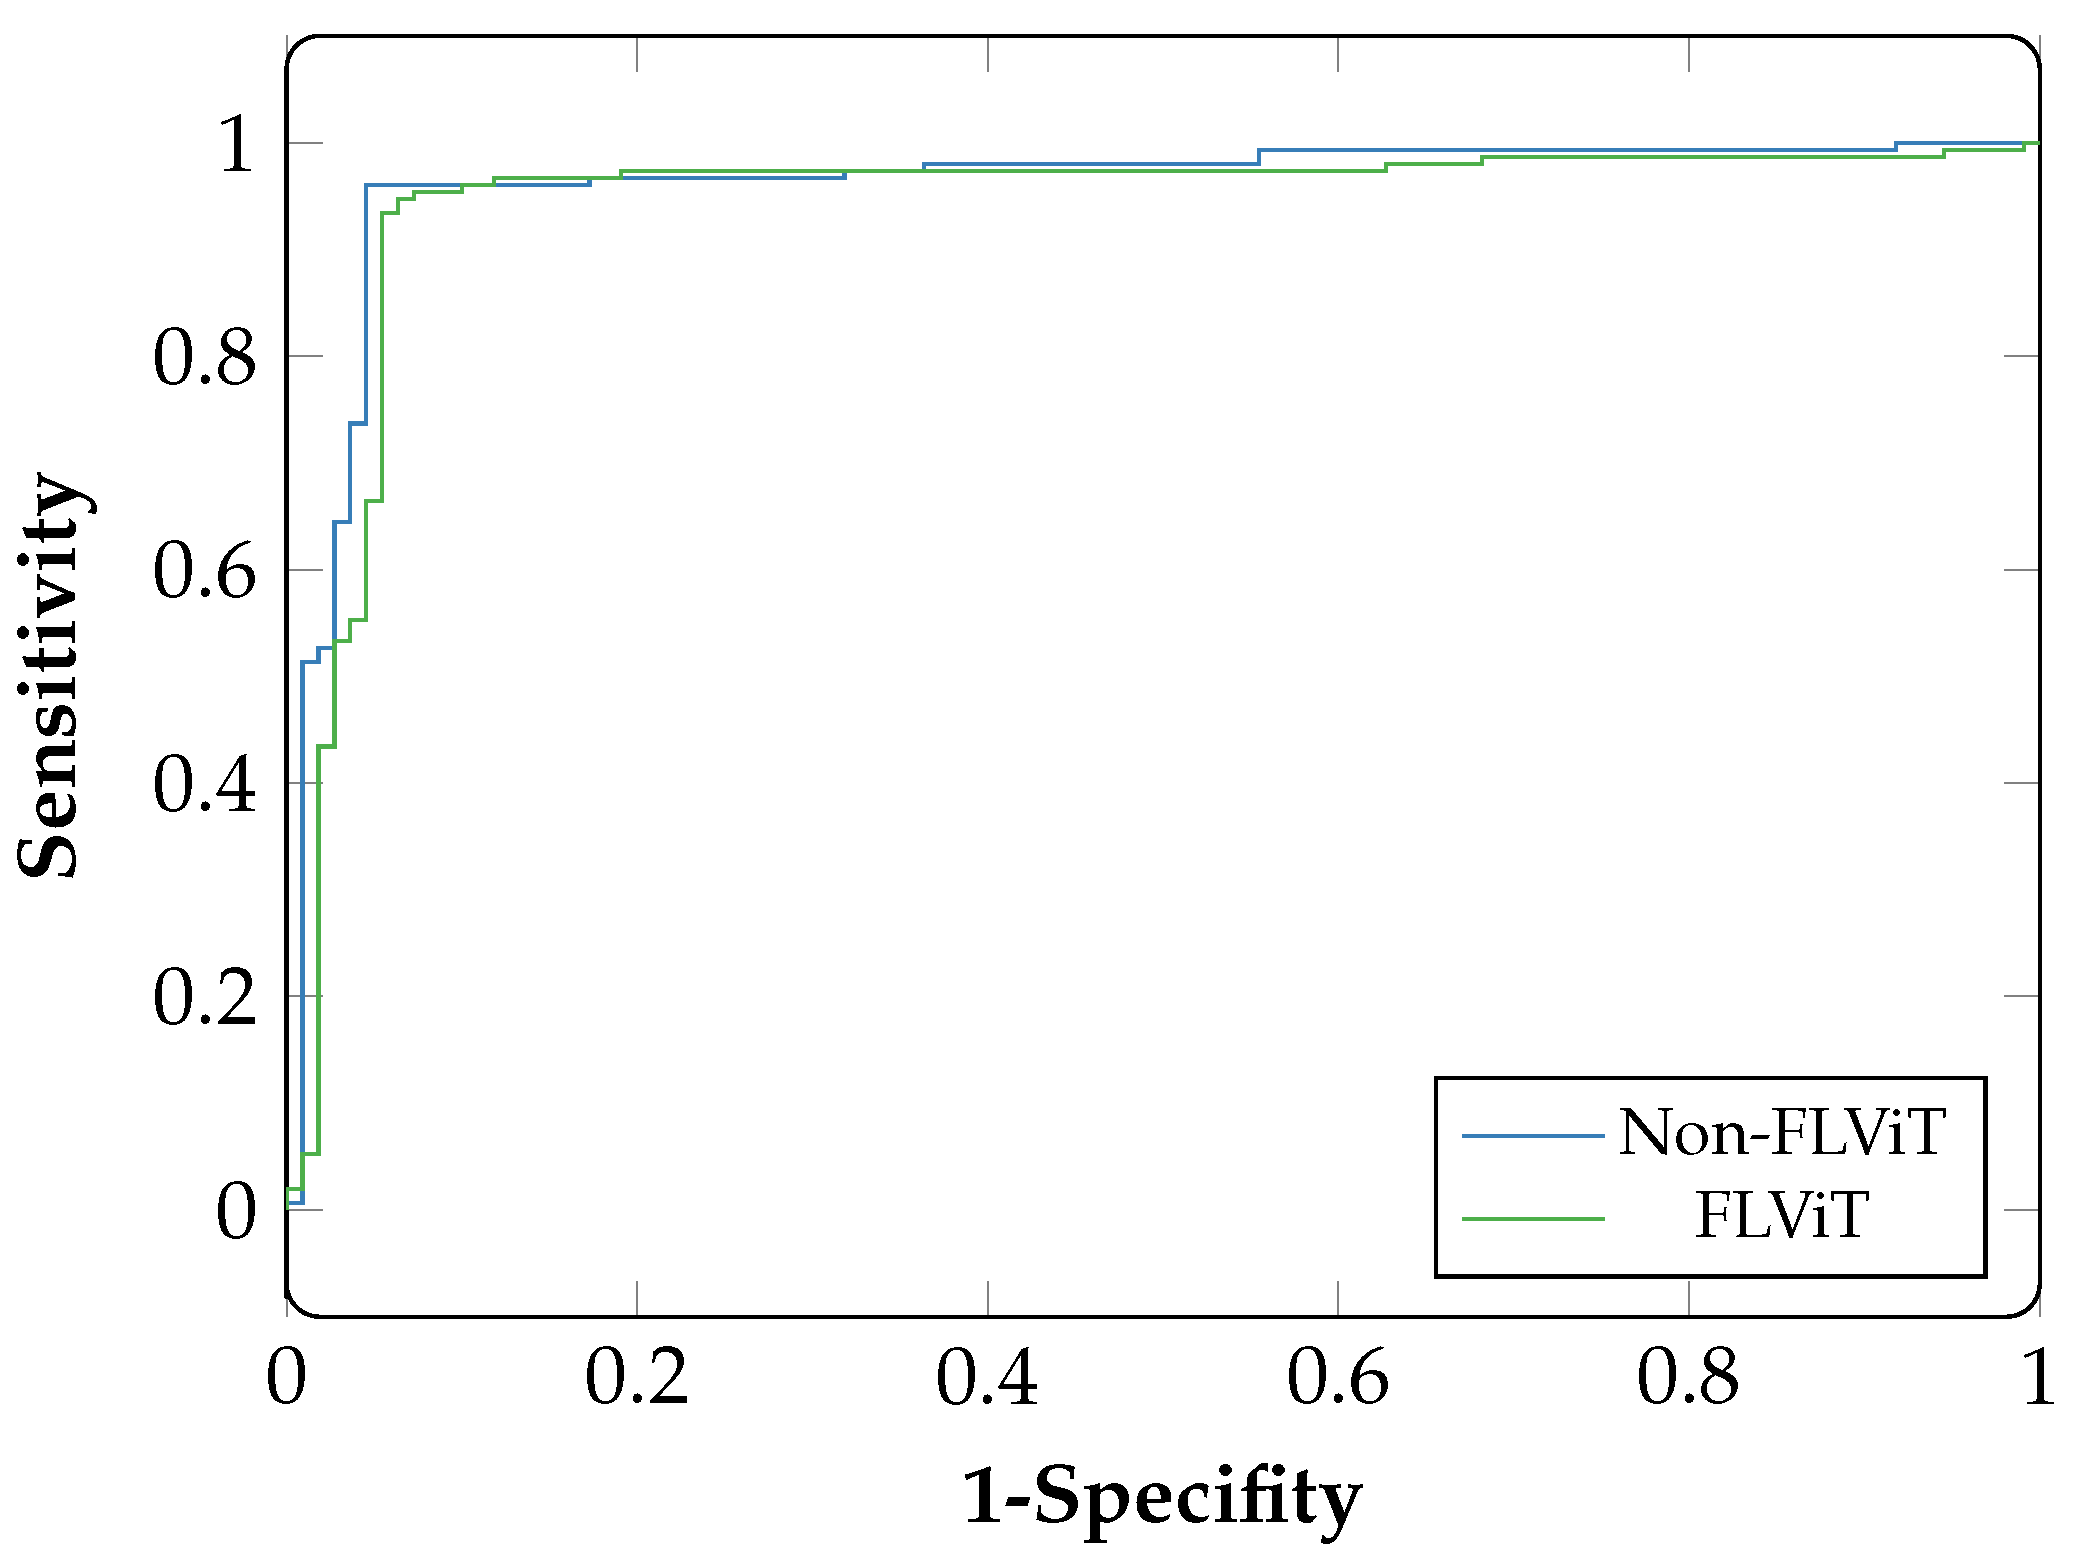
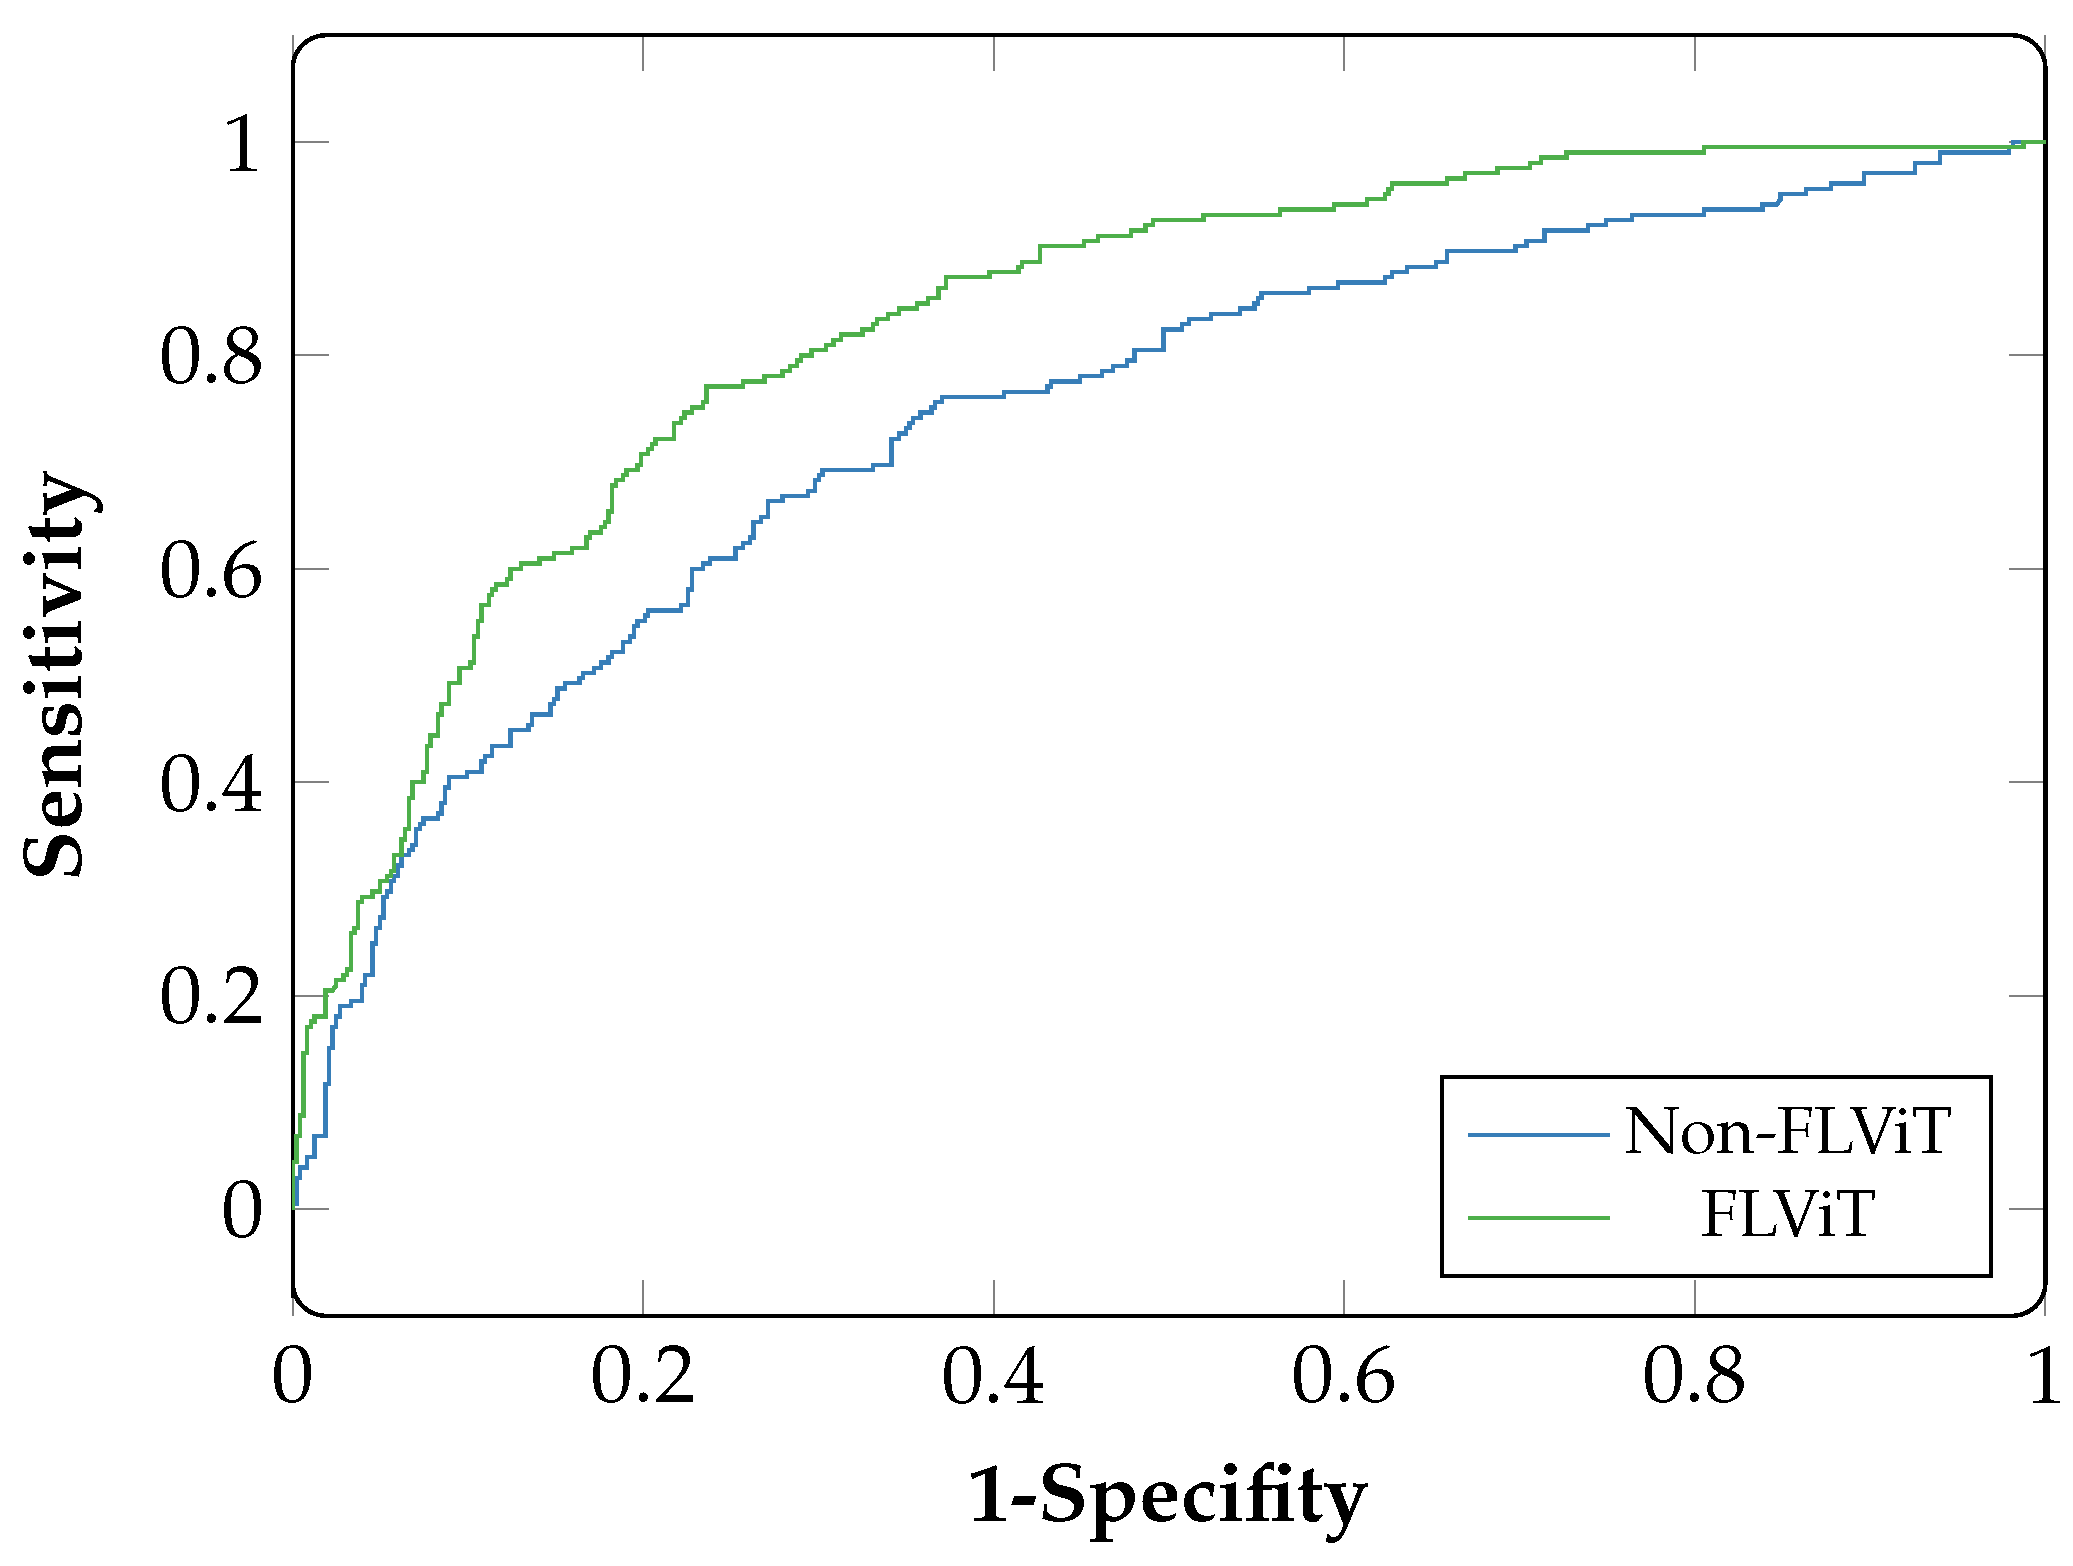
6. Results
7. Discussion
8. Conclusions
Author Contributions
Funding
Institutional Review Board Statement
Informed Consent Statement
Data Availability Statement
Conflicts of Interest
References
- Ghaderzadeh, M.; Asadi, F.; Jafari, R.; Bashash, D.; Abolghasemi, H.; Aria, M. Deep convolutional neural network–based computer-aided detection system for COVID-19 using multiple lung scans: Design and implementation study. J. Med. Internet Res. 2021, 23, e27468. [Google Scholar] [CrossRef] [PubMed]
- Ghaderzadeh, M.; Aria, M. Management of COVID-19 detection using artificial intelligence in 2020 pandemic. In Proceedings of the 5th International Conference on Medical and Health Informatics, Kyoto, Japan, 14–16 May 2021; pp. 32–38. [Google Scholar]
- Gheisari, M.; Ebrahimzadeh, F.; Rahimi, M.; Moazzamigodarzi, M.; Liu, Y.; Dutta Pramanik, P.K.; Heravi, M.A.; Mehbodniya, A.; Ghaderzadeh, M.; Feylizadeh, M.R.; et al. Deep learning: Applications, architectures, models, tools, and frameworks: A comprehensive survey. Caai Trans. Intell. Technol. 2023, 8, 581–606. [Google Scholar] [CrossRef]
- Hosseini, A.; Eshraghi, M.A.; Taami, T.; Sadeghsalehi, H.; Hoseinzadeh, Z.; Ghaderzadeh, M.; Rafiee, M. A mobile application based on efficient lightweight CNN model for classification of B-ALL cancer from non-cancerous cells: A design and implementation study. Inform. Med. Unlocked 2023, 39, 101244. [Google Scholar] [CrossRef]
- Kaul, V.; Enslin, S.; Gross, S.A. History of artificial intelligence in medicine. Gastrointest. Endosc. 2020, 92, 807–812. [Google Scholar] [CrossRef]
- Ramesh, A.; Kambhampati, C.; Monson, J.R.; Drew, P. Artificial intelligence in medicine. Ann. R. Coll. Surg. Engl. 2004, 86, 334. [Google Scholar] [CrossRef] [PubMed]
- Tang, F.; Wang, X.; Ran, A.R.; Chan, C.K.; Ho, M.; Yip, W.; Young, A.L.; Lok, J.; Szeto, S.; Chan, J.; et al. A Multitask Deep-Learning system to classify diabetic macular edema for different optical coherence tomography devices: A multicenter analysis. Diabetes Care 2021, 44, 2078–2088. [Google Scholar] [CrossRef]
- Ting, D.S.W.; Cheung, C.Y.L.; Lim, G.; Tan, G.S.W.; Quang, N.D.; Gan, A.; Hamzah, H.; Garcia-Franco, R.; San Yeo, I.Y.; Lee, S.Y.; et al. Development and validation of a deep learning system for diabetic retinopathy and related eye diseases using retinal images from multiethnic populations with diabetes. JAMA 2017, 318, 2211–2223. [Google Scholar] [CrossRef]
- Grassmann, F.; Mengelkamp, J.; Brandl, C.; Harsch, S.; Zimmermann, M.E.; Linkohr, B.; Peters, A.; Heid, I.M.; Palm, C.; Weber, B.H. A deep learning algorithm for prediction of age-related eye disease study severity scale for age-related macular degeneration from color fundus photography. Ophthalmology 2018, 125, 1410–1420. [Google Scholar] [CrossRef]
- Burlina, P.M.; Joshi, N.; Pekala, M.; Pacheco, K.D.; Freund, D.E.; Bressler, N.M. Automated grading of age-related macular degeneration from color fundus images using deep convolutional neural networks. JAMA Ophthalmol. 2017, 135, 1170–1176. [Google Scholar] [CrossRef]
- Brown, J.M.; Campbell, J.P.; Beers, A.; Chang, K.; Ostmo, S.; Chan, R.P.; Dy, J.; Erdogmus, D.; Ioannidis, S.; Kalpathy-Cramer, J.; et al. Automated diagnosis of plus disease in retinopathy of prematurity using deep convolutional neural networks. JAMA Ophthalmol. 2018, 136, 803–810. [Google Scholar] [CrossRef]
- Ting, D.S.W.; Pasquale, L.R.; Peng, L.; Campbell, J.P.; Lee, A.Y.; Raman, R.; Tan, G.S.W.; Schmetterer, L.; Keane, P.A.; Wong, T.Y. Artificial intelligence and deep learning in ophthalmology. Br. J. Ophthalmol. 2019, 103, 167–175. [Google Scholar] [CrossRef] [PubMed]
- Li, Z.; He, Y.; Keel, S.; Meng, W.; Chang, R.T.; He, M. Efficacy of a deep learning system for detecting glaucomatous optic neuropathy based on color fundus photographs. Ophthalmology 2018, 125, 1199–1206. [Google Scholar] [CrossRef] [PubMed]
- Ran, A.R.; Cheung, C.Y.; Wang, X.; Chen, H.; Luo, L.Y.; Chan, P.P.; Wong, M.O.; Chang, R.T.; Mannil, S.S.; Young, A.L.; et al. Detection of glaucomatous optic neuropathy with spectral-domain optical coherence tomography: A retrospective training and validation deep-learning analysis. Lancet Digit. Health 2019, 1, e172–e182. [Google Scholar] [CrossRef] [PubMed]
- Zhang, K.; Liu, X.; Xu, J.; Yuan, J.; Cai, W.; Chen, T.; Wang, K.; Gao, Y.; Nie, S.; Xu, X.; et al. Deep-learning models for the detection and incidence prediction of chronic kidney disease and type 2 diabetes from retinal fundus images. Nat. Biomed. Eng. 2021, 5, 533–545. [Google Scholar] [CrossRef]
- Sabanayagam, C.; Xu, D.; Ting, D.S.; Nusinovici, S.; Banu, R.; Hamzah, H.; Lim, C.; Tham, Y.C.; Cheung, C.Y.; Tai, E.S.; et al. A deep learning algorithm to detect chronic kidney disease from retinal photographs in community-based populations. Lancet Digit. Health 2020, 2, e295–e302. [Google Scholar] [CrossRef]
- Poplin, R.; Varadarajan, A.V.; Blumer, K.; Liu, Y.; McConnell, M.V.; Corrado, G.S.; Peng, L.; Webster, D.R. Prediction of cardiovascular risk factors from retinal fundus photographs via deep learning. Nat. Biomed. Eng. 2018, 2, 158–164. [Google Scholar] [CrossRef]
- Cheung, C.Y.; Ran, A.R.; Wang, S.; Chan, V.T.; Sham, K.; Hilal, S.; Venketasubramanian, N.; Cheng, C.Y.; Sabanayagam, C.; Tham, Y.C.; et al. A deep learning model for detection of Alzheimer’s disease based on retinal photographs: A retrospective, multicentre case-control study. Lancet Digit. Health 2022, 4, e806–e815. [Google Scholar] [CrossRef]
- Li, J.P.O.; Liu, H.; Ting, D.S.; Jeon, S.; Chan, R.P.; Kim, J.E.; Sim, D.A.; Thomas, P.B.; Lin, H.; Chen, Y.; et al. Digital technology, tele-medicine and artificial intelligence in ophthalmology: A global perspective. Prog. Retin. Eye Res. 2021, 82, 100900. [Google Scholar] [CrossRef]
- Campbell, J.P.; Lee, A.Y.; Abràmoff, M.; Keane, P.A.; Ting, D.S.; Lum, F.; Chiang, M.F. Reporting guidelines for artificial intelligence in medical research. Ophthalmology 2020, 127, 1596–1599. [Google Scholar] [CrossRef]
- Ting, D.S.; Wong, T.Y.; Park, K.H.; Cheung, C.Y.; Tham, C.C.; Lam, D.S. Ocular imaging standardization for artificial intelligence applications in ophthalmology: The joint position statement and recommendations from the Asia-Pacific Academy of Ophthalmology and the Asia-Pacific Ocular Imaging Society. Asia-Pac. J. Ophthalmol. 2021, 10, 348–349. [Google Scholar] [CrossRef]
- Shigueoka, L.S.; Mariottoni, E.B.; Thompson, A.C.; Jammal, A.A.; Costa, V.P.; Medeiros, F.A. Predicting age from optical coherence tomography scans with deep learning. Transl. Vis. Sci. Technol. 2021, 10, 12. [Google Scholar] [CrossRef] [PubMed]
- Korot, E.; Pontikos, N.; Liu, X.; Wagner, S.K.; Faes, L.; Huemer, J.; Balaskas, K.; Denniston, A.K.; Khawaja, A.; Keane, P.A. Predicting sex from retinal fundus photographs using automated deep learning. Sci. Rep. 2021, 11, 10286. [Google Scholar] [CrossRef] [PubMed]
- Zhu, Z.; Shi, D.; Guankai, P.; Tan, Z.; Shang, X.; Hu, W.; Liao, H.; Zhang, X.; Huang, Y.; Yu, H.; et al. Retinal age gap as a predictive biomarker for mortality risk. Br. J. Ophthalmol. 2023, 107, 547–554. [Google Scholar] [CrossRef] [PubMed]
- Yeh, F.C.; Vettel, J.M.; Singh, A.; Poczos, B.; Grafton, S.T.; Erickson, K.I.; Tseng, W.Y.I.; Verstynen, T.D. Quantifying differences and similarities in whole-brain white matter architecture using local connectome fingerprints. PLoS Comput. Biol. 2016, 12, e1005203. [Google Scholar] [CrossRef] [PubMed]
- VanRullen, R.; Reddy, L. Reconstructing faces from fMRI patterns using deep generative neural networks. Commun. Biol. 2019, 2, 193. [Google Scholar] [CrossRef]
- Chang, K.; Balachandar, N.; Lam, C.; Yi, D.; Brown, J.; Beers, A.; Rosen, B.; Rubin, D.L.; Kalpathy-Cramer, J. Distributed deep learning networks among institutions for medical imaging. J. Am. Med. Inform. Assoc. 2018, 25, 945–954. [Google Scholar] [CrossRef]
- Yang, Z.; Chen, M.; Wong, K.K.; Poor, H.V.; Cui, S. Federated learning for 6G: Applications, challenges, and opportunities. Engineering 2022, 8, 33–41. [Google Scholar] [CrossRef]
- Konečnỳ, J.; McMahan, H.B.; Yu, F.X.; Richtárik, P.; Suresh, A.T.; Bacon, D. Federated learning: Strategies for improving communication efficiency. arXiv 2016, arXiv:1610.05492. [Google Scholar]
- Rieke, N.; Hancox, J.; Li, W.; Milletari, F.; Roth, H.R.; Albarqouni, S.; Bakas, S.; Galtier, M.N.; Landman, B.A.; Maier-Hein, K.; et al. The future of digital health with federated learning. NPJ Digit. Med. 2020, 3, 119. [Google Scholar] [CrossRef]
- McMahan, B.; Moore, E.; Ramage, D.; Hampson, S.; y Arcas, B.A. Communication-efficient learning of deep networks from decentralized data. In Proceedings of the Artificial Intelligence and Statistics, Lauderdale, FL, USA, 20–22 April 2017; pp. 1273–1282. [Google Scholar]
- Yu, T.T.L.; Lo, J.; Ma, D.; Zang, P.; Owen, J.; Wang, R.K.; Lee, A.Y.; Jia, Y.; Sarunic, M.V. Collaborative diabetic retinopathy severity classification of optical coherence tomography data through federated learning. Investig. Ophthalmol. Vis. Sci. 2021, 62, 1029. [Google Scholar]
- Hanif, A.; Lu, C.; Chang, K.; Singh, P.; Coyner, A.S.; Brown, J.M.; Ostmo, S.; Chan, R.V.P.; Rubin, D.; Chiang, M.F.; et al. Federated learning for multicenter collaboration in ophthalmology: Implications for clinical diagnosis and disease epidemiology. Ophthalmol. Retin. 2022, 6, 650–656. [Google Scholar] [CrossRef] [PubMed]
- Lu, C.; Hanif, A.; Singh, P.; Chang, K.; Coyner, A.S.; Brown, J.M.; Ostmo, S.; Chan, R.V.P.; Rubin, D.; Chiang, M.F.; et al. Federated learning for multicenter collaboration in ophthalmology: Improving classification performance in retinopathy of prematurity. Ophthalmol. Retin. 2022, 6, 657–663. [Google Scholar] [CrossRef] [PubMed]
- Fleck, B.W.; Williams, C.; Juszczak, E.; Cocker, K.; Stenson, B.J.; Darlow, B.A.; Dai, S.; Gole, G.A.; Quinn, G.E.; Wallace, D.K.; et al. An international comparison of retinopathy of prematurity grading performance within the Benefits of Oxygen Saturation Targeting II trials. Eye 2018, 32, 74–80. [Google Scholar] [CrossRef] [PubMed]
- Lo, J.; Timothy, T.Y.; Ma, D.; Zang, P.; Owen, J.P.; Zhang, Q.; Wang, R.K.; Beg, M.F.; Lee, A.Y.; Jia, Y.; et al. Federated learning for microvasculature segmentation and diabetic retinopathy classification of OCT data. Ophthalmol. Sci. 2021, 1, 100069. [Google Scholar] [CrossRef]
- Nasajpour, M.; Karakaya, M.; Pouriyeh, S.; Parizi, R.M. Federated transfer learning for diabetic retinopathy detection using CNN architectures. In Proceedings of the SoutheastCon 2022, Mobile, AL, USA, 26 March–3 April 2022; pp. 655–660. [Google Scholar]
- Mohan, N.J.; Murugan, R.; Goel, T.; Roy, P. DRFL: Federated Learning in Diabetic Retinopathy Grading Using Fundus Images. IEEE Trans. Parallel Distrib. Syst. 2023, 34, 1789–1801. [Google Scholar] [CrossRef]
- Abràmoff, M.D.; Lou, Y.; Erginay, A.; Clarida, W.; Amelon, R.; Folk, J.C.; Niemeijer, M. Improved automated detection of diabetic retinopathy on a publicly available dataset through integration of deep learning. Investig. Ophthalmol. Vis. Sci. 2016, 57, 5200–5206. [Google Scholar] [CrossRef]
- Porwal, P.; Pachade, S.; Kamble, R.; Kokare, M.; Deshmukh, G.; Sahasrabuddhe, V.; Meriaudeau, F. Indian diabetic retinopathy image dataset (IDRiD): A database for diabetic retinopathy screening research. Data 2018, 3, 25. [Google Scholar] [CrossRef]
- Saxena, G.; Verma, D.K.; Paraye, A.; Rajan, A.; Rawat, A. Improved and robust deep learning agent for preliminary detection of diabetic retinopathy using public datasets. Intell.-Based Med. 2020, 3, 100022. [Google Scholar] [CrossRef]
- Khalifa, N.E.M.; Loey, M.; Taha, M.H.N.; Mohamed, H.N.E.T. Deep transfer learning models for medical diabetic retinopathy detection. Acta Inform. Med. 2019, 27, 327. [Google Scholar] [CrossRef]
- Khan, S.; Naseer, M.; Hayat, M.; Zamir, S.W.; Khan, F.S.; Shah, M. Transformers in vision: A survey. ACM Comput. Surv. (CSUR) 2022, 54, 1–41. [Google Scholar] [CrossRef]
- Dosovitskiy, A.; Beyer, L.; Kolesnikov, A.; Weissenborn, D.; Zhai, X.; Unterthiner, T.; Dehghani, M.; Minderer, M.; Heigold, G.; Gelly, S.; et al. An image is worth 16x16 words: Transformers for image recognition at scale. arXiv 2020, arXiv:2010.11929. [Google Scholar]
- Chen, H.; Wang, Y.; Guo, T.; Xu, C.; Deng, Y.; Liu, Z.; Ma, S.; Xu, C.; Xu, C.; Gao, W. Pre-trained image processing transformer. In Proceedings of the IEEE/CVF Conference on Computer Vision and Pattern Recognition, Nashville, TN, USA, 20 June–25 June 2021; pp. 12299–12310. [Google Scholar]
- Wu, J.; Hu, R.; Xiao, Z.; Chen, J.; Liu, J. Vision Transformer-based recognition of diabetic retinopathy grade. Med. Phys. 2021, 48, 7850–7863. [Google Scholar] [CrossRef] [PubMed]
- Mohan, N.J.; Murugan, R.; Goel, T.; Roy, P. ViT-DR: Vision Transformers in Diabetic Retinopathy Grading Using Fundus Images. In Proceedings of the 2022 IEEE 10th Region 10 Humanitarian Technology Conference (R10-HTC), Hyderabad, India, 16–18 September 2022; pp. 167–172. [Google Scholar]
- Gu, Z.; Li, Y.; Wang, Z.; Kan, J.; Shu, J.; Wang, Q. Classification of diabetic retinopathy severity in fundus images using the vision transformer and residual attention. Comput. Intell. Neurosci. 2023, 2023, 1305583. [Google Scholar] [CrossRef]
- Chollet, F. Keras. 2015. Available online: https://keras.io (accessed on 11 July 2023).
- NVIDIA. QUADRO P6000. 2018. Available online: https://www.nvidia.com/content/dam/en-zz/Solutions/design-visualization/productspage/quadro/quadro-desktop/quadro-pascal-p6000-data-sheet-us-nv-704590-r1.pdf (accessed on 11 July 2023).
- Melinte, D.O.; Vladareanu, L. Facial expressions recognition for human–robot interaction using deep convolutional neural networks with rectified adam optimizer. Sensors 2020, 20, 2393. [Google Scholar] [CrossRef] [PubMed]
- Warnat-Herresthal, S.; Schultze, H.; Shastry, K.L.; Manamohan, S.; Mukherjee, S.; Garg, V.; Sarveswara, R.; Händler, K.; Pickkers, P.; Aziz, N.A.; et al. Swarm learning for decentralized and confidential clinical machine learning. Nature 2021, 594, 265–270. [Google Scholar] [CrossRef] [PubMed]
- Kairouz, P.; McMahan, H.B.; Avent, B.; Bellet, A.; Bennis, M.; Bhagoji, A.N.; Bonawitz, K.; Charles, Z.; Cormode, G.; Cummings, R.; et al. Advances and open problems in federated learning. Found. Trends® Mach. Learn. 2021, 14, 1–210. [Google Scholar] [CrossRef]
- Chetoui, M.; Akhloufi, M.A. Peer-to-Peer Federated Learning for COVID-19 Detection Using Transformers. Computers 2023, 12, 106. [Google Scholar] [CrossRef]


| Name | Nbr. of Images | Resolution | Uses |
|---|---|---|---|
| EyePACS | 6000 | 1440 × 960 2240 × 1488 2304 × 1536 4288 × 2848 | DR grading Exudates, Hemorrhage and Microaneurysms detection |
| MESSIDOR | 1200 | 1440 × 960 2240 × 1488 2304 × 1536 | Exudates, Hemorrhage, Microaneurysms and abnormal blood vessel detection |
| MESSIDOR-2 | 1748 | 1440 × 960 2240 × 1488 2304 × 1536 | Exudates, Hemorrhage, Microaneurysms and abnormal blood vessel detection |
| IDRID | 516 | 4288 × 2848 | Exudates, Hemorrhage, Microaneurysms and abnormal blood vessel detection |
| APTOS | 3662 | 2124 × 2056 | Exudates, Hemorrhage, Microaneurysms and abnormal blood vessel detection |
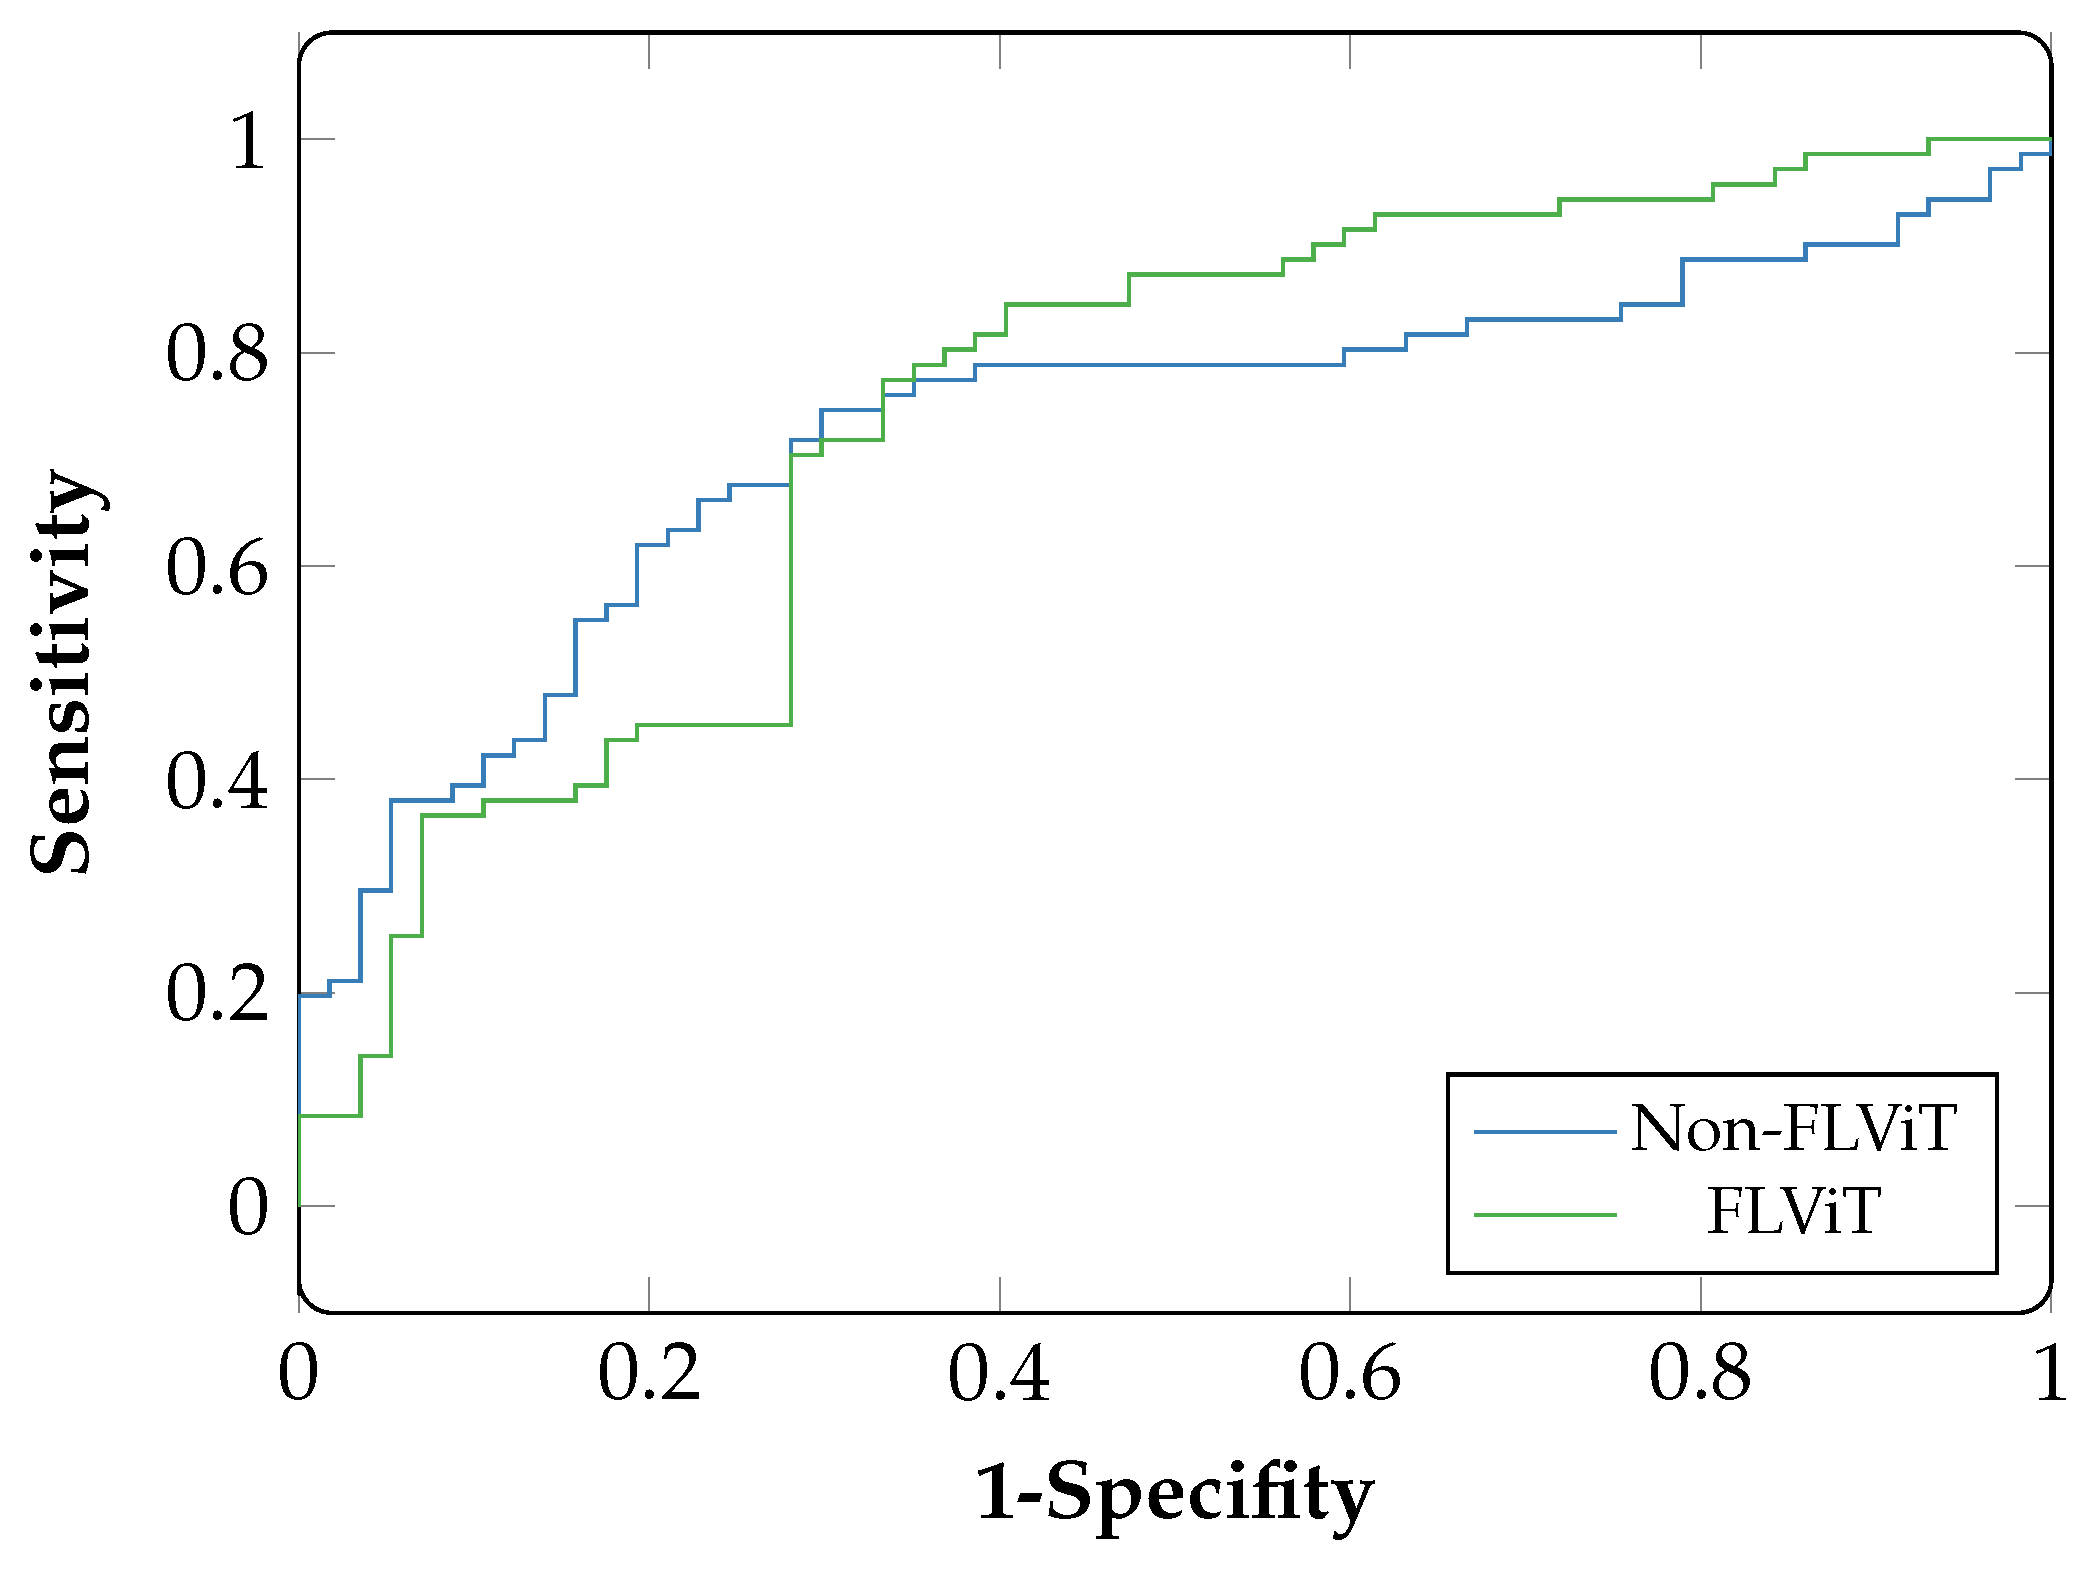
| FLViT | Non-FLViT | |||||||
|---|---|---|---|---|---|---|---|---|
| Institutions | ACC | AUC | SP | SN | ACC | AUC | SP | SN |
| APTOS | 0.95 | 0.95 | 0.95 | 0.95 | 0.94 | 0.94 | 0.95 | 0.94 |
| MESSIDOR | 0.79 | 0.83 | 0.89 | 0.55 | 0.76 | 0.74 | 0.94 | 0.35 |
| IDRID | 0.71 | 0.74 | 0.54 | 0.85 | 0.69 | 0.73 | 0.58 | 0.77 |
| Eyepacs | 0.71 | 0.77 | 0.83 | 0.56 | 0.68 | 0.76 | 0.63 | 0.72 |
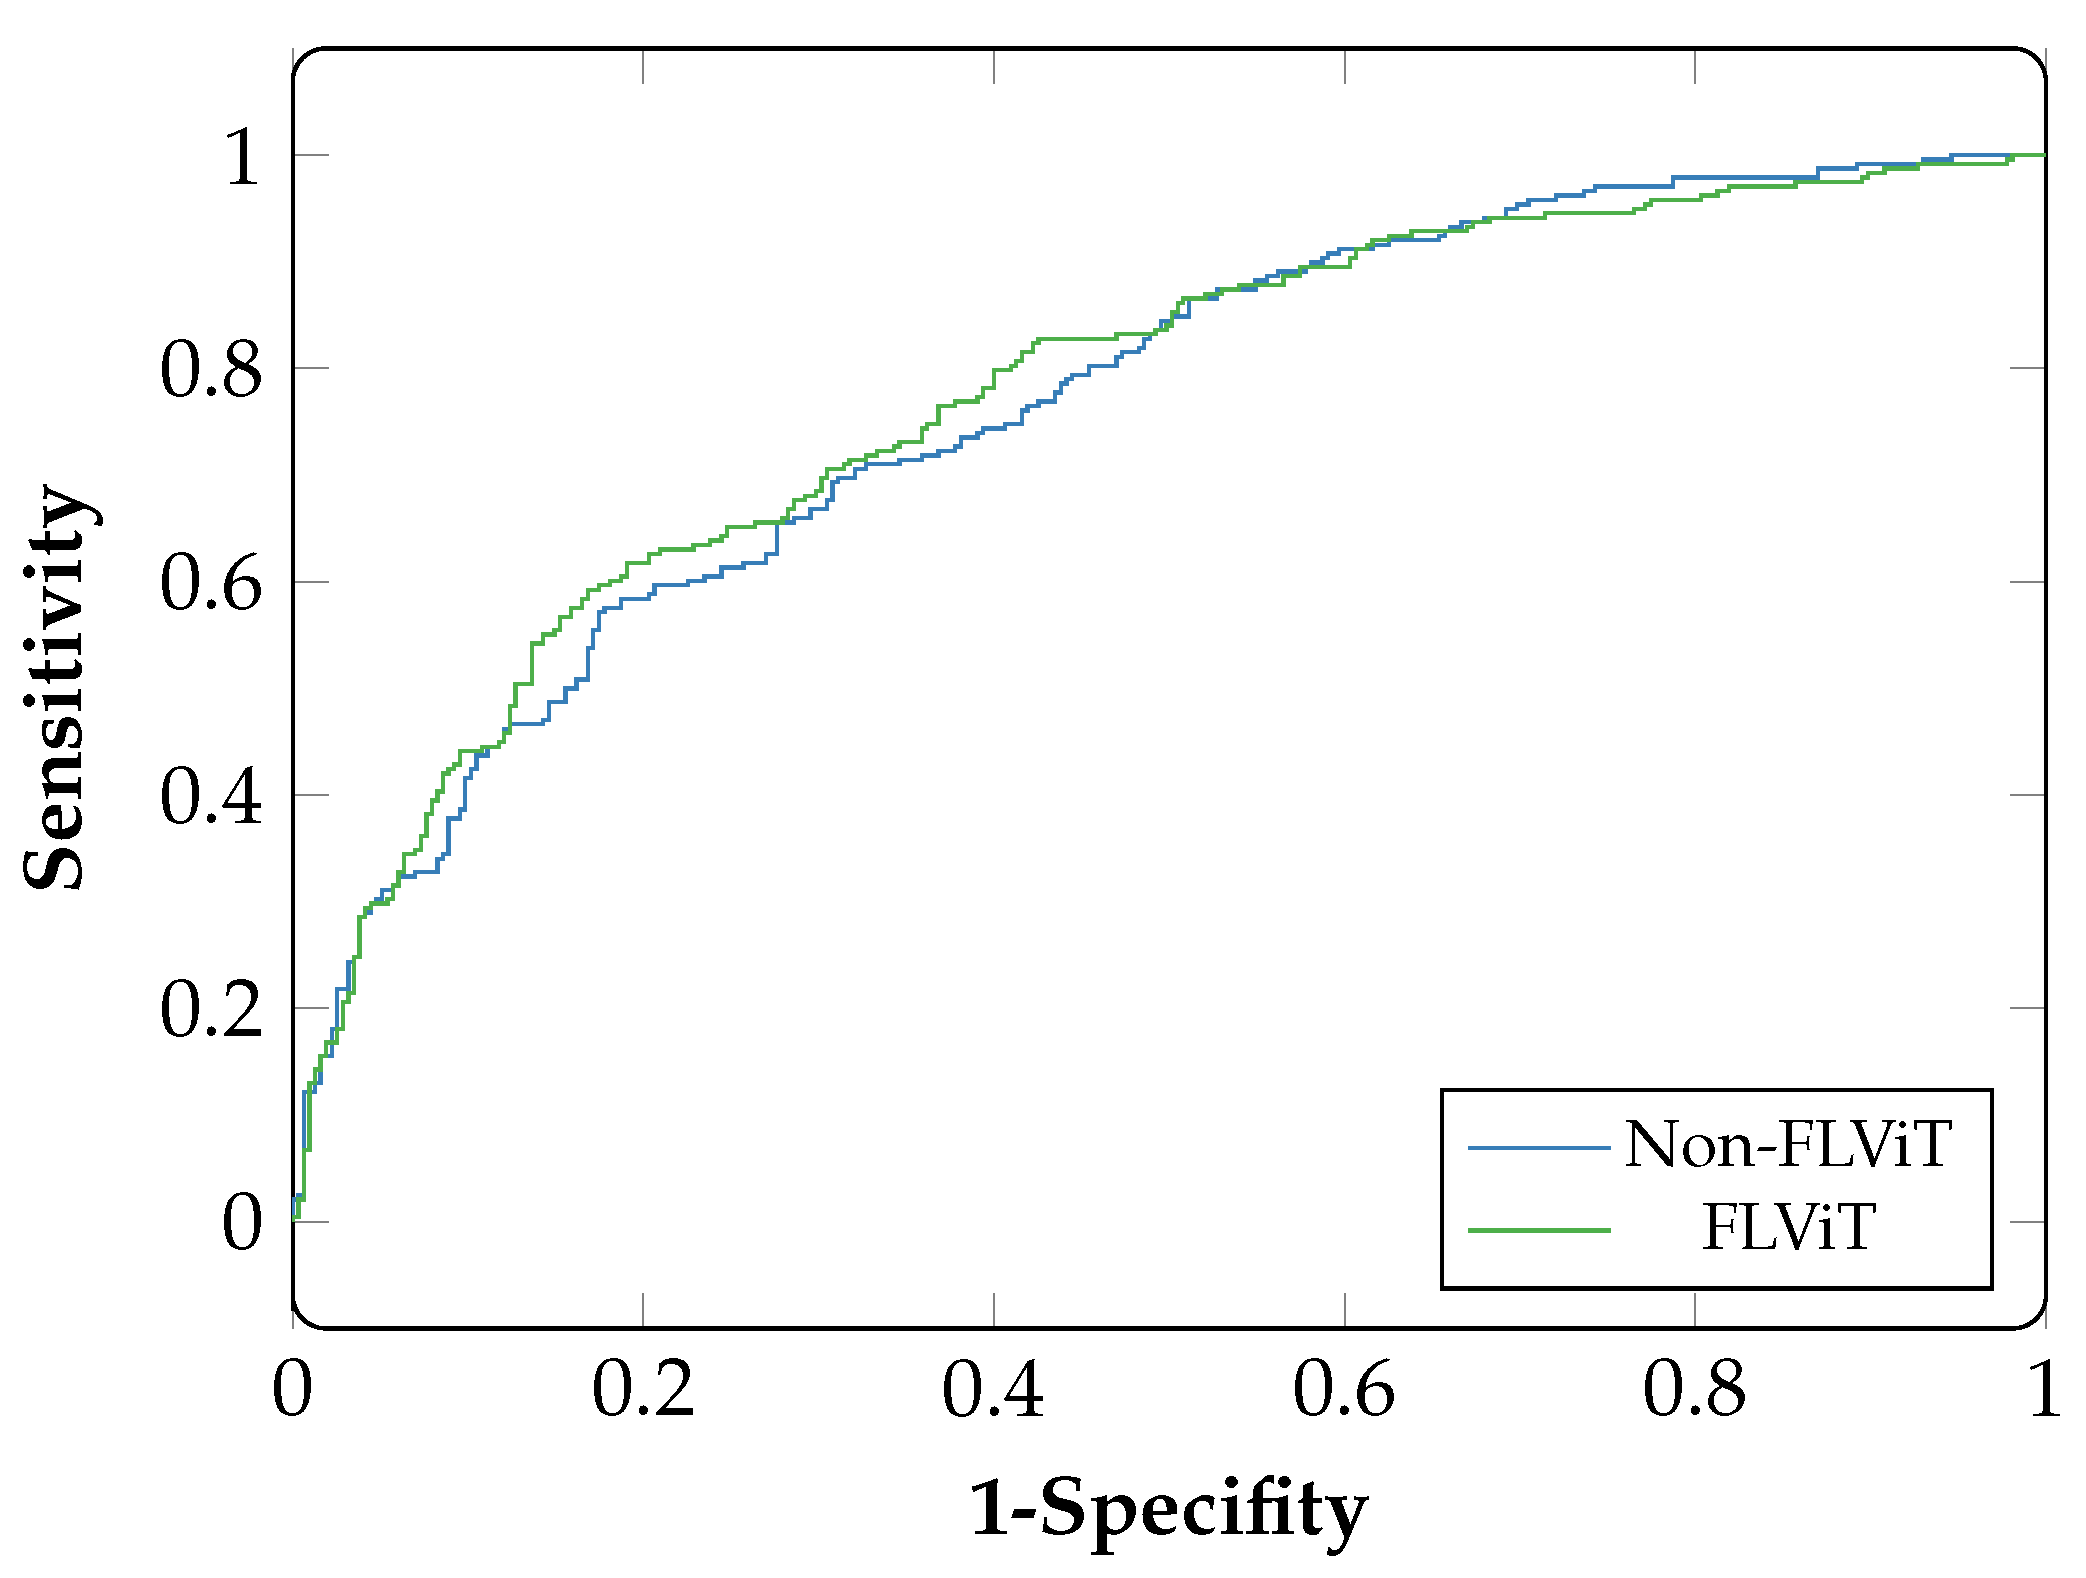
| FL-CNN | Non-FLCNN | |||||||
|---|---|---|---|---|---|---|---|---|
| Institutions | ACC | AUC | SP | SN | ACC | AUC | SP | SN |
| APTOS | 0.94 | 0.93 | 0.93 | 0.93 | 0.91 | 0.91 | 0.92 | 0.94 |
| MESSIDOR | 0.80 | 0.83 | 0.90 | 0.53 | 0.74 | 0.73 | 0.93 | 0.37 |
| IDRID | 0.71 | 0.73 | 0.60 | 0.80 | 0.68 | 0.72 | 0.56 | 0.80 |
| Eyepacs | 0.67 | 0.72 | 0.87 | 0.51 | 0.65 | 0.76 | 0.66 | 0.68 |
Disclaimer/Publisher’s Note: The statements, opinions and data contained in all publications are solely those of the individual author(s) and contributor(s) and not of MDPI and/or the editor(s). MDPI and/or the editor(s) disclaim responsibility for any injury to people or property resulting from any ideas, methods, instructions or products referred to in the content. |
© 2023 by the authors. Licensee MDPI, Basel, Switzerland. This article is an open access article distributed under the terms and conditions of the Creative Commons Attribution (CC BY) license (https://creativecommons.org/licenses/by/4.0/).
Share and Cite
Chetoui, M.; Akhloufi, M.A. Federated Learning for Diabetic Retinopathy Detection Using Vision Transformers. BioMedInformatics 2023, 3, 948-961. https://doi.org/10.3390/biomedinformatics3040058
Chetoui M, Akhloufi MA. Federated Learning for Diabetic Retinopathy Detection Using Vision Transformers. BioMedInformatics. 2023; 3(4):948-961. https://doi.org/10.3390/biomedinformatics3040058
Chicago/Turabian StyleChetoui, Mohamed, and Moulay A. Akhloufi. 2023. "Federated Learning for Diabetic Retinopathy Detection Using Vision Transformers" BioMedInformatics 3, no. 4: 948-961. https://doi.org/10.3390/biomedinformatics3040058