Article

A Planning Support System for Monitoring Aging Neighborhoods in Germany

I3mainz, Mainz University of Applied Sciences, Lucy-Hillebrand-Straße 2, 55128 Mainz, Germany
*
Author to whom correspondence should be addressed.
Geomatics 2024, 4(1), 66-80; https://doi.org/10.3390/geomatics4010004
Submission received: 15 January 2024 / Revised: 3 February 2024 / Accepted: 6 February 2024 / Published: 9 February 2024
(This article belongs to the Special Issue GIS Open Source Software Applied to Geosciences)

Abstract

:
Many single-family homes built in Germany in the first decades following the Second World War are now occupied by elderly residents. If local conditions are unfavorable, a large number of these buildings may enter the real estate market in a short period of time and put pressure on the local housing market. Planners and decision-makers therefore need detailed spatiotemporal information about these neighborhoods to effectively address and counteract such developments. We present the design and implementation of a planning support system that can generate the required information. The architecture of this newly developed software consists of a composite, multitier framework to perform the complex tasks of data importation, data processing, and visualization. Legally mandated municipal population registers provide the key data for the calculation of indicators as a base for spatiotemporal analyses and visualizations. These registers offer high data quality in terms of completeness, logical consistency, spatial, and temporal and thematic accuracy. We demonstrate the implemented method using population data from a local government in a rural area in southwestern Germany. The results show that the new tool, which relies on open software components, is capable to identify and prioritize areas with particularly high levels of problem pressure. The tool can be used not only for analyses in a local context, but also at a regional level.

1. Introduction

Zoning for single-family housing is increasingly criticized by scientists, planners, and politicians in North America, Europe, and beyond. In the United States, this criticism culminated in statements such as “It’s time to end single-family zoning” [1] or “Death to single-family zoning…and new life to the missing middle” [2]. Such calls were in turn challenged and partly met with objections [3,4,5]. However, the demerits of this type of housing are numerous, and the arguments against it are strong.
Single-family zoning contradicts political goals that aim to increase urban density [6,7,8] and reduce the carbon footprint [9,10,11]. Critics also point to the low energy efficiency of many single-family detached houses [12,13] and the extra costs for roads, sewage, and water infrastructure caused by dispersed settlements [14,15]. Esthetic considerations oppose sub-urban single-family houses as mass or anonymous architecture [16], which fit poorly into the historically evolved urban fabric. Further criticism refers to the notion that zoning that only allows the presence of detached single-family houses engenders wealth inequalities and aggravates economic and racial segregation [17,18,19].
In countries like Germany, attention is increasingly drawn to an additional dimension of segregation that correlates with the aforementioned types but suggests a specific perspective—and that is segregation by age [20,21,22]. Single-family zoning has dominated the development of various municipalities in Germany since the 1950s. Many single-family housing estates from the decades after the Second World War are now characterized by the advanced age of their residents [23]. In these areas, the current residents once built their family home, in which they have lived in ever since and where they want to spend their remaining years [24,25]. The children of the builders, on the other hand, usually move out of the family home when they grow up to set up their own household elsewhere. This life cycle pattern of parents staying and children moving away leads to a relatively homogeneous population structure in aging single-family estates, which is frequently dominated by empty-nesters [26,27]. Due to their demographic homogeneity and uniform architecture, a relatively large number of analogous buildings might enter the market in a short space of time during an acute period of upheaval, overwhelming local housing markets and leading to vacancies. Reoccupying might be challenging since many buildings no longer meet current housing needs and often have a backlog of renovations.
Previous research shows that single-family housing (SFH) areas in Germany vary in how well they are prepared to meet the challenges of the demographic transition [28]. At the macro level, differences between sought-after and less-sought-after housing market regions come into play [24,29]. For example, there is a shortage of housing in many major cities, where the sale of detached houses has so far gone smoothly. In contrast, rural–peripheral regions are often characterized by a propensity for out-migration, which leads to a correspondingly lower demand for housing [30].
At the meso and micro levels, the situation of aging neighborhoods and their future prospects may differ in the same market and even in the same municipality [31,32]. In neighborhoods originating from the 1950s and much of the 1960s, the demographic shift may already be complete with younger families moving in. In areas constructed in the 1970s and 1980s, on the other hand, the transition of resident generations may be well underway or just commencing [33]. Additionally, the availability and accessibility of amenities and services exhibit variability. This can pose a challenge for older individuals with limited mobility, restricting access to shopping and other services, thereby diminishing their ability to age in place in a self-determined manner [34].
In view of spatial and temporal variability, planners and decision-makers require detailed information about changing neighborhoods in order to make tailored decisions. In this article, we present the conception and implementation of a monitoring tool capable of generating the required information. The tool is intended to serve as a planning support system (PSS), providing urban planners in concerned municipalities with detailed and previously unknown information about their neighborhoods. Firstly, we will discuss the current state of the debate on SFH areas in Germany, covering indicators and data challenges. The subsequent concept and demonstration of the PSS illustrate its architecture and user workflow, showcasing how demographic indicators can be processed and visualized. This approach aims to generate spatially accurate informati, effectively addressing existing knowledge gaps.

2. Materials and Methods

The consequences of demographic shifts and the change in resident generations in aging SFH areas have been discussed in Germany for some years now [35,36,37]. Nevertheless, research on transitioning SFH areas from the second half of the 20th century is still considered to be in its early stages [38]. Apart from case studies, there is hardly any systematic research that analyze these areas on a long-term and large-scale basis [39]. A comparable situation has been identified in the Netherlands and Belgium [40]. This is particularly true when it comes to research that takes a comprehensive and holistic approach to neighborhoods and that explicitly addresses demographic transition. Individual studies with a focus on the energy supply of aging single-family homes, on the other hand, have recently become more frequent, e.g., [41,42]. The limited research activity aligns with the observations of the authors of [43,44], who argue that the relationship between urban sprawl and demographic change has not been sufficiently studied in the European context. In the same vein, ref. [45] expresses, from a global perspective, that despite settlements expanding worldwide and the omnipresence of suburbs, which in many countries often consist of detached one-family houses, there has been insufficient research on this topic.
In rural regions of Germany, the proportion of single-family homes in the building stock is comparatively high and the age of the residents is particularly old. In addition, rural communities often do not have sufficient financial and human resources to respond properly to these challenges [46]. In order to make the PSS applicable in rural local authorities, we strongly automate the data processing [47]. We endeavor to conceal technical details from its users as far as possible and to provide them with visualizations of relevant indicators. In addition, the tool offers users functional flexibility by allowing them to set parameters for customization. To minimize time-consuming and case-specific data collection by local partners, we utilize data that are collected as part of routine procedures, even in the absence of a specific mandate for neighborhood research. The monitoring tool we propose is based on open software, as depicted in Figure 1, to reduce costs and ensure flexibility for future developments.

2.1. Demographic Indicators and Walkability Assessment

Although the number of studies is limited, efforts have been made over the last two decades in Germany and beyond to capture the current situation and the changes going on in transforming single-family housing estates using indicators. Some of these studies describe demographic and other characteristics of SFH areas from the 1950s, 1960s, and 1970s in a certain municipality [48,49,50]. Other studies go further by comparing single-family neighborhoods in one municipality with those in other regions [31,35,51,52], or by drawing up typologies for SFH areas in transition [53,54].
The indicators used in these studies were developed individually and partly without thorough knowledge of previous research. Nevertheless, they show similarities in core aspects, especially in the demographic realm, but vary in their level of detail and in the thematic range they cover. Usually, the current age structure is described on the basis of the average age, and changes in demographics in recent years are analyzed. Occasionally, additional composite indicators, such as the age dependency ratio, are calculated. Furthermore, researchers broke migration patterns down into in- and out-migration rates, net migration, length of stay, and fluctuation. The latter two indicators are particularly important, because detached houses in Germany are usually inhabited for a long time by the generation that built them. Against this background, heightened fluctuation may indicate the transition of initial occupants to care facilities or signify their passing, highlighting a period of significant change. Knowing the age of those relocating allows us to differentiate between generations, since increased fluctuation may also indicate children leaving their parents’ home.
Despite these studies, SFH research is fragmented and there are many options for further progress [38]. For example, studies treat residential areas as a homogeneous entity and employ a corresponding scale for observation and analysis. In these cases, indicators, such as in- and out-migration numbers, are calculated for the entire area. However, it makes sense to go a step further and additionally examine individual addresses. This is the only way to identify building-related indicators, such as the proportion of buildings in the neighborhood with only one or two occupants of advanced age (in the subsequent course, this will be referred to as a ‘remanence building indicator’). In such houses, a vacancy could be imminent. Subsequently, one can aggregate the detailed, address-specific information for visualization purposes, providing insights not only for single buildings, but for the entire neighborhood, building blocks, or any other spatial aggregation unit.
GIS and the utilization of geocoded (population) data are apt for tasks at both the level of residential areas and individual addresses within those areas. Working with spatial reference and geocoding allows municipal data sets on demographics to be spatially linked with further geospatial data sets, e.g., buildings, addresses, or neighborhood delineations [42,49,50]. Additionally, working with geospatial data is a requirement, for instance, in network-based accessibility analyses, where starting points, destination addresses, and streets must be interconnected. Such analyses can contribute essential information about the location advantages and disadvantages of certain residential areas. Even though network-based approaches for accessibility are standard in geospatial informatics today [55], only little research in SFH areas employs this relatively precise method [22]. Other researchers estimate these through on-site inspections [56] or by calculating the simple Euclidean distance (“as-the-crow-flies distance”) to the city center [29]. Outside of SFH research, life-stage-sensitive indices have moreover been developed, for instance for walkability [57]. A modern PSS should reflect and integrate such attempts, particularly those with highlighted relevance to urban planning, as exemplified by the widely used Walk Score approach [58]. This score assesses the walkability of neighborhoods by estimating the proximity of them to amenities such as pharmacies, grocery stores, or parks. It connects these categories through a predefined weighting system and has been adjusted to the needs of the elderly [59], hereinafter referred to as Elderly-WS.

2.2. From Case Studies to Monitoring

The forenamed studies were designed as case studies. The work of [21,56] goes one step further, as the authors aim to model aging SFH areas in a way that enables regularly repeatable analyses and represents a decisive step toward systematic monitoring.
The model proposed by [21] is an early approach that tries to comprehensively describe the current state and transformation in aging single-family home estates. It offers 15 indicators from 4 thematic areas (structural, economic, spatial, and social). These indicators vary in precision, with some being individual indicators (such as land value and building age) and others being composite indicators (e.g., residential location and infrastructure). Ref. [56] criticizes the inconsistent allocation of indicators to the four thematic areas and raises challenges regarding comparability. Due to the high analytical workload, the author recommends focusing on a few indicators that point directly to a transformation situation. His focus is on two demographic indicators defined as “Increasing fluctuation of households, decreasing length of residence” and “Above-average and growing proportion of older people”. These two composite indicators are complemented by a location-based indicator providing information on SFH areas with a poor supply situation with everyday supportive social infrastructures, goods for daily needs, and low real estate prices [56] (see Table 1).
Ref. [56] already develops these indicators with regard to the utilisation of existing data sources. However, the author processes these data in a fragmented way using tools like Excel and not taking advantage of geocoding. The evolutionary step toward a spatially integrated PSS is not included in his considerations.

2.3. Data for Research on Transforming Neighborhoods

Ref. [56] and most other studies on the generational shift in aging single-family home neighborhoods rely on the municipal population register (German: Einwohnermelderegister) as a key data set [48,49,56]. In Germany, every municipality collects comprehensive demographic data about its residents through this register. It includes details such as gender, birthdate, move-in and move-out dates, and address information. The demographic indicators essential for monitoring SFH areas can be derived exclusively from it. As the population register encompasses not only present data but also documents alterations in demographic composition and migration, it even enables the visualization of evolving trends over time [46]. Data collection follows a legal mandate, requiring registration authorities to establish and verify the identity and residences of citizens. As a result, every German municipality collects and maintains these data. However, they have limited use in the urban planning of smaller towns and rural communities [60]. Instead, local authorities in rural Germany often rely on data from statistical state or federal authorities, which are easily accessible but not suitable for monitoring SFH areas due to their insufficient spatial or temporal resolution. For example, the widely used German Census data are collected only every 10 years, posing a limitation in capturing the dynamics that come with demographic changes. The low utilization of the population register is primarily due to the major challenges that need to be overcome in order to fully exploit its unique information potential. Primarily designed for registration purposes, the software packages that local authorities apply for managing the population register pose a challenge to extracting meaningful information for urban planning. For instance, they frequently lack support for spatial analyses or cartographic visualization. Additionally, the utilization of this register is subject to stringent legal regulations concerning privacy issues [46].
Ref. [56] additionally recommends the use of real estate price data for monitoring SFH areas. During the sale of properties, the contracting parties are obligated to provide information such as the purchase price and building type in addition to the address of the sold building. In this way, the legislator aims to track real estate market dynamics and contribute to more transparency. The data for all transactions in a region, for example, a rural district, are collected in Germany by the Appraisal Committees for Property Valuation, which are organized outside the realm of the municipalities. These data are collected throughout Germany, where the raw data on property sales are relevant under data protection law and cannot be transmitted to the municipalities without further security measures. The demand for the appraisal committees to open up this data set for other purposes and establish a nationwide, uniform secondary database for these specific uses has only recently been raised in Germany [61]. Such strict regulation, however, does not apply to the standard land value zones derived from the raw real estate price data. Here, land values for certain value-homogeneous zones are widely accessible today through so-called land value information systems available on the internet.
To identify the supply situation of a neighborhood, there is not a single data set; rather, accessibility analyses require a combination of several data sets recorded and managed in different institutions and with different objectives. In addition to addressing coordinates, which are offered for use as authoritative data by the state surveying offices, accessibility analyses require data on road and path networks and the locations of supply facilities. For example, the open data project OpenStreetMap (OSM) records these kinds of data and makes them available online [62]. To implement the Elderly-WS, additional data on barriers are required. While one can derive steps from OSM, inclinations on the network have to be calculated on basis of the Digital Elevation Model (DEM) that is offered by the Surveying Agency of Germanys federal states.

3. Results

3.1. Implemented Indicators

Due to the numerous advantages, we use the municipal population register as the central data reference in our monitoring PSS. Both information on individuals currently living in the respective municipalities (master data) and population change data (transactional data) are derived from this data pool. In order to circumvent data protection regulations that apply to the transfer of population register data, our software is installed in the participating municipalities. This ensures that sensitive data records stay within the municipality, eliminating the need for external data transfer. We have implemented, so far, a diverse set of demographic indicators to visualize population dynamics (see Table 2). In addition, Elderly-WS is the first indicator to add a further level of consideration to monitoring with the focus on accessibility. Furthermore, we integrate spatial data on the standard land value zones. Depending on the aggregation geometries provided, different scales can be used for these indicators. The proof of concept is based on population data from the local government association (German: Verbandsgemeinde) of Otterbach-Otterberg, the DEM from the Rhineland-Palatinate Surveying Office, standard land value zones from the Appraisal Committee for Westpfalz, and data from OSM.
To calculate and evaluate these indicators, a monitoring application with a suitable set of functionalities was implemented.

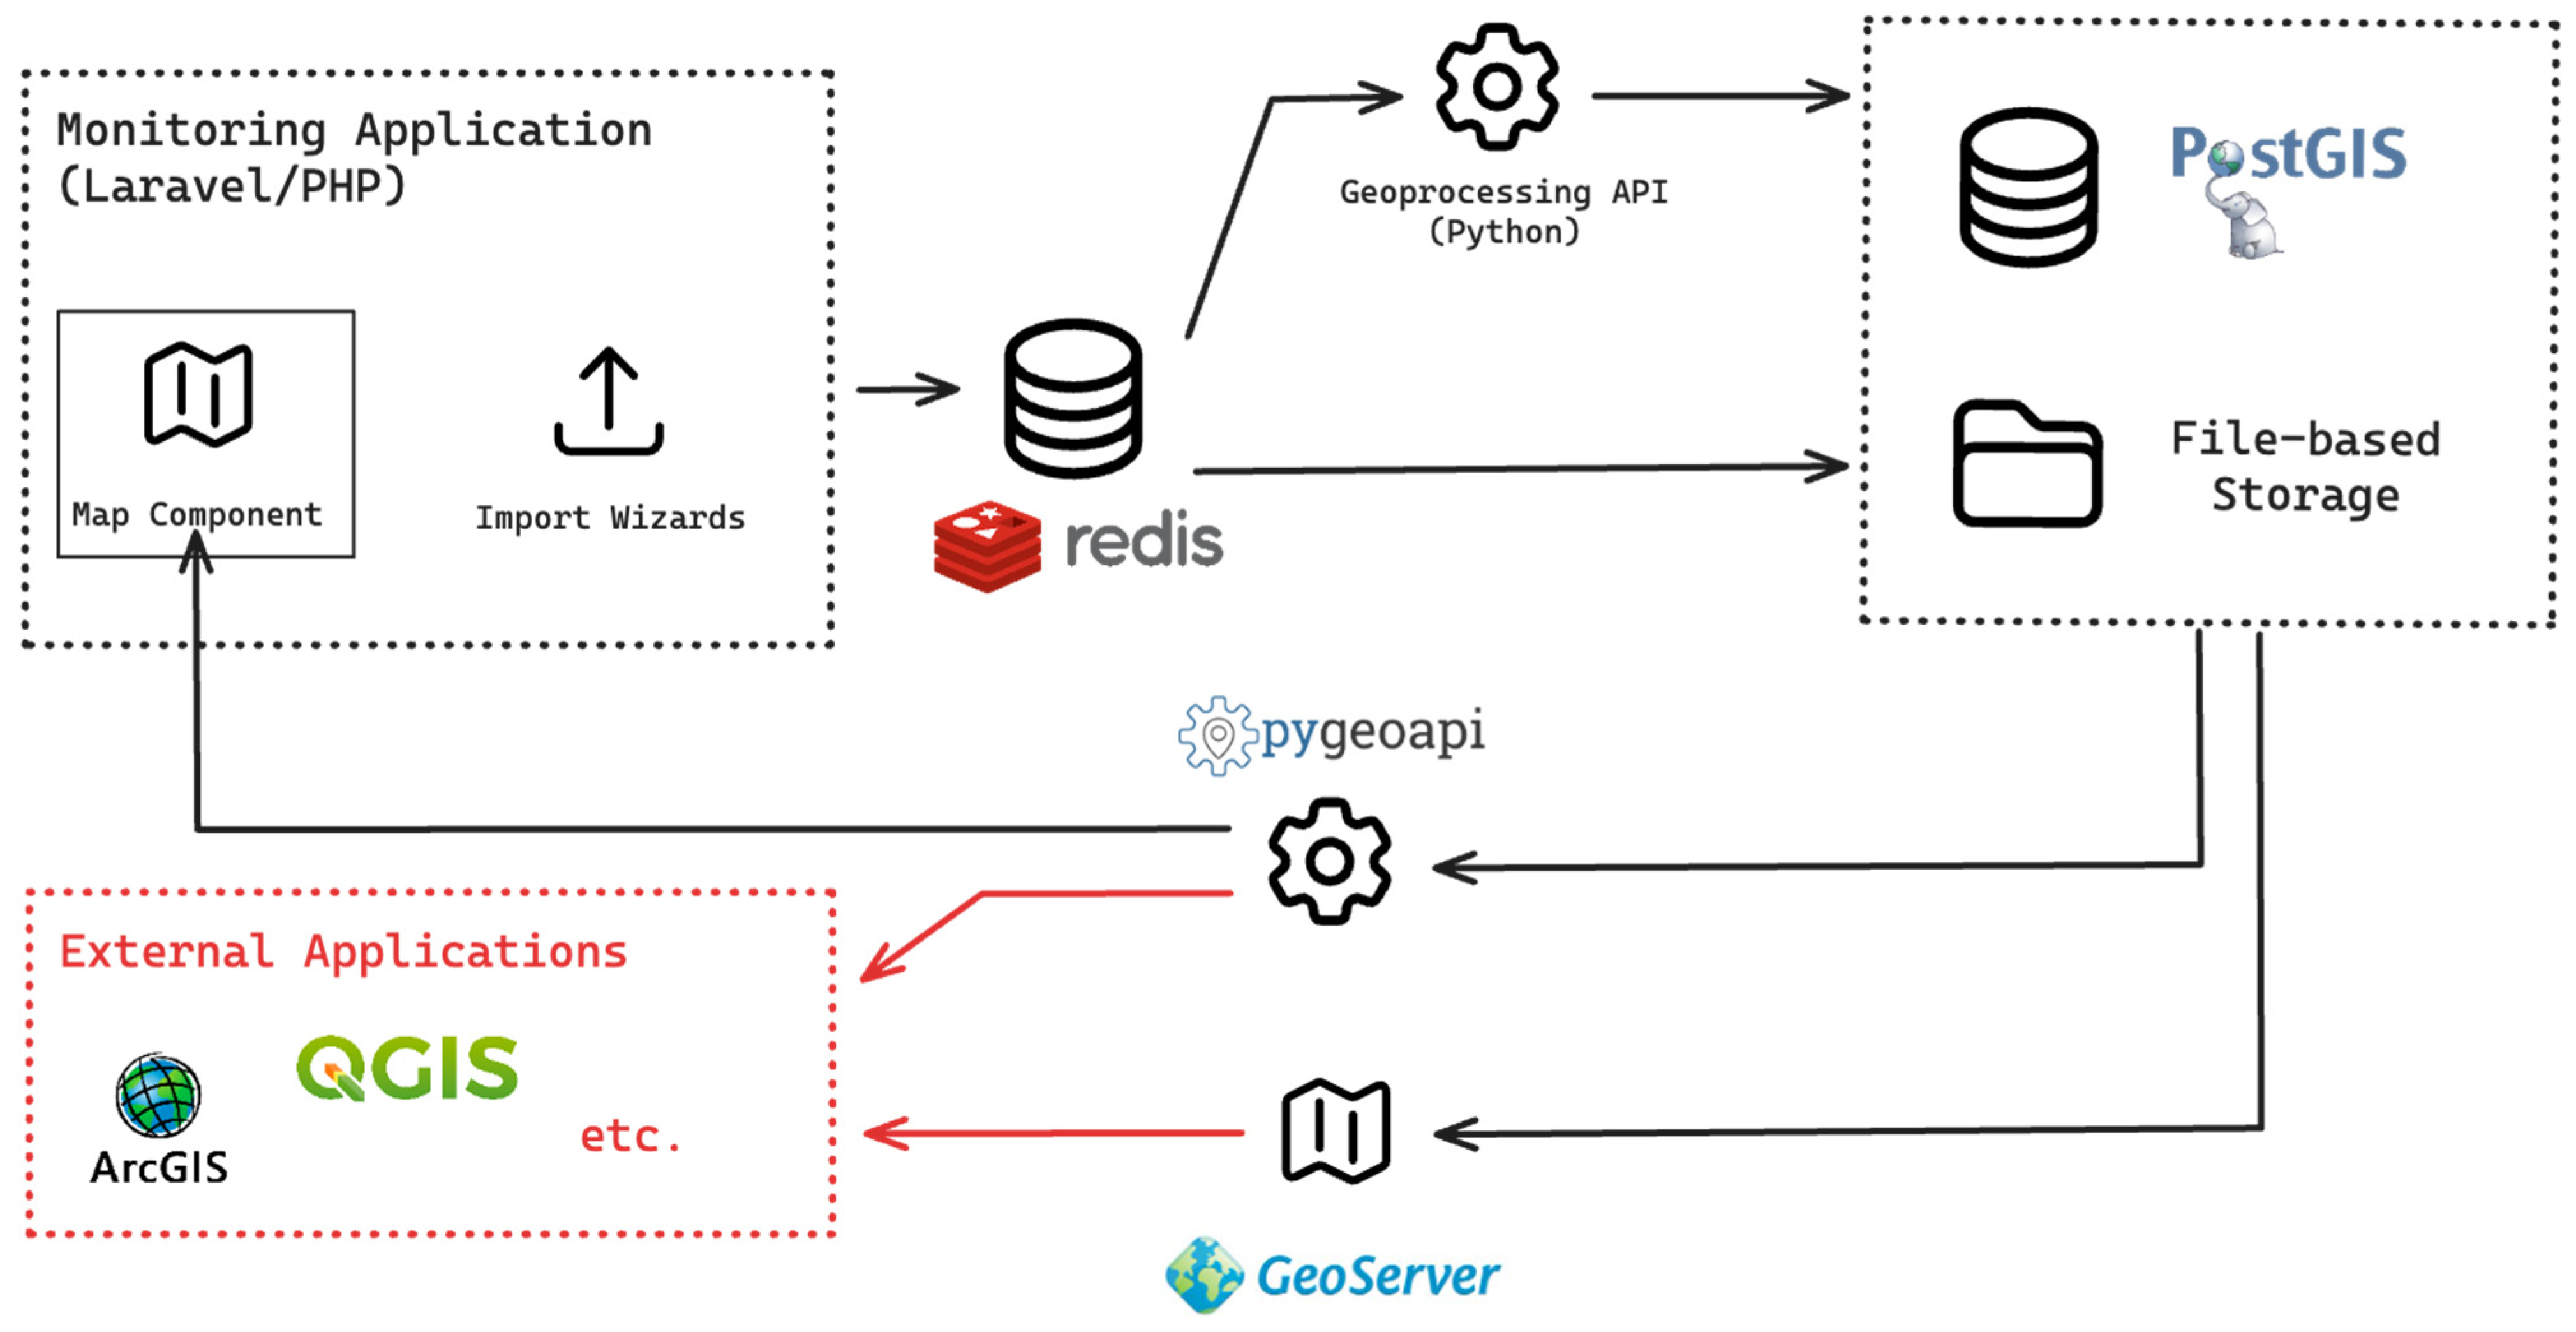
3.2. System Architecture

The monitoring application’s architecture is a composite, multitiered framework designed to accommodate the complexities of data importation, processing, and visualization, as shown in Figure 1. This framework is anchored by the robust PHP framework Laravel, which orchestrates user-centric operations and underpins overall application management.
Within this architecture, Laravel serves as the fundamental backbone and coordinates the interplay between the user interface, database, and processing components. This allows for the importation of raw data, the triggering of various indicator calculations, and their subsequent evaluation. Security is essential given the sensitive nature of the population and geospatial data handled. To this end, the application enforces industry-standard password protection and two-factor authentication (2FA), strictly adhering to current security protocols and guidelines.
The system’s import wizard manages diverse data types, accommodating population data in CSV or Excel and geospatial data in GeoJSON format. This wizard abstracts the technicalities of the integration process for the users, directing them through the necessary steps for successful data importation. Post-import, an asynchronous task scheduler—powered by Redis—takes over, ensuring efficient and orderly data processing into predefined indicators. For specialized tasks, such as those demanding the manipulation of big data sets or complex spatial calculations, the system leverages an internal Python API. Utilizing Python’s extensive suite of geospatial tools, this API excels in managing and processing large data volumes, making it particularly suited for calculating walkability scores.
The PostGIS database sits at the core of the system’s data management, chosen for its extensive geospatial capabilities. It facilitates data storage and enables complex spatial queries, which are instrumental during the processing phase of various indicators. These indicators are visualized through a map component based on React and utilizing Deck.GL and MapLibre for rendering. This component is integrated within the Laravel application via Inertia.js, ensuring dynamic data interaction while maintaining the overarching security framework.
Although primarily intended for internal data visualization and analysis, the system is also designed to interface with external applications, using pygeoapi, which provides an OGC API-compliant interface for data access. The map component utilizes this API, but the system architecture also supports data access from disparate GIS within the same network. While not a default feature, the potential incorporation of WMS/WFS capabilities with GeoServer could extend the system’s utility. Containerization via Docker and Docker Compose underpins the entire application, streamlining installation and maintenance processes and ensuring scalability. This methodology caters to the evolving needs of users, offering straightforward system updates and customizations.

3.3. User Workflow

The user workflow is architected to be intuitive and efficient, guiding users in local authorities through steps that extend from data importation to the critical evaluation of indicators. This workflow is bolstered by an interface designed for ease of use, paired with a suite of tools that streamline the entire monitoring and analysis process. An existing and exported data set of population register data, which contains the current population and changes, forms the basis of the following workflow.

3.3.1. Data Importing

The process starts with users importing population master and transactional data. An import wizard, compatible with CSV and Excel file formats, facilitates this process. As shown in Figure 2, it guides users through a step-by-step process, ensuring system compatibility with a broad spectrum of data types and structures. The flexibility of the import was tested with three different real-world population data sets as well as data sets generated from OpenStreetMap and census data for test purposes [63].
Users can import a separate address data set to augment geocoding precision, which leverages Nominatim based on OSM data. During the import of the population data, the system first attempts to geocode addresses using the imported data set before defaulting to Nominatim for unresolved entries. Nominatim was used to ensure transferability to other municipalities, as this geocoder can be used independently of existing data sets. The importation of reference geometries is essential for the computation and aggregation of data from the population register into meaningful indicators with varying spatial scales, such as neighborhoods or blocks, allowing for granular spatial analysis. It is advisable to use large-scale geometries to achieve precise monitoring. However, such geometries are rarely available, while administrative delineations are too small-scale. The use of development plan areas can be helpful. As a rule, they already outline areas that are homogeneous in terms of content and time, but have not yet necessarily been developed. Figure 3 shows the remanence building indicator, which relies on high-resolution spatial reference geometries—building polygons—and also shows the accuracy of the geocoded data. For privacy reasons, the data used in this illustration do not correspond to the real situation, but serve to illustrate the approach.
If authorized, the demographic information can be displayed for the individual buildings. However, it can also be aggregated to higher display scales. Ref. [64] have described a method for automatically deriving areas of a similar year of construction and similar building structure from development plans, even outside the actual area of validity of a development plan. The resulting neighborhoods are one option for geometric representation that we offer for displaying the demographics; others are, for example, standard land value zones or grids.

3.3.2. Data Processing

After import, users can initiate the calculation of various specified indicators by selecting the appropriate combination of the population data set and a reference geometry. The processing queue is managed by an asynchronous task scheduler reliant on Redis, which guarantees efficient and correct execution without impacting user experience. This phase encompasses geocoding individual population data points, aggregating them according to the chosen reference geometry, and calculating the selected indicators. These may encompass demographic statistics, such as median age and greying index, migration patterns, or future population projections. Complex geospatial data set-processing tasks, particularly those involving OpenStreetMap data, are shifted to an internal Python API that ensures robust and extensive processing capabilities. The outcomes are then stored in the PostGIS database.

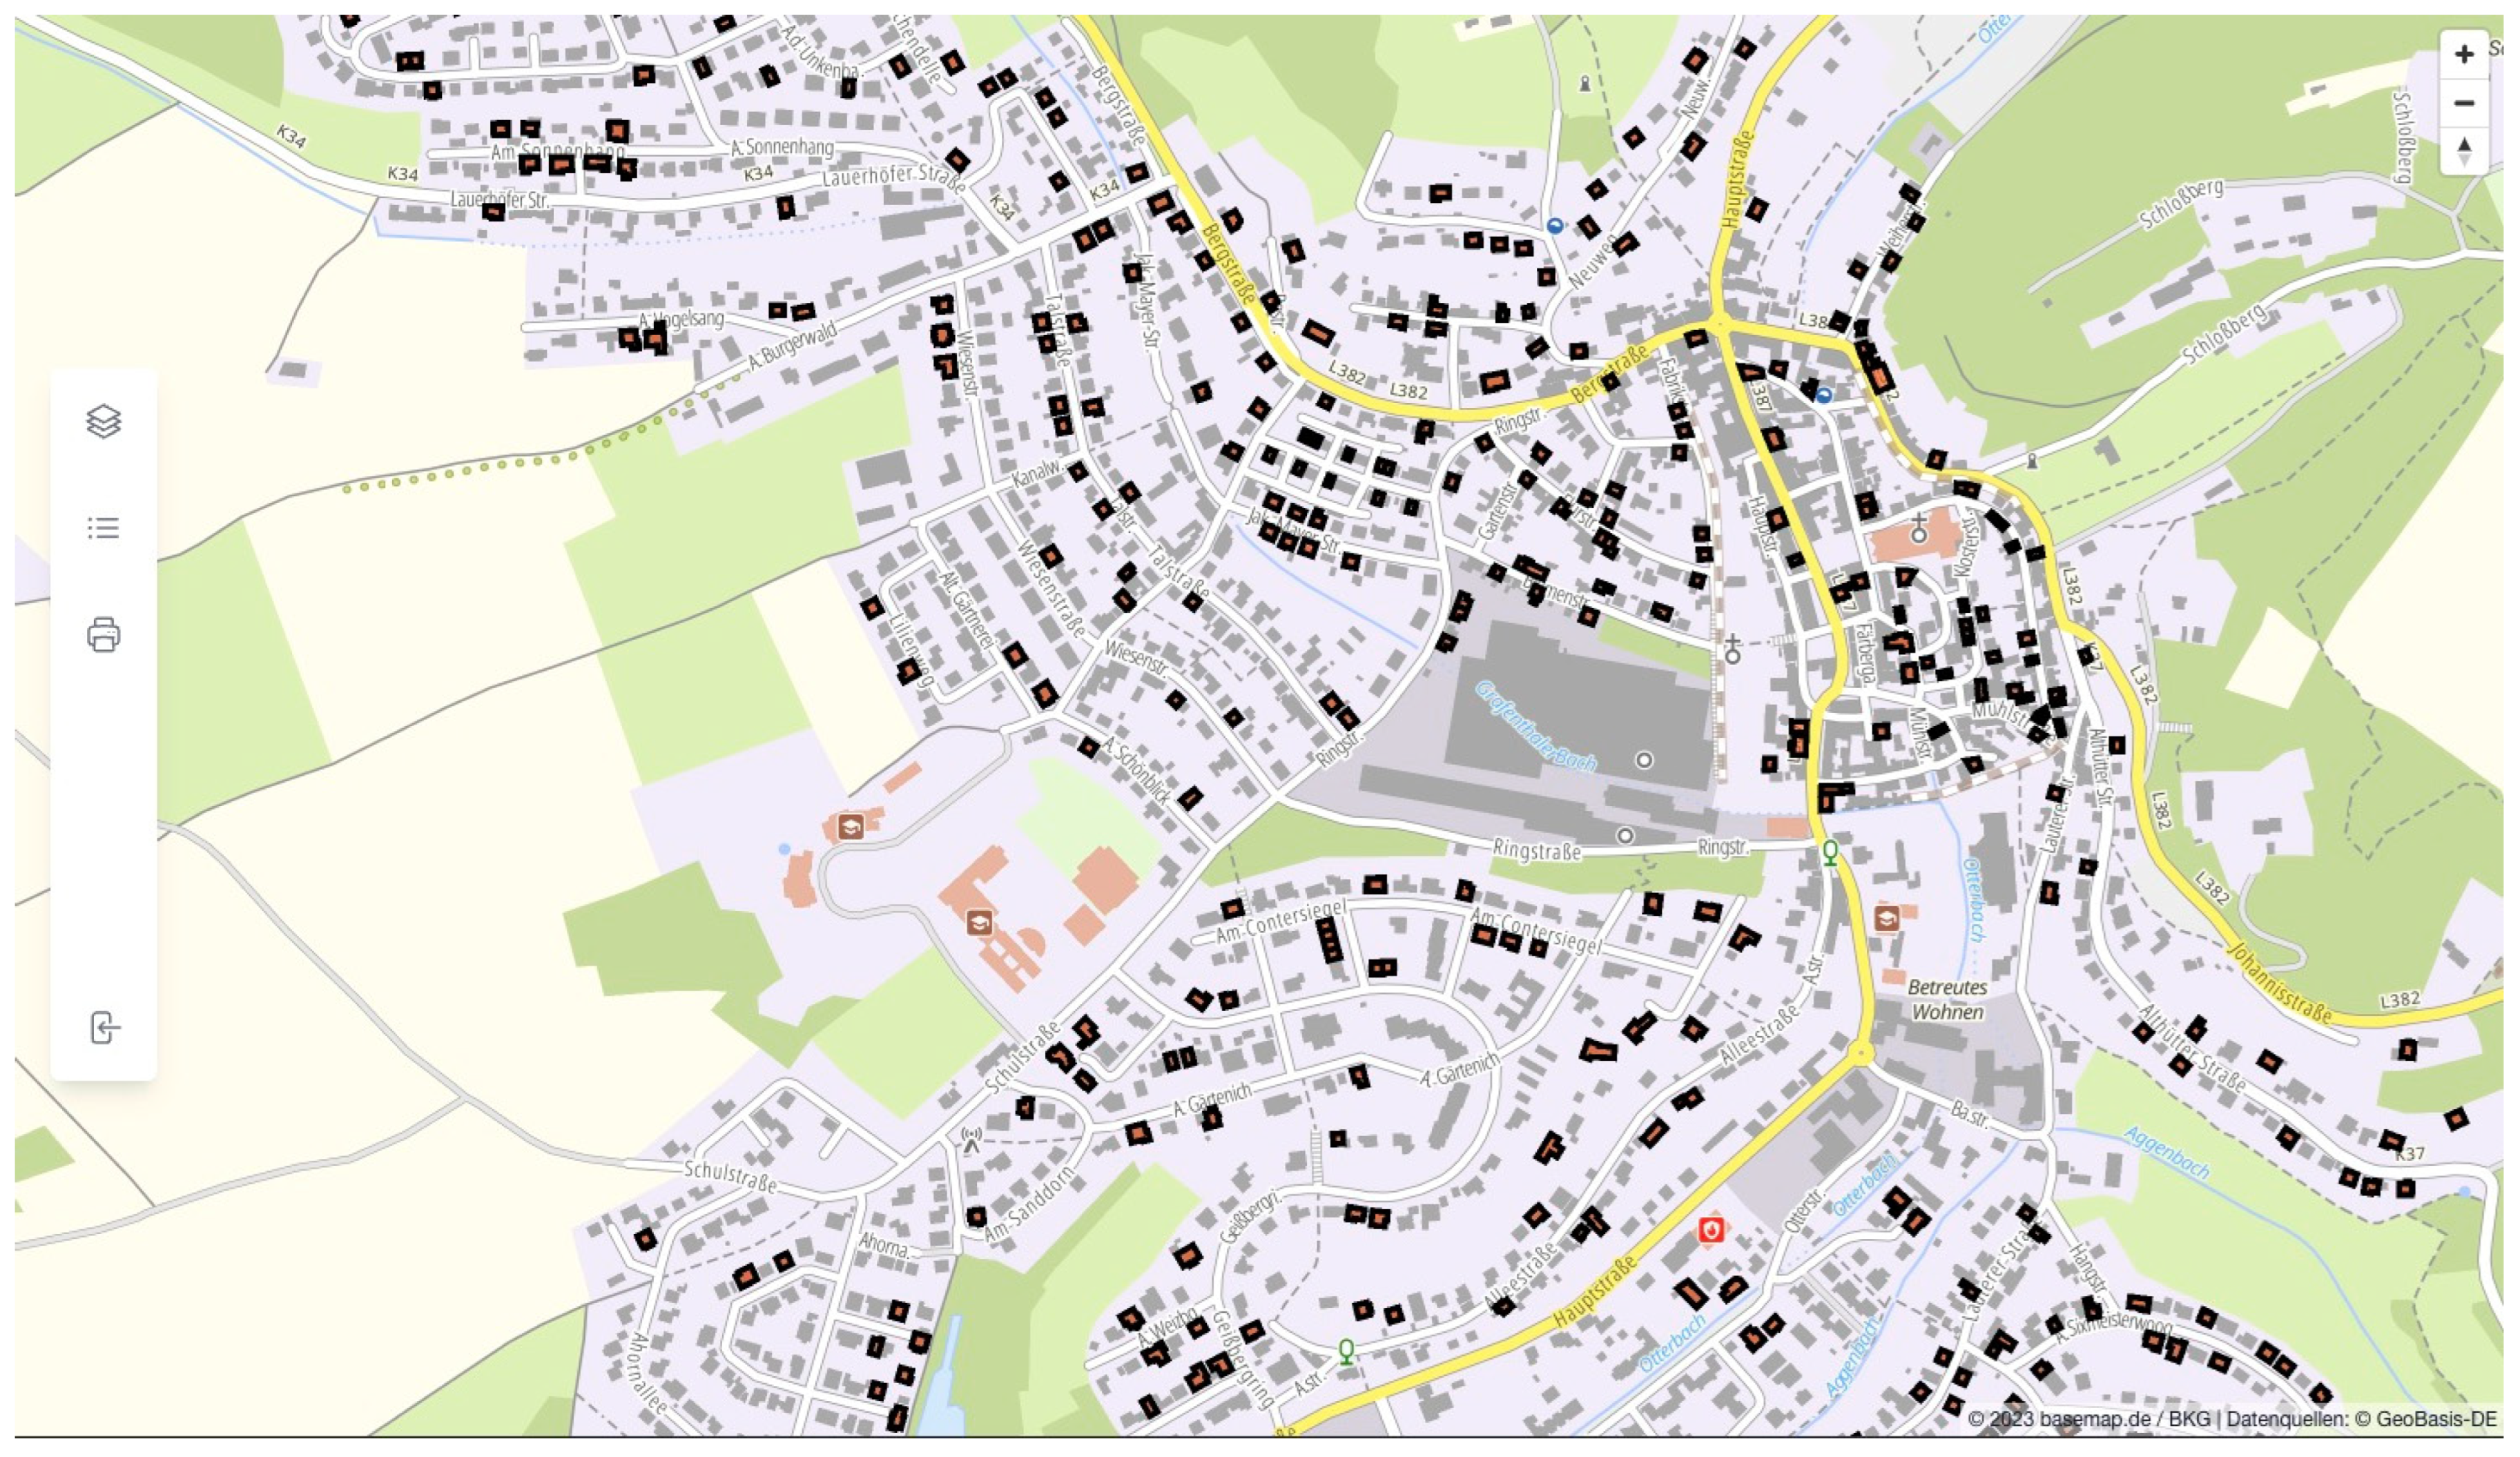
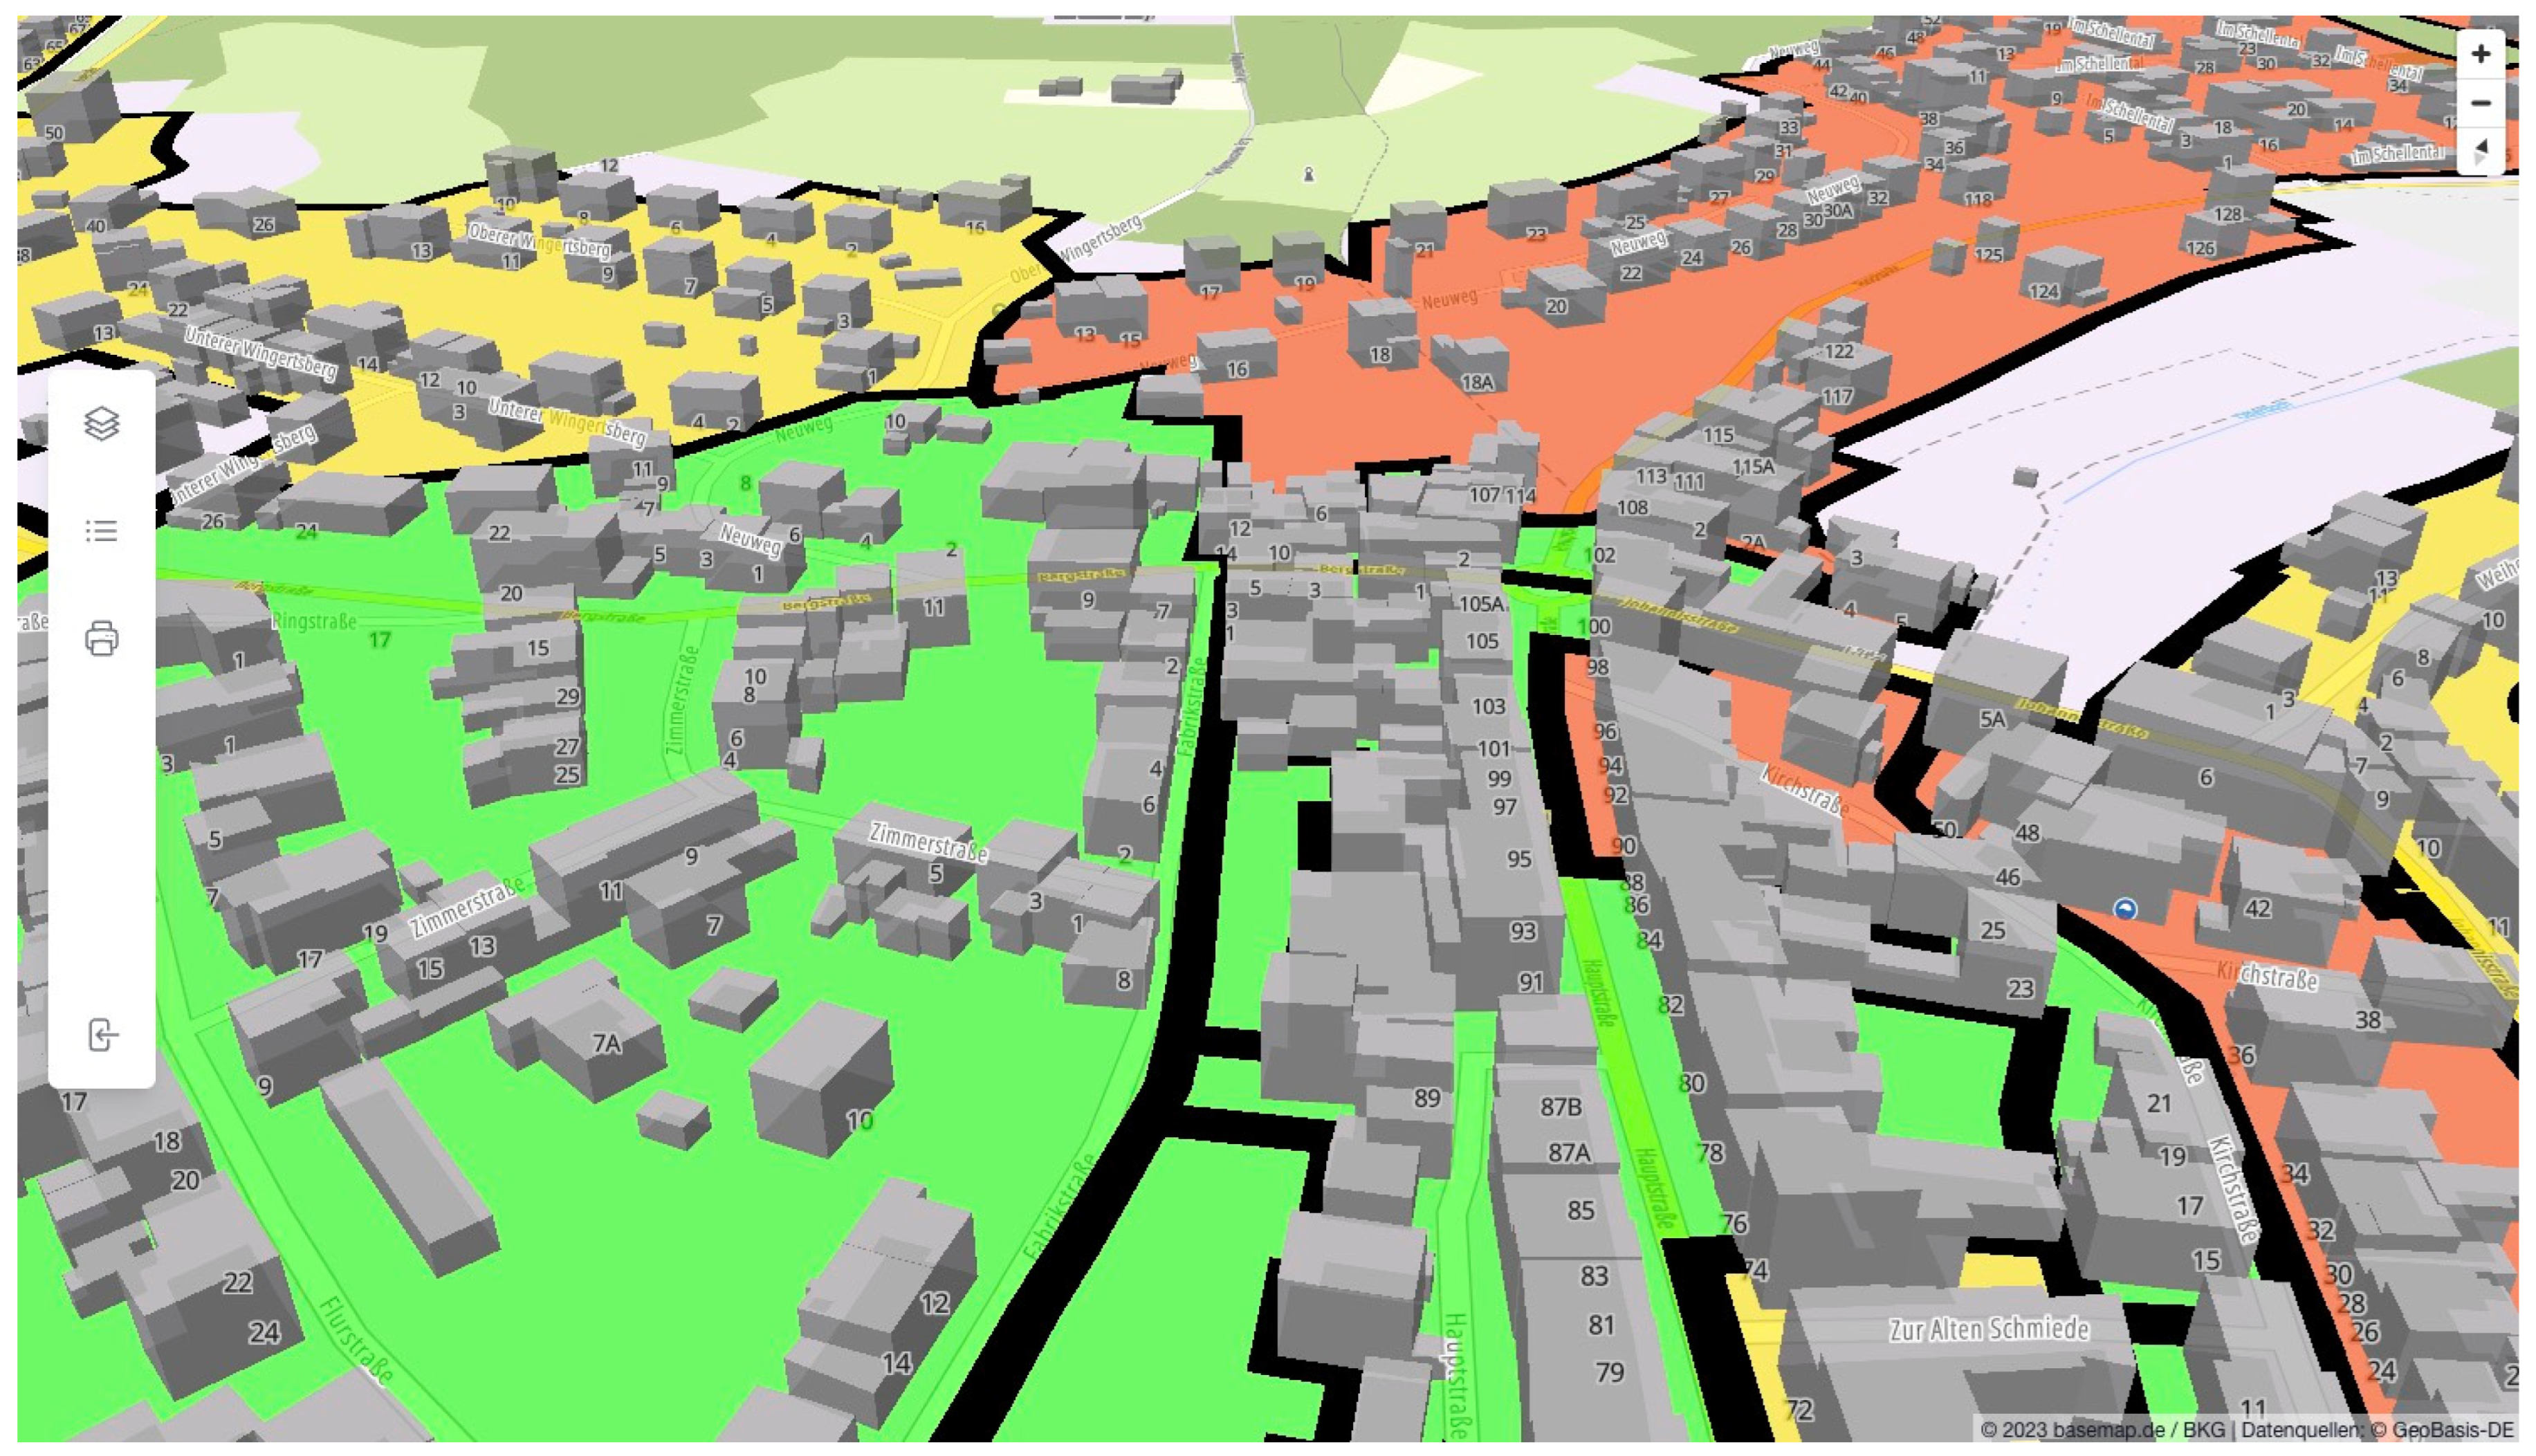
3.3.3. Visualization

The indicators are visualized on a map, a central feature of the application that users can access directly from the import menu. This interactive platform allows users to navigate through the spatial distribution and delve into the specifics of the existing indicators. Standard map functionalities—like zooming, panning, pop-up information windows, and legends—are complemented by filtering options through various timestamps and aggregation geometries.
The iterative design of the user workflow permits users to re-import data, modify calculation parameters, and explore different indicators across multiple spatial and temporal resolutions.

3.4. User Application

Within the monitoring application, the map component is constructed as a React component and integrated using Inertia.js to enable a reactive interface that aligns with the single-page application paradigm without adding the complexity of synchronizing a separate frontend and backend.
The base mapping layer is rendered via MapLibre, which utilizes official vector tiles for geographical accuracy. Deck.GL complements MapLibre by overlaying the calculated indicators onto this base layer. The utilization of Deck.GL is critical for its capability to render large quantities of data points efficiently, an essential feature for creating heatmap visualizations to represent population distribution across various age groups.
The map component is tailored for municipal planners and decision-makers, functioning within an ecosystem where extensive GIS software is already in place. Consequently, the component is designed with a focus on the visualization and exploration of demographic indicators, rather than replicating comprehensive GIS functionalities. This design choice simplifies the user interface, facilitating ease of use and allowing immediate engagement with the data without extensive GIS expertise. The interface includes standard navigation tools and a 3D view option, enhancing the spatial exploration of data as shown in Figure 4. It incorporates a dynamic legend and a table of contents for a contextual understanding of the data layers, alongside a basic print service for physical map outputs. Pop-up information provides detailed data insights at specific points of interest.
In line with the system’s adaptability, the presentation of indicators on the map is adjustable and can be customized using selection menus and temporal sliders. This provides a dynamic interface for data visualization based on user-defined parameters. Due to privacy reasons, the data we used in Figure 4 do not represent the real situation, but are intended to illustrate the principle.

4. Discussion

4.1. Indicators—From Islands to Bridges

SFH monitoring tools and their indicators should not be designed as isolated solutions, but should support in building bridges for integration, both technically and in terms of content. Most indicators discussed in Section 2 were developed on a case-specific and largely individual basis. However, they share a common core. While flexibility in the development of indicators is an asset for meeting local characteristics, there is still ample room for additional indicators and harmonization with indicator sets for other areas of urban planning. The narrow set of indicators of [56], which is limited to demographic aspects such as fluctuation, length of residence, and the increasing proportion of older people, can serve as an example here. Building-related demographic indicators, such as the youngest occupant or the proportion of buildings with few older people, could meaningfully supplement the core catalogue of [56]. This modular structure guided us in the design of the monitoring tool. In doing so, we expanded the core catalogue to include additional demographic indicators, like the greying index or Billeter J, that may not directly indicate a transformation but allow for a more comprehensive assessment of the overall demographic situation. These parameters were borrowed from local statistical guidelines that are recognized in German cities and take an integrated planning approach. The indicator catalogue of the German city statistics [65,66,67] is particularly noteworthy in this context, and defines additional indicators in a consistent manner.
In this context, one should also consider regional integration that can technically be implemented through open network services. The regional interconnection of our software, which has so far been tailored to the needs of individual municipalities, is therefore the consistent next step because housing markets extend beyond local borders and represent regional markets. Therefore, tools for regional planning should complement municipal planning efforts. With the help of a traffic light system, which represents the impact of aging single-family home areas in transition, for example, it would be possible to identify and prioritize areas with particularly high problem pressure, even in a regional context [22]. Based on such information, regional planning could assist the municipalities in setting priorities in the region by facilitating moderation between the affected municipalities. Initial proposals for such a regional connection in Germany are already available [22,38]. However, they are still in the early stages when it comes to the specific needs of aging residential areas. Nevertheless, there is much to be learned from successful implementations of SDI-based comprehensive planning architectures and projects [68,69].

4.2. Architecture and Software Development

The development of the monitoring application involved opting for a more monolithic architecture, diverging from the increasingly popular microservices and single-page applications (SPAs). This decision was principally guided by the need to streamline the development process, given the limited resources and the fact that the software was developed by a single programmer. Monolithic architectures offer a simplified and cohesive development workflow, avoiding the complexities associated with microservices, such as service discovery, load balancing, and distributed data management. This approach, while potentially limiting scalability and independent service deployment, significantly reduces operational overhead and aligns with the requirements of solo developers or small teams.
The choice of a monolithic structure over a more modular architecture is supported by the literature as being particularly effective for rapid prototyping and early-stage product development, where ease of maintenance, debugging, and a unified data model are paramount [70,71]. For the monitoring application, this architectural choice enables a more integrated experience and the cohesive handling of complex geospatial and demographic data, which is essential for the application’s goal of providing a user-friendly interface for municipal planners and decision-makers.

4.3. Convincing Stakeholders of the Need for Monitoring

Given that single-family homes SFH in Germany are typically privately owned, public authorities often do not consider the monitoring of aging single-family neighborhoods as a priority task [72]. However, aging single-family residential areas are undergoing a structural transformation that cannot be left solely to private homeowners [31]. Currently, there is only moderate willingness to recognize structural change in residential areas as a communal task. Coupled with the significant challenges described above in terms of data procurement and resources, this does not make the municipalities’ commitment a self-runner. Rather, it seems imperative to motivate decision-makers in the local authorities to address this issue.
The previous analyses conducted within a municipality play a crucial role in demonstrating the benefits of the tool and making the challenges identified understandable to individuals without a primarily technical background. To analyze and present professional contexts effectively, working with geodata and their interdisciplinary combinability in a joint spatial context provides significant benefit. For instance, current municipal obligations in the energy sector, such as municipal heat planning [73], can be utilized to generate local motivation and combine demographic indicators with energy considerations. This approach allows a quick recognition of the significance that these aspects converge upon in aging post-war buildings and among elderly residents at the local level.

5. Conclusions

Our work shows that it is possible to implement tools for monitoring transitions in single-family neighborhoods based on open source software and that these tools can be designed spatially and thematically in such a way that they can provide essential planning support. Methods of geospatial informatics and the data source’s common spatial reference system are of central importance in this approach. Data from different sources require that, in addition to analysis and visualization, data management is also given appropriate consideration when designing the tool in order to ensure interoperability. In order not to overwhelm the intended users, namely planners and decision-makers in the municipalities, the underlying indicators for map visualization are calculated automatically, while the process is controlled through variable parameter settings. We have implemented a canon of demographic indicators in our PSS. There is a consensus among experts on their importance for SFH area monitoring, as previous studies have shown. In addition to information on the demographic status quo, change-related information, such as the fluctuation of residents, is particularly important. It is also crucial to be able to carry out analyses not only at the neighborhood level, but also at the building level. Even if, for reasons of data protection or spatial planning, detailed information has to be visualized finally at neighborhood level, the ability to carry out analyses at both levels is essential. In addition to the key demographic indicators, we implemented further indicators. These include land values and a walkability estimate adjusted to the needs of the elderly. We also considered indicators that are used in established German urban statistics, such as the greying index or Billeter J.
Indicators that can be linked to established statistical catalogues are important for generating sustained interest, especially at the local rural level. In rural areas, our instrument, originally designed with the characteristics of single-family home areas in mind, is likely to often serve as the first ever visualization component for high resoluted local statistical data. This represents a significant opportunity for our PSS. However, trade-offs need to be made between what we as academics consider to be an epochal problem for many rural communities, namely the demographic transition in single-family house areas, and the large number of various obligations facing local authorities today. Therefore, it is crucial to provide information not only for SFH areas, but also at a granular level for the entire municipal area. Continuous engagement with potential users on-site is indispensable. Consequently, we aim to further intensify collaboration with our practice partners in the form of real-world laboratories for mutual learning and research. The needs identified there will guide the ongoing development of the PSS in a transdisciplinary setup. In this way, we hope that the PSS can fully exploit its potential to contribute to urban resilience.

Author Contributions

Conceptualization, M.S. and D.W.; methodology, M.S. and D.W.; software, D.W.; validation, H.M., M.S. and D.W.; formal analysis, M.S. and D.W.; investigation, M.S. and D.W.; resources, M.S. and D.W.; data curation, M.S. and D.W.; writing—original draft preparation, M.S., H.M. and D.W.; writing—review and editing, M.S., H.M. and D.W.; visualization, D.W. and M.S.; supervision, M.S.; project administration, M.S.; funding acquisition, M.S. All authors have read and agreed to the published version of the manuscript.

Funding

This article was written as part of the project ‘Raumintelligenz für die integrierte Versorgung von Seniorinnen und Senioren in ländlichen Quartieren (RAFVINIERT)’ funded by the Carl Zeiss Foundation.

Institutional Review Board Statement

Not applicable.

Informed Consent Statement

Not applicable.

Data Availability Statement

The data presented in this study are available on request from the corresponding author, provided that privacy and data protection aspects permit this.

Conflicts of Interest

The authors declare no conflicts of interest.

References

  1. Manville, M.; Monkkonen, P.; Lens, M. It’s time to end single-family zoning. J. Am. Plan. Assoc. 2020, 86, 106–112. [Google Scholar] [CrossRef]
  2. Wegmann, J. Death to Single-Family Zoning…and New Life to the Missing Middle. J. Am. Plan. Assoc. 2020, 86, 113–119. [Google Scholar] [CrossRef]
  3. Chakraborty, A. Calls to end all single-family zoning need more scrutiny. J. Am. Plan. Assoc. 2020, 86, 123–124. [Google Scholar] [CrossRef]
  4. Trounstine, J. You Won’t Be My Neighbor: Opposition to High Density Development. Urban Aff. Rev. 2021, 59, 294–308. [Google Scholar] [CrossRef]
  5. Romero, F.S. “For the Contrary View”: Reconsidering the Early Anti-Zoning Decisions. J. Plan. Hist. 2022, 21, 199–214. [Google Scholar] [CrossRef]
  6. Gennaio, M.-P.; Hersperger, A.M.; Bürgi, M. Containing urban sprawl—Evaluating effectiveness of urban growth boundaries set by the Swiss Land Use Plan. Land Use Policy 2009, 26, 224–232. [Google Scholar] [CrossRef]
  7. Yasin, M.Y.; Mohd Yusoff, M.; Abdullah, J.; Mohd Noor, N. Is urban sprawl a threat to sustainable development? A review of characteristics and consequences. Geografia 2020, 16, 56–68. [Google Scholar] [CrossRef]
  8. Navarrete-Hernandez, P.; Mace, A.; Karlsson, J.; Holman, N.; Zorloni, D.A. Delivering higher density suburban development: The impact of building design and residents’ attitudes. Urban Stud. 2022, 59, 2801–2820. [Google Scholar] [CrossRef]
  9. Newman, P. Density, the sustainability multiplier: Some myths and truths with application to Perth. Sustainability 2014, 6, 6467–6487. [Google Scholar] [CrossRef]
  10. Bambara, J.; Athienitis, A.K.; Eicker, U. Residential Densification for Positive Energy Districts. Front. Sustain. Cities 2021, 3, 630973. [Google Scholar] [CrossRef]
  11. Heidari, M.; Rahdar, M.H.; Dutta, A.; Nasiri, F. An energy retrofit roadmap to net-zero energy and carbon footprint for single-family houses in Canada. J. Build. Eng. 2022, 60, 105141. [Google Scholar] [CrossRef]
  12. Debs, L.; Metzinger, J. A Comparison of Energy Consumption in American Homes by Climate Region. Buildings 2022, 12, 82. [Google Scholar] [CrossRef]
  13. Karpinska, L.; Śmiech, S. Shadow of single-family homes: Analysis of the determinants of Polish households’ energy-related CO2 emissions. Energy Build. 2022, 277, 112550. [Google Scholar] [CrossRef]
  14. Linke, H.-J. Siedlungsumbau aufgrund des demographischen Wandels. In Land Management: Potential, Problems and Stumbling Blocks; Hepperle, E., Ed.; vdf Hochschulverlag an der ETH Zürich: Zürich, Switzerland, 2013; pp. 107–120. [Google Scholar]
  15. Milder, J. Sustainable urban form. In Sustainable Urban Environments; Van Bueren, E., Van Bohemen, H., Itard, L., Visscher, H., Eds.; Springer: Dordrecht, The Netherlands, 2012; pp. 263–284. [Google Scholar]
  16. Bervoets, W.; Heynen, H. The obduracy of the detached single family house in Flanders. Int. J. Hous. Policy 2013, 13, 358–380. [Google Scholar] [CrossRef]
  17. Leinberger, C.B. The next slum? The Atlantic 2008, 301, 70–75. [Google Scholar]
  18. Owens, A. Building inequality: Housing segregation and income segregation. Sociol. Sci. 2019, 6, 497–525. [Google Scholar] [CrossRef] [PubMed]
  19. Tziganuk, A.; Irvine, B.; Cook-Davis, A.; Kurtz, L.C. Exclusionary Zoning: A Legal Barrier to Affordable Housing; Morrison Institute for Public Policy: Tucson, AZ, USA, 2022. [Google Scholar]
  20. Walther, U.-J. Alternde Stadtbevölkerung—Altern in der Stadt. In Die Stadt in der Sozialen Arbeit; Baum, D., Ed.; VS Verlag für Sozialwissenschaften: Wiesbaden, Germany, 2007; pp. 276–286. [Google Scholar]
  21. Nierhoff, S. Entwicklungsperspektiven von alternden Einfamilienhausquartieren. In Quartiersforschung; Schnur, O., Ed.; VS Verlag für Sozialwissenschaften: Wiesbaden, Germany, 2008; pp. 337–350. [Google Scholar]
  22. Schaffert, M.; Böhm, K.; Neis, P. Einfamilienhausgebieten im Umbruch—Auf dem Weg zu einem Monitoring von alternden Quartieren. Z. Für Geodäsie Geoinf. Und Landmanagement 2023, 6, 354–363. [Google Scholar]
  23. Lorbek, M. Idealizations of the Kleinhaus: On the typology of the small single-family house in Germany, 1920s–1960s. Arch. Hist. 2018, 6, 13. [Google Scholar] [CrossRef]
  24. Hallenberg, B.; Rohland, F. Eigenheime der 1950er bis 1970er Jahre: Ergebnisse einer Befragung von älteren Eigentümerinnen und Eigentümern zur Wohnsituation und im Kontext der Perspektiven des Bestandes; Vhw—Bundesverband für Wohnen und Stadtentwicklung e. V.: Berlin, Germany, 2021. [Google Scholar]
  25. Homfeldt, H.G. Wohlergehen im Alter. In Sozialraum; Kessl, F., Reutlinger, C., Eds.; Sozialraumforschung und Sozialraumarbeit; Springer Fachmedien Wiesbaden: Wiesbaden, Germany, 2022; pp. 667–676. [Google Scholar]
  26. Gans, P. Demografischer Wandel. In Handwörterbuch der Stadt-und Raumentwicklung; Verlag der ARL: Hannover, Germany, 2018; pp. 375–396. [Google Scholar]
  27. Fuhrhop, D. Der unsichtbare Wohnraum: Wohnsuffizienz als Antwort auf Wohnraummangel, Klimakrise und Einsamkeit; Urban Studies; Transcript Verlag: Bielefeld, Germany, 2023. [Google Scholar]
  28. Hesse, M.; Polívka, J.; Reicher, C. Spatially differentiated, temporally variegated: The study of life cycles for a better understanding of suburbia in German city regions. Raumforsch. Raumordn. 2018, 76, 149–163. [Google Scholar] [CrossRef]
  29. Zakrzewski, P.; Berndgen-Kaiser, A.; Fox-Kämper, R.; Siedentop, S. Herausforderungen westdeutscher Einfamilienhausgebiete der Nachkriegszeit. Bestandsentwicklung als neues Handlungsfeld für Kommunen. Comp. Popul. Stud. 2014, 39, 247–284. [Google Scholar]
  30. Grabski-Kieron, U.; Mose, I.; Reichert-Schick, A.; Steinführer, A. European rural peripheries revalued? Introduction to this volume. Eur. Rural Peripher. Revalued Gov. Actors Impacts 2016, 1, 2–27. [Google Scholar]
  31. Krajewski, C. Was wird aus den Traumhäusern? Einfamilienhausgebiete in Altena im Umbruch. Forum Wohn. Stadtentwickl. 2015, 7, 189–190. [Google Scholar]
  32. Gudewer, S.; Utku, Y. The Desert is Alive—Engagement in Aging Districts of Single-Family Housing. Four Examples from North-Rhine Westphalia. In Maturity and Regeneration of Residential Areas in Metropolitan Regions—Trends, Interpretations and Strategies in Japan and Germany; Kadono, Y., Beilein, A., Polívka, J., Reicher, C., Eds.; Technische Universität: Dortmund, Germany, 2017; pp. 190–203. [Google Scholar]
  33. Berndgen-Kaiser, A.; Bläser, K.; Fox-Kämper, R.; Siedentop, S.; Zakrzewski, P. Demography-driven suburban decline? At the crossroads: Mature single-family housing estates in Germany. J. Urban. Int. Res. Placemaking Urban Sustain. 2014, 7, 286–306. [Google Scholar] [CrossRef]
  34. Tao, Y.; Zhang, W.; Gou, Z.; Jiang, B.; Qi, Y. Planning walkable neighborhoods for “aging in place”: Lessons from five aging-friendly districts in Singapore. Sustainability 2021, 13, 1742. [Google Scholar] [CrossRef]
  35. Wüstenrot Stiftung (Ed.) Die Zukunft von Einfamilienhausgebieten aus den 1950er bis 1970er Jahren—Handlungsempfehlungen für eine nachhaltige Nutzung; Wüstenrot Stiftung: Ludwigsburg, Germany, 2012. [Google Scholar]
  36. Kötter, T.; Weiß, D. Governanceansätze zur Anpassung und Stabilisierung von Einfamilienhausgebieten. Forum Wohn. Stadtentwickl. 2015, 4, 197–202. [Google Scholar]
  37. Hohn, U.; Utku, Y. Wohnquartiere von morgen? Zehn Thesen zur Zukunft von Einfamilienhausgebietender 1950er bis 1970er Jahre. Forum Wohn. Stadtentwickl. 2015, 4, 185–188. [Google Scholar]
  38. Adam, B.; Aring, J.; Berndgen-Kaiser, A.; Hohn, U.; Jochemsen, K.; Kötter, T.; Krajewski, C.; Mielke, B.; Münter, A.; Utku, Y.; et al. Ältere Einfamilienhausgebiete im Umbruch: Eine unterschätzte planerische Herausforderung—Zur Situation in Nordrhein-Westfalen; Positionspapier aus der ARL; Verl. d. ARL: Hannover, Germany, 2018; Volume 109. [Google Scholar]
  39. Lindenthal, J.; Mraz, G. Das Zukunftspotenzial von bestehenden Einfamilienhaus-Siedlungen im ländlichen Raum. Z. Für Kult. 2017, 11, 149–170. [Google Scholar] [CrossRef]
  40. Berndgen-Kaiser, A.; Köhler, T.; Wiechert, M.; Netsch, S.; Ruelle, C.; Marique, A.F. Approaches to handling future use of the single-family housing stock: Evidence from Belgium, Germany and the Netherlands. Open House Int. 2018, 43, 69–82. [Google Scholar] [CrossRef]
  41. Attia, S.; Mustafa, A.; Giry, N.; Popineau, M.; Cuchet, M.; Gulirmak, N. Developing two benchmark models for post-world war II residential buildings. Energy Build. 2021, 244, 111052. [Google Scholar] [CrossRef]
  42. Jensen, J.O.; Mechlenborg, M. Ageing population in Danish single-family houses: Energy efficiency and other challenges illustrated by the “Single-family housing atlas” and home research. In Proceedings of the ENHR 2019, Athen, Greece, 27–30 August 2019. [Google Scholar]
  43. Cividino, S.; Egidi, G.; Salvati, L. Unraveling the (Uneven) Linkage? A Reflection on Population Aging and Suburbanization in a Mediterranean Perspective. Sustainability 2020, 12, 4546. [Google Scholar] [CrossRef]
  44. Módenes, J.A.; López-Colás, J. Recent demographic change and housing in Spain: Towards a new housing system? Rev. Española Investig. Sociol. 2014, 148, 103–134. [Google Scholar]
  45. Keil, R. After Suburbia: Research and action in the suburban century. Urban Geogr. 2020, 41, 1–20. [Google Scholar] [CrossRef]
  46. Schaffert, M.; Höcht, V. Geocoded Data from Population Registers as a Source for Needs-Based Planning in Rural Municipalities and Regions. Raumforsch. Raumordn. 2018, 76, 421–435. [Google Scholar]
  47. Geertman, S.; Stillwell, J. Planning support science: Developments and challenges. Environ. Plan. B Urban Anal. City Sci. 2020, 47, 1326–1342. [Google Scholar] [CrossRef]
  48. de Temple, N. Einfamilienhaussiedlungen im Wandel. Eine Untersuchung zum Generationenwechsel vor dem Hintergrund des soziodemografischen Wandels am Beispiel der Stadt Dortmund. Diplomarbeit; Technischen Universität Berlin: Berlin, Germany, 2005. [Google Scholar]
  49. Planinsek, S. Die Entwicklung von Eigenheimgebieten der 1960er- bis 1980er-Jahre in Gemeinden des Umlandes und der Peripherie—Generierung und Analyse von Bevölkerungs- und Siedlungsstrukturdaten auf Quartiersebene durch Geocoding. Fallstudien aus Baden-Württemberg. Ph.D. Thesis, Karlsruher Institut für Technologie (KIT), Karlsruhe, Germany, 2011. [Google Scholar]
  50. Schaffert, M. Herausforderung »Generationenwechsel in ländlichen Einfamilienhausgebieten«—Unterstützungspotenziale von GIS. In GeoForum MV 2018—Geoinformation und Digitalisierung; Bill, R., Zehner, M.L., Lerche, T., Schröder, J., Eds.; GITO Verlag: Berlin, Germany, 2018; pp. 79–85. [Google Scholar]
  51. Schaffert, M.; Steensen, T. Demographic Transition in Single-Family Housing Areas—Planning Support for Rural Germany. In Proceedings of the ICREDM-Conference, Ankara, Turkey, 1–4 February 2023. [Google Scholar]
  52. Ryckewaert, M.; Bervoets, W.; van de Weijer, M.; Vanneste, D.; Vanderstraeten, L.; Heynen, H. Towards a sustainable transformation of the housing stock in Flanders, Belgium. J. Urban. Int. Res. Placemaking Urban Sustain. 2014, 7, 1–29. [Google Scholar]
  53. van de Weijer, M. Reconfiguration, Replacement or Removal? Evaluating the Flemish Post-War Detached Dwelling and its Part in Contemporary Spatial Planning and Architecture. Ph.D. Thesis, KU Leuven, Leuven, Belgium, 2014. Available online: http://hdl.handle.net/1942/16783 (accessed on 5 February 2024).
  54. Zakrzewski, P. In der Übergangszone: Alternde Einfamilienhausgebiete zwischen Revitalisierung, Stagnation und Schrumpfung. In Quartiere im Demografischen Umbruch; Schnur, O., Drilling, M., Eds.; VS Verlag für Sozialwissenschaften: Wiesbaden, Germany, 2011; pp. 47–66. [Google Scholar]
  55. Shields, R.; Gomes da Silva, E.J.; Lima e Lima, T.; Osorio, N. Walkability: A review of trends. J. Urban. Int. Res. Placemaking Urban Sustain. 2023, 16, 19–41. [Google Scholar] [CrossRef]
  56. Höger, U. Alternde Einfamilienhausgebiete: Standortanalyse und Entwicklungspotenziale. Ph.D. Thesis, Universität Kassel, Kassel, Germany, 2018. [Google Scholar]
  57. Alves, F.; Cruz, S.; Ribeiro, A.; Bastos Silva, A.; Martins, J.; Cunha, I. Walkability index for elderly health: A proposal. Sustainability 2020, 12, 7360. [Google Scholar] [CrossRef]
  58. Carr, L.J.; Dunsiger, S.I.; Marcus, B.H. Validation of Walk Score for estimating access to walkable amenities. Br. J. Sports Med. 2011, 45, 1144–1148. [Google Scholar] [CrossRef]
  59. Schaffert, M.; Geist, K.; Albrecht, J.; Enners, D.; Müller, H. Walk Score from 2D to 3D—Walkability for the Elderly in Two Medium-Sized Cities in Germany. ISPRS Int. J. Geo-Inf. 2023, 12, 157. [Google Scholar] [CrossRef]
  60. Haußmann, M. Die Städtestatistik als Datennutzer und Informationsprovider—Wie können die bestehenden Potenziale genutzt werden? In Georeferenzierung von Daten. Situation und Zukunft der Geodatenlandschaft in Deutschland; Rat für Sozial- und Wirtschaftsdaten, Ed.; Rat für Sozial- und Wirtschaftsdaten: Berlin, Germany, 2012; pp. 74–79. [Google Scholar]
  61. Gudat, R.; Ache, P. Immobilienmarkttransparenz—ihr Potenzial und eine neue Definition. zfv—Z. Für Geodäsie Geoinf. Landmanagement 2023, 6, 364–371. [Google Scholar]
  62. Balducci, F.; Ståhl, A.; Svensson, O.; Jonsson, B.; Westerlund, Y.; Dolcini, J.; Chiatti, C. “How Far Is the Closest Bus Stop?” An Evaluation of Self-Reported versus GIS-Computed Distance to the Bus among Older People and Factors Influencing Their Perception of Distance. Geomatics 2023, 3, 580–596. [Google Scholar] [CrossRef]
  63. Visca, D.; Hoppe, M.; Neis, P. Generating a Pseudo Resident Registration Register by Using Open Data. In Proceedings of the GEOProcessing 2022—The Fourteenth International Conference on Advanced Geographic Information Systems, Applications, and Services, Porto, Portugal, 26–30 June 2022; pp. 53–57. [Google Scholar]
  64. Visca, D.; Hoppe, M.; Kaminski, K.; Neis, P. Identifying and visualizing older single-family house areas for a sustainable spatial planning. In Proceedings of the GEOProcessing 2023: Trends of Urban-Geo, Venice, Italy, 24–28 April 2023; pp. 73–78. [Google Scholar]
  65. VDSt—Verband Deutscher Städtestatistiker. Indikatoren-und Merkmalskatalog zum demografischen Wandel. Arbeitshilfe Für Kommunalstatistische Monitoring- Und Berichtssysteme Zur Bevölkerungsstruktur Und -Entwicklung; Materialien zur Bevölkerungsstatistik, Heft 1; VDSt: Frankfurt, Germany, 2011. [Google Scholar]
  66. Gleich, A.; Staudinger, T. Demografiemonitoring und Bevölkerungsprognose als Beispiele kleinräumiger Kommunalstatistik–Methode und Ergebnisse der Stadt Augsburg. In Flächennutzungsmonitoring V: Methodik—Analyseergebnisse—Flächenmanagement; Leibniz-Institut für ökologische Raumentwicklung e.V.: Dresden, Germany, 2013; pp. 297–304. [Google Scholar]
  67. Göddecke-Stellmann, J.; Lauerbach, T.; Winkler, D. Innerstädtische Raumbeobachtung: Ein kritischer Rück-und Ausblick. Stadtforsch. Stat. Z. Verb. Dtsch. Städtestatistiker 2021, 34, 98–105. [Google Scholar]
  68. Danowski-Buhren, C.; Guth, M.; Schonlau, M.; Wytzisk-Arens, A. KomMonitor—Effiziente Entscheidungsunterstützung kommunaler raumbezogener Planungsfragen. zfv—Z. Für Geodäsie Geoinf. Landmanagement 2022, 2, 123–129. [Google Scholar]
  69. Wette, L.; Kramer, B. WEBWiKo—Digitale Werkzeuge zur Unterstützung der kooperativen Regionalentwicklung. Stadtforsch. Stat. Z. Verb. Dtsch. Städtestatistiker 2020, 33, 92–99. [Google Scholar]
  70. Christian, J.; Steven; Kurniawan, A.; Anggreainy, M.S. Analyzing Microservices and Monolithic Systems: Key Factors in Architecture, Development, and Operations. In Proceedings of the 6th International Conference of Computer and Informatics Engineering (IC2IE), Lombok, Indonesia, 14–15 September 2023; pp. 64–69. [Google Scholar]
  71. Gos, K.; Zabierowski, W. The Comparison of Microservice and Monolithic Architecture. In Proceedings of the XVIth International Conference on the Perspective Technologies and Methods in MEMS Design (MEMSTECH), Lviv, Ukraine, 22–26 April 2020; pp. 150–153. [Google Scholar]
  72. Berndgen-Kaiser, A.; Köhler, T.; Lorbek, M.; Wiechert, M. Land-management strategies and the detached housing stock in shrinking municipalities–evidence from Germany. Raumforsch. Raumordn. 2020, 78, 119–134. [Google Scholar] [CrossRef]
  73. Turner, V.K.; French, E.M.; Dialesandro, J.; Middel, A.; M Hondula, D.; Weiss, G.B.; Abdellati, H. How are cities planning for heat? Analysis of United States municipal plans. Environ. Res. Lett. 2022, 17, 064054. [Google Scholar] [CrossRef]
Figure 1. System architecture of the monitoring tool (our own diagram).
Geomatics 04 00004 g001
Figure 2. Import wizard (screenshot).
Geomatics 04 00004 g002
Figure 3. Indicator ‘Remanence Buildings’ (see Table 2). The dark highlighted polygons show buildings in which exclusively one or two people over the age of 60 live (screenshot).
Geomatics 04 00004 g003
Figure 4. Map component: visualization of mean population age aggregated to land value zones. Green areas show a mean age below 44 years, red areas show a mean age above 46 years, and yellow areas show a mean age between both values (screenshot).
Geomatics 04 00004 g004
Table 1. Indicators for the monitoring of aging SFH areas according to [56].
Demography Indicator 1Demography Indicator 2Location Quality Indicator
Decreasing duration of residence High share of elderly Insufficient supply situation
Increasing fluctuationIncreasing share of elderlyLow property prices
Table 2. Implemented indicators for the monitoring of aging SFH areas.
IndicatorSource Data Set
Mean AgePopulation register (master data)
Median AgePopulation register (master data)
Greying IndexPopulation register (master data)
Billeter-JPopulation register (master data)
Child Dependency RatioPopulation register (master data)
Aged Dependency RatioPopulation register (master data)
Total Dependency RatioPopulation register (master data)
Population Distribution (by age)Population register (master data)
Immigration RatesPopulation register (transactional data)
Emigration RatesPopulation register (transactional data)
Net MigrationPopulation register (transactional data)
FluctuationPopulation register (transactional data)
Length of StayPopulation register (transactional data)
Remanence BuildingPopulation register (master data)
Elderly-WSOSM, Digital Terrain Model (1 meter)
Land and Real Estate priceZones of standard land values
Disclaimer/Publisher’s Note: The statements, opinions and data contained in all publications are solely those of the individual author(s) and contributor(s) and not of MDPI and/or the editor(s). MDPI and/or the editor(s) disclaim responsibility for any injury to people or property resulting from any ideas, methods, instructions or products referred to in the content.

