1. Introduction
Mobility has been defined as one person’s ability to move to a desired destination independently and safely [
1]. It is a fundamental ability, but also a “personal right” for the individual. Mobility skill is acquired in early infancy and consolidated during childhood and adulthood, whereas it can deteriorate in later age, due to functional and cognitive impairments [
2].
Impairment of mobility is not, however, a deterministic consequence of ageing, which applies to all older individuals. Many people in modern societies are today ageing actively and in good health, as a consequence of the overall improvement of living conditions [
3]. Nonetheless, the risk of reduced mobility affects significant shares of the older population, especially those living in the most deprived cultural and social contexts [
4].
Mobility is a multidimensional and cross-disciplinary concept. It may be seen as a single element mirroring a specific subject’s health status: lower walking speed (most commonly assessed using usual walking speed achieved during a timed walk test over a short distance) and other multisystem performance measures of physical function (such as the time taken to rise from a chair and sit down several times, or tests of balance) are consistently associated with poorer well-being and quality of life in old age, track overall health status, and predict adverse health outcomes, including rising multimorbidity, health care resource utilisation, disability in activities of daily living, nursing home admission, and earlier mortality [
2]. At the same time, mobility can be seen as a much more complex concept that goes beyond individual health and physiological characteristics and may refer to mobility capabilities within social and urban contexts. The idea of having the right to mobility has been fundamental to modern Western citizenship and is expressed in many legal and government documents, including the Universal Declaration of Human Rights. Still, the right to travel and move freely has been highly uneven across countries, regions, and groups of people within countries. Thus, mobility as a resource is always achievable in different ways for different groups of people. As a right and a resource, mobility can also be understood as a cultural and social value that is pursued for various reasons. The discussion of mobility in old age is closely linked to issues of physical (in)capability and physical movements from the medical point of view, without giving profound consideration to the social dimension in tactile–kinaesthetic feelings that phenomenologists have seen as vital for meaningful human life [
5].
Given the ongoing demographic shift, the importance of mobility should be considered by policy makers and professionals in the broader context of active and healthy ageing frameworks. Evidence strongly supports that the capacity of an ageing individual to maintain an adequate and active mobility is associated with their independence and good health [
6]. A Swedish study correlated data on health and distance to the bus network among people over 75 years, and found out that mental health scores are significantly lower among those living far from the closest bus stop and never or seldom using public transport [
7]. Mobility is associated with social participation, stronger social networks, and independence of older people [
8,
9], which in turn are factors leading to lower morbidity and mortality rates and a higher quality of life [
10]. In this respect, stronger social networks supported by effective, efficient, and accessible mobility services might ensure that older peoples’ wished mobility is realised [
11,
12].
There is a common concern, however, that the current characteristics of the public transport sector might not meet the needs of older people. The traditional concept of efficiency within the public transport framework might collide with the special needs of older travelers, who for instance could request short distances by a more spread bus stop network and/or slower travelling paces [
13,
14]. Therefore, in order to adapt public transport characteristics to the changed mobility needs of older travelers, evidence on their preferences and on factors influencing their use and opinion of public transport is of interest for policy makers and professionals responsible for development of the new strategies of the sector.
In this respect, access to public transport services is the first prerequisite for their actual use [
15]. Therefore, investigation of the multiple factors associated with access to and use of public transport services among the older population is of paramount importance to inform policy [
13].
In general terms, accessibility can be defined as “the extent to which transport systems enable individuals to reach activities or destinations by means of a combination of transport modes” (Geurs and van Wee 2004). However, as there are different definitions of accessibility, there are also several computation methods which could possibly be employed to take it into account. Essentially, the main factors involved are distance, time, and cost. Isodistance (same-distance) maps represent areas that are equidistant from a specific point, typically visualised using buffers or radiuses around points. Isochrones (same-time), instead, represent areas that can be reached within the same amount of time, rather than distance, and focus on factors such as road networks congestion, traffic conditions, and transportation modes. Lastly, economic distances take into account not only physical distance or travel time but also economic factors, such as the cost of travel. It is interesting to notice how the cost of travel might include elements outside the conventional costs (e.g., tolls, fuel costs, or other expenses associated with travel), such as the effort required for mobility for older, disadvantaged or disabled people.
It is important to notice, moreover, that the personal characteristics of specific groups of people (e.g., elderly, vulnerable, school pupils, etc.), or of the area (walking surface, green spaces, etc.) are playing a growingly important role in the literature, in addition to the conventional elements of accessibility discussed above.
Methodology-wise, the distance to a bus stop from home can be considered a good proxy measure for the level of accessibility to public transport of older people. Despite the relevance of this measure, most of the studies on public transport mobility in older age collected data on this dimension using only self-reported measures. Self-reported measures, however, might be biased by several confounding factors, such as age and health conditions of the respondents.
Accessibility data can be obtained from a variety of sources, starting from government and institutional open data portals, transportation authorities, who often release data related to public transit schedules, routes, and infrastructure, non-profit organisations, and research institutions. In the case of Sweden, a strategy for Spatial Data Infrastructure (SDI) has been developed since 2006; a national web portal (
www.geodata.se (accessed on 25 November 2023)) works as a node containing a large number of datasets being stored and maintained by the responsible organisations [
16]. The University of Lund also has a portal dedicated to geographical data (
https://www.gis.lu.se/gis-centre/geographical-data, last accessed on 25 November 2023).
During the last decade, the emergence of Volunteered Geographic Information (VGI), geographic data provided voluntarily by individuals (Goodchild, 2007), has made it possible to create new datasets and to enrich or complement official sources of data. OpenStreetMap (OSM) is an open-source mapping platform that allows users to contribute and access geographical data, including information related to roads, points of interest (POIs), and more. Operationally, the availability of GIS software, VGI, and optimised routing algorithms have made the computation of walking distance a growingly accessible operation.
User-generated geographic data typically have advantages in terms of free use, timely creation, high detail in local areas, and site-specific crisis management [
17]. A large amount of research has focused on VGI quality assessment, classifying methods into two major strands: comparisons with authoritative/official reference datasets and internal quality assessment based on indicators of VGI quality [
18]. When health studies are concerned, objectively measured distances to target destinations are a major advantage in complementing self-reported distances.
In order to contribute to the debate in this area, the SEBEM-GIS (Socio-Economic Benefits of Elderly Mobility-GIS) study aimed to investigate whether health and socioeconomic characteristics of older individuals are associated with the perceived distance to the bus stop in urban public mainstream services. SEBEM-GIS tested whether specific subjects’ characteristics might be associated either with overestimated or underestimated distance perception. Answering this question could be very useful for policy decision makers in terms of the perspective of optimizing public transport services, and focusing on possible education and active participation of the general population.
2. Data and Methods
2.1. The SEBEM-GIS Study
This paper draws on data from the SEBEM (Socio-Economic Benefits of Elderly Mobility) project, funded by the Centre for Ageing and Supportive Environment (CASE) at Lund University (Sweden) [
7]. SEBEM aimed to investigate several dimensions related to public transport use in old age. Its specific aims included the evaluation of mobility patterns among people above 75 years old and related socioeconomic correlates and the analysis of the costs for mobility services provision among three Swedish municipalities (Göteborg, Lund, and Helsingborg).
A large cross-sectional survey among older citizens (75 to 90 years old) was performed in those cities. The three cities were selected as they represent urban contexts homogeneous in terms of share of older population, but heterogeneous in terms of availability of mobility options. In particular, Göteborg has invested considerably in the last 20 years in the development of Flexlinjen, an advanced flexible (demand-responsive) mobility service for older people [
19], which is absent in Lund and Helsingborg. Lund, instead, is characterised by a relevant share of educated older population, as a consequence of its status of “university town”. Göteborg is also the biggest of the cities considered. Even if an in-depth analysis of the morphological characteristics of the cities is out of the scope of this study, the three urban areas are rather flat and similar in terms of elevation (see elevation maps in
Supplementary Materials).
The structured questionnaire used in the survey included both instruments already validated in the Swedish context for addressing complex constructs (e.g., health and wellbeing) and study-specific items developed by the study team to retrieve information on specific aspects of social activities (e.g., visiting friends and relatives) and mobility (e.g., use of a private car) [
20]. This study obtained ethical clearance by the Regional Ethical Review Board in Lund, Sweden (DNR 2015/30). An extension of the previous ethical clearance was applied for an extension of the original protocol. Ethical clearance was granted by the Regional Ethical Board of Skåne (EPN DNR 2018/368).
A list with names of addresses (and national id-number) of the population aged between 75 and 90 years in the three study locations was retrieved from the municipalities using general population registries. The persons were randomly selected based on a population list (obtained from the municipalities under signing a confidentiality agreement) of all residents aged 75–90 in the respective study area, after all those living in special nursing homes were discarded with the help of staff from the respective municipality. Age and residential location were the only inclusion criteria. Participants were then randomly selected using a routine created using the software Microsoft Excel (Microsoft Corporation, Redmond, DC, USA, 2015). Excel was used in the following manner: a random number up to 12 digits was created and assigned to each citizen by the municipalities. The citizen list was then ordered by this random number. The first names of each city list were then selected for participation in this study, according to the planned quotas. A final list of 3600 participants was extracted from the three cities (1800 from Göteborg, 900 from Lund and Helsingborg, respectively) and participants received the survey questionnaires, together with the informed consent, directly at their home addresses.
The first mailing of the postal survey to the subjects was conducted on 6–8 May 2014, with a cover letter inviting them to participate in the current research project. Participants who did not respond within 3–4 weeks received a reminder with a new questionnaire. Out of the 3600 questionnaires sent to the study sample, 2411 were returned. The overall response rate was thus 67%, ranging from 68.3% among those aged 75–80 to 66.8% and 63.7% among those aged 81–85 and 86–90, respectively. Response rates were higher in Lund (73.7%) compared to Helsingborg (65.4%) and Göteborg (64.4%). All data referred to individuals have been stored in a physical memory device inside a secure room in the basement of the Department of Transport Studies of Lund University.
2.2. Computation of Walking Distance Variable and GIS
Originally, distance to the closest bus stop was retrieved directly from the participants in the SEBEM project using a self-reported categorical item (classified in “less than 200 m”, “between 200 and 500 m”, and “more than 500 m”). In order to overcome the limitation by this way of measuring, GIS technology and geocoding and routing algorithms based on OpenStreetMap data (
www.openstreetmap.org, last accessed on 25 November 2023) were used to compute walking distances between bus stops and study participants’ home addresses. The three municipalities and the transport authorities of the area (Skånetrafiken) provided data regarding the bus stops available, including latitude-longitude coordinates, and respondents’ home addresses have been geocoded. For each pair of coordinates, the shortest walking distance was computed using the Graphhopper Directions API (
https://www.graphhopper.com/, last accessed on 25 November 2023) to perform routings. In all, a total of 2398 individuals answered the SEBEM questionnaire. However, the algorithm could not compute the walking distance for some address pairs, generating 334 missing values. Moreover, the algorithm generated some unrealistically long walking distances, e.g., when pedestrian routes could not be found across gardens or parking lots, or under patios, etc. (See example figure in
Supplementary Material S3). Nevertheless, the pattern of missing values was unbiased among the areas of study, reflecting proportionally the total number of respondents in the three cities (48% Göteborg, 27% Lund, and 25% Helsingborg) (cf.
Table 1).
To enrich the analysis, and to double-check the accuracy of the estimates, we also computed straight-line distance using the OpenStreetMap base of data and STATA. These Euclidean (straight-line) distances have been compared with Graphhopper walking distances. Since walking paths tend to mimic—whenever possible—shortest straight-line paths, we treated overly high discrepancies between walking and straight-line distances as an indication of bias. Overall, the discrepancy between the two measures of distance was 350 m or more for 67 subjects (3.25% of the total), while 29 respondents have a bias of 500 m or more (1.41%). In order to replace unrealistically high routes, straight-line distances have been used for the subjects with a bias above the 350 m threshold, being aware that this is just a rough approximation (see example map in
Supplementary Materials).
2.3. Creation of Dependent Variable
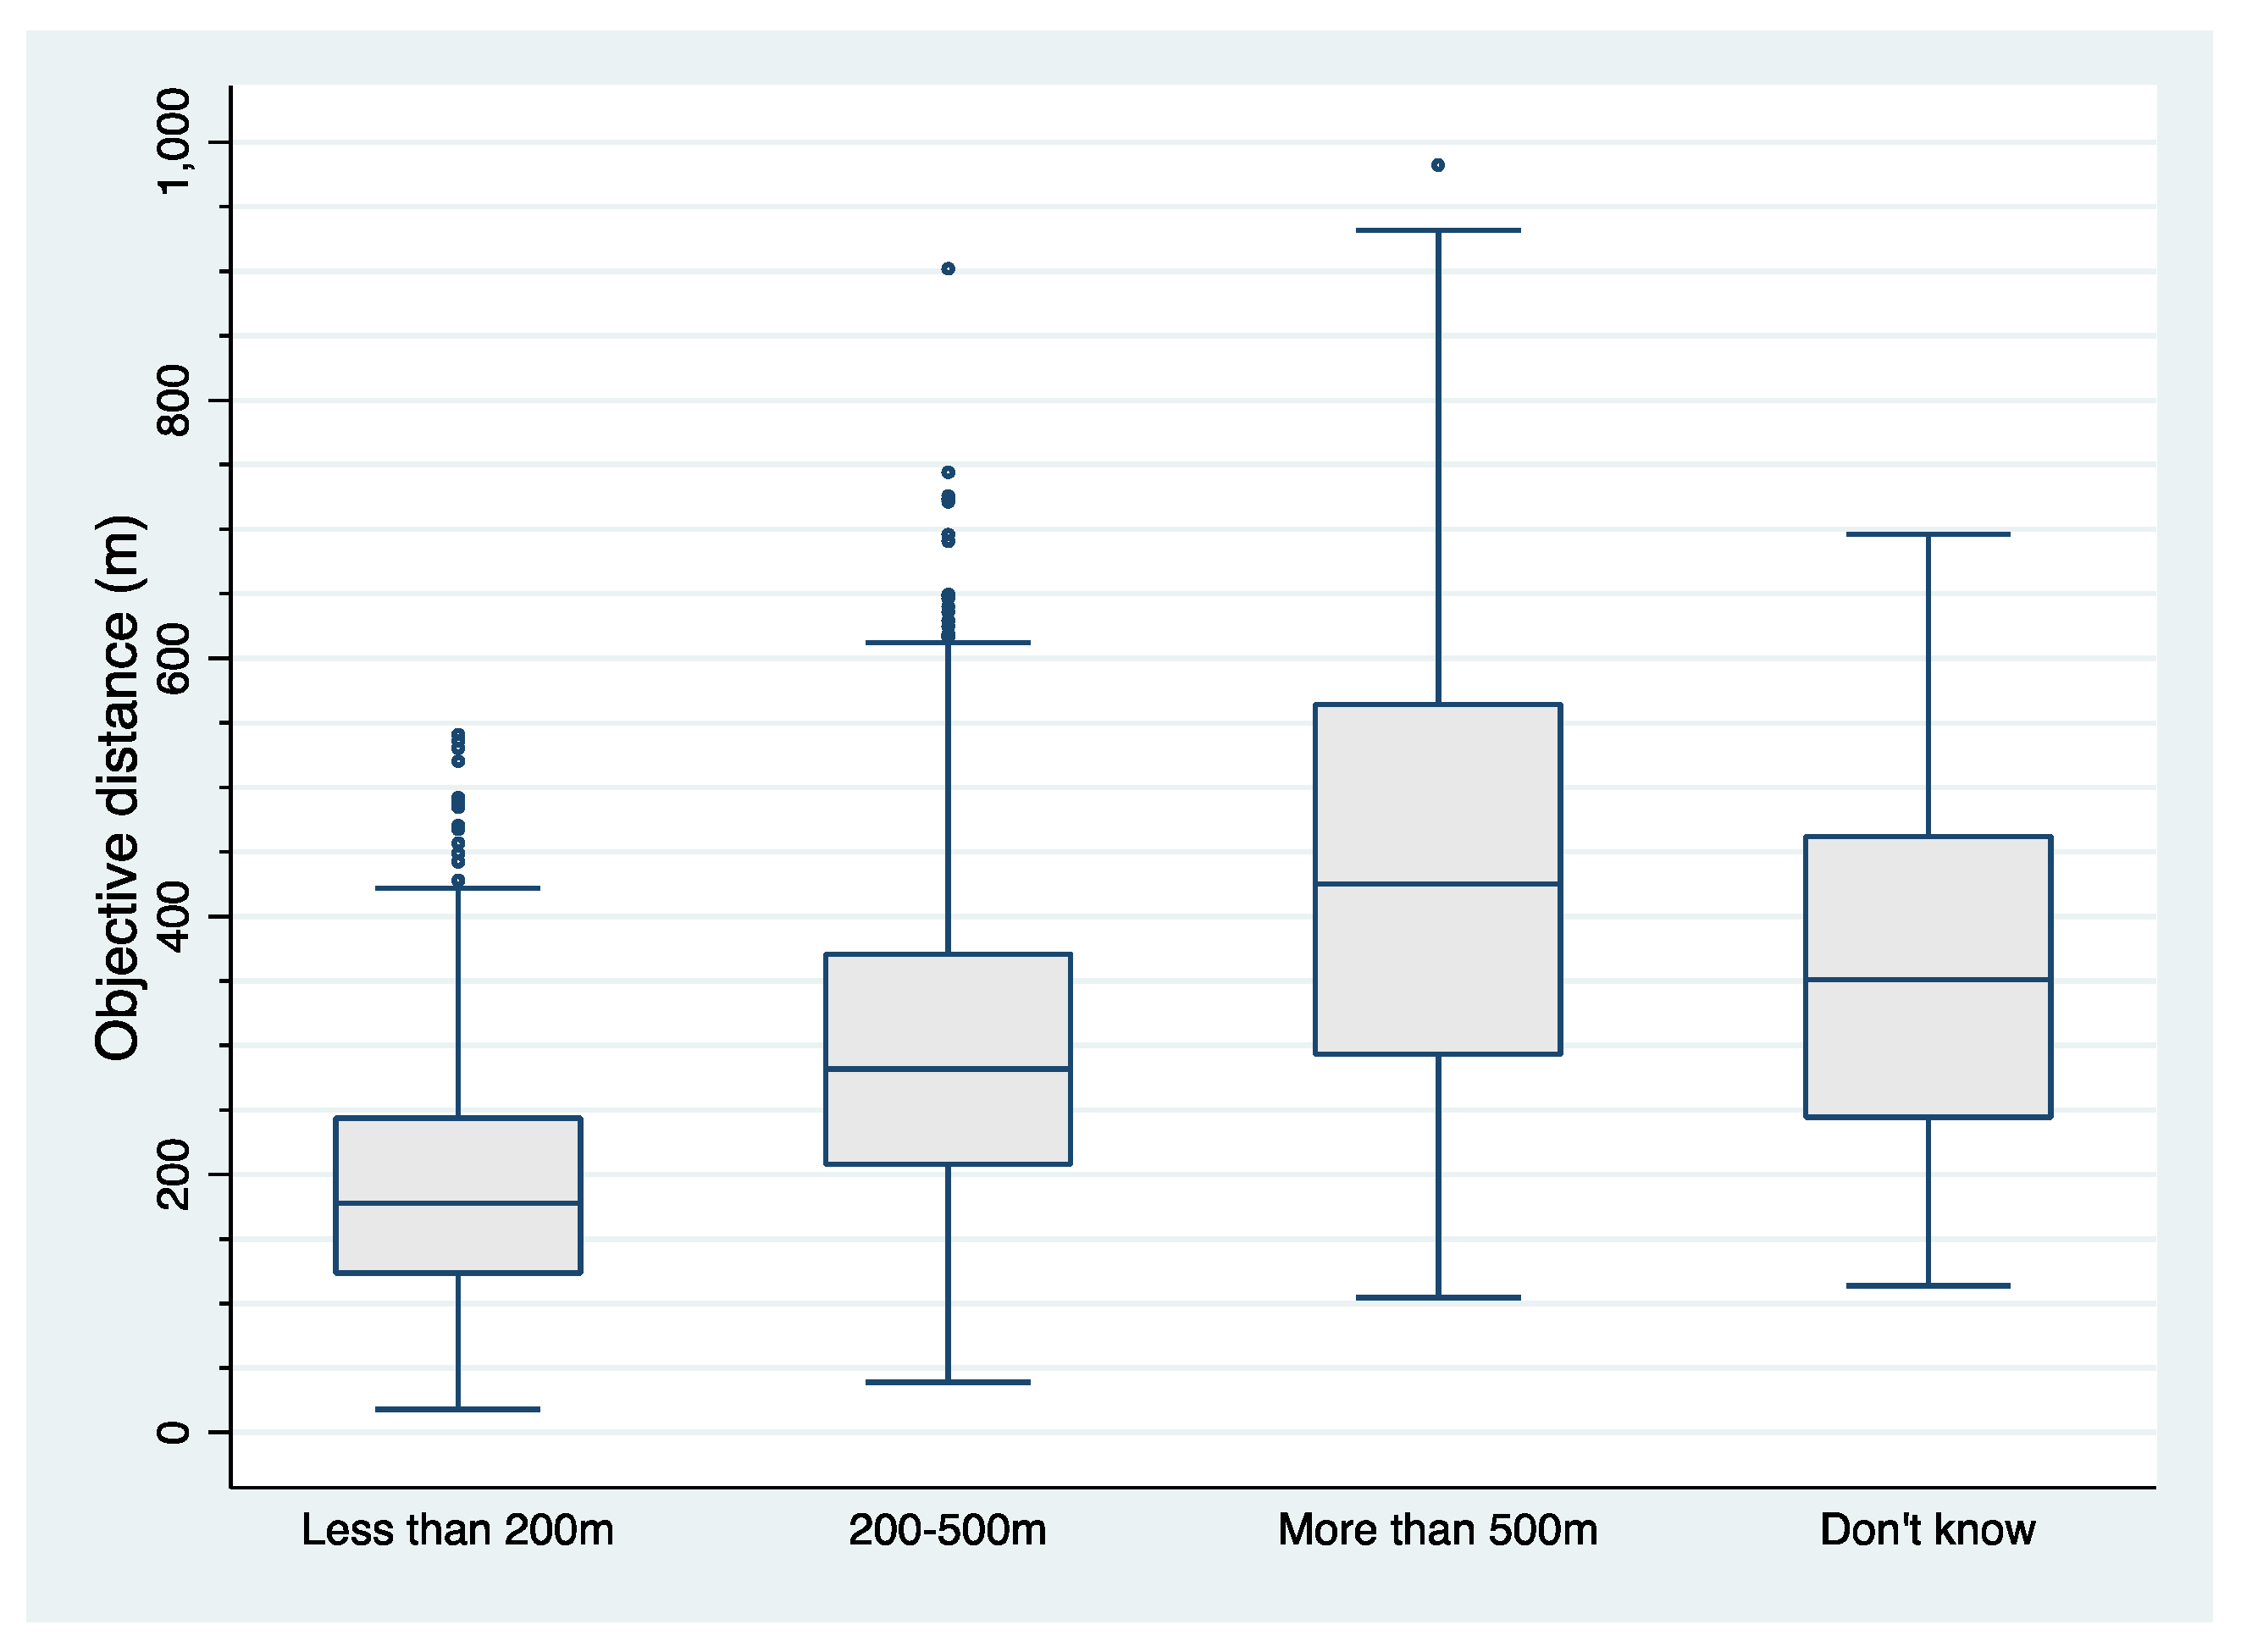
The dependent variable of this study was created by comparing estimated vs. GIS-measured distance. We classified study participants in three categories, according to the fact that they “underestimated” (e.g., live farther than estimated), “correctly estimated”, or “overestimated” (e.g., live actually closer than reported) the distance of the closest bus stop to their home. The criterion adopted to define people who wrongly estimate their distance to bus stops was when they actually lived outside the distance band they estimated they lived in (“less than 200 m”, “between 200 and 500 m”, and “more than 500 m”). Seventy respondents who reported not being able to classify their distance to bus stops were excluded from the regression analysis (resulting in N = 1994).
2.4. Statistical and Spatial Analysis
As the data used came from different sources, a preliminary process of cleaning and harmonisation was performed, together with outliers and distributional inspection. In particular, the data from the health survey were integrated with those containing the distances calculated by the algorithm. In this phase, several distance variables and perception variables were also constructed, and recoded in categorical form. Outcome variables’ distribution was inspected with boxplots highlighting outliers, and with Q-Q plots to assess normality. Outlier points in terms of actual distance were not omitted since their effects were attenuated after recoding to categorical variables.
Then, the relation between perception of distance to bus stops and explicative variables was analysed with bivariate tests. Specifically, all the categorical variables were tested using chi-square tests across the three groups identified as correct/under-/over-estimate (See
Table 2 and
Table 3). For continuous variables (PCS12 and MCS12), the probabilities are referred to a non-parametric Kruskal–Wallis test.
Regarding variables, we assessed the Physical Composite Score (PCS) and the Mental Component Score (MCS), both ranging from 0 to 100, using the SF12 Health Survey. Other variables collected in order to characterise the study population included gender; place of birth; level of education; and living arrangements.
The questions to assess the engagement of participants in social activities have been retrieved and partially modified from the Omnibus Survey of the British Office for National Statistics (Banister and Bowling, 2004). Study participants have been asked the following question: “How often have you participated in the following social activities during the last four weeks?” The listed social activities were (slightly grouped) the following: “Senior get-togethers“, “Associations/clubs”, “Classes, libraries, and lectures”, “Church/religious activities”, “Cinema, theater, concerts”, “Voluntary work”, “Sports, gym, dance”, “Meet relatives/friends”. The answers were arranged on a 5-grade scale: “Daily”; “Several times a week”; “Once a week”; “Once a month”; “More rarely/never”. A study-specific social score index was created to obtain a single, easy-to-read measure indicating the intensity of engagement of the older person in a range of possible social activities. The score (ranging from 0 to 8) simply counts the number of social activities in which the person is engaged at least weekly. This means that a person meeting weekly his relatives and attending daily the city library was categorised as having a social score equal to 2.
We also assessed the frequency of walking more than 500 m, using the same 5-graded scale. This threshold has been chosen as it corresponds to approximately 10 min of walking activity per day, a meaningful time span for achieving health benefits suggested by the WHO (2010).
Several study-specific questions addressed the domain of mobility and access to transport options. Respondents were asked about their possibility to have access to a private car (response categories were “Yes, always”, “Yes, sometimes”, and “Never, or almost never”); their use of private car and public transport (also using the 5-graded scale used for social activities); and the distance between the nearest bus stop from their home (“Less than 200 m”, “About 200–500 m”, “More than 500 m”, “Do not know”).
Finally, a multinomial logistic regression model was used to investigate factors associated with an underestimated or overestimated perception of distance, controlling for the influence of potential confounders. The exclusion of respondents who could not estimate their distance and the interactions among independent variables caused a decrease in the final number of valid observations of the statistical model (N = 1794). Post-estimation diagnostics were conducted by checking normality of residuals and measuring the information criteria. All analyses were performed using STATA, version 14 (Stata Corp., College Station, TX, USA, 2010).
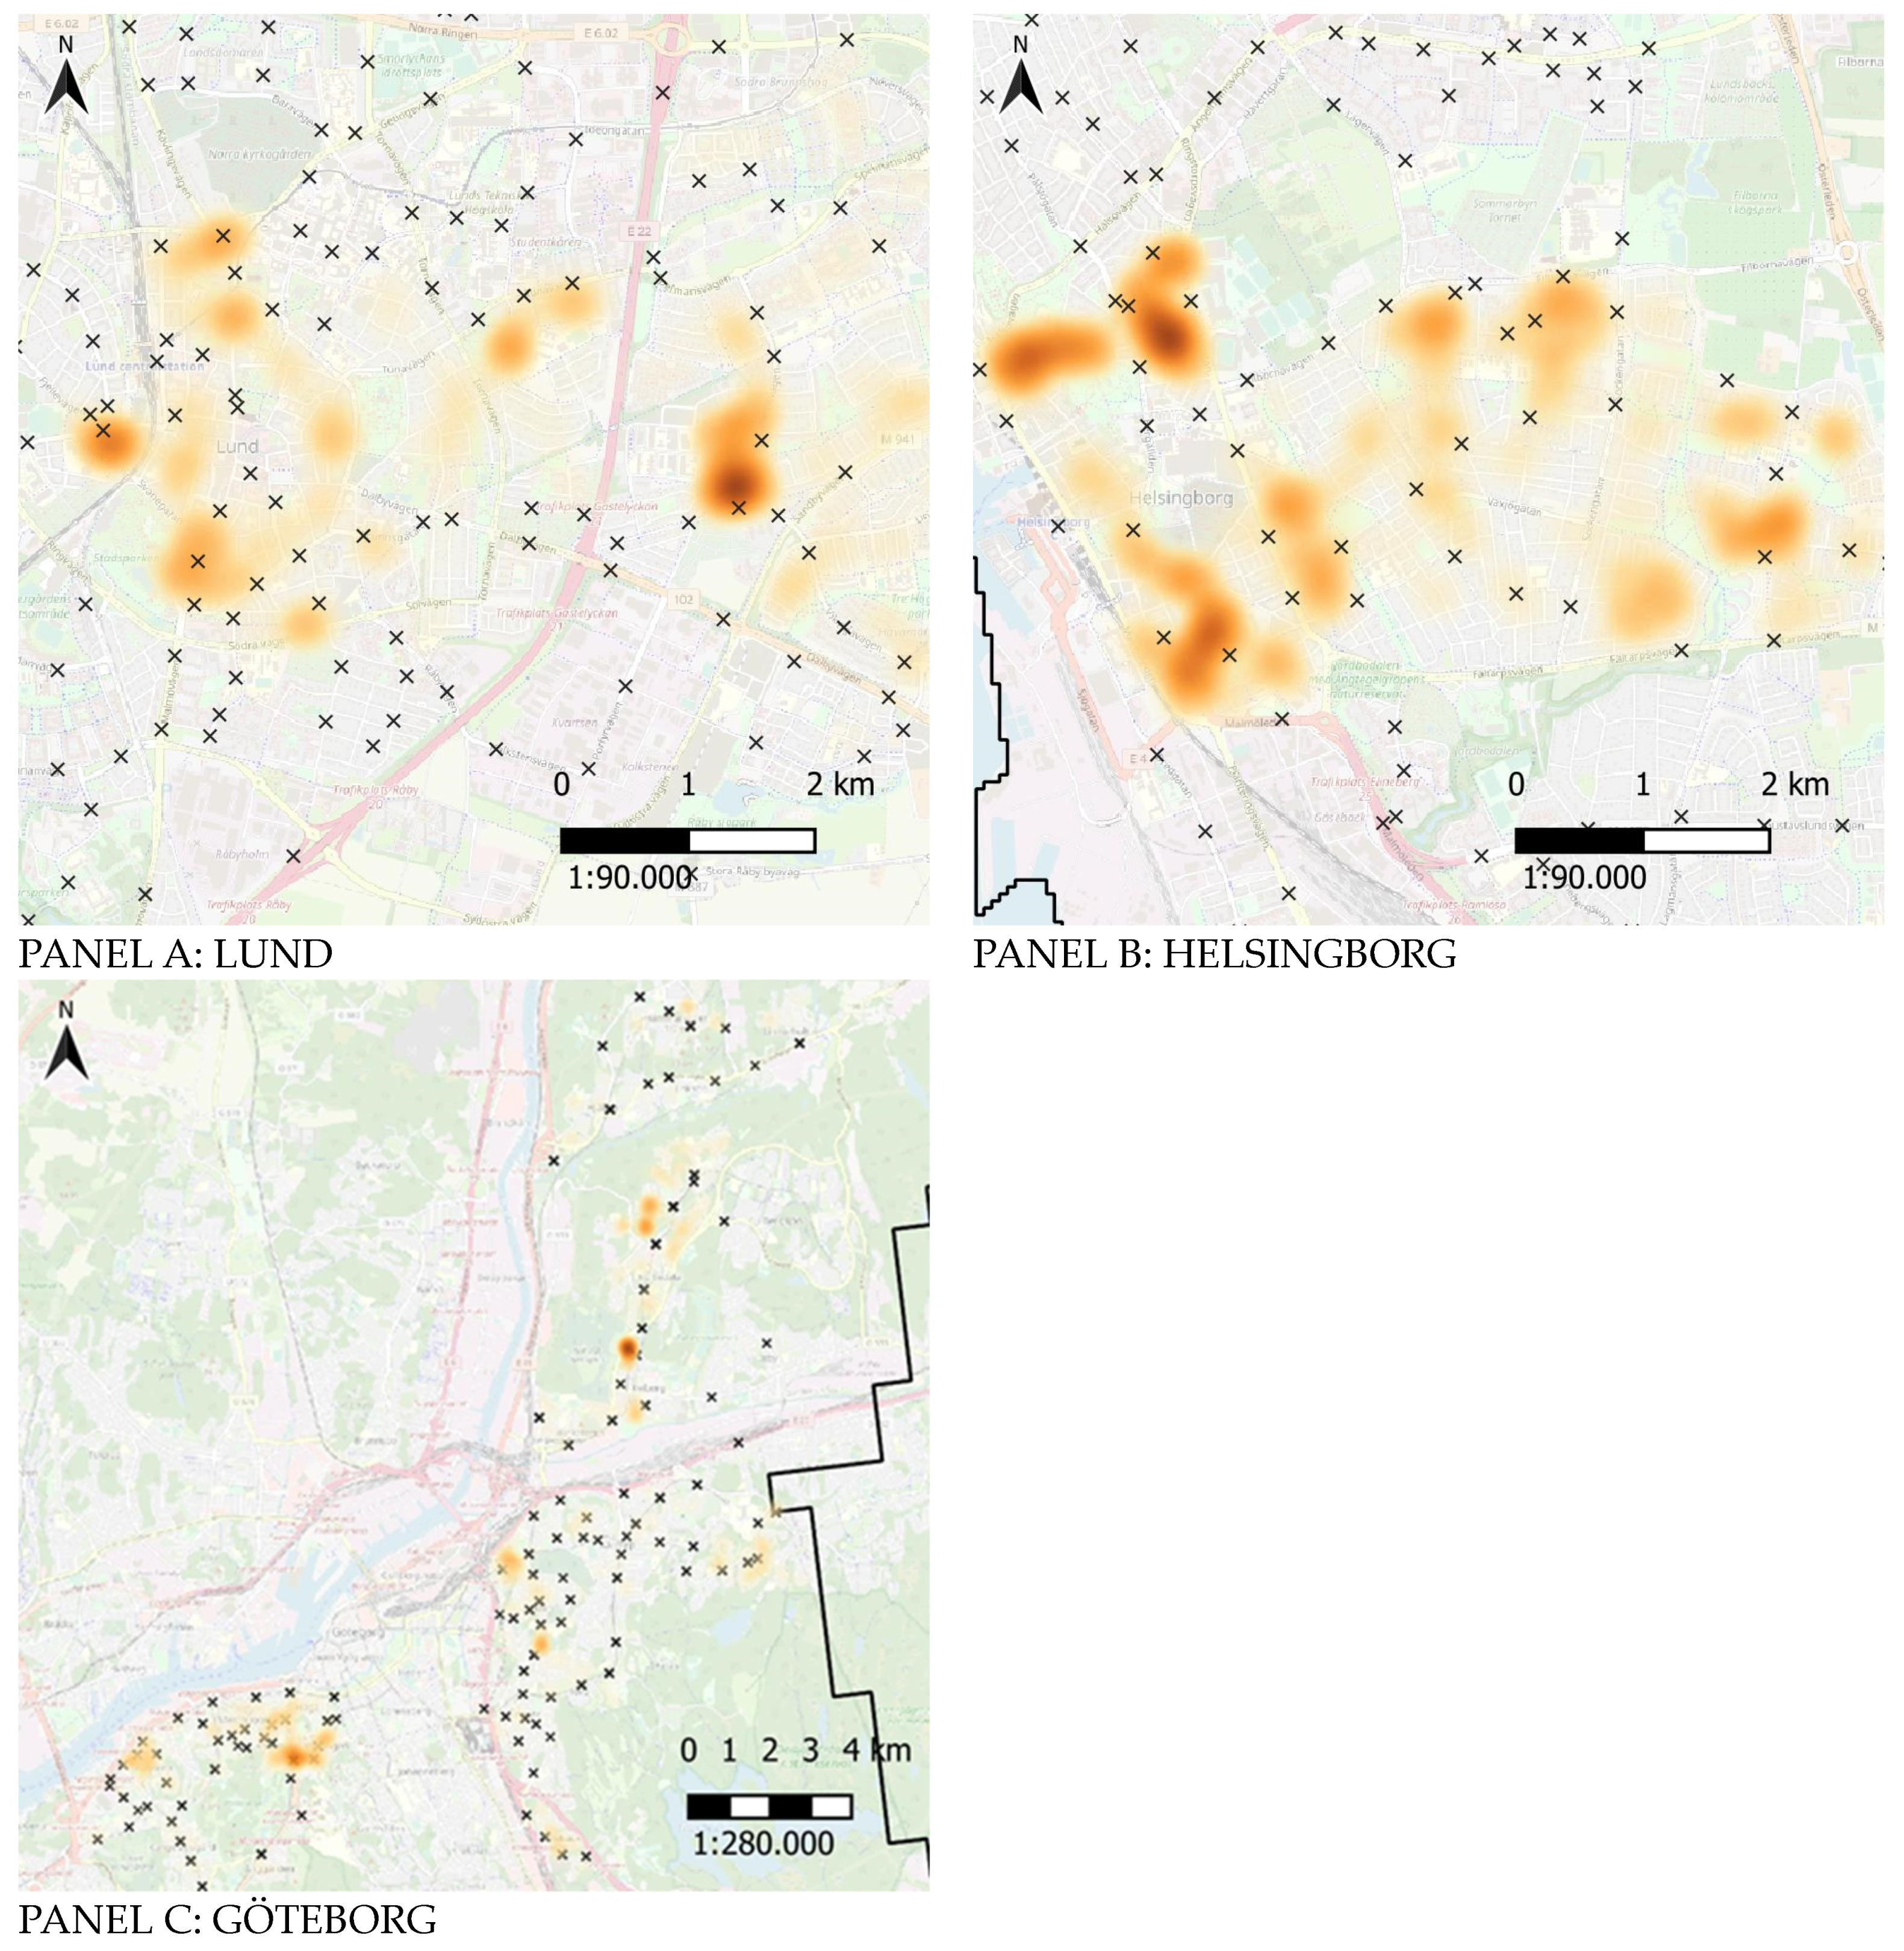
In order to investigate the spatial structuring of the data, and to validate the statistical analysis, some specific spatial analyses have been carried out (see results in
Supplementary Materials). First, the location of respondents in the three towns have been mapped by means of kernel density estimations (KDE) [
21], superimposed to point pattern of bus stops. Then, specific tests for spatial autocorrelations have been carried out, namely global Moran’s I [
22] and Local Indicators of Spatial Association (LISA, Anselin, 1995).
Spatial autocorrelation measures how close objects are in comparison with other close objects. Moran’s I can be classified as positive or negative; a Moran’s I close to zero indicates the absence of spatial autocorrelation, so a relative spatial independence of geographical units. Global statistics, referring to the entire study area, only indicate if the spatial configuration is overall autocorrelated, but does not allow us to understand which units are autocorrelated to the others, or in what areas they are located. However, LISA statistics allow us to calculate spatial correlation for each area of the study region and to assess whether a statistically significant difference exists, comparing the results with a random distribution. For a detailed description of spatial methodologies, see O’Sullivan and Unwin [
21] and Anselin [
23].
4. Discussion
This study investigates the difference between perceived (survey-reported) and real walking distance (GIS-computed) and also analyses what socioeconomic characteristics of older individuals are associated with the perception of the distance to the closest bus stop to their home. First of all, our findings are important for the planning sector of society in that they show a discrepancy between real and self-reported distances in this study focusing on distances to the closest bus stop. Another strength of this study worth mentioning is that the response rate of the SEBEM study was high, which increases its reliability [
20].
An amount of 60% of respondents estimated the distances correctly. Among the others, 16.4% (327) overestimated the distance meaning that they estimated the distance to be longer than in reality. Individuals in this group are associated with higher age and poor health. Furthermore, there is an overrepresentation of people born abroad in this group. From a societal point of view, these findings are important since they highlight a vulnerable group which have a risk of no longer finding public transport as a choice for travelling. This puts a pressure on society to seriously take the importance of shorter distances into account in urban transport planning in order to integrate all citizens and to maintain mobility and an active life for an ageing population. A positive finding in this respect from this study is that the group who underestimated the distances to the closest bus stop are associated not only with frequent use of public transport but also with higher satisfaction with the walking environment. Therefore, planning for an accessible public transport system must also put the highest priority to the walking environment on the neighbourhood level in order to keep this vulnerable group active.
According to scientific literature, the main factors that influence the correct perception of distance are different. Our study showed results in accordance with previous studies since an underestimation was influenced by the walking environment in the neighbourhood like it has been found by Cepolina et al. regarding the comfort of pedestrian facilities (width, surface, crossings, obstructions, traffic density, etc.) [
24]. Moreover, physical condition can also influence the correct estimation of waking distance since the physical composite score showed a statistically significant association with overestimation and this result recalls the importance of physical abilities as found by previous studies [
25,
26].
Living far from the bus stop is associated with socioeconomic characteristics. Annual income, living alone or in a family nucleus, job situation, and other demographic characteristics of individuals are associated with their residential choices. As a result, some neighbourhoods of cities may be occupied by subjects with homogeneous characteristics [
27]. As a consequence, personal characteristics of the respondents were reflected in the distance between their homes and the stops of public transport. In this regard, it is an interesting finding that people with other backgrounds than Swedish tended to overestimate the distances to the closest bus stop. Possibly, the subjects with less knowledge of the local environment might have a biased image of the surrounding space and, consequently, of real distances. Likewise, those reporting they did not use public transport due to long distances to the bus stops also had a tendency of overestimating the real distances. Evidently, those subjects gave a strong weight to the walking activity and tended to weight distances more.
Interestingly, respondents who reported being very satisfied with the walking opportunities of their neighbourhood tend to underestimate their distance to the bus stop. The perception of distance is in fact strongly influenced by the mobility habits of the subjects. In particular, those who are satisfied with the walking environment in their neighbourhood (such as the presence of parks, etc.) tend to underestimate the distance, i.e., they do not perceive much effort in walking for longer distances. That is a relevant indication in terms of urban planning, showing that a comfortable setting may be used as a factor in promoting active lifestyles and enhancing sustainable transport. This result also confirms that the nature of the area in terms of comfort and adequacy of features plays an important role.
This study is conducted in three cities with similar socioeconomic backgrounds but with some differences in size and in the way mobility services for older people are treated and conducted in the respective municipality. Göteborg, situated along the Göta River, is characterised by a mix of urban and waterfront areas with a series of canals, contributing to its distinct geography. It has pedestrian-friendly central areas, with a well-maintained and extensive cycling infrastructure. Public transportation includes trams, buses, and ferries, providing efficient connectivity throughout the city. The city centre is compact and easy to navigate on foot. Lund has a pedestrian-friendly city centre with narrow streets and historic buildings: due to its smaller size, many residents and students prefer walking or cycling to move around the city. Situated in the southern part of Sweden, Helsingborg is located on the Oresund Strait; it is a key transportation hub, offering ferry connections to and from Danmark. The city has a mix of historical and modern architecture. Its waterfront areas, including the marina, are often explored on foot by residents and visitors.
There are also differences between the three cities concerning background variables. For example, Lund is characterised by a relevant share of educated older population, as a consequence of its status of “university town”, and Göteborg has a high proportion of people born abroad—Göteborg is also different in terms of population size, being the second biggest city in Sweden.
Nonetheless, this study has some limitations, mostly dependent on the algorithm based on OSM data, which can sometimes be imperfect when routing and distance measurements are concerned. First, OSM data extent and quality are dependent on the overall availability of contributors and features in an area [
17]. Secondly, OSM routing can be inconsistent for some cases, thus not computing walking distances for a subset of the cases (see
Section 2.2 and
Figure S10 in the Supplementary Materials). It should be acknowledged that mapping guidelines exists in OSM to take into account the roads dedicated to pedestrians (tag: highway = pedestrian) or, on the contrary, where walking might not be safe or recommended: for example, if the road has sidewalks (tag: sidewalk = none), or if it has been classified as foot = yes. In spite of that, the completeness tags to this respect are not perfect, and actual walking behaviours cannot be determined in many parts of the map, leaving space for inconsistent cases to arise.
At present, the computed walking distances are not weighted in terms of walking barriers, tunnels, surface conditions, traffic, and other road attributes that influence the perception of distance [
24,
28]. Taking into account those occurrences and topography, however, may represent a promising technical extension of the current study, as well as producing a more sophisticated algorithm to take other morphological features into account. In terms of topography, the general differences among cities are only considered in the statistical model using dummy variables. This is a simplistic approach. In this sense, the dummy variables are a basic way to control for the diverse characteristics of the cities, and especially to take the largest demographic dimension of Göteborg into account, with respect to Lund and Helsingborg. Other differences, such as the general topography of the areas (steepness, etc.) remain untreated (see
Supplementary Materials for descriptive elevation maps).
It should be noted, also, that both the objective and subjective measures used in this study are relative to the nearest bus stop to peoples’ homes, even if those are not necessarily the ones used by the respondents, who may use other stops because of personal or context-related features (i.e., bigger hubs, safer neighbourhoods, stops including shops and other services or routes with destinations of interest, etc.). Respondents’ choices may be influenced also by their perception of time needed to walk to the bus stops, which, even if related, may be different from the perception of distance [
29]
From a technical point of view, the results of this study allow us to overcome an issue common to spatial analyses, i.e., the Modifiable Area Unit Problem (MAUP) [
30]. When the centroid of area units (such as neighbourhoods) are used to compute population’s walking distances to bus stops, the underlying assumption is that all the residents from the same neighbourhood have the same distance to the bus stops [
31]. That measure of distance is less accurate than the point-to-point distance used in this study, which from a methodological perspective allows us to test the level of MAUP in a similar way as the perceived distance has been validated. In addition to the spatial perspective, the existence of possible spatial autocorrelation has been tested (see results in
Supplementary Materials). Without going deeply into this topic, when looking at the distance from respondents’ homes to bus stops, the global autocorrelation seemed to be quite low (Moran’s I is around 0.3 on average for the three cities). Interestingly, however, some clustering appeared at the local level when computing LISA’s indicators. The results for Göteborg are easily interpretable: the “blue” clusters of low distance to bus stops are evident in the central part of the city, while the “red” cluster is dispersed across peripheral areas. Similar evidence arose for Lund and Helsingborg.
The results of this methodological contribution suggest that evidence based on self-reported measures only should be treated cautiously. Nevertheless, considering the limitations still present in open-data-based routing algorithms, the best indication is to combine the subjective with the objective measure of distance. Having the possibility to combine the two measures appears as a sound strategy to overcome the limitations associated with each single measure.


 ,
, 


