Article

Applying a Geographic Information System and Other Open-Source Software to Geological Mapping and Modeling: History and Case Studies

by
Mauro De Donatis
* and
Giulio Fabrizio Pappafico
Department of Pure and Applied Sciences, University of Urbino Carlo Bo, 61029 Urbino, Italy
*
Author to whom correspondence should be addressed.
Geomatics 2023, 3(4), 465-477; https://doi.org/10.3390/geomatics3040025
Submission received: 24 August 2023 / Revised: 28 September 2023 / Accepted: 30 September 2023 / Published: 13 October 2023
(This article belongs to the Special Issue GIS Open Source Software Applied to Geosciences)

Abstract

:
Open-source software applications, especially those useful for GIS, have been used in the field of geology both in research and teaching at the University of Urbino for decades. The experiences described in this article range from land-surveying cases to cartographic processing and 3D printing of geological models. History of their use and development is punctuated by trials, failures, and slowdowns, but the idea of using digital tools in areas where they are traditionally frowned upon, such as in soil geology, is now rooted in and validated by applications in projects of various types. Although the current situation is not definitive, given that the evolution of information technology provides increasingly faster tools that are performance-oriented and easier to use, this article aims to contribute to the development of methodologies through an exchange of information and experiences.

1. Introduction

The surveying and production of modern geological cartography trace back to the realization of William Smith’s 1819 geological map of England [1]. Although there are variations due to different types of geological units, the survey method is classically constituted by annotation with symbols, lines, and colors on basic topographic maps, in addition to data collection, information, and working hypotheses in field notebooks [2]. The compass, the clinometer, and the altimeter were standard tools for geolocation and data collection up until a few years ago.
For the past couple of decades, with the growing availability of tools and the development of information technology, even geologists have had to engage with digital technology [3]. Despite the understandable resistance of those who have used the traditional method for years [4], currently, the official maps of leading geological services are surveyed using digital tools and methodologies in whole or in part [5,6].
The surveying and elaboration of geological cartography are among the most characterizing subjects of the training and profession of a geologist. For some time, therefore, courses on digital geological surveying have been present in university courses [7]. New generations of digital native geologists have fewer preconceived limitations and, therefore, are more open-minded to and even attracted to digital technologies. GIS software, being an open-source software, is particularly appreciated for its availability in the studio and for professional use.

2. Methods

2.1. Development of Digital Field Mapping Techniques at the University of Urbino

2.1.1. The Birth of an Idea

The use of GIS for geological cartography began in the 1980s with the commercial software ARC/INFO [8], requiring a time-consuming training process to learn how to use it. Although this way of working has allowed us to reach new frontiers in geological data and the treatment of information, it has discouraged more traditional geologists. A few years later, when new software and hardware allowed a smoother approach to their use, many geologists started using GIS in the laboratory, digitizing data collected in the field with the traditional method of mapping with paper and pencils. The idea of using GIS directly for fieldwork arose in 1999 when the Fujitsu Stylistic LT pen computer [9] became available.
Initial experiences in the field were very frustrating. The transport bag broke at the beginning of the work, the screen had low brightness and legibility, the pen was unresponsive, and the software was less user-friendly than it is today (Bentley Microstation Geographics [10]), making geological surveying with digital instruments difficult.
A few years later, Microsoft released a tablet PC for the Windows XP operating system. Some brands (HP, Acer, etc.) started manufacturing and distributing convertible or slate tablet PCs.
The stylus input tool maintained the traditional way of mapping in the field (pencil on paper) but through digital devices. The advantages were and are numerous, such as greater precision, fieldwork control, separation among raw data and interpretation, group work simplification, quantification of uncertainty, etc.

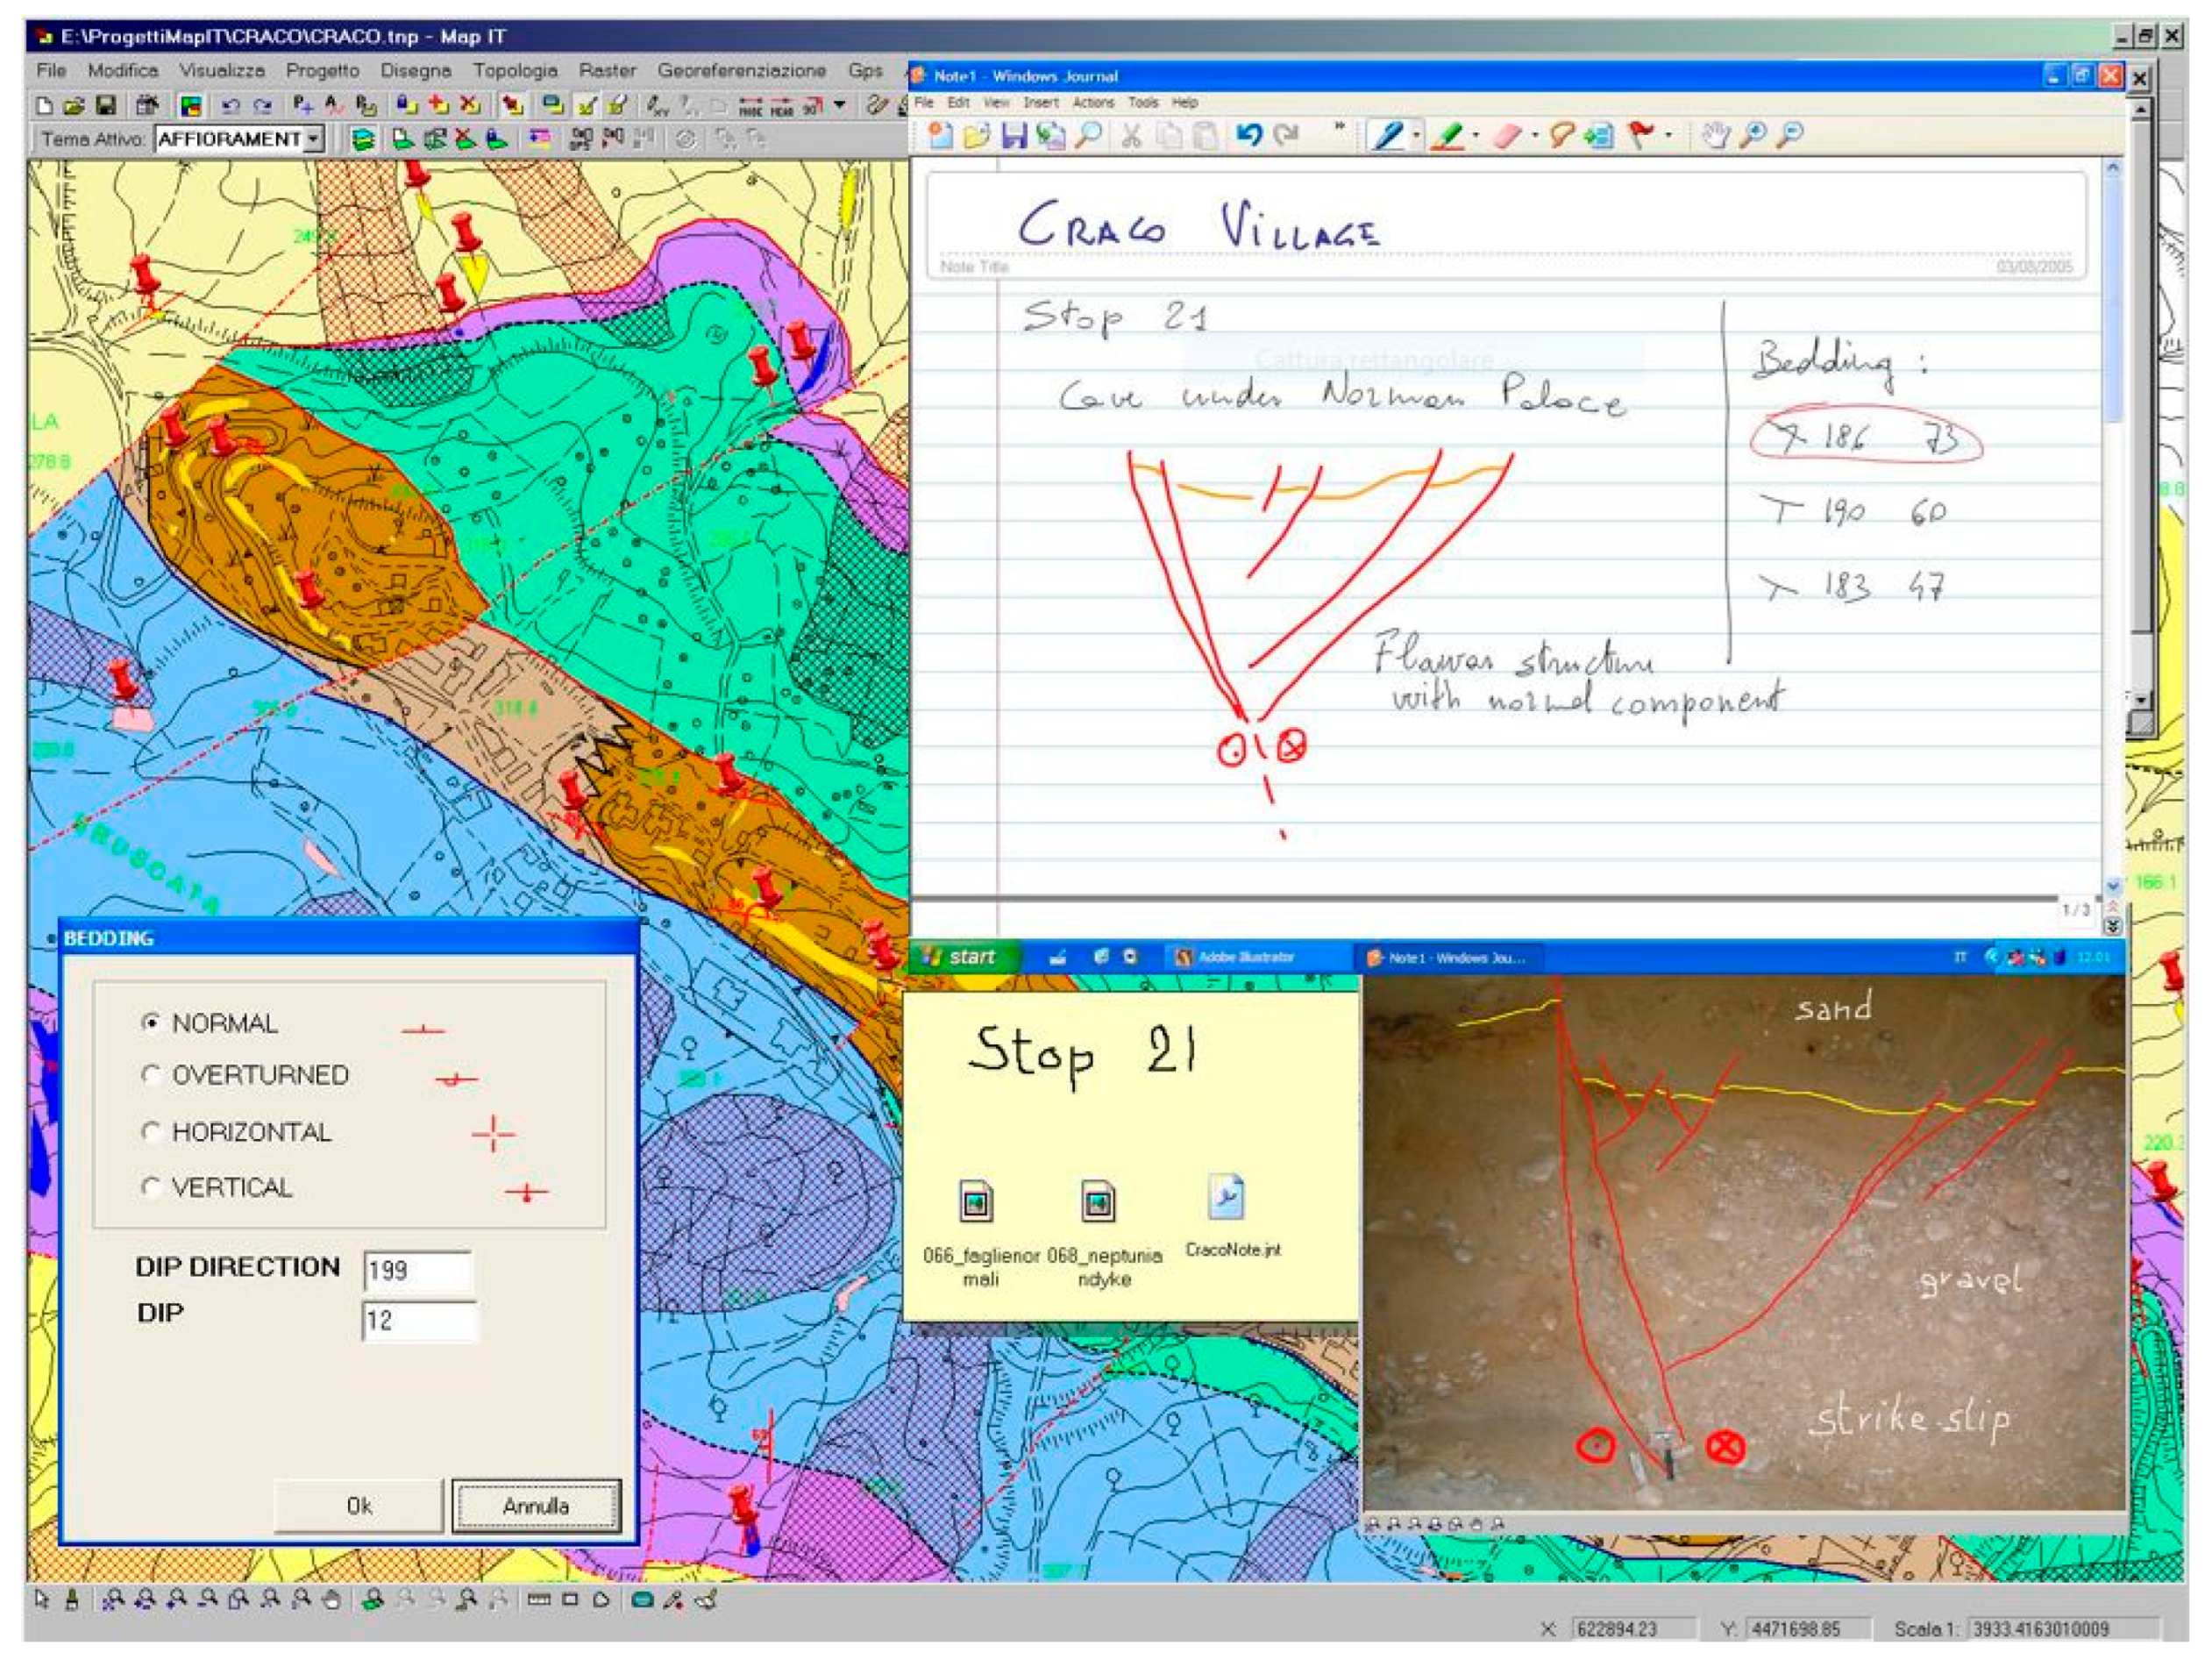
2.1.2. Starting with Commercial Software (Map-IT)

Thanks to the emergence of better operating systems and hardware, the idea of introducing GIS reemerged for field geological investigations. What we needed at the time was out-and-out mobile GIS software.
Thus, a fruitful collaboration was born between LINEE (Computer Science Laboratory for Earth and Environmental Sciences) and an Italian software company, Terranova, who developed Shark software. Thanks also to doctoral work in 2004, we managed to release the first version of Map-IT [11], a Shark GIS modified with a series of tools (GPS acquisition, Easy note, Form Editor, notes to hand on maps and pictures, etc. See Figure 1). Map-IT was presented at the 32nd International Geological Congress held in Florence in August 2004. It ran on a rugged and heavy Xplore iX104 tablet PC, with Windows XP, tablet edition. The beginning was promising and, the following year, Map-IT was presented again at DMT ‘05 [12], held in Baton Rouge. Some US geological surveys adopted Map-IT for their field mapping work [13]. In collaboration with the University of Durham, a comparison was also made between different systems and procedures in the field of digital geological surveying [14,15]. After a very short period, the trading company decided to terminate the collaboration due to a change in company policy. Therefore, attempts to bring the GIS to the field came to an abrupt halt.

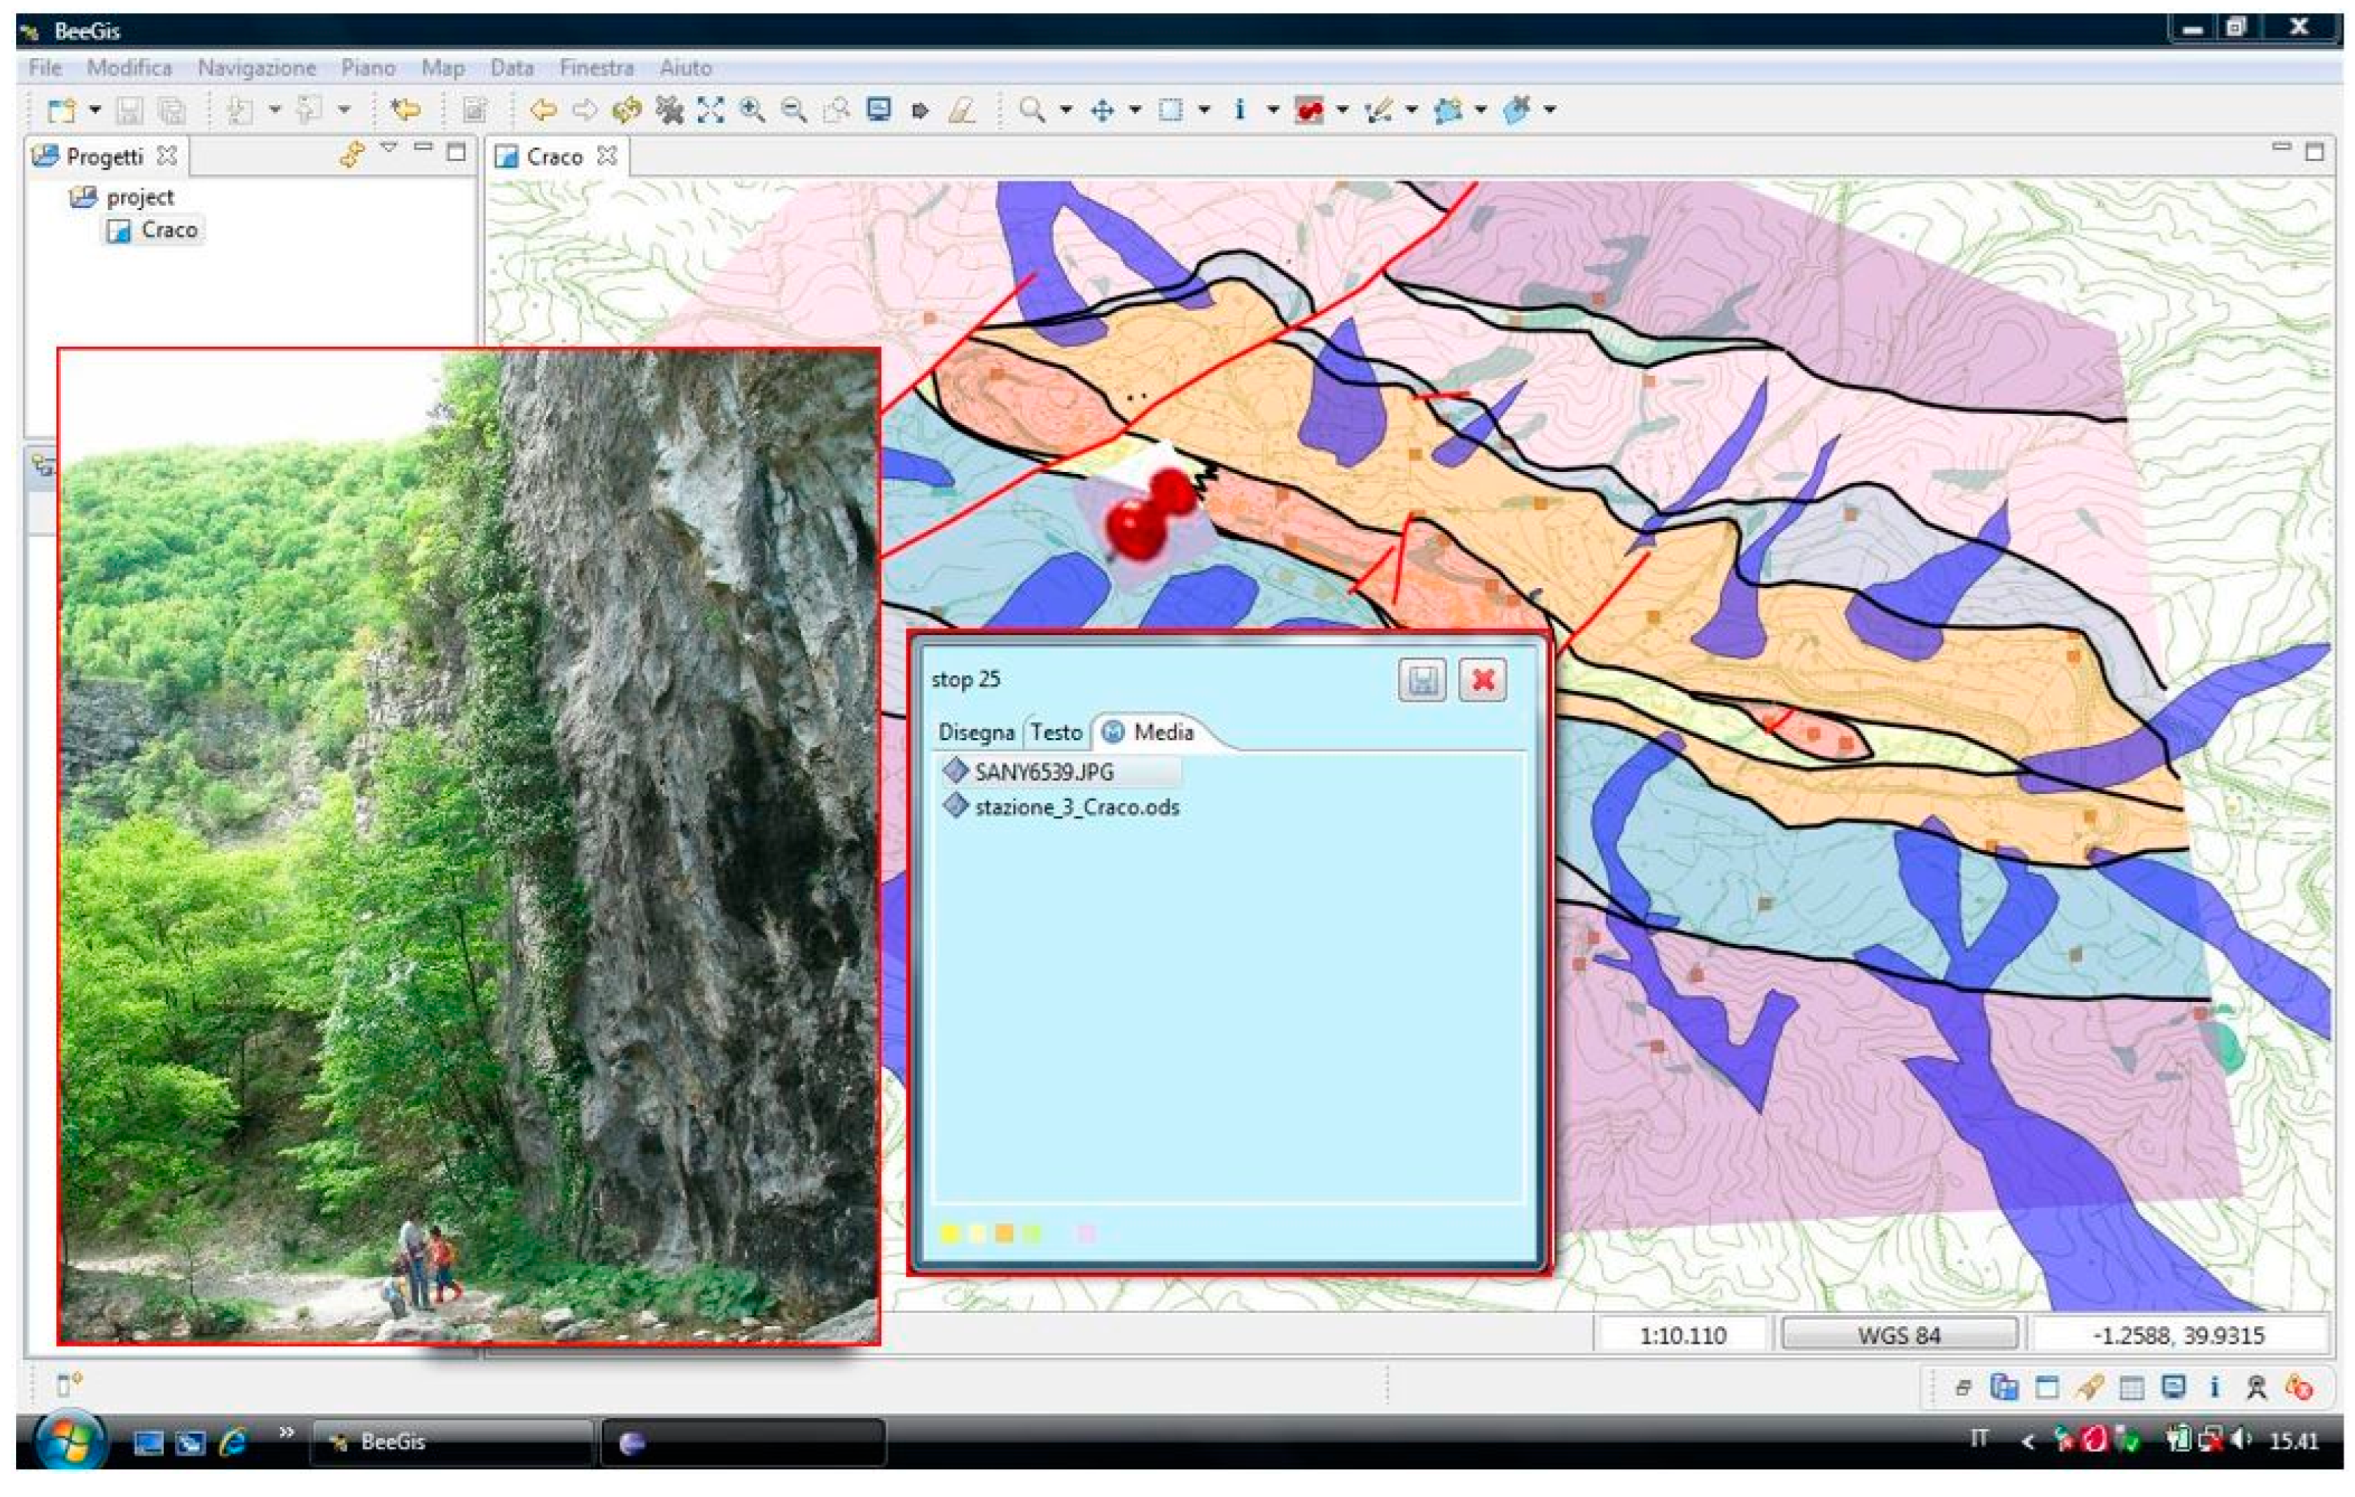
2.1.3. Discovery of the Open-Source World (uDig–BeeGIS)

During the first GIT conference (Geology and Computer Science [16]) held in San Leo (Italy) in June 2006, a new story began. The idea of transferring the knowledge already developed for commercial software into the open-source world materialized with a Ph.D. The developer chose the programming language Java to optimize the coding work. A series of plugins were developed on uDig [17], creating a mobile GIS called BeeGIS [18] (Figure 2).
The available hardware was also different. A Hewlett Packard award for developing academic projects using tablet PCs brought to the University of Urbino 21 HP Compaq 2710p convertible laptops with the Windows Vista operating system to be used for research and teaching activities.
Even if BeeGIS initially presented some annoying bugs, we used it comprehensively in many research and teaching experiences outside the University (for example, with the primary and secondary school mapping of the city of Fermignano (PU), Italy, on MDGs).

2.1.4. A Robust GIS (QGIS)

One of the most important problems encountered in previous experiences is related to the continuity of software development. Commercial software and company policies are blocked, and open-source software that does not have a strong development support community has no continuity or diffusion and stops working. At this point, the analysis conducted on the various open-source software indicated that the most developed and active community was the one around QuantumGIS (QGIS) [19]. Furthermore, the possibility of using the Python language for creating tools ad hoc made customization even more immediate. For these reasons, it was decided to adopt QGIS for developing digital geological mapping tools and procedures.
The students following the Digital Geological Survey (MSc. Geological Sciences) and Geomatics (BSc. Applied Information Technology) courses were also involved in this choice. In particular, students enrolled in the latter have developed several plugins and pieces of code that have made it possible to make a desktop GIS like QGIS into a functional mobile GIS.

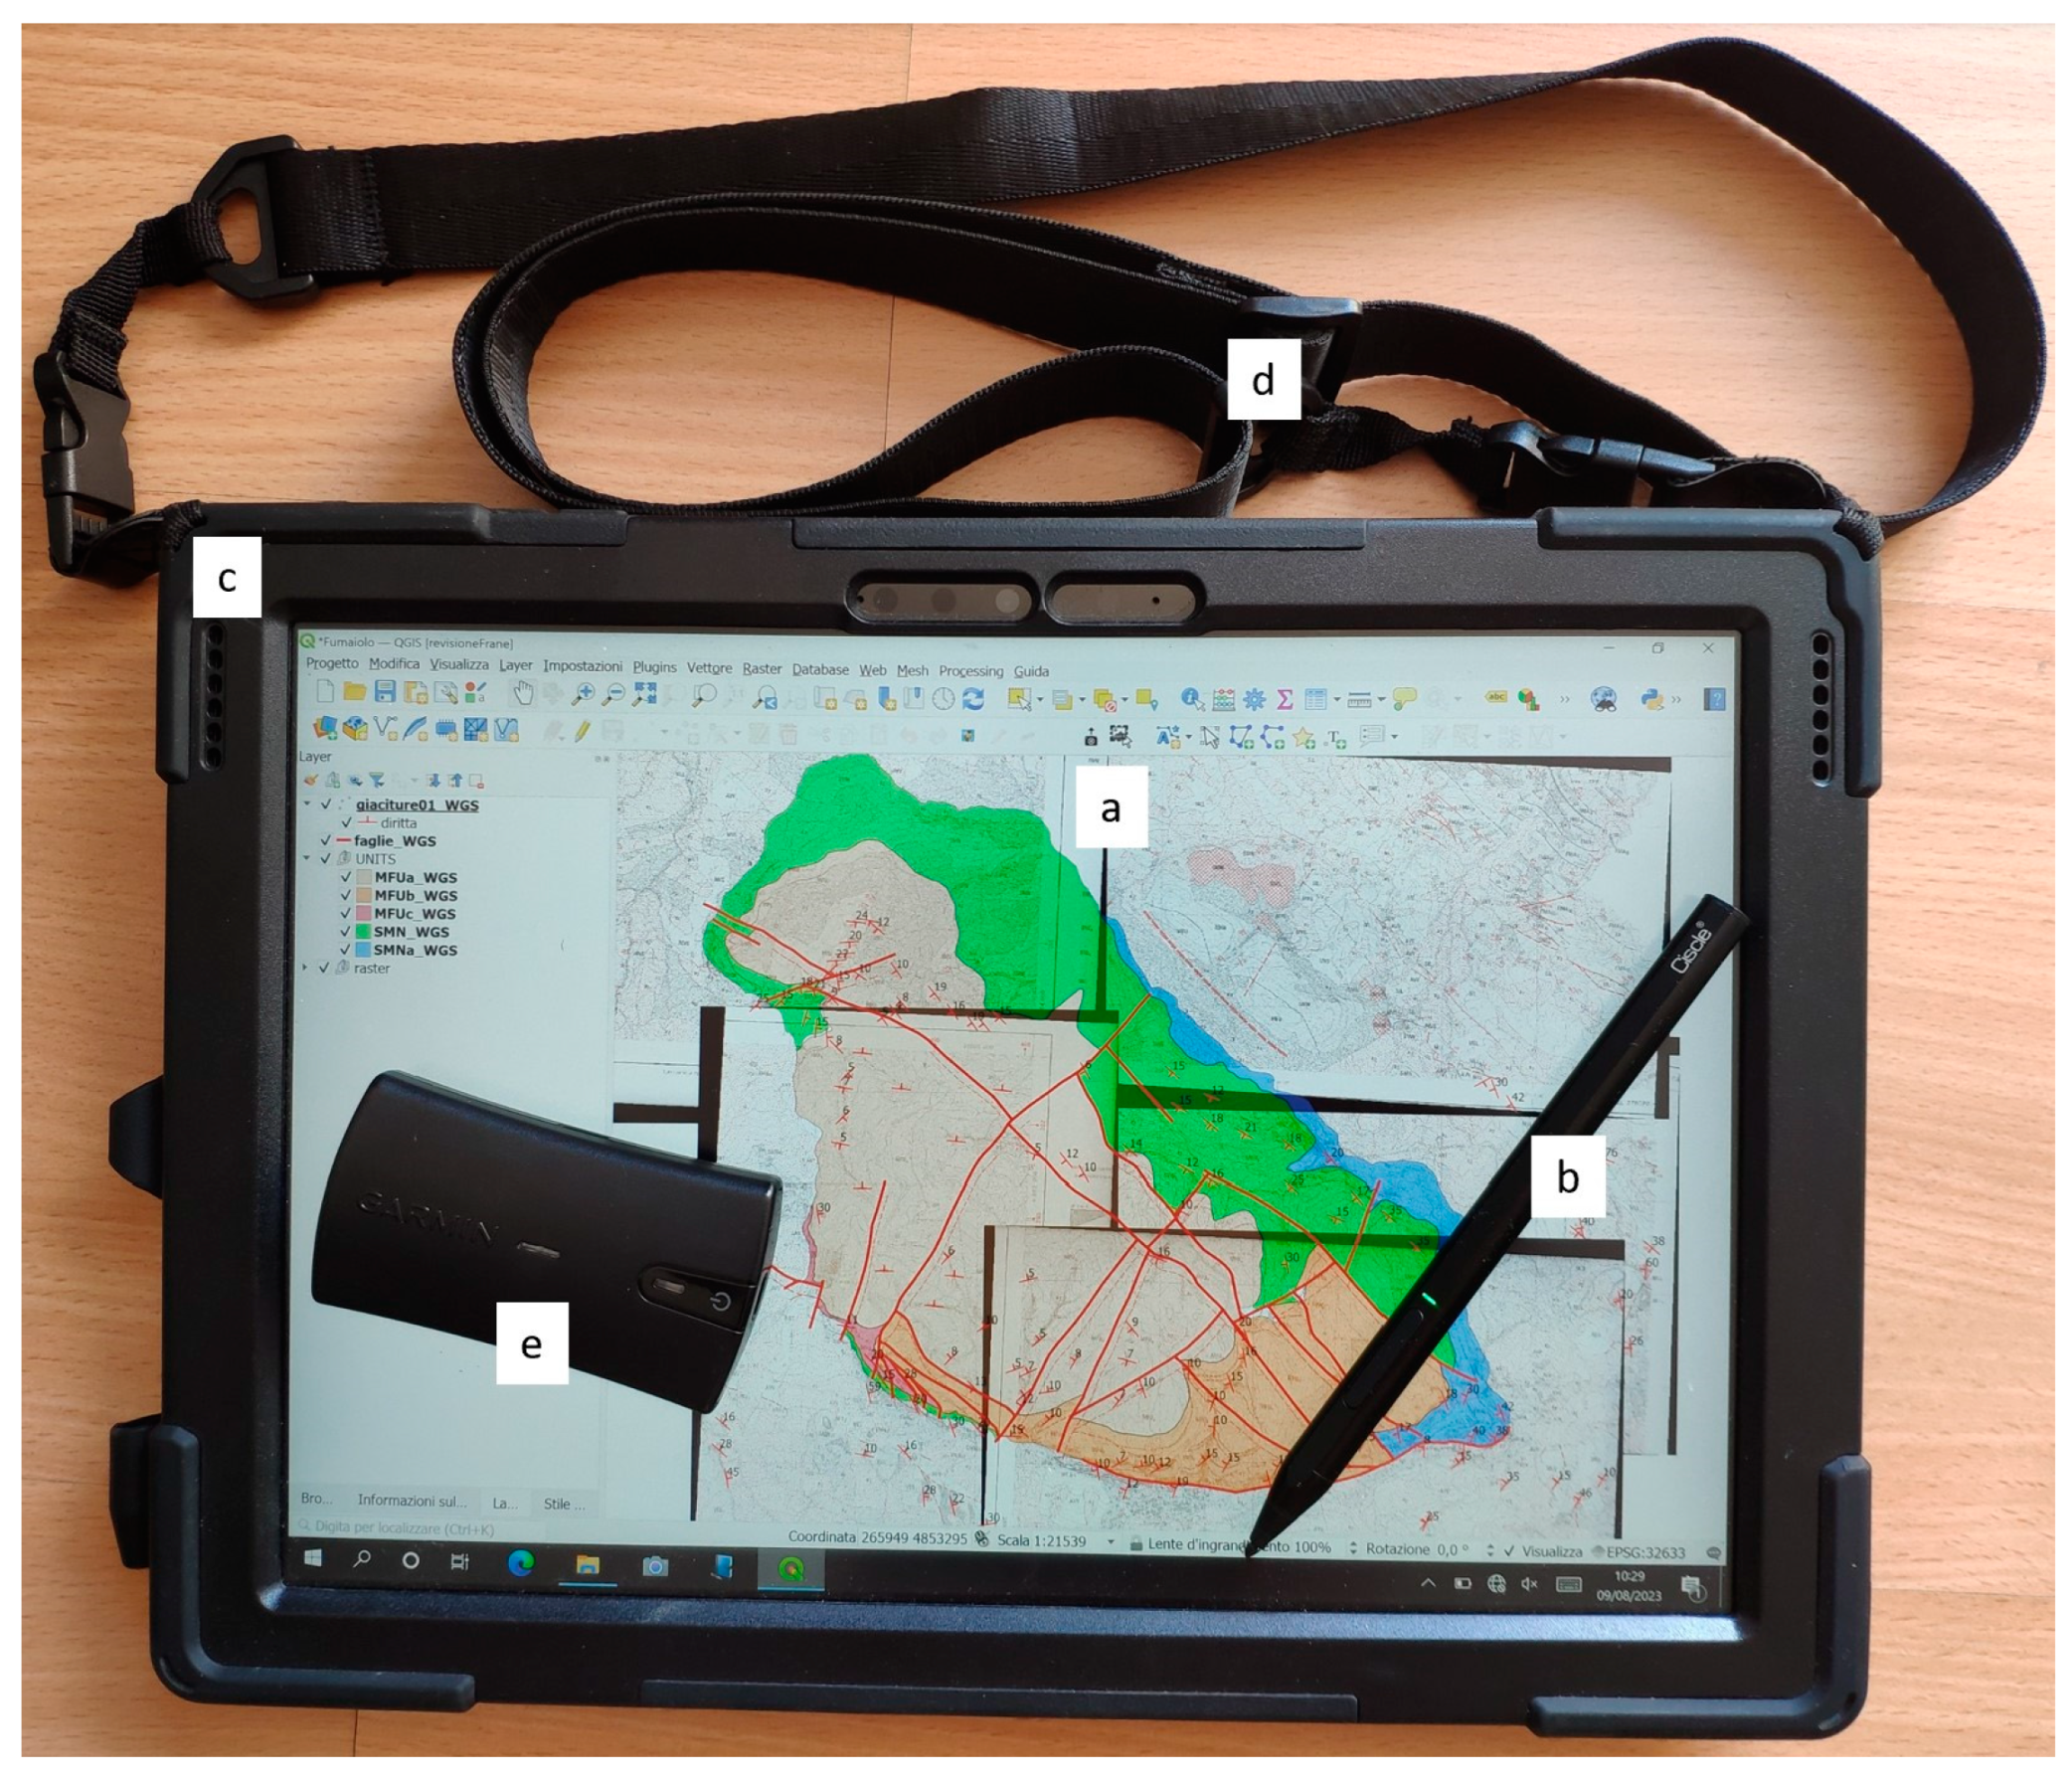
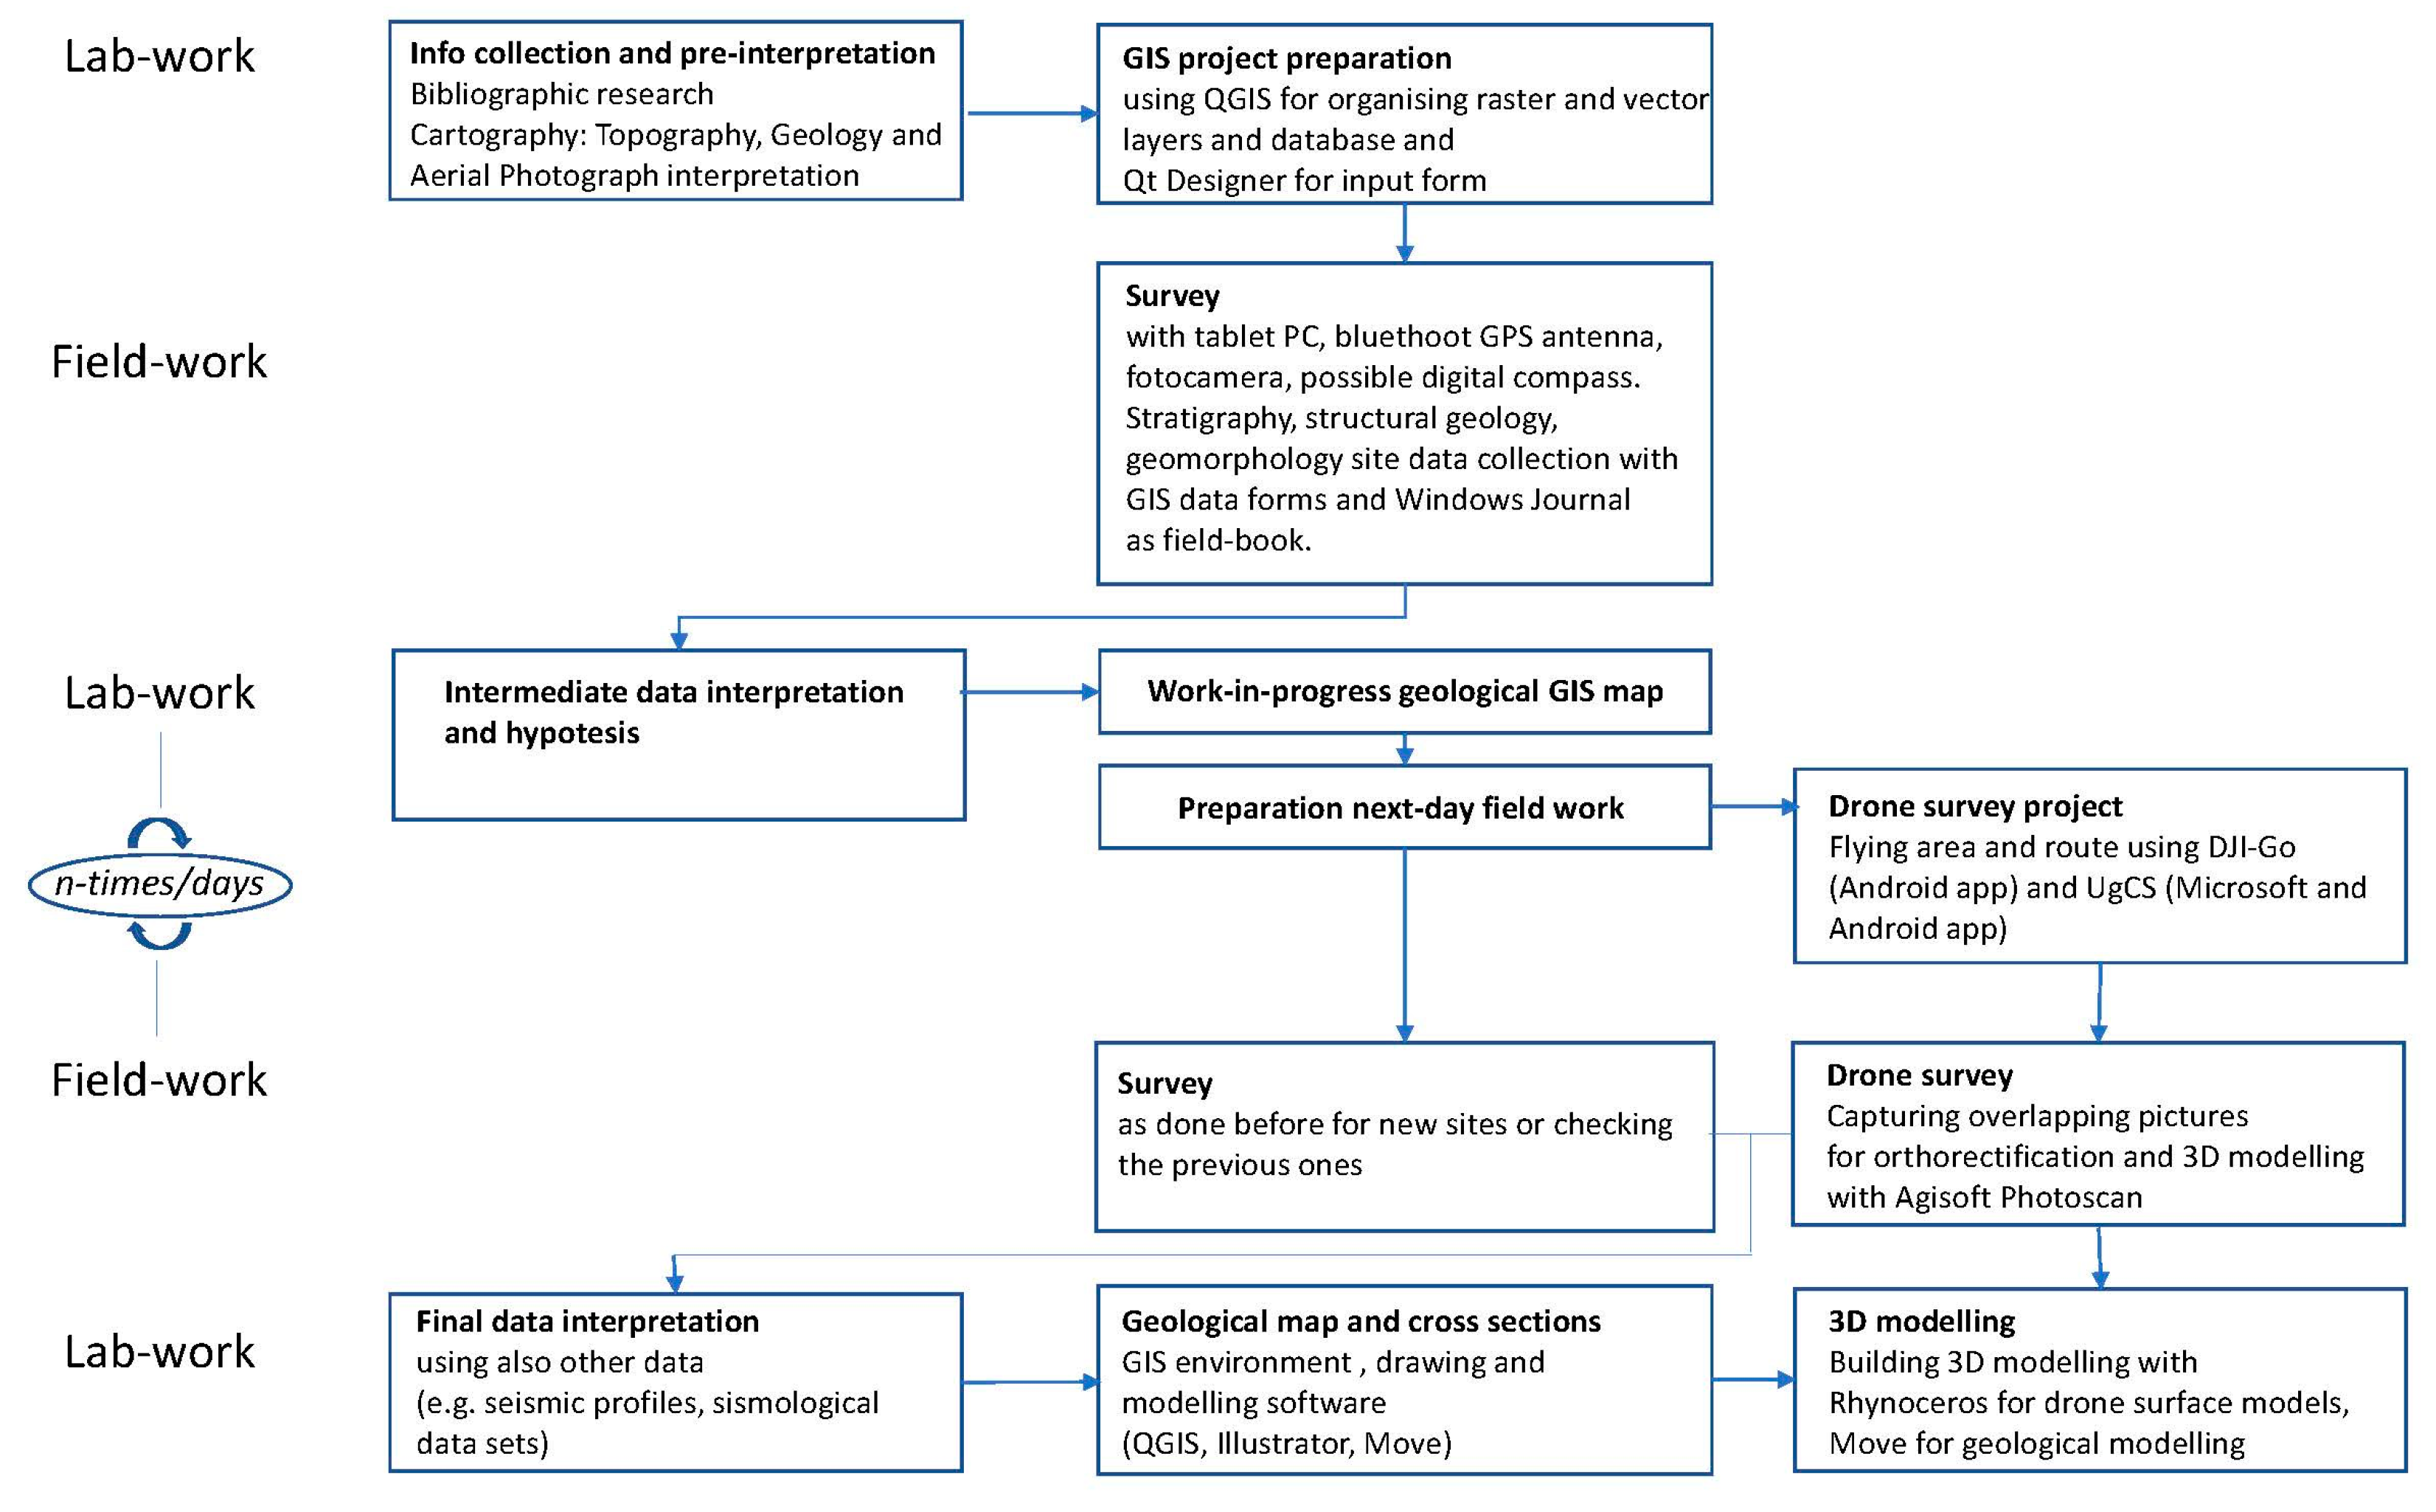
2.1.5. Current Situation

For several years, the mobile GIS system for geological surveying has been based on using QGIS [19], customized with some plugins. In teaching, research, and third mission activity (Third Mission and Societal Impact of Universities and Research Institutes [20]), the system exploits the potential of a widely used open-source software.
The hardware currently used is a tablet PC with Windows System, the Microsoft Surface Pro with 12-inch touch screens, and a stylus. To make it more suitable for use on the ground, it is equipped with a plastic and rubber cover that cushions any accidental blows. A shoulder strap then facilitates transport while on the move (Figure 3).
The tablets used do not have a GPS receiver, so Garmin GLO pocket receivers with Bluetooth are now used. The latter can receive Navstar and Glonass signals (Figure 3e).
For GPS connection, QGIS has a controller which has been implemented for some years by a student from the University of Urbino following an educational laboratory. The student brought the possibility of limiting the acquisition of GPS fixes with a spatial threshold and a time limit. In other words, you decide to take a spot every few seconds, and if you stop within a defined area without movement, the system does not acquire continuously, avoiding redundancies of points when stationary, for example, in front of an outcrop.
Other customizations are linked to the development of some plugins; some are currently available in the QGIS repository, and others are still in the testing phase.
Among the former are the following:
  • qgSurf [21] is a “field-mapping/structural-geology plugin that can be used as an aid in: (a) estimating the attitude of sub-planar geological surfaces given three or more points on a topographic surface; (b) determining the intersection between a geological plane and a topographic surface; (c) calculating the distance between points and a geological plane; (d) plotting geological data in a stereonet; (e) creating geological profiles”.
  • beePen [22] is a “plugin for drawing freehand lines with map-specified pen widths. It is based on the “Freehand” plugin” [23]. This plugin allows the surveyor to keep the classic way of mapping, like “pen-on-paper”, using the stylus on the tablet’s screen.
  • BeeDip [24]—“This plugin lets you import layers from a GeoPackage and export selected layers to a Geopackage file for later use in BeeDip”. It is an Android application working as a geological compass.
Even though we do not frequently use QField [25], an Android app built on top of QGIS, we also install QField Sync [26]: “this plugin facilitates packaging QGIS projects for QField. It analyzes the current project and suggests (and performs) actions needed to make the project working on QField”.
We also assembled some input data forms using Qt Designer [27], a standalone program built into the QGIS package.
Moreover, we collected information similarly to a field book using Windows Journal (free software for Windows) [28] by jotting down notes and drawing sketches.

3. Results of Applications

In this chapter, a few examples of open-source GIS applied to field mapping are explained to give a glimpse into the different fields of potential applications.

3.1. Fault Survey

The survey of capable faults in an area of the Umbria–Marche Apennines (Province of Pesaro–Urbino, Italy) was carried out using mobile GIS systems made of QGIS and the abovementioned plugins [29]. In this case, a workflow (Figure 4) that enhances this system interoperability and flexibility of alternating field and laboratory work was applied.
The software used was QGIS 3.18 [30], coupled with a large number of plugins, such as BeePen [22] for annotation pen-on map, BeePic for picture importing and georeferencing, BeeDip [24] for direct import/export of bedding attitude data, DirectionalSlope [31] to analyze DEM morphology, and qgSurf [21] to extrapolate the fault surface–DEM intersection.
A tablet PC, to which a 51-channel GPS receiver SIRF antenna was connected via Bluetooth, was used for the ground survey. The stylus came in handy for keeping the pen-on-paper method through using it on the tablet screen. Furthermore, a drone was used for image collection and DTM creation.
We built the project using the available raster base maps (topography [32], geology [33], and aerial orthorectified images) of the Marche Region at the scale of 1:10,000. The vector layers were organized for collecting bedding measurements, fault geometry and kinematics, and outcrops. Some input forms have been developed using Qt Designer [27] to make field data capture easier.

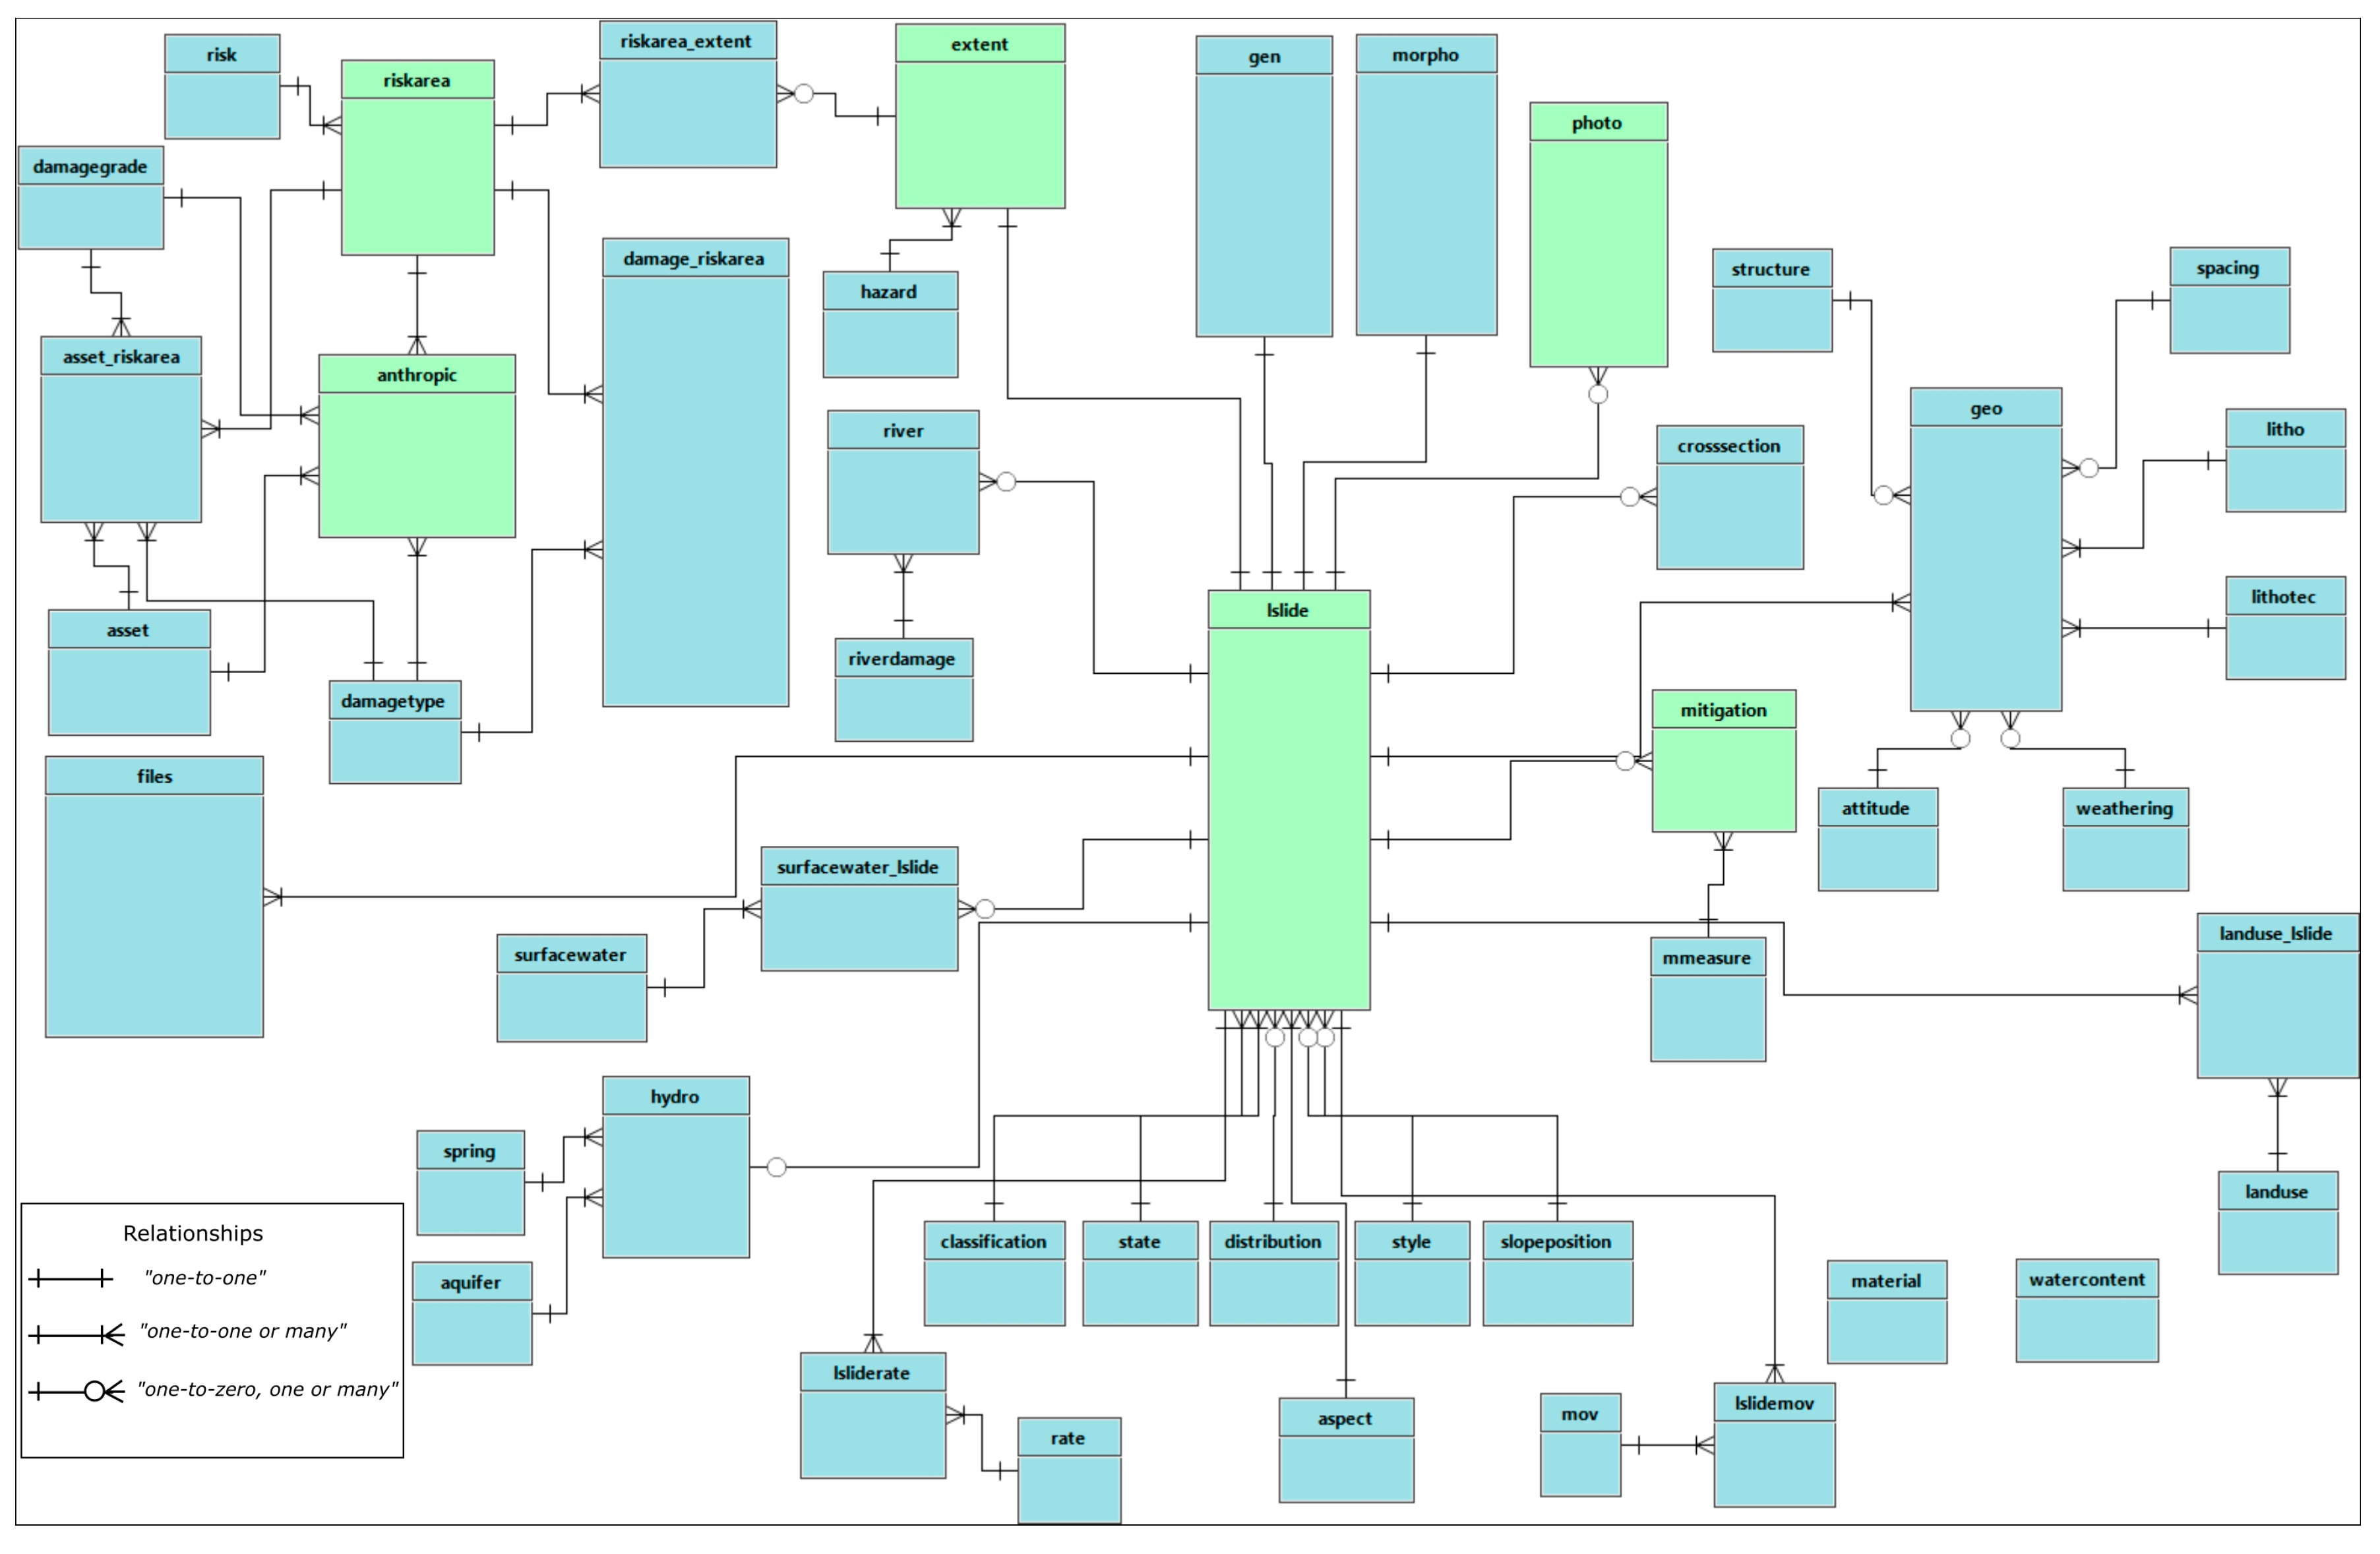
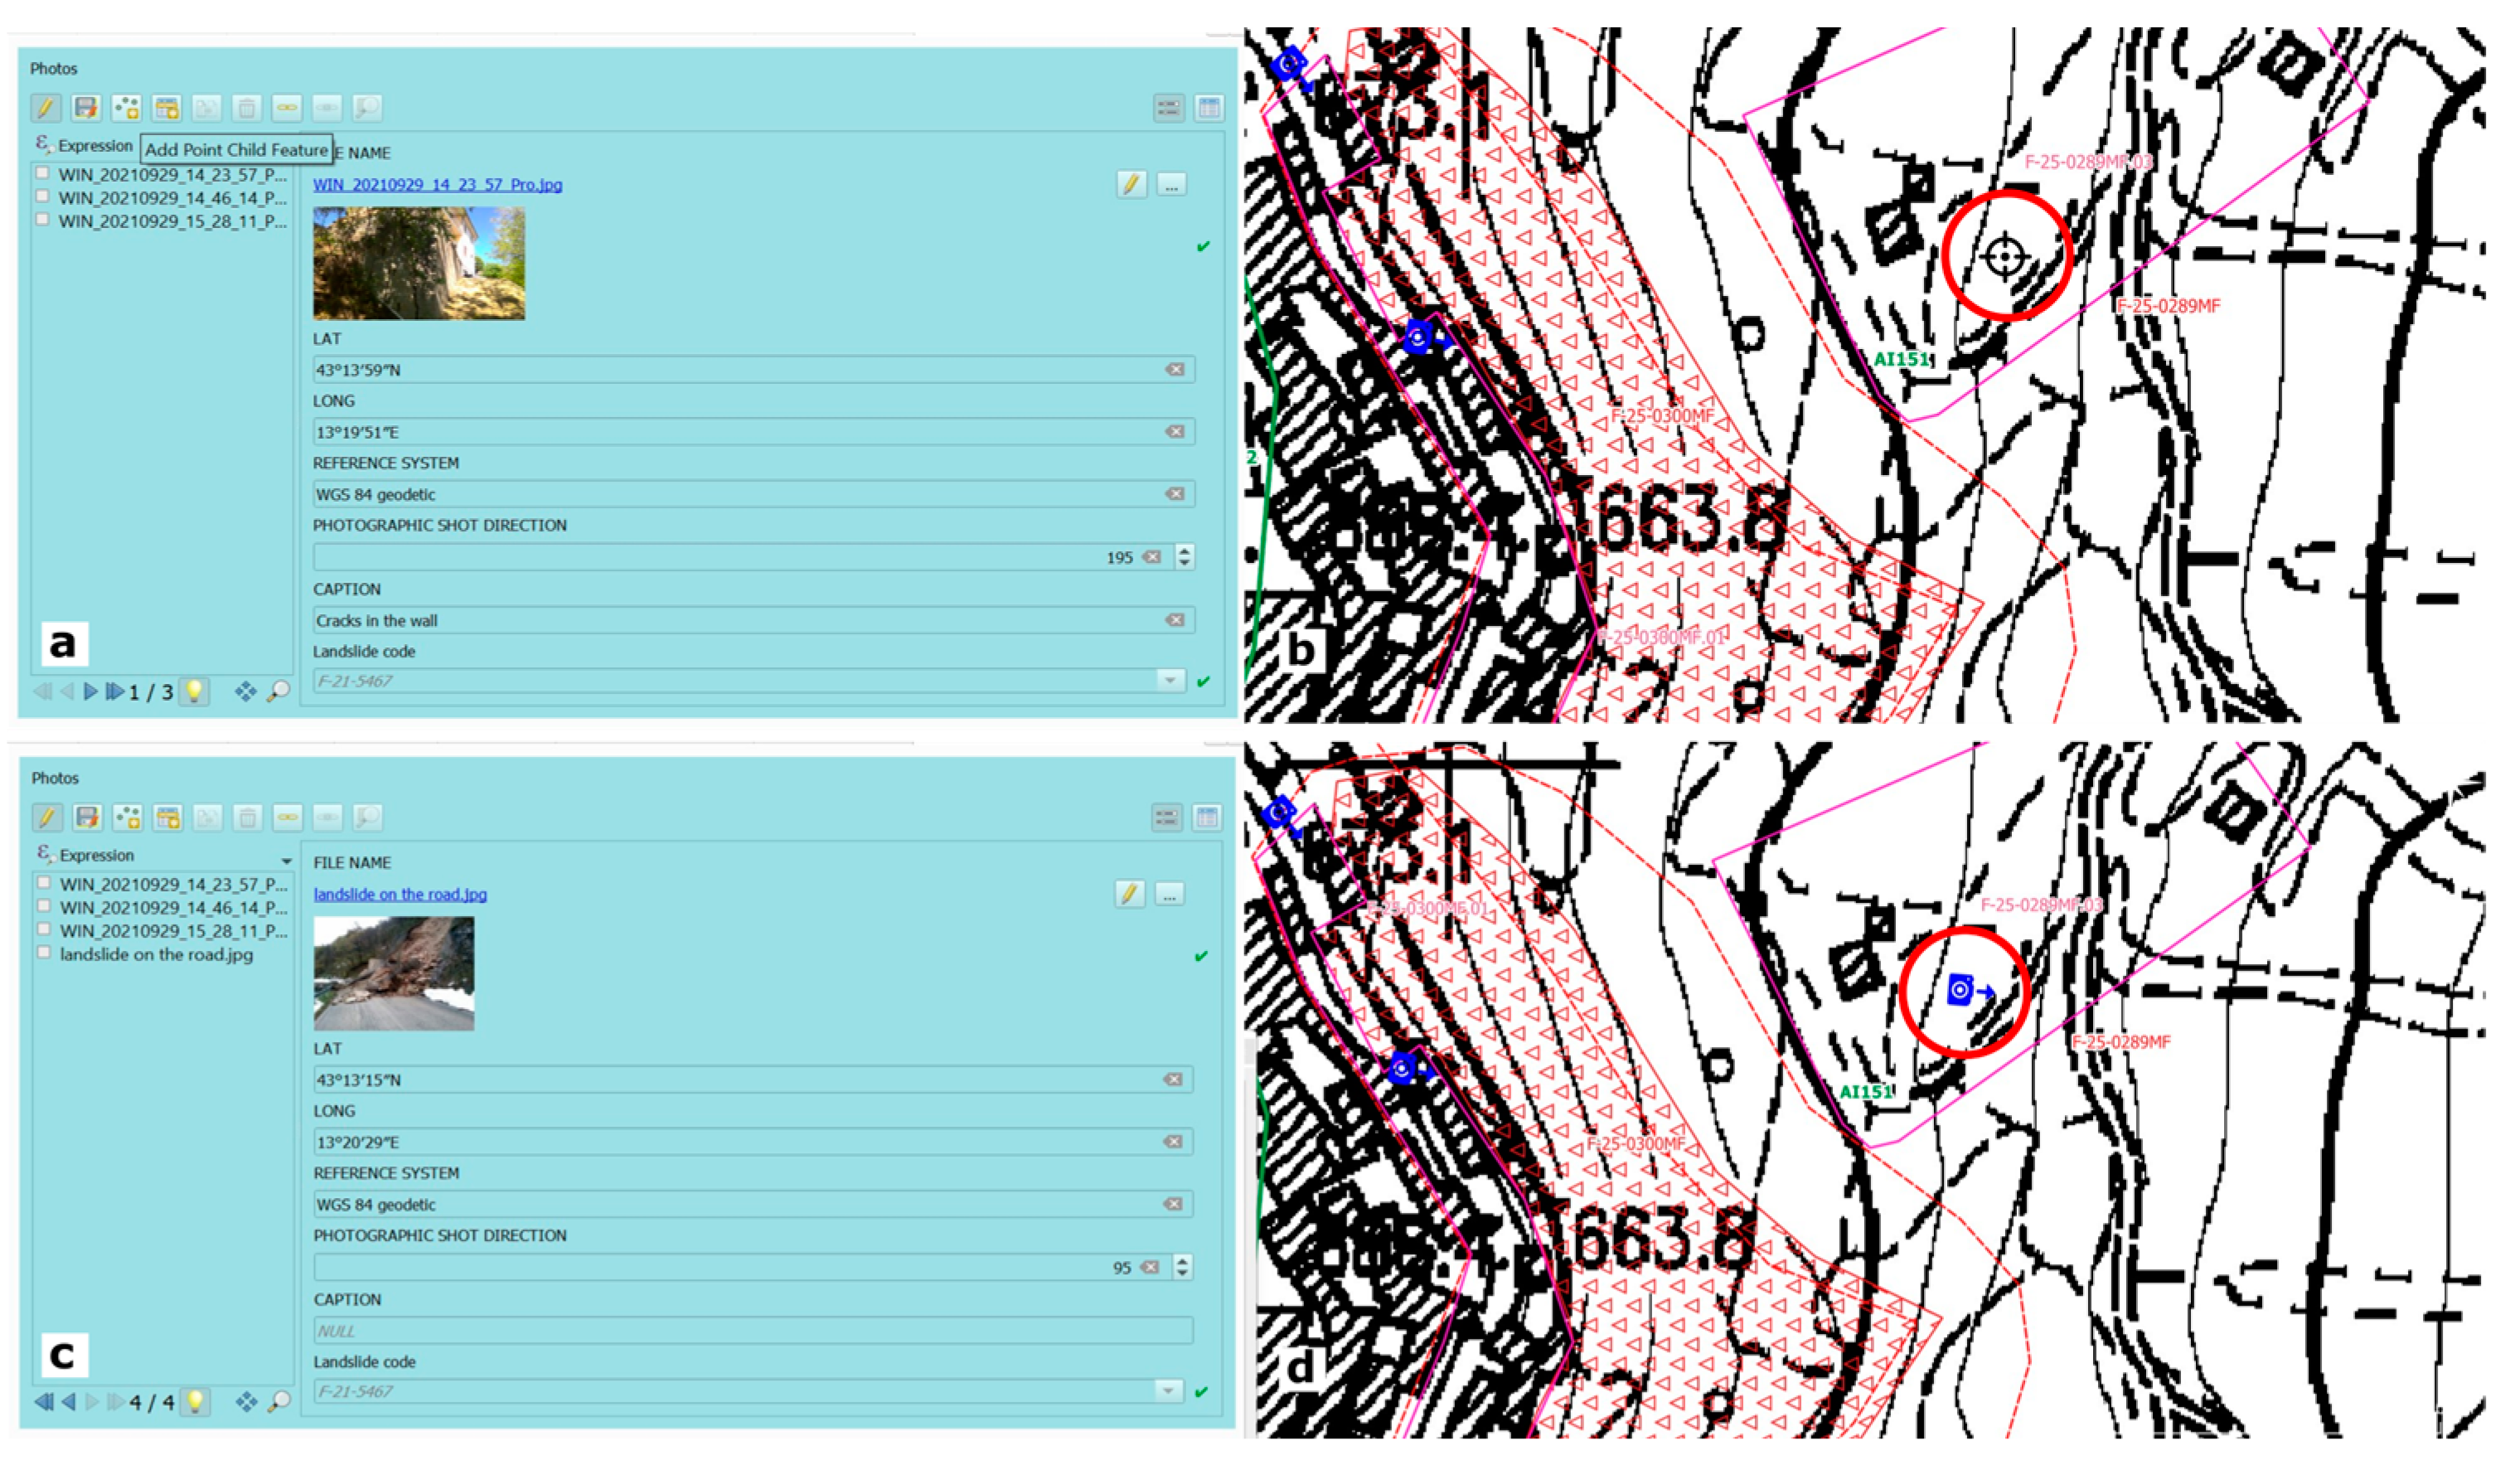
3.2. ReSTART Project

In Central Italy, in the municipalities affected by the 2016 Central Italy Earthquake, geological and geomorphological surveys were carried out in the field with tablet PCs for collecting field data based on the Italian Landslide Inventory (IFFI) schema [34,35]. This was required by the government territorial authorities, who commissioned five universities of Central Italy to re-size and reclassify the landslides affecting the inhabited centers, for the final purpose of post-seismic reconstruction. The field and laboratory work involved 239 survey areas, i.e., slope sectors delimited by morphological features such as watersheds and drainage lines enclosing places with assets needing to be rebuilt, belonging to 138 municipalities. To adopt a common working method for all operators in the field and the laboratory, a GIS with open-source software was developed by the Urbino University working group, redefining and adapting the IFFI database schema to a system that would allow the standardization of the field data collection and the preservation of spatial relations between the mapped features [36].
For this purpose, a geographic relational database was realized using the open-standards-based, platform-independent database format Geopackage [37]. The database objects have been linked to QGIS graphical modules (forms) to ease the acquisition of landslide data in the field and their storage using tablet PCs. Geopackage is a storage format using an SQLite database [38,39] as a container, along with Geopackage encoding standards defining the schema [37]. Tables and fields in the database correspond to the entities derived from the IFFI Project [34,35] and are updated following the criteria adopted by the abovementioned ReSTART project [36].
The database named restart.gpkg comprises spatial and non-spatial tables, available with detailed text and graphic documentation in [36] (Figure 5). It is behind a GIS implemented with the QGIS software [30] The QGIS project file is configured with layer relations based, in turn, on the database table relationships.
Detailed form configuration and descriptions of how they are used are available in [36].
Among others, a form page named “Photographic Documentation” was set up to facilitate the rapid storage of the points representing the photographic shots taken in the field and of the other form attributes simultaneously with the point digitization [36] (Figure 6a,b). After opening the form page and digitizing the point, the Photo QGIS widget allows the photo file to be loaded and the other attribute boxes to be filled in. After saving the data, an oriented marker is displayed in the photographic shot point (Figure 6c,d).

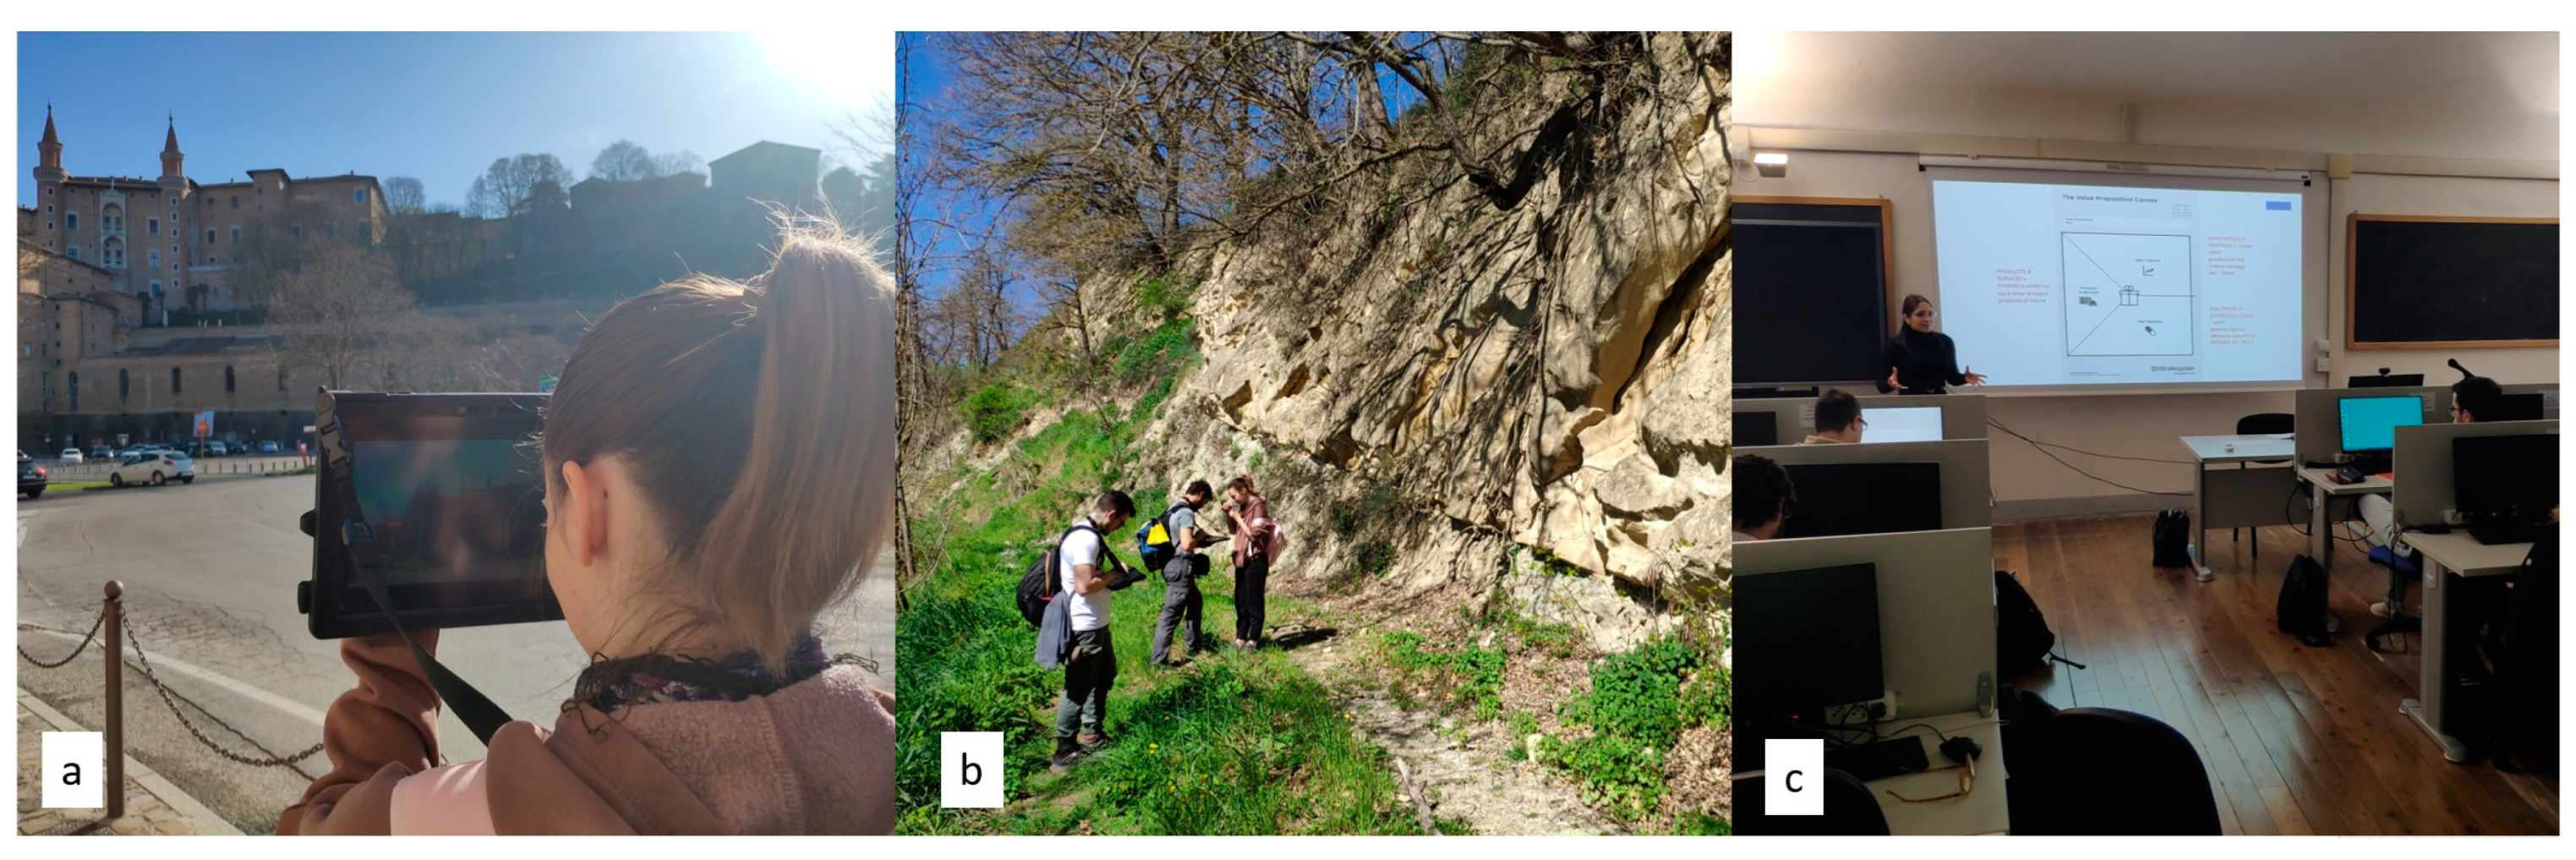
3.3. Academic Educational Applications

Open-source software GIS has been used for teaching in BSc and MSc courses and Ph.D projects.
Teaching Digital Geological Mapping courses, through time and changing the various software listed above, we have reached the (temporary) results that the current version of QGIS, equipped with the above-described plugins, can be used profitably even in the field.
At the beginning of the course, students already have some knowledge about using the software and learn to use GPS and various connectable instruments. They quickly start creating personal projects, organizing data-storing layers, designing the database fields, and implementing data-inserting forms throughout the various customization tools available in QGIS. After a phase of comparison and discussion, a sharing project is drawn up for the fieldwork set up in small groups (of two–three students) (Figure 7). At the end of each survey day, carried out through different areas by each group, data and information gathered for each project are organized. During the discussion, tools and methods for data gathering are also adjusted and improved. For example, not-foreseen attribute fields may need to be added to the database tables, and new layers and categories may need to be implemented. But above all, it is also possible to discuss the observations that are difficult to insert into the database fields. Therefore, an analog or digital field log can be inserted as a georeferenced feature within the GIS project to retrieve related observations and working hypotheses, which would be very helpful in the middle and final synthesis phases.
At the end of the course, the students elaborate a common synthesis map in the laboratory, and each of them makes geological sections from data and presents their final report.
The possibility of having an open and flexible tool which is, above all, available to everyone without the cost of purchasing a license, is very significant in the practice of digital surveying.
If this is true for future geologists, it is also a moment of tangible application of knowledge for computer scientists following the Geomatics BSc Applied Information Technology course. In fact, during these courses, some of the students working with Python developed the plugins described above, proving to be useful for fellow geologist students with whom co-working often occurs in research projects.

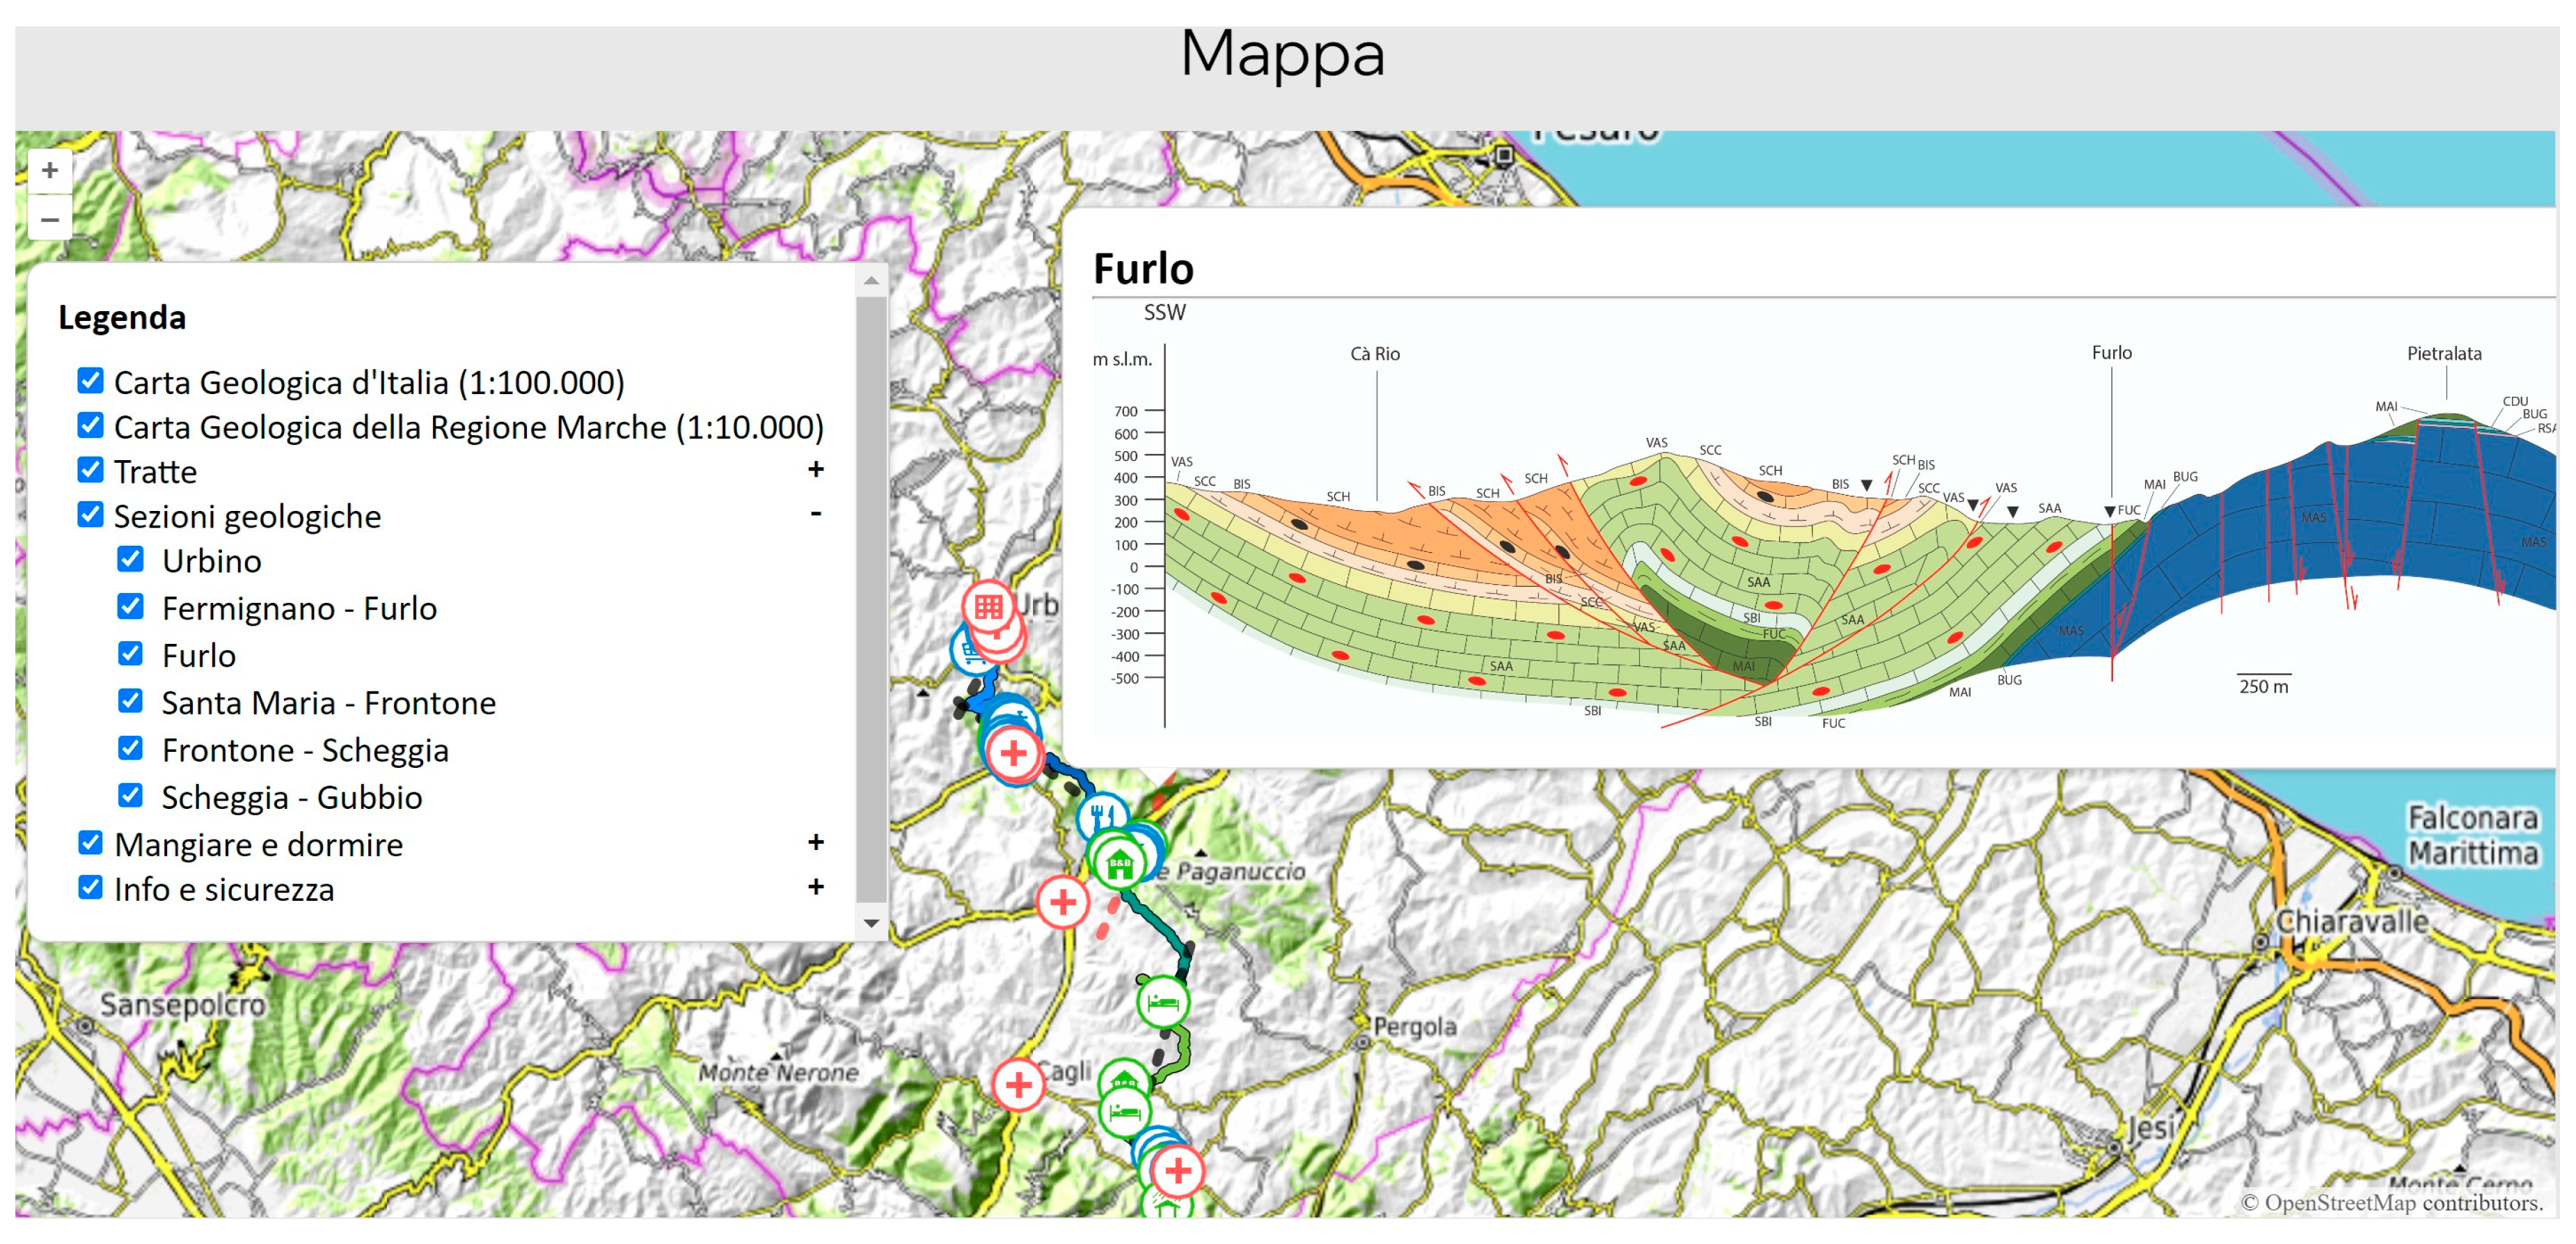
3.4. Web GIS—Geotrail

As part of a project of economic development of the territory through a sustainable tourism program such as that of the “Cammino del Duca” [40], a webGIS was designed to access georeferenced information [41] (Figure 8). Dedicated thematic cartography, starting from the project developed in QGIS 2.28, was made to implement a website with plenty of information for walkers.
The tool adopted is the OpenLayers library [42]. This library allows one to create interactive maps, insert information of interest, and then display it in a web browser. One reason to choose the library is the ease of reading the GeoJSON format. The library allows the addition of various layers and permits the manipulation and display of spatial data. It also provides functions to add panels that the user can interact with on the map. OpenTopoMap [43] is the service for supplying the basic cartography retrieving the tiles from the global map’s OpenStreetMap data and SRTM elevation data. The class used is OSM, a source type that automatically interfaces with OpenStreetMap [44].
The Regional Geological Cartography represents another usable cartographic base provided by WMS services of the Marche Region [45] and the Umbria Region [46].
Among the vector layers, the “legs” layer shows the route divided by legs.
A geological cross-section layer contains the trace lines of the single cross-sections showing once-selected pop-ups of the related geological cross-section.
Other vector layers are those relating to touristic receptivity and safety. These show points of interest along the way by using icons according to the place they represent. The selection of an icon retrieves information about the location or service in addition to the name, telephone, and website address.

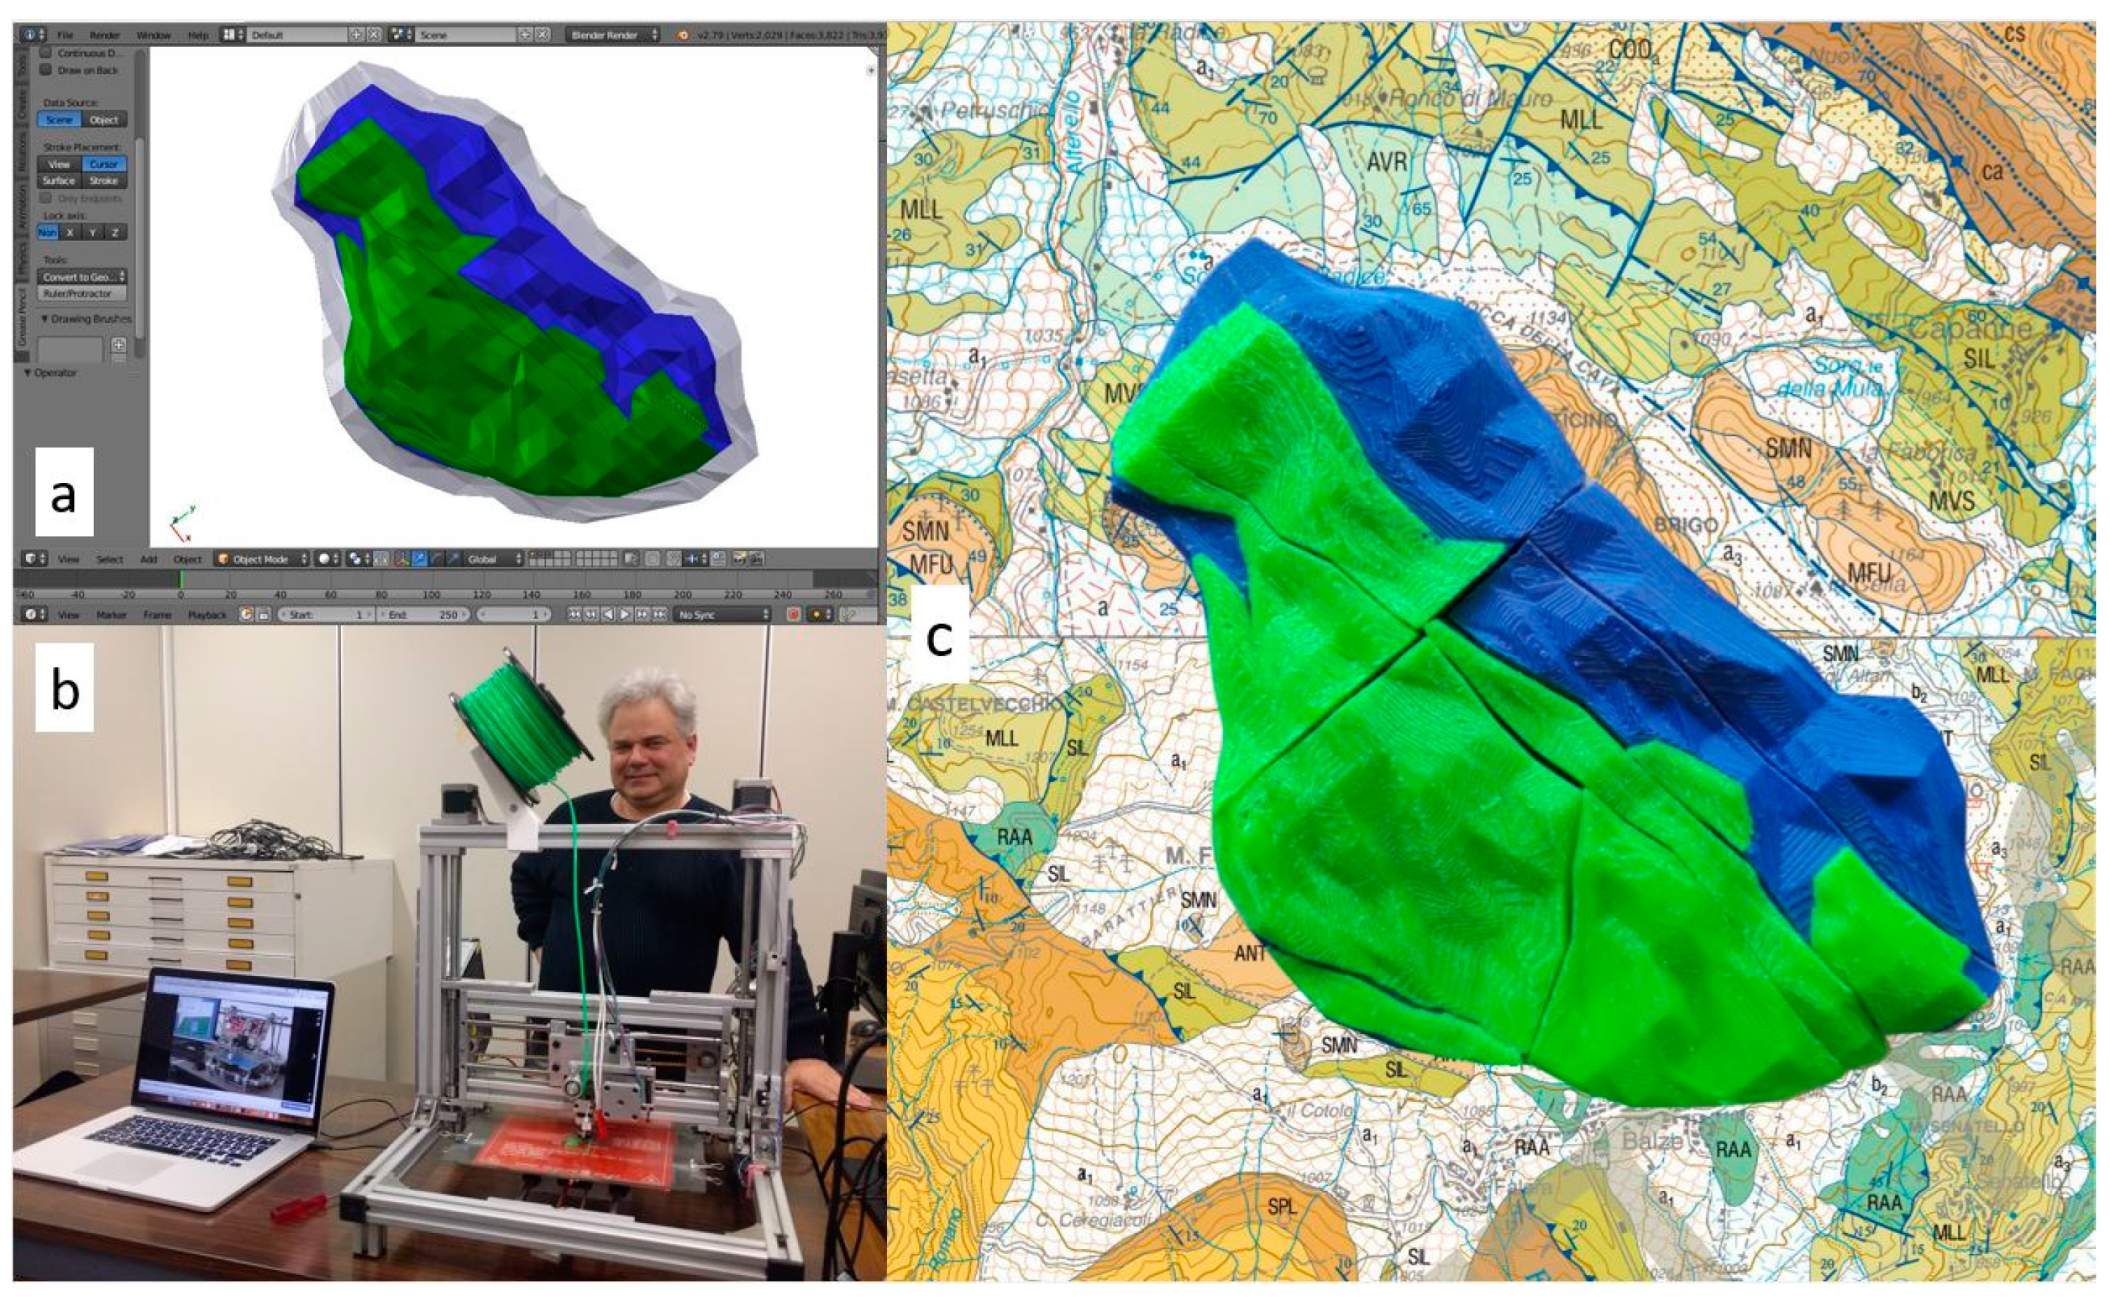
3.5. Three-Dimensional Printer Modelling

The geological map of Monte Fumaiolo (Romagna Apennines, Italy), surveyed using traditional methods on paper at the 1:10,000 scale, has been digitized in a QGIS (version 2.28) project. The map distinguishes the lithozones corresponding to the lithological types associated with different depositional environments. We, therefore, wanted to reconstruct the lithologies volumes according to the current structural setting, thus creating a 3D Model with MOVE [47], a commercial software currently developed by Petroleum Experts Ltd.
Later, we started imagining how to produce a realistic model. The “Move” files are exported into the open-source Blender software [48] to realize a 3D model. After some initial problems, we produced 3D models of each lithozone block bounded by the fault network (Figure 9a).
The BLENDER-processed project files were subsequently modified to obtain a suitable scale factor. The model is scaled to make 1 BLENDER unit equal to 1 km. It was further scaled down to adapt to the printing requirements.
The open-source software REPETIERHOST [49] was used for processing the files by analysis of the .stl files (coming from BLENDER, in this case) through the integrated SLIC3R software, producing, in the end, a sequence of GCode. GCode is a programming language used to compose a long series of commands describing the work of a machine tool in a precise and repeatable way. GCode sequences control all numerical control machine types, such as 3D printers.
A CAM program (computer-aided manufacturing) produces the GCode. It analyses the input file and calculates the movements of the machine that will have to be used to reproduce the physical model of the object. For this reason, the files must be simplified.
The used 3D printer is of the “Prusa I3” type [50], consisting of an extruder, a printing plate, and various sensors and motors (Figure 9b).
The printing method is “FDM fused deposition modelling”, using plastic-type PLA (polylactic acid), which melts at 180–210 °C.
The final 3D-printed model measures 28 cm in maximum length and 16 cm in maximum width. The total time taken for printing was about 80 h, considering the modifications of the print files, the various tests carried out, and the change of the extruder due to the different diameters of the wires.
With some expedients, the shapes displayed in the digital model are kept, producing an analog 3D model (Figure 9c).

4. Discussion and Conclusions

Great tools and a variety of applications have characterized the methodological and scientific research at the University of Urbino in the field of Digital Geology. In particular, the use of information technology on the ground and the subsequent storage and processing of the gathered data, as described in the previous chapters.
The main lesson learned was that the open-source world provides most of the necessary tools. Above all, they may be easily adapted to practical cases, allowing practicality of execution, especially in geological fieldwork.
For this purpose, already available software and purpose-built tools must allow the data gathering and first reading stages to be as simple as possible. The creation and development of the method are addressed for implementing tools, procedures, and our experiences so that they are as close as possible to those of classical surveying and mapping. For example, the freehand use of pencils on paper should be possible to replicate with the “ink-technology” of the stylus pen on the monitor. It is not always possible, and sometimes even counterproductive, to remain tied entirely to traditional analog methods, such as not using relational databases. However, a complete ruled and normalized database connected to a GIS project (see the ReSTART project above) allows the avoidance of data duplication and redundancy and guarantees data integrity; this is the case both for working in a group that shares information and for working in real-time (if a web data network connection is present).
On the other hand, as every surveying geologist knows, the GIS project must be equally flexible to integrate unexpected data and information from when creating the project itself. In this case, the ease of creating new layers, tables, and work interfaces must be possible; if not directly on the ground, this should at least be the case in the moment of initial control and data processing, which precede a second data-gathering phase. Furthermore, for those data that cannot be structured or categorized in database tables, it may be helpful, if not necessary, to use simple but effective tools such as notes and sketches. Nothing new, but just a couple of examples: Leonardo da Vinci’s Codes and Charles Darwin’s annotation notebooks—here, art meets science. Although not always so artistic, geologists’ field notebooks have this function: to report all the observations which are crucial in the interpreting and processing phase. Also, in this respect, digital innovation can be significant, such as geolocating and inventorying information, but so are the first interpretations of working hypotheses. In this way, the georeferencing and the temporality of the work of the geologist, both material and intellectual, are created to allow for a better understanding of the final result. For example, a geological map results from a series of data collections, observations, hypotheses, and initial interpretations; this must be, from time to time, validated during the mapping survey and data processing phases. Therefore, the result is nothing more than a series of hypotheses that will be confirmed or denied during the field survey, from day to day and from one area to another. If we have the physical, temporal, and geographical path to which the subsequent confirmed or denied hypotheses are associated, it will be possible to understand more easily the achievement of the interpretation and the final product.
Also, the possibility of keeping the data separate from the intermediate stages of interpretation and final processing is very significant. In this case, the digital method, compared to the analogical one, allows the creation of the same theme, acquisition layer, and final processing layer. For example, in the case of faults, we have often created a point acquisition layer, in which insert the measured data and the observations made on well-exposed outcrop, and an annotation layer is added using beePen (see above) to gather the interpretation of the geomorphological signs and aerial images. All this is maintained and distinct from a line layer where faults are digitized, perhaps inserting the appropriate symbols and labels.
Although the above considerations apply to commercial IT tools, the greater flexibility of open-source software makes this more easily achievable. These tools offer the broadest customization and adaptability in the research and didactic fields that are the main academic missions. As described in the section “Academic educational applications”, they are very functional and powerful tools for developing students’ ability to implement new ideas and applications. It is also clear that these tools are constantly evolving and that the open-source software allows us to follow and further participate in this evolution (see GPS controls and various plug-ins for QGIS). In this world, it is important to embrace a flexible way of approaching digital systems rather than learning to master them at the moment every software tool becomes available.
Of course, as described in the first sections, the path to use the current open-source software was dotted with tests that demonstrated fallacies, slowdowns, and U-turns. Therefore, the development experiences of the mobile GIS application and other open-source software at the University of Urbino Carlo Bo could be comparable with other academic and professional realities [14], to avoid mistakes already made and to encourage the development of new ideas.

Author Contributions

Conceptualization, M.D.D. and G.F.P.; methodology, M.D.D.; resources, M.D.D.; data curation, G.F.P.; writing—original draft preparation, M.D.D. and G.F.P.; writing—review and editing, M.D.D. and G.F.P.; funding acquisition, M.D.D. All authors have read and agreed to the published version of the manuscript.

Funding

This research was funded by DISPEA—Dotazione per progetti di ricerca 2021 (Mauro De Donatis).

Institutional Review Board Statement

Not applicable.

Informed Consent Statement

Not applicable.

Data Availability Statement

No new data were created or analyzed in this study. Data sharing is not applicable to this article.

Conflicts of Interest

The authors declare no conflict of interest.

References

  1. Winchester, S. The Map That Changed the World; HarperCollins Publishers: New York, NY, USA, 2002; ISBN 0-06-093180-9. [Google Scholar]
  2. Coe, A.L.; Argles, T.W.; Rothery, D.A.; Spicer, R.A. Geological Field Techniques; Wiley-Blackwell: Hoboken, NJ, USA, 2010; ISBN 978-1-4443-3062-5. [Google Scholar]
  3. Briner, A.P.; Kronenberg, H.; Mazurek, M.; Horn, H.; Engi, M.; Peters, T. FieldBook and GeoDatabase: Tools for Field Data Acquisition and Analysis. Comput. Geosci. 1999, 25, 1101–1111. [Google Scholar] [CrossRef]
  4. Brimhall, G.H.; Vanegas, A. Removing Science Workflow Barriers to Adoption of Digital Geological Mapping. In Proceedings of the Digital Mapping Techniques ‘01, Tuscaloosa, AL, USA, 20–23 May 2001. [Google Scholar]
  5. Leslie, G.; Smith, N.; Jordan, C. Digital Field Mapping with the British Geological Survey. Geophys. Res. Abstr. 2014, 16, 4172. [Google Scholar]
  6. Geological Map of Italy at 1:50,000 Scale—Updating and Supplementing the Guidelines of the Geological Map of Italy at 1:50,000 Scale (Version 1.0/2022). Available online: https://www.isprambiente.gov.it/en/publications/technical-periodicals/booklets-series-iii-of-sgi/geological-map-of-italy-at-1-50-000-scale-updating-and-supplementing-the-guidelines-of-the-geological-map-of-italy-at-1-50-000-scale-version-1-0-2022 (accessed on 16 August 2023).
  7. De Donatis, M. Earth and Environmental Sciences: Field Classes with GIS/GPS and Tablet PC. In Proceedings of the First International Workshop on Pen-Based Learning Technologies, Catania, Italy, 4–5 May 2007; p. 3. [Google Scholar]
  8. ARC/INFO Software, version 1.0; Esri: Redlands, CA, USA, 1982.
  9. Fujitsu Introduces the Stylistic LT P-600—Next Generation Pen Tablet PC with Compact and Ergonomic Design—Fujitsu Hong Kong. Available online: https://www.fujitsu.com/hk/about/resources/news/press-releases/2001/ltp600.html (accessed on 16 August 2023).
  10. MicroStation CAD for Infrastructure Design|Bentley Systems. Available online: https://www.bentley.com/software/microstation/ (accessed on 16 August 2023).
  11. De Donatis, M.; Bruciatelli, L. MAP IT: The GIS Software for Field Mapping with Tablet PC. Comput. Geosci. 2006, 32, 673–680. [Google Scholar] [CrossRef]
  12. De Donatis, M.; Susini, S.; Bruciatelli, L. MAP IT: A GIS/GPS Software Solution for Digital Mapping. In Proceedings of the Digital Mapping Techniques ’05 Workshop, Baton Rouge, LA, USA, 24–27 April 2005. [Google Scholar]
  13. Brown, K.D.; Sprinkel, D.A. Geologic Field Mapping Using a Rugged Tablet Computer. In Proceedings of the Digital Mapping Techniques ‘07 Workshop, Columbia, SC, USA, 20–23 May 2007. [Google Scholar]
  14. Clegg, P.; Bruciatelli, L.; Domingos, F.; Jones, R.R.; De Donatis, M.; Wilson, R.W. Digital Geological Mapping with Tablet PC and PDA: A Comparison. Comput. Geosci. 2006, 32, 1682–1698. [Google Scholar] [CrossRef]
  15. De Donatis, M.; Susini, S.; Delmonaco, G. Digital Geologic Mapping Methods: From Field to 3D Model. Inter. J. Geol. 2008, 2, 47–52. [Google Scholar]
  16. National Conference: Geology & Information Technology, 31 May–01 June 2006, San Leo (PU), Italy. Available online: https://gitonline.org/san-leo-2006/ (accessed on 3 June 2023).
  17. Refractions Research: uDig. Available online: http://www.refractions.net/products/udig/ (accessed on 16 August 2023).
  18. De Donatis, M.; Lanteri, L.; Antonello, A.; Foi, M.; Foresto, C.; Susini, S. BeeGIS: The Open Source Mobile GIS for Field Mapping. In Proceedings of the 6th Euregeo Congress, Munich, Germany, 9–12 June 2009; pp. 53–55. [Google Scholar]
  19. QGIS Development Team. QGIS Geographic Information System; Open Source Geospatial Foundation: Beaverton, OR, USA, 2019. [Google Scholar]
  20. Italian National Agency for the Evaluation of Universities and Research Institutes; Third Mission/Impact. Available online: https://www.anvur.it/en/activities/third-mission-impact/ (accessed on 28 September 2023).
  21. Alberti, M. GIS Analysis of Geological Surfaces Orientations: The qgSurf Plugin for QGIS. PeerJ Prepr. 2019, 7, e27694v1. [Google Scholar] [CrossRef]
  22. Alberti, M. BeePen, Python Plugin for QGIS. 2019. Available online: https://github.com/mauroalberti/beePen (accessed on 14 August 2023).
  23. DocOC86, freehandEditing_3 software tool for QGIS 3.x. 2021. Available online: https://github.com/DocOC86/freehandEditing_3 (accessed on 13 August 2023).
  24. Cortellucci, D. Beedip, Python Plugin for QGIS. 2019. Available online: https://github.com/Dodoveloper/beedip (accessed on 14 August 2023).
  25. OPENGIS.ch QField for QGIS, C++ language. 2023. Available online: https://github.com/opengisch/QField (accessed on 7 June 2023).
  26. QField Ecosystem Documentation—QField Ecosystem Documentation. Available online: https://docs.qfield.org/ (accessed on 7 June 2023).
  27. D.P. and/or its subsidiary(-ies) Qt Designer 2014. Available online: https://www.qt.io/design?utm_campaign=Navigation%202019&utm_source=Nav%202019 (accessed on 14 August 2023).
  28. Windows Journal Software for Windows 7; Microsoft Corporation: Redmond, WA, USA, 2021.
  29. De Donatis, M.; Alberti, M.; Cipicchia, M.; Guerrero, N.M.; Pappafico, G.F.; Susini, S. Workflow of Digital Field Mapping and Drone-Aided Survey for the Identification and Characterization of Capable Faults: The Case of a Normal Fault System in the Monte Nerone Area (Northern Apennines, Italy). ISPRS Int. J. Geo-Inf. 2020, 9, 616. [Google Scholar] [CrossRef]
  30. Development Team QGIS, 2021. Geographic Information System QGIS. Available online: http://www.qgis.org (accessed on 15 May 2021).
  31. Alberti, M. Directionalslope, Python Plugin for QGIS. 2020. Available online: https://github.com/mauroalberti/directionalslope (accessed on 14 August 2023).
  32. Regione Marche, Carta Tecnica Numerica 1:10000. Available online: https://www.regione.marche.it/Regione-Utile/Paesaggio-Territorio-Urbanistica/Cartografia/Repertorio/Cartatecnicanumerica110000 (accessed on 13 August 2020).
  33. Carta Geologica Regionale 1:10000-Geotiff. Available online: https://www.regione.marche.it/Regione-Utile/Paesaggio-Territorio-Urbanistica-Genio-Civile/Cartografia-e-informazioni-territoriali/Repertorio/Carta-geologica-regionale-110000/Carta-geologica-regionale-110000-Geotiff (accessed on 13 August 2020).
  34. Trigila, A.; Iadanza, C.; Spizzichino, D. Quality Assessment of the Italian Landslide Inventory Using GIS Processing. Landslides 2010, 7, 455–470. [Google Scholar] [CrossRef]
  35. Trigila, A.; Iadanza, C. Landslides in Italy, Special Report 2008; Italian National Institute for Environmental Protection and Research-Geological Survey of Italy/Land Protection and Georesources Department: Rome, Italy, 2008. [Google Scholar]
  36. De Donatis, M.; Pappafico, G.F.; Bonì, R.; Francioni, M.; Marino, L.; Morelli, S.; Zatserkovny, V.I. Landslide Field Mapping: IFFI-Restart Forms for Data Acquisition and Management for the Classification of Landslides in the Municipalities Affected by the 2016 Central Italy Earthquake 2022. Preprints 2022, 1, 2022110461. [Google Scholar] [CrossRef]
  37. GeoPackage Encoding Standard; Open Geospatial Consortium: Wayland, MA, USA, 2023.
  38. Hipp, R.D. SQLite 3.31.1, Documentation. Available online: https://www.sqlite.org/index.html,2020 (accessed on 28 September 2023).
  39. OSGeo. Available online: https://www.osgeo.org/ (accessed on 7 October 2022).
  40. Bazzoli, N.; De Donatis, M.; Lello, E.; Martelli, F.; Viganò, E.; Piacentini, P. Il Cammino del Duca: Un itinerario in costruzione tra università e territorio. In Itinerari per la Rigenerazione Territoriale tra Sviluppi Reticolari e Sostenibili; Scienze geografiche; FrancoAngeli s.r.l.: Milan, Italy, 2022; ISBN 978-88-351-4322-2. [Google Scholar]
  41. Il Cammino Del Duca. Available online: https://www.ilcamminodelduca.it/ (accessed on 17 August 2023).
  42. The OpenLayers Dev Team. OpenLayers Library 2006. Available online: https://github.com/openlayers/openlayers (accessed on 17 August 2023).
  43. OpenTopoMap. Available online: https://opentopomap.org/about (accessed on 17 August 2023).
  44. OpenStreetMap. Available online: https://www.openstreetmap.org/about (accessed on 17 August 2023).
  45. Regione Marche WMS of the Marche Region Geological Map at the scale of 1:10.000. Available online: https://www.regione.marche.it/Regione-Utile/Paesaggio-Territorio-Urbanistica-Genio-Civile/Cartografia-e-informazioni-territoriali/WMS#Carta-Geologica-1:10.000 (accessed on 17 August 2023).
  46. Umbria Region Geological Map. Available online: http://www.umbriageo.regione.umbria.it/catalogostazioni/catalogo.aspx (accessed on 17 August 2023).
  47. Midland Valley Exploration/Petex Ltd. MOVE Suite. Available online: http://www.petex.com/products/move-suite/ (accessed on 15 August 2020).
  48. Community, B.O. Blender—A 3D Modelling and Rendering Package; Stichting Blender Foundation: Amsterdam, The Netherlands, 2018. [Google Scholar]
  49. Littwin, R. Repetier Host. 2022. Available online: repetier.com (accessed on 14 August 2023).
  50. Original Prusa I3 MK3S+ 3D Printer|Original Prusa 3D Printers Directly from Josef Prusa. Available online: https://www.prusa3d.com/product/original-prusa-i3-mk3s-3d-printer-3/ (accessed on 21 August 2023).
Figure 1. Map-IT interface with the main tools: input data form (example for bedding attitudes) and Easy Note, a multimedia collector of georeferenced information (in this case showing a note on Windows Journal).
Geomatics 03 00025 g001
Figure 2. BeeGIS interface showing geonotes and picture georeferencing.
Geomatics 03 00025 g002
Figure 3. Hardware: (a) tablet pc Microsoft Surface Pro 7 with touch screen 12”; (b) USB-rechargeable stylus; (c) ruggedized carry case (plastic and rubber); (d) shoulder strap; (e) Bluetooth GPS receiver.
Geomatics 03 00025 g003
Figure 4. Workflow for digital survey project from organization to final elaboration with intermediate check and interpretation (after Figure 3 from [29]).
Geomatics 03 00025 g004
Figure 5. The restart database entity relationship (E-R) diagram: the core spatial tables are represented in green, the non-spatial associations and lookup tables in blue, with listed fields and relationships between tables. The symbols of the types of relationships are described in the legend (from [36]).
Geomatics 03 00025 g005
Figure 6. The four successive steps of photo acquisition, simultaneous to the point digitization (from [36]). (a) After opening the form page and activating editing, click the Add Point button; (b) the view shifts to the map canvas and a target cursor appears (circled in red); (c) after clicking on the photographic shot point on the map, the view shifts again to the form view, allowing for loading the photo file using the browse button and filling in the other attributes boxes; (d) after saving the data, an oriented marker is displayed in the photographic shot point (circled in red).
Geomatics 03 00025 g006
Figure 7. Examples of applications of digital cartography with open-source GIS and other software by students: (a) survey of Geotrail “Il Cammino del Duca” in Urbino; (b) fieldwork during the Digital Geological Mapping Course (MSc. in Geological Sciences); (c) field data elaboration during Geomatics classes (BSc. on Applied Information Technology).
Geomatics 03 00025 g007
Figure 8. Webgis “Il Cammino del Duca” geotrail: web interface of maps with different layers for service and geological information [41] (http://webgis.ilcamminodelduca.it/webgis/# (accessed on 17 August 2023).
Geomatics 03 00025 g008
Figure 9. From digital to analogic modeling: (a) after GIS and MOVE elaboration, 3D drawing of Mt. Fumaiolo with Blender; (b) 3D printing in the lab; (c) plastic 3D model on top of the geological map of Mt. Fumaiolo.
Geomatics 03 00025 g009
Disclaimer/Publisher’s Note: The statements, opinions and data contained in all publications are solely those of the individual author(s) and contributor(s) and not of MDPI and/or the editor(s). MDPI and/or the editor(s) disclaim responsibility for any injury to people or property resulting from any ideas, methods, instructions or products referred to in the content.

