Article

Physicochemical Properties of Tungsten Trioxide Photoanodes Fabricated by Wet Coating of Soluble, Particulate, and Mixed Precursors

by
Valli Kamala Laxmi Ramya Chittoory
1,
Marketa Filipsika
2,
Radim Bartoš
2,
Marcela Králová
2 and
Petr Dzik
2,*
1
Advanced Ceramic Materials, Central European Institute of Technology, Purkyňova 123, 612 00 Brno, Czech Republic
2
Faculty of Chemistry, Brno University of Technology, Purkyňova 464, 612 00 Brno, Czech Republic
*
Author to whom correspondence should be addressed.
Photochem 2024, 4(1), 111-127; https://doi.org/10.3390/photochem4010006
Submission received: 24 October 2023 / Revised: 12 January 2024 / Accepted: 23 January 2024 / Published: 1 February 2024
(This article belongs to the Topic New Materials and Advanced Applications in Photocatalysis)

Abstract

:
Advanced oxidation processes are emerging technologies for the decomposition of organic pollutants in various types of water by harnessing solar energy. The purpose of this study is to examine the physicochemical characteristics of tungsten(VI) oxide (WO3) photoanodes, with the aim of enhancing oxidation processes in the treatment of water. The fabrication of WO3 coatings on conductive fluorine-doped tin oxide (FTO) substrates was achieved through a wet coating process that utilized three different liquid formulations: a dispersion of finely milled WO3 particles, a fully soluble WO3 precursor (acetylated peroxo tungstic acid), and a combination of both (applying a brick-and-mortar strategy). Upon subjecting the WO3 coatings to firing at a temperature of 450 °C, it was observed that their properties exhibited marked variations. The fabricated photoanodes are examined using a range of analytical techniques, including profilometry, thermo-gravimetric analysis (TGA), X-ray diffraction (XRD), and voltammetry. The experimental data suggest that the layers generated through the combination of particulate ink and soluble precursor (referred to as the brick-and-mortar building approach) display advantageous physicochemical properties, rendering them suitable for use as photoanodes in photoelectrochemical cells.

Graphical Abstract

1. Introduction

The urgent requirement to confront the pervasive pollution of groundwater, surface water, and drinking water by toxic and long-lasting organic chemicals stemming from industrial and domestic sources demands an increased emphasis on the development of wastewater treatment technologies [1,2]. Advanced wastewater treatment typically involves the use of physicochemical and combined physical and biological methods, which are categorized into three main groups: physical, chemical, and biological treatments [3,4]. Commonly used physical methods for water treatment include sedimentation, adsorption, and membrane separation [5]. Biological treatments can be an effective solution for removing organic matter from water, as conventional physical processes have limitations in this area. However, even though there have been advancements in membrane bioreactors, they have not yet been successful in removing micropollutants from wastewater. This is because the membrane components of these technologies become clogged with particles from previous processes, which hinders the separation process [6]. Advanced Oxidation Processes (AOPs) are widely regarded as the most effective method for rapidly degrading and oxidizing organic pollutants in water treatment, with chemical methods demonstrating high efficiency, especially for addressing organic wastewater [7].
Advanced oxidation processes possess several advantages, such as a high mineralization efficiency, rapid reaction rates, and minimal secondary pollution [8]. Organic products are highly susceptible to oxidation by hydroxyl radicals, which are generated by holes and other reactive oxygen species (ROS) that exist between electrons and molecular oxygen [9]. AOPs rely on efficient ROS generation and reduced mass transfer resistance to determine their oxidation capacity. Unlike other AOPs, electrochemical oxidation breaks down pollutants without producing secondary products at a relatively low cost. The anodic reaction is influenced by the organic compounds’ affinity for the oxidant and results in the formation of active oxygen, which can lead to either the complete degradation or simplification of pollutants [7,8,10]. Photochemical AOPs offer a promising solution for both water treatment and energy production due to their capacity to break down persistent compounds using sunlight. Nevertheless, their relatively low efficiency in harnessing light energy and the rapid reunion of electron–hole pairs at the photocatalyst’s surface present substantial obstacles to their practical implementation [11]. By integrating multiple advanced oxidation processes (AOPs), the oxidation efficiency of treating organic wastewater can be enhanced. This method aims to overcome the drawbacks and high operational costs of individual treatment technologies, by leveraging synergistic effects to improve the efficiency of organic degradation. PEC facilitates the separation of electron–hole pairs, thereby promoting the mineralization of organic pollutants in wastewater [8,9,12]. The conductivity of urban and industrial wastewater is adequate due to the presence of electrolytes [13]. The majority of PEC research has typically utilized synthetic wastewater composed of ultrapure water and electrolytes [12,14,15,16,17]. The process-specific parameters, system design, and water quality all play a role in determining the formation of radicals [4,18,19]. The efficiency of contaminant destruction in surface-based advanced oxidation processes (AOPs) is influenced by several factors, including radical scavenging, radical transfer, and hydrodynamics [8]. Optimal performance of a photocatalyst depends on effective morphology control, as it impacts the photocatalytic properties, specific surface area, quantum efficiency, and porosity [7]. Oxidation of these organic pollutants at the surface of photocatalyst is of the utmost importance [20]. The photocatalytic approaches have been the latest developments for the degradation of organic pollutants, based on semiconductor materials as catalysts in conjunction with the advanced oxidation processes (AOPs) under the irradiation of solar light [21].
In tungsten(VI) oxide (WO3), the lower size of the bandgap starts at 2.6 eV, and photocatalysis can be excited by blue radiation of the visible spectrum, which has an edge for WO3 over titania [22]. There are different mechanisms through which tungsten oxides act. One includes the bandgap value and band edge positions, allowing carrier generation in the healthcare system [23]. The energy of the bandgap can vary depending on the crystalline phase of the photocatalyst [24]. Photocatalysts face a significant challenge due to faster electron–hole recombination time, making it difficult in PEC cell activity [25,26,27]. The photoelectrochemical cell comprises a photoanode and a cathode immersed in an aqueous electrolyte, as shown in Figure 1. The smaller the photocatalytic particles, the greater the total number of charge separations [28,29,30]. Combining band structure engineering, geometric engineering, and heterostructure engineering may enhance the photocatalytic activity. The setup comprises a photoanode and a cathode immersed in an aqueous electrolyte, as shown in Figure 1. In the n-type photoanode, photogenerated holes move to the semiconductor interface to oxidize organic pollutants to carbon dioxide.
The nanomaterial preparation can be divided into two basic procedures: top-down and bottom-up. In the top-down procedure, the bulk material is broken down into nanosized particles by different physical, chemical, and mechanical processes. Various synthetic methods can be utilized under this approach such as mechanical milling, laser ablation, and ion sputtering [31]. Mechanical mills of various types include planetary, attrition, vibration, low-energy ball, and high-energy ball mills [32]. Using the bottom-up procedure, larger layers can be prepared from soluble precursors and such processes include the sol–gel method. The precursors utilized in the sol–gel method are heated to a very high temperatures to achieve one of the immobilization conditions, namely, adhesion to the substrate [32].

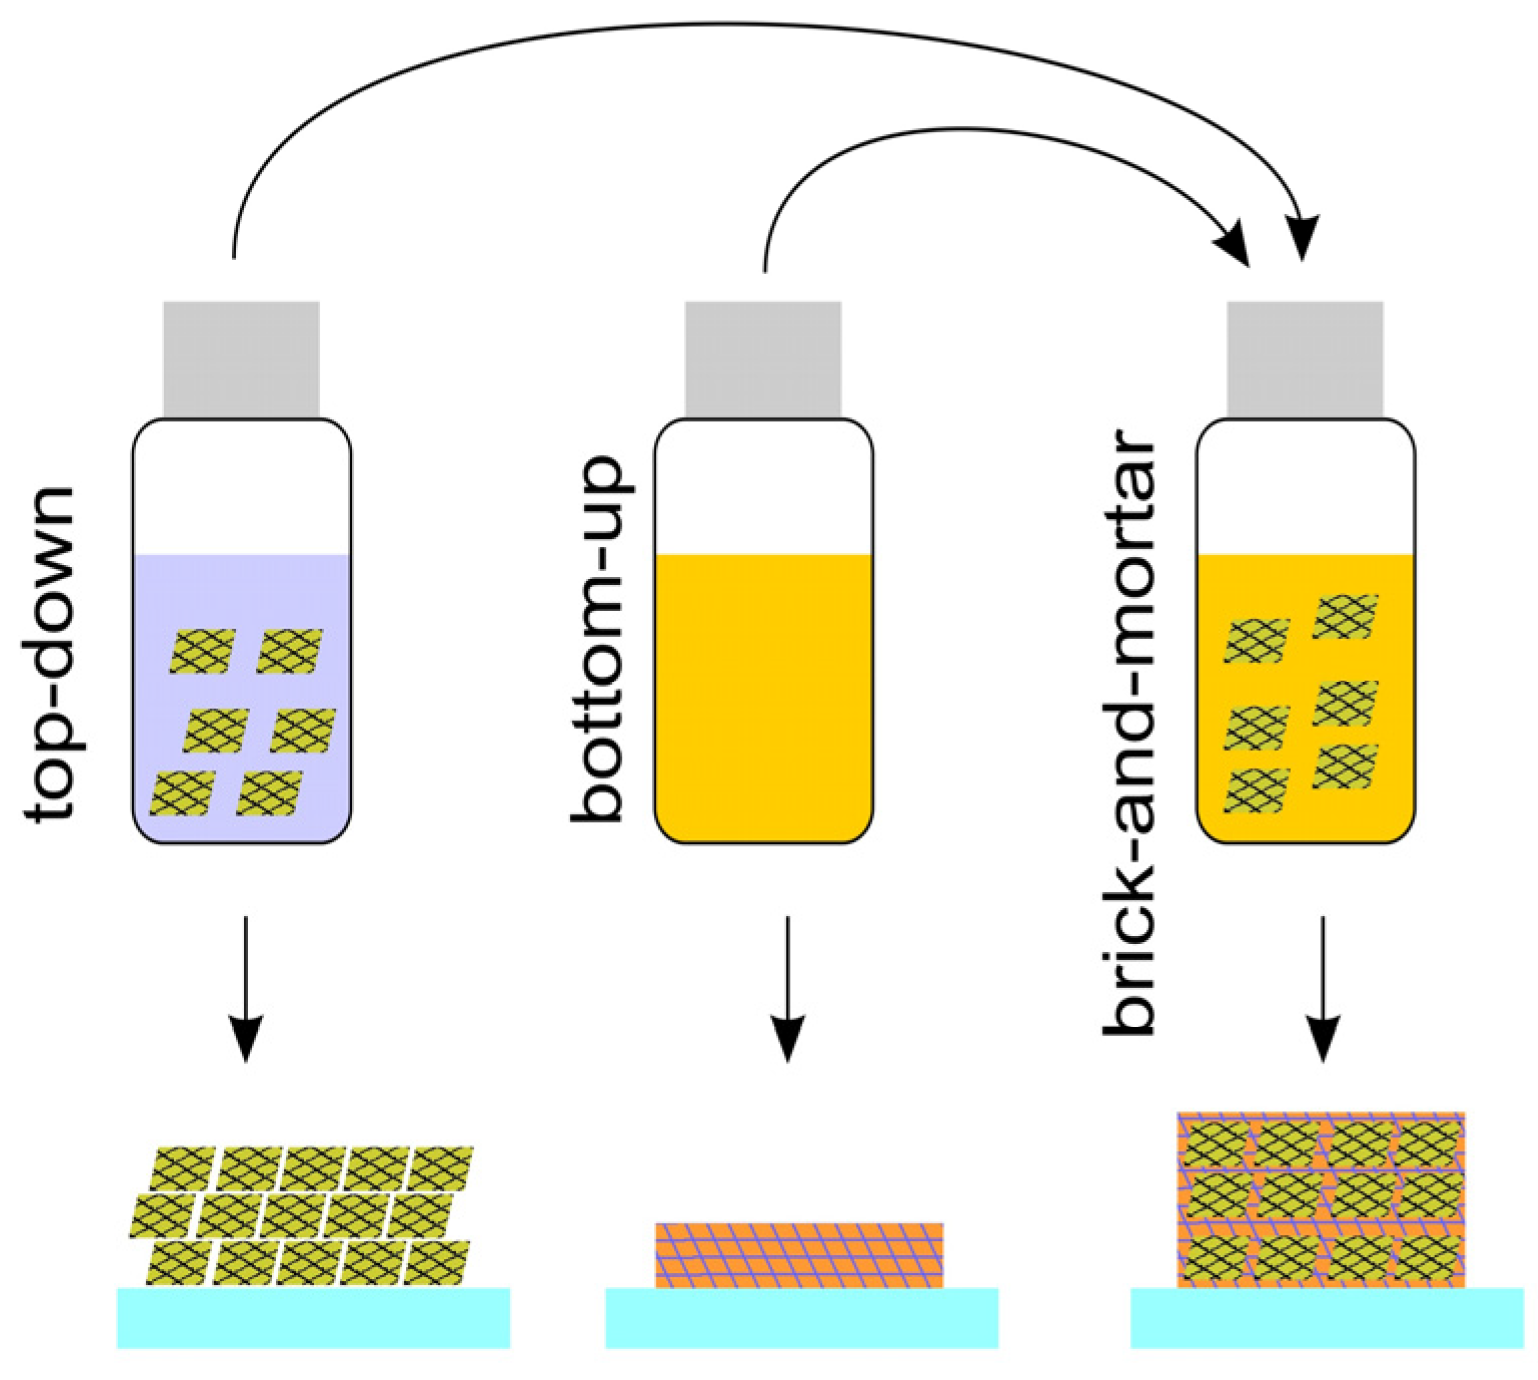
1.1. Tungsten(VI) Oxide Layers Prepared by Top-Down Approach

Ball milling is commonly used in industrial mass production for ores, ceramics, and pigments [33]. The milling technique is quite suitable for morphological modifications of nanostructures and It comes with an advantage of low-cost preparation can use it at room temperature [34]. Ball milling is advantageous over laser ablation in terms of large-scale production [35]. Ball milling is a widely used technique for synthesizing amorphous materials [36]. A miller setup was designed to reduce WO3 to metallic tungsten [37,38].

1.2. Tungsten(VI) Oxide Layers by Bottom-Up Approach

Different tungsten precursors were used in the literature for formation of tungsten(VI) oxide films via the sol–gel method. Suitable structure-directing agents and binders help in tailoring the morphology of WO3 thin films. The peroxotungstic acid (PTA) derivatives are widely reported for casting tungsten(VI) oxide films in the sol–gel route. De Moura, D.S. et al. reported on a system to synthesize WO3 powders via PTA and polyvinyl alcohol as precursor [39]. Fang, Y. et al. reported WO3 films derived from the sol–gel synthesis of acetylated peroxotungstic acid (APTA), and polyethylene glycol layers deposited by spin coating [40]. Işık et al. reported the influence of tungsten(VI) oxide microstructures on the electrochromic properties obtained from tungsten peroxo complexes via the sol–gel method for the application of tungsten coatings [41]. The authors of article [36] published a study on the formation of thin oxide layers of modified tungsten chloride by the sol–gel method. Zhang et al. reported on the formation of thermally stable mesoporous tungsten oxide films by the sol–gel method using a surfactant [42].

1.3. Fabrication of WO3 Layers by Brick-and-Mortar Approach

The brick-and-mortar approach serves as a connection matrix, combining the two aforementioned methodologies, as shown in Figure 2. The authors of [43] used an innovative brick-and-mortar approach to prepare WO3 nanoparticles and the photoanodes showed high photocurrents of 3.04 mA cm−2.

1.4. Wet Coating Techniques–Deposition of Liquid Formulations onto Substrates

Meyer rod coating is utilized in the production of the prepared inks for the larger electrodes to achieve uniform thickness, without the need for any additional processes. Ojeda, M. et al. reported on the fabrication of WO3 thin films using a simple spin-coating route [44]. Sadale and Neumann-Spallart drop-casted WO3 films to study the degradation of azo dyes [45]. Wang et al. [46] studied the deposition of tungsten trioxide films with photocatalytic and electrochromic properties by synthesizing a precursor solution with WO3 powder in hydrogen peroxide. Table 1 summarizes the comparative analysis of wet coating methods used for depositing liquid formulations on substrates.
In this study, the authors synthesized three distinct types of coatings from two precursors. The aim of the study is to investigate the physicochemical properties of fabricated tungsten(VI) oxide photoanodes for the purpose of advanced oxidation processes in water treatment. The two different types of AOPs (photocatalysis and electrocatalysis) are utilized in this study to minimize the operational costs of the process and increase the efficacy of the pollutant degradation. The preparation methods used include ball milling, sol–gel, and brick-and-mortar methods, and wet coating deposition techniques for fabrication. The photocatalytic performance of the coated compositions is examined in tap water.

2. Materials and Methods

2.1. Materials

The following precursors and solvents were utilized:
  • Tungsten(VI) oxide, Sigma Aldrich, Billerica, MA, USA;
  • Isobutyl alcohol p.a, Penta, Prague, Czech Republic;
  • Tungstic acid (99%), Sigma Aldrich, Billerica, MA, USA;
  • Tungsten fine powder, Sigma Aldrich, St. Louis, MO, USA;
  • Hydrogen peroxide (15%), Penta, Prague, Czech Republic;
  • Distilled water;
  • Acetic acid (98%), Chemapol, Prague, Czech Republic;
  • Dowanol® PM (1-methoxy-2-propanol, ≥99.5%), P–LAB, Prague, Czech Republic;
  • Neodisher® LM3, Dr. Weigert, Hamburg, Germany;
  • Perchloric acid (60% solution), Sigma Aldrich, Billerica, MA, USA;
  • Hexanol (98%), Chemapol, Prague, Czech Republic;
  • Ethanol, (absolute), Sigma Aldrich, Billerica, MA, USA;
  • Isopropyl alcohol (≥98%), Sigma Aldrich, Billerica, MA, USA;
  • Glycerol, Penta, Prague, Czech Republic;
  • Tap water;
  • Acetylated peroxotungstic acid (APTA).

2.2. Preparation of Precursor Stock Solution/Dispersions/Mixture

2.2.1. WO3 Nanoparticles Stock Dispersion:

The mixture to be milled was a 20% dispersion of WO3 in isobutanol. We placed 11.2 g of tungsten(VI) oxide powder into a 150 mL beaker with 56 mL of isobutanol and 45 g of glass beads with a diameter of 1 mm. The assembled ball mill was turned on at 850 RPM and allowed to grind for 96 h. After grinding, the dispersion was poured through a nylon sieve into a reagent bottle and stored for future use.

2.2.2. APTA Stock Solution

We poured 10.4 g of tungsten powder into a flat bottom flask. The flask was mounted on a rack and placed in an ice bath where the temperature was maintained at 10 °C. In a beaker, 64 mL of 30% hydrogen peroxide was mixed with 6.4 mL of distilled water. This solution was slowly added dropwise to the tungsten powder. After all the peroxide had been added dropwise with the distilled water, the tungsten was filtered to give a colorless peroxo-tungstic acid (PTA) solution. This solution was refluxed in the presence of 98% acetic acid for 48 h at 55 °C. The resulting yellowish solution was evaporated in a vacuum to give powdered APTA. The APTA stock solution is prepared by mixing powdered APTA in isobutanol.

2.2.3. WO3-APTA Stock Mixture

From the prepared 20% WO3 stock dispersion and 20% APTA stock solution, a coating formulation was prepared by first mixing 0.4 g of powdered APTA with 1.6 g of isobutanol. This mixture was dissolved at 60 °C, and, after dissolution, 2 g of 20% WO3 suspension was added to this mixture.

2.3. Coating

2.3.1. Substrate Preparation

Conductive FTO substrates are used as substrates for depositing the stock dispersion/solution/mixture. The substrates had to be degreased and dirt-free before applying the layers to ensure good surface wettability. The solution of demi-water was prepared with a ratio of one part Neodisher and nine parts of water. After the ultrasonic bath, we rinsed the slides in a beaker with the demi-water. When preparing the substrates for coating, we dried the substrate with a stream of air as the last step. The resistance of the FTO substrate was 10–15 ohms per sq.

2.3.2. Inkjet Printing

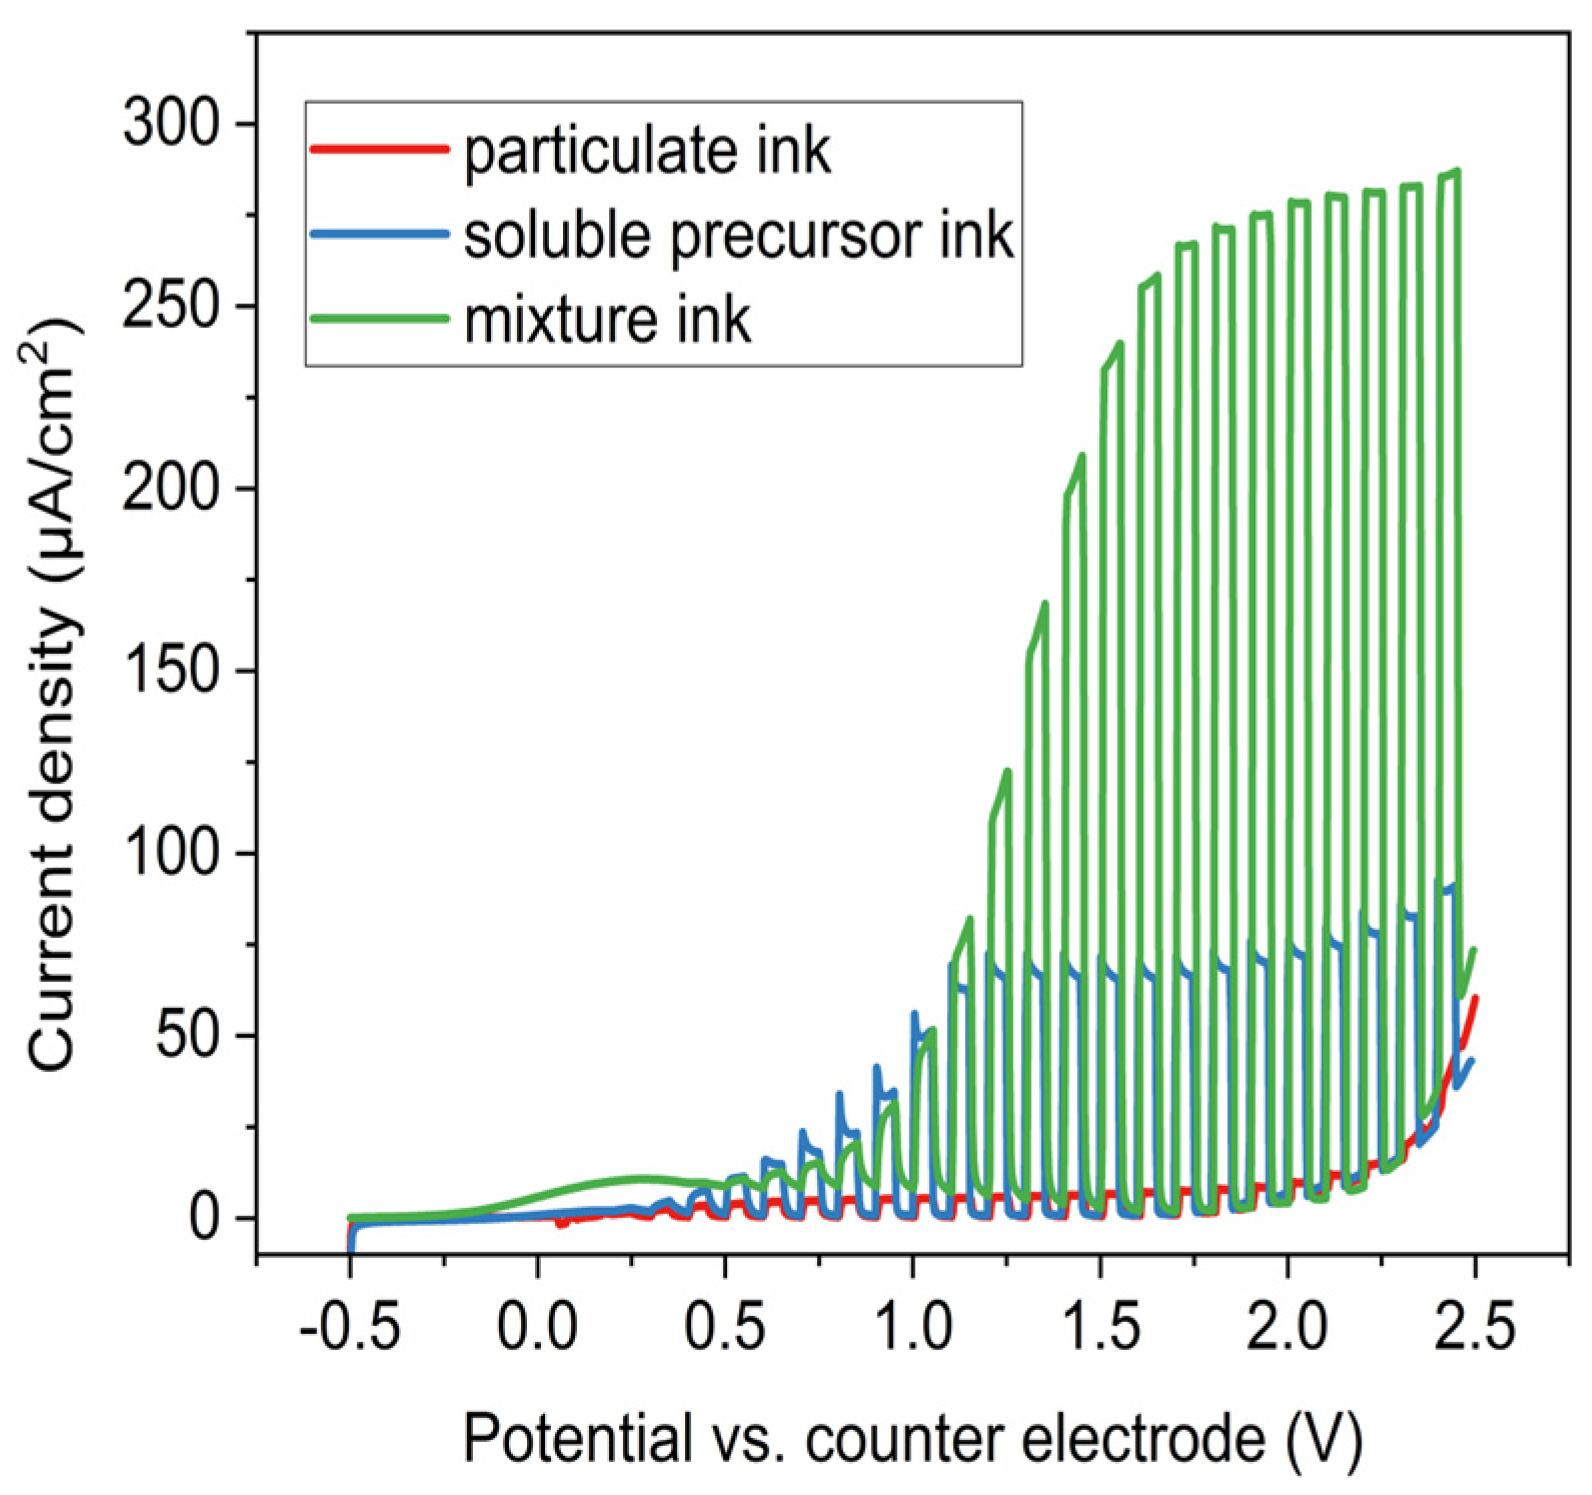
  • Particulate ink: The coating ink was made by mixing 2 mL of each 20% WO3 stock dispersion and hexanol.
  • Soluble precursor ink: The coating ink was made by mixing 20% APTA stock solution (0.6 g of powdered APTA in 2.4 g of isobutanol) in 1 mL of hexanol.
  • Brick-and-mortar ink: The coating ink was made by mixing the WO3-APTA stock mixture and hexanol in a 1:1 ratio. For each prepared formulation, 2 mL was taken and injected into the cartridge. Then, two layers of the composition (1 cm2) were printed on the prepared glass substrates.

2.3.3. Meyer Rod Coating

The coating formulation for the particulate, soluble precursor, and brick-and-mortar inks was prepared by mixing 1 mL of each stock dispersion, solution, and mixture, respectively, with 1 mL of ethanol and 1 mL of isopropanol. From each formulation, 80 µL was deposited onto the FTO substrates using a spiral rod of 30 microns thickness with a working speed of 5 cm s−1.

2.4. Post-Deposition Treatment

The glass substrates printed with particulate ink were annealed at 300 °C, the soluble precursor at 500 °C, and the brick-and-mortar ink at 400 °C for a duration of 30 min. The Meyer rod-coated FTO substrates of the particulate, soluble precursor, and brick-and-mortar inks were annealed at 450 °C to remove any excess residue. The annealing temperatures of the particulate ink, soluble precursor, and brick-and-mortar ink were decided according to the highest photocurrents obtained for all three different inks when annealed at different temperatures ranging from 0 °C to 500 °C, as shown in Figure 5, Figure 6 and Figure 7.

2.5. Characterization

The characterization techniques can be seen in Supplementary Materials.

3. Results

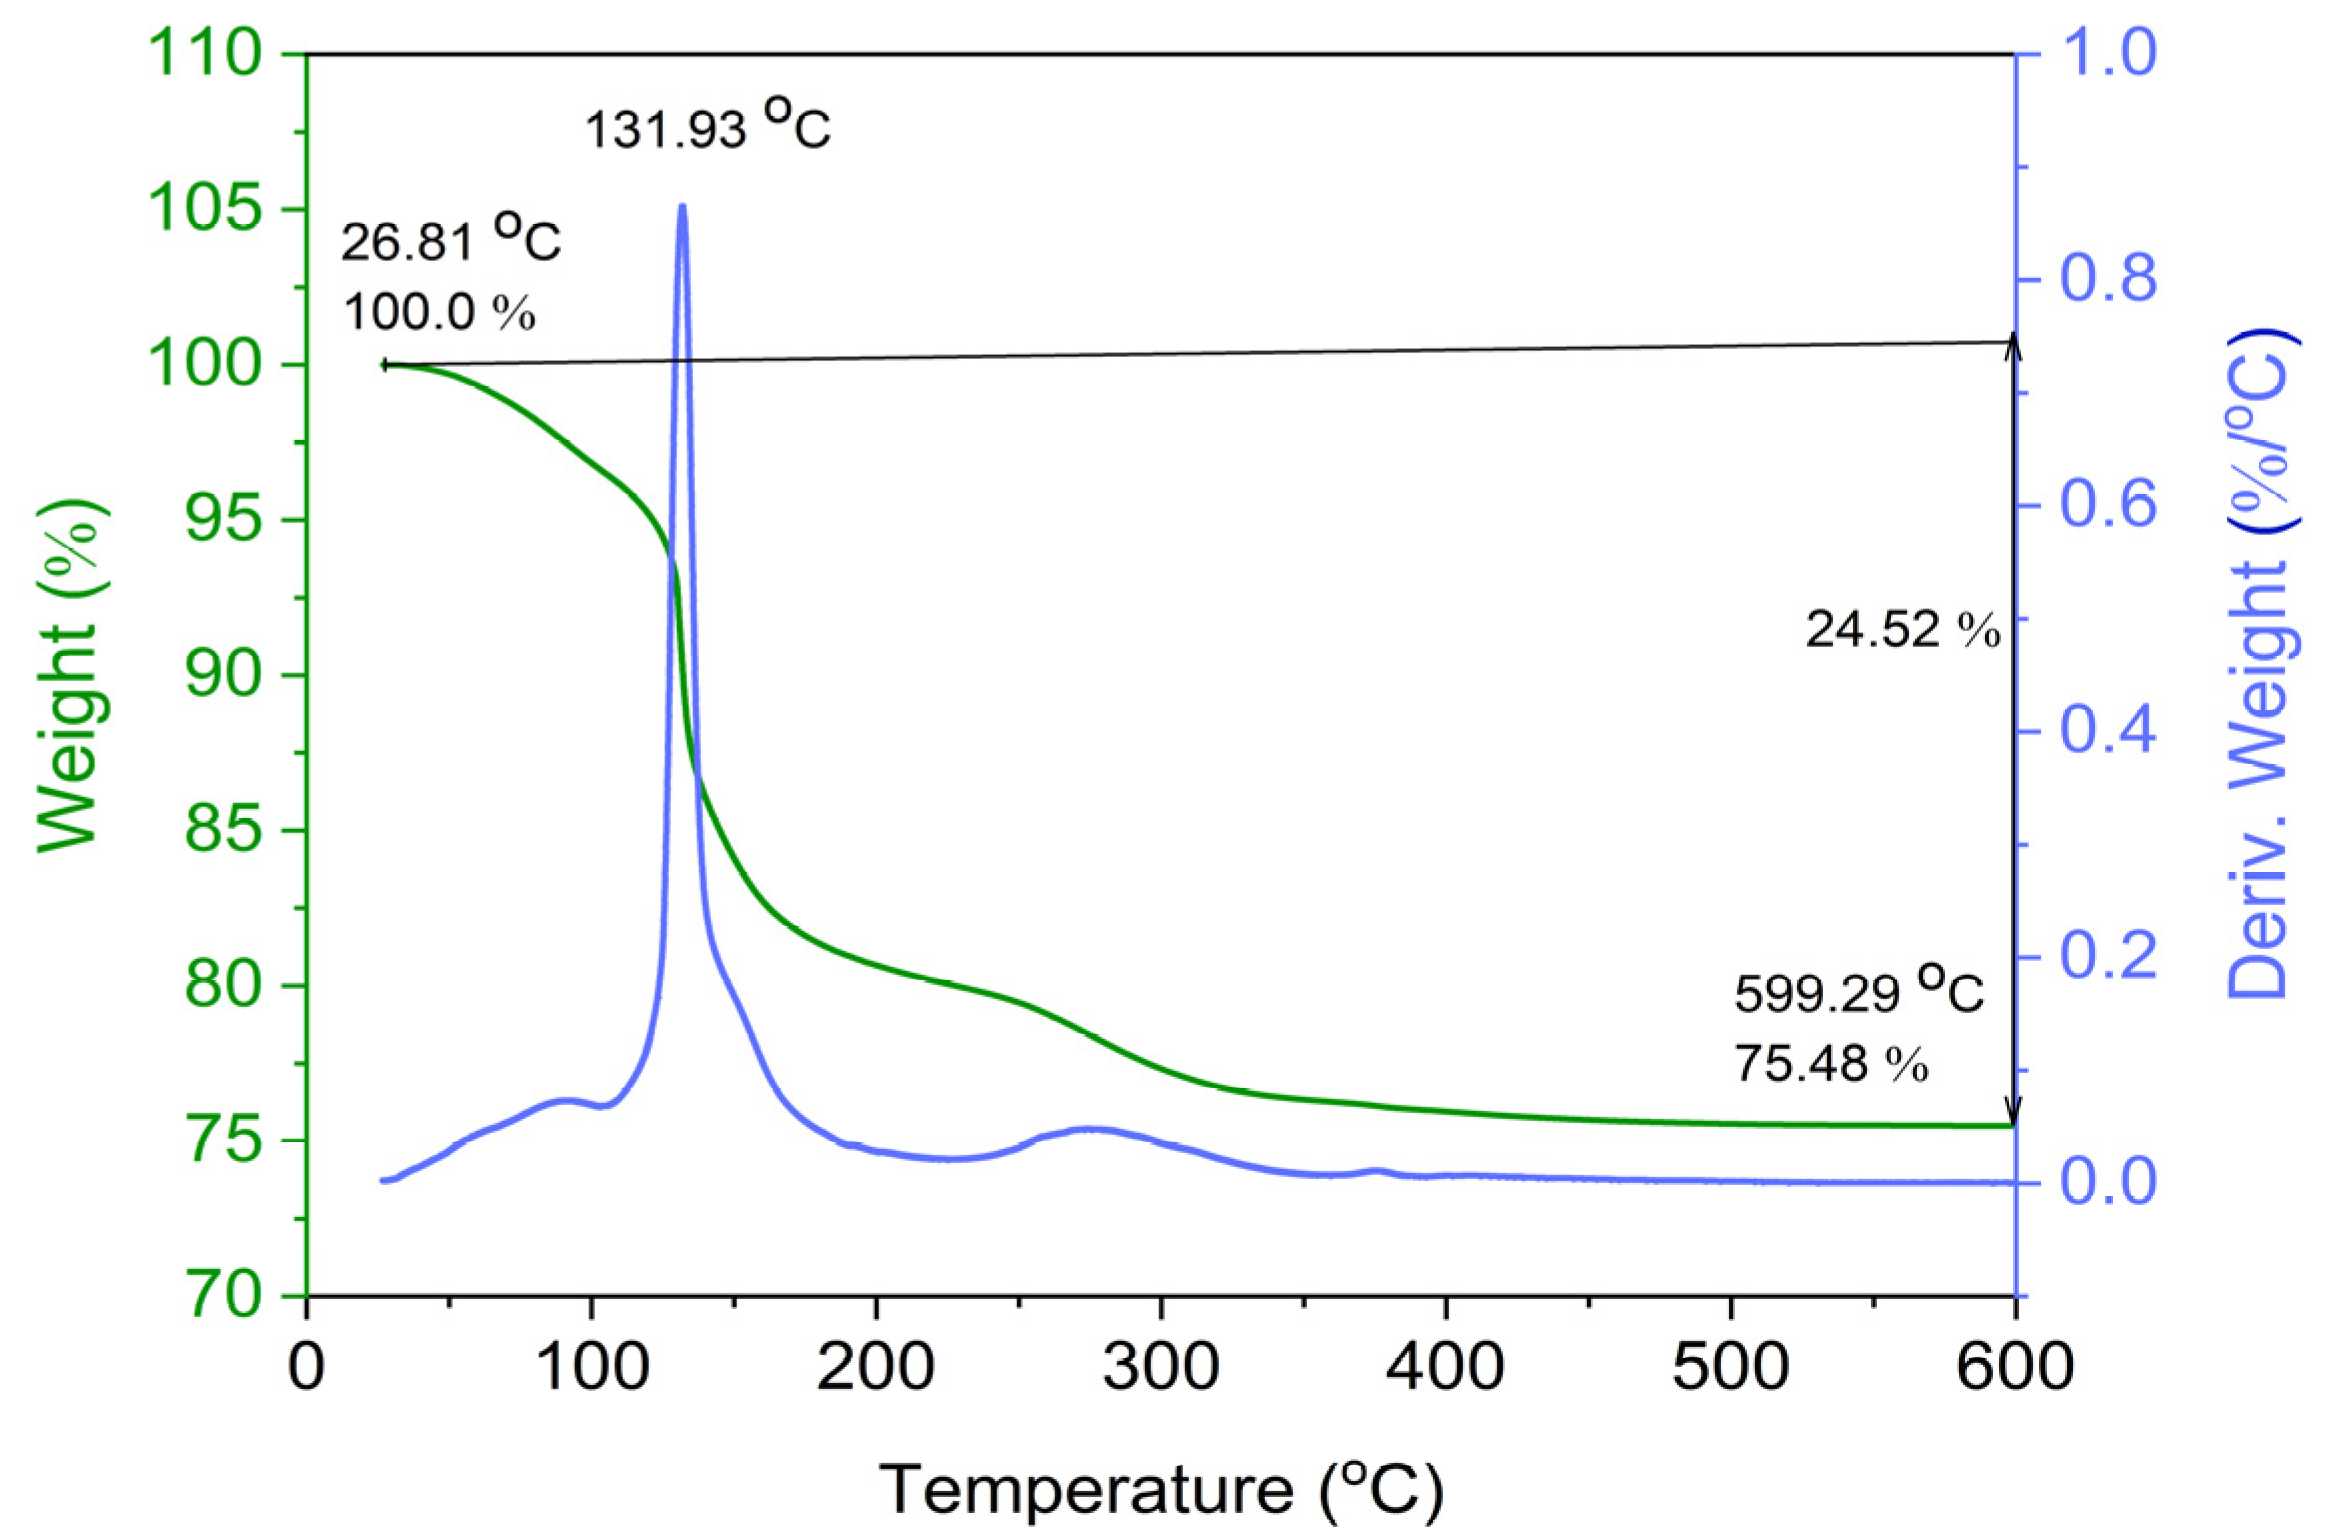
3.1. Thermogravimetric Analysis

Thermogravimetric analysis of the APTA was performed to analyze the behavior of the soluble precursors at different calcination temperatures. After 300 °C, 75% of the composition was left, while the remaining amount was evaporated with an increase in temperature. This can be attributed to the decomposition of the organic component (acetate group) present in the soluble precursor, as shown in Figure 3.

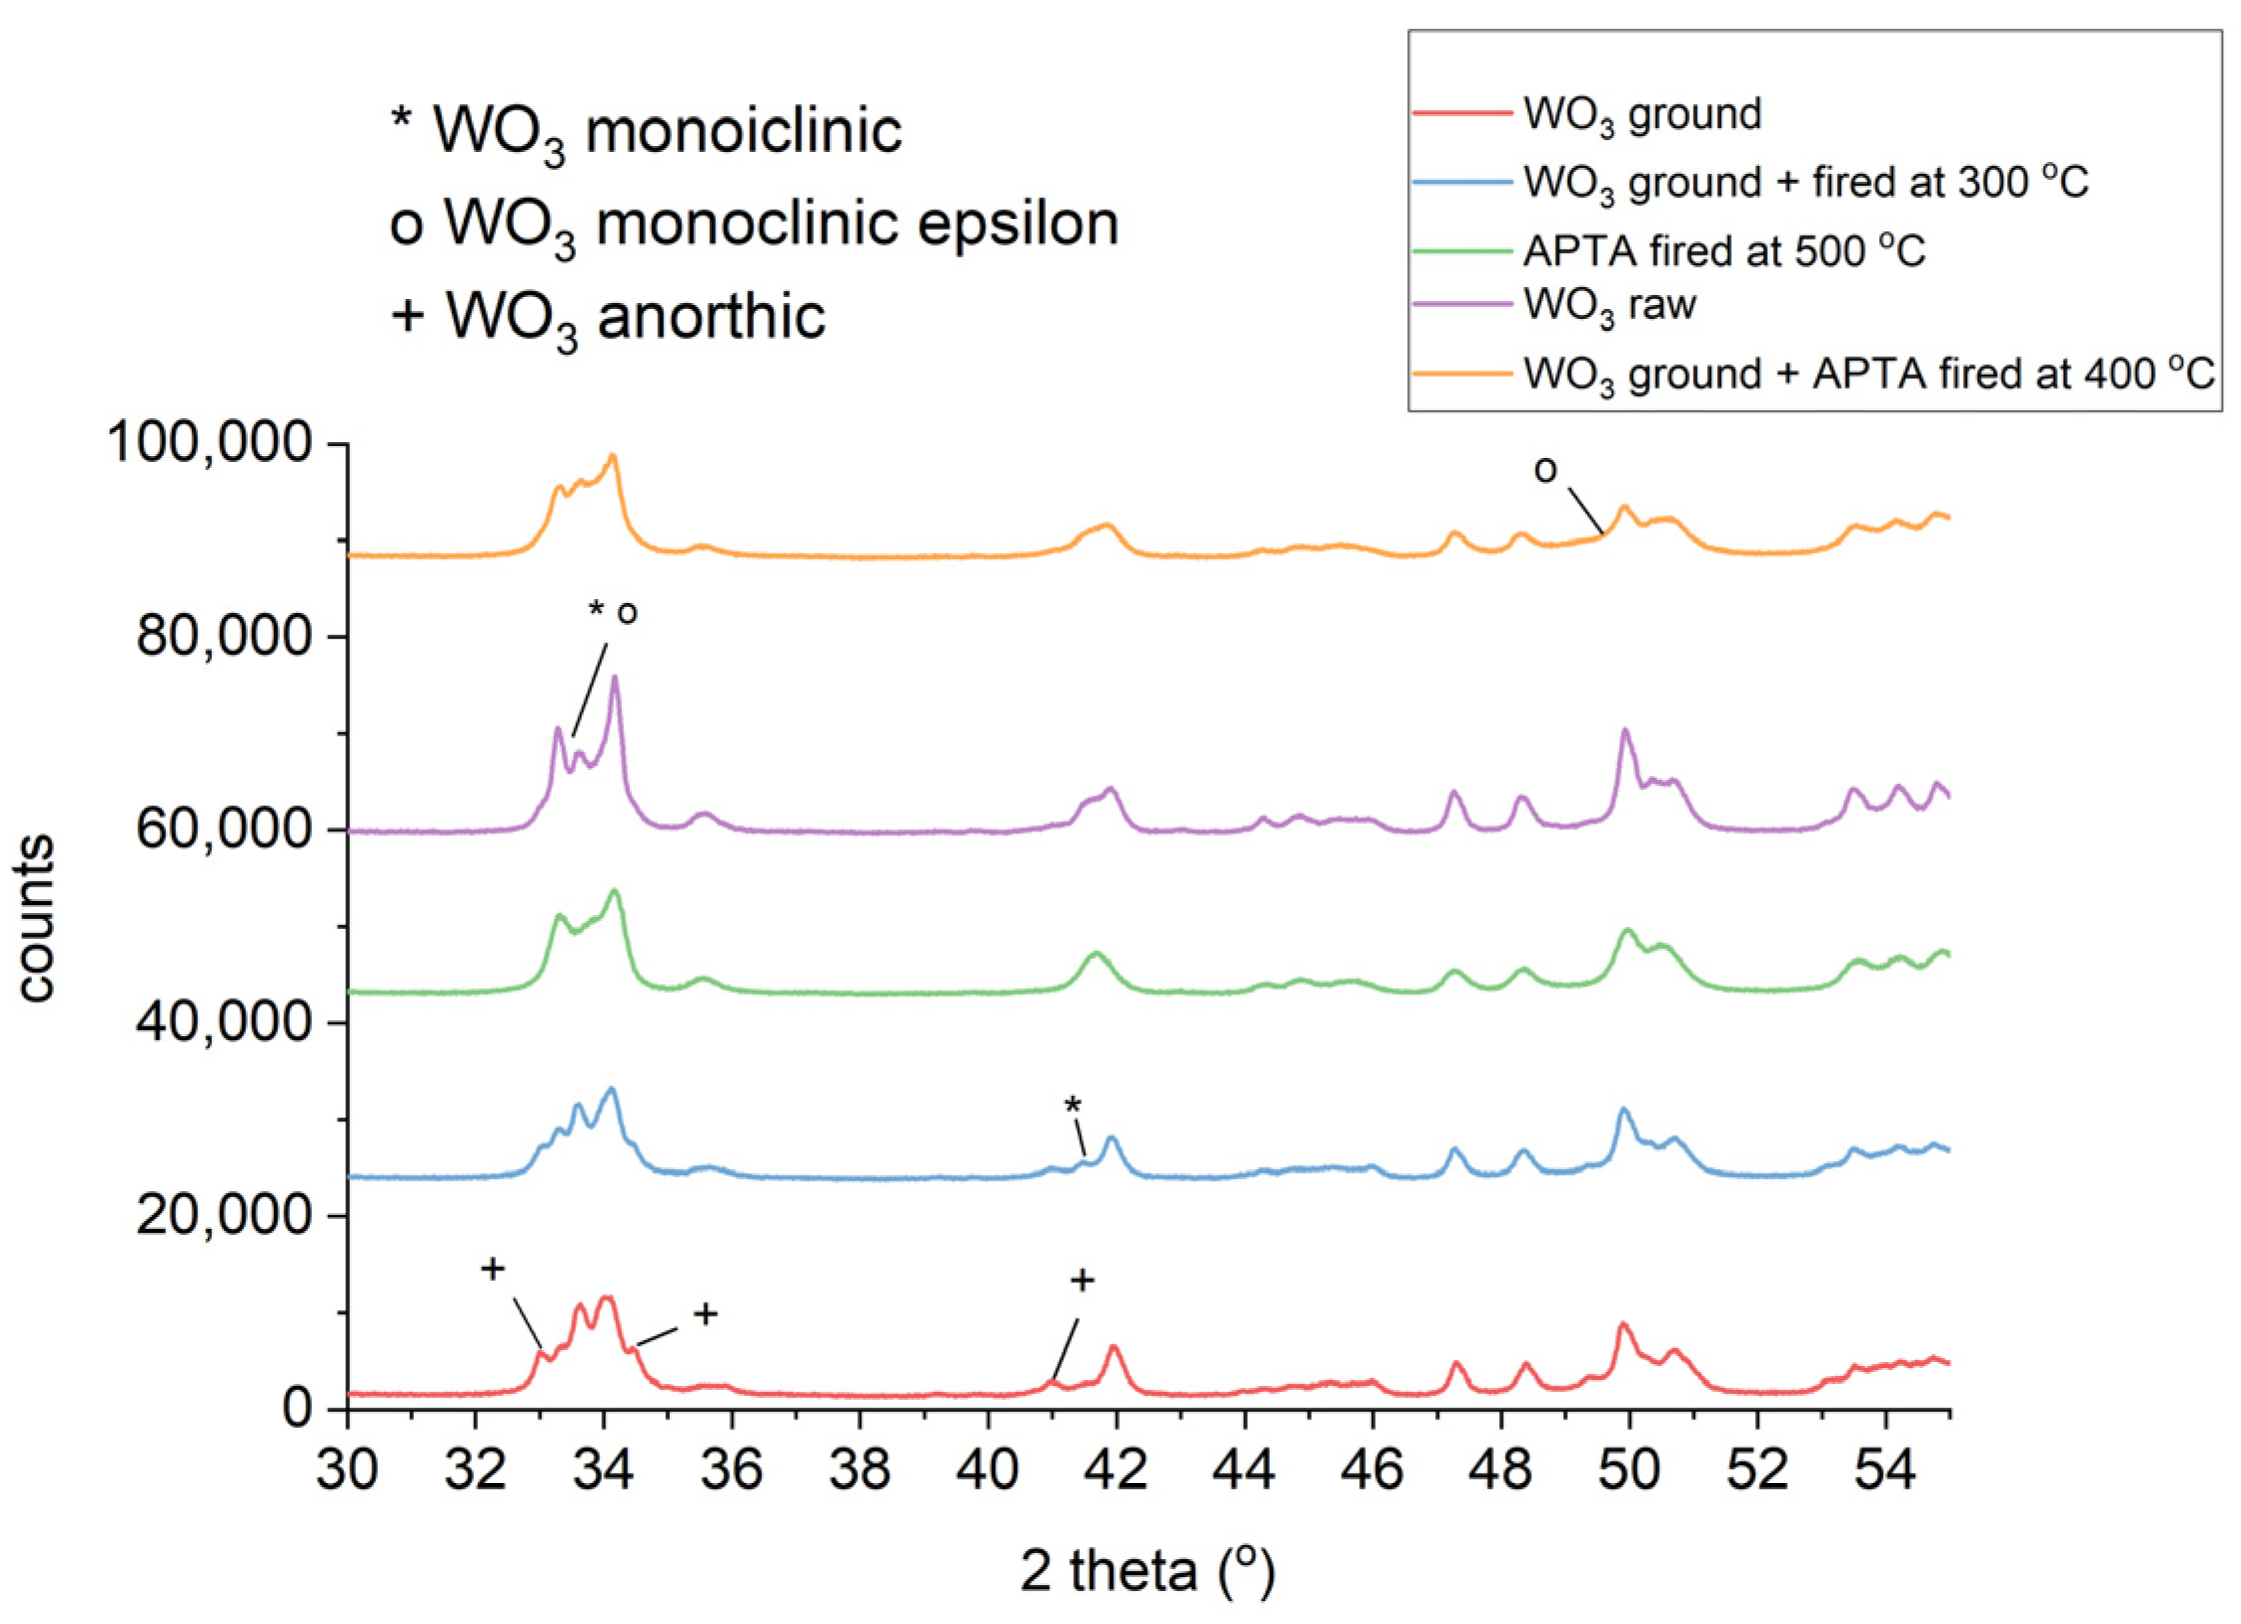
3.2. X-ray Diffraction

Figure 4 shows the overall overview together with the APTA, which appears quite amorphous [62,63,64,65,66]. From the figure, three main positions can be seen where separate phases are located at 33.0°, 41.5°, and 49.5°, and the anorthic phase forms at the 33.0° and 34.7° positions where these diffractions widen. Furthermore, the epsilon phase itself can be seen overlapping with the monoclinic phase at position 33.2°. A separate diffraction of the anorthic phase can be seen at 41.2°, and a separate diffraction of the monoclinic phase can be seen at 41.5°. A separate epsilon phase can be observed at position 49.3°. The other phases overlap again.
The WO3 raw powder had high intensities, indicating that it has the best “grown” crystals. After semi-aging, the crystals will break, and thus the intensity will decrease. In terms of abundance, the raw sample had a majority of the basic monoclinic phase (67%) (JCPDS No: 043-1035), a smaller amount of the anorthic phase (25%) (JCPDS No: 071-0305), and a complete minimum of the epsilon phase (9%) (JCPDS No: 087-2392). This can be observed in Figure 4, shown with circles/crosses. When the raw WO3 sample was ground/milled, a mechanochemical modification took place, and the representation of the different phases was reversed, as there was a transformation from the basic monoclinic phase, which was 57%, to the epsilon (15%) and anorthic (27%) phases. This can be observed in the same figure. When the WO3 was ground and fired at 300 °C, energy was supplied by sintering, and the crystals recrystallized. The transformation from the basic monoclinic phase, which was reduced to 49%, to the anorthic phase (12%) and especially to the epsilon phase (39%) was under way.
Subsequently, the stock amorphous APTA was taken and fired at 500 °C. The stock APTA was completely transformed to the monoclinic phase after firing. The last sample was a mixture that was fired at 400 °C. The WO3-APTA stock mixture contained a basic monoclinic phase (68%), an anorthic phase (17%), and an epsilon phase (15%). The epsilon phase was not peak shaped, but it is widespread as it is a very small crystal. It can be observed at position 49.3°. The types of crystalline phases present in the stock mixtures are summarized in Table 2.

3.3. Inkjet Printer Sample Series

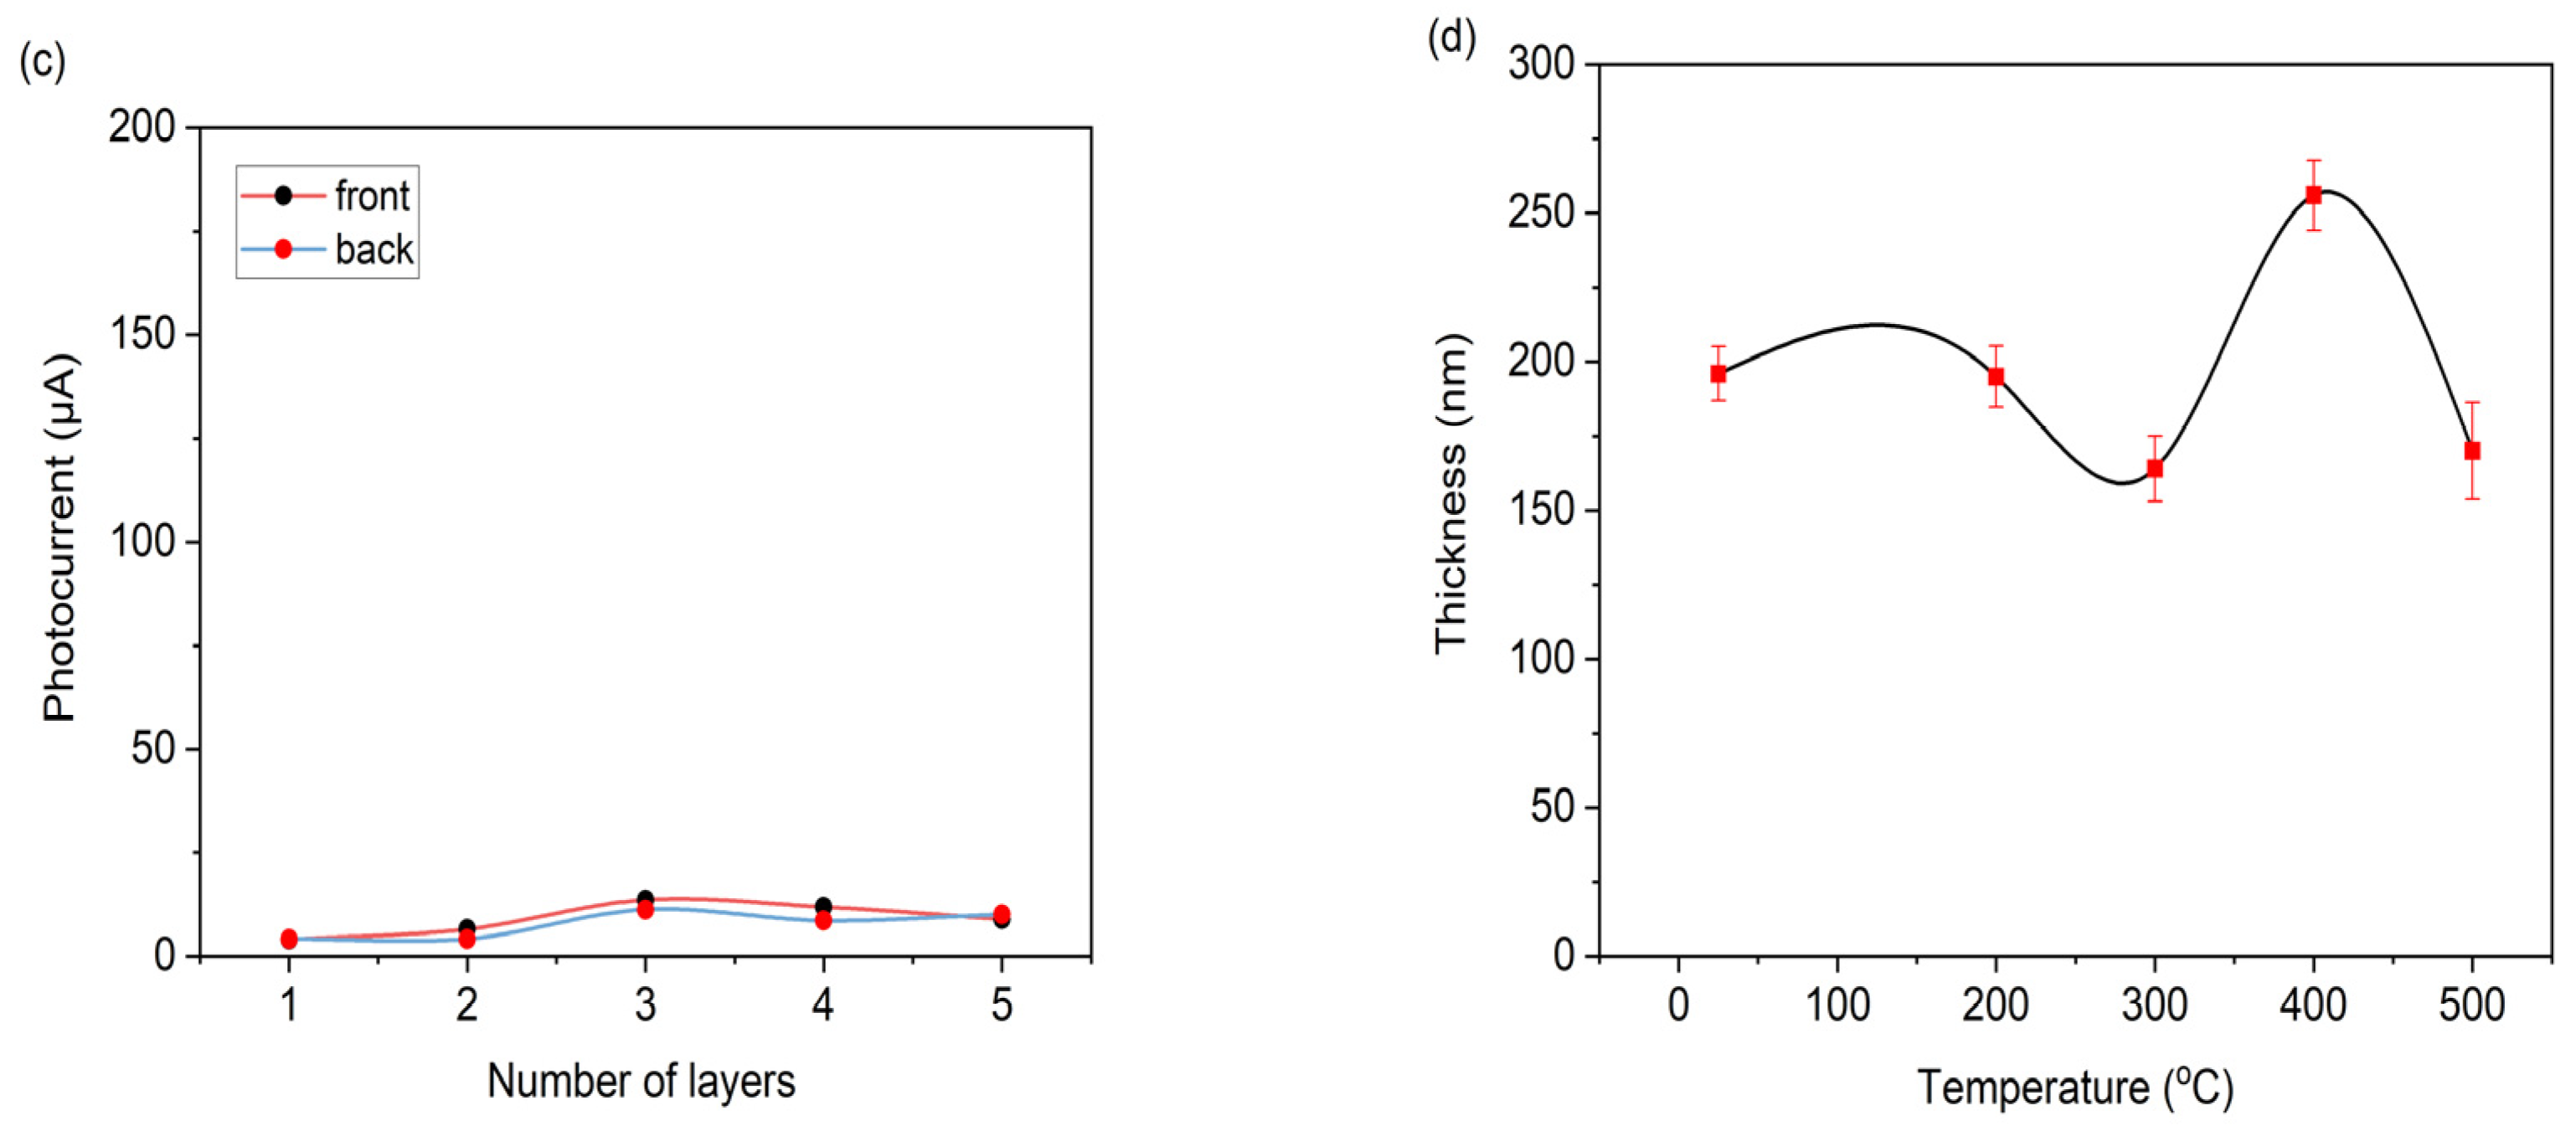
3.3.1. Particulate Ink

From Figure 5a, it was possible to obtain the dependence of the photocurrent values on the sintering temperature.
Figure 5. (a) Example of linear chopped voltammetry for inkjet-coated composition sintered at 300 °C. (b) The plot of photocurrent dependence at different temperatures. (c) The measurement of photocurrents as a function of the number of layers for inkjet-coated composition. (d) The thickness of inkjet-coated composition as a function of temperature.
Photochem 04 00006 g005aPhotochem 04 00006 g005b
Due to the curve at 1 volt being very similar, the evaluation was also performed at 0.1 volt, where it was already possible to observe differences in the initial “on set”. By default, samples are evaluated at 1 volt. It was already clear that the highest photocurrent was reached at a firing temperature of 300 °C. Samples of the particulate ink were measured in 0.1 M HClO4 at the intensity of irradiation 1.5 mW cm−2. The results are summarized in Figure 5b. After measuring the photocurrent, the thicknesses of the applied composition were measured depending on the sintering temperature. From the results, it was evident that the thickness of the particulate layers does not change systematically with the sintering temperature, as seen in Figure 5d. Figure 5c shows the relationship between the number of layers and the photocurrent.

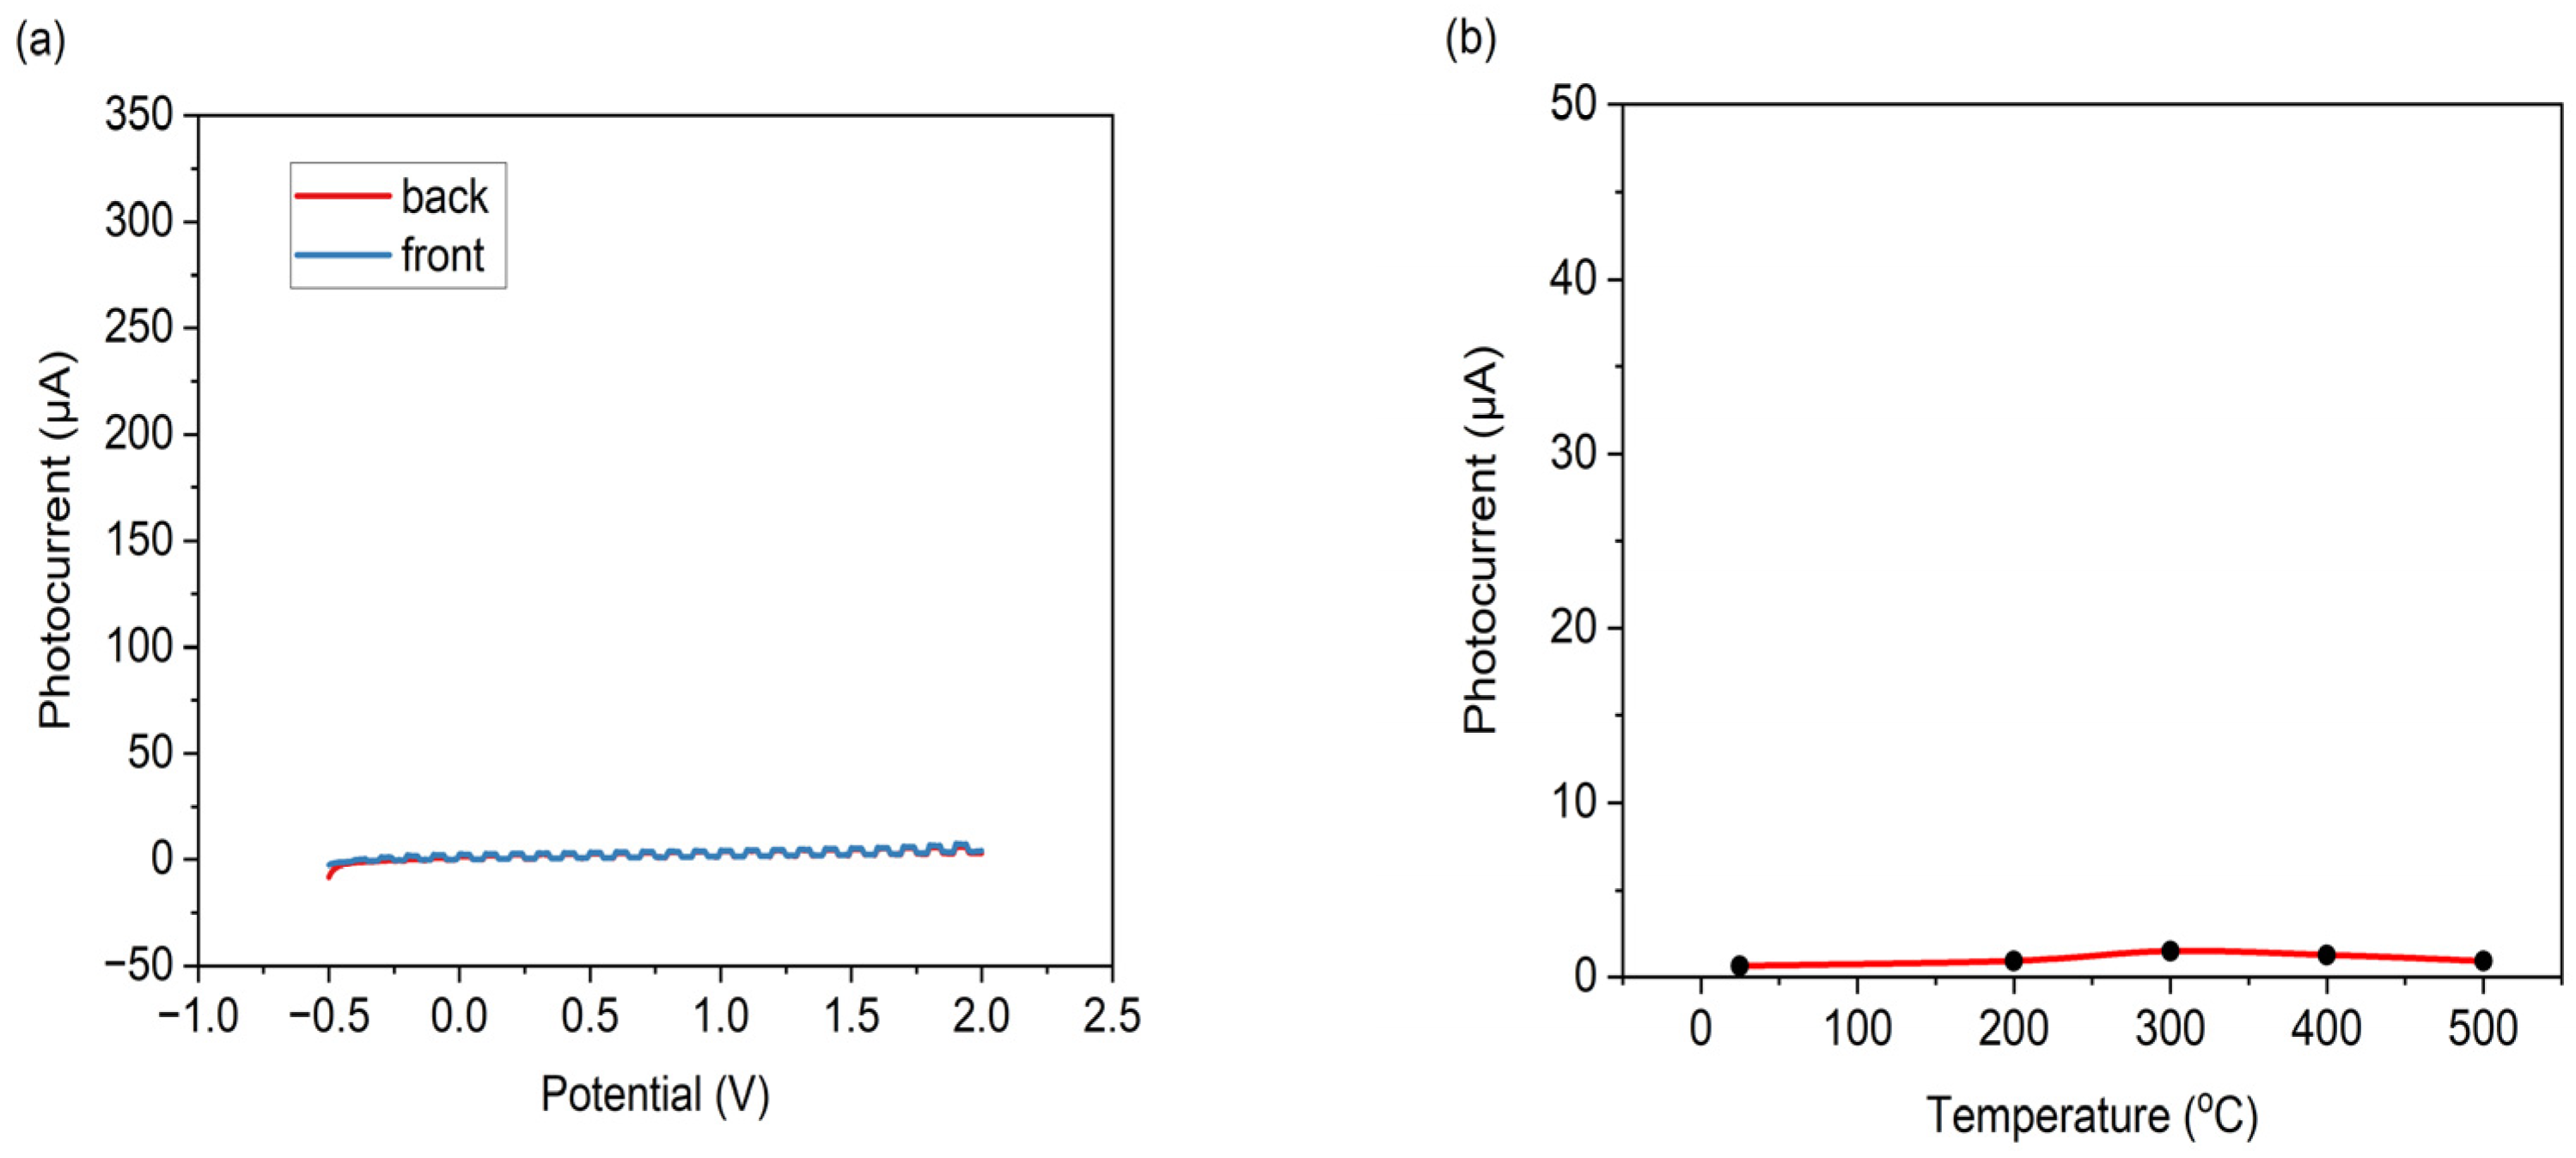
3.3.2. Soluble Precursor Ink

Figure 6a shows the typical behavior of a sample of two layers at linear chopped voltammetry. At the beginning of the curve (0.25–0.75 V), it is possible to observe that a “belly” is formed. Only after the input potential has been increased above 0.8 V does the chopped exposure response appear in the current record.
Figure 6. (a) Example of linear chopped voltammetry for soluble precursor ink electrodes sintered at 500 °C. (b) The plot of photocurrent dependence at different temperatures. (c) The measurement of photocurrents as a function of the number of layers for soluble ink-coated electrodes. (d) The thickness of the electrodes is a function of temperature.
Photochem 04 00006 g006aPhotochem 04 00006 g006b
From this, it can be concluded that the layer was reduced to lower oxidation states around the lower potentials with simultaneous intercalation of H+ cations and the formation of a characteristic blue color. In the region above 0.8 V, the layer is re-oxidized back to WO3, accompanied by discoloration and photocurrent generation during irradiation. The second printed composition used soluble precursor ink (Figure 6b). First, it was necessary to determine its sintering temperature. The result of the dependence of the photocurrent on the applied voltage is shown in Figure 3. The measurements were performed at temperatures of 200 °C, 300 °C, 400 °C, and 500 °C. Figure 6c shows a graph evaluating all the layers’ elongated linear chopped voltammetry. The photocurrent increases with each additional layer, which can be observed in both modes of exposure. They developed a stable plateau at 1.5 V, and Figure 6d shows that the layer thickness decreases slightly with the increasing temperature.

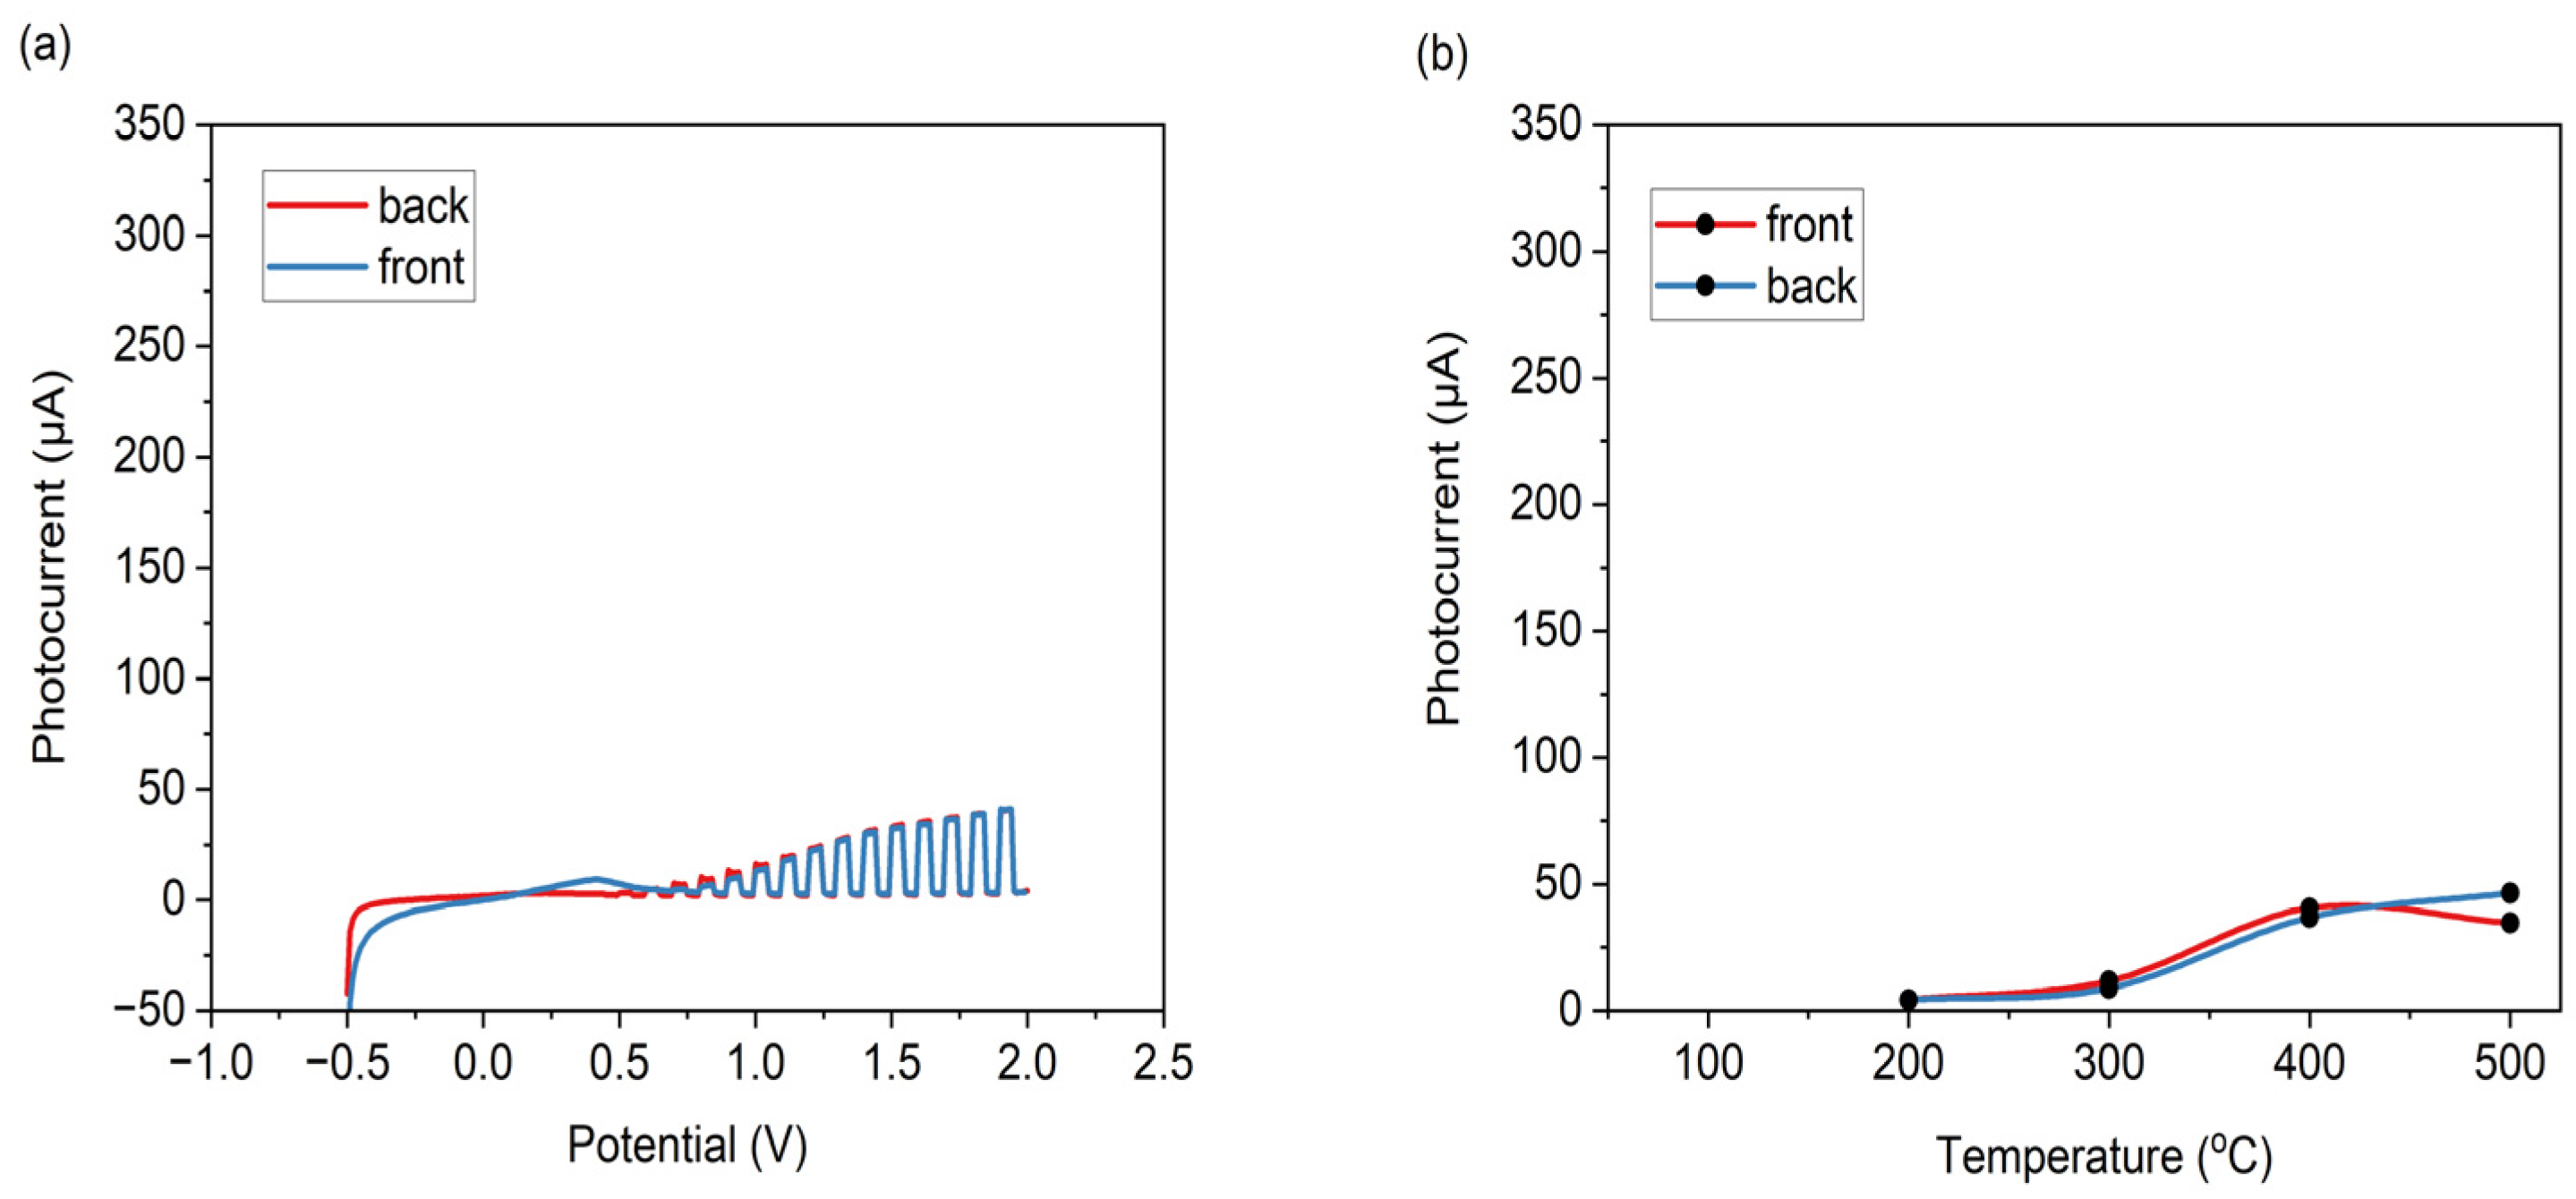
3.3.3. Brick-and-Mortar Ink

The plot in Figure 7a shows an example of linear chopped voltammetry for the brick-and-mortar ink sample. The values are plotted at 1.7 V, as a stable plateau is formed. Figure 7b describes the best sintering temperature obtained for the sample with the inkjet printer method. The photocurrent increases with the increase in the number of layers, as shown in Figure 7c. In Figure 7d, it can be seen that the thickness of the layer decreases with an increase in temperature due to the presence of the soluble precursor in the printed composition.
Figure 7. (a) Linear chopped voltammetry plot for an inkjet-coated composition of brick-and-mortar ink sintered at 400 °C. (b) The resulting plot of photocurrent dependence for coated composition as a function of temperatures. (c) The measurement of photocurrents as a function of a number of layers for inkjet-coated electrodes. (d) The thickness of inkjet-coated composition is fired at different temperatures by a profilometer.
Photochem 04 00006 g007aPhotochem 04 00006 g007b
All the coated compositions are measured in 0.1 M HClO4 at 1.5 mW cm−2. From the properties of the inkjet printing method, the determination of sintering temperature for the particulate ink composition was evaluated as 300 °C, from Figure 5b, as the highest photocurrent was achieved. When measuring the electrical properties of particulate ink photoanodes (1–5 layers), which were printed on FTO glass and fired at 300 °C, the photoanode consisting of three layers showed the best results. At 1 V, when a stable plateau was formed, the photocurrent reached 1.35 × 10⁻⁵ A at front exposure and 1.12 × 10⁻⁵ A in backlight. The second composition used the soluble precursor ink. The sintering temperature was chosen to be 500 °C due to the highest achieved photocurrent from the linear chopped voltammetry measurements. When measuring the electrical properties of the photoanodes with the soluble precursor (1–5 layers), the best photoanode was with five printed layers of the composition. During frontal exposure, the photocurrent reached 1.43 × 10⁻⁴ A and in backlight reached 1.24 × 10⁻⁴ A. These values were read at 1.5 V as a stable plateau was formed. The last composition studied was the brick-and-mortar ink. Here, a temperature of 400 °C was chosen as the best sintering temperature. This temperature was evaluated as the best by measurement, as in the previous two cases. At 1.7 V, the measurement reached its maximum in most of the layers. The best results were achieved by a photoanode with five printed layers of the composition. At anterior exposure, 1.9 × 10⁻⁴ A was achieved at front exposure and, at rear exposure, values of 7.24 × 10⁻⁵ A at 1.7 V were achieved.

3.4. Meyer Rod-Coated Sample Series

The second set of samples was fabricated with the Meyer rod coating technique. While the inkjet was very useful for enabling us to fabricate multilayered samples and allowed us to investigate the influence of variable thickness, the Meyer rod technique was adopted for the larger format sample series for two particular reasons: first, we wanted to confirm if the mixed ink would perform equally well when much thicker coatings are deposited, and second, we wanted to fabricate larger photoanodes which would be employed in a pilot electrochemical cells study with tap water as the electrolyte. Generally, the Meyer rod is more suited to the deposition of coating formulations on bigger electrodes as compared to the inkjet printer samples of photoanodes. With simple motorized coating machines, sheet substrates up to an approximate A3 size can be coated with reasonable evenness and repeatability. Once the Meyer rod samples were coated and processed, we observed a similar trend of the highest photocurrents for the brick-and-mortar ink, when coated using the Meyer rod technique for a single layer electrode, in comparison to the inkjet-coated photoanodes based on voltammetric measurements of the conductive electrolyte (perchloric acid), as shown in Figure 8.
When compared to the particulate ink and soluble precursor alone, the brick-and-mortar ink coated using the Meyer rod demonstrated the highest photocurrents for single-layer deposition. It developed a stable plateau between +1.5 and +2.5 volt bias. It can be assumed that the synergistic effect of the coexistence of the crystalline and amorphous phases in the layer contributed to this result, where the crystalline phase contributes to the absorption of incident radiation and the generation of charge carriers, and the amorphous phase contributes to the transport of the photogenerated electrons to a conductive substrate.
Furthermore, we carried out a simple proof-of-concept experiment and evaluated the photocurrent delivered by the fabricated photoanodes in a scenario closely matching their practical application. As suggested in the introduction section, the photoanodes described in this work may be employed in electro-assisted photocatalytical cells for water remediation purposes (either potable water, swimming pool water, or wastewater). The photocurrent delivered by the cell is the crucial quality factor because it directly reflects the rates of oxidation and reduction reactions taking place on the anode and cathode, respectively. At the same time, it is important to realize that the photocurrent magnitude is limited by many other material and construction factors of the cell (electrolyte conductivity, the concentration of hole and electron scavengers, effective interface area of the electrodes, and, in the case of low-conductivity electrolytes, also the distance between electrodes). In order to investigate the properties of the bigger Meyer rod-coated electrodes, the best performing mixture-coated ones were used to assemble a model electrophotocatalytic cell with gold and carbon cathodes. Tap water with various amounts of glycerol was used as an electrolyte.
From Figure 9a showing the photocurrent vs. time dependence, it is evident that mass transfer is limiting the photocurrent. At 30 s, when the UV lamp is switched on, the current immediately jumps to 0.045 mA cm−2 but quickly decays down to 0.025 mA cm−2. Apparently, it is the cathodic reaction (i.e., the electron scavenging process) that limits the photocurrent because no significant influence of glycerol concentration is apparent at this stage. However, once air bubbling is switched on at 60 s, the current jumps almost to the initial peak level and eventually decays down after 90 s, when bubbling is stopped. This behavior clearly indicates that with the golden cathode, electron scavenging by oxygen is the rate-determining step establishing the bottleneck for the photocurrent. This explanation is further supported by Figure 9b, which depicts the photocurrent delivered by a cell consisting of a carbon cathode. Carbon is well known for its good oxygen-reducing properties, which manifest themselves in significantly higher magnitudes of the photocurrent (app. 0.055 mA cm−2), and which is not further influenced by bubbling air. Glycerol was adopted as an oxidizable solute for the electrophotocatalytic experiment. Although glycerol can hardly serve as a model pollutant for photocatalytic remediation experiments because its chemical structure is much different from typical real aqueous pollutants (dyes, aromatic hydrocarbons, antibiotics, hormones etc.), it is still a very popular oxidizable solute for both photocatalytic and electrocatalytic experiments. It is a very efficient photogenerated hole scavenger [67] and recently it has drawn much attention as a green raw material for photocatalytic valorization into many products of commercial value [68].
Similar trends but different magnitudes of photocurrent were observed when back-side irradiation (i.e., through the substrate) was used. We again observed an overshoot in photocurrents for the gold counter electrode, shown in Figure 10a, upon switching the UV lamp on. However, this time, both the initial peak and the stabilized photocurrent magnitude were much higher, peaking at up to 0.14 mA cm−2 and leveling at around 0.06 mA cm−2. Air bubbling still contributes to an increase in the photocurrent magnitude, but not as prominently. Apparently, with the back-side irradiation (Figure 10b), the electrons are generated close to the current collector, and therefore there is much less resistance on their way to the collector, which results in higher photocurrent values despite the fact that a significant amount of the incident radiation is attenuated on its way through the glass substrate. However, this time, it looks as if the anodic reaction is the bottleneck for limiting the photocurrent, as the bubbling has less effect, and we expect that the lack of porosity hinders the penetration of the oxidizable solute deep into the anodic layer, resulting in limited hole scavenging.

4. Conclusions

The presented work gives a side-by-side comparison of three distinct fabrication approaches to wet-coated WO3 films. The soluble APTA is representative of the bottom-up synthetic route, the dispersion of milled particles represents the top-down strategy, and their combination is often termed the brick-and-mortar approach. By analogy with the macroscopic building process, small crystalline particles are bonded together by a phase originating from the soluble precursor. In this way, a bi-phase system is created made of two WO3 phases. The TGA analysis is used to study the behavior of the soluble precursor at different calcination temperatures and also to understand the thermal stability of the soluble precursor for the preparation of brick-and-mortar ink.
The photoanodic layers reported in this study are therefore classified as originating from particulate ink, soluble precursor ink, and mixture ink. The particulate ink was thought to contain varied shaped nanoparticles that were distributed in an irregular manner, and the brick-and-mortar ink showed the combination of bricks and compact layers. On the other hand, the soluble precursor ink was discovered to be present as compact layers, and cracks were observed in the layers when they were analyzed using scanning electron microscopy (as seen in the Supporting Information). The poor charge transfers of the compact layers and lack of porosity at the nanoparticulate surfaces were reflected in voltametric studies of the soluble precursor, followed by the particulate ink, which revealed low current densities among all three photoanodes. The brick-and-mortar theory was proven true by electrocatalytic measurements performed on the mixer ink, demonstrating very high photocurrents among all three created photoanodes. It can be assumed that the synergistic effect of the coexistence of the crystalline and amorphous phases in the layer contributed to this result, where the crystalline phase contributes to the absorption of incident radiation and the generation of charge carriers, and the amorphous phase contributes to the transport of the photogenerated electrons to a conductive substrate. The mixture ink proved the brick-and-mortar theory by breaking down contaminants in municipal water in a very efficient way when exposed to light. Irradiation of the UV source from the back side of the mixture ink photoanode for the carbon–stainless steel cathode revealed high photocurrents, surpassing the steep decrease in photocurrents shown by the gold cathode in the chronoamperometric measurements.

Supplementary Materials

The following supporting information can be downloaded at: https://www.mdpi.com/article/10.3390/photochem4010006/s1, Figure S1: Pictorial representation of PEC setup; Table S1: The operating voltages used to measure the morphology of WO3 particles, APTA, and brick-and-mortar ink; Table S2: Microscopic images of prepared WO3 particles, APTA and brick-and-mortar inks.

Author Contributions

Fabrication of samples by Meyer rod coating their characterization and manuscript writing, V.K.L.R.C.; Fabrication of inkjet printer samples and their characterization, M.F.; Supply of cathodes for electrophotocatalytic experiment and assembly of the cells, R.B.; Synthesis of APTA, M.K.; Conceptual initiator and mentor, P.D. All authors have read and agreed to the published version of the manuscript.

Funding

This work was supported by the Czech Technology Agency through project TH03030197.

Data Availability Statement

Datasets used can be accessed through the corresponding author.

Acknowledgments

We are grateful to CEITEC for the use of their core facility in the characterization of our samples.

Conflicts of Interest

The authors declare no conflicts of interest.

References

  1. Deng, Y.; Zhao, R. Advanced Oxidation Processes (AOPs) in Wastewater Treatment. Curr. Pollut. Rep. 2015, 1, 167–176. [Google Scholar] [CrossRef]
  2. Gautam, P.; Popat, A.; Lokhandwala, S. Advances & Trends in Advance Oxidation Processes and Their Applications. In Advanced Industrial Wastewater Treatment and Reclamation of Water: Comparative Study of Water Pollution Index during Pre-industrial, Industrial Period and Prospect of Wastewater Treatment for Water Resource Conservation; Roy, S., Garg, A., Garg, S., Tran, T.A., Eds.; Environmental Science and Engineering; Springer International Publishing: Cham, Switzwerland, 2022; pp. 45–69. ISBN 9783030838119. [Google Scholar]
  3. Coha, M.; Farinelli, G.; Tiraferri, A.; Minella, M.; Vione, D. Advanced Oxidation Processes in the Removal of Organic Substances from Produced Water: Potential, Configurations, and Research Needs. Chem. Eng. J. 2021, 414, 128668. [Google Scholar] [CrossRef]
  4. Dewil, R.; Mantzavinos, D.; Poulios, I.; Rodrigo, M.A. New Perspectives for Advanced Oxidation Processes. J. Environ. Manag. 2017, 195, 93–99. [Google Scholar] [CrossRef] [PubMed]
  5. Garrido-Cardenas, J.A.; Esteban-García, B.; Agüera, A.; Sánchez-Pérez, J.A.; Manzano-Agugliaro, F. Wastewater Treatment by Advanced Oxidation Process and Their Worldwide Research Trends. Int. J. Environ. Res. Public Health 2019, 17, 170. [Google Scholar] [CrossRef]
  6. Atalay, S.; Ersöz, G. Chapter 7—Hybrid Application of Advanced Oxidation Processes to Dyes’ Removal. In Green Chemistry and Water Remediation: Research and Applications; Sharma, S.K., Ed.; Elsevier: Amsterdam, The Netherlands, 2021; pp. 209–238. [Google Scholar]
  7. Ma, D.; Yi, H.; Lai, C.; Liu, X.; Huo, X.; An, Z.; Li, L.; Fu, Y.; Li, B.; Zhang, M.; et al. Critical Review of Advanced Oxidation Processes in Organic Wastewater Treatment. Chemosphere 2021, 275, 130104. [Google Scholar] [CrossRef] [PubMed]
  8. Miklos, D.; Remy, C.; Jekel, M.; Linden, K.G.; Drewes, J.E.; Hübner, U. Evaluation of Advanced Oxidation Processes for Water and Wastewater Treatment—A Critical Review. Water Res. 2018, 139, 118–131. [Google Scholar] [CrossRef]
  9. Feijoo, S.; Yu, X.; Kamali, M.; Appels, L.; Dewil, R. Generation of Oxidative Radicals by Advanced Oxidation Processes (AOPs) in Wastewater Treatment: A Mechanistic, Environmental and Economic Review. Rev. Environ. Sci. Technol. 2023, 22, 205–248. [Google Scholar] [CrossRef]
  10. Moreira, F.C.; Boaventura, R.A.R.; Brillas, E.; Vilar, V.J.P. Electrochemical Advanced Oxidation Processes: A Review on Their Application to Synthetic and Real Wastewaters. Appl. Catal. B Environ. 2017, 202, 217–261. [Google Scholar] [CrossRef]
  11. Swaminathan, M.; Muruganandham, M.; Sillanpää, M. Advanced Oxidation Processes for Wastewater Treatment. Int. J. Photoenergy 2013, 2013, 683682. [Google Scholar] [CrossRef]
  12. Matilainen, A.; Sillanpää, M. Removal of Natural Organic Matter from Drinking Water by Advanced Oxidation Processes. Chemosphere 2010, 80, 351–365. [Google Scholar] [CrossRef]
  13. Stefan, M.I. (Ed.) Advanced Oxidation Processes for Water Treatment: Fundamentals and Applications; IWA Publishing: London, UK, 2018; ISBN 9781780407197. [Google Scholar]
  14. Zhang, X.; Yu, W.; Guo, Y.; Li, S.; Chen, Y.; Wang, H.; Bian, Z. Recent Advances in Photoelectrocatalytic Advanced Oxidation Processes: From Mechanism Understanding to Catalyst Design and Actual Applications. Chem. Eng. J. 2023, 455, 140801. [Google Scholar] [CrossRef]
  15. Zawadzki, P. Visible Light–Driven Advanced Oxidation Processes to Remove Emerging Contaminants from Water and Wastewater: A Review. Water Air Soil Pollut. 2022, 233, 374. [Google Scholar] [CrossRef]
  16. Oturan, M.A.; Aaron, J.-J. Advanced Oxidation Processes in Water/Wastewater Treatment: Principles and Applications. A Review. Crit. Rev. Environ. Sci. Technol. 2014, 44, 2577–2641. [Google Scholar] [CrossRef]
  17. Muruganandham, M.; Suri, R.; Jafari, S.; Sillanpää, M.; Lee, G.; Wu, J.J.; Swaminathan, M. Recent Developments in Homogeneous Advanced Oxidation Processes for Water and Wastewater Treatment. Int. J. Photoenergy 2014, 2014, 821674. [Google Scholar] [CrossRef]
  18. Babu, D.S.; Srivastava, V.; Nidheesh, P.V.; Kumar, M.S. Detoxification of Water and Wastewater by Advanced Oxidation Processes. Sci. Total Environ. 2019, 696, 133961. [Google Scholar] [CrossRef]
  19. Chaplin, B.P. Critical Review of Electrochemical Advanced Oxidation Processes for Water Treatment Applications. Environ. Sci. Process. Impacts 2014, 16, 1182–1203. [Google Scholar] [CrossRef] [PubMed]
  20. Macwan, D.P.; Dave, P.N.; Chaturvedi, S. A Review on Nano-TiO2 Sol–Gel Type Syntheses and Its Applications. J. Mater. Sci. 2011, 46, 3669–3686. [Google Scholar] [CrossRef]
  21. Jia, Z.; La, L.B.T.; Zhang, W.C.; Liang, S.-X.; Jiang, B.; Xie, S.K.; Habibi, D.; Zhang, L.C. Strong Enhancement on Dye Photocatalytic Degradation by Ball-Milled TiO2: A Study of Cationic and Anionic Dyes. J. Mater. Sci. Technol. 2017, 33, 856–863. [Google Scholar] [CrossRef]
  22. Strieth-Kalthoff, F.; James, M.J.; Teders, M.; Pitzer, L.; Glorius, F. Energy Transfer Catalysis Mediated by Visible Light: Principles, Applications, Directions. Chem. Soc. Rev. 2018, 47, 7190–7202. [Google Scholar] [CrossRef] [PubMed]
  23. Sampaio, P.G.V.; González, M.O.A.; de Oliveira Ferreira, P.; da Cunha Jácome Vidal, P.; Pereira, J.P.P.; Ferreira, H.R.; Oprime, P.C. Overview of Printing and Coating Techniques in the Production of Organic Photovoltaic Cells. Int. J. Energy Res. 2020, 44, 9912–9931. [Google Scholar] [CrossRef]
  24. Veprek, S.; Veprek-Heijman, M.G.J.; Karvankova, P.; Prochazka, J. Different Approaches to Superhard Coatings and Nanocomposites. Thin Solid Films 2005, 476, 1–29. [Google Scholar] [CrossRef]
  25. Camacho, S.Y.T.; Rey, A.M.; Hernández-Alonso, M.D.; Llorca, J.; Medina, F.; Contreras, S. Pd/TiO2-WO3 Photocatalysts for Hydrogen Generation from Water-Methanol Mixtures. Appl. Surf. Sci. 2018, 455, 570–580. [Google Scholar] [CrossRef]
  26. Ouyang, W.; Kuna, E.; Yepez, A.; Balu, A.M.; Romero, A.A.; Colmenares, J.C.; Luque, R. Mechanochemical Synthesis of TiO2 Nanocomposites as Photocatalysts for Benzyl Alcohol Photo-Oxidation. Nanomaterials 2016, 6, 93. [Google Scholar] [CrossRef] [PubMed]
  27. Shabdan, Y.; Markhabayeva, A.; Bakranov, N.; Nuraje, N. Photoactive Tungsten-Oxide Nanomaterials for Water-Splitting. Nanomaterials 2020, 10, 1871. [Google Scholar] [CrossRef] [PubMed]
  28. Coronado, J.M. A Historical Introduction to Photocatalysis. In Design of Advanced Photocatalytic Materials for Energy and Environmental Applications; Coronado, J.M., Fresno, F., Hernández-Alonso, M.D., Portela, R., Eds.; Springer: London, UK, 2013; pp. 1–4. ISBN 9781447150602. [Google Scholar]
  29. Fujishima, A.; Honda, K. Electrochemical Photolysis of Water at a Semiconductor Electrode. Nature 1972, 238, 37–38. [Google Scholar] [CrossRef]
  30. Lee, J.-Y.; An, J.; Chua, C.K. Fundamentals and Applications of 3D Printing for Novel Materials. Appl. Mater. Today 2017, 7, 120–133. [Google Scholar] [CrossRef]
  31. Homola, T.; Ďurašová, Z.; Shekargoftar, M.; Souček, P.; Dzik, P. Optimization of TiO2 Mesoporous Photoanodes Prepared by Inkjet Printing and Low-Temperature Plasma Processing. Plasma Chem. Plasma Process. 2020, 40, 1311–1330. [Google Scholar] [CrossRef]
  32. Vidmar, T.; Topič, M.; Dzik, P.; Opara Krašovec, U. Inkjet Printing of Sol–Gel Derived Tungsten Oxide Inks. Sol. Energy Mater. Sol. Cells 2014, 125, 87–95. [Google Scholar] [CrossRef]
  33. Kumar, M.; Xiong, X.; Wan, Z.; Sun, Y.; Tsang, D.C.W.; Gupta, J.; Gao, B.; Cao, X.; Tang, J.; Ok, Y.S. Ball Milling as a Mechanochemical Technology for Fabrication of Novel Biochar Nanomaterials. Bioresour. Technol. 2020, 312, 123613. [Google Scholar] [CrossRef]
  34. Xu, C.; Sudipta, D.; De, S.; Balu, A.M.; Ojeda, M.; Luque, R. Mechanochemical Synthesis of Advanced Nanomaterials for Catalytic Applications. Chem. Commun. 2015, 51, 6698–6713. [Google Scholar] [CrossRef]
  35. Laranjo, M.T.; Ricardi, N.C.; Arenas, L.T.; Benvenutti, E.V.; de Oliveira, M.C.; Buchner, S.; Santos, M.J.L.; Costa, T.M.H. Influence of Ball Milling on Textural and Morphological Properties of TiO2 and TiO2/SiO2 Xerogel Powders Applied in Photoanodes for Solar Cells. J. Solid State Electrochem. 2016, 20, 1731–1741. [Google Scholar] [CrossRef]
  36. Gies, M.; Michel, F.; Lupó, C.; Schlettwein, D.; Becker, M.; Polity, A. Electrochromic Switching of Tungsten Oxide Films Grown by Reactive Ion-Beam Sputter Deposition. J. Mater. Sci. 2021, 56, 615–628. [Google Scholar] [CrossRef]
  37. Sheng, Y.; Yang, J.; Wang, F.; Liu, L.; Liu, H.; Yan, C.; Guo, Z. Sol-Gel Synthesized Hexagonal Boron Nitride/Titania Nanocomposites with Enhanced Photocatalytic Activity. Appl. Surf. Sci. 2019, 465, 154–163. [Google Scholar] [CrossRef]
  38. Saleem, Z.; Pervaiz, E.; Yousaf, M.U.; Niazi, M.B.K. Two-Dimensional Materials and Composites as Potential Water Splitting Photocatalysts: A Review. Catalysts 2020, 10, 464. [Google Scholar] [CrossRef]
  39. de Moura, D.S.; Pazinato, J.C.O.; Pereira, M.B.; Mertins, O.; Silva, E.R.; Garcia, I.T.S. Poly(Vinyl Alcohol) as a Structuring Agent for Peroxotungstic Acid. J. Mol. Liq. 2018, 269, 92–100. [Google Scholar] [CrossRef]
  40. Fang, Y.; Sun, X.; Cao, H. Influence of PEG Additive and Annealing Temperature on Structural and Electrochromic Properties of Sol–Gel Derived WO3 Films. J. Sol-Gel Sci. Technol. 2011, 59, 145–152. [Google Scholar] [CrossRef]
  41. Işık, D.; Ak, M.; Durucan, C. Structural, Electrochemical and Optical Comparisons of Tungsten Oxide Coatings Derived from Tungsten Powder-Based Sols. Thin Solid Films 2009, 518, 104–111. [Google Scholar] [CrossRef]
  42. Zhang, Y.; Yuan, J.; Le, J.; Song, L.; Hu, X. Structural and Electrochromic Properties of Tungsten Oxide Prepared by Surfactant-Assisted Process. Sol. Energy Mater. Sol. Cells 2009, 93, 1338–1344. [Google Scholar] [CrossRef]
  43. Nakajima, T.; Hagino, A.; Nakamura, T.; Tsuchiya, T.; Sayama, K. WO3 Nanosponge Photoanodes with High Applied Bias Photon-to-Current Efficiency for Solar Hydrogen and Peroxydisulfate Production. J. Mater. Chem. A Mater. Energy Sustain. 2016, 4, 17809–17818. [Google Scholar] [CrossRef]
  44. Ojeda, M.; Gaster, C.; Harris, C. Fabrication and Internal Functionalization of Highly Macroporous WO3 Thin Films. Preprints 2018, 2018100227. [Google Scholar] [CrossRef]
  45. Sadale, S.B.; Neumann-Spallart, M. Drop-Cast Tungsten Trioxide Semiconducting Films in Photoelectrocatalysis. J. Electroanal. Chem. 2020, 877, 114502. [Google Scholar] [CrossRef]
  46. Wang, P.; Wang, S.; Wang, H.; Wu, Z.; Wang, L. Recent Progress on Photo-Electrocatalytic Reduction of Carbon Dioxide. Part. Part. Syst. Charact. 2018, 35, 1700371. [Google Scholar] [CrossRef]
  47. Trojanowicz, M. Impact of Nanotechnology on Design of Advanced Screen-Printed Electrodes for Different Analytical Applications. Trends Anal. Chem. 2016, 84, 22–47. [Google Scholar] [CrossRef]
  48. Suresh, R.R.; Lakshmanakumar, M.; Arockia Jayalatha, J.B.B.; Rajan, K.S.; Sethuraman, S.; Krishnan, U.M.; Rayappan, J.B.B. Fabrication of Screen-Printed Electrodes: Opportunities and Challenges. J. Mater. Sci. 2021, 56, 8951–9006. [Google Scholar] [CrossRef]
  49. Rong, Y.; Ming, Y.; Ji, W.; Li, D.; Mei, A.; Hu, Y.; Han, H. Toward Industrial-Scale Production of Perovskite Solar Cells: Screen Printing, Slot-Die Coating, and Emerging Techniques. J. Phys. Chem. Lett. 2018, 9, 2707–2713. [Google Scholar] [CrossRef]
  50. Adly, N.; Bachmann, B.; Krause, K.J.; Offenhäusser, A.; Wolfrum, B.; Yakushenko, A. Three-Dimensional Inkjet-Printed Redox Cycling Sensor. RSC Adv. 2017, 7, 5473–5479. [Google Scholar] [CrossRef]
  51. Bachalo, W.D.; Bachalo, W.D. Measurements of Inkjet Droplet Size, Velocity, and Angle of Trajectory. In Inkjet Printing in Industry: Materials, Technologies, Systems, and Applications; Wiley: Hoboken, NJ, USA, 2022. [Google Scholar] [CrossRef]
  52. Cai, G.; Darmawan, P.; Cui, M.; Chen, J.; Wang, X.; Eh, A.L.-S.; Magdassi, S.; Lee, P.S. Inkjet-Printed All Solid-State Electrochromic Devices Based on NiO/WO3 Nanoparticle Complementary Electrodes. Nanoscale 2016, 8, 348–357. [Google Scholar] [CrossRef]
  53. Calvert, P. Inkjet Printing for Materials and Devices. Chem. Mater. 2001, 13, 3299–3305. [Google Scholar] [CrossRef]
  54. Cummins, G.; Desmulliez, M.P.Y. Inkjet Printing of Conductive Materials: A Review. Circuit World 2012, 38, 193–213. [Google Scholar] [CrossRef]
  55. da Costa, C.H.; Costa, C.; Pinheiro, C.B.; da Silva Henriques, I.D.; Laia, C.A.T. Inkjet Printing of Sol-Gel Synthesized Hydrated Tungsten Oxide Nanoparticles for Flexible Electrochromic Devices. ACS Appl. Mater. Interfaces 2012, 4, 1330–1340. [Google Scholar] [CrossRef]
  56. Hansora, D.; Cherian, D.; Mehrotra, R.; Jang, J.-W.; Lee, J.S. Fully Inkjet-Printed Large-Scale Photoelectrodes. Joule 2023, 7, 884–919. [Google Scholar] [CrossRef]
  57. Hui, R.; Wang, Z.; Yick, S.; Maric, R.; Ghosh, D. Fabrication of Ceramic Films for Solid Oxide Fuel Cells via Slurry Spin Coating Technique. J. Power Sources 2007, 172, 840–844. [Google Scholar] [CrossRef]
  58. Deepa, M.; Saxena, T.K.; Singh, D.P.; Sood, K.N.; Agnihotry, S.A. Spin Coated versus Dip Coated Electrochromic Tungsten Oxide Films: Structure, Morphology, Optical and Electrochemical Properties. Electrochim. Acta 2006, 51, 1974–1989. [Google Scholar] [CrossRef]
  59. Shendage, S.S.; Patil, V.L.; Vanalakar, S.A.; Patil, S.P.; Bhosale, J.L.; Kim, J.H.; Patil, P.S. Characterization and Gas Sensing Properties of Spin Coated WO3 Thin Films. Z. Phys. Chem. 2020, 234, 1819–1834. [Google Scholar] [CrossRef]
  60. Go, M.; Alam, A.; Choie, H.K.; Zhong, Z.; Lee, K.H.; Seo, Y.; Hwang, B.; Woo, K.; Kim, T.-W.; Lim, S. Meyer-Rod Coated 2D Single-Crystalline Copper Nanoplate Film with Intensive Pulsed Light for Flexible Electrode. Coat. World 2020, 10, 88. [Google Scholar] [CrossRef]
  61. Jung, M.; Kim, J.; Koo, H.; Lee, W.; Subramanian, V.; Cho, G. Roll-to-Roll Gravure with Nanomaterials for Printing Smart Packaging. J. Nanosci. Nanotechnol. 2014, 14, 1303–1317. [Google Scholar] [CrossRef]
  62. Bragg, L. The Diffraction of X-Rays. Br. J. Radiol. 1956, 29, 121–126. [Google Scholar] [CrossRef] [PubMed]
  63. Schülli, T.U.; Leake, S.J. X-ray Nanobeam Diffraction Imaging of Materials. Curr. Opin. Solid State Mater. Sci. 2018, 22, 188–201. [Google Scholar] [CrossRef]
  64. Bunaciu, A.A.; Udriştioiu, E.G.; Aboul-Enein, H.Y. X-ray Diffraction: Instrumentation and Applications. Crit. Rev. Anal. Chem. 2015, 45, 289–299. [Google Scholar] [CrossRef] [PubMed]
  65. Lider, V.V. X-ray Diffraction Topography Methods (Review). Phys. Solid State 2021, 63, 189–214. [Google Scholar] [CrossRef]
  66. Reimer, L. Scanning Electron Microscopy, 2nd ed.; Springer Series in Optical Sciences; Springer: Berlin/Heidelberg, Germany, 2013; ISBN 9783540639763. [Google Scholar]
  67. Pan, H.; Heagy, M.D. Bicarbonate Reduction with Semiconductor Photocatalysts: Study of Effect of Positive Hole Scavengers. MRS Commun. 2018, 8, 1173–1177. [Google Scholar] [CrossRef]
  68. Karimi Estahbanati, M.R.; Feilizadeh, M.; Attar, F.; Iliuta, M.C. Current Developments and Future Trends in Photocatalytic Glycerol Valorization: Process Analysis. React. Chem. Eng. 2021, 6, 197–219. [Google Scholar] [CrossRef]
Figure 1. Schematic overview of photoelectrochemical cell.
Photochem 04 00006 g001
Figure 2. Illustration of top-down, bottom-up, and brick-and-mortar methods.
Photochem 04 00006 g002
Figure 3. Record from APTA thermogravimetric analysis.
Photochem 04 00006 g003
Figure 4. Detailed spectra of three selected diffraction patterns of WO3, APTA, and the WO3-APTA stock mixture.
Photochem 04 00006 g004
Figure 8. Resulting graph of the photocurrent dependence of the printed composition single layer, 1 cm2. Particulate ink, soluble precursor, and mixture samples were measured in 0.1 M HClO4 at an intensity irradiation of 2.0 mW cm−2.
Photochem 04 00006 g008
Figure 9. (a) The mixture photoanode is illuminated from the front side at a voltage of 1.5 volts with a gold electrode as the counter electrode in tap water along with 0.1%, 1%, and 10% glycerol concentrations using 365 nm UV point, source at a radiation intensity of 2 mW cm−2. (b) The mixture photoanode is illuminated from the front side at a voltage of 1.5 volts with a carbon–stainless steel electrode as the counter electrode in tap water along with 0.1%, 1%, and 10% glycerol concentrations using a 365 nm UV point source at a radiation intensity of 2 mW cm−2.
Photochem 04 00006 g009
Figure 10. (a) The mixture photoanode is illuminated from the back side at a voltage of 1.5 volts with a gold counter electrode in tap water along with 0.1%, 1%, and 10% glycerol concentrations using a 365 nm UV point source at a radiation intensity of 2 mW cm−2. (b) The mixture photoanode is illuminated from the back side at a voltage of 1.5 V with a carbon-stainless steel counter electrode in tap water along with 0.1%, 1%, and 10% glycerol concentrations using a 365 nm UV point source at a radiation intensity of 2 mW cm−2.
Photochem 04 00006 g010
Table 1. Presents a comparison of the advantages and disadvantages of using wet coating techniques for depositing liquid formulations.
S. NoTechniqueAdvantagesDisadvantages
1.Screen PrinterLow cost [47,48]One of the principal drawbacks of this method is the lack of flexibility in modifying the morphology and film thickness [49].
2.Inkjet PrinterInkjet printing offers several advantages, including non-contact, maskless, and combinatorial processing. It also consumes minimal materials and generates minimal waste [50,51].Nozzle clogging, wetting behaviour, and film homogeneity [52,53,54,55,56].
3.Spin CoaterA primary factor contributing to the popularity of spin coating is its ease of handling and rapid processing [57].The utilization of spin-coating for automated fabrication is not feasible and lacks the capability to pattern substrates selectively. Furthermore, it has high material waste consumption [58,59].
4.Meyer rodThe technique referred to as bar coating does not involve any additional processes such as pre-patterning of the substrate. Its purpose is to achieve a uniform, homogeneous coating with efficient processing [60].The thickness of the laminating layer varies and depends on the range of possible bar diameters [61].
Table 2. Summary of the type of crystalline phases present in the stock mixtures with semiquantitave analysis.
S. NoType of Stock MixtureCrystalline Phase
MonoclinicMonoclinic EpsilonAnorthic
1.WO3 raw+++ *+ *+
2.WO3 ground ++ *++++
3.WO3 ground + fired at 300 °C+++++
4.APTA fired at 500 °C+++
5.WO3 ground + APTA fired at 400 °C+++++
* +++ = 50–100%, ++ = 25–50%, + = 0–25%.
Disclaimer/Publisher’s Note: The statements, opinions and data contained in all publications are solely those of the individual author(s) and contributor(s) and not of MDPI and/or the editor(s). MDPI and/or the editor(s) disclaim responsibility for any injury to people or property resulting from any ideas, methods, instructions or products referred to in the content.

