Article

Enhanced Photocatalytic Dehalogenation Performance of RuDoped In2O3 Nanoparticles Induced by Oxygen Vacancy

1
Key Laboratory of Catalysis and Materials Science of the State Ethnic Affairs Commission and Ministry of Education, College of Resources and Environmental Science, South-Central Minzu University, Wuhan 430074, China
2
Wuhan Institute of Biomedical Sciences, School of Medicine, Jianghan University, Wuhan 430056, China
*
Author to whom correspondence should be addressed.
These authors contributed equally to this work.
Photochem 2023, 3(3), 360-372; https://doi.org/10.3390/photochem3030022
Submission received: 28 May 2023 / Revised: 21 July 2023 / Accepted: 1 August 2023 / Published: 1 September 2023
(This article belongs to the Special Issue Advance in Photocatalysis in Asia)

Abstract

:
Due to its favorable excited-state physicochemical properties, indium oxide (In2O3) has widely captured attention as a potentially great photocatalyst. However, an inferior charge separation efficiency limits its application. Recently, an increasing amount of evidence has demonstrated that the construction of surface defects is an effective strategy to boost photocatalytic performances. In this work, a ruthenium (Ru) species was successfully introduced into the lattice of In2O3 nanoparticles through co-precipitation and thermal treatment. It was found that the content of surface oxygen vacancies was directly related to the amount of Ru3+ doping, which further determines the separation efficiency of photogenerated carriers. As a result, the 0.5% Ru-In2O3 samples enriched with oxygen vacancies exhibit dramatically enhanced photocatalytic dehalogenation performances of decabromodiphenyl ether and hexabromobenzene, about four times higher than that of the pure In2O3 nanoparticles. This study emphasized the significance of the surface defects of the photocatalyst and may provide a valuable strategy to prepare highly active photocatalysts for photocatalytic dehalogenation reactions.

1. Introduction

Brominated flame retardants, such as decabromodiphenyl ether (Deca−BDE) and hexabromobenzene (HBB), are widely used in various industries to attain effective fire resistance for consumer products (e.g., textiles, electronics, etc.) [1,2]. Recently, an increasing amount of research has reported that these kinds of aryl halides, as a series of endocrine hormones, have high toxicity, environmental persistence and bioaccumulation potential, which might pose significant harm to humans and animals [3,4,5,6,7,8]. In order to control pollution due to brominated flame retardants, various technologies have been developed. Among them, photocatalysis, as one of the most promising green and renewable environmental treatment technologies, has proved to be effective in the removal of brominated flame retardants [9,10,11]. For instance, TiO2 photocatalysis has been used in the degradation of polybrominated diphenyl ethers (PBDEs) in a series of liquid systems [12]. Zhang et al. found that the In2O3 nanospheres can be used as a visible-light responsive catalyst for the decomposition of gaseous aryl halides [13]. However, these reported catalysts have the common problem of low photocatalytic performances, which are mainly due to the low separation efficiency of photogenerated electron–hole pairs [14]. To solve this problem, many modification methods, such as facet engineering, novel metal deposition and the construction of heterojunctions, were studied. Guo et al. reported that Pd nanoclusters decorated with TiO2 nanosheets were able to rapidly degrade 4-bromobiphenyl in 30 min due to a strong chemical interaction and effective electron transfer [15]; Feng et al. confirmed that the exposed high-energy facets of Co3O4 nanosheets greatly promoted the separation efficiency of photogenerated electron–hole pairs and significantly enhanced the photocatalytic performances [16]; Liu et al. facilitated the charge separation at the TiO2/Bi2MoO6 interface by fabricating heterojunctions [17].
Besides the above approaches, it has been reported that the construction of surface defects, such as oxygen or hydroxide defects, could also promote photocatalytic performance by improving the charge separation efficiency and adjusting the localized electronic states of semiconductors [18,19,20,21,22]. In this case, surface defects often serve as active sites for promoting the transfer of photogenerated electrons, both in the bulk phase and interface, thereby improving the separation efficiency of photogenerated carriers [23,24,25]. Among them, oxygen vacancies are one of the most common defects on a semiconductor’s surface. For the semiconductor photocatalysts, one way to produce an oxygen-vacancy-rich surface is by adjusting the reductive preparation conditions. For example, Bi et al. synthesized defective K4Nb6O7 nanosheets by introducing oxygen vacancies with the decomposition of KBH4, which had a six-times higher hydrogen evolution rate than that of the K4Nb6O7 samples without oxygen vacancies [26]; Yang et al. found that the oxygen vacancy content of the OVH-TiO2 obtained by reducing TiO2 aggregates in a hydrogen atmosphere was much higher than that of the original TiO2 samples [27]. As another method, ion doping is also an effective way to adjust the oxygen vacancy content. Moreover, a disordered surface caused by ion doping may intensify the localization of electrons, which is beneficial for transferring photogenerated electrons and lowering the activation energy of the reaction. In this case, Wang et al. prepared TiO2 nanorods enriched with oxygen vacancies through a C-N-S three-doping method to enhance its visible photocatalytic activity [28]; Huang et al. used metallic Cu and Bi nanoparticles to co-modify the BiVO4 to generate surface oxygen vacancies, which exhibited a higher absorption capacity for visible light and a superior charge separation efficiency compared to the original one [29]. In particular, it has been reported that Ru dopants were intentionally introduced into the In2O3 lattice as active sites, which not only narrow the bandgap energy but also cause the formation of oxygen vacancies, improving catalytic activity [30,31]. In addition, besides oxygen vacancy formation, the doping of Ru species could lead to an excellent hydrogen spillover effect, promoting hydrogen dissociation and adsorption, which is significant for the reduction reactions coupled with protons, such as the dehalogenation of brominated flame retardants [32].
In this work, we synthesized Ru−In2O3 nanoparticles with different oxygen vacancy contents by doping different amounts of Ru3+ in the lattice of In2O3. Characterization results indicate that the oxygen vacancy content of In2O3 is directly related to Ru doping, of which the 0.5% Ru−In2O3 sample had the highest oxygen vacancy content. The photocurrent, electrochemical impedance and surface photovoltage response results confirm that the 0.5% Ru−In2O3 sample had the highest separation efficiency of photogenerated electron and hole pairs, which is in accordance with the XPS results. We selected Deca−BDE and HBB as the model organic pollutants to evaluate the photocatalytic dehalogenation performances of the as-prepared Ru−In2O3 samples. Compared with other samples, 0.5% Ru−In2O3 nanoparticles exhibited superior photocatalytic dehalogenation activities for the removal of both Deca−BDE and HBB, which are closely related to its highest content of surface oxygen vacancies. Our results indicate that the increased oxygen vacancy content of photocatalysts caused by ion doping could effectively promote the removal efficiency of brominated flame retardants, which are persistently toxic in the environment.

2. Materials and Methods

2.1. Chemical Reagents

Indium nitrate hydrate (In(NO3)3·H2O) and ruthenium chloride (RuCl3) were obtained from Innochem Chemical Reagent Co. Ammonia solution (NH4OH), ethyl alcohol and isopropyl alcohol were purchased from Sinopharm Chemical Reagent. Deionized water was obtained from Wahaha Group Co., Ltd (Hangzhou, China). Nafion was purchased from Sigma-Aldrich (St Louis, MO, USA). All the other chemical reagents were purchased from J&K Chemicals Co (Beijing, China). All chemicals used in this work were purchased in analytical grade and used without any purification.

2.2. Synthesis of Ru−In2O3 Nanoparticles

Ru−In2O3 nanoparticles were synthesized following a modified version of a previously published procedure [23]. All chemicals were used as received without any further purification. In a typical synthesis, 1.8 mmol of the In(NO3)3·H2O was dissolved in a mixed solution containing 6 mL of anhydrous ethanol and 2 mL of deionized water to obtain solution A. Solution B was prepared by adding 2.5 mL of ammonia solution (27%) into 7.5 mL of anhydrous ethanol. Then, the above solution A and solution B were rapidly mixed together to form a white suspension, which was immediately transferred to a pre-heated oil bath at 80 °C and stirred for 10 min. The resulting suspension was then removed from the oil bath and allowed to settle and cool to room temperature before being centrifuged, washed three times with deionized water and ethanol, respectively and dried in a freeze dryer for 10 h. The dried precursor was collected, ground, and then calcined in a muffle furnace at 250 °C in air for 3 h to obtain the sample labeled as 0% Ru−In2O3. RuCl3 was added into the solution A under different Ru/In molar ratios (0.1%, 0.5% and 1%) with the other steps remaining unchanged to obtain the samples labeled as 0.1% Ru−In2O3, 0.5% Ru−In2O3 and 1% Ru−In2O3, respectively.

2.3. Characterization

The structure and phase of the as-prepared samples were determined by X-ray diffraction (XRD) analysis on a D8 ADVANCE diffractometer with Cu Kα radiation. The Cu target wavelength was 0.154056 Å, and the slit width was 5 nm. The samples were pressed into a pellet and scanned in the range of a 10°–80° diffraction angle with a step size of 0.02 °/step and a scan speed of 0.1 s/step. The chemical compositions were tested by X-ray photoelectron spectroscopy (Thermo Electron Corporation, Waltham, MA. USA) with Al Kα radiation. The samples were uniformly applied to a double–sided adhesive surface for testing, and the scanning range was -9 eV–1551 eV with dwell time of 58 s and pass energy of 30 eV. All the binding energies were calibrated by carbon (C1s 285.0 eV). The morphology and size of the as-prepared samples were examined by field emission scanning electron microscopy (FESEM, S-4800). Photocurrent and electrochemical impedance spectroscopy (EIS) in Na2SO4 (0.5 M) aqueous solution were acquired on a CHI660 electrochemical workstation with a standard three-electrode cell, where 75 mg of the as-prepared catalyst sample powders were sonicated in a mixture of 1.5 mL isopropanol and 20 μL Nafion solution for 30 min. Then, 20 μL of the suspensions were dripped onto a 1 × 1 cm2 size FTO conductive glass as the working electrode, a Pt electrode as auxiliary electrode, and a standard calomel electrode as reference. Photocurrent measurement used a 300 W xenon lamp as the light source, and the frequency in the electrochemical impedance spectroscopy test ranged from 100 kHz to 0.1 Hz. The surface photovoltage spectroscopy (SPS) measurements were performed according to the previous reports [33,34].

2.4. Photocatalytic Dehalogenation Reactions

Deca−BDE was dissolved in a tetrahydrofuran solvent to prepare a stock solution with a concentration of 10−3 mol/L. Prior to the experiments, the stock solution was diluted 100 times to a concentration of 10−5 mol/L using methanol as the solvent. The photocatalytic reaction was carried out in a freshly prepared 20 mL Deca−BDE solution with the addition of 15 mg of as-prepared photocatalysts in a Pyrex vessel. The vessel was sealed with a rubber stopper under an argon atmosphere. Before irradiation, the suspension was firstly magnetically stirred for 30 min in darkness to achieve the adsorption–desorption equilibrium, followed by purging with argon for 40 min to remove air. The suspension was then irradiated at constant temperature (25 °C) using cooling circulation water. A 300 W xenon lamp (CEL-HXF300, Beijing China Education Au-light Co., Ltd.) with a 400 nm cutoff filter served as the light source. During the photocatalytic reaction, 1 mL of the suspension was sampled and centrifuged at predetermined time intervals. The supernatant was filtered through a 0.22 μm membrane and then analyzed using high-performance liquid chromatography (Thermo scientific Ultimate 3000 HPLC) equipped with a diode array detector and SB−C18 chromatographic column (4.6 × 150 mm). Pure methanol served as the mobile phase at a flow rate of 1.0 mL/min, while the detector wavelength was set at 240 nm. The photocatalytic degradation of HBB was carried out under similar experimental conditions as that of Deca−BDE, except for the quantity of the photocatalysts (30 mg). Cyclic tests were carried out under identical experimental conditions as those employed for the Deca−BDE degradation. Before each cycle, the recovered samples, including the filtered particles on the membrane and the remaining precipitates in the vessel, were collected and dried using a freeze dryer for 6 h.

3. Results and Discussion

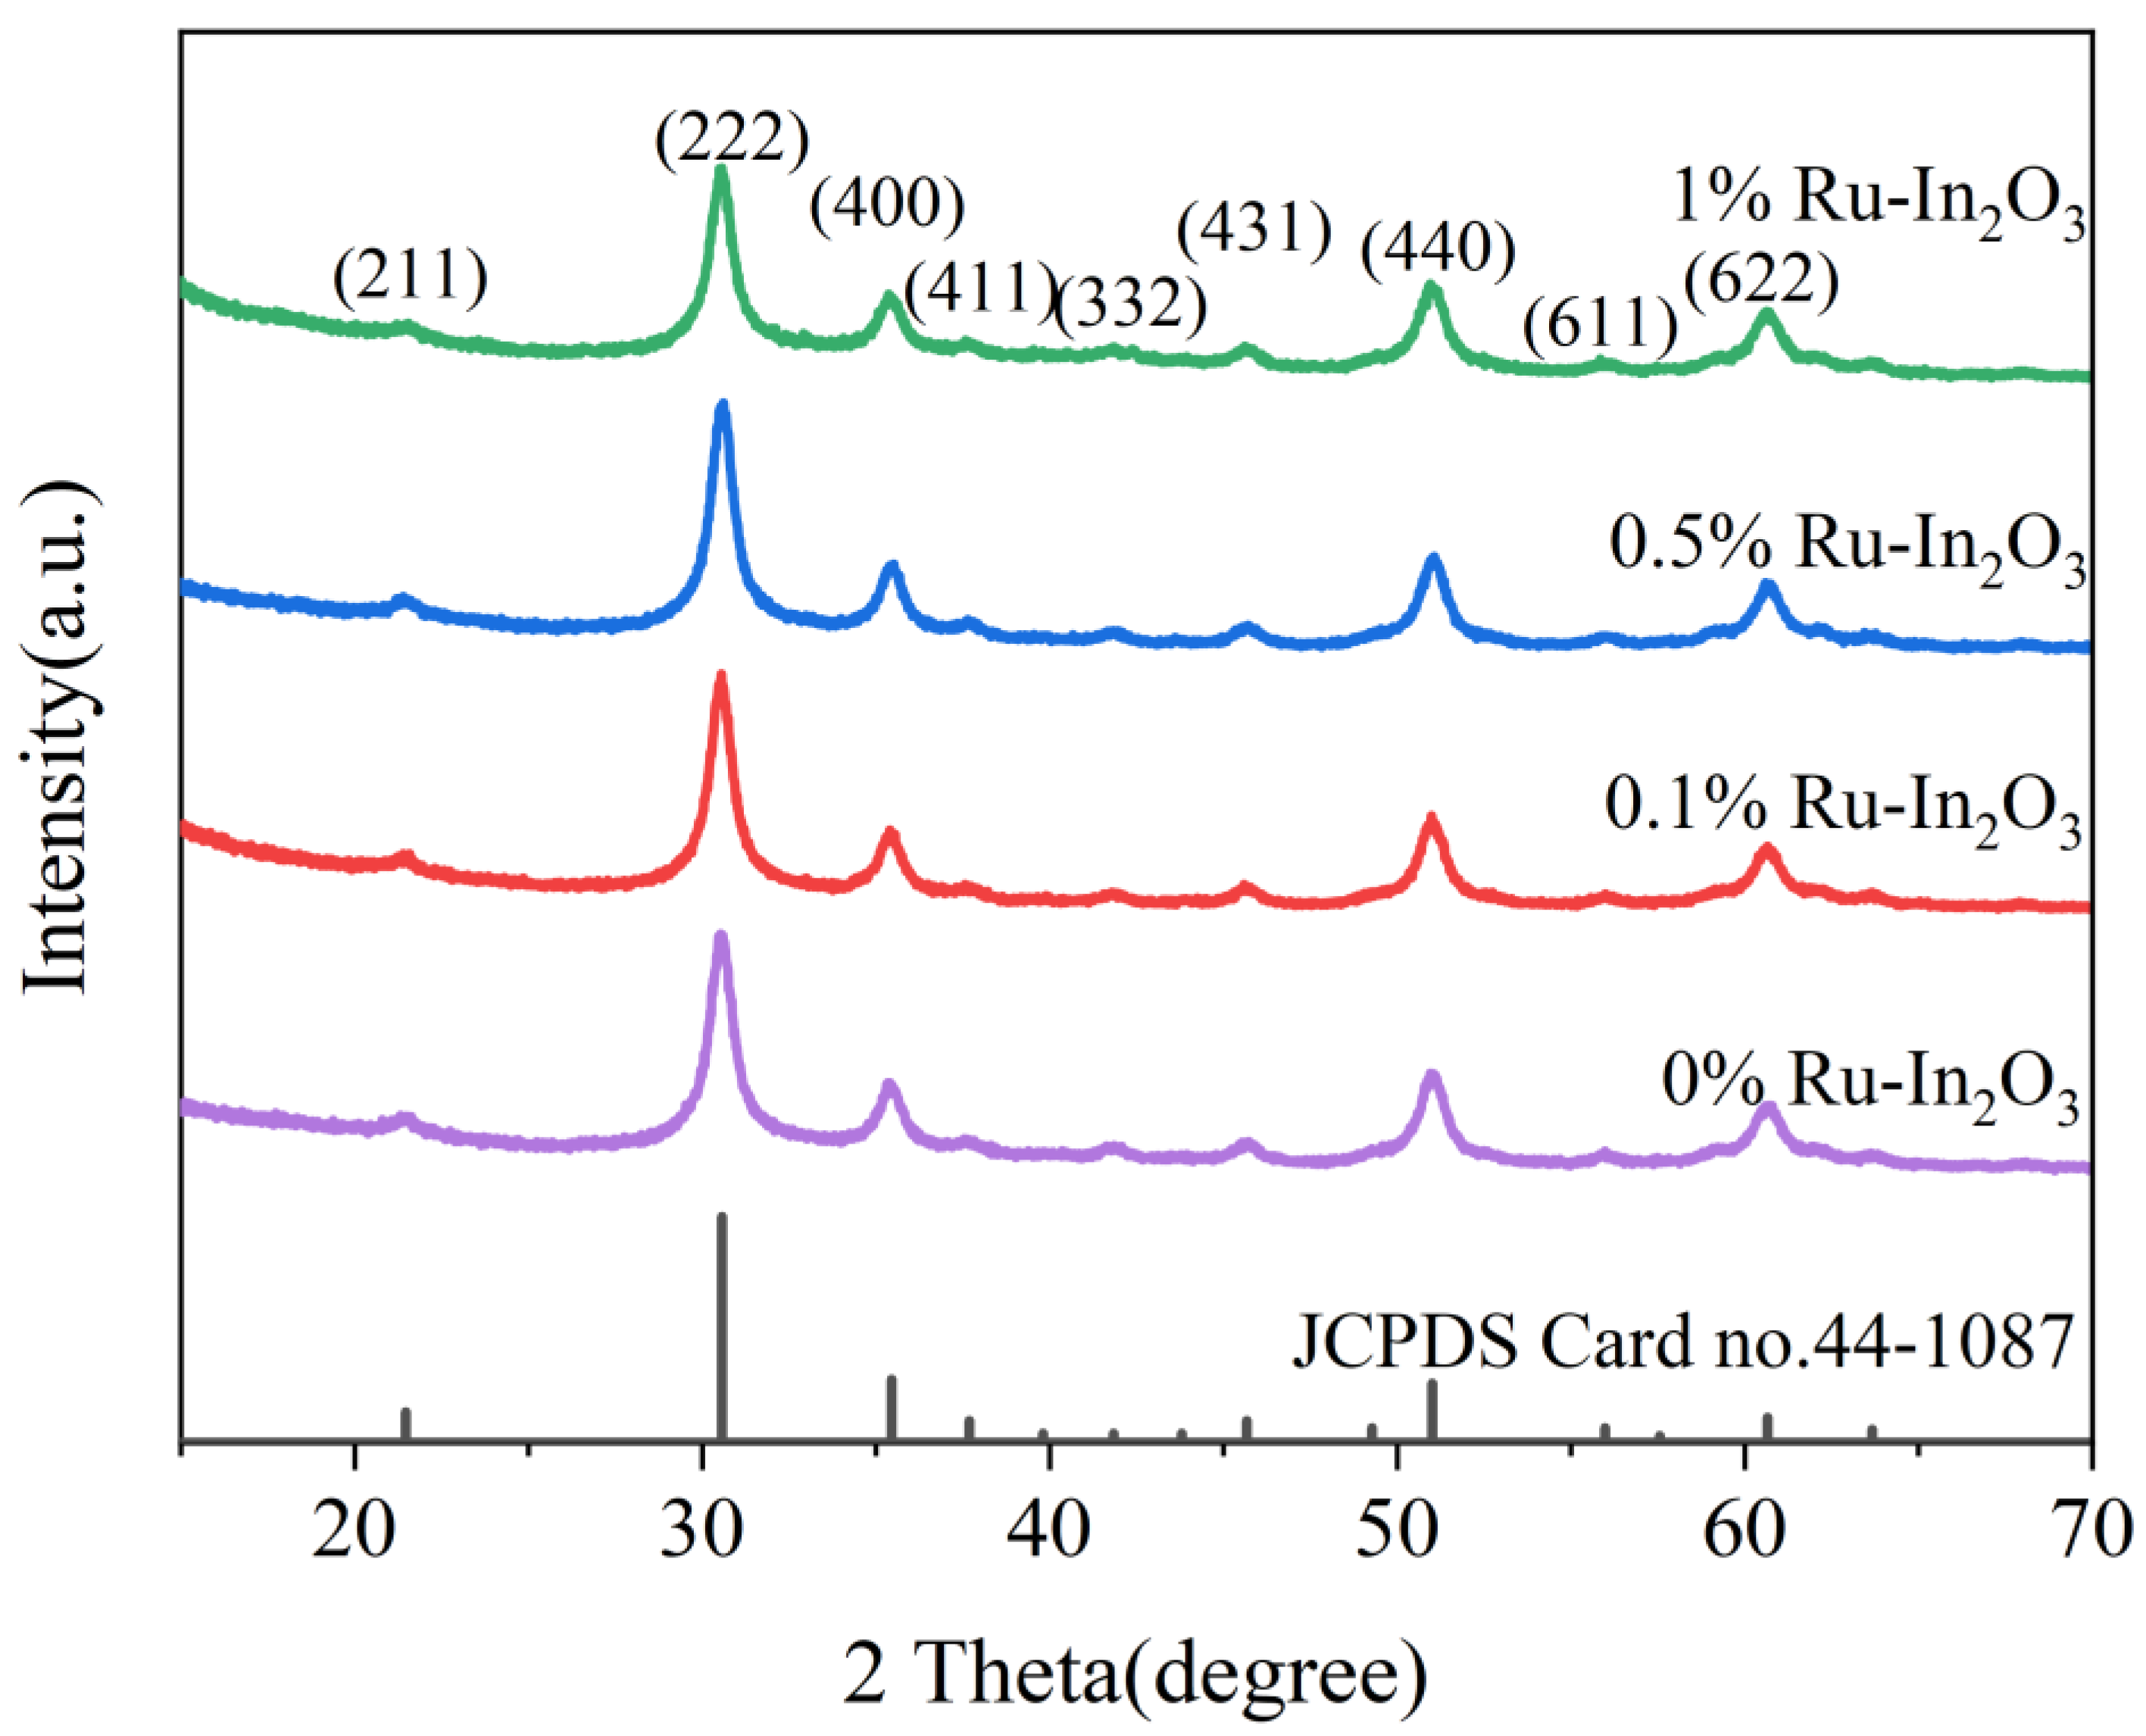
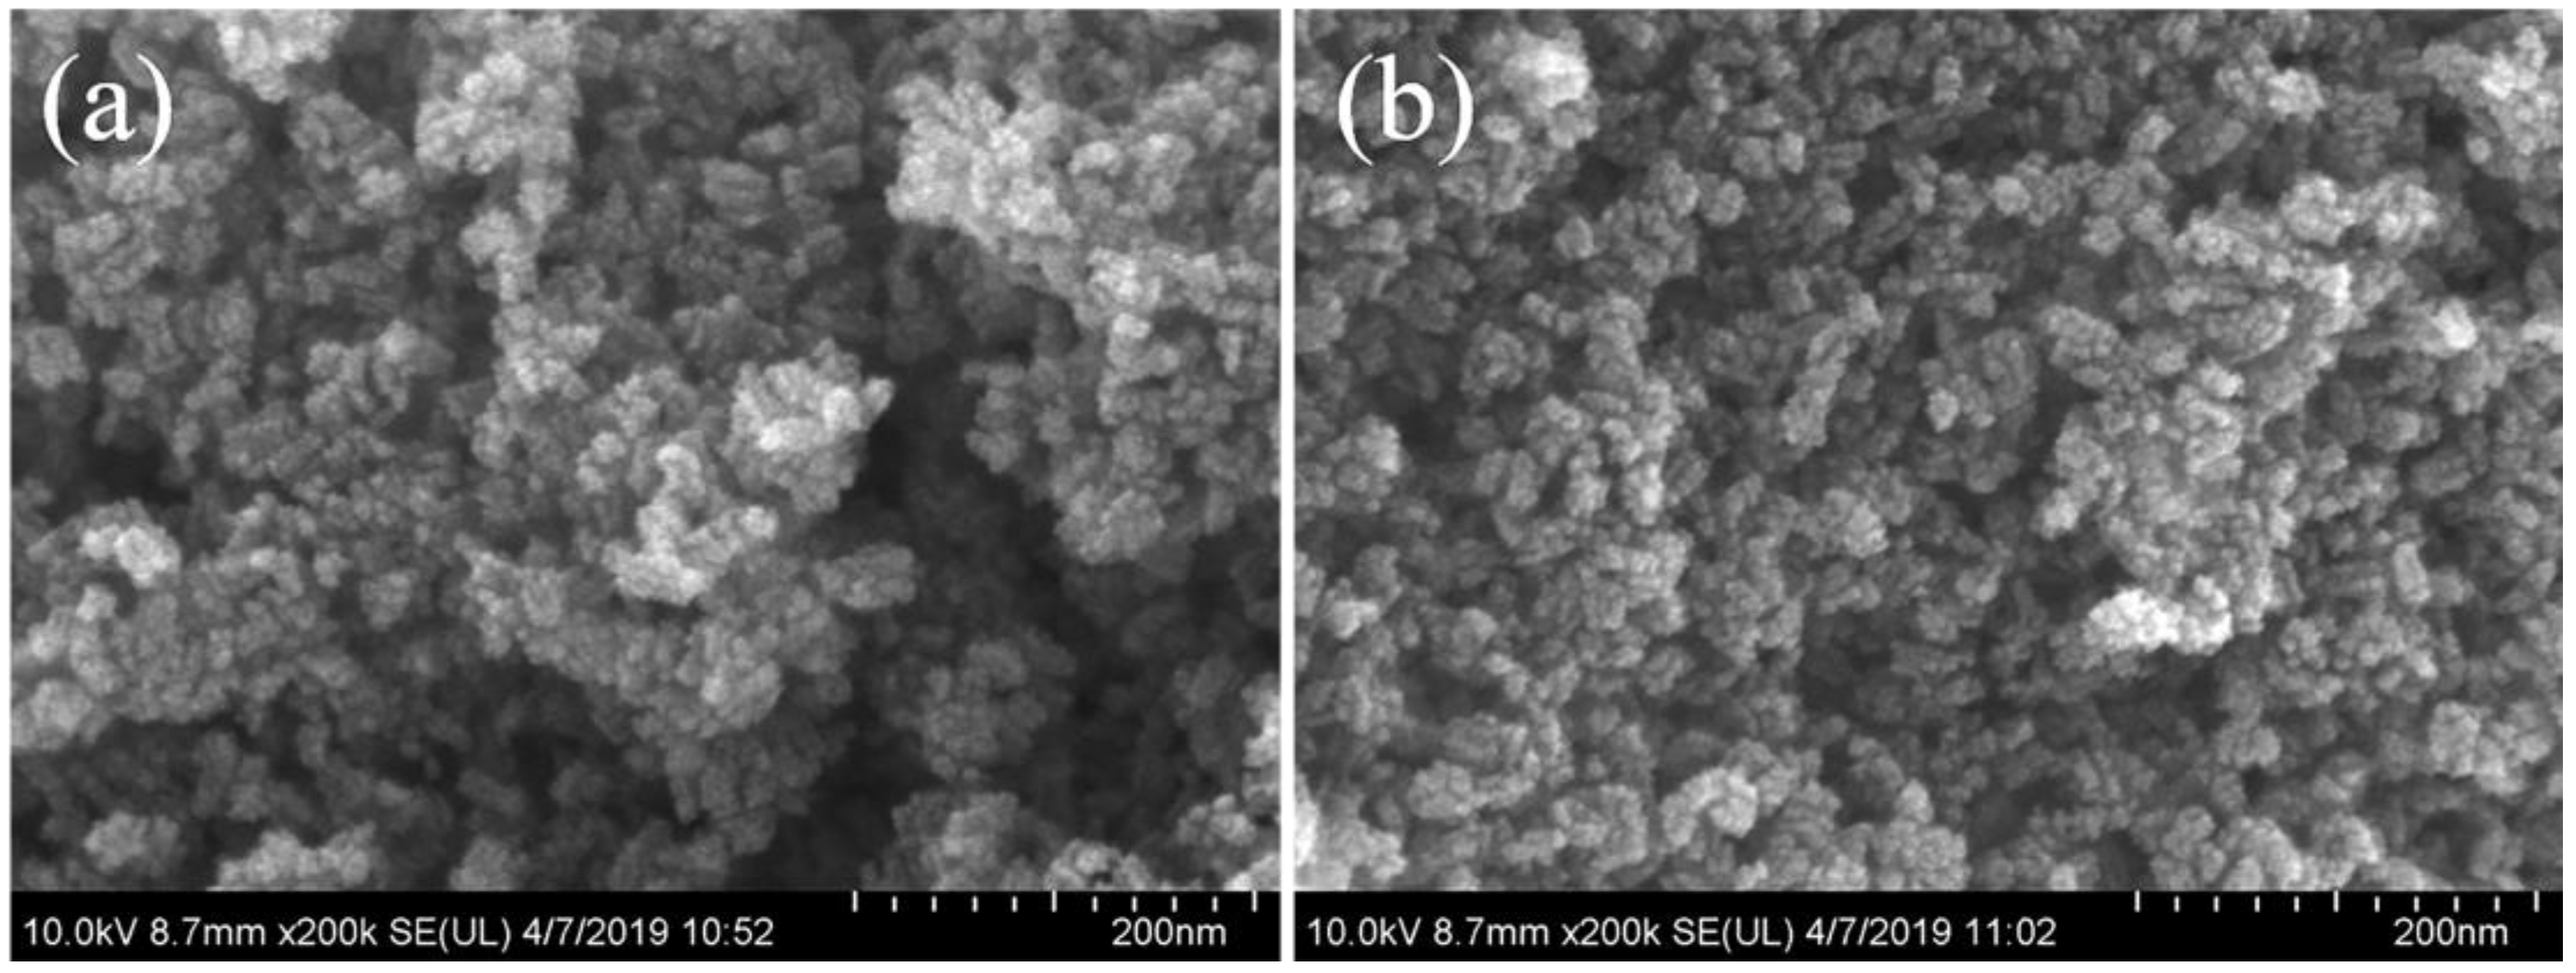
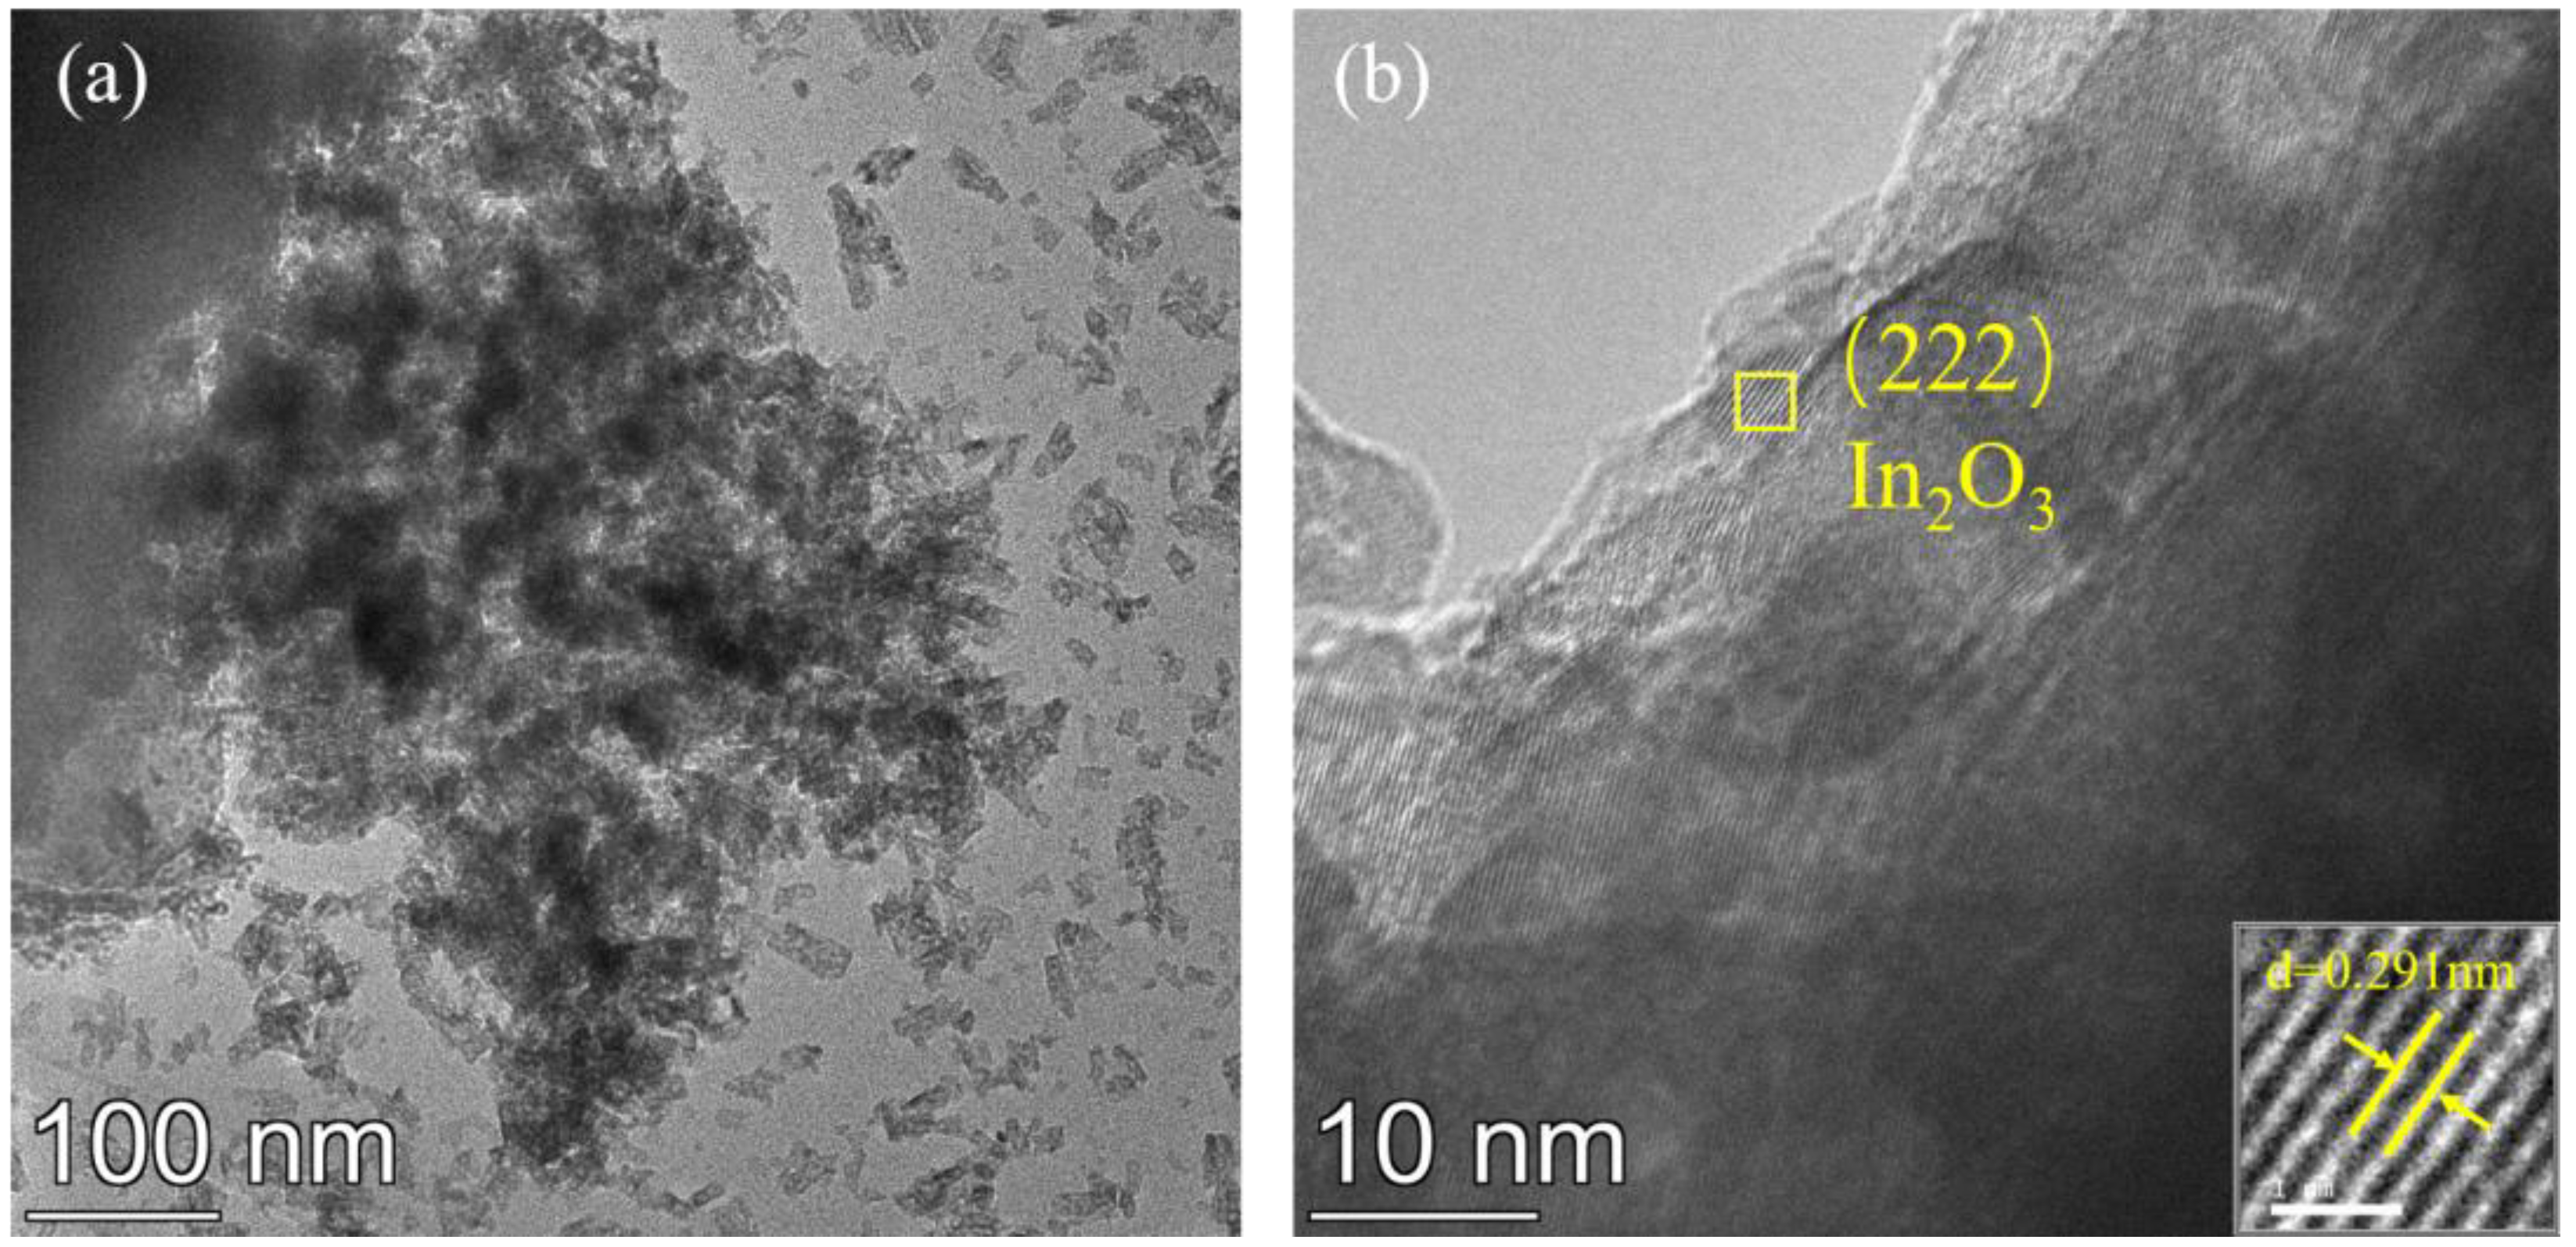
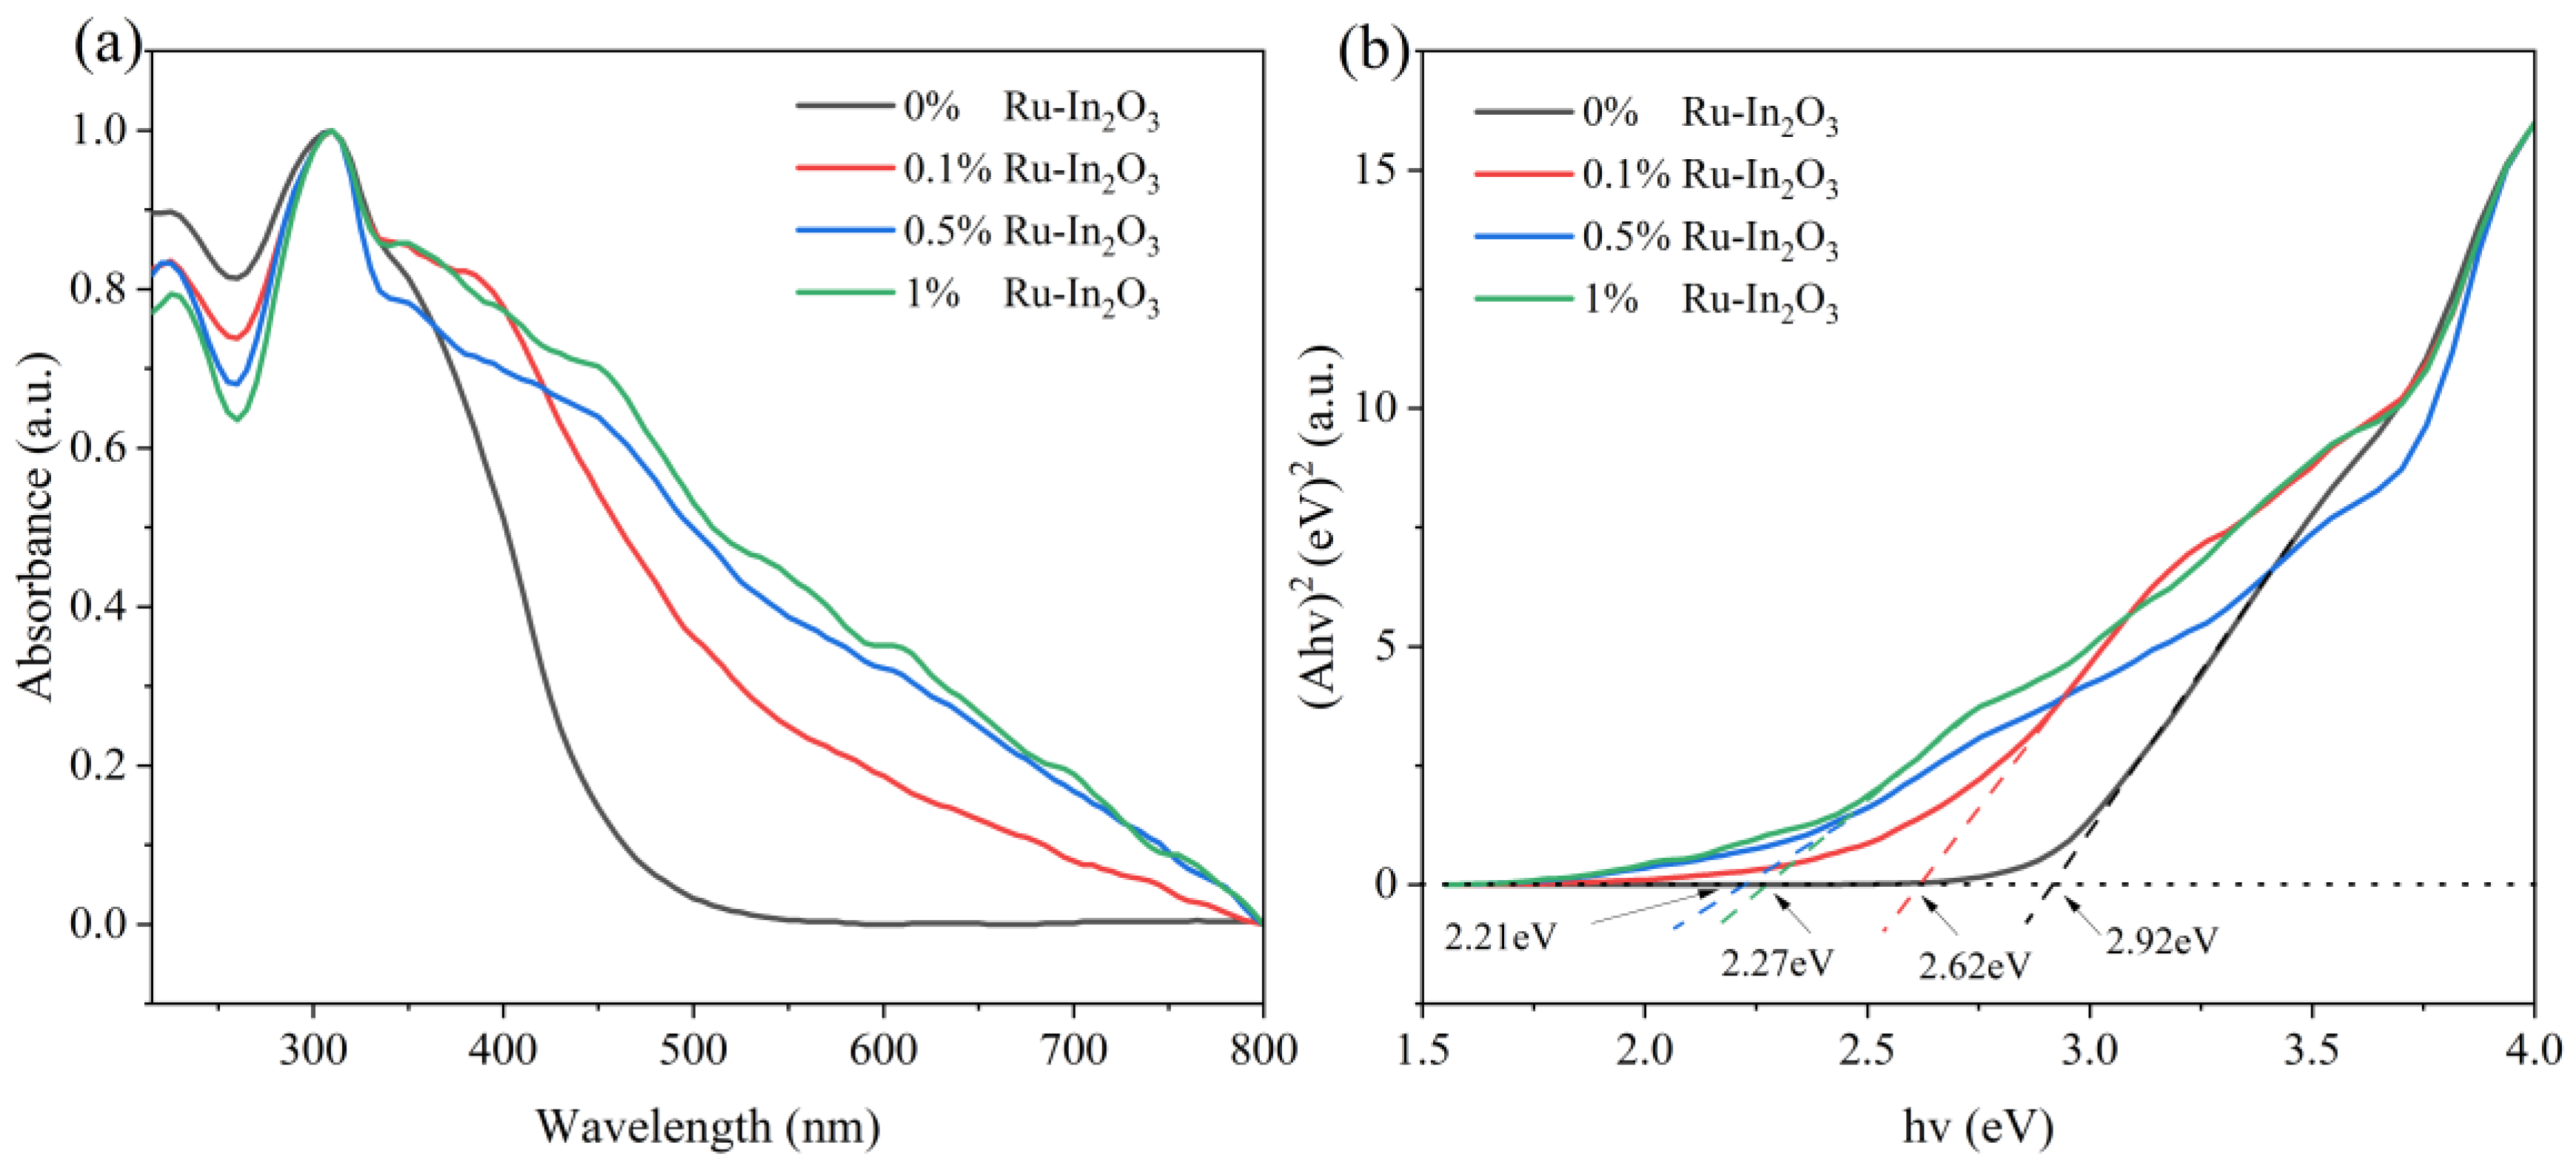
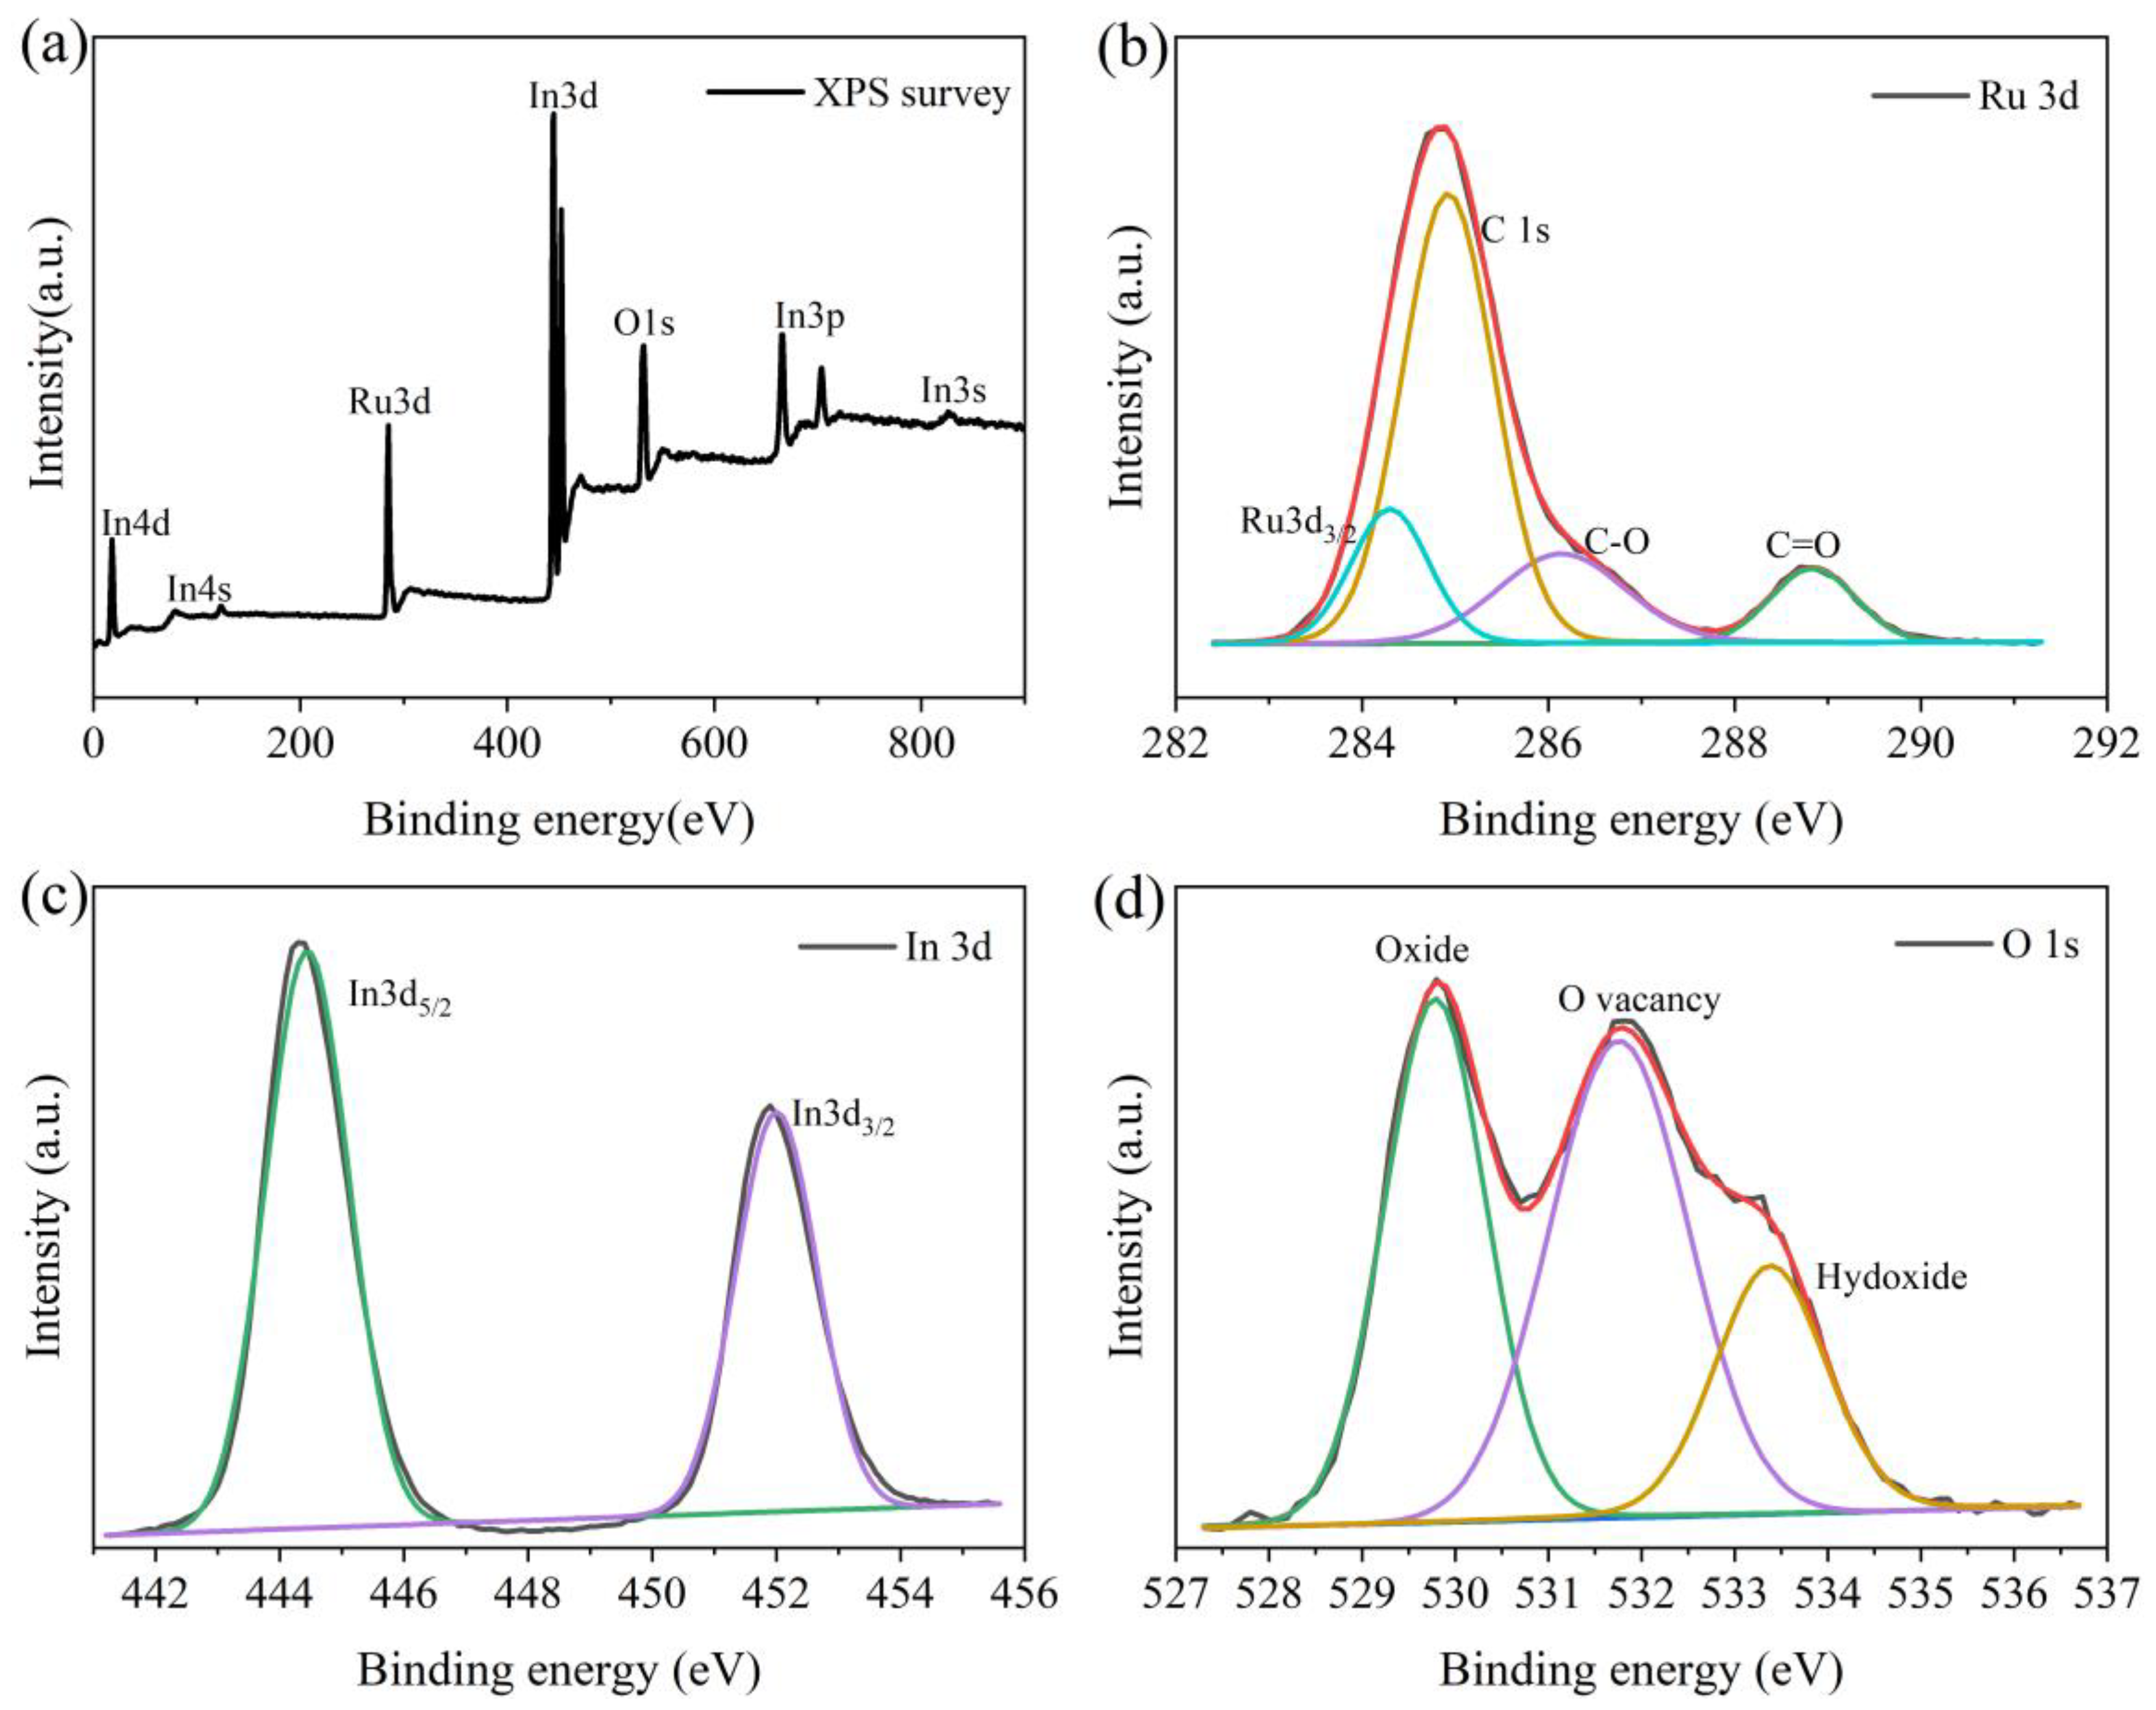
3.1. Characterizations of Ru−In2O3 Nanoparticles

XRD, SEM and TEM/HRTEM measurements were carried out to study the structure and morphology of the as-prepared Ru−In2O3 samples. Figure 1 illustrates the XRD patterns of different Ru−In2O3 samples. From the figure, it can be observed that all the samples retained the characteristic cubic structure of In2O3 and are in good agreement with the standard pattern (JCPDS Card no. 44-1087), which indicates that well-crystallized single-phase In2O3 had been successfully synthesized under the current experimental conditions. The diffraction peaks at 2θ = 21.5°, 30.5°, 35.4°, 37.6°, 41.8°, 45.6°, 51.0°, 55.9° and 60.6° are assigned to the (211), (222), (400), (411), (332), (431), (440), (611) and (622) planes of cubic In2O3, respectively. With increasing the Ru-doping content in the as-prepared Ru−In2O3 samples, there were no significant changes observed in terms of intensity or the position of diffraction peaks, indicating that Ru doping did not alter the crystal structure of In2O3 components. The strong and sharp diffraction peaks imply good crystallinity of the samples. No diffraction peaks of Ru components or other impurities were observed in any of the samples, possibly because the doped Ru components were too little to reach the detection limit. Additionally, the Scherrer equation was employed to calculate the crystallite sizes of different Ru−In2O3 samples. The calculated results for 0% Ru−In2O3, 0.1% Ru−In2O3, 0.5% Ru−In2O3 and 1% Ru−In2O3 samples are 7.89, 8.60, 8.24 and 8.34 nm, respectively. Meanwhile, the morphology and size of the as-prepared Ru−In2O3 samples were also characterized by the SEM and TEM/HRTEM images presented in Figure 2 and Figure 3. SEM images in Figure 2a and Figure S3 reveal that the 0% Ru−In2O3 samples are irregular agglomerates with spherical nanoparticles less than 10 nm in size, which is in accordance with the XRD results. From the SEM and TEM images in Figure 2b, Figure S4 and Figure 3a, the 0.5% Ru−In2O3 samples exhibit no significant change in shape and size compared to those of the 0% Ru−In2O3 samples. Moreover, Figure 3b contains a HRTEM image displaying clear crystal lattice fringes with a spacing of 0.291 nm attributed to the (222) plane of cubic In2O3 (JCPDS Card no.44-1087), which is consistent with our XRD findings.
The optical properties of the as-prepared samples were studied using UV-visible diffuse reflectance spectroscopy. As shown in Figure 4a, compared to the pure In2O3 samples, the absorption band edges of the Ru-doped In2O3 samples have undergone a significant red shift, which gradually increased with the increase of Ru content. As shown in Figure 4b, the optical band gap energy (Eg) of the as-prepared Ru−In2O3 samples was calculated by Tauc plot according to the results of the UV diffuse reflectance spectra. The calculation formula is as follows [35,36],
(αhv) = A(hv − Eg)n/2
hv = 1240/λ
where α represents the absorption coefficient, h is the Planck constant, v is the vibration frequency of light, A is a proportionality constant, and the exponent n is related to the semiconductor type [37]. From Figure 4b, it was calculated that the band gaps of 0% Ru−In2O3, 0.1% Ru−In2O3, 0.5% Ru−In2O3 and 1% Ru−In2O3 were 2.92 eV, 2.62 eV, 2.21 eV and 2.27 eV, respectively. The doping of Ru evidently enhanced absorption in the visible light region.
XPS measurements were performed to further study the surface element composition, chemical state and the amount of oxygen vacancy. Figure 5a shows the survey XPS spectrum of the 0.5% Ru−In2O3 samples, in which the binding energy peaks of In 4d, In 4s, Ru 3d, In 3d, O 1s, In 3p and In 3s were detected, indicating the existence of In, O and Ru elements in the Ru−In2O3 samples. Especially, in Figure 5b, the high-resolution XPS spectrum of Ru 3d located at 284.3 eV indicates that Ru3+ has been successfully doped into the In2O3 lattices. As shown in Figure 5c, the peaks at 444.4 and 452.0 eV are attributed to the binding energies of the In 3d5/2 and In 3d3/2 levels, respectively, which correspond to the In3+ in the In2O3 lattices according to previous reports [38,39]. From the O 1s region in Figure 5d, the O 1s binding energy peak at around 529.7 eV is attributed to the lattice oxygen of In2O3 components, while the appearance of shoulder peaks with higher binding energies can be attributed to the combination of chemisorbed oxygen and surface hydroxyl groups, which can be divided into peaks at around 530.9 eV and 532.0 eV, respectively [38]. It is reported that the chemisorbed oxygen of In2O3 is caused by oxygen vacancy [39]. Hence, from the O 1s core-level XPS spectra in Figure 6, we used the ratios of peaks around at 530.9 eV to quantify the surface oxygen vacancy contents of the as-prepared Ru−In2O3 samples and the results were listed in Table 1. From Table 1, the OL, OV and OH represent the oxygen atoms from the lattice, chemisorbed oxygen and surface hydroxyl groups of different Ru−In2O3 samples, respectively. Among them, for the 0.5% Ru−In2O3 samples the ratio of oxygen vacancy to all oxygen species was 44.3%, obviously higher than that of In2O3 doped with 0%, 0.1% and 1% Ru (20.6%, 22.6% and 22.2%, respectively), which could directly lead to its superior photocatalytic behaviors as discussed below.
Photocurrent response, electrochemical impedance spectroscopy (EIS) and surface photovoltage response (SPS) measurements were used to investigate the delocalization and separation efficiency of photogenerated carriers. As shown in Figure 7a, the photocurrent response of 0.5% Ru−In2O3 under visible light irradiation was significantly higher than that of the 0% Ru−In2O3, 0.1% Ru−In2O3 and 1% Ru−In2O3, indicating the photogenerated carriers of 0.5% Ru−In2O3 have the highest separation efficiency. From Figure 7b, the EIS plot of the 0.5% Ru−In2O3 samples exhibits a smaller arc radius than that of other Ru−In2O3 samples, indicating an improvement of migration and delocalization of photogenerated carriers. As shown in Figure 7c, the SPS response curves of all the Ru−In2O3 samples display a broad peak from 300 to 450 nm. Similarly, the SPS response of the 0.5% Ru−In2O3 samples is much more intense in comparison with that of other Ru−In2O3 samples. All the above mentioned results prove that the 0.5% Ru−In2O3 sample exhibits an enhanced delocalization and separation efficiency of photogenerated carriers, which is closely related to its higher surface oxygen vacancy content.

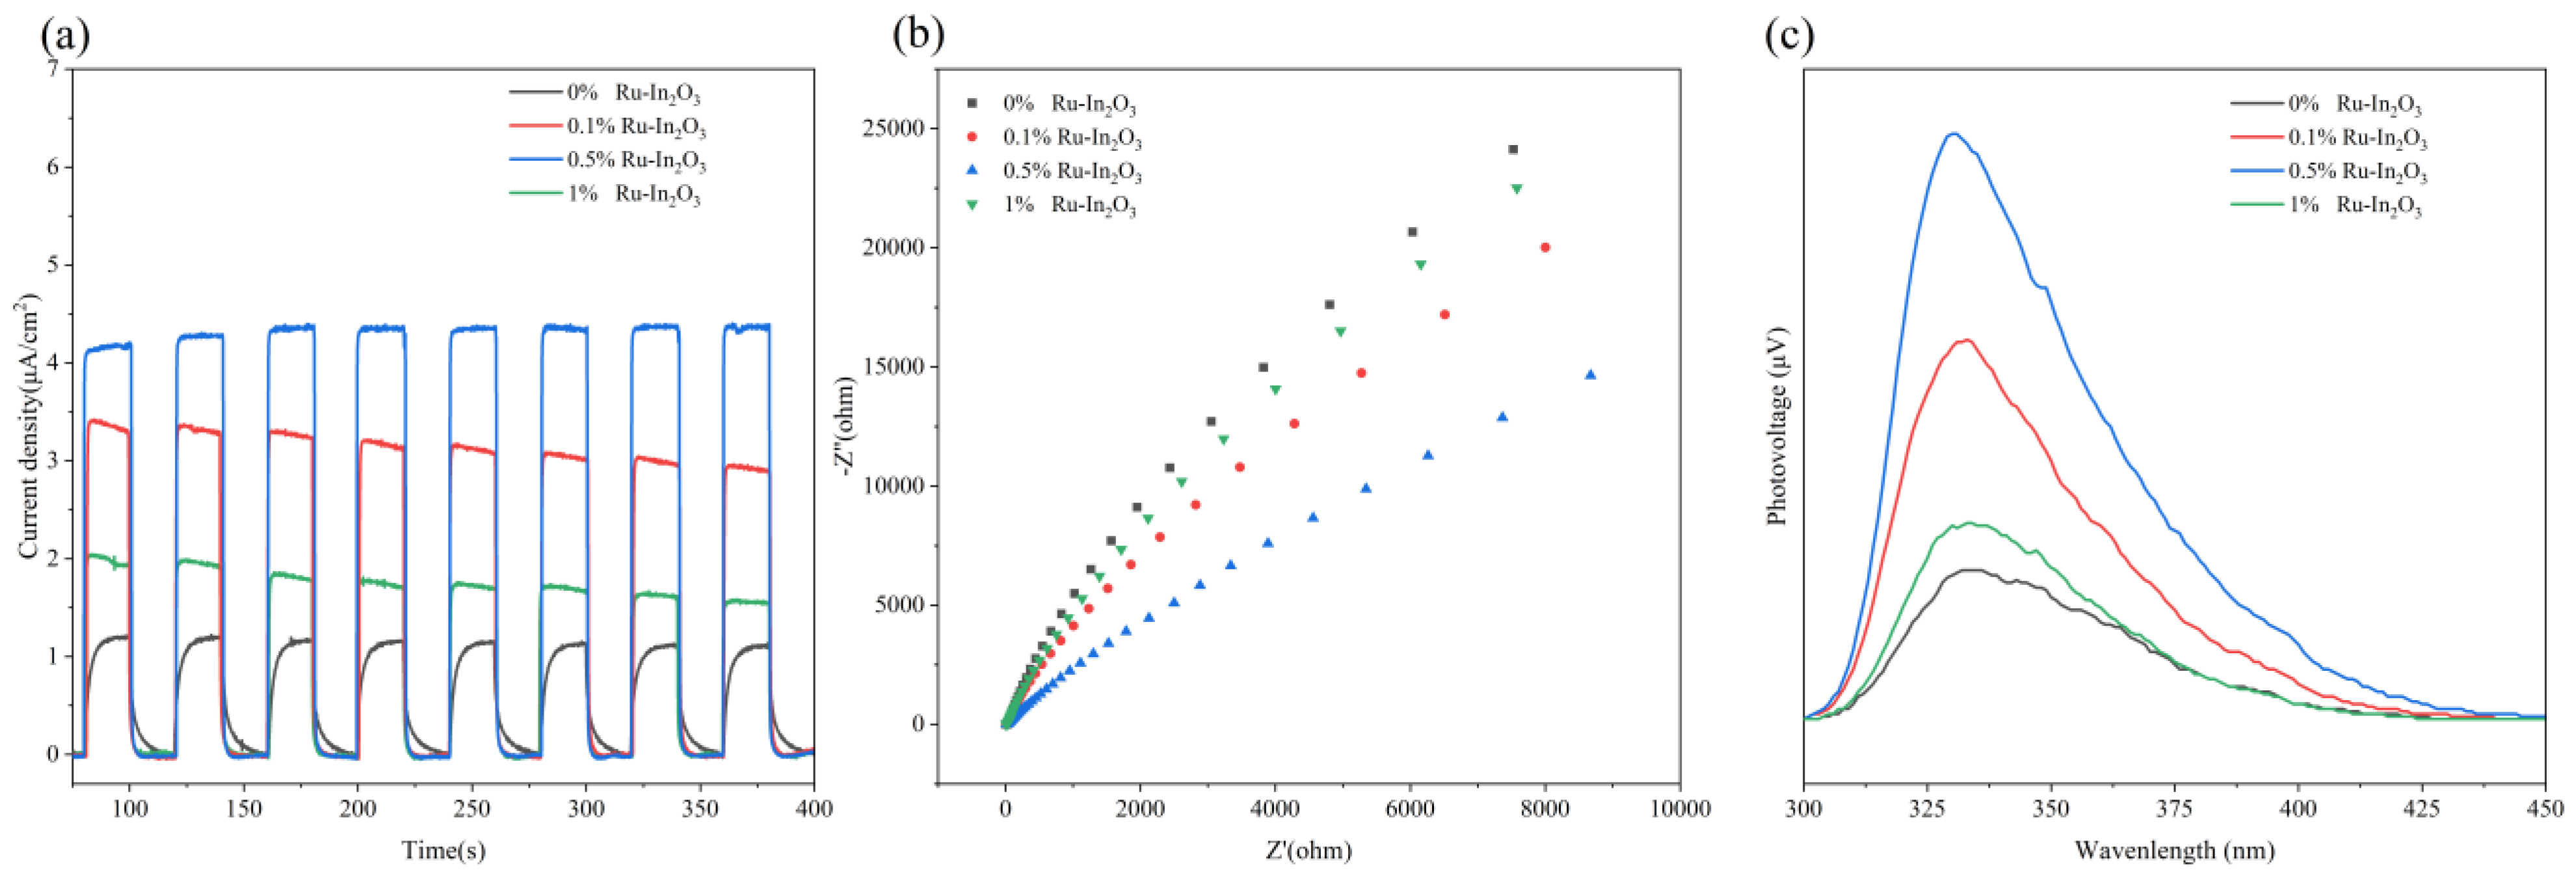
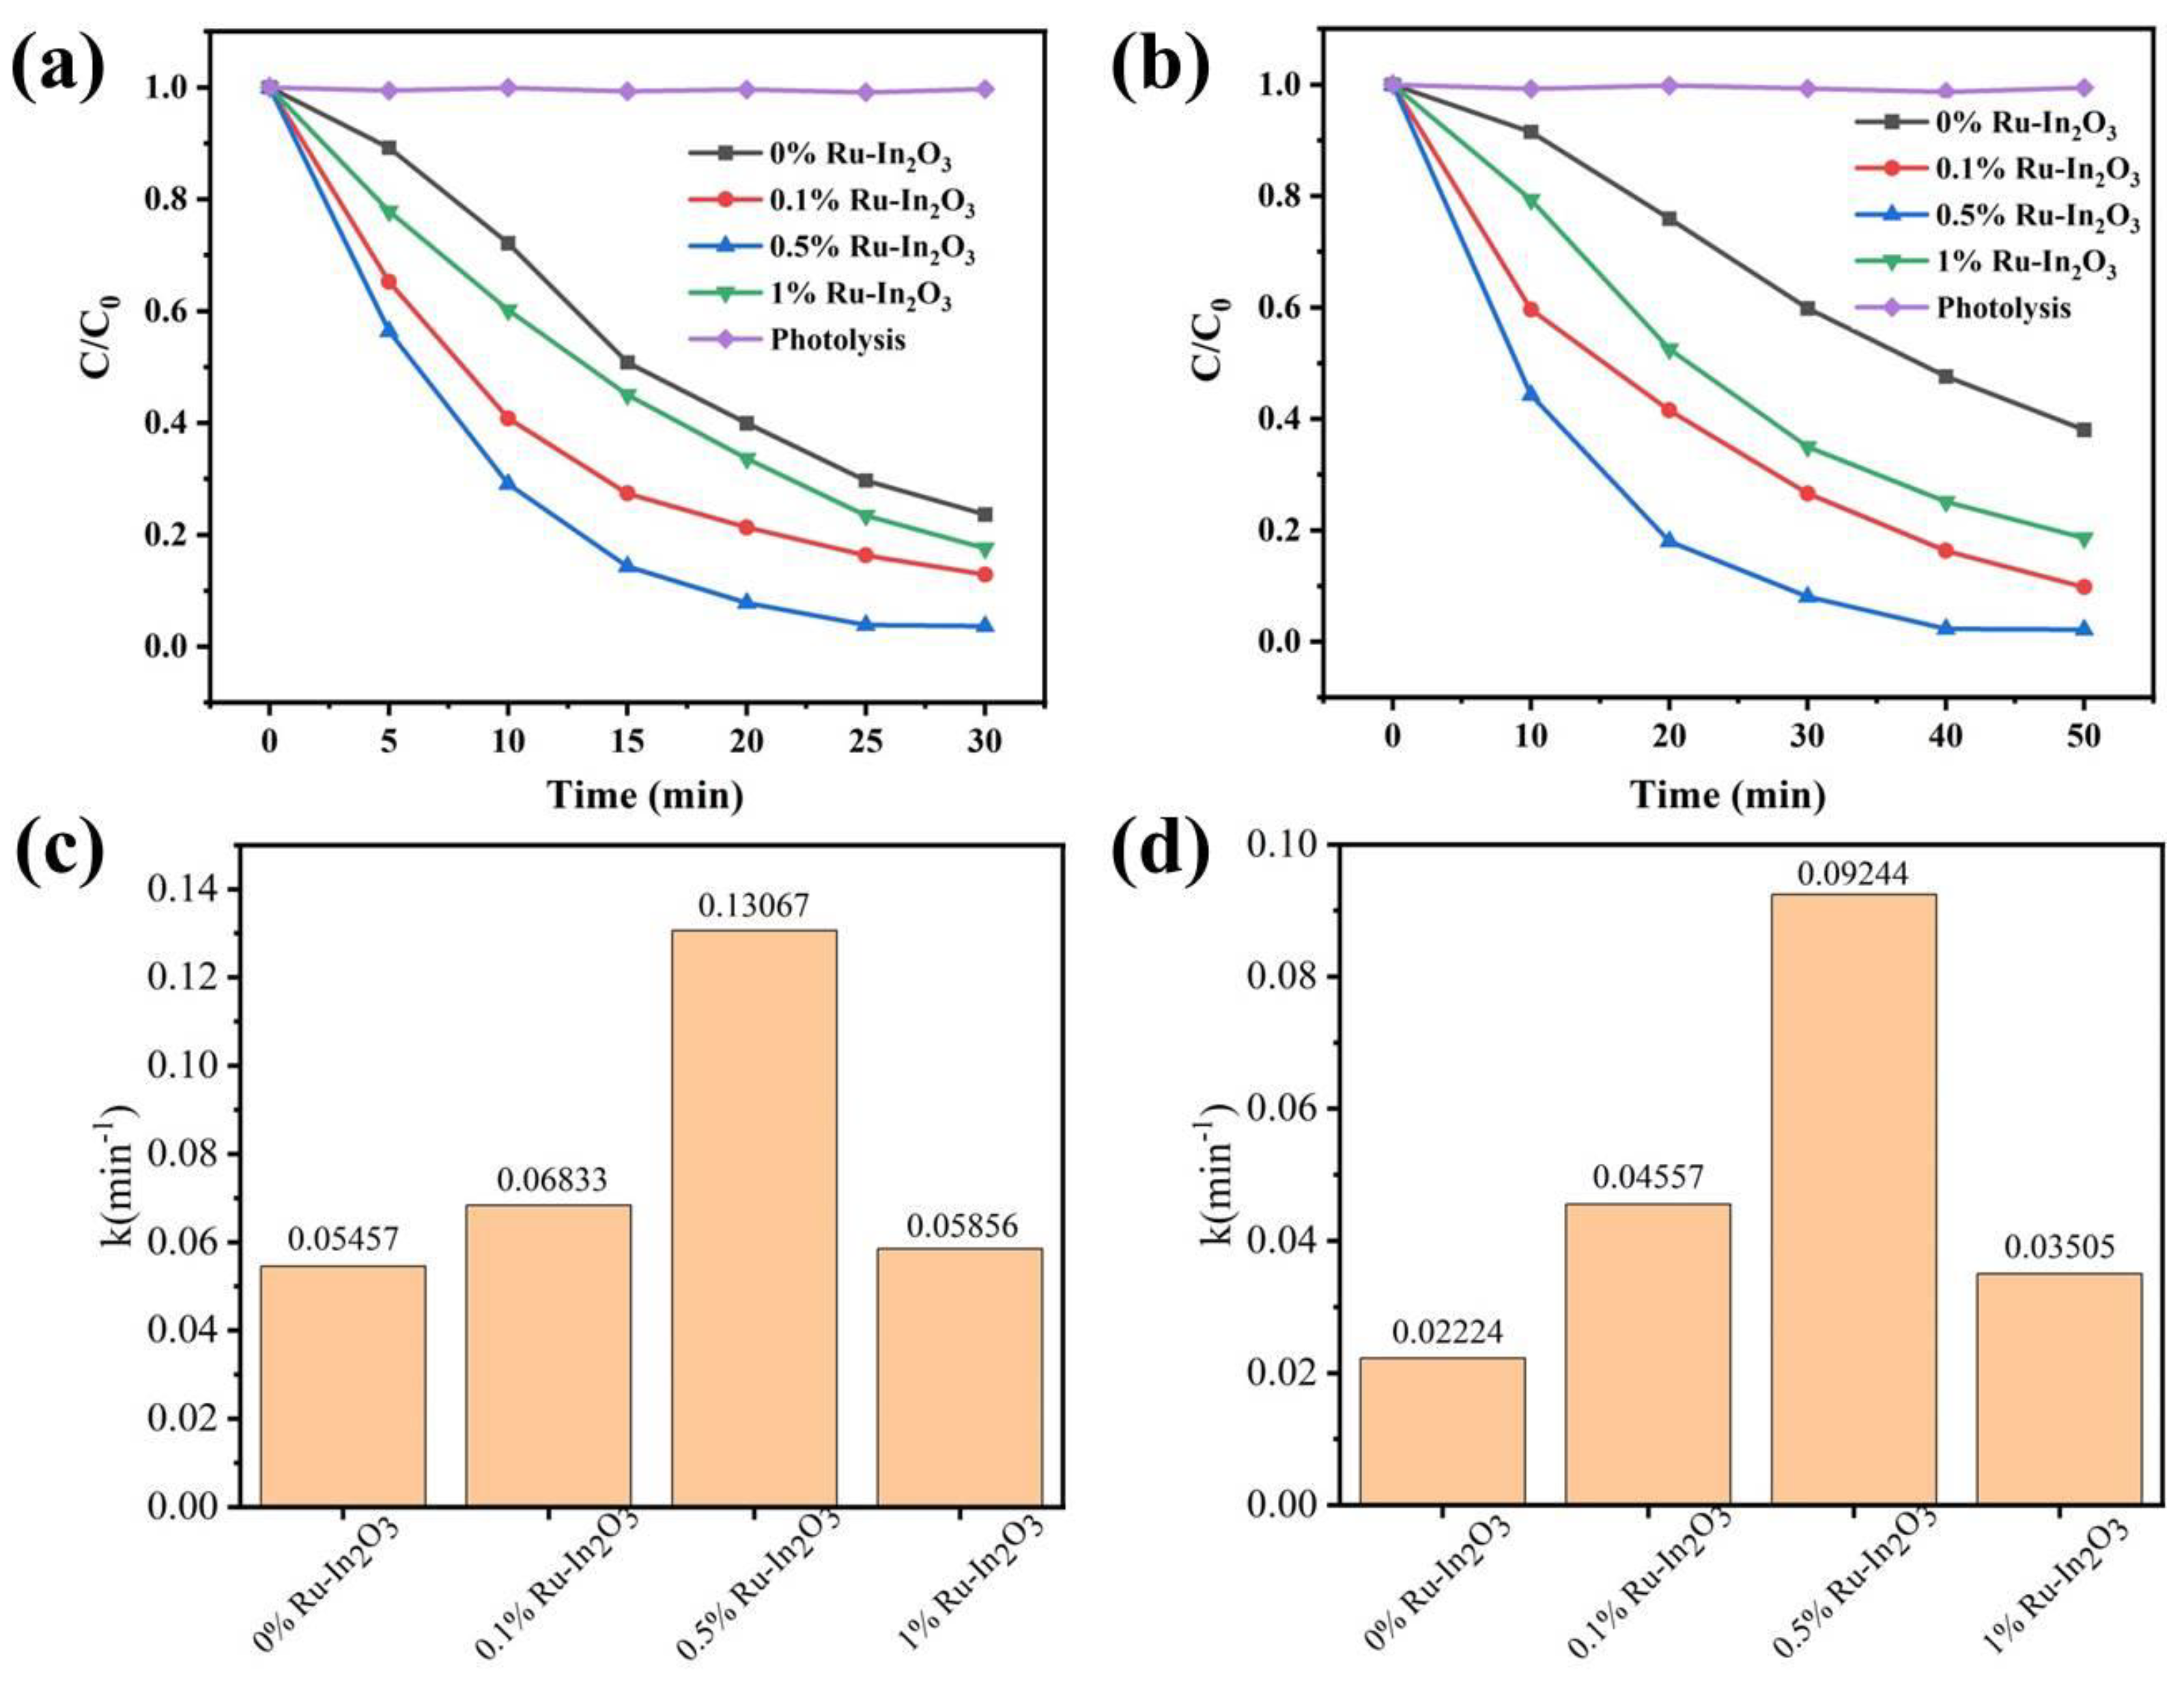
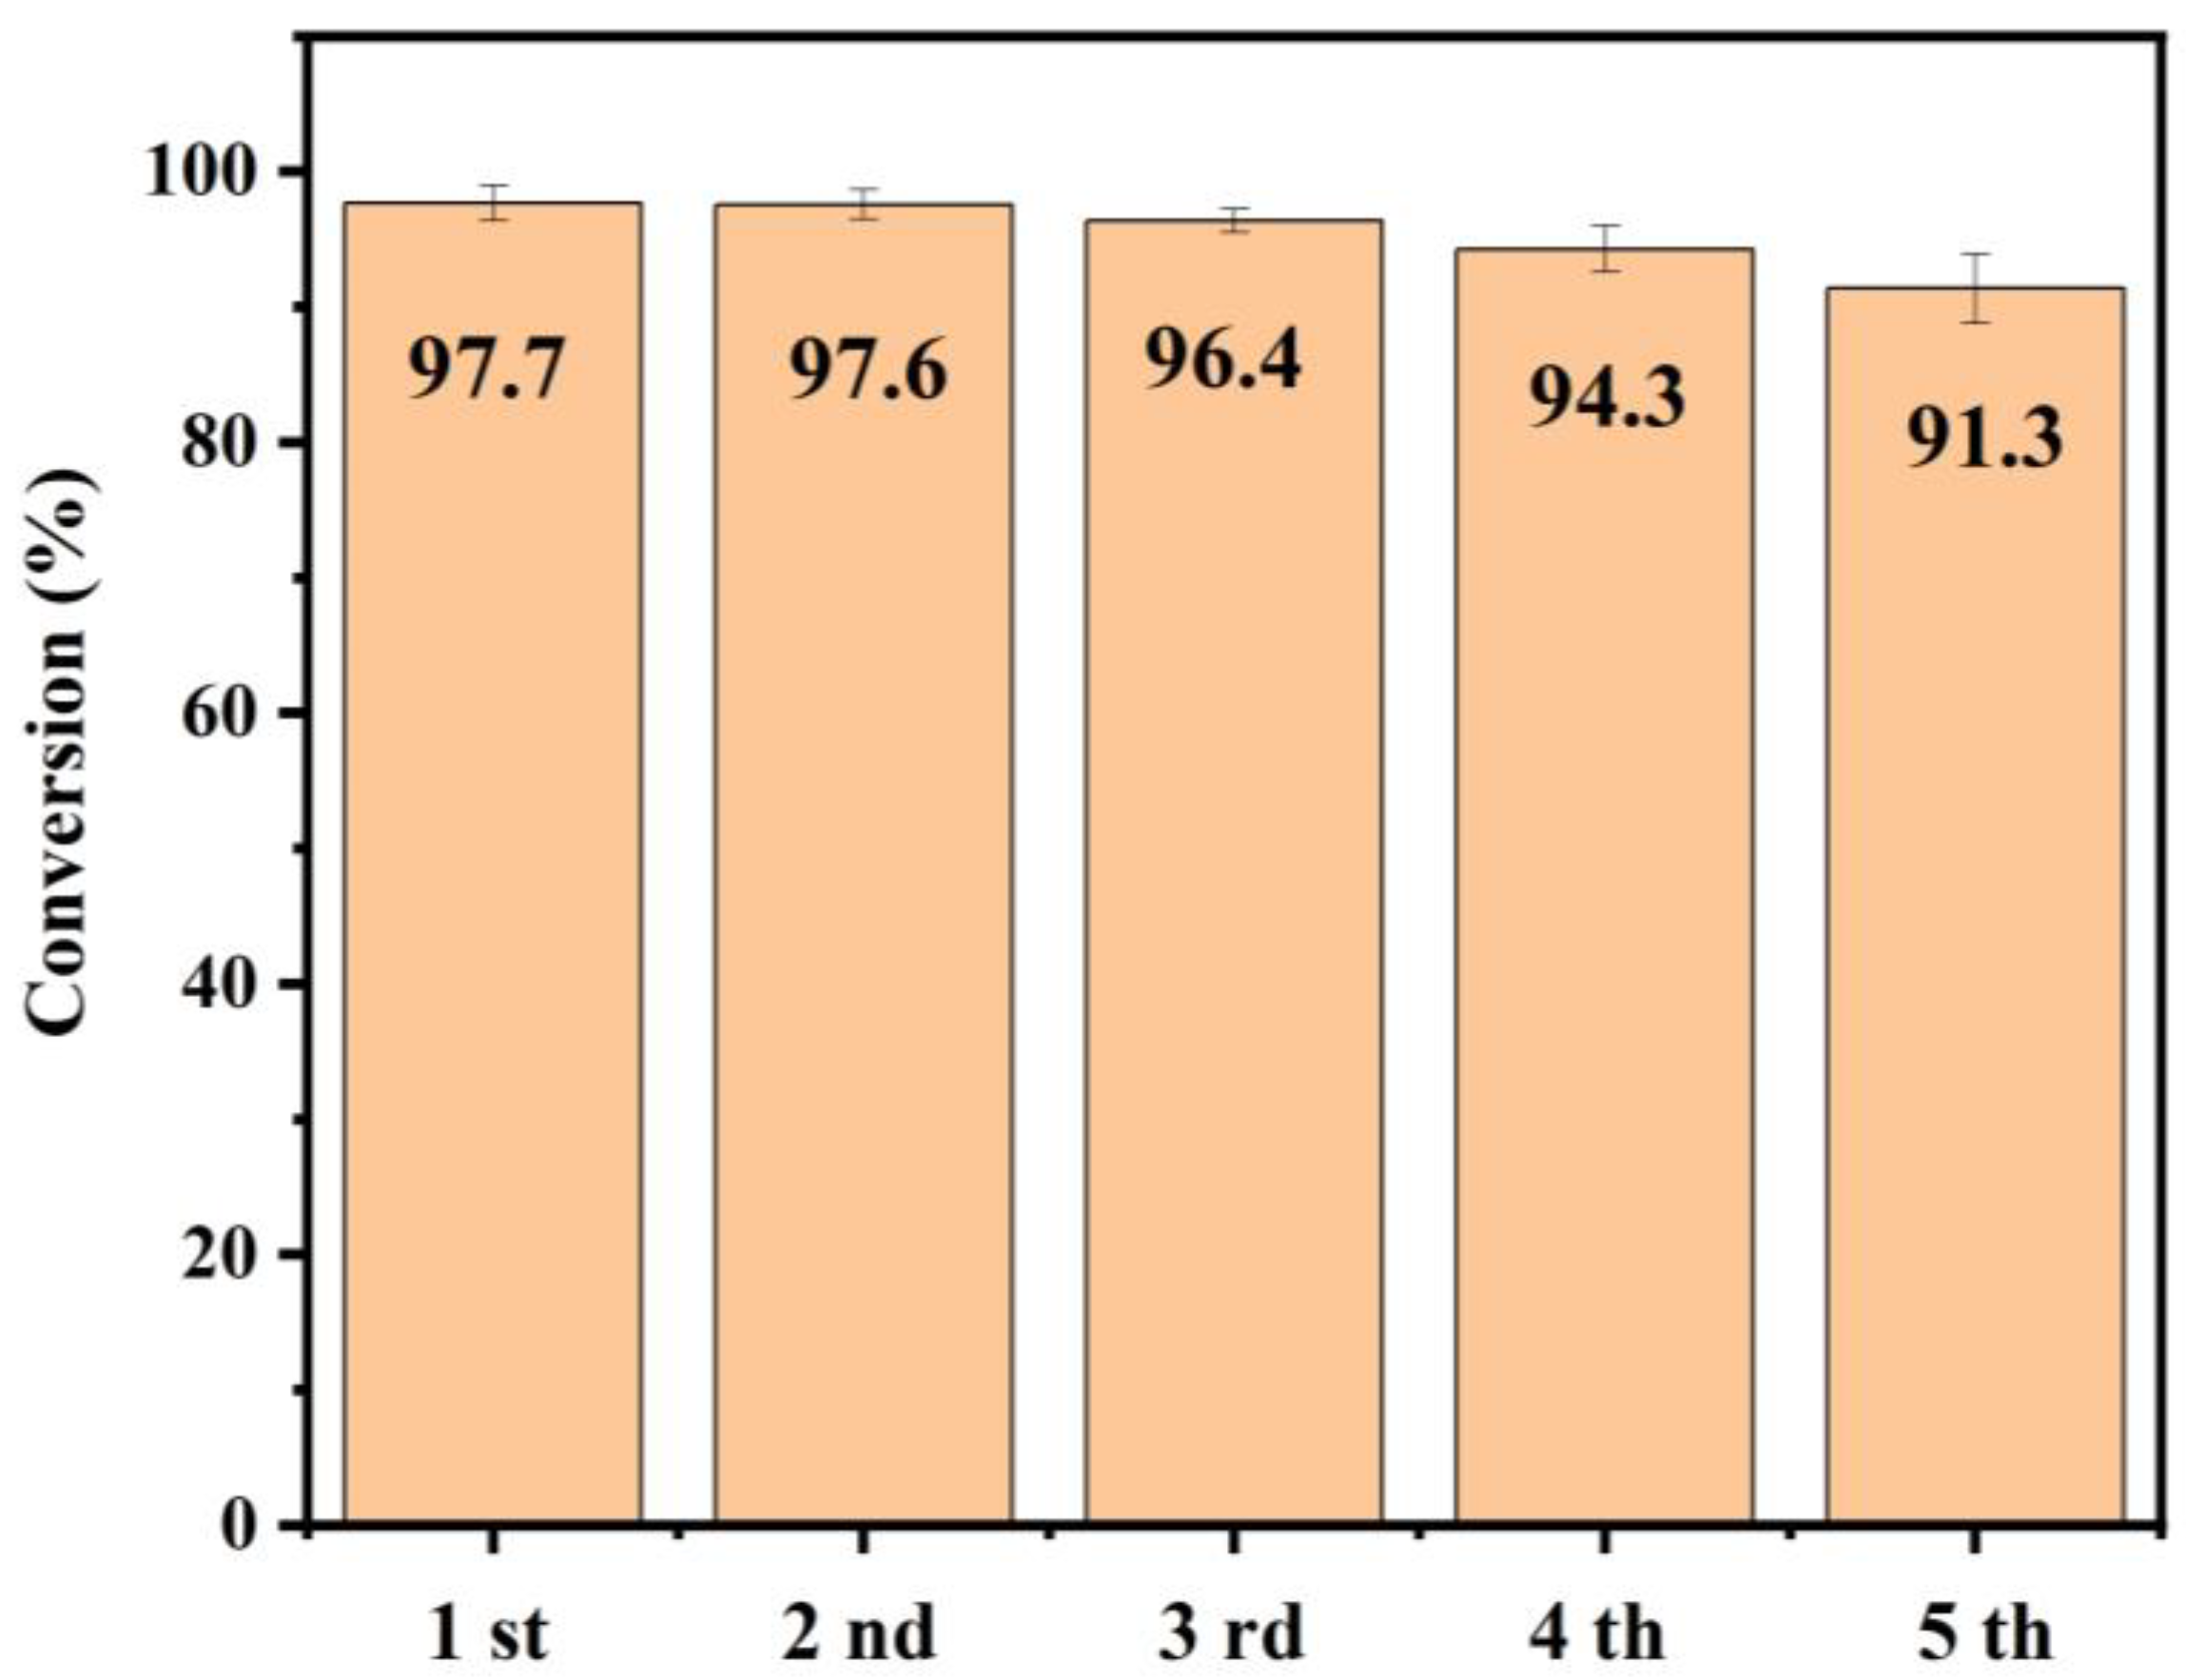
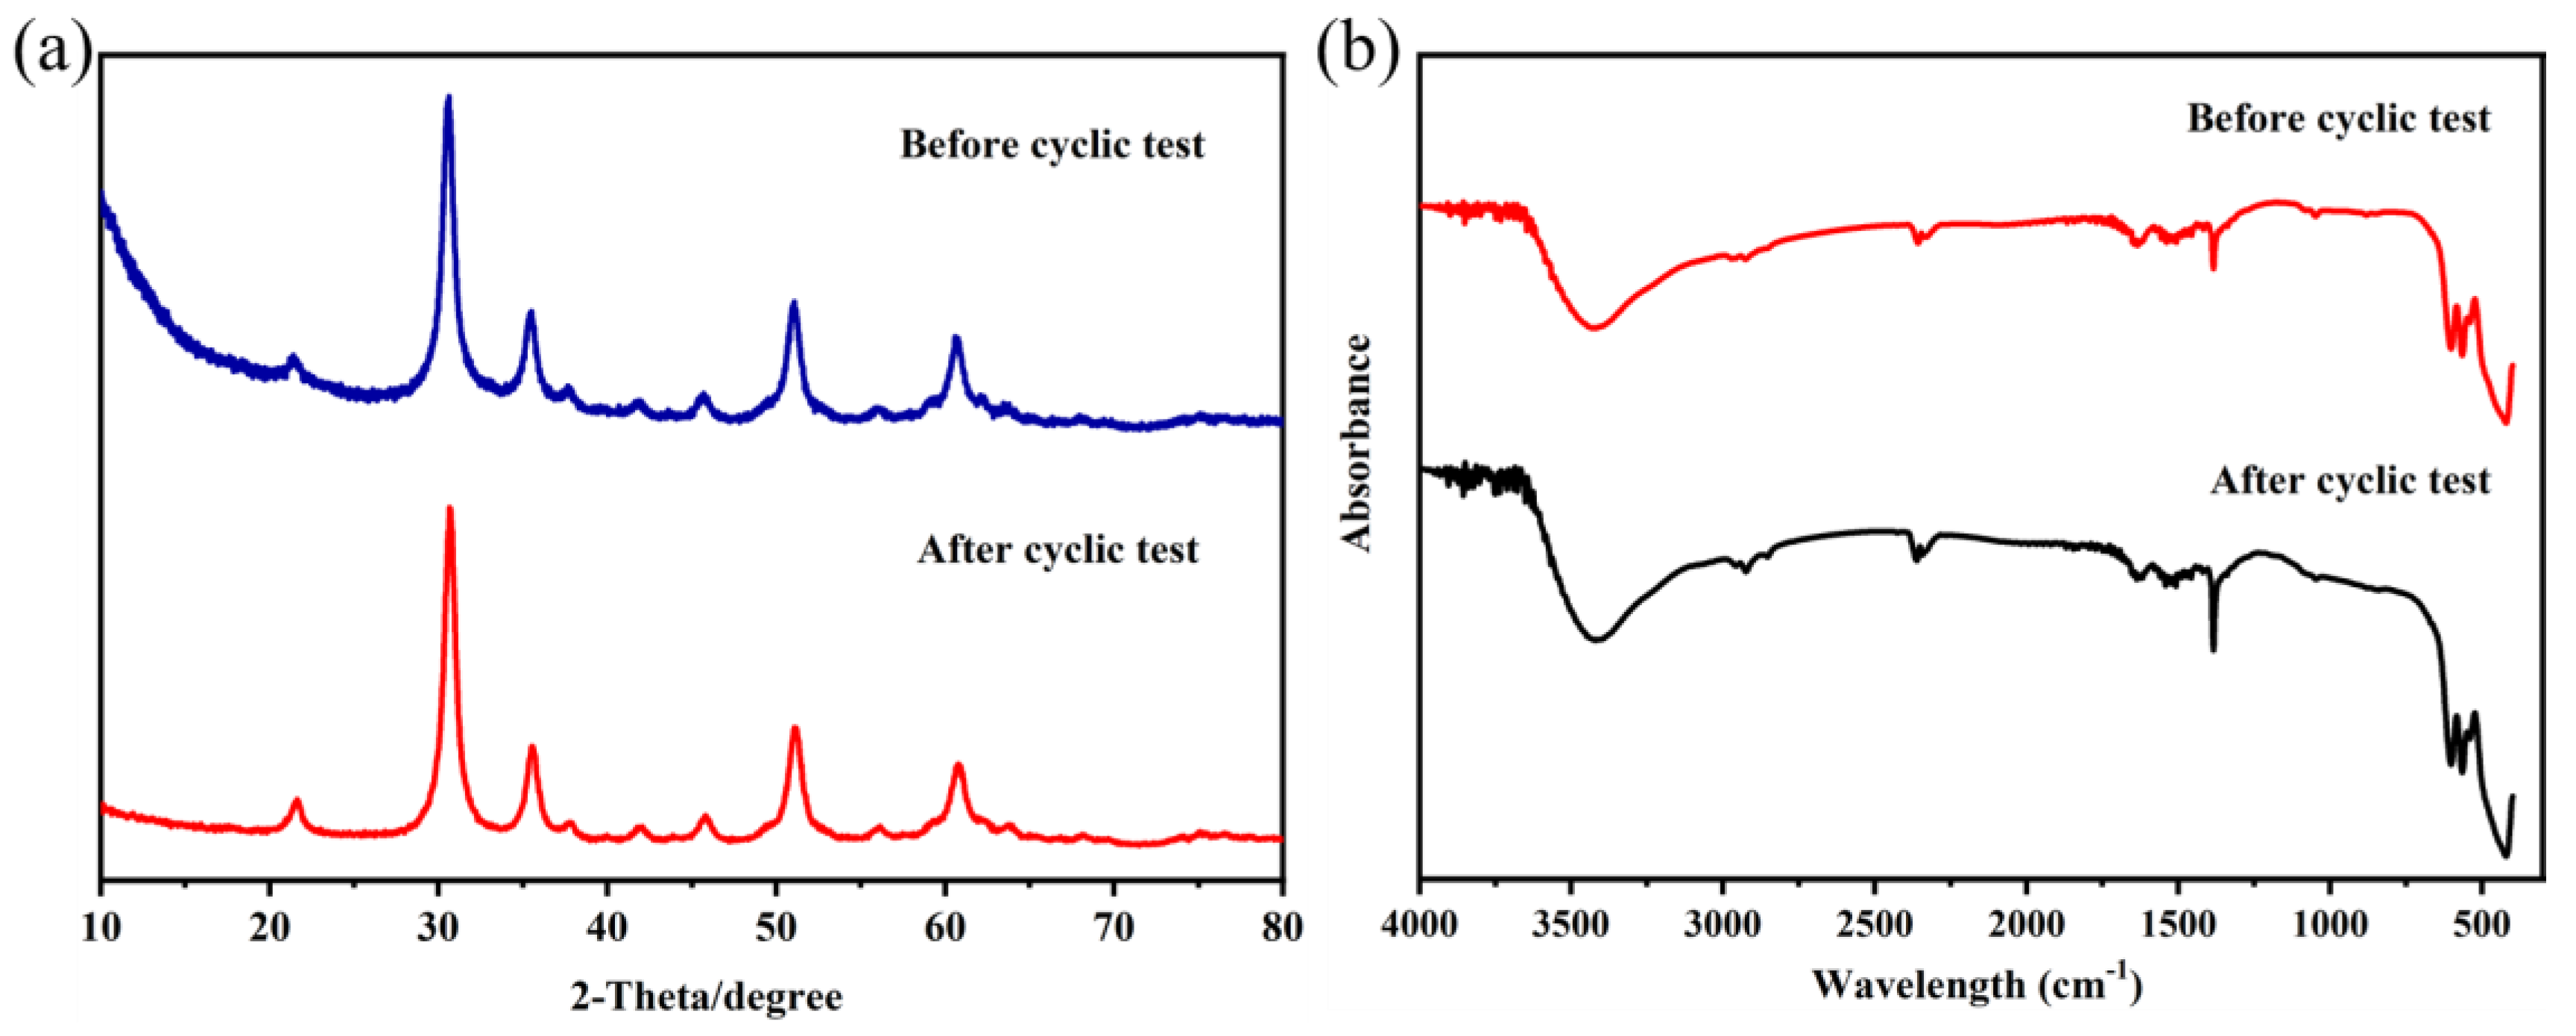
3.2. Photocatalytic Activity

Two typical brominated flame retardants, which are toxic substances in the environment (Deca−BDE and HBB), were used to evaluate the photocatalytic performance of Ru−In2O3 samples under visible light and Ar conditions. Figure 8, Figures S5 and S6 show the time profiles and corresponding kinetic values of different Ru−In2O3 samples for the photocatalytic dehalogenation of Deca−BDE and HBB, respectively. As shown in Figure 8a, the photolysis of the Deca−BDE was negligible under visible light irradiation while the removal efficiency of Deca−BDE by 0% Ru−In2O3 samples was only 76.4% within 30 min. With the doping of Ru, the removal efficiency increased and the removal efficiency of 0.5% Ru−In2O3 for Deca−BDE reached 96.3% within 30 min due to the promotion of surface oxygen vacancy content. However, excessive Ru doping (1%) caused the sliding of surface oxygen vacancy and thus resulted in the decrease of removal efficiency of Deca−BDE to 82.4% under the same experiment conditions. Figure 8c shows the corresponding apparent rate constant (K) of different Ru−In2O3 samples for the photocatalytic dehalogenation of Deca−BDE. From the figure, the K values of 0-1% Ru−In2O3 samples are 0.05457, 0.06833, 0.13067 and 0.05856 min−1, respectively. The photocatalytic dehalogenation efficiency of 0.5% Ru−In2O3 samples is about 2.4 times higher than that of the 0% Ru−In2O3 samples.
Meanwhile, the photocatalytic dehalogenation of HBB exhibited a similar tendency. As shown in Figure 8b, Within 50 min, the removal efficiency of HBB by 0.5% Ru−In2O3 samples reached a maximum of 97.8%. Moreover, the calculated K values in Figure 8d for 0-1% Ru−In2O3 samples are 0.02224, 0.04557, 0.09244 and 0.03505 min−1, respectively. For the dehalogenation of HBB, the removal efficiency of 0.5% Ru−In2O3 samples is about four times higher than that of the 0% Ru−In2O3 samples. These results are consistent with the above XPS results, indicating that the surface oxygen vacancy content is directly related to the separation efficiency of photogenerated carriers and thus determines the photocatalytic activities of the Ru−In2O3 samples. In addition, we have compared the photocatalytic performances of Deca−BDE over Ru−In2O3 samples with seven other kinds of photocatalysts [40,41,42]. As shown in Table S1, the as-prepared Ru−In2O3 samples exhibited superior photocatalytic dehalogenation performances compared to other photocatalysts, indicating that the increase of oxygen vacancy content is an effective way to improve photocatalytic performances in dehalogenation reactions. IC (ion chromatography) was used to study the transformation products during photocatalytic degradation. As shown in Figure S1, the formation of the bromide ion in the dehalogenation of Deca−BDE was much higher than the conversion of Deca−BDE, which might be due to the further degradation of Nona−BDE to Octa−BDE. Similar results could also be seen in the dehalogenation of HBB (Figure S2), in which tetrabromo-benzene might be formed during the photocatalytic reactions.
Furthermore, we tested the stability of 0.5% Ru−In2O3 samples through cyclic experiments for the degradation of Deca−BDE. As shown in Figure 9, the photocatalytic dehalogenation efficiency of the as-prepared Ru−In2O3 samples exhibits a gradual decline after five cycles, decreasing only from 97.7% to 91.3% after five cycles, indicating the remarkable reusability of the as-prepared 0.5% Ru−In2O3 samples in this reaction system. Moreover, we used XRD and FTIR to study the phase structure of the Ru−In2O3 samples after the reusability tests. In Figure 10a,b, no significant deviations can be observed in both XRD patterns and FTIR spectra of the 0.5% Ru−In2O3 samples before and after undergoing cyclic tests, thus confirming their exceptional stability.

4. Conclusions

In summary, In2O3 nanoparticles with varying oxygen vacancy contents were created by doping Ru through co-precipitation and subsequent thermal treatment. Through comprehensive characterizations and measurements, we demonstrated the effective modulation of oxygen vacancy content in the Ru−In2O3 samples via Ru doping. Meanwhile, the photocurrent, electrochemical impedance spectroscopy and surface photovoltage response measurements reveal that the increased oxygen vacancy content could effectively promote the separation efficiency of photogenerated electrons and holes, ultimately leading to improved photocatalytic performances of the as-prepared Ru−In2O3 samples. As a result, the 0.5% Ru−In2O3 enriched with oxygen vacancy exhibits dramatically enhanced photocatalytic dehalogenation performances of decabromodiphenyl ether and hexabromobenzene, approximately four times higher than that of the 0% Ru−In2O3 nanoparticles. This study emphasized the significance of the surface defects of the photocatalyst and may provide a valuable strategy to prepare highly active photocatalysts for brominated flame retardant removal.

Supplementary Materials

The following supporting information can be downloaded at: https://www.mdpi.com/article/10.3390/photochem3030022/s1, Figure S1: The formation of bromide ion in the photocatalytic dehalogenation of Deca–BDE over the 0.5% Ru−In2O3 samples; Figure S2: The formation of bromide ion in the photocatalytic dehalogenation of Deca–BDE over the 0.5% Ru−In2O3 samples; Figure S3: SEM image of the 0% Ru−In2O3 samples; Figure S4: SEM image of the 0.5% Ru−In2O3 samples; Figure S5: Kinetic studies for the degradation of Deca–BDE over the different Ru−In2O3 samples; Figure S6: Kinetic studies for the degradation of HBB over the different Ru−In2O3 samples; Table S1: The comparison of the photocatalytic performances with other studies [40,41,42].

Author Contributions

Conceptualization, J.X. and Z.W.; methodology, J.X., J.S. and Z.W.; investigation, J.X., J.S. and Z.W.; writing—original draft, J.X. and Z.W.; supervision, J.S. and Z.W.; writing—review and editing, Z.W. All authors have read and agreed to the published version of the manuscript.

Funding

This research was funded by the National Natural Science Foundation of China (Grant No. 21906184, 22006056) and the Fundamental Research Funds for the Central Universities, South-Central University for Nationalities (CZQ23008).

Data Availability Statement

The datasets generated during and/or analyzed during the current study are available from the corresponding author on reasonable request.

Acknowledgments

This work was financially supported by the College of Resources and Environmental Science of South-Central Minzu University.

Conflicts of Interest

All authors certify that the submission is original work and is not under review at any other publication. The authors declare no conflict of interest.

References

  1. De-Wit, C.A. An Overview of Brominated Flame Retardants in the Environment. Chemosphere 2002, 46, 583–624. [Google Scholar] [CrossRef] [PubMed]
  2. Wemken, N.; Drage, D.S.; Abdallah, M.A.; Harrad, S.; Coggins, M.A. Concentrations of Brominated Flame Retardants in Indoor Air and Dust from Ireland Reveal Elevated Exposure to Decabromodiphenyl Ethane. Environ. Sci. Technol. 2019, 53, 9826–9836. [Google Scholar] [CrossRef] [PubMed]
  3. Hites, R.A. Polybrominated Diphenyl Ethers in the Environment and in People: A Meta-Analysis of Concentrations. Environ. Sci. Technol. 2004, 38, 945–956. [Google Scholar] [CrossRef]
  4. Guo, S.; Zhu, L.; Majima, T.; Lei, M.; Tang, H. Reductive Debromination of Polybrominated Diphenyl Ethers: Dependence on Br Number of the Br-Rich Phenyl Ring. Environ. Sci. Technol. 2019, 53, 4433–4439. [Google Scholar] [CrossRef] [PubMed]
  5. Yu, L.; Han, Z.; Liu, C. A Review on the Effects of PBDEs on Thyroid and Reproduction Systems in Fish. Gen. Comp. Endocrinol. 2015, 219, 64–73. [Google Scholar] [CrossRef] [PubMed]
  6. Burreau, S.; Zebuhr, Y.; Broman, D.; Ishaq, R. Biomagnification of Polychlorinated Biphenyls (PCBs) and Polybrominated Diphenyl Ethers (PBDEs) Studied in Pike (Esox lucius), Perch (Perca fluviatilis) and Roach (Rutilus rutilus) from the Baltic Sea. Chemosphere 2004, 55, 1043–1052. [Google Scholar] [CrossRef] [PubMed]
  7. Abbasi, G.; Li, L.; Breivik, K. Global Historical Stocks and Emissions of PBDEs. Environ. Sci. Technol. 2019, 53, 6330–6340. [Google Scholar] [CrossRef]
  8. Zhou, C.; Pagano, J.; McGoldrick, D.J.; Chen, D.; Crimmins, B.S.; Hopke, P.K.; Milligan, M.S.; Murphy, E.W.; Holsen, T.M. Legacy Polybrominated Diphenyl Ethers (PBDEs) Trends in Top Predator Fish of the Laurentian Great Lakes (GL) from 1979 to 2016: Will Concentrations Continue to Decrease? Environ. Sci. Technol. 2019, 53, 6650–6659. [Google Scholar] [CrossRef]
  9. Singh, A.R.; Dhumal, P.S.; Bhakare, M.A.; Lokhande, K.D.; Bondarde, M.P.; Some, S. In-situ Synthesis of Metal Oxide and Polymer Decorated Activated Carbon-Based Photocatalyst for Organic Pollutants Degradation. Sep. Purif. Technol. 2022, 286, 120380. [Google Scholar] [CrossRef]
  10. Samanta, A.; Goswami, M.N.; Mahapatra, P.K. Fe-Doped ZnO Nanoparticles as Novel Photonic and Multiferroic Semiconductor. Mater. Chem. Phys. 2020, 240, 122180. [Google Scholar] [CrossRef]
  11. Sun, C.; Zhao, D.; Chen, C.; Ma, W.; Zhao, J. TiO2-Mediated Photocatalytic Debromination of Decabromodiphenyl Ether: Kinetics and Intermediates. Environ. Sci. Technol. 2009, 43, 157–162. [Google Scholar] [CrossRef] [PubMed]
  12. Santos, M.S.F.; Alves, A.; Madeira, L.M. Chemical and Photochemical Degradation of Polybrominated Diphenyl Ethers in Liquid Systems—A Review. Water Res. 2016, 88, 39–59. [Google Scholar] [CrossRef] [PubMed]
  13. Zhang, F.; Li, X.; Zhao, Q.; Chen, G.; Zhang, Q. High-Performance In2O3@Pani Core@Shell Architectures with Ultralong Charge Carriers Lifetime for Photocatalytic Degradation of Gaseous 1,2-Dichlorobenzene. Appl. Catal. B Environ. 2020, 263, 118278. [Google Scholar] [CrossRef]
  14. Lei, M.; Wang, N.; Zhu, L.; Xie, C.; Tang, H. A Peculiar Mechanism for the Photocatalytic Reduction of Decabromodiphenyl Ether over Reduced Graphene Oxide–TiO2 Photocatalyst. Chem. Eng. J. 2014, 241, 207–215. [Google Scholar] [CrossRef]
  15. Guo, W.; Zou, J.; Guo, B.; Xiong, J.; Liu, C.; Xie, Z.; Wu, L. Pd Nanoclusters/TiO2(B) Nanosheets with Surface Defects Toward Rapid Photocatalytic Dehalogenation of Polyhalogenated Biphenyls Under Visible Light. Appl. Catal. B Environ. 2020, 277, 119255. [Google Scholar] [CrossRef]
  16. Feng, Z.; Zhu, X.; Yang, J.; Zhong, K.; Jiang, Z.; Yu, Q.; Song, Y.; Hua, Y.; Li, H.; Xu, H. Inherent Facet-Dominant Effect for Cobalt Oxide Nanosheets to Enhance Photocatalytic CO2 Reduction. Appl. Surf. Sci. 2022, 578, 151848. [Google Scholar] [CrossRef]
  17. Liu, Z.; Tian, J.; Zeng, D.; Yu, C.; Huang, W.; Yang, K.; Liu, X.; Liu, H. Binary-Phase TiO2 Modified Bi2MoO6 Crystal for Effective Removal of Antibiotics under Visible Light Illumination. Mater. Res. Bull. 2019, 112, 336–345. [Google Scholar] [CrossRef]
  18. Lai, Y.; Meng, M.; Yu, Y.; Wang, X.; Ding, T. Photoluminescence and Photocatalysis of the Flower-Like Nano-ZnO Photocatalysts Prepared by a Facile Hydrothermal Method with or without Ultrasonic Assistance. Appl. Catal. B Environ. 2011, 105, 335–345. [Google Scholar] [CrossRef]
  19. Chen, S.; Wang, H.; Kang, Z.; Jin, S.; Zhang, X.; Zheng, X.; Qi, Z.; Zhu, J.; Pan, B.; Xie, Y. Oxygen Vacancy Associated Single-Electron Transfer for Photofixation of CO2 to Long-Chain Chemicals. Nat. Commun. 2019, 10, 788. [Google Scholar] [CrossRef]
  20. Lei, F.; Sun, Y.; Liu, K.; Gao, S.; Liang, L.; Pan, B.; Xie, Y. Oxygen Vacancies Confined in Ultrathin Indium Oxide Porous Sheets for Promoted Visible-Light Water Splitting. J. Am. Chem. Soc. 2014, 136, 6826–6829. [Google Scholar] [CrossRef]
  21. Raizada, P.; Soni, V.; Kumar, A.; Singh, P.; Parwaz Khan, A.A.; Asiri, A.M.; Thakur, V.K.; Nguyen, V.-H. Surface Defect Engineering of Metal Oxides Photocatalyst for Energy Application and Water Treatment. J. Mater. 2021, 7, 388–418. [Google Scholar] [CrossRef]
  22. Ni, M.; Zhu, Y.; Guo, C.; Chen, D.-L.; Ning, J.; Zhong, Y.; Hu, Y. Efficient Visible-Light-Driven CO2 Methanation with Self-Regenerated Oxygen Vacancies in Co3O4/NiCo2O4 Hetero-Nanocages: Vacancy-Mediated Selective Photocatalysis. ACS Catal. 2023, 13, 2502–2512. [Google Scholar] [CrossRef]
  23. Hoch, L.B.; He, L.; Qiao, Q.; Liao, K.; Reyes, L.M.; Zhu, Y.; Ozin, G.A. Effect of Precursor Selection on the Photocatalytic Performance of Indium Oxide Nanomaterials for Gas-Phase CO2 Reduction. Chem. Mater. 2016, 28, 4160–4168. [Google Scholar] [CrossRef]
  24. Ran, M.; Wang, H.; Cui, W.; Li, J.; Chen, P.; Sun, Y.; Sheng, J.; Zhou, Y.; Zhang, Y.; Dong, F. Light-Induced Generation and Regeneration of Oxygen Vacancies in BiSbO4 for Sustainable Visible Light Photocatalysis. ACS Appl. Mater. Interfaces 2019, 11, 47984–47991. [Google Scholar] [CrossRef]
  25. Geng, Z.; Kong, X.; Chen, W.; Su, H.; Liu, Y.; Cai, F.; Wang, G.; Zeng, J. Oxygen Vacancies in ZnO Nanosheets Enhance CO2 Electrochemical Reduction to CO. Angew. Chem. Int. Ed. 2018, 57, 6054–6059. [Google Scholar] [CrossRef]
  26. Bi, W.; Ye, C.; Xiao, C.; Tong, W.; Zhang, X.; Shao, W.; Xie, Y. Spatial Location Engineering of Oxygen Vacancies for Optimized Photocatalytic H2 Evolution Activity. Small 2014, 10, 2820–2825. [Google Scholar] [CrossRef] [PubMed]
  27. Yang, Y.; Yin, L.-C.; Gong, Y.; Niu, P.; Wang, J.-Q.; Gu, L.; Chen, X.; Liu, G.; Wang, L.; Cheng, H.-M. An Unusual Strong Visible-Light Absorption Band in Red Anatase TiO2 Photocatalyst Induced by Atomic Hydrogen-Occupied Oxygen Vacancies. Adv. Mater. 2018, 30, 1704479. [Google Scholar] [CrossRef] [PubMed]
  28. Wan, N.; Xing, Z.; Kuang, J.; Li, Z.; Yin, J.; Zhu, Q.; Zhou, W. Oxygen Vacancy-Mediated Efficient Electron-Hole Separation for C-N-S-Tridoped Single Crystal Black TiO2(B) Nanorods as Visible-Light-Driven Photocatalysts. Appl. Surf. Sci. 2018, 457, 287–294. [Google Scholar] [CrossRef]
  29. Huang, L.; Duan, Z.; Song, Y.; Li, Q.; Chen, L. BiVO4 Microplates with Oxygen Vacancies Decorated with Metallic Cu and Bi Nanoparticles for CO2 Photoreduction. ACS Appl. Nano Mater. 2021, 4, 3576–3585. [Google Scholar] [CrossRef]
  30. Vu, M.-H.; Quach, T.-A.; Do, T.-O. The Construction of Ru-doped In2O3 Hollow Peanut-like Structure for An Enhanced Photocatalytic Nitrogen Reduction under Solar Light Irradiation. Sustain. Energ. Fuels 2021, 5, 2528–2536. [Google Scholar] [CrossRef]
  31. Wang, J.; Su, J.; Chen, H.; Zou, X.; Li, G. Oxygen Vacancy-rich, Ru-doped In2O3 Ultrathin Nanosheets for Efficient Detection of Xylene at Low Temperature. J. Mater. Chem. C 2018, 5, 2528–2536. [Google Scholar] [CrossRef]
  32. Wu, Q.; Shen, C.; Rui, N.; Sun, K.; Liy, C. Experimental and Theoretical Studies of CO2 Hydrogenation to Methanol on Ru/In2O3. J. CO2 Util. 2021, 53, 101720. [Google Scholar] [CrossRef]
  33. Li, H.; Tang, X.; Zhong, J.; Li, J.; Chen, G.; Chen, C. Carbon Nanofibers Induced Tunable Oxygen Vacancies on BiOCl for High Efficient Destruction of Decontaminants. Surf. Interfaces 2021, 25, 101247. [Google Scholar] [CrossRef]
  34. Huang, J.; Dou, L.; Li, J.; Zhong, J.; Li, M.; Wang, T. Excellent Visible Light Responsive Photocatalytic Behavior of N-Doped TiO2 toward Decontamination of Organic Pollutants. J. Hazard. Mater. 2021, 403, 123857. [Google Scholar] [CrossRef]
  35. Zhang, J.; Balasubramanian, R.; Yang, X. Novel 3D Multi-Layered Carbon Nitride/Indium Sulfide Heterostructure for Boosted Superoxide Anion Radical Generation and Enhanced Photocatalysis under Visible Light. Chem. Eng. J. 2023, 453, 139776. [Google Scholar] [CrossRef]
  36. Wang, W.; Chen, X.; Liu, G.; Shen, Z.; Xia, D.; Wong, P.K.; Yu, J.C. Monoclinic Dibismuth Tetraoxide: A New Visible-Light-Driven Photocatalyst for Environmental Remediation. Appl. Catal. B Environ. 2015, 106–177, 444–453. [Google Scholar] [CrossRef]
  37. Huang, Y.; Wang, K.; Guo, T.; Li, J.; Wu, X.; Zhang, G. Construction of 2D/2D Bi2Se3/g-C3N4 Nanocomposite with High Interfacial Charge Separation and Photo-Heat Conversion Efficiency for Selective Photocatalytic CO2 Reduction. Appl. Catal. B Environ. 2020, 277, 119232. [Google Scholar] [CrossRef]
  38. Chang, W.-C.; Kuo, C.-H.; Juan, C.-C.; Lee, P.-J.; Chueh, Y.-L.; Lin, S.-J. Sn-Doped In2O3 Nanowires: Enhancement of Electrical Field Emission by a Selective Area Growth. Nanoscale Res. Lett. 2012, 7, 684. [Google Scholar] [CrossRef]
  39. He, L.; Wood, T.E.; Wu, B.; Dong, Y.; Hoch, L.B.; Reyes, L.M.; Wang, D.; Kubel, C.; Qian, C.; Jia, J.; et al. Spatial Separation of Charge Carriers in In2O3-x(OH)y Nanocrystal Superstructures for Enhanced Gas-Phase Photocatalytic Activity. ACS Nano 2016, 10, 5578–5586. [Google Scholar] [CrossRef]
  40. Lv, Y.; Cao, X.; Jiang, H.; Song, W.; Chen, C.; Zhao, J. Rapid Photocatalytic Debromination on TiO2 with In-situ Formed Copper Co-catalyst: Enhanced Adsorption and Visible Light Activity. Appl. Catal. B Environ. 2016, 194, 150–156. [Google Scholar] [CrossRef]
  41. Wan, Z.; Mao, Q.; Chen, Q. Proton-dependent Photocatalytic Dehalogenation Activities Caused by Oxygen Vacancies of In2O3. Chem. Eng. J. 2021, 403, 126389. [Google Scholar] [CrossRef]
  42. Sun, C.; Chen, C.; Ma, W.; Zhao, J. Photocatalytic Debromination of Decabromodiphenyl Ether by Graphitic Carbon Nitride. Sci. China Chem. 2012, 55, 2532–2536. [Google Scholar] [CrossRef]
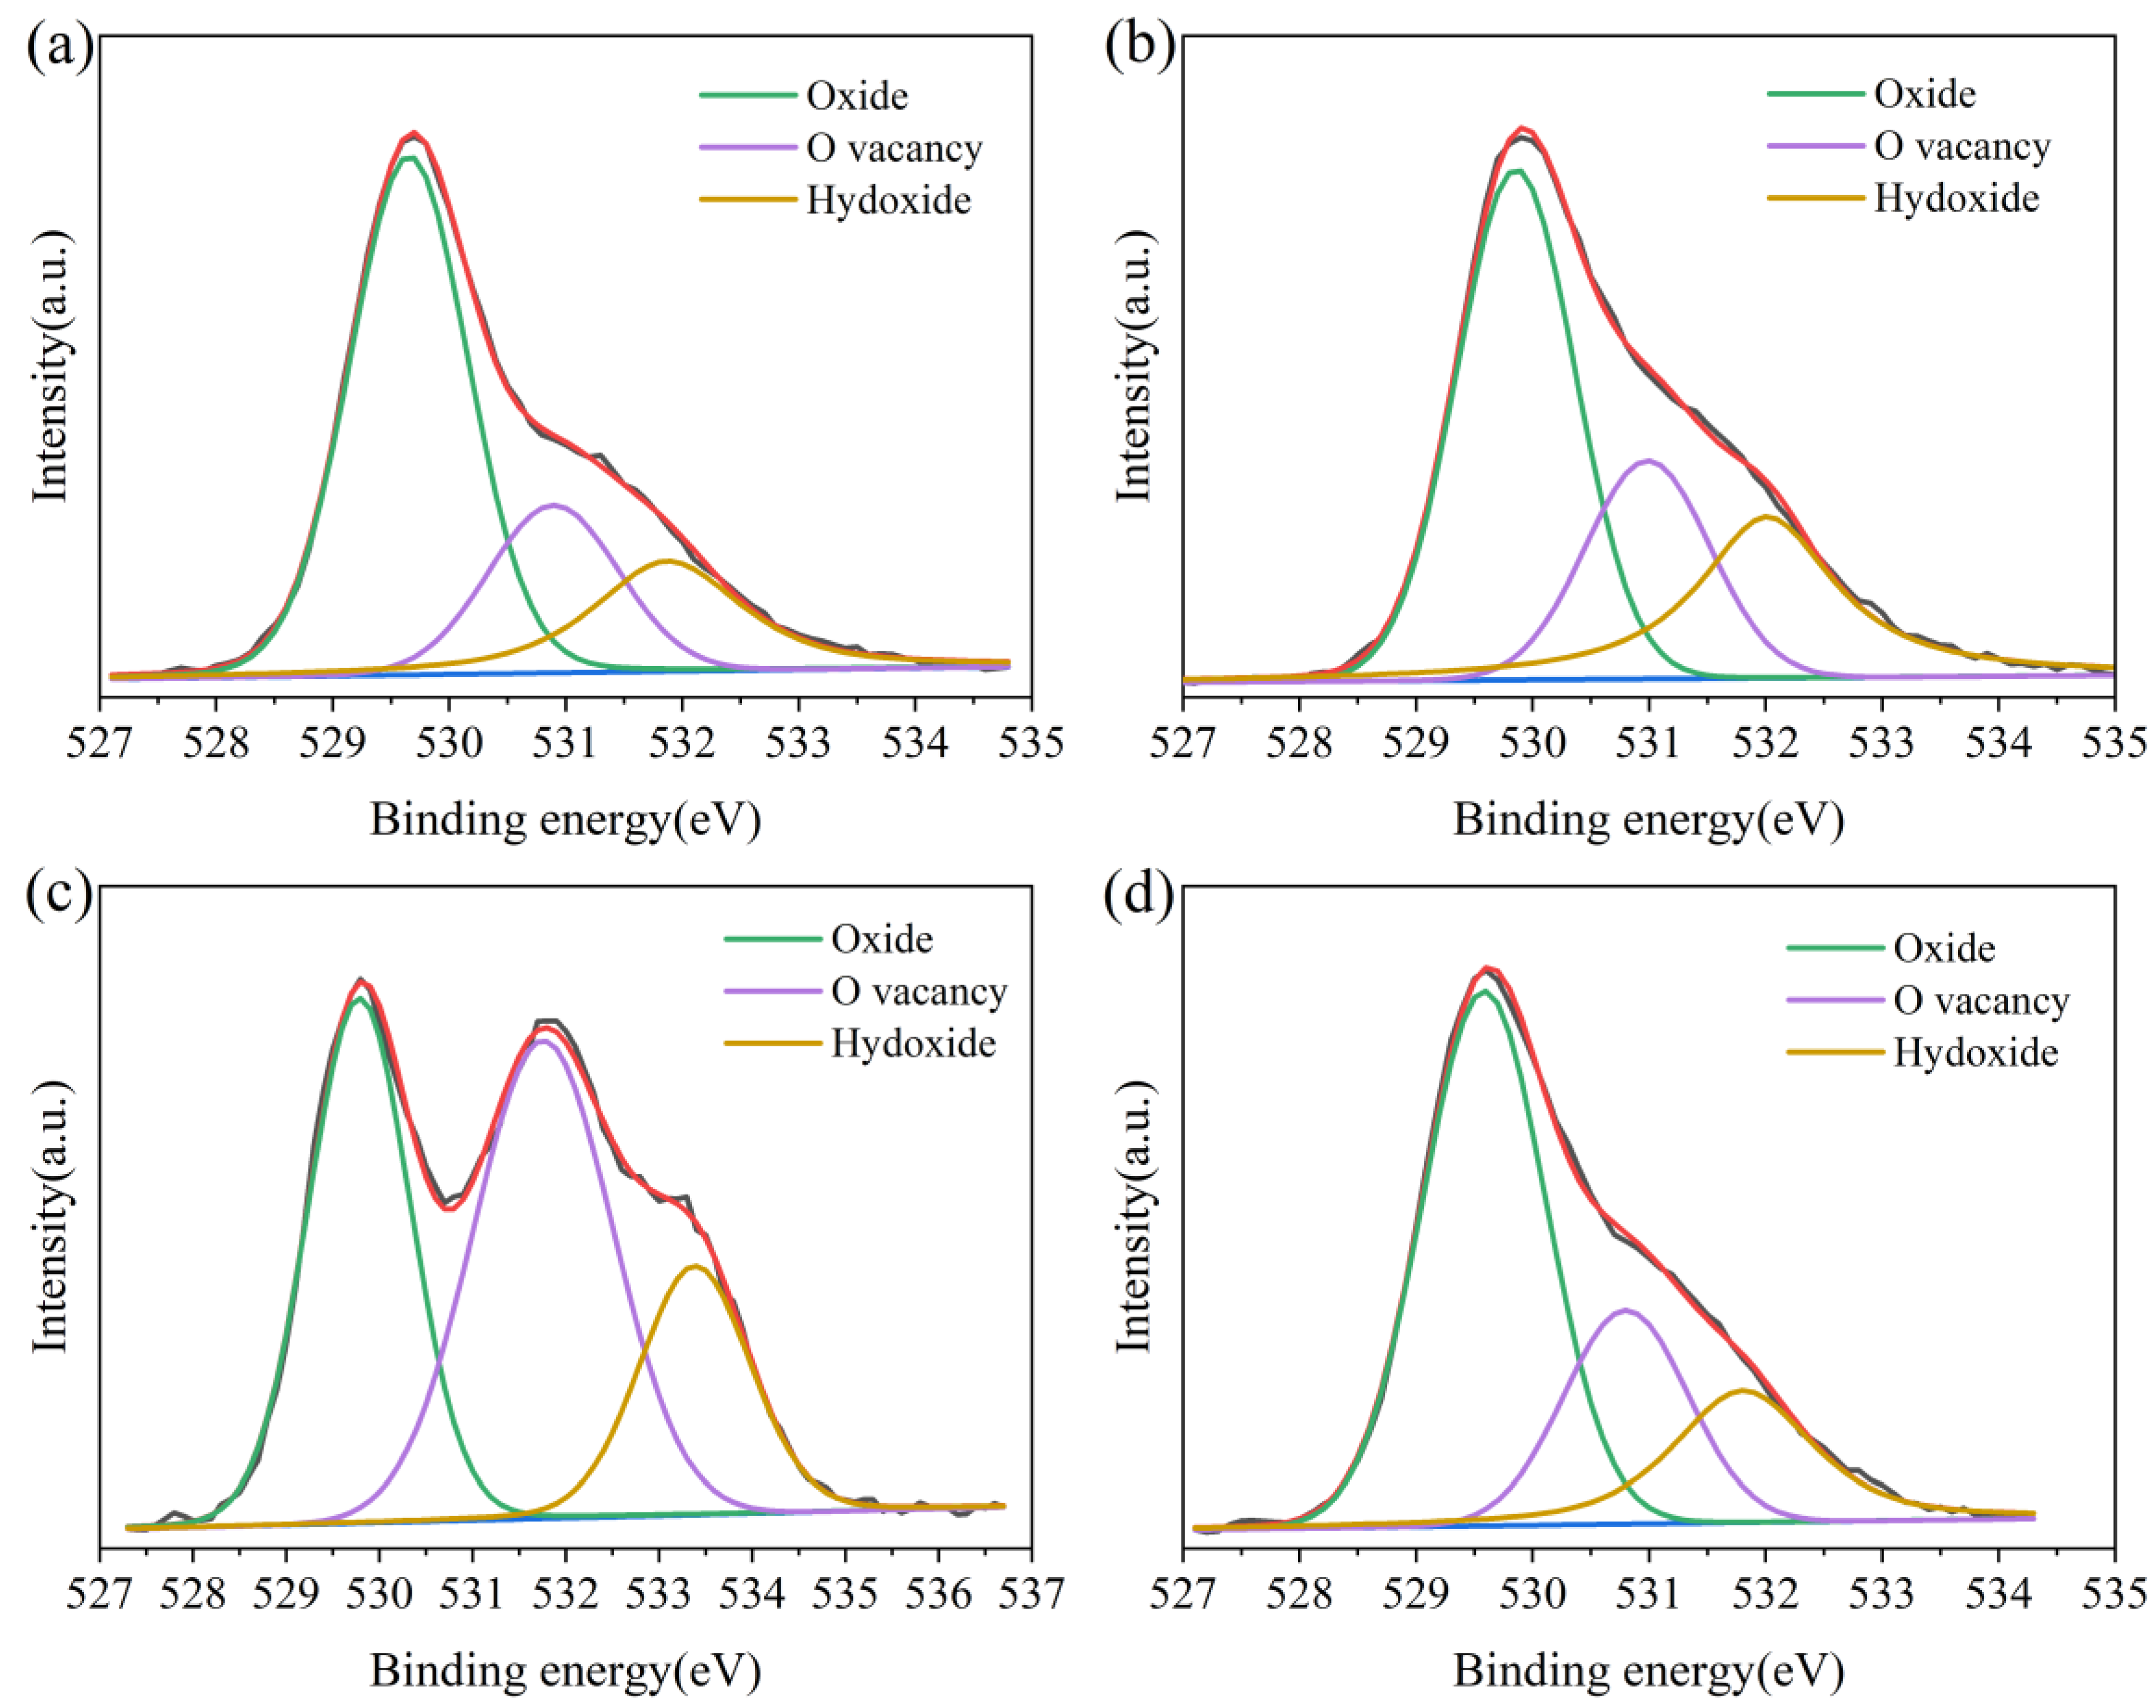
Figure 1. XRD patterns of the different as-prepared Ru−In2O3 samples.
Photochem 03 00022 g001
Figure 2. SEM images of the (a) 0% Ru−In2O3 and (b) 0.5% Ru−In2O3 samples.
Photochem 03 00022 g002
Figure 3. TEM (a) and HRTEM (b) images of the 0.5% Ru−In2O3 samples.
Photochem 03 00022 g003
Figure 4. (a) UV-Vis diffuse reflection spectra of the different as-prepared Ru−In2O3 samples. (b) Plot of the (Ahv)2 versus hv for the different as-prepared Ru−In2O3 samples.
Photochem 03 00022 g004
Figure 5. (a) Survey XPS spectrum and (bd) high-resolution XPS spectra of Ru 3d, In 3d regions, respectively, of the 0.5% Ru−In2O3 samples.
Photochem 03 00022 g005
Figure 6. XPS O 1s core-level spectra of different Ru−In2O3 samples: (a) 0% Ru−In2O3, (b) 0.1% Ru−In2O3, (c) 0.5% Ru−In2O3, (d) 1% Ru−In2O3.
Photochem 03 00022 g006
Figure 7. (a) Photocurrent responses, (b) electrochemical impedance spectra and (c) surface photovoltage responses of the different as-prepared Ru−In2O3 samples.
Photochem 03 00022 g007
Figure 8. (a) Photocatalytic performances for the degradation of Deca−BDE (a) and HBB (b) over the different Ru−In2O3 samples and (c,d) corresponding kinetic studies.
Photochem 03 00022 g008
Figure 9. Cyclic tests over the 0.5% Ru−In2O3 samples.
Photochem 03 00022 g009
Figure 10. XRD patterns (a) and FTIR spectra (b) of the 0.5% Ru−In2O3 samples before and after the cyclic tests.
Photochem 03 00022 g010
Table 1. Atom ratio of the OL, OV and OH for different Ru−In2O3 samples.
SampleAtom Ratio of OL (%)Atom Ratio of OV (%)Atom Ratio of OH (%)Atom Ratio of Ru (%)
0% Ru−In2O359.320.620.10
0.1% Ru−In2O350.422.627.00.1
0.5% Ru−In2O336.544.219.30.5
1% Ru−In2O356.522.221.31.0
Disclaimer/Publisher’s Note: The statements, opinions and data contained in all publications are solely those of the individual author(s) and contributor(s) and not of MDPI and/or the editor(s). MDPI and/or the editor(s) disclaim responsibility for any injury to people or property resulting from any ideas, methods, instructions or products referred to in the content.

