
Conformational Structure, Infrared Spectra and Light-Induced Transformations of Thymol Isolated in Noble Gas Cryomatrices


Abstract
:1. Introduction
2. Methods
2.1. Experimental Methods
2.2. Computational Methods
3. Results and Discussion
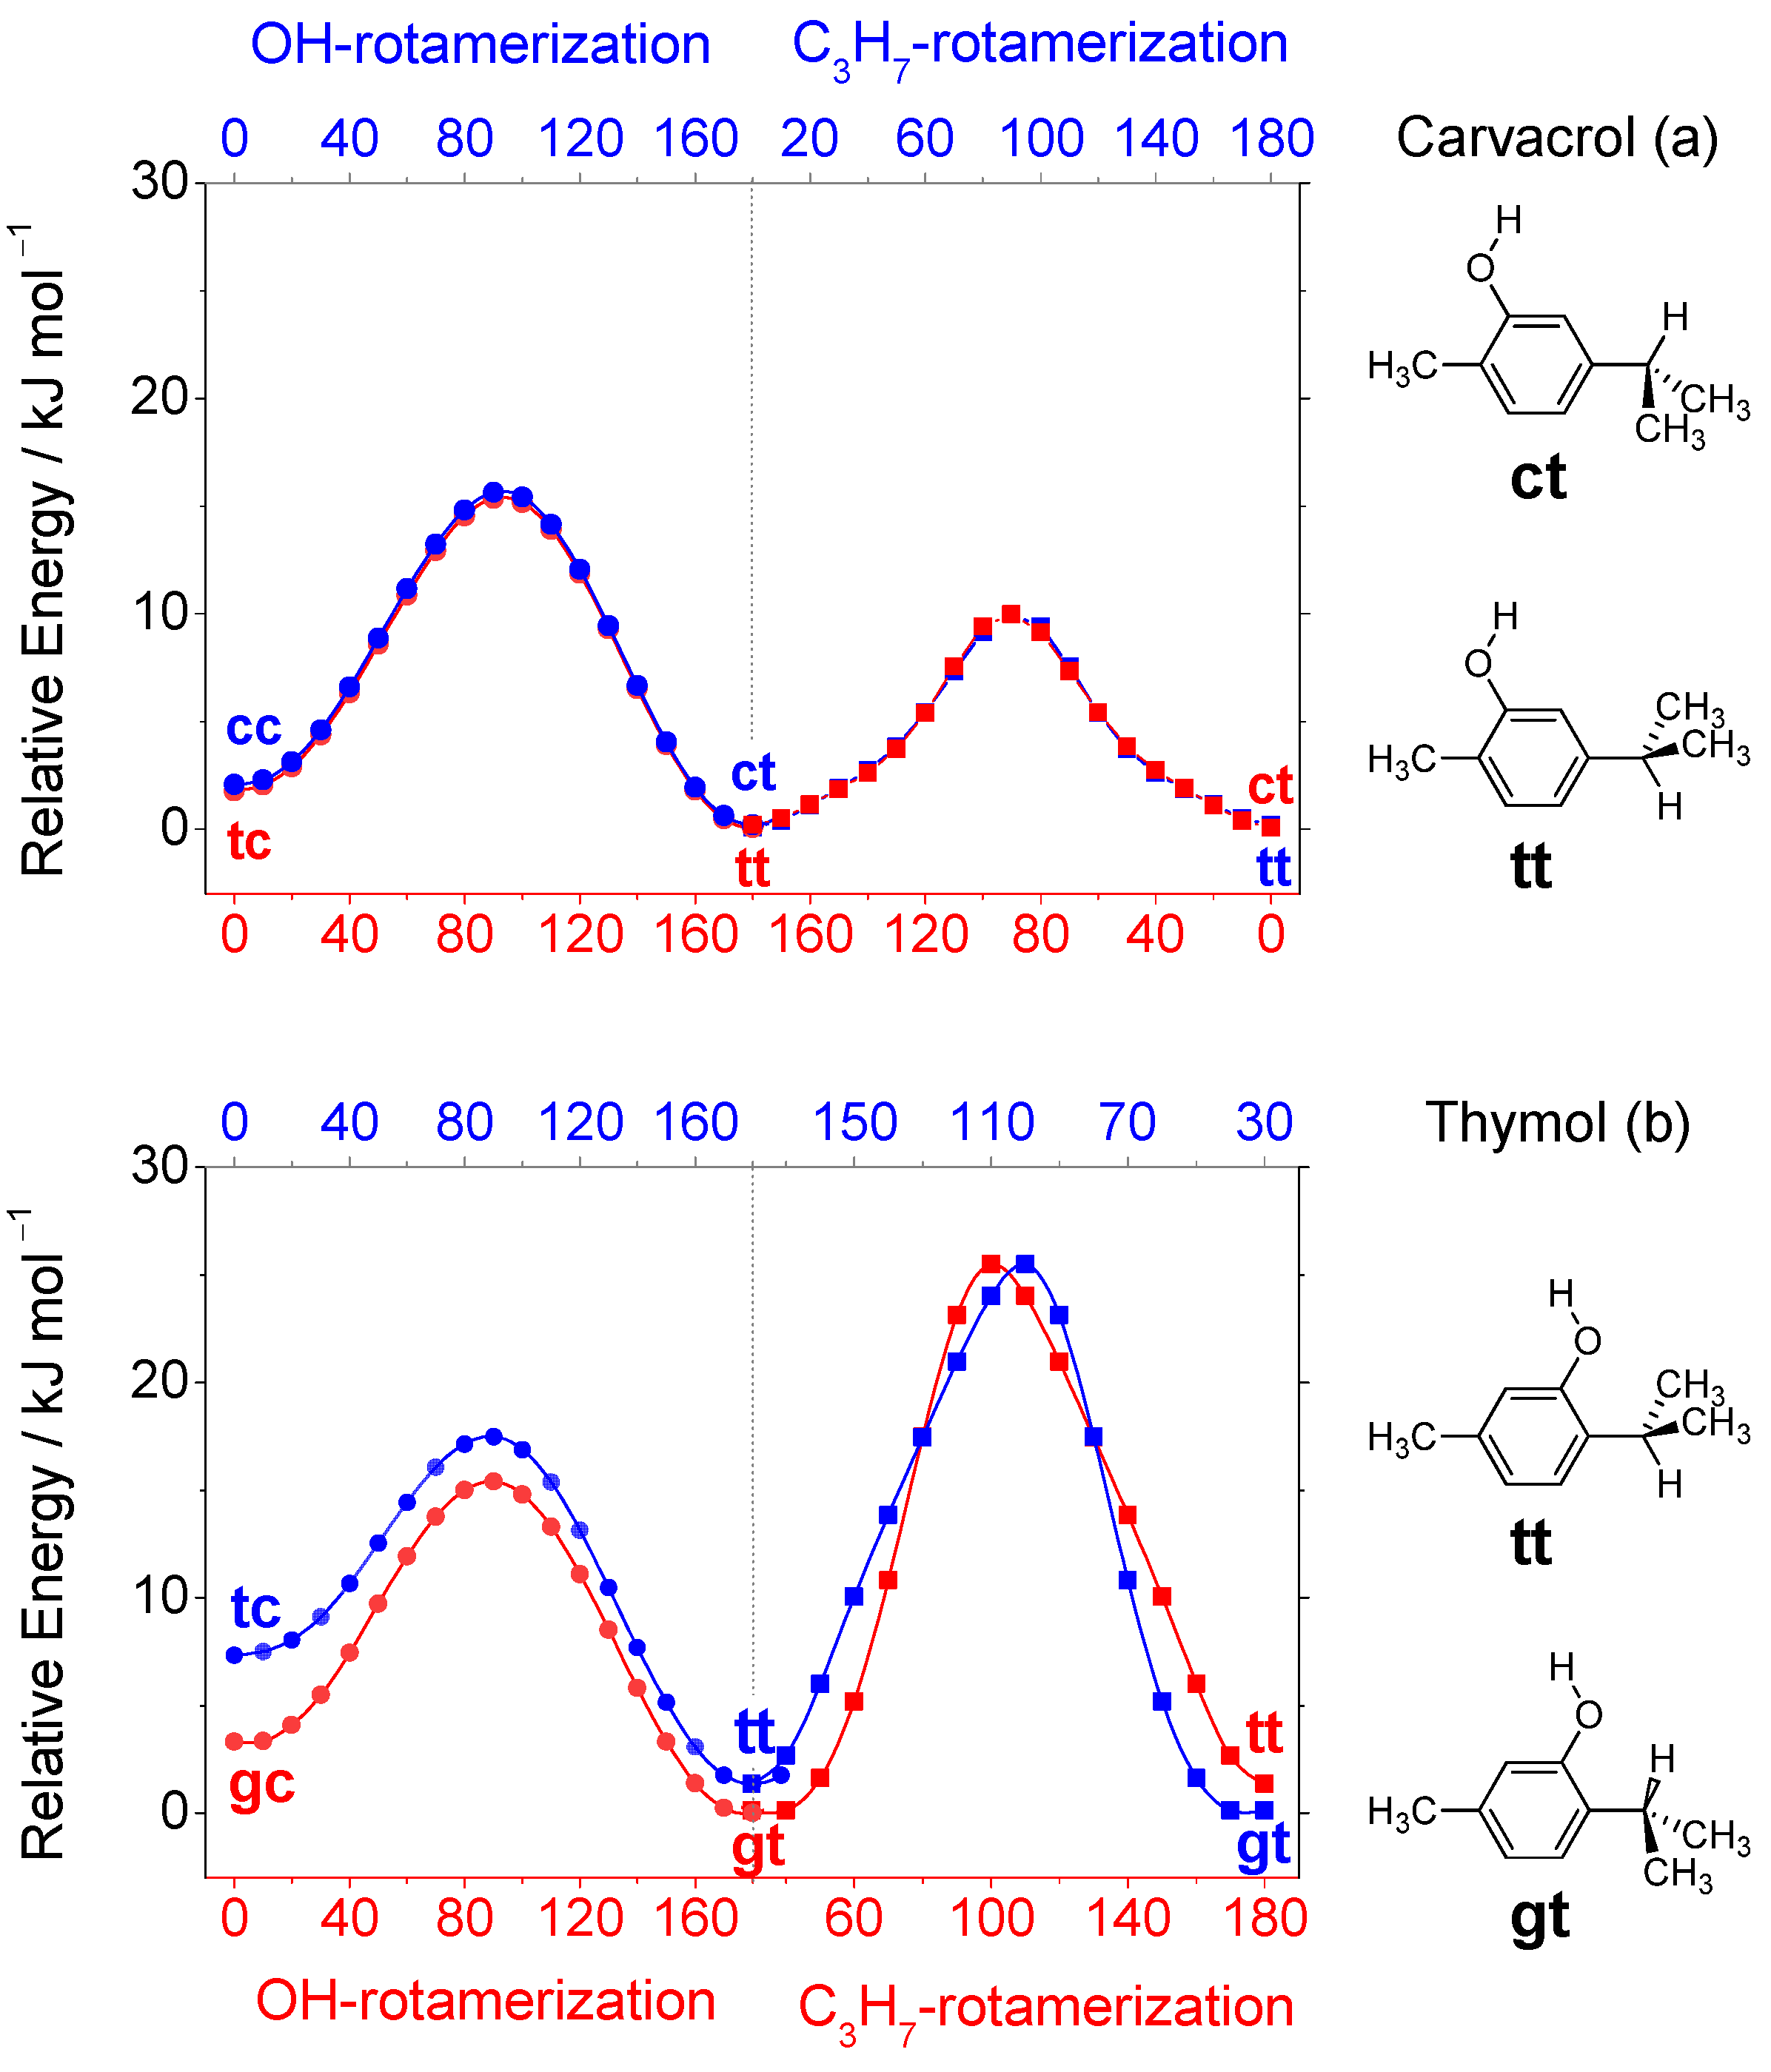
3.1. Conformers and Barriers to Internal Interconversion
3.2. Infrared Spectra of Matrix-Isolated Thymol, Annealing and IR Irradiations
3.3. UV-Induced Transformations
4. Concluding Discussion
Supplementary Materials
Author Contributions
Funding
Institutional Review Board Statement
Informed Consent Statement
Acknowledgments
Conflicts of Interest
References
- Nagoor Meeran, M.F.; Javed, H.; Al Taee, H.; Azimullah, S.; Ojha, S.K. Pharmacological properties and molecular mechanisms of thymol: Prospects for its therapeutic potential and pharmaceutical development. Front. Pharmacol. 2017, 8, 380. [Google Scholar] [CrossRef] [Green Version]
- Sahoo, C.R.; Paidesetty, S.K.; Padhy, R.N. The recent development of thymol derivative as a promising pharmacological scaffold. Drug Dev. Res. 2021, 82, 1079–1095. [Google Scholar] [CrossRef]
- Escobar, A.; Pérez, M.; Romanelli, G.; Blustein, G. Thymol bioactivity: A review focusing on practical applications. Arab. J. Chem. 2020, 13, 9243–9269. [Google Scholar] [CrossRef]
- Jamali, T.; Kavoosi, G.; Jamali, Y.; Mortezazadeh, S.; Ardestani, S.K. In-vitro, in-vivo, and in-silico assessment of radical scavenging and cytotoxic activities of Oliveria decumbens essential oil and its main components. Sci. Rep. 2021, 11, 14281. [Google Scholar] [CrossRef]
- Bautista-Hernández, I.; Aguilar, C.N.; Martínez-Ávila, G.C.G.; Torres-León, C.; Ilina, A.; Flores-Gallegos, A.C.; Kumar Verma, D.; Chávez-González, M.L. Mexican oregano (Lippia graveolens Kunth) as source of bioactive compounds: A review. Molecules 2021, 26, 5156. [Google Scholar] [CrossRef]
- Nieto, G. A review on applications and uses of thymus in the food industry. Plants 2020, 9, 961. [Google Scholar] [CrossRef]
- Pandey, S.K.; Upadhyay, S.; Tripathi, A.K. Insecticidal and repellent activities of thymol from the essential oil of Trachyspermum ammi (Linn) Sprague seeds against Anopheles stephensi. Parasitol. Res. 2009, 105, 507–512. [Google Scholar] [CrossRef]
- Scoralik, M.G.; Daemon, E.; de Oliveira Monteiro, C.M.; Maturano, R. Enhancing the acaricide effect of thymol on larvae of the cattle tick Rhipicephalus microplus (Acari: Ixodidae) by solubilization in ethanol. Parasitol. Res. 2012, 110, 645–648. [Google Scholar] [CrossRef] [PubMed]
- Thozet, A.; Perrin, M. Structure of 2-isopropyl-5-methylphenol (thymol). Acta Crystallogr. Sect. B 1980, 36, 1444–1447. [Google Scholar] [CrossRef]
- Schmitz, D.; Shubert, V.A.; Giuliano, B.M.; Schnell, M. The broadband microwave spectra of the monoterpenoids thymol and carvacrol: Conformational landscape and internal dynamics. J. Chem. Phys. 2014, 141, 034304. [Google Scholar] [CrossRef] [Green Version]
- Sin, K.-R.; Kim, C.-J.; Ko, S.-G.; Hwang, T.-M.; Han, Y.-N.; Pak, Y.-N. Inclusion of thymol into cucurbiturils: Density functional theory approach with dispersion correction and natural bond orbital analysis. J. Inclusion Phenom. Macrocycl. Chem. 2022, 102, 533–542. [Google Scholar] [CrossRef]
- Saraiva, A.G.Q.; Saraiva, G.D.; Albuquerque, R.L.; Nogueira, C.E.S.; Teixeira, A.M.R.; Lima, L.B.; Cruz, B.G.; de Sousa, F.F. Chemical analysis and vibrational spectroscopy study of essential oils from Lippia sidoides and of its major constituent. Vib. Spectrosc. 2020, 110, 103111. [Google Scholar] [CrossRef]
- Rajkumar, P.; Selvaraj, S.; Suganya, R.; Velmurugan, D.; Gunasekaran, S.; Kumaresan, S. Vibrational and electronic spectral analysis of thymol an isomer of carvacrol isolated from Trachyspermum ammi seed: A combined experimental and theoretical study. Chem. Data Collect. 2018, 15–16, 10–31. [Google Scholar] [CrossRef]
- Beć, K.B.; Grabska, J.; Kirchler, C.G.; Huck, C.W. NIR spectra simulation of thymol for better understanding of the spectra forming factors, phase and concentration effects and PLS regression features. J. Mol. Liq. 2018, 268, 895–902. [Google Scholar] [CrossRef]
- Lopes Jesus, A.J.; Fausto, R.; Reva, I. Conformational Space, IR-Induced, and UV-induced chemistry of carvacrol isolated in a low-temperature argon matrix. J. Phys. Chem. A 2021, 125, 8215–8229. [Google Scholar] [CrossRef] [PubMed]
- Becke, A.D. Density-functional exchange-energy approximation with correct asymptotic behavior. Phys. Rev. A 1988, 38, 3098–3100. [Google Scholar] [CrossRef]
- Lee, C.T.; Yang, W.T.; Parr, R.G. Development of the Colle-Salvetti correlation-energy formula into a functional of the electron-density. Phys. Rev. B 1988, 37, 785–789. [Google Scholar] [CrossRef] [PubMed] [Green Version]
- Vosko, S.H.; Wilk, L.; Nusair, M. Accurate spin-dependent electron liquid correlation energies for local spin density calculations: A critical analysis. Can. J. Phys. 1980, 58, 1200–1211. [Google Scholar] [CrossRef] [Green Version]
- Møller, C.; Plesset, M.S. Note on an approximation treatment for many-electron systems. Phys. Rev. 1934, 46, 618–622. [Google Scholar] [CrossRef] [Green Version]
- Pople, J.A.; Head-Gordon, M.; Raghavachari, K. Quadratic configuration interaction. A general technique for determining electron correlation energies. J. Chem. Phys. 1987, 87, 5968–5975. [Google Scholar] [CrossRef]
- Reva, I.; Lopes Jesus, A.J.; Nunes, C.M.; Roque, J.P.L.; Fausto, R. UV-Induced Photochemistry of 1,3-Benzoxazole, 2-Isocyanophenol, and 2-Cyanophenol Isolated in Low-Temperature Ar Matrixes. J. Org. Chem. 2021, 86, 6126–6137. [Google Scholar] [CrossRef] [PubMed]
- Zhurko, G.A. Chemcraft—Graphical Program for Visualization of Quantum Chemistry Computations, Version 1.8. 2020. Available online: http://www.chemcraftprog.com (accessed on 18 May 2022).
- Frisch, M.J.; Trucks, G.W.; Schlegel, H.B.; Scuseria, G.E.; Robb, M.A.; Cheeseman, J.R.; Scalmani, G.; Barone, V.; Mennucci, B.; Petersson, G.A.; et al. GAUSSIAN 09, Revision D.01; Gaussian, Inc.: Wallingford, CT, USA, 2013. [Google Scholar]
- Teixeira, F.; Cordeiro, M.N.D.S. Improving vibrational mode interpretation using bayesian regression. J. Chem. Theory Comput. 2019, 15, 456–470. [Google Scholar] [CrossRef] [PubMed]
- Lesarri, A.; Shipman, S.T.; Neill, J.L.; Brown, G.G.; Suenram, R.D.; Kang, L.; Caminati, W.; Pate, B.H. Interplay of phenol and isopropyl isomerism in propofol from broadband chirped-pulse microwave spectroscopy. J. Am. Chem. Soc. 2010, 132, 13417–13424. [Google Scholar] [CrossRef]
- Zhao, Y.; Jin, Y.; Hao, J.; Yang, Y.; Wang, L.; Li, C.; Jia, S. Rotamers of p-isopropylphenol studied by hole-burning resonantly enhanced multiphoton ionization and mass analyzed threshold ionization spectroscopy. Spectrochim. Acta Part A 2019, 207, 328–336. [Google Scholar] [CrossRef] [PubMed]
- Richardson, P.R.; Chapman, M.A.; Wilson, D.C.; Bates, S.P.; Jones, A.C. The nature of conformational preference in a number of p-alkyl phenols and p-alkyl benzenes. Phys. Chem. Chem. Phys. 2002, 4, 4910–4915. [Google Scholar] [CrossRef]
- Schaefer, T.; Addison, B.M.; Sebastian, R.; Wildman, T.A. Orientations of the hydroxyl and isopropyl groups in the cis and trans conformers of 2-isopropylphenol and 2-isopropyl-6-methylphenol. Can. J. Chem. 1981, 59, 1656–1659. [Google Scholar] [CrossRef]
- Rozenberg, M.; Fausto, R.; Reva, I. Variable temperature FTIR spectra of polycrystalline purine nucleobases and estimating strengths of individual hydrogen bonds. Spectrochim. Acta Part A 2021, 251, 119323. [Google Scholar] [CrossRef] [PubMed]
- Lopes Jesus, A.J.; Rosado, M.T.S.; Leitão, M.L.P.; Redinha, J.S. Molecular structure of butanediol isomers in gas and liquid states: Combination of DFT calculations and infrared spectroscopy studies. J. Phys. Chem. A 2003, 107, 3891–3897. [Google Scholar] [CrossRef] [Green Version]
- Lopes Jesus, A.J.; Rosado, M.T.S.; Reva, I.; Fausto, R.; Eusébio, M.E.S.; Redinha, J.S. Structure of isolated 1,4-Butanediol: Combination of MP2 calculations, NBO analysis, and matrix-isolation infrared spectroscopy. J. Phys. Chem. A 2008, 112, 4669–4678. [Google Scholar] [CrossRef] [Green Version]
- Lopes Jesus, A.J.; Rosado, M.T.S.; Reva, I.; Fausto, R.; Eusébio, M.E.; Redinha, J.S. Conformational study of monomeric 2,3-Butanediols by matrix-isolation infrared spectroscopy and DFT calculations. J. Phys. Chem. A 2006, 110, 4169–4179. [Google Scholar] [CrossRef] [PubMed] [Green Version]
- Rosado, M.T.S.; Lopes Jesus, A.J.; Reva, I.D.; Fausto, R.; Redinha, J.S. Conformational cooling dynamics in matrix-isolated 1,3-Butanediol. J. Phys. Chem. A 2009, 113, 7499–7507. [Google Scholar] [CrossRef] [Green Version]
- Lopes Jesus, A.J.; Nunes, C.M.; Reva, I.; Pinto, S.M.V.; Fausto, R. Effects of entangled IR radiation and tunneling on the conformational interconversion of 2-Cyanophenol. J. Phys. Chem. A 2019, 123, 4396–4405. [Google Scholar] [CrossRef]
- Lopes Jesus, A.J.; Reva, I.; Nunes, C.M.; Roque, J.P.L.; Pinto, S.M.V.; Fausto, R. Kinetically unstable 2-isocyanophenol isolated in cryogenic matrices: Vibrational excitation, conformational changes and spontaneous tunneling. Chem. Phys. Lett. 2020, 742, 137069. [Google Scholar] [CrossRef]
- Akai, N.; Kudoh, S.; Takayanagi, M.; Nakata, M. Cis-Trans isomerization equilibrium in hydroquinone in low-temperature argon and xenon matrices studied by FTIR spectroscopy. Chem. Phys. Lett. 2002, 356, 133–139. [Google Scholar] [CrossRef]
- Akai, N.; Kudoh, S.; Nakata, M. Photoisomerization and tunneling isomerization of tetrachlorohydroquinone in a low-temperature argon matrix. J. Phys. Chem. A 2003, 107, 3655–3659. [Google Scholar] [CrossRef]
- Borden, W.T. Reactions that involve tunneling by carbon and the role that calculations have played in their study. WIREs Comput. Mol. Sci. 2016, 6, 20–46. [Google Scholar] [CrossRef]
- Nunes, C.M.; Reva, I.; Fausto, R. Direct observation of tunnelling reactions by matrix isolation spectroscopy. In Tunnelling in Molecules: Nuclear Quantum Effects from Bio to Physical Chemistry; Kästner, J., Kozuch, S., Eds.; The Royal Society of Chemistry: Cambridge, UK, 2021; pp. 1–60. [Google Scholar] [CrossRef]
- Pettersson, M.; Lundell, J.; Khriachtchev, L.; Räsänen, M. IR spectrum of the other rotamer of formic acid, cis-HCOOH. J. Am. Chem. Soc. 1997, 119, 11715–11716. [Google Scholar] [CrossRef]
- Maçôas, E.M.S.; Khriachtchev, L.; Pettersson, M.; Fausto, R.; Räsänen, M. Rotational isomerism in acetic acid: The first experimental observation of the high-energy conformer. J. Am. Chem. Soc. 2003, 125, 16188–16189. [Google Scholar] [CrossRef] [Green Version]
- Lapinski, L.; Reva, I.; Rostkowska, H.; Halasa, A.; Fausto, R.; Nowak, M.J. Conformational Transformation in Squaric Acid Induced by Near-IR Laser Light. J. Phys. Chem. A 2013, 117, 5251–5259. [Google Scholar] [CrossRef]
- Kuş, N.; Fausto, R. Effects of the matrix and intramolecular interactions on the stability of the higher-energy conformers of 2-fluorobenzoic acid. J. Chem. Phys. 2017, 146, 124305. [Google Scholar] [CrossRef]
- Gerbig, D.; Schreiner, P.R. Hydrogen-Tunneling in Biologically Relevant Small Molecules: The Rotamerizations of α-Ketocarboxylic Acids. J. Phys. Chem. B 2015, 119, 693–703. [Google Scholar] [CrossRef]
- Bazsó, G.; Magyarfalvi, G.; Tarczay, G. Tunneling lifetime of the ttc/VIp conformer of glycine in low-temperature matrices. J. Phys. Chem. A 2012, 116, 10539–10547. [Google Scholar] [CrossRef] [PubMed]
- Lopes Jesus, A.J.; Reva, I.; Araujo-Andrade, C.; Fausto, R. Conformational changes in matrix-isolated 6-methoxyindole: Effects of the thermal and infrared light excitations. J. Chem. Phys. 2016, 144, 124306. [Google Scholar] [CrossRef] [Green Version]
- Marzec, K.M.; Reva, I.; Fausto, R.; Proniewicz, L.M. Comparative matrix isolation infrared spectroscopy study of 1,3- and 1,4-diene monoterpenes (α-Phellandrene and γ-Terpinene). J. Phys. Chem. A 2011, 115, 4342–4353. [Google Scholar] [CrossRef] [PubMed]
- Giuliano, B.M.; Reva, I.; Lapinski, L.; Fausto, R. Infrared spectra and ultraviolet-tunable laser induced photochemistry of matrix-isolated phenol and phenol-d5. J. Chem. Phys. 2012, 136, 024505. [Google Scholar] [CrossRef] [Green Version]
- Giuliano, B.M.; Melandri, S.; Reva, I.; Fausto, R. Conformational space and photochemistry of tyramine isolated in argon and xenon cryomatrixes. J. Phys. Chem. A 2013, 117, 10248–10259. [Google Scholar] [CrossRef]
- Barnes, A.J. Matrix isolation vibrational spectroscopy as a tool for studying conformational isomerism. J. Mol. Struct. 1984, 113, 161–174. [Google Scholar] [CrossRef]
- Breda, S.; Lapinski, L.; Reva, I.; Fausto, R. 4,6-Dimethyl-α-pyrone: A matrix isolation study of the photochemical generation of conjugated ketene, Dewar valence isomer and 1,3-dimethyl-cyclobutadiene. J. Photochem. Photobiol. A 2004, 162, 139–151. [Google Scholar] [CrossRef] [Green Version]
- Breda, S.; Reva, I.; Lapinski, L.; Fausto, R. Matrix isolation FTIR and theoretical study of α-pyrone photochemistry. Phys. Chem. Chem. Phys. 2004, 6, 929–937. [Google Scholar] [CrossRef] [Green Version]
- Tidwell, T.T. Spectroscopy and physical properties of ketenes. In Ketenes II; John Wiley and Sons: Hoboken, NJ, USA, 2006; pp. 27–53. [Google Scholar]
- Kuş, N.; Sagdinc, S.; Fausto, R. Infrared spectrum and UV-induced photochemistry of matrix-isolated 5-Hydroxyquinoline. J. Phys. Chem. A 2015, 119, 6296–6308. [Google Scholar] [CrossRef] [PubMed]
- Krupa, J.; Olbert-Majkut, A.; Reva, I.; Fausto, R.; Wierzejewska, M. Ultraviolet-tunable laser induced phototransformations of matrix isolated isoeugenol and eugenol. J. Phys. Chem. B 2012, 116, 11148–11158. [Google Scholar] [CrossRef]
- Samanta, A.K.; Pandey, P.; Bandyopadhyay, B.; Chakraborty, T. Keto–enol tautomers of 1,2-cyclohexanedione in solid, liquid, vapour and a cold inert gas matrix: Infrared spectroscopy and quantum chemistry calculation. J. Mol. Struct. 2010, 963, 234–239. [Google Scholar] [CrossRef]
- Miyazaki, J.; Toh, S.Y.; Moore, B.; Djuricanin, P.; Momose, T. UV photochemistry of 1,3-cyclohexadiene isolated in solid parahydrogen. J. Mol. Struct. 2021, 1224, 128986. [Google Scholar] [CrossRef]
- Chapman, O.L.; McIntosh, C.L.; Pacansky, J. Photochemistry of a-Pyrone in Argon at 8 °K. J. Am. Chem. Soc. 1973, 95, 244–246. [Google Scholar] [CrossRef]
- Pong, R.G.S.; Shirk, J.S. Photochemistry of α-Pyrone in solid argon. J. Am. Chem. Soc. 1973, 95, 248–249. [Google Scholar] [CrossRef]
- Breda, S.; Lapinski, L.; Fausto, R.; Nowak, M.J. Photoisomerization reactions of 4-methoxy- and 4-hydroxy-6-methyl-α-pyrones: An experimental matrix isolation and theoretical density functional theory study. Phys. Chem. Chem. Phys. 2003, 5, 4527–4532. [Google Scholar] [CrossRef] [Green Version]


| Level of Theory | Conformer | |||
|---|---|---|---|---|
| gt | tt | gc | tc | |
| B3LYP/6-311++G(d,p) | ||||
| ΔEel | 0.00 | 1.37 | 3.24 | 7.34 |
| ΔE0 | 0.00 | 1.11 | 3.54 | 6.07 |
| ΔG (298 K) | 0.00 | 1.27 | 4.96 | 5.18 |
| Pop. (%) | 66.9 | 20.0 | 9.0 | 4.1 |
| (75.9) | (24.1) | |||
| MP2/aug-cc-pVDZ | ||||
| ΔEel | 0.00 | 2.51 | 2.54 | 7.94 |
| ΔE0 | 0.00 | 1.94 | 2.43 | 7.01 |
| ΔG (298 K) | 0.00 | 1.52 | 2.12 | 5.43 |
| Pop. (%) | 57.0 | 15.5 | 24.3 | 3.2 |
| (81.3) | (18.7) | |||
| QCISD/aug-cc-pVDZ b | ||||
| ΔEel | 0.00 | 2.29 | 2.56 | 7.30 |
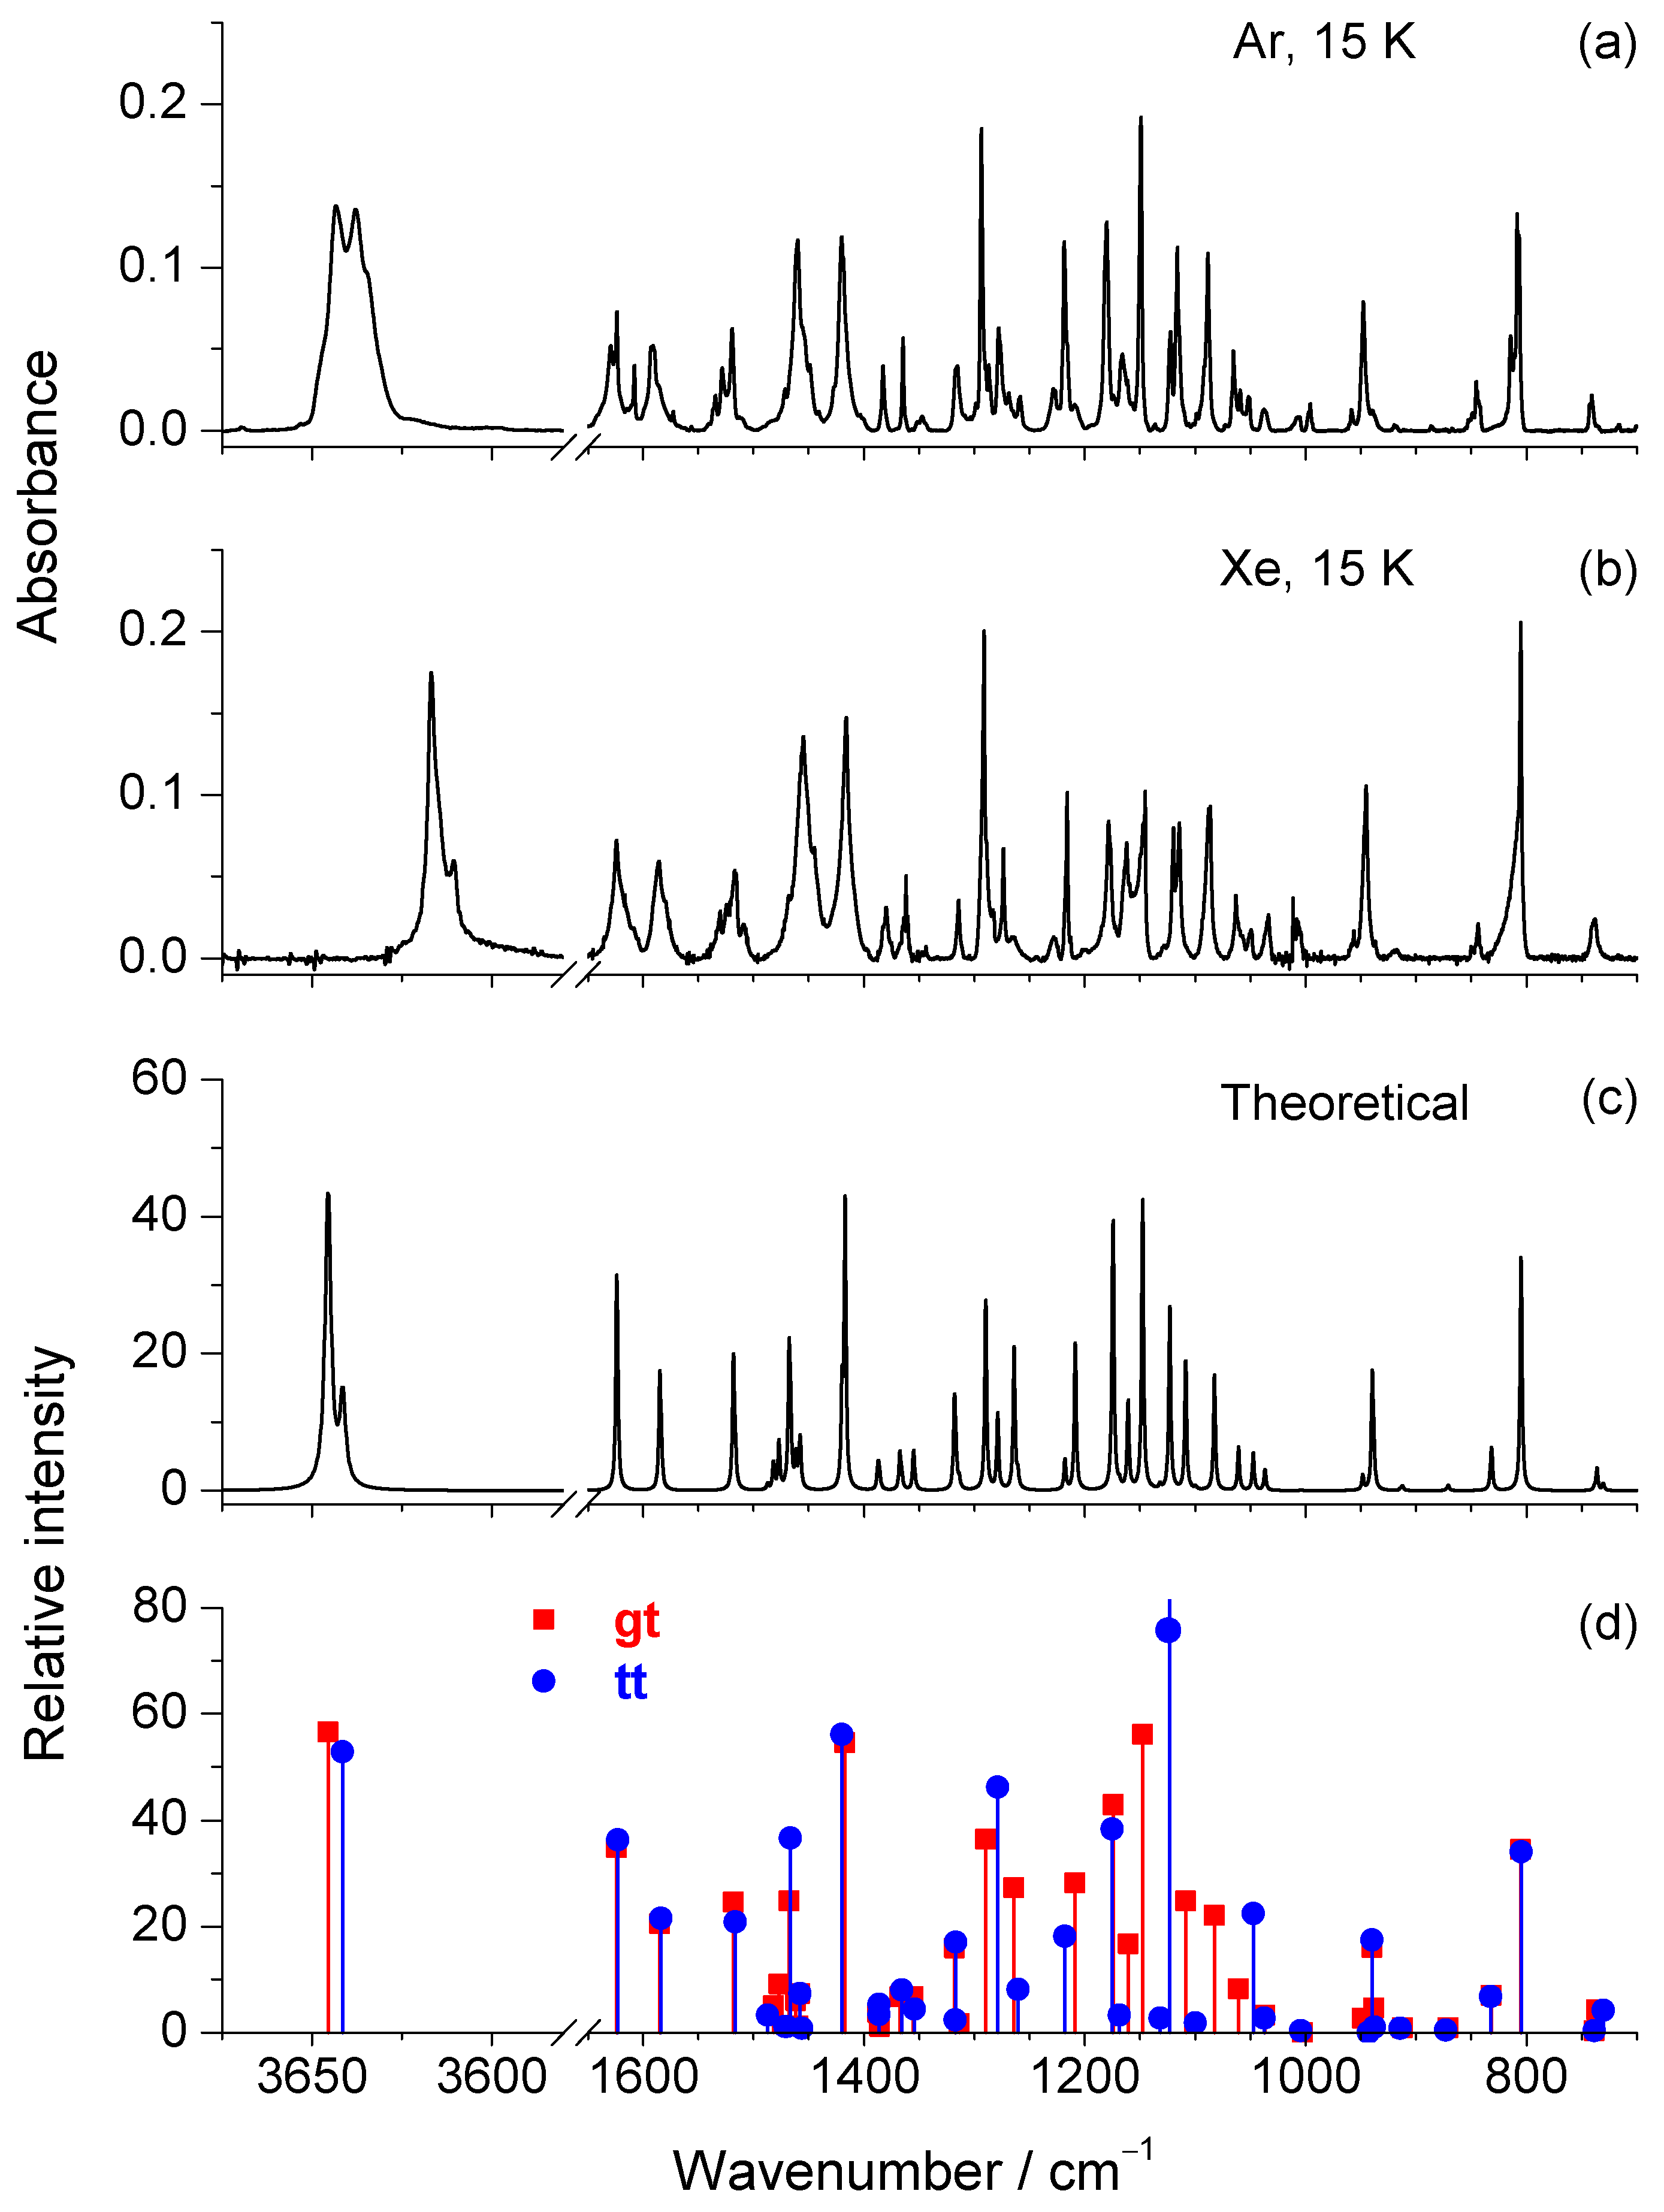
| Ar, 15 K a | Xe, 15 K a | Calc. gt b | Calc. tt b | Assignment c | ||||
|---|---|---|---|---|---|---|---|---|
| ῦ | Int. | ῦ | Int. | ῦ | Ath | ῦ | Ath | |
| 3643/3638/ 3635 (sh) | vs | 3617/3611 | vs | 3645.5 | 56.6 | 3641.5 | 52.8 | ν(OH) |
| 1629 | m | 1624 | m | 1623.9 | 34.9 | 1622.9 | 36.3 | ν(CC)ring |
| 1591 | m | 1586 | m | 1584.8 | 20.6 | 1583.5 | 21.5 | ν(CC)ring |
| 1519 (split) | m | 1517 (split) | m | 1518.2 | 24.7 | 1516.5 | 20.5 | ν(CC)ring; δ(CH)ring |
| 1481.9 | 5.1 | 1487.3 | 3.3 | δ(CH3)iso,as’ (+) | ||||
| 1476.9 | 9.2 | 1471.4 | 1.1 | δ(CH3)iso,as’’ (+) | ||||
| 1460 (split) | s | 1455 (split) | s | 1467.7 | 24.8 | 1466.3 | 36.7 | δ(CH3)as’ |
| 1461.7 | 6.0 | 1456.6 | 0.8 | δ(CH3)iso,as’’ (−) | ||||
| 1459.3 | 1.3 | 1469.3 | 1.4 | δ(CH3)iso,as’ (−) | ||||
| 1457.6 | 7.3 | 1458.0 | 7.3 | δ(CH3)as’’ | ||||
| 1420 | s | 1416 | s | 1417.0 | 54.5 | 1420.0 | 56.6 | δ(CH)ring; ν(CC)ring; ν(CO) |
| 1383 | w | 1380 | w | 1387.4 | 3.8 | 1386.3 | 3.4 | δ(CH3)iso,s (+) |
| 1385.5 | 1.1 | 1386.5 | 5.3 | δ(CH3)s | ||||
| 1365 | w | 1362 | w | 1367.4 | 6.8 | 1365.8 | 8.0 | δ(CH3)iso,s (−) |
| 1347 | vw | 1344 | vw | 1355.1 | 6.8 | 1355.1 | 4.6 | δ(C7H) |
| 1315 | w | 1314 | w | 1318.0 | 16.0 | 1316.6 | 17.1 | ν(CC)ring; δ(OH) |
| 1313.7 | 1.7 | 1317.6 | 2.3 | γ(C7H) | ||||
| 1294/1287 | vs | 1291/1284 | vs | 1289.8 | 36.5 | – | – | ν(CC)ring; δ(CH)ring |
| 1278 | m | 1274 | m | – | – | 1278.9 | 46.2 | ν(CC)ring; δ(CH)ring |
| 1269/1259 | vw | 1265 | vw | 1264.0 | 27.4 | 1260.5 | 8.1 | ν(CO) + ν(C5C10); ν(CC)ring |
| 1228 | vw | 1228 | vw | – | – | 1218.4 | 18.2 | ν(C2C7) |
| 1219 | s | 1216 | s | 1208.7 | 28.2 | – | – | ν(C2C7) |
| 1180 | s | 1179 | m | 1174.4 | 42.8 | 1175.0 | 38.3 | δ(OH); δ(C–H)ring |
| – | – | 1168.7 | 3.2 | ν(CO) − ν(C5C10); δ(CH)ring | ||||
| 1166 | w | 1162 | m | 1160.8 | 16.7 | – | – | ν(CO) − ν(C5C10); δ(CH)ring |
| 1149 | vs | 1147/1145 | s | 1147.7 | 56.1 | – | – | δ(OH); δ(CH)ring; ν(CC)ring |
| 1123 | m | 1120 | m | – | – | 1123.1 | 111.8 | δ(ring); δ(OH); ν(CO) |
| 1116 | m | 1115 | m | 1108.7 | 24.8 | – | – | ν(C7C8) − ν(C7C9) |
| 1089 | m | 1087 | m | 1082.6 | 22.1 | – | – | δ(ring) |
| 1065/1059 | w | 1063 | w | 1060.7 | 8.3 | – | – | ρ(CH3)iso (+) |
| 1051 | vw | 1049 | vw | – | – | 1047.4 | 22.5 | ρ(CH3)iso (+) |
| 1037 | vw | 1034 | vw | 1036.7 | 3.2 | 1037.2 | 2.7 | ρ(CH3)’ |
| 1007/996 | vw | 1008 | vw | – | – | – | – | – |
| 959 | vw | 956 | vw | 948.3 | 2.7 | – | – | ρ(CH3)iso (−) |
| 948/940 | m | 945/937 | m | 939.6 | 16.0 | 939.7 | 17.5 | ν(CO) − ν(C5C10); δ(ring) |
| 918 | vw | 918 | vw | 912.4 | 0.9 | 914.2 | 0.8 | ρ(CH3)iso (−); γ(C7H) |
| 886 | vw | n.o. | 870.8 | 1.0 | 872.8 | 0.5 | ν(C7C8) + ν(C7C9) | |
| 849/846 | vw | 850/844 | vw | 831.6 | 7.0 | 832.4 | 6.8 | γ(C6H) |
| 814/809/807 | s | 805 | vs | 805.0 | 34.5 | 805.1 | 33.8 | γ(C3H) + γ(C4H) |
| 741 | vw | 738 | vw | 736.3 | 4.3 | 730.5 | 4.1 | δ(ring) |
| 700 | vw | n.o. | 681.3 | 1.3 | 684.0 | 4.9 | ν(C2C7) − ν(C5C10); δ(ring) | |
| 594 | w | 593 | w | 594.0 | 7.8 | 594.6 | 8.5 | γ(C5) |
| 577 | w | 577 | w | 571.5 | 12.9 | 576.9 | 6.4 | δ(ring) |
Publisher’s Note: MDPI stays neutral with regard to jurisdictional claims in published maps and institutional affiliations. |
© 2022 by the authors. Licensee MDPI, Basel, Switzerland. This article is an open access article distributed under the terms and conditions of the Creative Commons Attribution (CC BY) license (https://creativecommons.org/licenses/by/4.0/).
Share and Cite
Lopes Jesus, A.J.; Nunes, C.M.; Reva, I. Conformational Structure, Infrared Spectra and Light-Induced Transformations of Thymol Isolated in Noble Gas Cryomatrices. Photochem 2022, 2, 405-422. https://doi.org/10.3390/photochem2020028
Lopes Jesus AJ, Nunes CM, Reva I. Conformational Structure, Infrared Spectra and Light-Induced Transformations of Thymol Isolated in Noble Gas Cryomatrices. Photochem. 2022; 2(2):405-422. https://doi.org/10.3390/photochem2020028
Chicago/Turabian StyleLopes Jesus, Antόnio Jorge, Cláudio M. Nunes, and Igor Reva. 2022. "Conformational Structure, Infrared Spectra and Light-Induced Transformations of Thymol Isolated in Noble Gas Cryomatrices" Photochem 2, no. 2: 405-422. https://doi.org/10.3390/photochem2020028