Article

Habitat Mapping and Spatiotemporal Overlap of the Amazon River Dolphin, Fishers, and Tourism in the Central Region of the Brazilian Amazon

1
Department of Geosciences, University of Arkansas, Fayetteville, AR 72701, USA
2
Department of Geography, University of Florida, Gainesville, FL 32611, USA
*
Author to whom correspondence should be addressed.
Conservation 2023, 3(4), 523-542; https://doi.org/10.3390/conservation3040034
Submission received: 14 August 2023 / Revised: 11 November 2023 / Accepted: 21 November 2023 / Published: 29 November 2023

Abstract

:
Over the past several decades, concern has grown over the rising mortality of the Amazon river dolphin (‘boto’) from increased human–dolphin interactions. Among these interactions are tourist attractions involving up-close feeding encounters with the botos, confrontations with fishers, and an illegal fishing practice that uses dolphin flesh as fish bait. Drawing on original data sourced from in-depth semi-structured interviews and household surveys, existing studies on boto habitat preferences and seasonal movement, and remotely-sensed data, this paper discusses the spatial and temporal overlap between humans and dolphins in a region outside of Manaus, Amazonas in the central Brazilian Amazon. Results suggest that there is considerable spatial overlap between boto habitat and spaces used for fishing and tourism activities; additionally, overall potential for conflict is greatest during the high-water season.

1. Introduction

The Amazon river dolphin (Inia geoffrensis), known in Brazil as the boto, boto vermelho (red dolphin), or boto cor-de-rosa (pink dolphin), is a freshwater dolphin species endemic to the Orinoco and Amazon river basins. Historically, human contact with the boto was minimal, but interactions between humans and the boto have increased over time as human populations have expanded [1]. Botos now face numerous anthropogenic threats, including habitat degradation from deforestation, dam construction, pollution, and river traffic, as well as commercial fishing and direct killing [2,3,4]. Consequently, growing concern over rising mortality of the boto has led to urgent calls to limit human–dolphin interactions in an effort to mitigate harms and ensure their survival.
What is problematic for conservation efforts is that relatively little is known about the boto’s distribution and abundance, despite the fact that they are classified as a vulnerable group [5,6,7]. Investigating wildlife movement, spatial patterns, and abundance of elusive species such as the boto can be a challenge, particularly if they persist in low-density populations and their habitats are difficult to access [8,9]. Population surveys contain uncertainty given the limitations in access to and visibility of these animals, expensive financial costs of such studies, and methodological challenges in basing freshwater survey methods on marine cetacean studies [7,8,9,10,11]. For regions like the Amazon river basin, these challenges are exacerbated by the massive network of rivers, tributaries, and flooded forests that the Amazon river dolphins inhabit.
Understanding species habitat niche and suitability is crucial to the conservation and protection of this species, but logistical challenges associated with mapping and studying these species can hinder efforts [12,13,14]. In the absence of in situ data, this paper uses remote sensing imagery to identify and map boto niche. In cases where human and wildlife activities overlap, as with the boto, conflicts often arise from resource competition or incompatibility of each group’s interests [15].

1.1. Human–Boto Interactions and Conflict

Conflicts have long been known to exist between fishers and the boto. Fishers often view the boto as a resource competitor and disruptor of fishing activities, who can and do destroy fishing gear and equipment, often by tearing through nets to access fish caught inside, or by accidentally getting caught in the nets themselves [16,17,18,19,20]. More recently, botos have been slaughtered for use as bait in an industry centered around Calophysus macropterus, a species of necrophagous catfish known in Brazil as piracatinga [21,22] and as vulture catfish in English. The combination of these anthropogenic harms has resulted in a precipitous decline of boto populations in Brazil over the past two decades [1].
Tourism with botos is another activity with the potential to exacerbate boto vulnerability. This small but growing industry has increased in popularity since the late 1990s when it began at a small flutuante (a floating structure, referred to here as a boto interaction platform, or BIP) in the municipality of Novo Airão, located approximately 115 km northwest of Manaus, Amazonas, Brazil [23]. This industry that centers on tourists being able to get up-close and interact with botos has blossomed into an activity that has only recently become regulated by the state government of Amazonas (SEMA Resolução/CEMAAM n° 28, de 22 de janeiro de 2018). The regulations were implemented partly in response to reports of interactions leading to both human and boto injuries.
The potential harm in provisioning and interacting with wild cetaceans is well-documented [24,25,26,27,28,29,30,31,32,33,34,35]. Conditioning wild dolphins through food provisioning increases the likelihood of those dolphins being injured by human interactions [34]. In the Brazilian Amazon, the issue is compounded by shared resources and space among fishers, tourism operators and tourists, and the botos. While recent reports elucidate threats to the boto from fishing communities and BIP operators [22,23,36], there is little known about the role that spatial organization—the arrangement of fishing, boto, and tourism activities across space—plays in the interaction between these actors and their economic activities and boto vulnerability.

1.2. Fisher, BIP, and Boto Spaces of Conflict

The spatial interactions between these groups ebb and flow depending on the season. BIP tourism and fishing both occur throughout the year, but seasonal variations in water level and rainfall greatly impact each activity. For example, tourism often declines during the rainy season (January–May), while fishing is more reliable in the dry season (June–December) when water levels drop and fish movement is restricted to a smaller area [37,38].
Seasonality also affects boto movements. Studies concerning their spatial and temporal movement have been driven primarily by seasonal river fluctuation and habitat preferences of botos, but how this changes the spatial distribution of botos and human presence is understudied [3,4,6,39,40,41,42]. Given that humans are increasingly in contact with botos, both through longstanding activities like fishing and newer ones like BIP tourism, it is important to understand how these three stakeholder groups utilize their spaces throughout the year and where these spaces overlap. Problematically, boto population research is logistically challenging given the vastness of their habitat range and the difficulty in spotting, tracking, and tagging individual animals. Modeling boto niche using satellite-based measurements can provide researchers with data in remote areas of the Amazon where other forms of data may not exist. Moreover, a geographic approach such as the one presented here offers visualization of geospatial information to supplement studies that aim to predict locales in which botos may inhabit and estimate populations.
Boto territories overlap spatially with both fishers and BIPs [18,23]; however, it is not well understood where these overlaps occur during different seasons. Here, we use spatial data to map areas of overlap and identify potential hotspots of conflict among subsistence fishing, BIP tourism, and boto communities in an effort to inform resource managers aiming to mitigate harmful interactions.
Prior to analysis, we hypothesized that the overlap between fishers and BIPs would diminish during high-water periods but the overlap of BIPs and boto territories would persist through all periods. Furthermore, we expected that boto vulnerability is exacerbated during the low-water (dry) season by increased tourism and fishing activities, and minimized during the high-water season, when both fishing and tourism activity decreases (Table 1). With these issues and expectations in mind, the research in this paper (1) explores the spatial and temporal uses of space among fishers, BIP operators, and botos, with the aim to delineate the geographic spaces occupied by each stakeholder, and (2) illuminates potential spatiotemporal overlap of these actors, which may exacerbate boto vulnerability and facilitate conflict.

2. Materials and Methods

This research uses spatial and temporal data collected from in-person semi-structured interviews and mixed method surveys (both closed- and open-ended questions) with fishers and BIP operators. We used mixed methods to allow participants to elaborate on topics important to them and for us to better understand specifics about their activities, including where they engage in fishing and tourism. Refer to the supplemental materials for access to the complete survey instrument, of which parts were used for production of this manuscript. All human subjects research was approved through an Institutional Review Board (IRB# x16-687e) and housed under research project CAAE #70833817.9.0000.5020, approved through the Universidade Federal do Amazonas Ethics Committee. A geospatial model was created using remote sensing and secondary data to identify potential boto territory. The model presented here differs from species distribution models that depend on sampled primary data of species presence; boto territory is defined here using biophysical parameters to characterize niche. To model potential boto habitat in our study region, remote sensing data of water occurrence, elevation, surface/submerged vegetation, and suspended sediment were acquired and analyzed using Google Earth Engine. Boto habitat niche was defined using parameters that were consistent with observations in the literature (Section 2.3) [4,41,42,43]. Maps were produced to show spaces of fishing activity, BIP activity, potential boto habitat, and human settlements in order to identify potential areas of conflict and spaces of overlap (Figure 1).

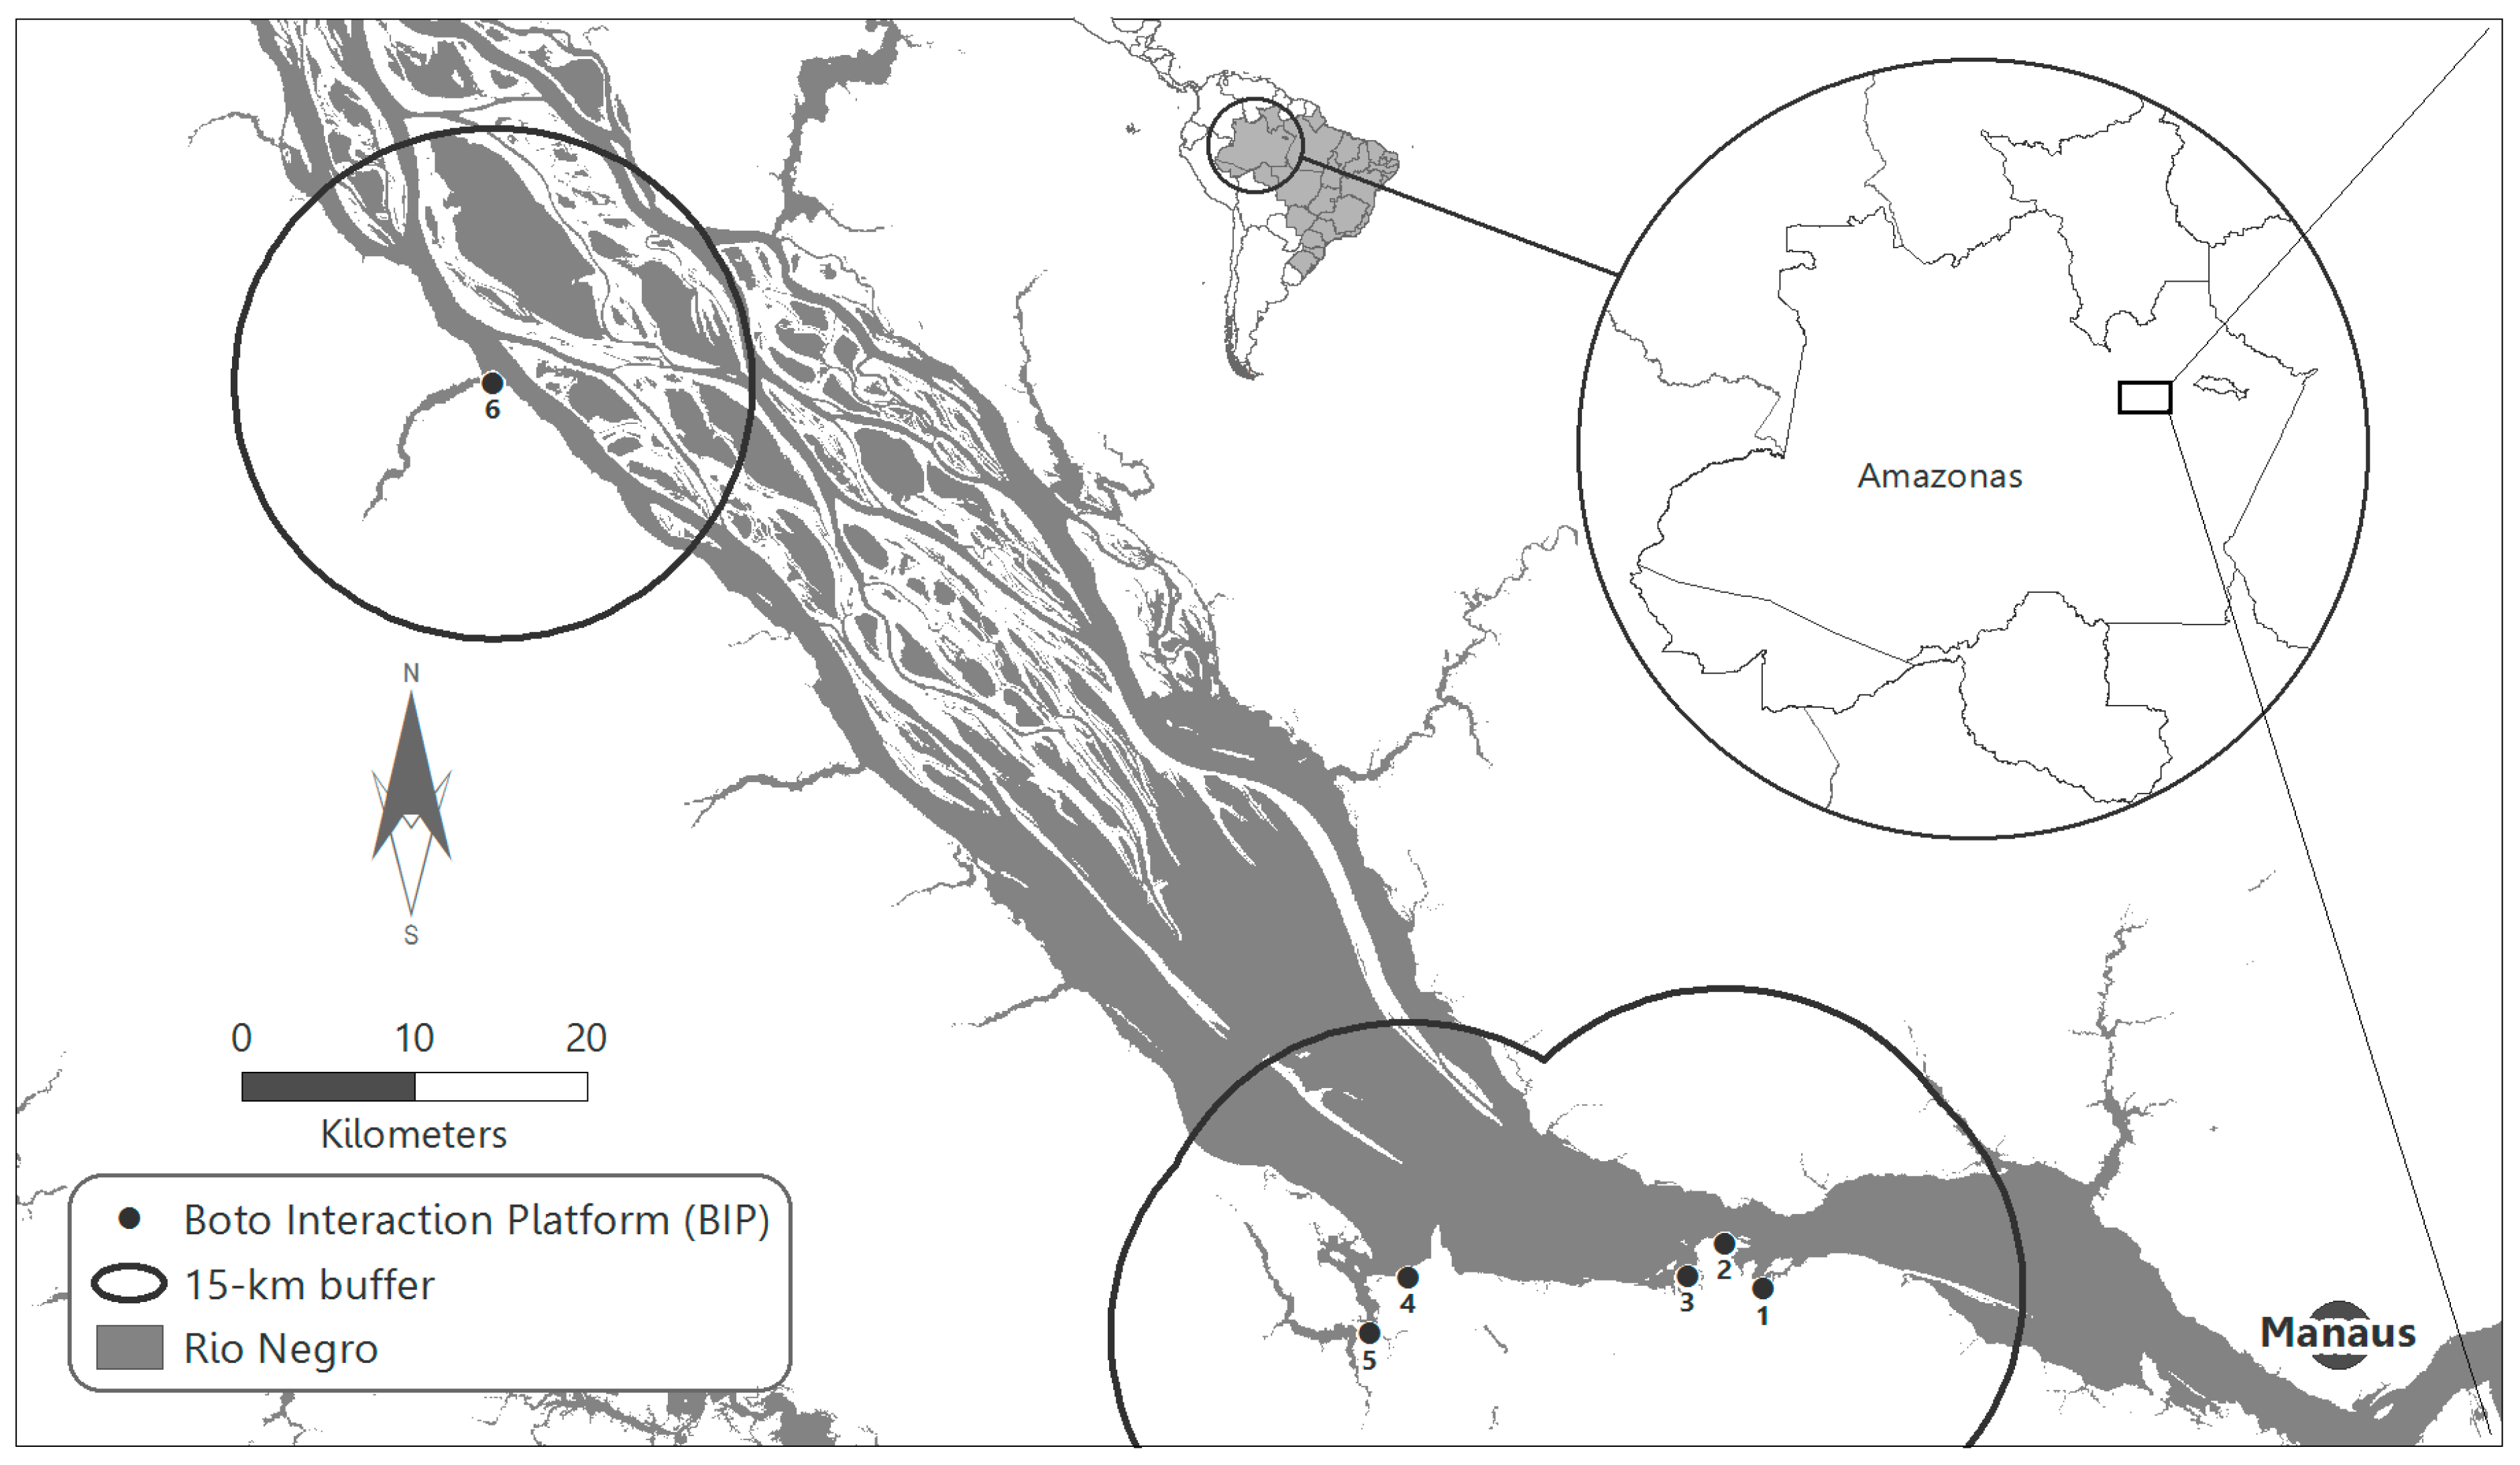
2.1. Field Data Collection and Study Area

Field data collection took place from June to August 2016 (the high-water period in this region) along a 95 km stretch of the Lower Rio Negro outside of Manaus, Amazonas in Brazil (Figure 2). Six BIPs were selected for study and BIP operator participants were recruited during visits to each BIP (Figure 3). Fisher participants were recruited by visiting residences and small communities first within a 1 km radius of each BIP and expanding outwards as necessary until willing participants were identified. Proximity to a BIP was required in order to recruit fisher participants who were familiar with boto tourism activities and may have been directly impacted by such activities, or may be aware of conflicts between tourists, other fishers, and botos. A total of 11 fishers and 10 BIP operators were surveyed and interviewed for information regarding the spatial and seasonal variations of their respective activities, in addition to a number of socioeconomic, institutional, and cultural questions. Each survey and interview lasted ~60 min; all were conducted on-site in Portuguese, audio-recorded, transcribed, and later translated to English. Location coordinates were taken at each interview site; BIP locations are publicly known and indicated in the study area map (Figure 2), but fisher locations are omitted from the manuscript to maintain the confidentiality of fisher respondents. In place of exact fisher locations, a 15 km radius buffer is placed around each of the three main areas where BIPs are located, representing the general vicinity in which interviews and surveys were conducted.

2.2. Fisher and BIP Spatiotemporal Data

Fishers and BIP operators were asked about the frequency of their respective activities during both the high- and low-water periods, how fishing varied across space depending on the season, and observations of or participation in human–boto contact. Fishers were also asked about their preferred locations for fishing activities. Satellite imagery of local areas was provided for reference and fishers were shown on the imagery where they were located during the interview, as well as nearby landmarks (e.g., local inns, well-known named tributaries of the Rio Negro, and BIPs), and asked to identify and describe common fishing locales in relation to these landmarks. This was a challenge for two reasons: (1) fishers’ typical mode of navigation does not include an aerial perspective, so identifying specific sites or known features on such imagery will have an inherent margin of error, and (2) verbal accounts and descriptions of locations are a challenge to accurately map. For these reasons, the resulting maps from this exercise were not included in our analyses; instead, we transcribed the data collected through verbal accounts and descriptions of fishing locations and included these with the data collected from surveys and interviews.
In addition to these data, human presence and fishing activity were proxied here using population data acquired from the 1 km spatial resolution 2016 LandScan Global Population product [44]. A 2 km buffer was produced from each pixel in the LandScan data containing a population greater than zero; this buffer represents the typical geographic footprint of small-scale, local subsistence fishers. The 2 km buffer distance was selected based on distance traveled for subsistence fishing purposes, as reported in fishers’ descriptions of the most common fishing areas near their communities (Fishers, personal communication, July and August 2016). Using Google Earth, the average measured distance between the community and these locations was approximated at 2 km. This estimate was selected for the buffer because it represents day-to-day subsistence fishing activities, which require less resources than the longer-distance (and often overnight) fishing trips reported.

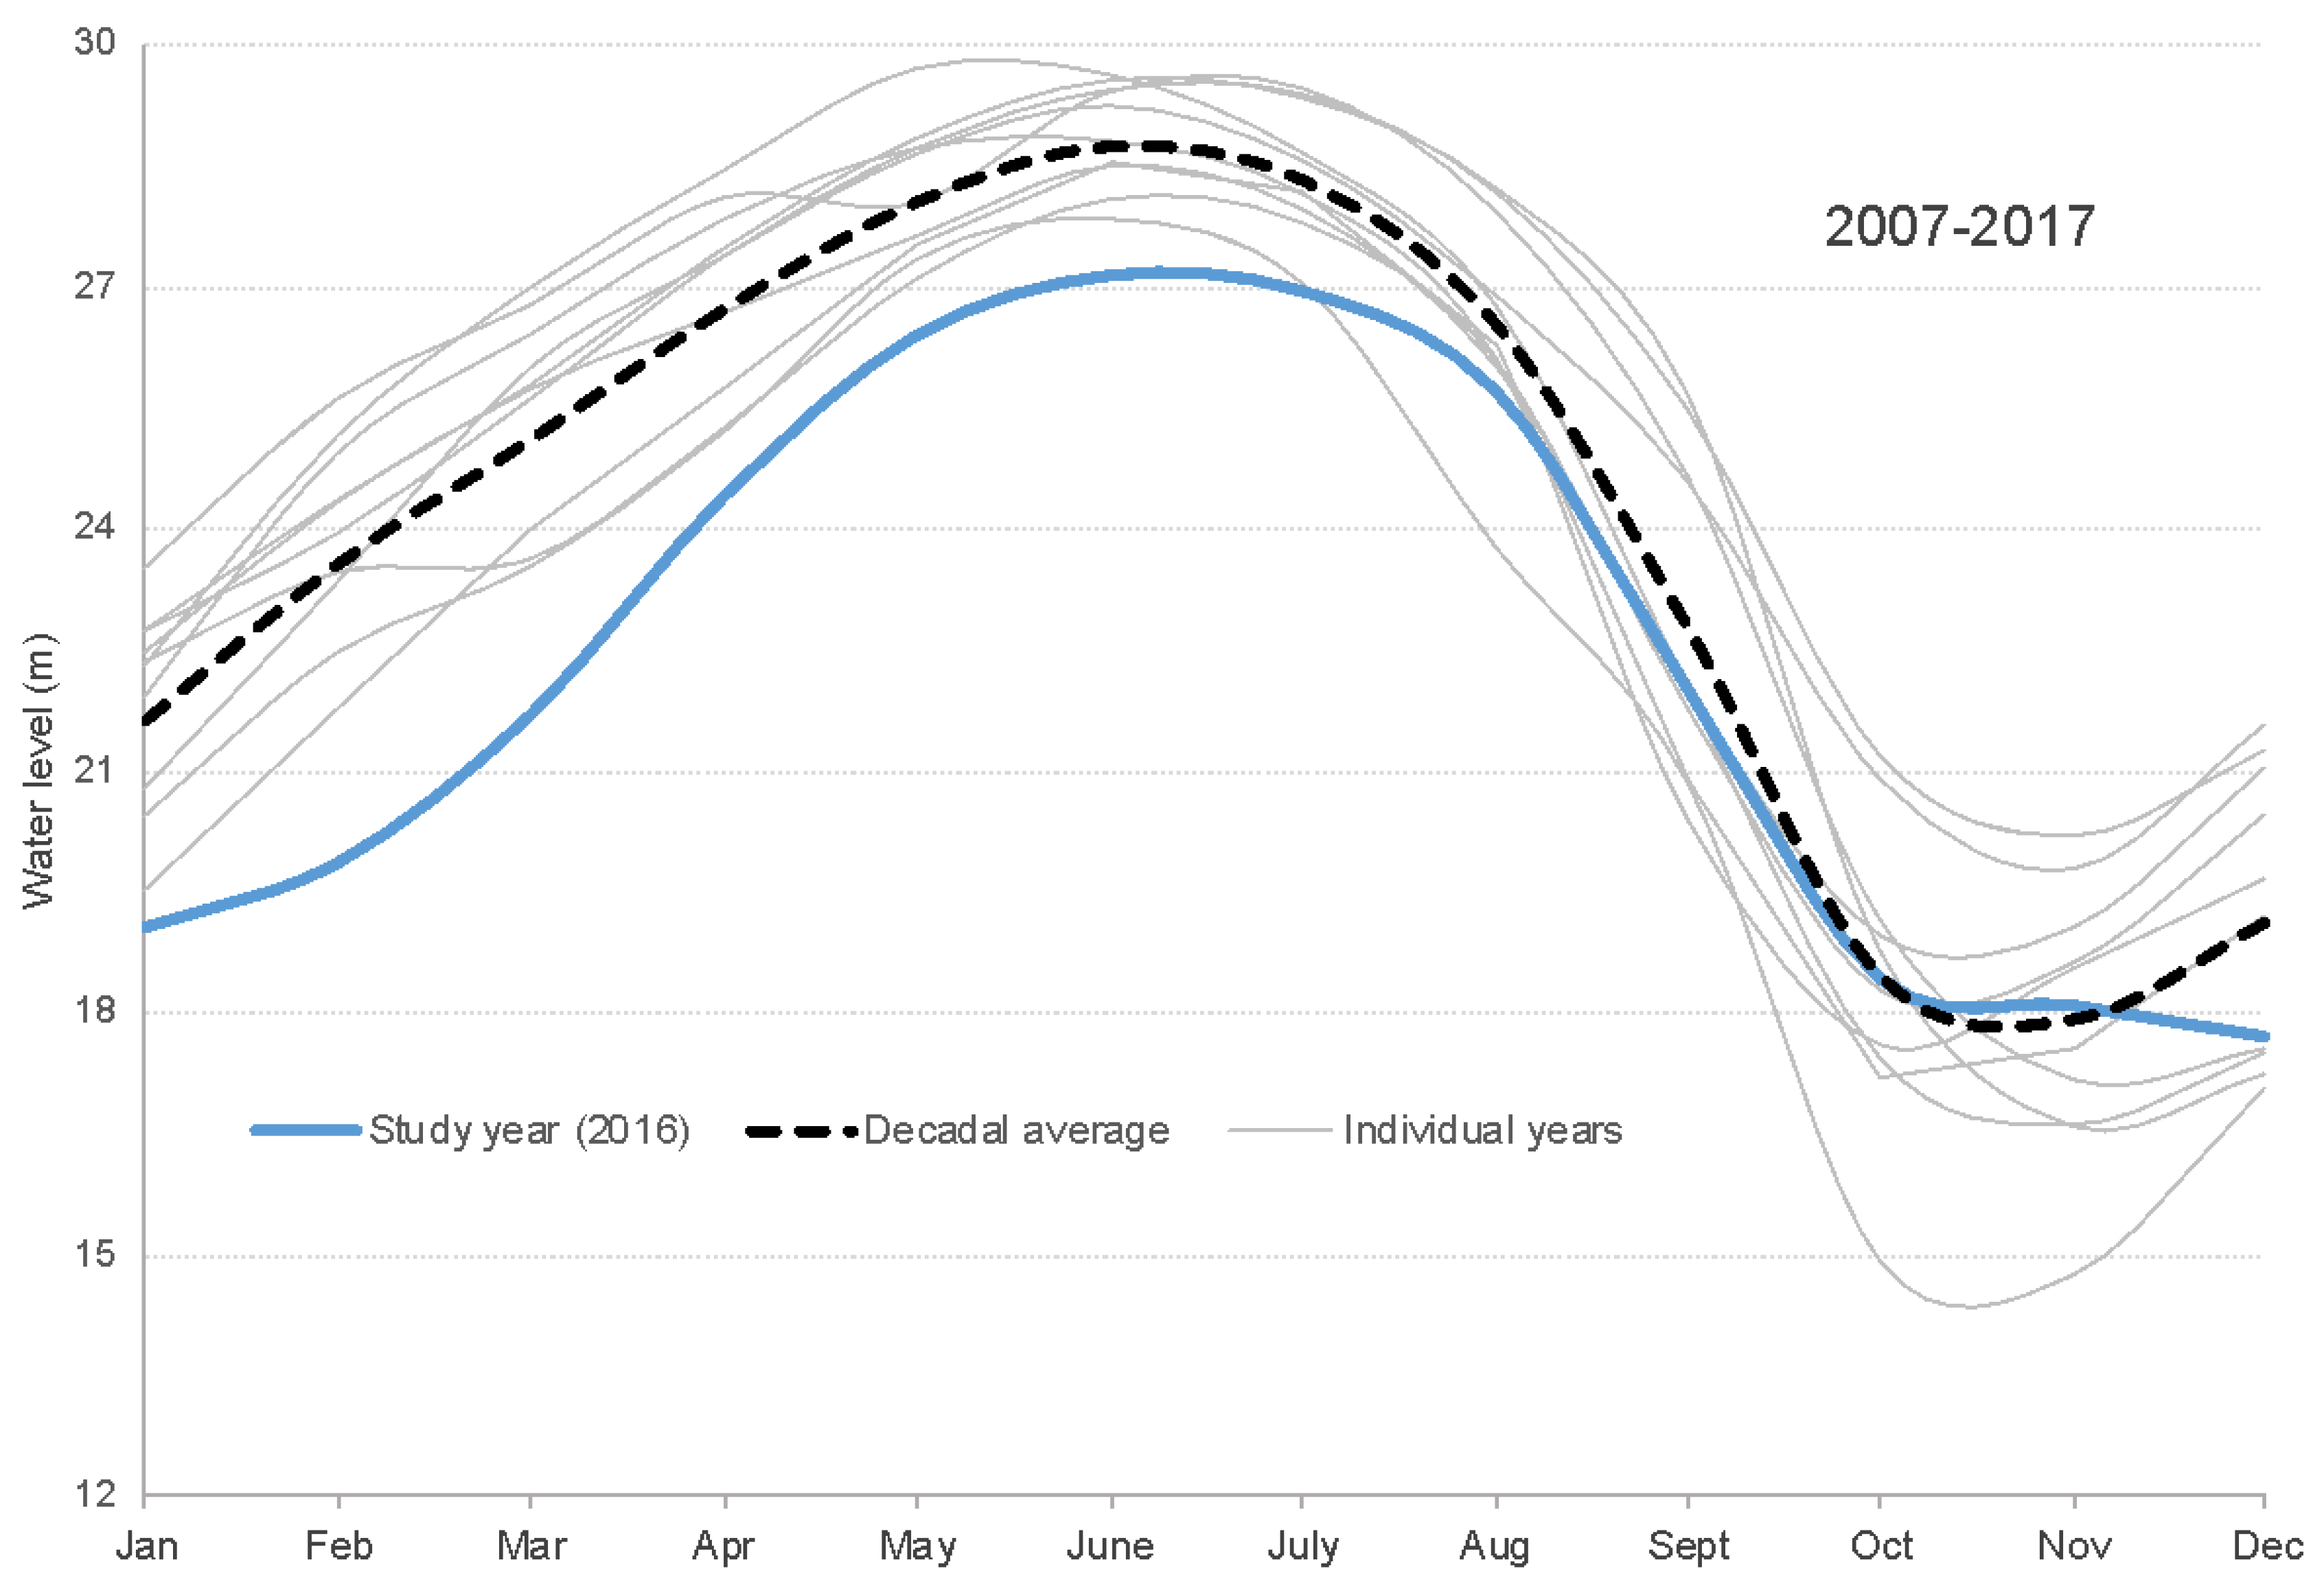
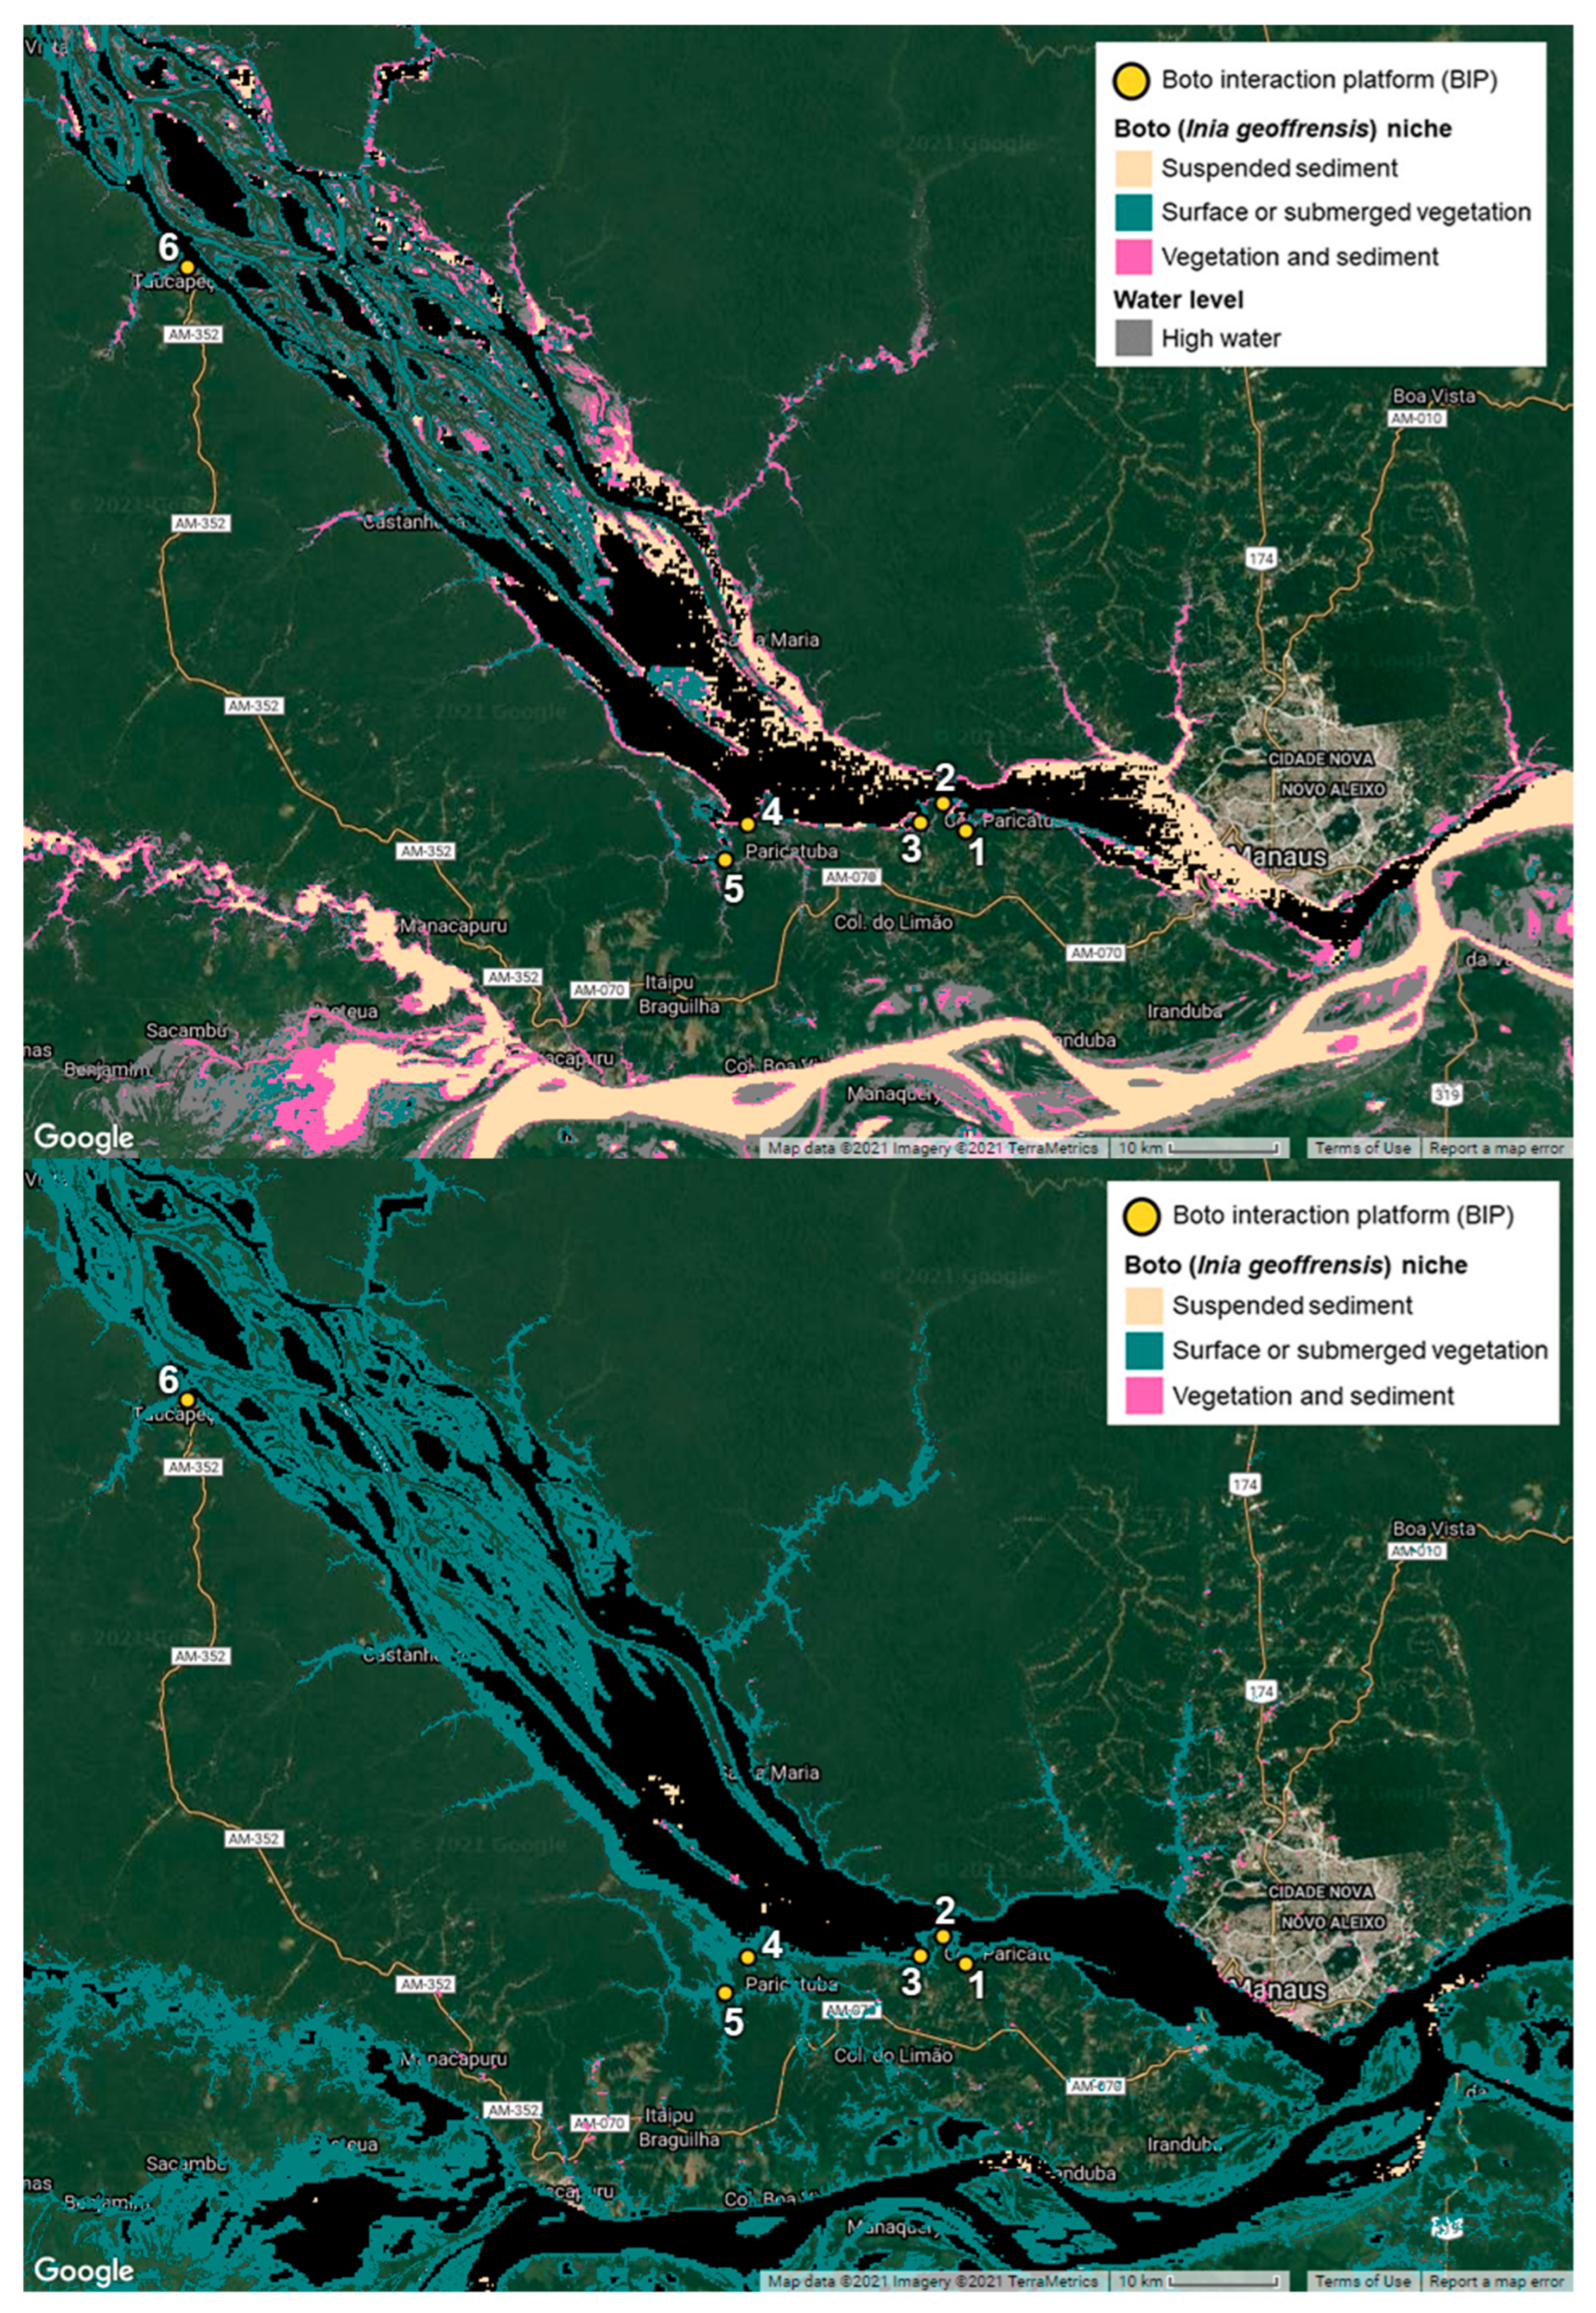
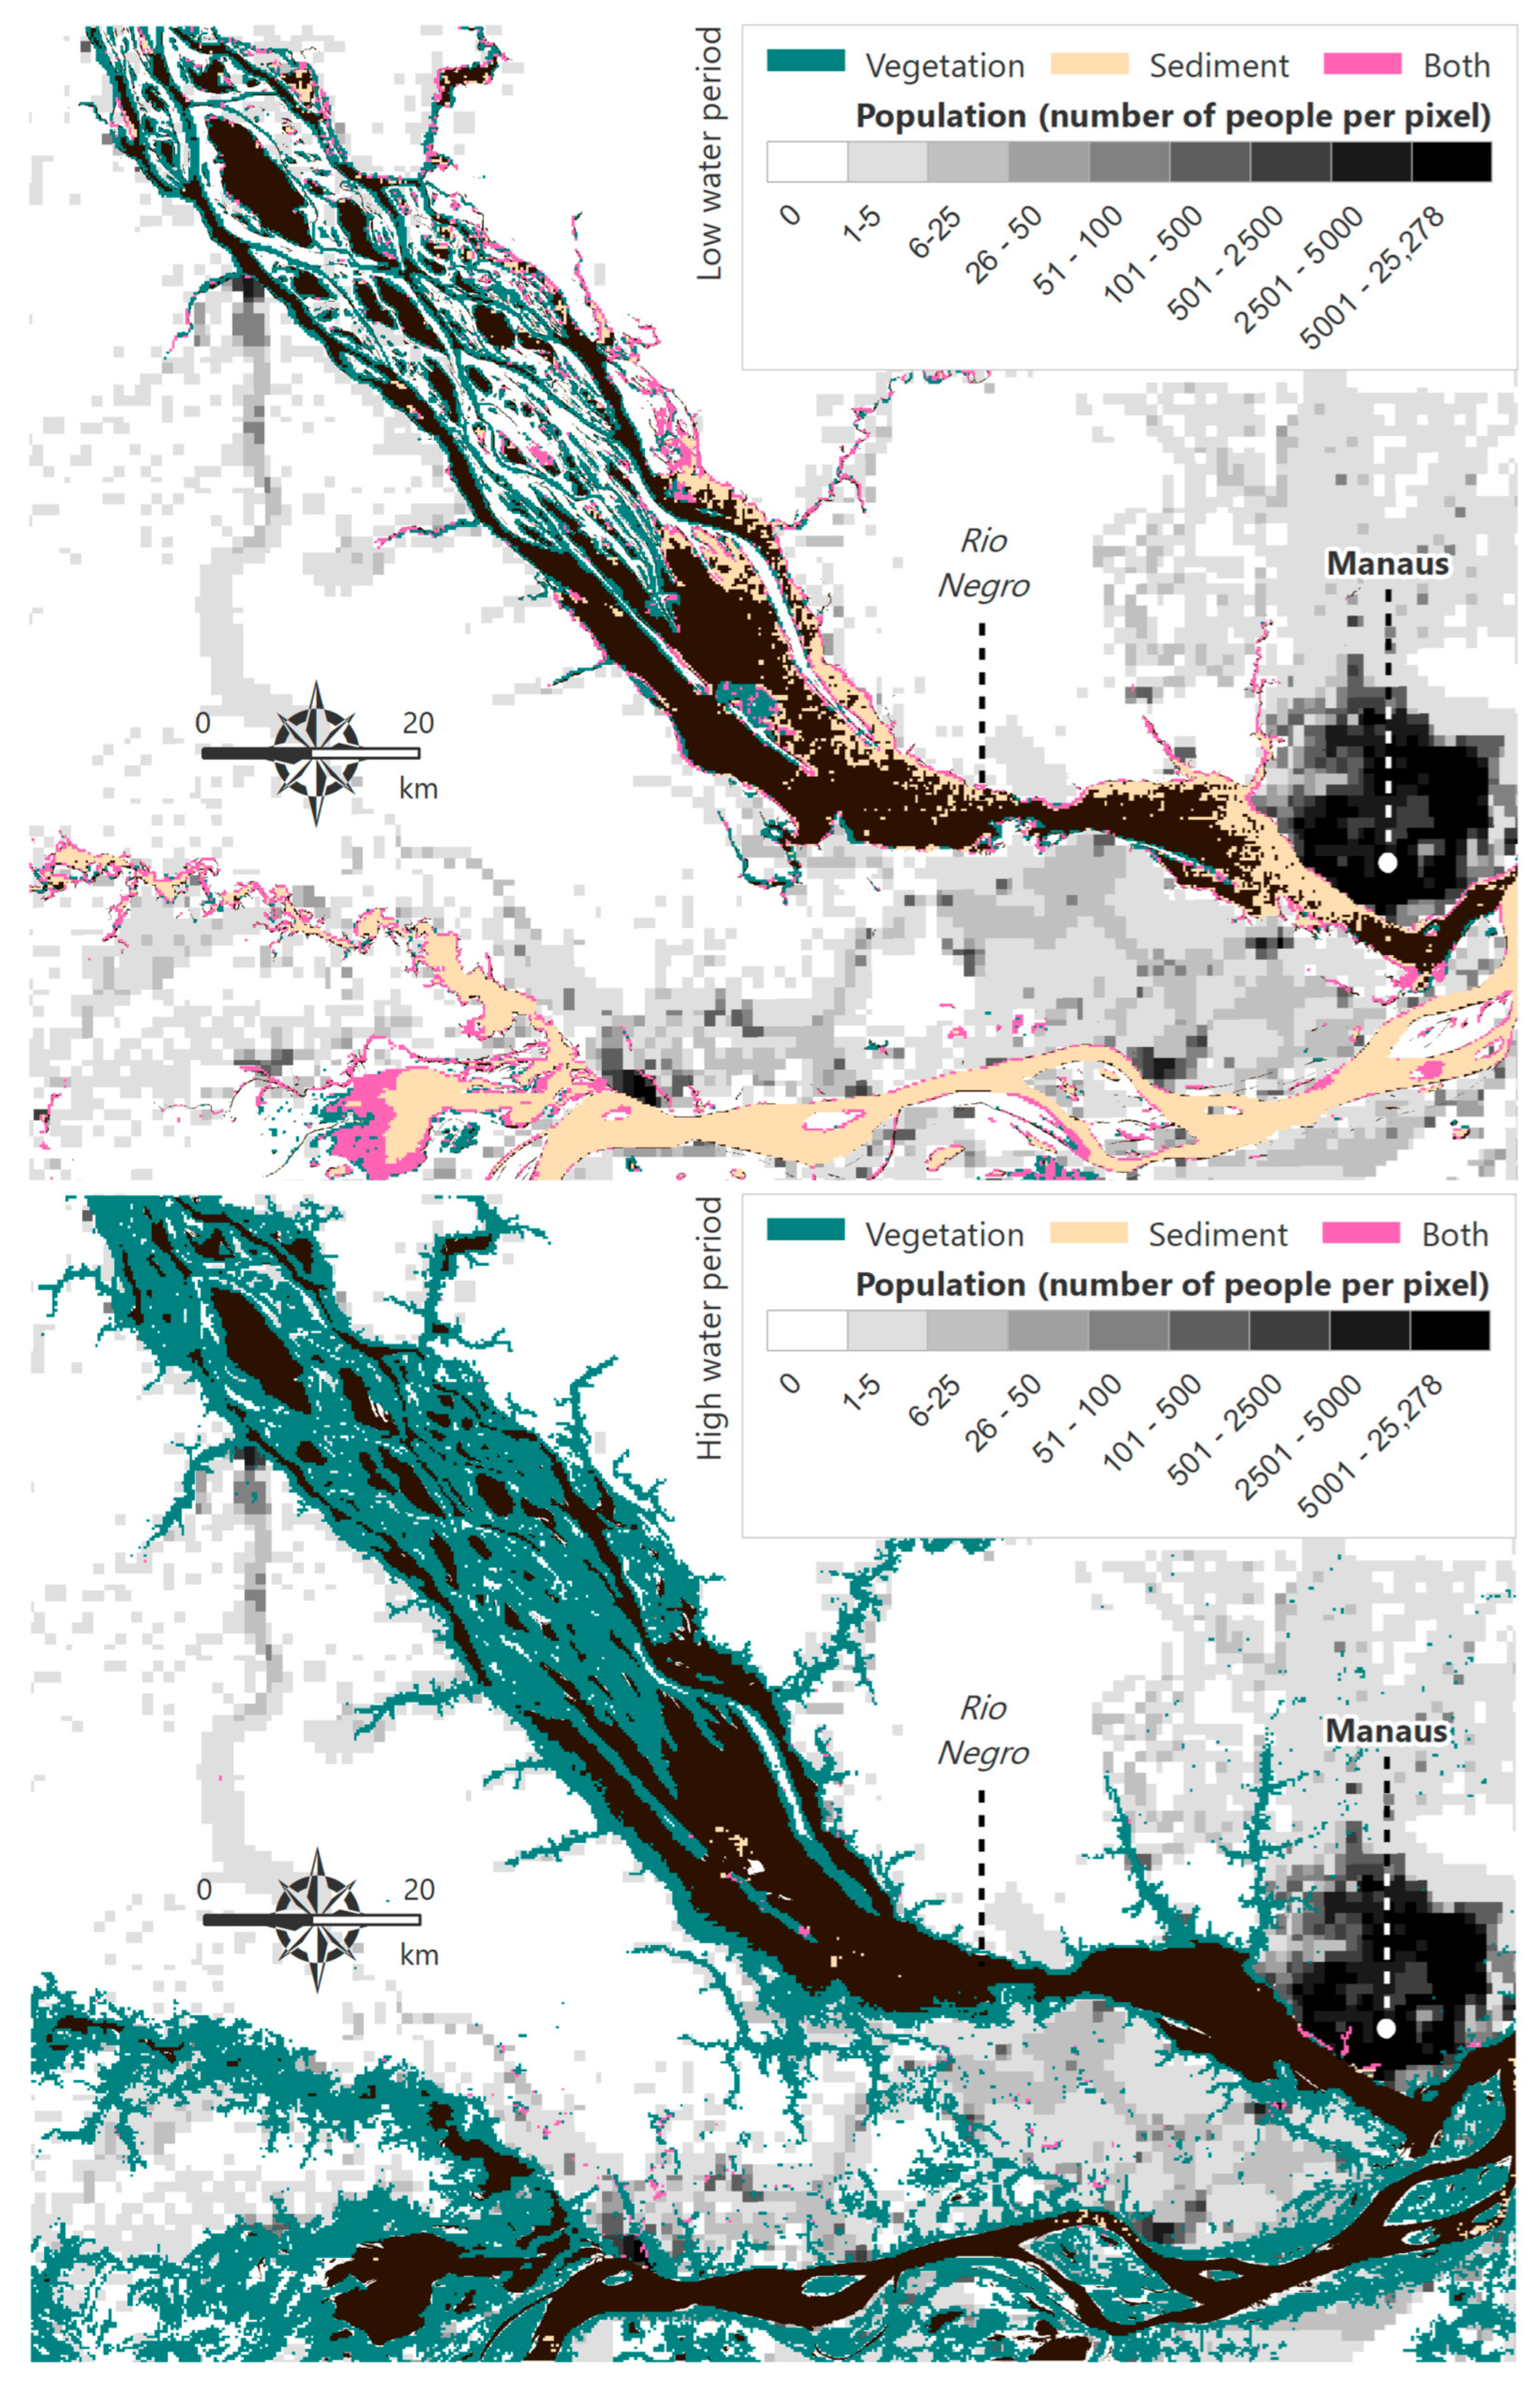
2.3. Seasonal Boto Habitat and Temporal Parameterization

A review of the literature was conducted to further determine boto preferences and movement, which was then used to parameterize the seasonal habitat maps. Data pertaining to habitat preferences and seasonal movements of the boto were sourced from previous studies conducted within Mamirauá Sustainable Development Reserve, a protected area outside of Tefé, Amazonas on the Rio Solimões (Amazon River) [4,40,41,42,43]. Habitat preferences of the boto vary depending on the seasonal cycle of water levels in the region. In the Lower Rio Negro, river levels fluctuate approximately 10 m between the low-water and high-water periods (Figure 4). In a different region of the Amazon, approximately 530 km due west of Manaus on the Rio Solimões, Martin and da Silva [41] found that almost all botos preferred the margins of the main rivers during the low-water period. As water levels increased, they began to enter floodplain channels. Boto density of both males and females in these channels peaked at mid-rising levels (February and March in their study region), after which point, they found that almost all the animals surveyed on rivers were males. Sexual segregation begins to occur after this period—males move back to the rivers as the waters continue to rise and females and their calves move further into the flooded areas. As waters recede and flooded areas become less accessible, some males re-enter floodplain channels from the main rivers, and females also begin to move to these same channels from the flooded forests (igapós). By September, almost all botos have returned to the main rivers [41].

2.4. Surface and Submerged Vegetation

Floating vegetation has been found to be a preferred habitat for botos, who feed on species of small fish that use the vegetation as refuge [42,45,46]. To measure the occurrence of floating vegetation, a minimum NDVI (normalized difference vegetation index) threshold of 0.2 was used; NDVI, a ratio of the red (R) and near-infrared (NIR) reflectance wavelengths ([NIR-R]/[NIR + R]), is widely used to measure vegetation presence and density [47]. Previous studies have measured NDVI of sparse submerged vegetation at 0.2–0.4 [48] and marshy vegetation at 0.24 [49], thus a threshold of 0.2 was selected to maximize identification of floating and partially submerged vegetation. Surface and submerged vegetation was measured using NDVI data from NASA MODIS Terra Vegetation Indices (MOD13Q1 V6; 250 m spatial resolution) [50]. A water mask (described in the following section) was used to identify where surface or submerged vegetation was present within the river bounds during both the low- and high-water periods.
Because river levels fluctuate drastically in the region in accordance with the flood cycle (Figure 4), the surface water presence data were parsed into two groupings—low-water and high-water. Surface water data were acquired from JRC Global Surface Water Mapping Layers, v1.0 [51], which identifies global surface water occurrence from over 30 years of Landsat imagery. The JRC product maps permanent and semi-permanent water bodies (e.g., changes due to seasonal fluctuation), but is not representative of the maximum flood extent resulting from extreme events. A threshold of 0.73 was used as a proxy for low-water levels (or regular water presence); in this case, a threshold of 0.73 means that water is present at least 73% of the time (the upper quartile of water presence within the area of interest); this threshold also conformed with satellite imagery available from Google Earth. High-water levels were classified as water present less than 73% of the time (i.e., water body expansion during the rainy season). For the low-water season, NDVI was averaged for October–November (period where water levels are the lowest; Figure 4) and the low-water mask was used. For the high-water season, NDVI was averaged for May–July (peak of the high-water season) and the high-water mask was used.

2.5. Suspended Sediment

Surface reflectance was used to estimate suspended sediment concentration (SSC), which has been shown to be indicative of higher nutrient availability and greater ecological productivity [52]. Previous studies have also found that botos exhibit a preference for high-sediment segments of rivers that tend toward high productivity [3,42]. In a study by Park and Latrubesse [53] along the meeting of the waters, which is a particularly turbid and productive micro-environment where the Rio Negro and Rio Solimões join and mix together (where this study is positioned), MODIS surface reflectance (MOD09Q1 band 1) data were compared to field measurements. In their study, average surface reflectance measurements on the Rio Negro side were 0.022, and 0.171 for the Rio Solimões. For our study, an average of these two values (0.0965) was calculated to threshold the reflectance of suspended sediment along the confluence, where botos are known to frequent, in order to locate similar high-sediment loads throughout the normally low-sediment river. Thus, suspended sediment was measured here using surface reflectance band 1 (620–670 nm; red) from the NASA MODIS (MOD09Q1 V6; 250-m spatial resolution) Terra Surface Reflectance dataset and a surface reflectance was set to a 0.0965 value of to identify potentially productive, high-sediment areas of the Rio Negro. As with NDVI, SSC was averaged between October–November for the low-water season (period where water levels are the lowest; Figure 4) and the low-water mask was used. For the high-water season, SSC was averaged for May–July (peak of the high-water season) and the high-water mask was used. Both the NDVI and SSC products derived from MODIS are spatially aligned at 250 m spatial resolution and datasets/thresholds are summarized in Table 2.

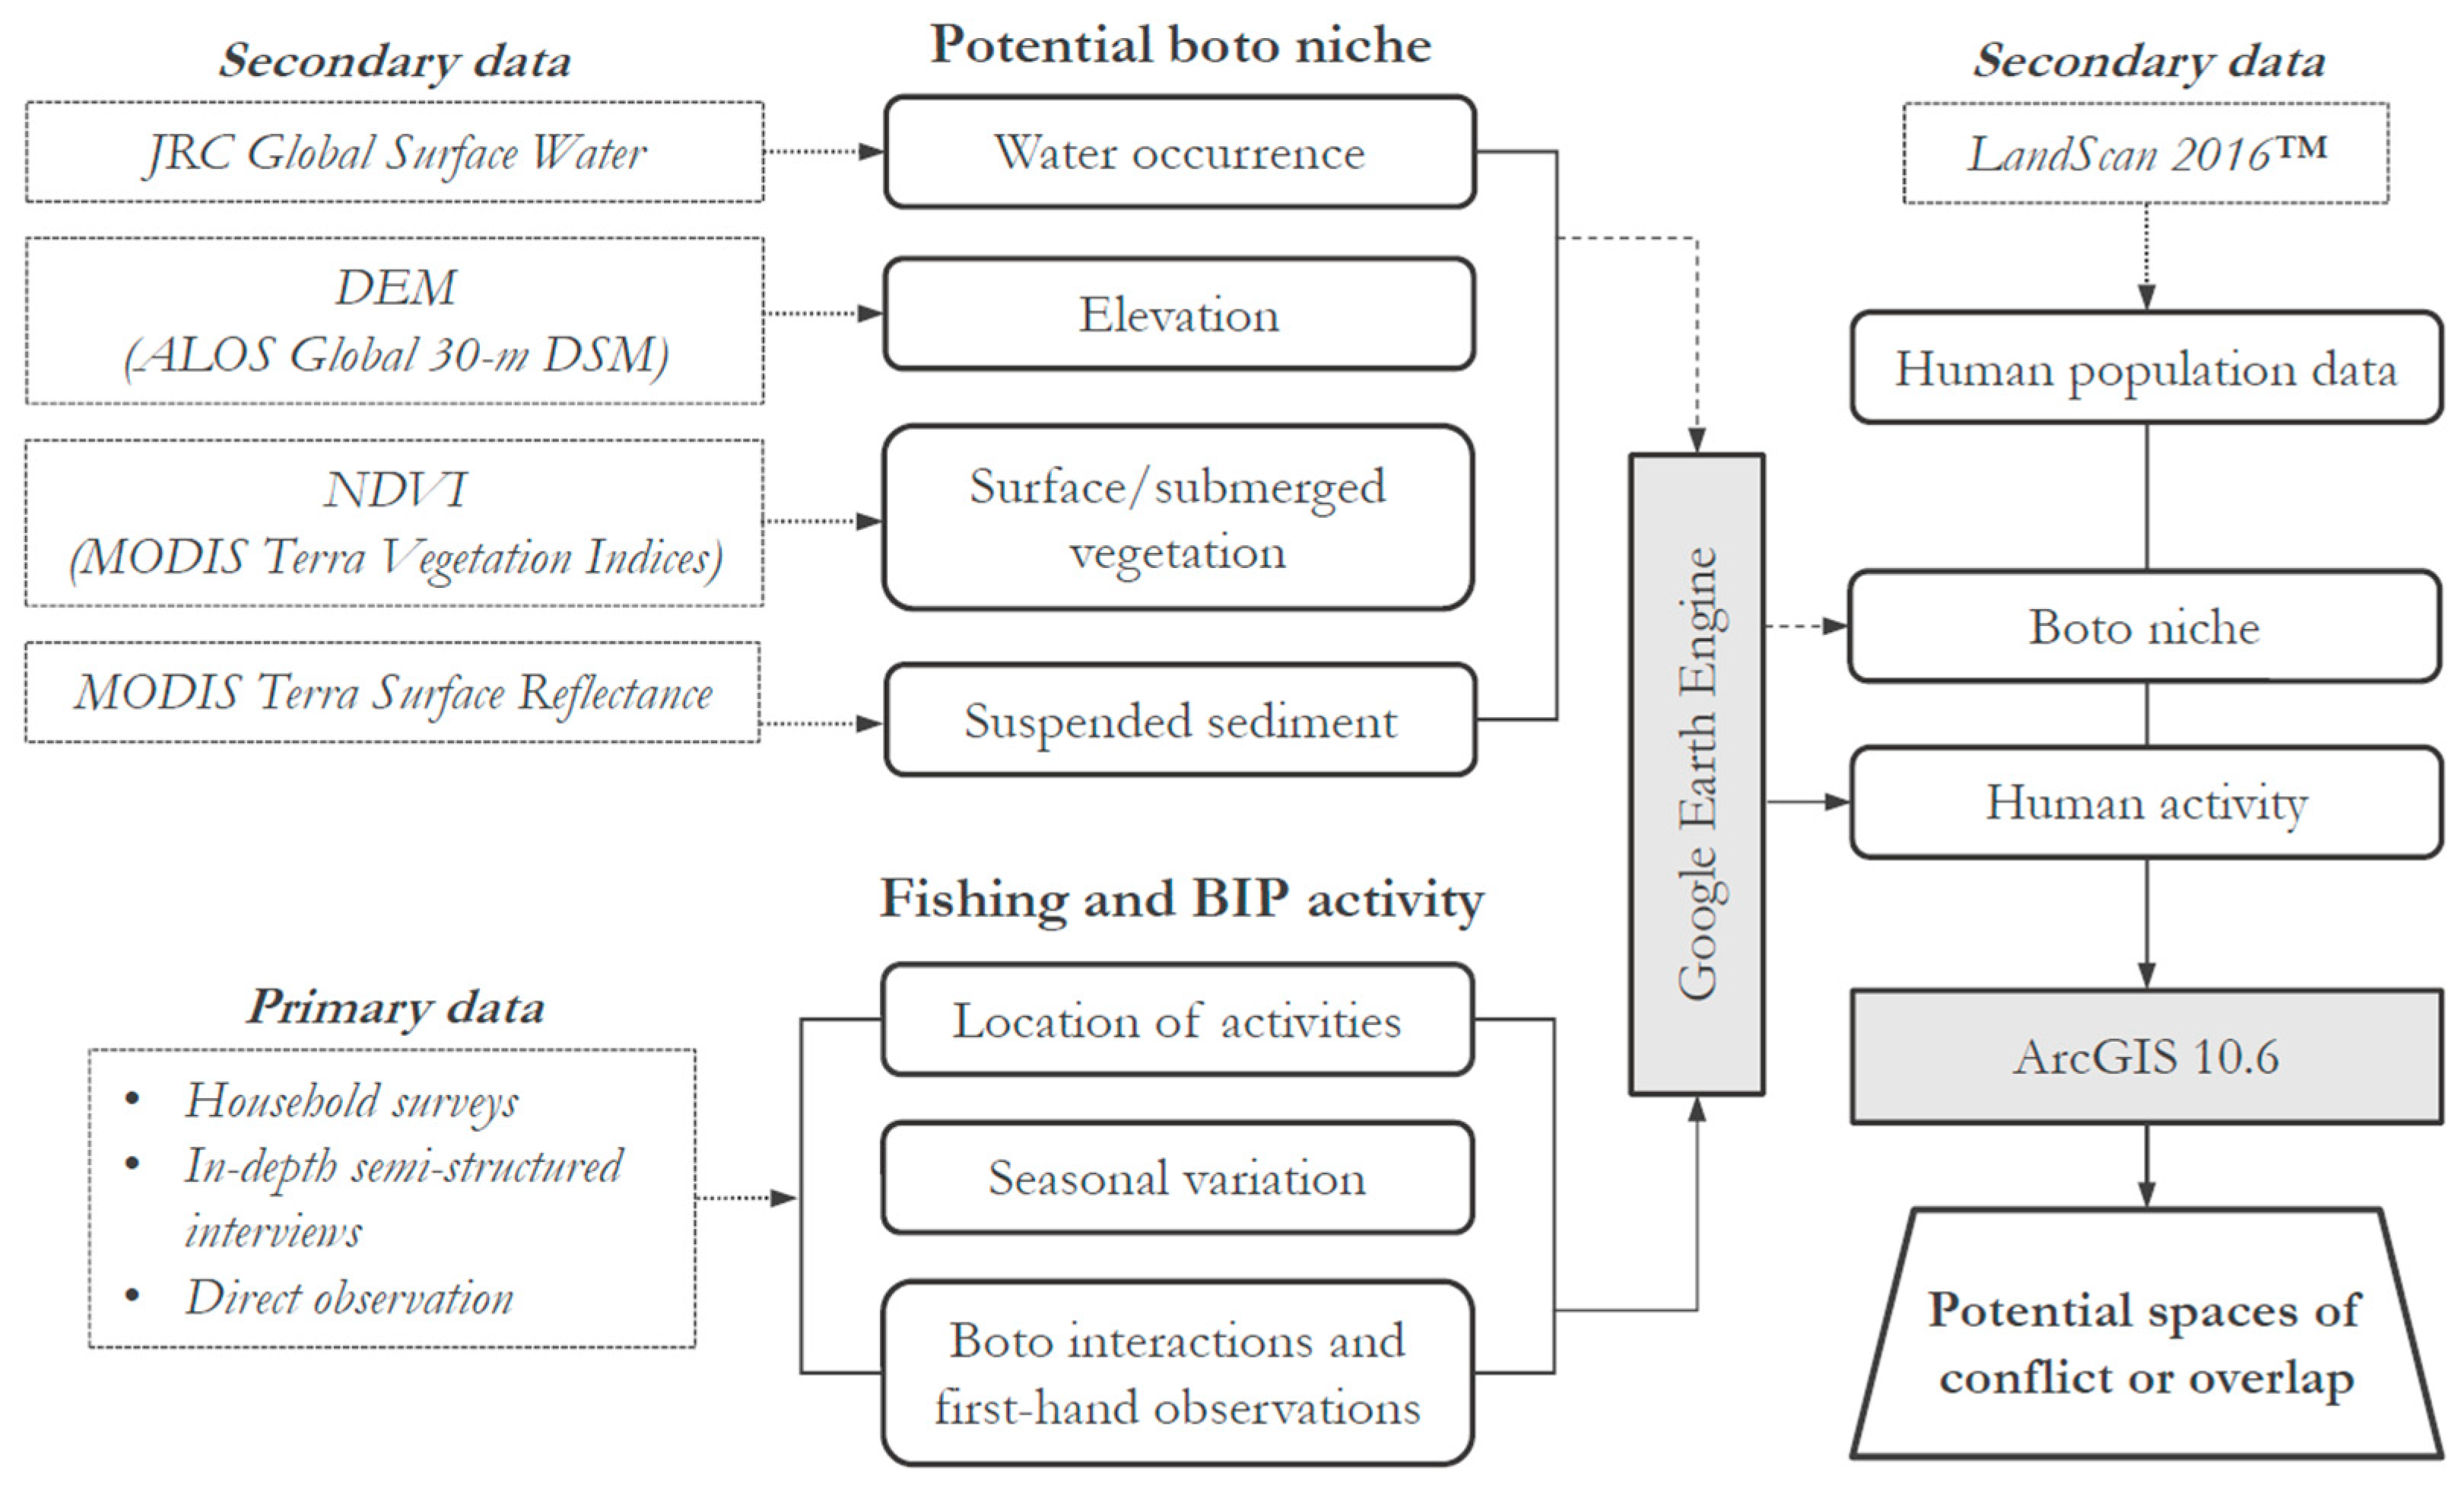
2.6. Identifying Boto Niche

Integrating seasonal habitat preferences with the geospatial data described in Section 2.1, Section 2.2, Section 2.3, Section 2.4 and Section 2.5, a boto niche model was developed for the Lower Rio Negro. The model combines areas of surface or submerged vegetation with areas of suspended sediment to pinpoint areas that are consistent with boto preference and identify potential areas of boto habitat. With these data, three distinct categories of suitability were determined—(1) vegetation only, (2) sediment only, and (3) vegetation and sediment together. Favorable boto niche was defined as vegetation and sediment together (Figure 5). Figure 5 shows a detailed view of suitability categories during the low-water season for demonstration and, in a following Section (3.3), Figure 9 shows the proximity of human settlements to boto habitat across the low- and high-water seasons.

3. Results

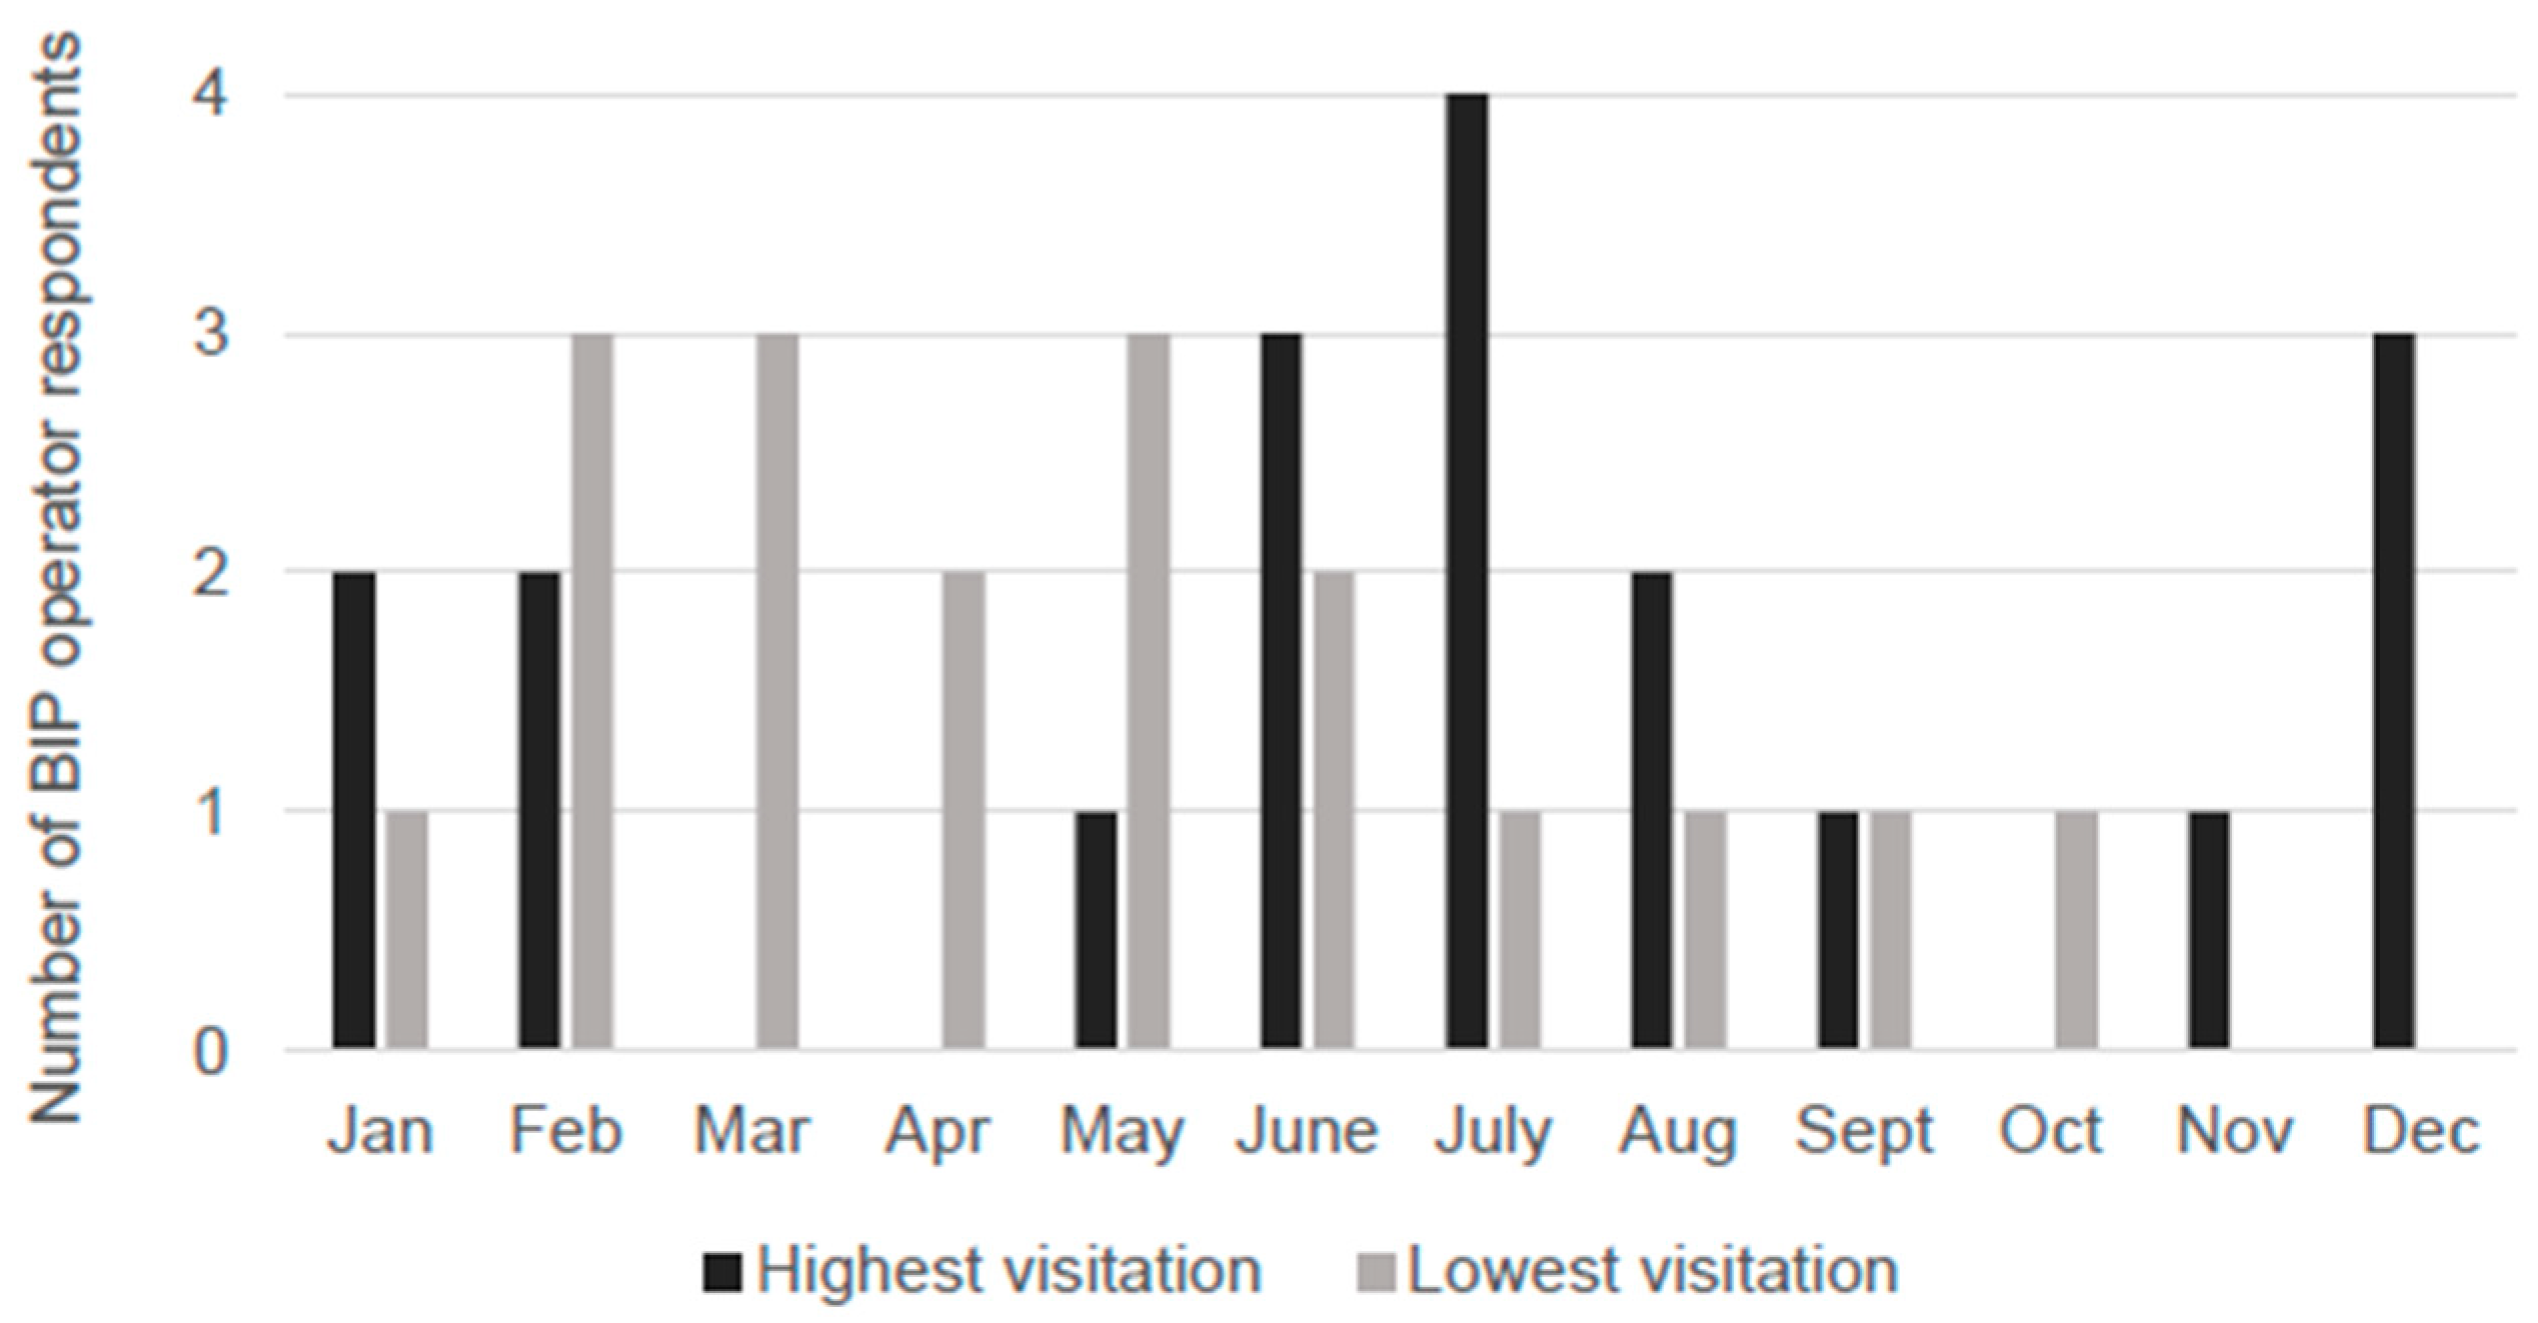
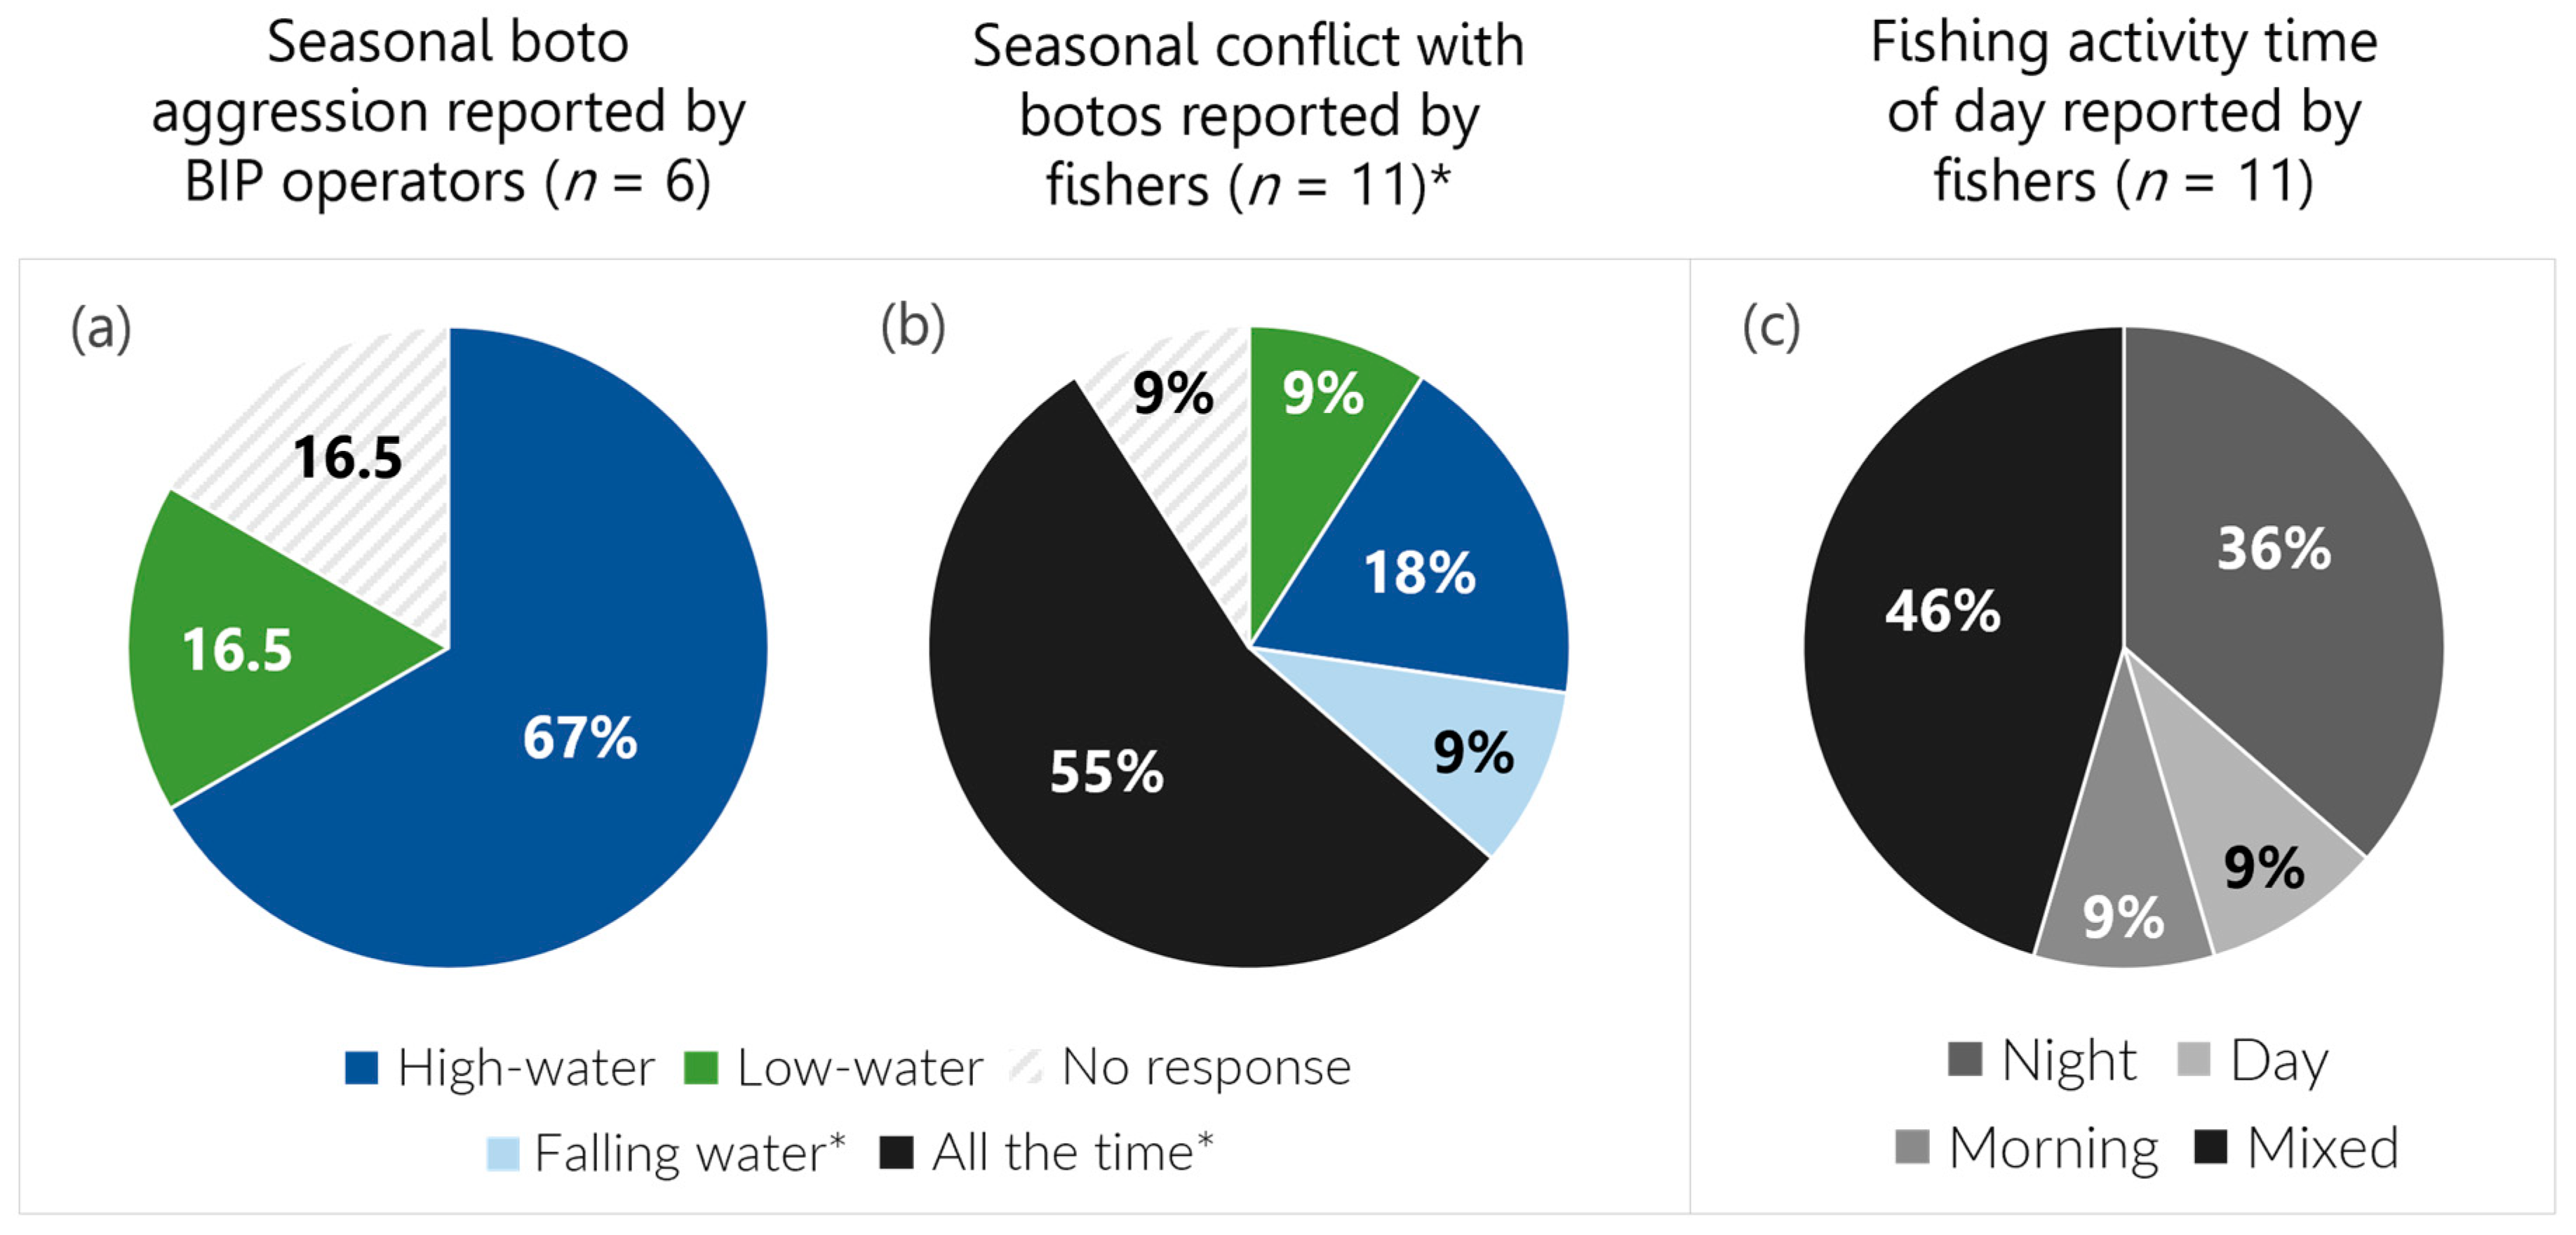
3.1. Spatial and Temporal Variation of BIP Activity

Although BIPs are in operation year round, tourist visitation varies depending on the time of year (Figure 6). Most BIP operators reported that highest tourist visitation occurred at some point during the high-water period (particularly June and July; n = 4), followed by end-of-the-year holidays (November and December; n = 3) and school holidays (January, February, and July; n = 2). Responses about low visitation were much more varied, and often contradicted what other BIP operators reported as high visitation months. Two operators said the low-water period receives the least amount of visitation because access becomes difficult, and since many tours are done by boat, some companies stop running tours because navigation is a challenge. One of these operators also said that January and February receive less visitation because of Carnaval, a major annual festival held in February or early March; another said February and March are their slowest months. One operator who reported that the high visitation season spans from June onward also reported that lowest visitation is from February to August. In the high-water period, BIPs are likely to be located on the margins of the main river (Figure 7). In the low-water period, BIPs that can be moved are relocated as necessary to areas of deeper water—typically further into the main river channel.
Boto aggression, movement, cost of fish, and types of fish used also varied with the different seasons. During the high-water period, fish are more expensive to purchase because they are harder to catch. When the river is full and forests become inundated with water, fish are able to scatter more easily and are thus more difficult to find. Species of fish also vary depending on the season, with jaraqui (Semiprochilodus spp.), cubiu (Anodus elongatus, Anodus orinocensis, Argonectes longiceps, Curimata ocellata, Hemiodus gracilis, Hemiodus immaculatus, Hemiodus unimaculatus, Micromischodus sugillatus), and mapará (Hypophthalmus spp.) being commonly used as boto feed in the high-water period, and cará (Acarichthys heckelii, Acaronia nassa, Astronotus ocellatus, Satanoperca acuticeps, Satanoperca jurupari, Satanoperca lilith), branquinha (Curimata inornata, Curimata knerii, Curimata roseni, Curimata vittata, Curimatella immaculata, Curimatella meyeri, Cyphocharax abramoides, Cyphocharax leucostictus, Potamorhina spp., Potamorhina latior, Potamorhina pristigaster, Psectrogaster amazonica, Psectrogaster cf. falcata, Psectrogaster rutiloides), and sardinha (Triportheus spp.) being used in the low-water period.
Four BIP operators also reported botos acting most aggressively with each other during the high-water period, which they associate with the mating season. Although boto reproduction occurs throughout the year, BIP operators perceived it to occur most frequently during the high-water period, with males acting more aggressively toward each other at this time. On the other hand, one BIP operator reported that botos are most aggressive with each other during the low-water period because more botos are present during the dry season (Figure 8).
BIP operators also reported that botos tend to disappear more during the high-water period to follow the schools of fish (particularly jaraqui, mapará, and matrinxã (Brycon spp.)) passing through. Operators also often observe the botos entering the flooded forest and nearby streams during this period, presumably to hunt for fish. Botos are also known to visit multiple BIPs, with one boto in particular having been spotted at both BIP 4 and BIP 6.

3.2. Spatial and Temporal Variation of Fishing Activity

As noted with BIP operators, the availability of fish changes drastically throughout the year. All fishers agreed that fishing is much easier in the dry, low-water season and much more difficult in the high-water season, when flooded forests appear and fish scatter. In terms of the seasonality of conflict with botos, respondents who gave definitive answers were split across low-water (n = 1), high-water (n = 2), and falling-water (n = 1) periods being times of greatest conflict (Figure 8). Most respondents, however, reported that boto interference with fishing occurs all the time. At the time of interviewing (high-water season), one fisher who typically fishes from early morning until late afternoon reported that a boto had interfered with his fishing activities more than five times in the past week.
Fishing locations also change throughout the year. While specific responses varied among individuals and fishing communities, in general, fishers reported to fish “everywhere” during both seasons. More specific answers depended on the location of fishers’ residences; those who lived near a cluster of streams (igarapés) tended to respond that they would fish in those areas throughout the year. Another community located near the main channel of the Rio Negro had fishers who fished on the rocks of the banks of the river during the dry season, and in the flooded forest during the high-water season.
Because certain species of fish are prohibited from being caught at certain times of the year, and additional prohibitions are in place for protected areas (‘conservation units’ in Brazil), respondents’ fishing locations ranged from sites near their residences to as far away as 12 h away by boat. All respondents reported to fish for subsistence at least part of the year near their places of residence, regardless of whether they resided within protected area boundaries. Due to the difficulties associated with changing water levels and access to legal fishing areas, some respondents reported traveling to Barcelos, Rio Unini, or Lake Janauari for fishing activities, the furthest of which is approximately 430 km northwest of Manaus via the Rio Negro. Those fishers who lived south of Anavilhanas reported to fish from their communities up until Anavilhanas, recognizing that if they are caught fishing within National Park boundaries that they could be arrested and have their fish and fishing equipment confiscated. Regardless of this knowledge, at least one fisher responded that they sometimes still fish in Anavilhanas.
Of the eleven fishers surveyed, four reported to fish predominantly or only at night (typically from 8 pm and on); one only during the day; one only in the mornings; and the others reported a combination of mornings (typically leaving at 5 am), afternoons (after lunch), and night, depending on the season and how far they would be traveling (Figure 8). In one case, a fisher stated that they sometimes spend a week in their canoe at a lake and come back on a Friday, Saturday, or Sunday.

3.3. Boto Niche and Spaces of Contention

As stated previously, BIP operations are all located in areas that contain characteristics consistent with observed boto presence, referred to here as favorable boto niche (Figure 7). Results indicate that in this study area (that is, the extent of the maps presented in Figure 9), human and boto spaces overlap approximately 50% during low-water periods and 52% during high-water periods. These areas tend to be located along river margins, within streams and inlets, and in lakes. Some spaces with less frequent overlap are located within Anavilhanas National Park boundaries. However, while the 2 km buffer serves to represent likely frequent human–boto overlap, it is important to recognize that the human footprint can cover the entire river.
While it was expected that the dry, low-water season is likely to be the time of highest conflict among all stakeholders—as this is when greatest potential spatial overlap is most likely to occur due to falling water levels—results from this study suggest that there is greater potential for conflict during the high-water period (Figure 9). Calculations for the spatial extent of the data presented in Figure 9 showed that potential conflict areas (i.e., areas of favorable boto habitat conditions that overlap with the 2 km buffer) cover 50.55% of suitable boto habitat during low-water and 52.66% during high-water. While this may seem like a small difference, it translates to approximately 1358 km2 of potential boto habitat. In general, the likelihood of increased conflict during the high-water period is supported by both fisher and BIP respondents in this study.
Seasonal sexual segregation of botos may bias which groups of botos are most vulnerable to fishing and tourism activities at different times of the year. Given that males have been shown to prefer main river channels more than females (particularly during the rising water and high-water periods), and females tend to spend more time in the flooded forests during the high-water season, fishing activities are likely to impact females and their calves more during the high-water period, and BIP activities to males during this same period (Figure 10).

4. Discussion

4.1. Seasonality of BIP Activities and Observed Boto Behavior

BIP activities occur year round, and the floating structures on which they take place are moved (if possible) according to fluctuating water levels throughout the year. Half of the BIPs surveyed (BIPs 4–6) were located within protected area boundaries; the other half (BIPs 1–3) were located outside of protected area boundaries, but near the margins of a terrestrial protected area. While formal regulation of these activities did not yet exist at the time of data collection, state legislation was passed in early 2018 that included regulation of the frequency and duration of BIP activities, the methods used to attract botos to BIPs, and the amount and quality of fish being provisioned to botos (SEMA Resolução/CEMAAM n° 28, de 22 de janeiro de 2018). Before then, BIP activities were de jure illegal but tolerated by local government. The BIP located in Anavilhanas National Park, however, was subject to more stringent rules, likely due to its location. The enactment of this resolution may change the dynamics between and among botos, fishers, and BIP operators; whether and how it impacts human–boto and boto–boto conflicts remains to be seen, as does the efficacy and degree of regulation enforcement and compliance. The potential for additional conflicts between BIP operators, local residents, and environmental managers may also be heightened, particularly if changes are sudden and impact local economies [54]. However, given that explicit prohibition of wildlife feeding activities tends to result in low levels of compliance [55], we are hopeful that this resolution will lead to more desirable outcomes.
Overall, BIP operators had more to say about the high-water season than the low-water season. For example, they reported this period to have (1) the highest tourist visitation, (2) more expensive fish than the dry season, (3) more occurrences of boto–boto aggression (particularly among males), and (4) greater disappearance of botos (into the igapós). There were some discrepancies, however, among operators in terms of highest and lowest tourist visitation. These discrepancies could be due in part to the location of the BIPs. Operators who reported high visitation to occur during school holidays worked at the BIP in Novo Airão, which is more physically integrated into the local community. The structure itself is also much easier to access, as it has a fixed location that is anchored to land and accessible by roads. This may also help explain seasonal discrepancies in reported low-visitation periods; those who reported lowest visitation during the low-water season are not anchored to the riverbank, and do not have access to roads.
While BIP operators tended to attribute heightened aggression between male botos to a mating season, these reports of greater occurrences of aggression during the high-water season may also be partially explained by a preference of males for main river channels during this period [41]. It is also possible that because fish tend to scatter more widely into the flooded forests during the high-water season, the botos spend more time at BIPs because of the predictable and steady food supply. In a genetic study of boto aggregations near BIPs, Gravena et al. [56] found that the botos in these groups were primarily unrelated, suggesting that the animals had indeed become conditioned to feed at BIPs, where access to food is easy. At these sites, botos may fight each other over the fish provisioned by BIP operators, which almost all BIP operators noted happened often.

4.2. Spatial and Temporal Fishing Considerations

During the low-water season, both botos and fishers move to the main river channels as the previously inundated areas dry out. Although there is an expectation that occupying the same space by both stakeholders at the same time would result in heightened conflict, a slight majority of respondents (60%) reported that boto disruption of fishing activities occurred more during the high-water season. In the high-water season, flooded forests and inundated land areas become accessible places for fish to inhabit, thus making fishing more difficult for fishers because of the increase in area. All fishers agreed that the best and easiest fishing season is during the low-water period. The challenges presented to fishers during the high-water period can prove to be doubly damaging for fishers, as they may experience greater losses of income and instances of damaged fishing equipment in the same season.
It is possible that the reported increase of conflict during high-water is due to an actual increase of conflict between fishers and botos. Another possible explanation is that conflict may not necessarily occur more often but is perceived to occur more frequently because fishers experience more hardships during this season and experience consequences more strongly due to the greater difficulty in catching fish.
Diel factors (factors relating to a 24 h period; specifically, differences between daytime and nighttime hours) are also important to consider here. Previous studies suggest that botos prefer lakes as their primary habitat for active behaviors like foraging, especially at night, while they tend to rest at night in junctions [4]. Given that night-fishing was common among fisher respondents, this is an important factor to consider in terms of potential hotspots of conflict. If fishers and botos already share spatial habitat preferences of high fish density and low current [42], conflicts could be exacerbated temporally by both parties occupying the same spaces more actively at the same time. Moreover, fishers have reported that damage from boto interference occurs most often when a gillnet is left unattended in the water (Fishers, personal communication, July and August 2016), which tends to be an overnight fishing strategy. If botos are indeed more active at night, this may contribute to increased conflict and fishing disruption.
On the other hand, Vidal et al. [57] noted that sightings of botos occurred more often in the morning hours, particularly between 08:31–11:30 h, and then spiking again in the afternoon between 14:31–16:00 h. Given that their study also took place along the Lower Rio Negro, their findings reinforce the importance of further studying diurnal patterns of botos in this region, in order to better understand potential temporal overlap between humans and botos.
While most fishers reported to fish relatively close to their residences, some also reported to travel long distances, in part due to the illegality of fishing in a protected area. This traveling might increase the range of fisher impact on boto vulnerability. At the same time, some individuals stated that they still fish in protected areas, even when it is illegal.

4.3. Limitations

Overall, results from the remote sensing model suggest favorable boto preferences for river margins, lakes, and smaller inlets and streams. It is important to note, however, that this model is based on vegetation, sediment, and water extent data, and does not incorporate specific habitat types discussed in previous studies of boto habitat preferences. These include confluences, lakes, and floodplains adjacent to main rivers, as well as areas with diminished current, bays, and downstream ends of islands [39,42]. Unlike the delphinid species of river dolphin in this same region, Sotalia fluviatilis (known as the ‘tucuxi’), botos prefer shallower waters, so long as they can readily swim in them. Tucuxi, on the other hand, prefer deeper waters. Martin, da Silva, and Salmon [42] also noted that botos seemed to avoid mud banks and flooded forest margins; these are factors that should be considered in following spatial analyses of boto habitat where bathymetric and river flow data are accessible.
The parameters for habitat modeling were gathered from studies conducted within the Rio Solimões (Amazon River), which is less acidic, more turbid, and cooler in temperature than the Rio Negro. It is assumed that habitat preferences for the boto are comparable across river systems, but habitat preferences and seasonal movement studies should be conducted in the Rio Negro to improve the knowledgebase on boto habitat. The conditions of the Solimões differ from the Negro (higher sediment load, greater water current speeds, higher species richness), and these differences may have significant impacts on the accuracy of habitat modeling.
In-depth participatory mapping with fishers should also be explored in future studies in order to gain further insight into the specific localities of fishing activity. With this information, we would be able to better understand the spatial relations between actual fishing activities (rather than only fishing residences and communities) and boto habitat. Similarly, more targeted questions can be asked of both BIP operators and fishers regarding the seasonality and temporal factors of their observations and experiences. Lastly, it is possible that emphasis on high-water phenomena was due in part to the fact that the surveys and interviews were conducted during a high-water period, thus the events happening in real time may have overshadowed experiences from other seasons. Moving forward, it will be important to conduct studies across seasons to better understand the spatial and temporal relationship between humans and botos so that policies can be enacted that minimize conflict.

5. Conclusions

This paper has outlined ways in which BIP operators and fishers utilize spaces along the Rio Negro throughout the year, with a focus on areas that have the potential to overlap with suitable boto habitat. Seasonality is a major factor, and this study suggests that the high-water period is more conducive to conflict between humans and botos, which leads to boto vulnerability and is an important consideration in trying to mitigate anthropogenic harm to botos. Spatially, human and boto usage of space has significant overlap throughout the year, given the nature of tourism and fishing activities relying on the availability of botos and fish, respectively. From a managerial perspective, incorporating these spatial considerations to BIP and fishing regulations may help mitigate potential negative impacts on wild boto populations, as well as focus enforcement and conservation efforts on those areas most likely to be at risk. Additionally, diel factors of fishing activity and boto behavior should be examined in tandem, as night-time activities for both groups may overlap in ways that studies have not yet addressed but may contribute to heightened conflict. Because conflict between humans and botos are often focused on fishers, research into conflict mitigation techniques that take fishing challenges into consideration (e.g., acoustic alarms designed to reduce bycatch of small cetaceans in gill nets [58]) should be conducted in this region. Further in-depth studies on human usages of these spaces, particularly focusing on different times of the day and during different seasons of the year, would provide valuable insights into ways in which managers might more effectively harmonize human and boto activities.
Decadal trends have shown a steady boto population decline, indicating more than ever that boto conservation is urgent [1]. Understanding the ways in which humans utilize the same spaces as botos, and to what extent, can help researchers, policymakers, natural resource managers, and the general public better understand the ways we can mitigate boto vulnerability to anthropogenic activities.

Author Contributions

Conceptualization, C.Y.F. and C.S.S.; methodology, C.Y.F. and C.S.S.; software, B.G.P. and C.Y.F.; validation, C.Y.F. and B.G.P.; formal analysis, C.Y.F. and B.G.P.; investigation, C.Y.F.; resources, C.Y.F. and B.G.P.; data curation, C.Y.F. and B.G.P.; writing—original draft preparation, C.Y.F.; writing—review and editing, C.Y.F., B.G.P. and C.S.S.; visualization, C.Y.F. and B.G.P.; supervision, C.S.S. and C.Y.F.; project administration, C.Y.F.; funding acquisition, C.Y.F. All authors have read and agreed to the published version of the manuscript.

Funding

This research was funded by the Michigan State University (MSU) Graduate Office; William W. and Evelyn M. Taylor Endowed Fellowship for International Engagement in Coupled Human and Natural Systems; MSU Animal Studies Graduate Specialization; MSU Center for Gender in Global Context; MSU Department of Geography; MSU Center for Latin American and Caribbean Studies; American Association of Geographers (AAG); AAG Latin America Specialty Group.

Data Availability Statement

This work uses public domain NASA products: (1) MODIS/Terra Vegetation Indices 16-Day (MOD13Q1.006) and (2) MODIS/Terra Surface Reflectance 8-Day (MOD09Q1.006), which are available through LPDAAC repositories (https://lpdaac.usgs.gov/products) and the Earth Engine Data Catalog (https://developers.google.com/earth-engine/datasets). JRC Global Surface Water Mapping Layers are available in Earth Engine, as well as the Joint Research Centre data repositories (https://global-surface-water.appspot.com/). LandScan data are made available by the Oak Ridge National Laboratory (ORNL) upon request (https://landscan.ornl.gov/). Interviewee data remain undisclosed to protect the privacy of the participants.

Acknowledgments

The authors wish to thank the fishers and tourism operators who participated in this research; research assistants Laynara Santos, Natalia Pimenta and Marina Guedes; Guillaume Marchand, who was instrumental in the implementation of this project; and the Federal University of Amazonas (UFAM) for their support in this research.

Conflicts of Interest

The authors declare no conflict of interest.

References

  1. da Silva, V.M.F.; Freitas, C.E.C.; Dias, R.L.; Martin, A.R. Both cetaceans in the Brazilian Amazon show sustained, profound population declines over two decades. PLoS ONE 2018, 13, e0191304. [Google Scholar] [CrossRef] [PubMed]
  2. McGuire, T.L.; Henningsen, T. Movement Patterns and Site Fidelity of River Dolphins (Inia geoffrensis and Sotalia fluviatilis) in the Peruvian Amazon as Determined by Photo-Identification. Aquat. Mamm. 2007, 33, 359–367. [Google Scholar] [CrossRef]
  3. Araujo, C.C.; da Silva, V.M.F. Spatial distribution of river dolphins, Inia geoffrensis (Iniidae), in the Araguaia River (central Brazil). Mammalia 2014, 78, 481–486. [Google Scholar] [CrossRef]
  4. Yamamoto, Y.; Akamatsu, T.; da Silva, V.M.F.; Kohshima, S. Local habitat use by botos (Amazon river dolphins, Inia geoffrensis) using passive acoustic methods. Mar. Mammal Sci. 2016, 32, 220–240. [Google Scholar] [CrossRef]
  5. Flores, P.A.C. Espécies-alvo do Pan Pequenos Cetáceos. In Plano de Ação Nacional para a Conservação dos Mamíferos Aquáticos-Pequenos Cetáceos; Rocha-Campos, C.C., Câmara, I.d.G., Pretto, D.J., Eds.; Instituto Chico Mendes de Conservação da Biodiversidade, Icmbio: Brasília, Brazil, 2010. [Google Scholar]
  6. Gomez-Salazar, C.; Trujillo, F.; Portocarrero-Aya, M.; Whitehead, H. Population, density estimates, and conservation of river dolphins (Inia and Sotalia) in the Amazon and Orinoco river basins. Mar. Mammal Sci. 2012, 28, 124–153. [Google Scholar] [CrossRef]
  7. Oliveira-da-Costa, M.; Marmontel, M.; Da-Rosa, D.S.X.; Coelho, A.; Wich, S.; Mosquera-Guerra, F.; Trujillo, F. Effectiveness of unmanned aerial vehicles to detect Amazon dolphins. Oryx 2019, 54, 696–698. [Google Scholar] [CrossRef]
  8. Watts, S.M.; McCarthy, T.M.; Namgail, T. Modelling potential habitat for snow leopards (Panthera uncia) in Ladakh, India. PLoS ONE 2019, 14, e0211509. [Google Scholar] [CrossRef] [PubMed]
  9. Oliveira, J.S.F.; Georgiadis, G.; Campello, S.; Brandão, R.A.; Ciuti, S. Improving river dolphin monitoring using aerial surveys. Ecosphere 2017, 8, e01912. [Google Scholar] [CrossRef]
  10. Dawson, S.; Wade, P.; Slooten, E.; Barlow, J. Design and field methods for sighting surveys of cetaceans in coastal and riverine habitats. Mammal Rev. 2008, 38, 19–49. [Google Scholar] [CrossRef]
  11. Richman, N.I.; Gibbons, J.M.; Turvey, S.T.; Akamatsu, T.; Ahmed, B.; Mahabub, E.; Smith, B.D.; Jones, J.P.G. To see or not to see: Investigating detectability of Ganges river dolphins using a combined visual-acoustic survey. PLoS ONE 2014, 9, e96811. [Google Scholar] [CrossRef]
  12. Briscoe, D.K.; Fossette, S.; Scales, K.L.; Hazen, E.L.; Bograd, S.J.; Maxwell, S.M.; McHuron, E.A.; Robinson, P.W.; Kuhn, C.; Costa, D.P.; et al. Characterizing habitat suitability for a central-place forager in a dynamic marine environment. Ecol. Evol. 2018, 8, 2788–2801. [Google Scholar] [CrossRef] [PubMed]
  13. Derville, S.; Torres, L.G.; Iovan, C.; Garrigue, C. Finding the right fit: Comparative cetacean distribution models using multiple data sources and statistical approaches. Divers. Distrib. 2018, 24, 1657–1673. [Google Scholar] [CrossRef]
  14. Huang, S.L.; Peng, C.; Chen, M.; Wang, X.; Jefferson, T.A.; Xu, Y.; Yu, X.; Lao, Y.; Li, J.; Huang, H.; et al. Habitat configuration for an obligate shallow-water delphinid: The Indo-Pacific humpback dolphin, Sousa chinensis, in the Beibu Gulf (Gulf of Tonkin). Aquat. Conserv. Mar. Freshw. Ecosyst. 2019, 29, 472–485. [Google Scholar] [CrossRef]
  15. Ruda, A.; Kolejka, J.; Silwal, T. GIS-assisted prediction and risk zonation of wildlife attacks in the Chitwan National Park in Nepal. ISPRS Int. J. Geo-Inf. 2018, 7, 369. [Google Scholar] [CrossRef]
  16. da Silva, V.M.F.; Best, R.C. Freshwater dolphin/fisheries interaction in the Central Amazon (Brazil). Amazoniana 1996, 14, 165–175. [Google Scholar]
  17. Loch, C.; Marmontel, M.; Simões-Lopes, P.C. Conflicts with fisheries and intentional killing of freshwater dolphins (Cetacea: Odontoceti) in the Western Brazilian Amazon. Biodivers. Conserv. 2009, 18, 3979–3988. [Google Scholar] [CrossRef]
  18. Alves, L.C.P.D.S.; Zappes, C.A.; Andriolo, A. Conflicts between river dolphins (Cetacea: Odontoceti) and fisheries in the Central Amazon: A path toward tragedy? Zoologia 2012, 29, 420–429. [Google Scholar] [CrossRef]
  19. Iriarte, V.; Marmontel, M. River dolphin (Inia geoffrensis, Sotalia fluviatilis) mortality events attributed to artisanal fisheries in the Western Brazilian Amazon. Aquat. Mamm. 2013, 39, 116–124. [Google Scholar] [CrossRef]
  20. Brum, S.M.; da Silva, V.M.F.; Rossoni, F.; Castello, L. Use of dolphins and caimans as bait for Calophysus macropterus (Lichtenstein, 1819) (Siluriforme: Pimelodidae) in the Amazon. J. Appl. Ichthyol. 2015, 31, 675–680. [Google Scholar] [CrossRef]
  21. da Silva, V.M.F.; Martin, A.R. Status, threats, conservation initiatives and possible solutions for Inia geoffrensis and Sotalia fluviatilis in Brazil. In The Action Plan for South American River Dolphins 2010–2020; Trujillo, F., Crespo, E., Van Damme, P.A., Usma, J.S., Eds.; WWF, Fundación Omacha, WDS, WDCS, and SOLAMAC: Bogota, Colombia, 2010; pp. 123–143. [Google Scholar]
  22. Mintzer, V.J.; Martin, A.R.; da Silva, V.M.F.; Barbour, A.B.; Lorenzen, K.; Frazer, T.K. Effect of illegal harvest on apparent survival of Amazon River dolphins (Inia geoffrensis). Biol. Conserv. 2013, 158, 280–286. [Google Scholar] [CrossRef]
  23. Alves, L.C.P.S.; Andriolo, A.; Orams, M.B.; Azevedo, A.F. The growth of “botos feeding tourism”, a new tourism industry based on the boto (Amazon river dolphin) Inia geoffrensis in the Amazonas State, Brazil. Sitientibus Ser. Ciências Biológicas 2011, 11, 8–15. [Google Scholar] [CrossRef]
  24. Baker, C.S.; Perry, A.; Vequist, G. Humpback whales of Glacier Bay, Alaska. Whalewatcher 1988, 21, 13–17. [Google Scholar]
  25. MacGibbon, J. Responses of Sperm Whales (Physeter macrocephalus) to Commercial Whale Watching Boats off the Coast of Kaikoura; Department of Conservation, University of Canterbury: Christchurch, New Zealand, 1991. [Google Scholar]
  26. Blane, J.M.; Jaakson, R. The impact of ecotourism boats on the Saint Lawrence beluga whales. Environ. Conserv. 1995, 21, 267–269. [Google Scholar] [CrossRef]
  27. Wursig, B. Swim-with-dolphin activities in nature: Weighing the pros and cons. Whalewatcher 1996, 30, 11–15. [Google Scholar]
  28. Constantine, R. Increased avoidance of swimmers by wild bottlenose dolphins (Tursiops truncatus) due to long-term exposure to swim-with-dolphin tourism. Mar. Mammal Sci. 2001, 17, 689–702. [Google Scholar] [CrossRef]
  29. Nowacek, S.M.; Wells, R.S. Short-term effects of boat traffic on bottlenose dolphins, Turciops truncatus, in Sarasota bay, Florida. Mar. Mammal Sci. 2001, 17, 673–688. [Google Scholar] [CrossRef]
  30. Williams, R.; Trites, A.W.; Bain, D.E. Behavioural responses of killer whales (Orcinus orca) to whale-watching boats: Opportunistic observations and experimental approaches. J. Zool. 2002, 256, 255–270. [Google Scholar] [CrossRef]
  31. Orams, M.B. Feeding wildlife as a tourism attraction: A review of issues and impacts. Tour. Manag. 2002, 23, 281–293. [Google Scholar] [CrossRef]
  32. Lusseau, D.; Higham, J.E.S. Managing the impacts of dolphin-based tourism through the definition of critical habitats: The case of bottlenose dolphins (Tursiops spp.) in Doubtful Sound, New Zealand. Tour. Manag. 2004, 25, 657–667. [Google Scholar] [CrossRef]
  33. Peters, K.J.; Parra, G.J.; Skuza, P.P.; Möller, L.M. First insights into the effects of swim-with-dolphin tourism on the behavior, response, and group structure of southern Australian bottlenose dolphins. Mar. Mammal Sci. 2013, 29, 484–497. [Google Scholar] [CrossRef]
  34. Christiansen, F.; Mchugh, K.A.; Bejder, L.; Siegal, E.M.; Lusseau, D.; Mccabe, E.B.; Lovewell, G.; Wells, R.S. Food provisioning increases the risk of injury in a long-lived marine top predator. R. Soc. Open Sci. 2016, 3, 160560. [Google Scholar] [CrossRef] [PubMed]
  35. Hazelkorn, R.A.; Schulte, B.A.; Cox, T.M. Persistent Effects of Begging on Common Bottlenose Dolphin (Tursiops truncatus) Behavior in an Estuarine Population. Aquat. Mamm. 2016, 42, 531–541. [Google Scholar] [CrossRef]
  36. Alves, L.C.P.S.; Andriolo, A.; Orams, M.B.; Azevedo, A.F. Resource defence and dominance hierarchy in the boto (Inia geoffrensis) during a provisioning program. Acta Ethologica 2013, 16, 9–19. [Google Scholar] [CrossRef]
  37. Hoefle, S.W. Multi-functionality, juxtaposition and conflict in the Central Amazon: Will tourism contribute to rural livelihoods and save the rainforest? J. Rural. Stud. 2016, 44, 24–36. [Google Scholar] [CrossRef]
  38. Pinaya, W.H.D.; Lobon-Cervia, F.J.; Pita, P.; De Souza, R.B.; Freire, J.; Isaac, V.J. Multispecies fisheries in the Lower Amazon River and its relationship with the regional and global climate variability. PLoS ONE 2016, 11, e0157050. [Google Scholar] [CrossRef] [PubMed]
  39. Vidal, O.; Barlow, J.; Hurtado, L.A.; Torre, J.; Cendon, P.; Ojeda, Z. Distribution and abundance of the Amazon River dolphin (Inia geoffrensis) and the tucuxi (Sotalia fluviatilis) in the upper Amazon River. Mar. Mammal Sci. 1997, 13, 427–445. [Google Scholar] [CrossRef]
  40. Martin, A.R.; da Silva, V.M.F. Number, seasonal movements, and residency characteristics of river dolphins in an Amazonian floodplain lake system. Can. J. Zool. 2004, 82, 1307–1315. [Google Scholar] [CrossRef]
  41. Martin, A.R.; da Silva, V.M.F. River dolphins and flooded forest: Seasonal habitat use and sexual segregation of botos (Inia geoffrensis) in an extreme cetacean environment. J. Zool. 2004, 263, 295–305. [Google Scholar] [CrossRef]
  42. Martin, A.R.; da Silva, V.M.F.; Salmon, D.L. Riverine habitat preferences of botos (Inia geoffrensis) and tucuxis (Sotalia fluviatilis) in the central Amazon. Mar. Mammal Sci. 2004, 20, 189–200. [Google Scholar] [CrossRef]
  43. Mintzer, V.J.; Lorenzen, K.; Frazer, T.K.; da Silva, V.M.F.; Martin, A.R. Seasonal movements of river dolphins (Inia geoffrensis) in a protected Amazonian floodplain. Mar. Mammal Sci. 2016, 32, 664–681. [Google Scholar] [CrossRef]
  44. Bright, E.A.; Rose, A.N.; Urban, M.L.; McKee, J.J. LandScan 2016; Oak Ridge National Laboratory SE: Oak Ridge, TN, USA, 2017. Available online: https://landscan.ornl.gov/ (accessed on 10 June 2018).
  45. da Silva, V.M.F. Ecologia Alimentar Dos Golfinhos Da Amazônia. Master’s Thesis, University of Amazonas, Manaus, Brazil, 1983. [Google Scholar]
  46. Crampton, W.G.R. Os peixes da Reserva Mamirauá: Diversidade e história natural na planície alagável da Amazônia. In Estratégias para Manejo de Recursos Pesqueiros em Mamirauá; Queiroz, H.L., Crampton, W.G.R., Eds.; Sociedade Civil Mamirauá/CNPq: Brasilia, Brazil, 1999; pp. 10–36. [Google Scholar]
  47. Tucker, C.J. Red and Photographic Infrared Linear Combinations for Monitoring Vegetation. Remote Sens. Environ. 1979, 8, 127–150. [Google Scholar] [CrossRef]
  48. Fusilli, L.; Collins, M.O.; Laneve, G.; Palombo, A.; Pignatti, S.; Santini, F. Assessment of the abnormal growth of floating macrophytes in Winam Gulf (Kenya) by using MODIS imagery time series. Int. J. Appl. Earth Obs. Geoinf. 2012, 20, 33–41. [Google Scholar] [CrossRef]
  49. Marchetti, Z.Y.; Minotti, P.G.; Ramonell, C.G.; Schivo, F.; Kandus, P. NDVI patterns as indicator of morphodynamic activity in the middle Paraná River floodplain. Geomorphology 2016, 253, 146–158. [Google Scholar] [CrossRef]
  50. Didan, K. MOD13Q1 MODIS/Terra Vegetation Indices 16-Day L3 Global 250m SIN Grid V006 [Data set]. NASA EOSDIS Land Processes DAAC. NASA EOSDIS Land Process. DAAC 2015, 10, 415. [Google Scholar]
  51. Pekel, J.-F.; ACottam; Gorelick, N.; Belward, A.S. High-resolution mapping of global surface water and its long-term changes. Nature 2016, 540, 418–422. [Google Scholar] [CrossRef] [PubMed]
  52. Junk, W.J.; Wittmann, F.; Schöngart, J.; Piedade, M.T.F. A classification of the major habitats of Amazonian black-water river floodplains and a comparison with their white-water counterparts. Wetl. Ecol. Manag. 2015, 23, 677–693. [Google Scholar] [CrossRef]
  53. Park, E.; Latrubesse, E.M. Surface water types and sediment distribution patterns at the confluence of mega rivers: The Solimões-Amazon and Negro Rivers junction. Water Resour. Res. 2015, 51, 6197–6213. [Google Scholar] [CrossRef]
  54. Alves, L.C.P.d.S.; Machado, C.J.S.; Vilani, R.M.; Vidal, M.D.; Andriolo, A.; Azevedo, A.D.F. As atividades turísticas baseadas na alimentação artificial de botos-da-Amazônia (Inia geoffrensis) e a legislação ambiental brasileira. Desenvolv. Meio Ambiente 2013, 28, 89–106. [Google Scholar] [CrossRef]
  55. Vidal, M.D.; Santos, P.M.D.C.; Chaves, M.D.P.S.R.; Swett, R. Challenges and advances in the planning of tourism with Amazon river dolphins in the Brazilian Amazon. In Tourism; Khan, S.A.R., Ed.; IntechOpen: London, UK, 2021; pp. 1–16. [Google Scholar]
  56. Gravena, W.; Hrbek, T.; da Silva, V.M.F.; Farias, I.P. Boto (Inia geoffrensis—Cetacea: Iniidae) aggregations in two provisioning sites in the lower Negro River—Amazonas, Brazil: Are they related? PeerJ 2019, 7, e6692. [Google Scholar] [CrossRef]
  57. Vidal, M.D.; Santos, P.M.D.C.; Parise, M.; Chaves, M.D.P.S.R. From food supply to contemplation: Proposition of areas for dolphin-watching tourism in the Anavilhanas National Park, Brazil. Tour. Plan. Dev. 2021, 20, 1121–1139. [Google Scholar] [CrossRef]
  58. Monteiro-Neto, C.; Avila, F.J.C.; Alves, T.T., Jr.; Araujo, D.S.; Campos, A.A.; Martins, A.M.A.; Parente, C.L.; Furtado-Neto, M.A.A.; Lien, J. Behavioral responses of Sotalia fluviatilis (Cetacea, Delphinidae) to acoustic pingers, Fortaleza, Brazil. Mar. Mammal Sci. 2004, 20, 145–151. [Google Scholar] [CrossRef]
Figure 1. Conceptual diagram of study.
Conservation 03 00034 g001
Figure 2. Study area map with BIPs and fishing activity zones. Sampled boto interaction platforms (BIPs) are depicted with black dots; fishing communities and residences are approximated by a 15 km buffer around each cluster of BIPs.
Conservation 03 00034 g002
Figure 3. Image of an Amazon river dolphin at a BIP. While botos are known for their pink skin color, they can also be predominantly gray, particularly in younger individuals. The boto pictured here has some pink coloration on their flipper. Image source: Cadi Fung, 2016.
Conservation 03 00034 g003
Figure 4. Water levels in meters above sea level for the Lower Rio Negro for the years 2007–2017. The dashed black line depicts the 2007–2017 decadal average; the solid blue line depicts water levels for the year in which this study took place (2016). The high-water season for this region typically spans from May through August, while the low-water season spans September through November. The periods of falling water (when river levels decline) and rising water (when river levels rise) are the temporal ranges between the high- and low-water seasons (August–September for falling water; November–May for rising water). River level data from Porto de Manaus: http://www.portodemanaus.com.br/?pagina=nivel-do-rio-negro-hoje, accessed on 10 June 2018.
Conservation 03 00034 g004
Figure 5. Favorable boto niche for the study region during the low-(top map) and high-(bottom map) water seasons. Pink areas (vegetation and sediment) represent areas that exhibit favorable conditions for boto visitation, which are most apparent in the low-water period. Map produced using Google Earth Engine.
Conservation 03 00034 g005
Figure 6. Number of BIP operators who reported visitation during each month. Peak high-water occurs in June; peak low-water occurs between October and November.
Conservation 03 00034 g006
Figure 7. BIPs are numbered and depicted as yellow circles; pink areas highlight favorable (vegetation & sediment) boto niche areas. Tan areas highlight sediment-only boto niche areas; green areas highlight vegetation-only boto niche areas. The three images on top (ac) show the BIPs during high water; the three images on the bottom (df) show BIPs during low water.
Conservation 03 00034 g007
Figure 8. (a) BIP operators reported a majority (67%) of aggressive boto–boto behaviors occur during the high-water season; one operator (16.5%) reported aggression during the low-water season, and one operator (16.5%) did not respond to this question. (b) Conflicts between fishers and botos was reported to occur “all the time” by 55% of fisher respondents; with regards to specific seasons, 9% reported most conflict to occur during the low-water season, 9% during the falling-water season, and 18% during the high-water season. (c) Daily temporal fishing activity varied among nighttime (36%), daytime (9%), morning (9%), and a mix of mornings, afternoons, nights, and overnights (46%). *As reported by fishers only.
Conservation 03 00034 g008
Figure 9. Overlap of projected human activity with areas suitable for favorable vegetation (teal), sediment (tan), and both vegetation and sediment (boto niche, pink) conditions during the low-water (top map) and high–water (bottom map) periods.
Conservation 03 00034 g009
Figure 10. Seasonal variation in usage of flooded forests, floodplain channels, and main river for male botos, female botos, BIP operators, and fishers.
Conservation 03 00034 g010
Table 1. A priori expectations for spatial and temporal overlap of fisher, BIP, and boto territories.
A Priori Expectations
Spatial overlap
  • Boto territories overlap spatially with both fishers and BIPs
  • Fisher territories exacerbate boto vulnerability
Temporal overlapHigh-water season:
  • Fisher and BIP overlap is diminished
  • BIPs and boto territories still overlap
  • Boto vulnerability is minimized because of decrease in fishing and tourism activity
Low-water season:
  • Boto vulnerability is exacerbated by increased tourism and fishing activities
Table 2. Data product summary and thresholds.
SourceProductBandMetricSpatial ResolutionTemporal ResolutionThreshold
NASA MODISMOD13Q1 V6NDVISurface and Submerged Vegetation250-m16-day0.2
NASA MODISMOD09Q1 V6Surface reflectance band 1 (red)Suspended Sediment Concentration250-m8-day0.0965
JRCGlobal Surface Water Mapping Layers V1.2OccurrenceWater Body Extent30-m >0.73 low-water; >0 high-water
LandscanLandscan 2016 Population density1000-m
Disclaimer/Publisher’s Note: The statements, opinions and data contained in all publications are solely those of the individual author(s) and contributor(s) and not of MDPI and/or the editor(s). MDPI and/or the editor(s) disclaim responsibility for any injury to people or property resulting from any ideas, methods, instructions or products referred to in the content.

