Article

Assisted Migration of Sequoiadendron Genotypes for Conservation and Timber: Performance and Morphology in a Warmer Climate Outside of Their Range

by
Christopher M. Valness
1,
William J. Libby
2 and
John-Pascal Berrill
1,*
1
Department of Forestry, Fire, and Rangeland Management, California Polytechnic State University Humboldt, Arcata, CA 95521, USA
2
College of Natural Resources, University of California, Berkeley, CA 94720, USA
*
Author to whom correspondence should be addressed.
Conservation 2023, 3(4), 543-568; https://doi.org/10.3390/conservation3040035
Submission received: 16 September 2023 / Revised: 19 November 2023 / Accepted: 28 November 2023 / Published: 1 December 2023

Abstract

:
Sequoiadendron giganteum (giant sequoia) has a fragmented distribution of 75 groves found along the western slope of the Sierra Nevada Mountains, California, USA. Outplanting and range expansion or assisted migration of this iconic species for the objectives of genetic conservation and timber production would be supported by information on growth and morphology to guide seed-collection decisions. We measured and assessed giant sequoia planted as seedlings and clonal stock originating from 22 groves in two common-garden experiments at Foresthill, California, north of the current species range, after 29 growing seasons. Traits examined were tree-size parameters, fluting and asymmetry of the lower stem, basal swelling, fullness of the live crown, epicormic sprouting, and heartwood decay resistance in cut stumps. Performance in terms of tree size after 29 years varied widely among genotypes with different grove origins. Morphology and decay resistance also exhibited some variation according to grove origins. The seedling stock outperformed the clonal stock of the same grove origins in terms of size and is therefore recommended when faster early growth is desired to outcompete other trees or for other management objectives. However, more fluting was exhibited by the larger fast-growing giant sequoia, while fewer seedlings had epicormic sprouts than the clonal stock of the same grove origins. At our warm low-elevation study site, giant sequoia from Mountain Home, Giant Forest, and Converse Basin consistently exhibited above-average growth among other giant sequoia in a pure planting and in an intimate mixture with five common conifer associates. Therefore, seed collected from these three groves should perform relatively well at other locations with a similar climate. When conservation of the species and its genetic diversity is the primary objective, we recommend collecting from a wide range of groves and undertaking assisted migration by planting at multiple locations inside and outside giant sequoia’s range as a hedge against the loss of native groves.

1. Introduction

Tree species with small and fragmented natural ranges are most vulnerable to local extinction, especially when the regional climate changes faster than species can migrate [1]. Assisted migration is being advocated as a tool for genetic conservation and for climate-change adaptation by better matching species with sites under future climate scenarios [2]. Genetic variation among fragmented populations offers opportunities to collect seed from populations with attributes desired for conservation or timber production objectives, such as superior growth and form or unique and distinctive morphological or anatomical characteristics under genetic control [3]. Therefore, forest managers need information on the performance and morphology of propagules originating from different populations outplanted at different geographic locations with different climates.
In its native range, Sequoiadendron giganteum (Lindl.) J.Buchh. (giant sequoia) is distributed in 75 disjunct groves in a 420 km stretch not more than 24 km wide along the western slope of the Sierra Nevada averaging 1700–2500 m (5000–7500 ft) elevation [4,5,6]. Occurring between 35° and 39° N, the total area of these groves is not more than 14,500 ha [5], and the individual groves vary in size from 1–1620 ha. The smallest and most northern grove, the Placer Grove, contains only six trees and is probably inbred [7,8,9]. Its propagules have demonstrated consistently poor performance in provenance trials [8]. The eight discontinuous northern groves are separated by as much as 90 km and spread over 310 km of the north-to-south range, though occupying a fraction of the total grove area (≤600 ha). The central and southern groves form a more continuous belt within a distance of 110 km with a maximum distance between groves of 7 km [10]. The central and southern groves comprise the majority of the grove area, at over 13,000 ha. Though genetic variation by heterozygosity tended to increase with decreasing latitude, the southernmost Deer Creek propagules have also demonstrated consistently poor performance in provenance trials [8]. The Deer Creek Grove with 30 large living trees, has a small native population, but evidence strongly suggested that inbreeding was not occurring within this grove [8].
In its current fragmented distribution, giant sequoia could be vulnerable to extreme shifts in environmental conditions [11]. Though past studies have indicated that giant sequoia grove boundaries have been stable for the last 500–1000 years [12,13], increased tree mortality is predicted throughout the Western United States due to a rapidly warming climate and increasing drought stress in the Sierra Nevada [14,15]. Though there is historical data indicating that giant sequoia has expanded and contracted its range since the last glacial maximum in response to climate shifts [16,17], it is unlikely that, during this current period of climate change, it will have time to migrate to safe sites [18,19].
Untested observations in the native groves and in field plantings of giant sequoia have noted several form traits that may be heritable, i.e., passed from parent tree to offspring. These traits may pose challenges to the efficient harvesting and milling of logs leading to poor recovery of milled timber. Of particular interest is giant sequoia’s tendency to exhibit fluting, asymmetry, and basal swelling of the lower stem as well as epicormic sprout formation and low height–diameter ratio. The presence of these traits may lead to a decrease in wood volume for milling (basal swelling, fluting, and stem taper) or defects of the wood, such as knot formation (epicormic sprouting) or wood rot (fluting). These traits are likely strongly influenced by environmental factors, such as spacing among trees and crown position in the canopy. However, identifying the influence of genetic sources of variation in these traits is of ecological interest and of concern to land managers who may want to plant giant sequoia for wood production. If specific native groves or regions of grove origin can be identified that express more favorable tendencies in these traits, then the losses in wood volume or growth efficiency associated with negative expressions of these traits may be avoided. Conversely, a population with greater expression of these distinctive traits may become a conservation priority. There has been little published information addressing these traits in the giant sequoia.
Fluting is a trait expressed in many forest trees in which slower diameter growth of certain areas of the stem results in a pinching or inward folding of the stem. This phenomenon may be caused by differential stimulation of the cambium due to environmental factors such as crown position or it may be a genetic trait of the species. Fluting reduces the amount of recoverable wood volume in a butt log, since flutes may extend deep into the log, exaggerates taper, and can make logs hard to stack or handle [20]. In giant sequoia trials planted in Beaumont, New Zealand, fluting depth was greater in trees with larger diameters at age 26 [21]. Trees with deeper flutes also had a greater incidence of heart rot in the Beaumont trials, necessitating the culling of up to one meter of the butt log prior to milling.
Basal swelling describes a distinct increase in the rate of taper in the lower portion of the stem. It is thought to be a genetic trait and has been observed in many giant sequoia planted in Europe. Unlike the closely related Sequoia sempervirens (D.Don) Endl. (coast redwood), which maintains a fairly consistent tapering of the lower stem, many young giant sequoia demonstrate a swelling or flaring within the first one to two meters of the lower stem above the ground [22]. Basal swelling is considered a defect for wood production, as the swelling comprises wood volume that may not be recovered at the sawmill. Observations of giant sequoia planted singly in parks have noted pronounced basal swelling of the lower bole. Many planted giant sequoia, especially in Europe, originated from the North Calaveras grove, the site of the first scientific description of the species by European-Americans in 1853. This leads to the question of whether there is variation in this trait among the native groves or whether it is characteristic of the species. There are no known published data comparing the degree of basal swelling exhibited among propagules originating from a range-wide sample of the native groves.
Epicormic sprouting in giant sequoia is common, though less common than in the closely related coast redwood [22]. Epicormic sprouting is assumed to be a response to a reduction in photosynthetic area or increased bole exposure to solar radiation or heat [23]. It may be an adaptation to allow rapid replacement of lost foliage and regain photosynthetic area following damage to the crown or the pruning of branches. In a study on the early growth of giant sequoia in a common-garden trial at Foresthill, California, there was a trend of increased incidence of epicormic sprouting in giant sequoia originating from more southern native grove origins [8]. In trials planted at the University of California Berkeley’s Blodgett Forest Research Station near Georgetown, California, more severe pruning intensities led to an increase in epicormic sprout formation [24].
In addition to its great size and longevity, there is growing interest in planting giant sequoia on timberlands in California [25] due to its decay-resistant heartwood, which is similar in quality to coast redwood [26]. This potential for timber utilization coupled with its limited genetic resources, makes it a prime candidate for planting outside of its current range for the dual purpose of timber utilization and conservation [25]. Wood properties are often highly heritable [27]. However, there are no known published data comparing the decay resistance of heartwood among giant sequoia originating from different native groves.
The objective of our study was to quantify differences in performance and morphology within a range-wide sample of giant sequoia propagules planted in a pure stand (monoculture) and intermingled in an intimate mixture with five co-occurring mixed conifer species in two common-garden trials at Foresthill, California. After 29 growing seasons, the propagules had experienced a wide range of climate years and were of a size where distinctive morphological characteristics were being expressed to a degree that assessment was possible. Identification of geographic or genetic variation in the growth and morphological traits of giant sequoia planted at Foresthill would inform seed collection for timber-production objectives. If among-grove variation in the morphological traits that are related to timber defect is prominent, certain native groves or regions could be avoided as seed sources. It will also help guide genetic conservation efforts by identifying specific native groves or regions of origin that exhibit distinctive morphological traits or unique attributes worthy of preservation or propagation. Therefore, we sought to answer the following research questions. (1) How do giant sequoia performance and morphology vary according to grove of origin at our warm low-elevation study site? (2) Does performance and morphology differ when planted in pure stands vs. mixed with common conifer associates? (3) How does the performance of planted seedlings and clonal stock compare? (4) Does heartwood decay resistance in cut stumps vary according to grove or region of origin?

2. Materials and Methods
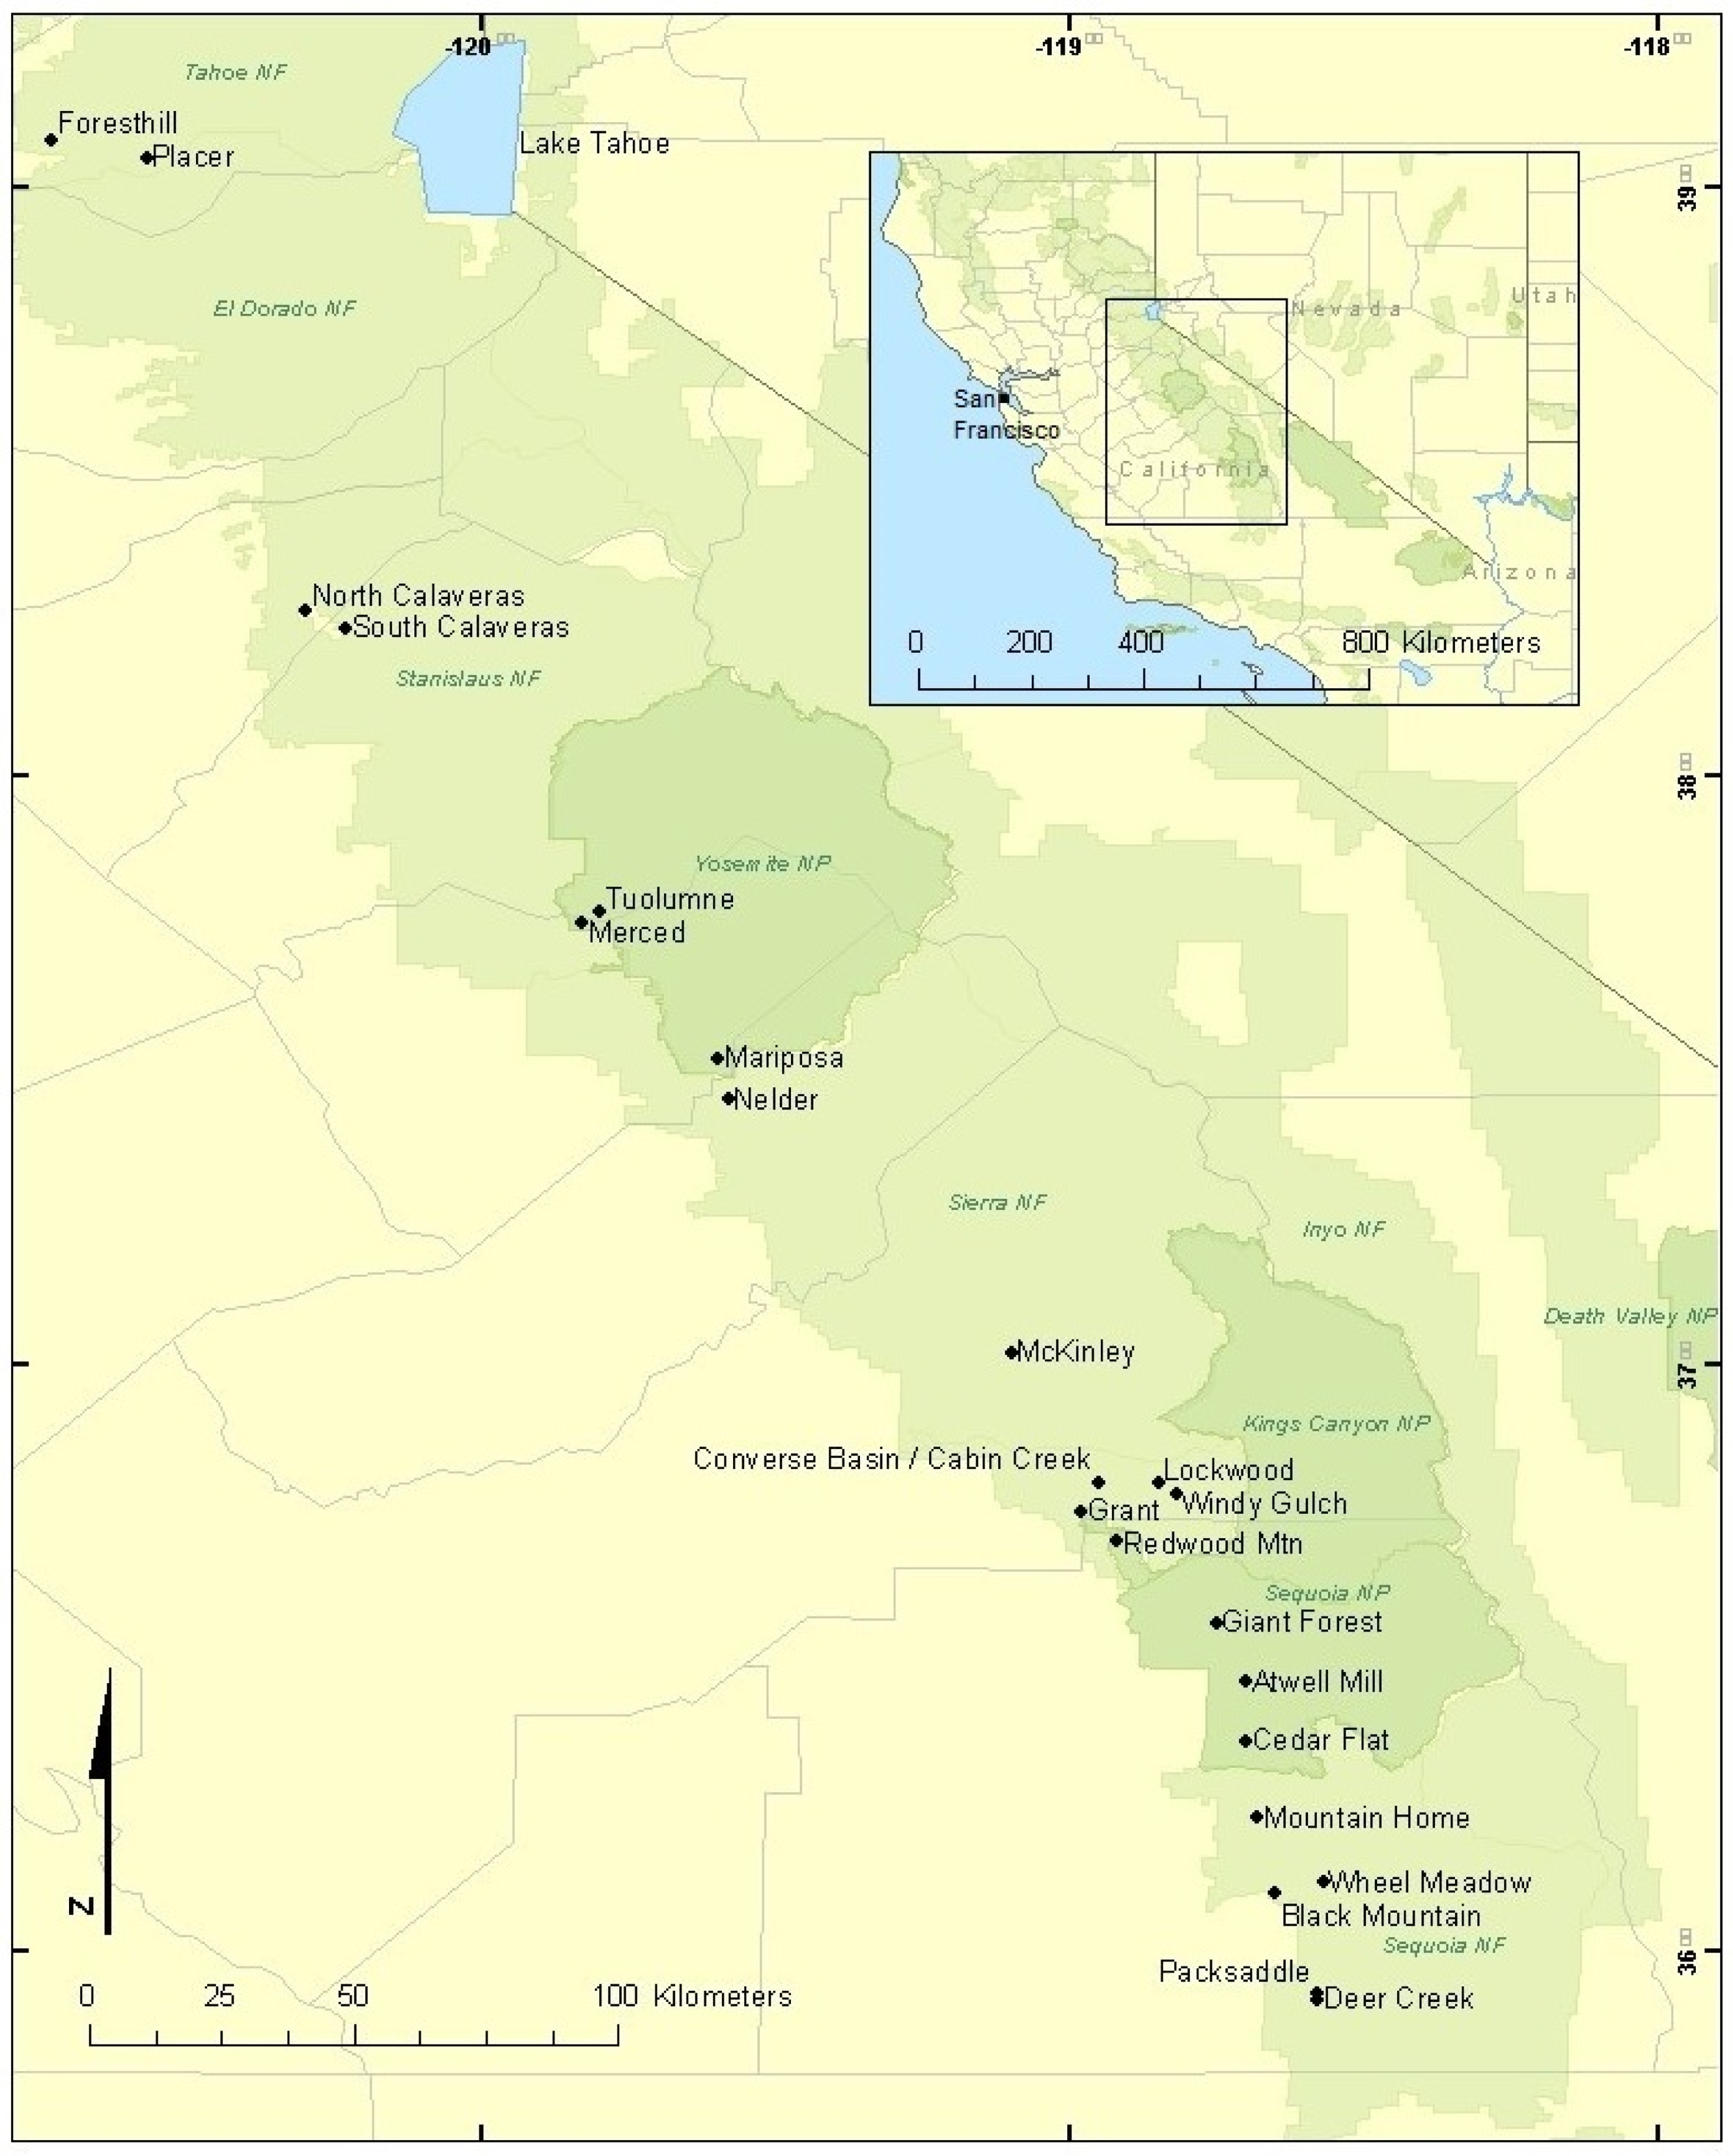
2.1. Study Site

The giant sequoia common-garden trials were established in the spring of 1981 at the Foresthill Seed Orchard (FSO) on the Tahoe National Forest and have been maintained by the USDA Forest Service (USFS). The site is located 32 km east of Auburn, CA at 39°05′ N, 120°43′ W on the western slope of the Sierra Nevada range at an elevation of approximately 1250 m. The FSO study site is north of the northernmost limit of the current range of giant sequoia at Placer Grove (39°03′ N, 120°34′ W) (Figure 1). The study site is 150 m lower in elevation than the lowest elevation native grove with propagules planted at FSO, North Calaveras grove, and approximately 550 m lower than the absolute mean elevation of all native giant sequoia groves sampled at FSO (Table S1). The soils at FSO are characterized as Andesitic mudflow of the Ahart series on a ridgetop with a gentle west-facing slope.
Summaries of the climate data for the Foresthill Ranger Station, approximately eight km west of the plantation, indicated that mean annual precipitation at this nearby location was 1300 mm with a mean of 663 mm falling as snow each winter for the period 1980–2009 [28]. The mean depth of snowpack was approximately 25 mm for the months January–March [28]. In comparison to the subset of native groves sampled at FSO, the study site experiences a greater mean growing-season temperature and greater mean growing-season precipitation with the growing season defined as May–September [29] (Table S2). In this subset of native groves, annual precipitation, growing-season precipitation, and growing-season temperature all declined from north to south (Table S2). Annual precipitation at Foresthill, CA was greater than the more southern groves by 200–400 mm and approximately equal to the two northernmost groves in Table S2.

2.2. Seed Collection and Creation of Cloned Sets

Giant sequoia seeds were collected from each of 23 of the 75 named native groves currently recognized by Save-the-Redwoods League in a range-wide seed collection in the summer and autumn of 1974–1976. The 23-grove sample collection sampled the north-to-south range of the species, including all eight of the disjunct northern native groves (Figure 1, Table S1). In each native grove sampled, seed was collected from cones that were clipped by squirrels and had fallen to the ground. Each cone was collected at distances of >100 m from the previously collected cone to ensure that each cone came from a different parent tree. One cone per sampled location was used to reduce the unknown double-sampling of families from collecting cones that may share the same female or pollen parent. This method was used in all but Placer Grove, where so few trees were present and producing seed that shooting cones from trees was the only way to ensure that each cone collected came from a different parent tree [30]. Each sampled cone in a grove location constituted an open-pollinated (o-p) family.
Propagules were vegetatively produced from each of a sample of germinated seedlings by rooted cutting, henceforth known as stecklings. Ideally, each seedling donor tree, or ortet, provided four steckling ramets, which together constituted a clone. Two ramets of each clone were then randomly deployed in both trial 1 (pure giant sequoia) and trial 2 (mixture). In establishing the FSO trials, equal numbers of two-ramet clones per o-p family, and of o-p families per grove were desired but not achieved. This was due to a variation in the numbers of families originally sampled from the groves, varying germination histories of these families in the nursery, and differential survival of ramets per ortet during rooting and post rooting in the greenhouse. In order to meet an acceptable minimum number of clones-per-family and families-per-grove, data from samples of the Cedar Flat and South Fork groves, which are adjacent to one another in the native range, were treated together as one “grove” sample [31]. The Black Mountain I and II grove samples originated from the same geographic native grove and were split into two grove samples due to a high number of available and surviving stecklings.

2.3. Experimental Design and Planting History

Trial 1 was designed to investigate variation among giant sequoia populations in a pure-stand planting covering approximately 2 ha. At the time of planting, the population samples consisted of 299 clones from 144 open-pollinated (o-p) families from 23 grove samples (i.e., populations) planted in 63 single- and 472 double-planted locations with 1007 total stecklings (i.e., rooted cuttings).
The planting design of FSO trial 1 was a hexagonal interlocking design made up of three internal sets [32]. Trees were planted at 3 m triangular spacing with each tree surrounded by six neighbors at equal distances, forming a hexagonal pattern (Figure S1). The steckling grove samples comprised Set A of the three interlocking internal sets and were planted in even-numbered rows. The stecklings had been raised to field-ready conditions at the University of California’s Russell Research Station in Lafayette, CA. The other two internal, Sets B and C, were systematically planted in odd-numbered rows. Half of Sets B and C were planted with USFS seedlings collected from six native groves, hereafter referred to as seedling grove samples: North Calaveras, Redwood Mountain, Giant Forest, Cedar Flat, Garfield, and Mountain Home. The seedling grove samples were raised at the USFS tree improvement center in Chico, CA. The other half of Sets B and C were planted with eight “standard” clones from six native groves, hereafter referred to as standard clones: two each from Merced and Cedar Flat, and one each from North Calaveras, Windy Gulch, Grant, and Mountain Home groves. These standard clones were random multiple-ramet clones produced vegetatively as stecklings from Lauren Fins’ 23-grove seed collection prior to the steckling population samples as rooting techniques were being refined near the west coast of California, first at the McGill Tract in Albany, California and, then, at the Russell Research Station near Lafayette California. Each steckling grove sample tree within the hexagonal planting pattern at FSO thus had as nearest neighbors first six and later three random giant sequoia drawn from the six seedling grove samples and the eight standard clones for a pure planting.
Two border rows consisting of 278 locations were planted to minimize the environmental edge effects. The border rows were composed of giant sequoia seedlings, standard clones, and population-sample stecklings and were not included in the reported analyses. Including seedlings, standard clones, and border rows, a total of 1890 locations were planted at an initial density of 945 stems per hectare.
At the time the FSO trials were planted, it was thought that a giant sequoia tree could be transplanted to replace a dead giant sequoia at another location within the experimental site and still be included in the eventual analysis. The mostly anecdotal information on the early growth of giant sequoia at that time suggested that growth tended to “check” (i.e., produce negligible above-ground growth) for several years upon planting before beginning a period of rapid growth. This was not the case at FSO and led to many disqualified individual trees in both trials due to abnormally slow growth following transplanting. Most locations were double planted with identical propagule types as insurance against expected mortality. Trees that were transplanted from a double-planted location to replace mortality at locations where both trees died were not included in summaries and analyses. This is an indication of the lack of data-based information available on germination and early growth prior to the seed collection, nursery experiments, and field trials established using propagules from the 23-grove seed collection planted at FSO. In the event that both propagules survived the first planting season, the individual in the northern planting location was analyzed for growth characteristics, and the southern individual was transplanted or culled.
Trial 2 was designed to investigate the growth of giant sequoia steckling population samples in a mixed-conifer setting. As in trial 1, the planting design was a hexagonal interlocking design made up of three internal sets with trees planted at 3 m spacing. Trial 2 covered a smaller area than trial 1 at approximately 1.5 ha. The internal Set A was made up of the giant sequoia steckling grove samples raised at the Russell Research Station. At the time of planting, the population samples consisted of 229 clones from 84 families from 22 grove samples planted at 451 locations spread throughout the trial. The 22 steckling grove samples were the same grove samples planted in trial 1 with the exception of the Deer Creek trees, for which the minimum number of two clones from two families was not available.
Interplanted with Set A, Sets B and C were seedling samples of giant sequoia (Garfield grove sample) and five mixed-conifer species typical of native giant sequoia groves. The mixed conifer seedlings included Abies concolor (Gordon) Lindley ex Hildebrand (white fir), Calocedrus decurrens (Torr.) Florin (incense cedar), Pinus lambertiana Douglas (sugar pine), P. ponderosa Douglas ex C.Lawson (ponderosa pine), and Pseudotsuga menziesii (Mirbel) Franco (Douglas-fir). The mixed conifer seedlings were of local provenance (Foresthill, zone 525.40) with the exception of the incense cedar seedlings, which were from a provenance test [33]. Two border rows were planted with these mixed-conifer seedlings and with giant sequoia seedlings from the Redwood Mountain grove. As in trial 1, the border-row trees were not included in the statistical analyses that follow. The total number of planted locations in trial 2, including border rows, was 1650 for an initial planting density of 1100 stems per hectare.

2.4. Nursery Effect and Thinning of the Trials

Thinning a decade after planting in 1991 (when the mean stem diameter at 1.37 m breast height (DBH) of giant sequoia in trial 1 was 12.4 cm) reduced competition in the trials at FSO. Thinning removed primarily giant sequoia seedlings and standard clones in Sets B and C in trial 1. In trial 2, the thinning partially removed mixed conifer seedlings. In the early years of growth, giant sequoia steckling growth in both trials lagged behind that of the giant sequoia and mixed conifer seedlings. This lag in steckling growth was attributed to a nursery effect experienced by the steckling grove samples raised at the Russell Research Station close to the Pacific coast. In order to prevent this nursery effect from confounding the FSO steckling data, the trials were divided to limit competition between the stecklings and the generally taller giant sequoia and mixed conifer seedlings. Thinning in 1991 removed approximately one third of the trees in trial 1 and trial 2.
A second thinning in 1999 (after the mean DBH of giant sequoia in trial 1 had surpassed 20.4 cm, as measured in 1997) divided both trials into two experiments within each trial, respectively. One experiment in each trial was dedicated to a pure steckling population-sample study for the analysis of growth, genetic architecture, and patterns of geographic variation in stecklings. In trial 1, this study occupied approximately 75% of the trial area, while the southern 25% became a pure giant sequoia seedling study comprising six grove samples to investigate among-grove differences in performance and morphology. The remaining “standard” clones in trial 1 were confined to border rows. After thinning in 1999 in trial 1, there remained 477 giant sequoia trees for a stand density of 239 stems per hectare. In trial 2, thinning in 1999 divided the trial so that the pure steckling grove sample study occupied approximately 50% of the eastern portion of the trial. The other 50% remained a mixed conifer planting with giant sequoia seedlings from the Garfield grove sample growing in a mixture with the five mixed conifer seedlings to investigate competitive effects within this mixed-species planting. After thinning in 1999, in trial 2 there were 463 trees remaining for a stand density of 308 stems per hectare.
In addition to differences arising from propagation in different nurseries, factors with the potential to confound the results from genetic experiments include differences in spacing unbalancing neighbor competition, uneven effects of competing vegetation, and disturbances or treatments that have an unequal impact on the development of trees. With some exceptions, the thinning treatment preserved approximately even spacings among residual trees, except in trial 1, where a note was made of suspected competition with large trees outside of the fenced experiment. In the years since the last thinning, the FSO trials have been kept free of competing vegetation by the USFS. All surviving trees have been pruned to approximately 2 m above ground level or half of the tree’s height if the tree height was ≤4 m.

2.5. Data Collection and Calculations

In the summer of 2009, measurements were made on all live trees in both trials for height (HT09) in meters (m) and stem diameter (DBH09) in centimeters (cm). In trial 1, measurements were made on 477 giant sequoia trees of which 296 were steckling grove samples with 257 in interior locations and 39 border trees; 100 were seedling grove samples; and 81 were standard clones. In trial 2, measurements were made on 463 trees, of which 283 were giant sequoia including 150 steckling grove samples in interior locations and 133 seedling samples with 37 in interior locations. The other 180 trees were mixed-conifer seedlings of five species with 127 in interior locations.
In addition to 2009 data, individual tree height (HT) data were available from previous measurement years in 1981 (HT81), 1983 (HT83), 1988 (HT88), 1991 (HT91), and 1997 (HT97). Stem diameter (DBH) data were available from measurement years in 1991 (DBH91) and 1997 (DBH97). These past data allowed for a comparison of tree sizes at FSO over 29 growing seasons.
Using this individual tree HT and DBH data, two additional variables were calculated in order to describe tree size, the conic stem-volume index (VOL) in cubic meters (m3) and the height-to-diameter ratio (HDR) for measurement years 1991, 1997, and 2009. Equations for these derived traits follow:
VOL i = π × ( DBH i / 200 ) 2 × HT i / 3
HDR i = HT i × 100 / DBH i
In each equation, the HT and DBH values are individual tree values for the ith tree.
In addition, we assessed giant sequoia trees for five tree-form traits, including fluting of the lower stem (FLUT), asymmetry of the lower stem (ASYM), basal swelling (SWEL), fullness of the live crown (FULL), and abundance of epicormic sprouts (EPI). Each trait was assessed on a four-point scale from 0 to 3, where 0 was the minimal expression of the trait and 3 was the maximal expression of the trait, as observed.
The lower stem-form characteristics were assessed on four-point scales while making allowances for size differences among the trees. Lower stem fluting (i.e., irregular grooves or furrows in the lower stem) was assessed based on a combination of the number and depth of flutes with “0” being no incidence of fluting and “3” being more than 4 flutes or extremely deep flutes relative to the size of the bole. The asymmetry trait was defined as a departure from a circular or cylindrical cross section in the lower bole. A tree receiving a “0” had an approximately cylindrical stem, a “1” was slightly oblong, a “2” had at least one prominent buttress depending on severity, and a “3” was nearly flat on one side and round on the other like a half moon or had other severe departures from a circular lower-bole cross section. Basal swelling was assessed as the departure from taper in the lower portion of the stem with “0” being a continuation of taper (i.e., no swelling), “1” and “2” indicating either a relatively small or large increase in the rate of taper, and “3” being an abrupt swelling or major increase in the rate of stem taper (resulting in stem-diameter increases of ≥50% of the stem diameter from top to bottom of the swollen portion of the stem) within one meter of ground level.
For the assessment of crown fullness, the four-point scale varied from “0”, a tree with a sparse crown confined to extremities of branches, to “3”, a tree with a full and dense crown with little to no light passing through the combined branches to the observer. Epicormic sprouts were counted on the lower stem below the live crown and each tree was assigned a value from 0 to 3 depending on the number of sprouts. A tree receiving a “0” had no epicormic sprouts, a “1” had 1–3 epicormic sprouts, a “2” had 4–6 epicormic sprouts, and a “3” had >6 epicormic sprouts on the pruned portion of each stem to a height of two meters above ground level.
In 2010, we evaluated the heartwood decay resistance of stumps of giant sequoia seedlings and standard clones thinned in 1999 within trial 1. There were 188 seedling stumps from all six seedling grove samples and 119 stumps of standard clones from all eight standard-clone grove samples thinned in 1999 and available for assessment. After 11 years of growth before thinning in 1999, these thinned stumps were large enough that heartwood development had occurred and could be assessed for decay resistance. The eleven years since thinning at the time of assessment in 2010 allowed sufficient time for decay to occur, and, yet, these had not disintegrated.
Heartwood decay resistance was assessed on a four-point scale varying from “0” for heartwood that was mostly decayed, “1” for heartwood that had large amounts of decay with some resistance, “2” for heartwood with small amounts of decay that was mostly resistant, to “3” for heartwood that was structurally sound with minimal decay. Only stumps that were in their original planting location based on the trial 1 map were evaluated. This meant that no loose stumps or stumps that had been uprooted were evaluated.
In summation, we collected data for analysis of ten growth, form, and heartwood decay resistance characteristics in 2009 and 2010: HT, DBH, VOL, HDR, FULL, EPI, FLUT, ASYM, SWEL, and heartwood decay resistance of thinned stumps. Each trait was calculated on an individual tree basis with summarized means for grove sample, region, grove-size category, planting-stock type, and trial based on unweighted means of individual tree values.

2.6. Analysis

At the time of data collection in 2009, there were 257 stecklings from 23 grove samples in trial 1 and 150 stecklings from 22 grove samples in trial 2 planted in interior locations within the trials. Data for trees that had confounding events in their nursery or plantation history were removed from the sample along with any trees with visible defects such as broken tops. A group of five stecklings on the east side of trial 1 were very small and likely had depressed height growth from competition with large oaks planted along the adjacent road. After the removal of these disqualified trees from the sample, the total number of steckling population samples consisted of 237 stecklings from 23 grove samples in trial 1 (averaging 10 stecklings per grove; range 2–19) and 124 stecklings from 22 grove samples in trial 2 (averaging 6 stecklings per grove; range 2–11). Due to past findings regarding the unusual growth of the Placer and Deer Creek grove samples [8], we reported their means but excluded all data for these trees from the majority of statistical analyses. This resulted in 21 grove samples per trial consisting of individual tree growth and form data for 227 and 119 stecklings in trial 1 and trial 2, respectively, for a total of 346 stecklings across the two trials.
Descriptive statistics and significance tests depict differences among trials, grove samples, or propagule types as a percent of the grand mean. Here, the standard error bars were relative standard errors (RSE) calculated by dividing the standard error of the group mean by the group mean and multiplying by 100 to express RSE as a percent of the group mean. We conducted all statistical analyses with R statistical software (R Core Team, Vienna, Austria, https://www.r-project.org/).

2.6.1. Comparison of Giant Sequoia Seedlings and Stecklings

The trial 1 giant sequoia seedling grove sample data consisted of 79 seedlings from six grove samples. We used one-way ANOVAs to test for significant differences among the seedling grove samples. In addition, we analyzed the five giant sequoia seedling grove samples and corresponding steckling grove samples for significant differences between the two types of planting stock for all assessed traits. These analyses included seedlings and stecklings from the North Calaveras, Redwood Mountain, Giant Forest, Cedar Flat/South Fork, and Mountain Home grove samples for a sample size of 68 seedlings and 63 stecklings. There were no stecklings planted from the Garfield grove, so we excluded the Garfield seedling grove samples from the analysis data. We used the nonparametric Kruskal–Wallis test for significant differences among planting stock because the steckling and seedling data did not meet the assumptions of normally distributed residuals and homogeneity of variance required for ANOVA.

2.6.2. Giant Sequoia Seedlings in a Mixed-Species Planting

In the mixed-species half of trial 2, there were 32 giant sequoia seedlings and 112 mixed conifer seedlings of five species in the analysis data. Data were available for summary and analysis of height in 1983 and 1986 and of all measured tree-size traits for three measurement years in 1991, 1997, and 2009. There were no form trait assessments made on the five co-occurring mixed conifer species for comparison with giant sequoia seedling form data in trial 2.
We tested for significant differences among the species using one-way ANOVAs for all measured size traits for each of the 3–5 measurement years. If statistically significant differences were detected among species, we used the Tukey honest significant differences test (TukeyHSD) to perform multiple comparison tests between individual species within the group. Residual plots were examined to assess assumptions of normality and homogeneity of variances. We used the Shapiro–Wilk test for the normal distribution of residuals and the Fligner–Killeen test for homogeneity of variances among species groups [34]. If either of these failed, we used the Kruskal–Wallis test, which is the nonparametric equivalent of a one-way ANOVA.

2.6.3. Heartwood Decay Resistance

We used ANOVA to test for differences among giant sequoia seedling grove samples and among giant sequoia standard-clone stumps thinned in 1999 in independent analyses. The ANOVAs also tested the significance of the region (north, central, and south) of the giant sequoia seedling sample and standard-clone sample native grove origin on the heartwood decay resistance of the thinned stump samples.
The seedling stumps allowed for an assessment of the significance of variation among giant sequoia grove sample origins for heartwood decay resistance. The standard-clone stumps allowed for an estimation of variation in heartwood decay resistance among and within the eight standard clones.

3. Results

3.1. Performance and Morphology of Steckling Grove Samples

The mean size and form traits of stecklings differed between the two trials, but the same grove samples in each trial performed best. Placer and Deer Creek were the worst-performing grove samples.

3.1.1. Trial 1 Steckling Tree-Size Traits after 29 Growing Seasons

There were statistically significant differences in mean HT09 among steckling grove samples (p ≤ 0.03; df = 20; n = 227) after 29 growing seasons. The mean steckling grove sample HT09 varied from a low of 6.2 m for Placer (s.d. = 2.1 m) and Deer Creek (s.d. = 3.4 m) grove samples to a high of 12.0 m (s.d. = 3.1 m) for the Mountain Home grove sample. The overall grove sample mean HT09 was 9.9 m (s.d. = 2.8 m) (Table 1).
The mean steckling diameter (DBH09) after 29 growing seasons was less variable than HT09 with a coefficient of variation (CV) of 24% compared to a CV of 29% for HT09 (Tables S3 and S4). The mean steckling grove sample DBH09 varied from a low of 14.8 cm (s = 3.9 cm) in the Placer grove samples to 33.8 cm (s.d. = 6.8 cm) in the Mountain Home grove samples. Mountain Home stecklings exceeded the trial 1 steckling mean DBH09 by 28% (Table S4; Figure S3) and were 20% greater than the second-ranked Converse Basin stecklings.
The mean conic stem volume varied more after 29 growing seasons (VOL09) than HT09 or DBH09 with a CV of 71%. Steckling grove sample means varied from a low of 0.04 m3 (s.d. = 0.03 m3) in the Placer grove samples to 0.41 m3 (s.d. = 0.27 m3) in the Mountain Home grove samples. The trial 1 steckling grove sample mean VOL09 was 0.21 m3 (s.d. = 0.15 m3). The mean VOL09 of the Mountain Home steckling grove samples was 195% of the steckling mean. Giant Forest ranked second for mean VOL09, at 133% of the mean, but only third in HT09 and fifth in DBH09. The Converse Basin grove samples ranked third in VOL09 at 129% of the mean (Table S4; Figure 2).
The Mountain Home steckling grove sample ranked first in the three assessed size traits. The difference between first-ranked Mountain Home and second-ranked Converse Basin grove samples was greatest in DBH09 and VOL09. This suggested that growing space availability and neighborhood competition effects varied as a result of uneven growth and thinning in trial 1. The tallest and largest individual steckling was from the Mountain Home grove sample with VOL09 of 1.03 m3, nearly 500% greater than the mean. This tree was on the edge of a sizable gap with the nearest neighbor a North Calaveras steckling with VOL09 only one percent of the steckling mean. Two other large stecklings were nearby on the edge of this gap, another Mountain Home steckling and a Black Mountain 1 steckling.
Most steckling grove samples contained individual trees well below the steckling mean VOL09 (Table 1). The CV for this trait was the largest of the size traits at 71% (Table S4). Notably, the minimum volume of an individual steckling in both the Mountain Home and Converse Basin grove samples was 0.14 m3, which exceeded or equaled the mean VOL09 of the four grove samples with the smallest means: Placer, Merced, Cedar Flat/South Fork, and Deer Creek. The smallest individual tree from the third-ranking Giant Forest grove sample was 0.04 m3, which equaled the mean of the lowest-ranked Placer grove sample (Table 1).
The poorest performing steckling grove samples for tree-size traits were from the Placer and Deer Creek grove samples. These groves are geographically at the north and south range limits, respectively. These grove samples ranked 22nd or 23rd for all three tree-size traits, with a mean VOL09 of Placer grove samples at 19% and Deer Creek at 38% of the overall mean (Table S4; Figure 2).

3.1.2. Trial 1 Steckling Growth over 29 Growing Seasons from 1981 to 2009

There were notable rank changes in the steckling grove sample rankings for HT over 29 growing seasons. These rank changes occurred primarily in the early growth of the trial prior to the first thinning in 1991. Following the thinning in 1991, ranks of grove sample mean HT were generally stable (Table S3). Differences in HT among grove samples were not significant in any measurement year until HT09 (p ≤ 0.05).
After one growing season, Lockwood, Atwell Mill, and Windy Gulch ranked highest in HT81 (Figure S4). The Atwell Mill and Windy Gulch grove samples had the highest native grove elevations of all the grove samples (Table S1); however, elevation was weakly correlated with HT81 (rs = 0.06) and HT09 (rs = 0.06). The grove samples that were tallest in HT09, and Mountain Home and Converse Basin, ranked 20th and 8th in HT81, respectively. First-season height was moderately correlated with year-29 height (rs = 0.24; p ≤ 0.001).
After three growing seasons, HT83 was strongly correlated with HT09 (rs = 0.61; p ≤ 0.0001). All three top-ranking HT09 grove samples ranked in the top third in HT83 and were above the steckling mean (Figure S5). The Wheel Meadow grove sample ranked first in HT83 and ranked in the top half of the grove samples through the 29th growing season. After 11 growing seasons, the top three grove samples in HT91 (Figure S6) were the same as in HT09 (Figure S2) and the two measurement years were strongly correlated (rs = 0.79; p ≤ 0.0001). Following thinning, the HT ranks were more stable (Table S3).
In the first measurement year, DBH data were recorded; the McKinley grove sample ranked first in DBH91 at 124% of the steckling mean, ahead of the Mountain Home and Converse Basin grove samples (Table S4). Black Mountain II ranked fourth in DBH91 at 113% of the steckling mean. Both McKinley, a north-region grove sample, and Black Mountain II, a south-region grove sample, lagged in DBH97 to 105% and 95% of the steckling mean, respectively. In DBH09, McKinley and Black Mountain II ranked 13th and 15th, respectively. McKinley ranked third in mean VOL91 at 131% of the steckling mean behind Mountain Home and Converse Basin. McKinley VOL97 decreased to 101% of the respective means for an eighth-place ranking. In VOL09, McKinley trees were 95% of the steckling mean for a 12th-place ranking. Mountain Home grove samples ranked first in mean VOL91, 97, and 09 (Table S4).
An example of rank changes in grove samples from close geographic proximity demonstrated the variability in steckling growth over 29 growing seasons. The North Calaveras and South Calaveras grove samples ranked eighth and ninth place in VOL91 at 112% and 110% of the steckling mean, respectively. The North Calaveras and South Calaveras native groves are separated by less than five miles in the northern region of giant sequoia’s native range. North Calaveras grove samples fell to 92% of the mean in VOL97 and then to 65% of the mean and a 19th place ranking in VOL09. South Calaveras grove samples moved up the rankings to sixth place in both VOL97, at 117%, and VOL09, at 114% of the respective trial 1 steckling means (Table S4).
Black Mountain I and II grove samples provided another demonstration of the variability in growth. These two grove samples share the same native grove within giant sequoia’s native range. The stecklings comprising these two grove samples were produced from seed collected in the same native grove. The stecklings were arbitrarily assigned to two grove samples due to abundant survival. These two grove samples exchanged rank positions between VOL91 and VOL09. Black Mountain I grove samples ranked 13th at 92% of mean VOL91, while Black Mountain II ranked sixth at 116% of mean VOL91 (Table S4). In VOL09, Black Mountain I ranked seventh at 110% of the steckling mean, and Black Mountain II grove samples were 90% of the VOL09 steckling mean, ranking 14th (Table S4).

3.1.3. Trial 1 Steckling Height–Diameter Ratio from 1991 to 2009

After 29 growing seasons, the mean height–diameter ratio (HDR09) of stecklings was 37.4 (s.d. = 5.3) (Table 1). The grove sample with the largest mean HDR09 was Black Mountain II (µ = 42.2; s.d. = 3.5) and the lowest was Merced (µ = 31.1; s.d. = 3.4) (Table 1). Trial 1 HDR09 was less variable than HT09, DBH09, or VOL09 with a CV of 14%. Trial 1 HDR09 was moderately positively correlated with VOL09 (rs = 0.33; p ≤ 0.001). An example of this weak correlation between HDR09 and VOL09 was provided by the contrasting HDR09 for the largest grove samples by mean VOL09. The Mountain Home grove sample with the largest mean VOL09 had a mean HDR09 six percent below the mean, ranking 16th. Giant Forest and Converse Basin, ranking second and third in VOL09, had mean HDR09s 5% and 9% greater than the mean, ranking fifth and third in HDR09, respectively (Figure S7). The two smallest grove samples by VOL09 also demonstrated contrasting different rankings for HDR09. Stecklings from the Placer grove sample had one of the highest mean HDR09s of 42, while Deer Creek stecklings had one of the lowest HDR09s of 33 with nearly equal mean HT09s for the two grove samples (Table 1).
The height–diameter ratio decreased with age. Mean HDR91 was 43.6 (s.d. = 14.9) with a CV of 34%. The mean HDR97 was 36.5 with a CV of 19%. In nonparametric statistical tests of trial 1 stecklings (df = 20; n = 227), the differences among grove samples were statistically significant for HDR97 (p ≤ 0.05) and HDR09 (p ≤ 0.001).
The mean HDR91 of Mountain Home and Converse Basin trees ranked in the bottom quarter of trial 1, at 87% and 91% of the mean, respectively, while the Giant Forest HDR91 was approximately equal to the mean. The correlation of HDR91 with VOL91 (rs = −0.86; p ≤ 0.001) and VOL09 (rs = −0.48; p ≤ 0.001) was strongly negative, indicating larger stecklings were stockier.

3.1.4. Trial 1 Steckling Form Traits after 29 Growing Seasons

In trial 1, there were statistically significant differences among steckling grove samples in mean basal swelling (SWEL) of the lower stem (p ≤ 0.01). Grove samples with the highest levels of SWEL were Cedar Flat/South Fork (µ = 140%; CV = 25%), Merced (µ = 138%; CV = 41%), and North Calaveras (µ = 123%; CV = 38%) (Figure S8). There were moderate levels of variation for this trait among the grove sample means (CV = 39%). Of the grove samples with the largest mean VOL09 in trial 1, Giant Forest (µ = 120%; CV = 22%) and Mountain Home (µ = 120%; CV = 32%) had an above-average SWEL, while Converse Basin (µ = 90%; CV = 35%) expressed lower levels of SWEL. Black Mountain I’s (µ = 92%; CV = 43%) mean SWEL was below the trial mean, while the mean SWEL in Black Mountain II (µ = 105%; CV = 40%) was greater than the mean (Figure S8). These grove samples were propagated from seed collected in the same native grove.
There was moderate statistical significance among steckling grove samples in the assessment of asymmetry (ASYM) of the lower stem (p = 0.06) (Figure S9). Cedar Flat exhibited the highest levels of ASYM at 164% of the steckling mean with no variation among individual stecklings. Each of the three stecklings in this grove sample exhibited the maximum lower stem asymmetry observed in trial 1. Most grove samples had an individual scoring the maximum value and the minimum value for this trait. Packsaddle (134%; CV = 33%), Converse Basin (125%; CV = 32%), and Redwood Mountain (124%; CV = 44%) grove samples expressed higher levels of ASYM. Placer (61%; CV = 88%), Windy Gulch (66%; CV = 91%), and Atwell Mill (76%; CV = 60%) grove samples exhibited the lowest levels of this trait. Asymmetry of the lower stem had a strong positive correlation with fluting (rs = 0.62; p ≤ 0.001) and a moderate positive correlation with DBH09 (rs = 0.25; p ≤ 0.01) and VOL09 (rs = 0.23; p ≤ 0.05) in trial 1.
Lower stem fluting (FLUT) of stecklings was highly variable within and among grove sample means (Figure S10). The CV among grove samples was 114% for this trait, and most grove samples had individual stecklings with high and low levels of FLUT. The two smallest grove samples by mean VOL09, Placer and Deer Creek, exhibited no FLUT. The grove samples exhibiting greater amounts of FLUT included two of the top-ranked groves by VOL09, Giant Forest (141%; CV = 104%) and Converse Basin (138%; CV = 68%). The Converse Basin grove samples had the lowest amount of variation in FLUT among all the grove samples exhibiting this trait. The fluting of the lower stem in stecklings was moderately and positively correlated to HT09 (rs = 0.36; p ≤ 0.01), DBH09 (rs = 0.41; p ≤ 0.01), and VOL09 (rs = 0.41; p ≤ 0.01) in trial 1.
Variation among grove samples in the fullness of the live crown (FULL) was moderate with CV = 54%. Grove samples from Grant (139%; CV = 22%), Mountain Home (125%; CV = 40%), and North Calaveras (123%; CV = 39%) ranked highest for FULL (Figure S11). Stecklings in the Deer Creek (29%; CV = 100%) grove sample from the native grove at the southern range limit had the lowest FULL in trial 1, while the Placer grove samples (99%; CV = 119%), from the native grove at the northern limit, expressed average FULL. Both of these grove samples had the greatest variation in this trait by CV.
The mean level of epicormic sprouting (EPI) among steckling grove samples was the most variable trait assessed with a CV of 207% (Figure S12). Differences in mean epicormic sprouting among steckling grove samples were statistically significant at alpha = 0.1. Five grove samples exhibited no incidence of epicormic sprouting, including three out of eight of the north-region grove samples: Placer, Merced, and Nelder. The grove samples with the greatest mean level of epicormic sprouting were Cedar Flat/South Fork (437%; CV = 115%), Deer Creek (328%; CV = 141%), and Packsaddle (268%; CV = 143%), from the south region. Epicormic sprouting among stecklings was weakly negatively correlated to DBH (rs = −0.23) and VOL (rs = −0.22), indicating that smaller trees tended to produce more epicormic sprouts. Demonstrating the great variability in this trait within grove samples, the Black Mountain I grove samples had no incidence of EPI, while Black Mountain II grove samples had above-average mean EPI (164%; CV = 214%). The stecklings in these grove samples originated from the same grove within the native range.

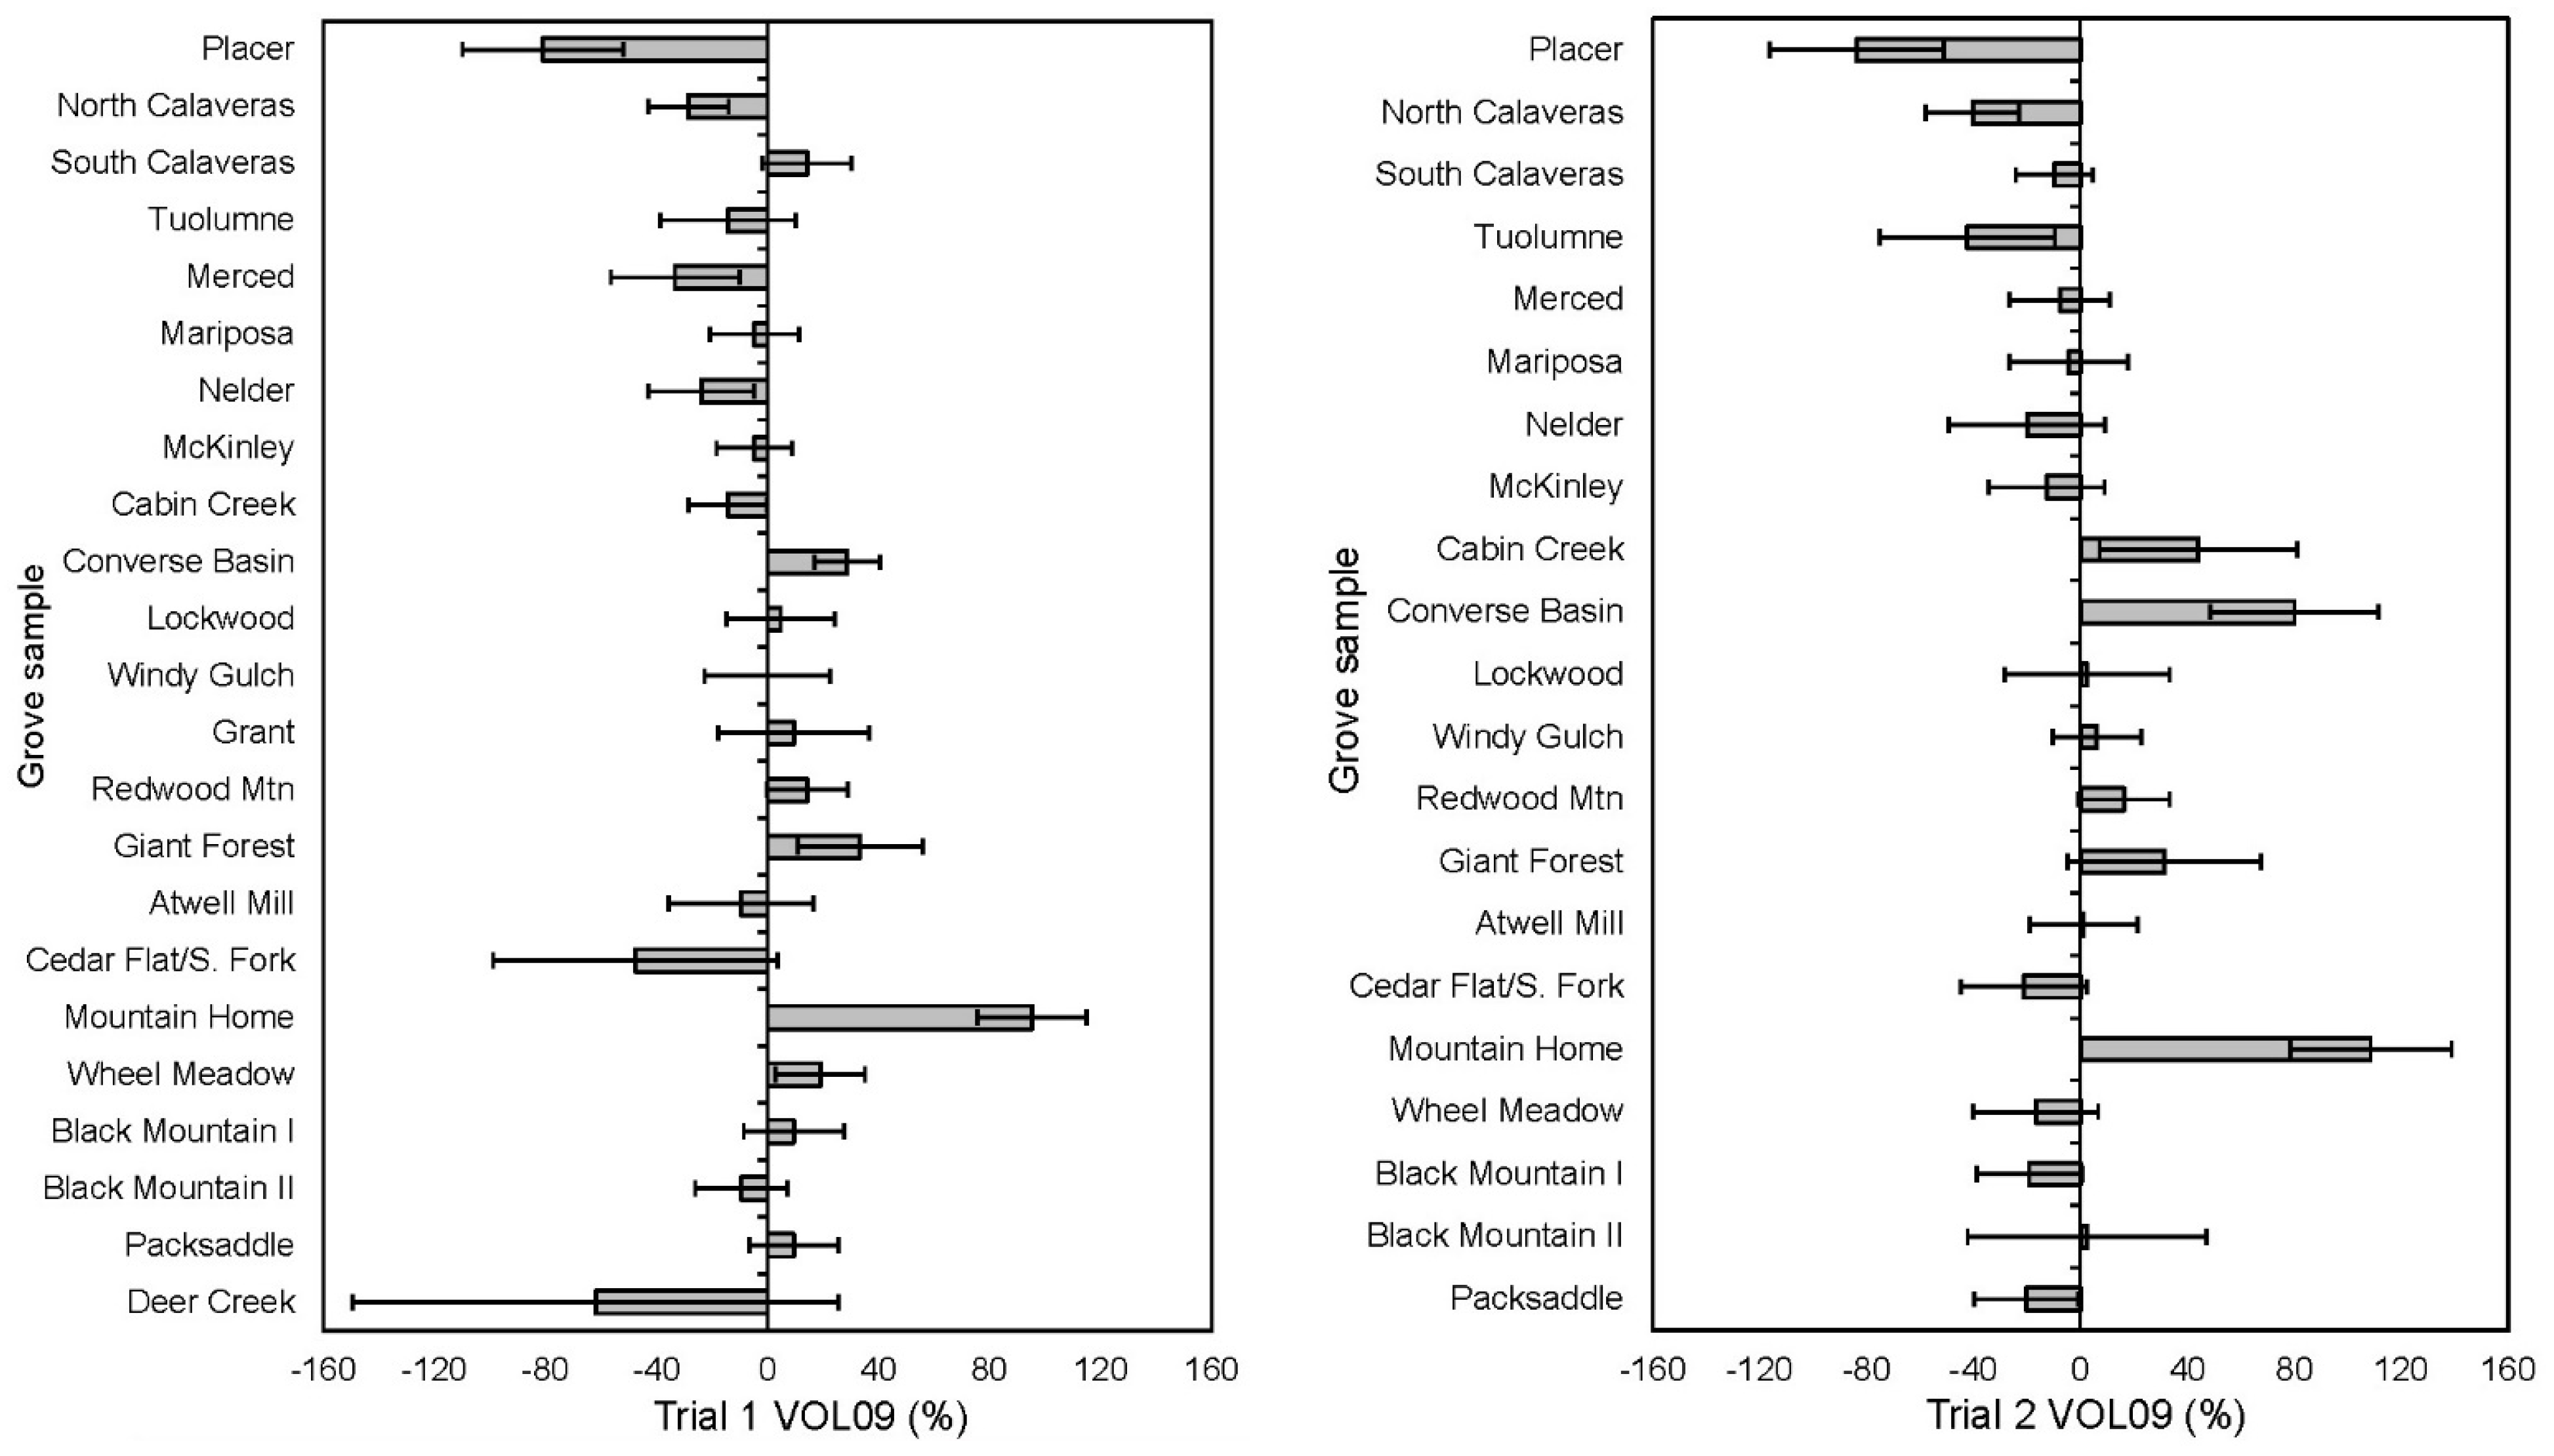
3.1.5. Trial 2 Steckling Tree-Size Traits after 29 Growing Seasons

After 29 growing seasons, in the block of trial 2 where stecklings were originally planted with mixed conifer neighbors subsequently thinned in 1999, the mean steckling height (HT09) was 11.5 m (s.d. = 3.4 m) (Table S5; Figure S13). The grove sample with the tallest mean steckling HT09 was Mountain Home at 14.3 m (s = 3.9 m) and the shortest was from the Placer grove sample at 6.3 m (s.d. = 1.9 m). The maximum individual steckling HT09 was in the Converse Basin grove sample at 19.9 m. The minimum steckling HT09 was 4.2 m in the Placer grove sample (Table S5).
The mean diameter (DBH09) and volume (VOL09) of stecklings were 26.1 cm (s.d. = 6.9 cm) and 0.24 m3 (s.d. = 0.20 m3), respectively (Table S5). Mountain Home grove samples had the largest mean DBH09 (35.5 cm; s.d. = 5.9 cm) and VOL09 (0.51 m3; s.d. = 0.31 m3). The mean VOL09 of the top-ranked Mountain Home grove sample was 209% of the trial 2 steckling mean (Figure 2). The minimum steckling VOL09 of the Mountain Home grove sample was 0.23 m3, nearly equal to the trial 2 steckling mean. The Converse Basin grove sample ranked second by mean VOL09 (0.44 m3; s.d. = 0.44 m3) at 180% of the mean with a large CV of 100% due to the influence of the largest individual steckling at 1.58 m3. This tree was 60% larger than the next largest steckling in trial 2, a Mountain Home steckling of 0.95 m3. The minimum individual steckling VOL09 in the Converse Basin grove sample was 0.06 m3, just 26% of the trial 2 steckling mean. The third-ranked grove sample by mean VOL09 was Cabin Creek (0.35 m3; s.d. = 0.26 m3) at 144% of the trial 2 steckling mean. The Cabin Creek native grove is in close proximity to giant sequoia’s native range in the Converse Basin native grove.
The Placer grove samples were the smallest stecklings at only 16% of the mean tree volume (0.04 m3; s.d. = 0.03 m3) (Table S5). The next poorest performing grove samples by mean VOL09 were the Tuolumne grove samples at 58% of the mean. Both North and South Calaveras grove samples had a mean VOL09 below the mean with South Calaveras performing the better of the two at 90% of the trial 2 steckling mean. The most southern grove sample planted was Packsaddle, which had a mean VOL09 of 80% of the steckling mean. Differences among steckling grove samples in tree-size traits were not statistically significant after 29 growing seasons.

3.1.6. Trial 2 Steckling Growth over Time 1981–2009

The best-performing steckling grove samples in terms of tree size were generally consistent throughout the six measurement periods from 1981 to 2009. As in trial 1, the largest and tallest steckling grove samples after 29 growing seasons were not among the tallest grove samples after one (HT81) and three (HT83) growing seasons (Table S6). Neither the Mountain Home nor Converse Basin grove samples were top ranked in HT83, but both had mean HT83s greater than the steckling mean at 101% and 105%, respectively (Figure S14). The correlation of HT83 with HT09 was weaker (rs = 0.49; p ≤ 0.001) than in trial 1.
After 11 growing seasons, Mountain Home was top ranked at 126% of mean HT91, and Converse Basin was third at 116% of mean HT91. Giant Forest grove samples, which ranked fourth by VOL09, were second ranked at 119% of steckling mean HT91 (Table S6; Figure S15). The Cabin Creek grove sample, third ranked by VOL09, had fast early height growth, ranking first in HT83 at 143% of the steckling mean (Figure S14). After 11 growing seasons, Cabin Creek’s mean HT91 was 114% of the mean, ranking fourth among steckling grove samples (Figure S15). During this same measurement period, the Packsaddle grove sample fell from second ranked at 118% of mean HT83 to 12th in HT91, approximately equal to the mean (Figures S14 and S15). The correlation between HT91 after 11 growing seasons and HT09 after 29 growing seasons was strong (rs = 0.82; p ≤ 0.0001) and comparable with the same correlation in trial 1.
Other notable rank changes occurred in mean conic stem volume from 1991 to 1997, following the thinning of trial 2 in 1991. Two north-region grove samples went from above the mean in VOL91 to below the mean VOL09. Mariposa grove sample stecklings ranked fifth in VOL91 at 143% of the mean, falling to seventh at 120% of the mean VOL97 and 11th at 96% of the mean VOL09. McKinley grove samples dropped from a VOL91 ranking of ninth at 107% of the mean to a ranking of 13th at 87% of the mean VOL09. Lockwood, a central region grove sample had the greatest increase in VOL from 1991 to 2009 in trial 2. Lockwood grove samples were 64% of the mean VOL91, ranking 19th and rising to 85% of the mean VOL97 and 102% of the mean VOL09 for an eighth-place ranking. Wheel Meadow dropped more gradually from the 11th rank in 1991 at 100% of the mean to 15th place in 2009, ranking at 83% of the mean VOL (Table S7). Differences among steckling grove sample HT, DBH, or VOL were not significant in any of the measurement years.

3.1.7. Trial 2 Steckling Height–Diameter Ratios from 1991 to 2009

The mean height–diameter ratio (HDR09) of steckling grove samples after 29 growing seasons varied from a low of 37.0 (s.d. = 1.4) for Merced grove samples to a high of 48.8 (s.d. = 5.7) for Windy Gulch grove samples (Table S5). The mean for all stecklings was 44.0 (s.d. = 7.2). In nonparametric tests, differences among grove samples in HDR09 (p = 0.09) were significant at alpha = 0.1 (Figure S16).
As in trial 1, HDR tended to decrease with advancing age. In trial 2, HDR was highest during crown closure after 11 growing seasons in 1991 at 46.5 (s.d. = 11.0) and lowest in 1997 at 40.9 (s.d. = 6.3) following thinning in 1991. As in trial 1, the correlation between HDR and VOL changed with age. Correlations of HDR91 with the corresponding VOL91 (rs = −0.56; p ≤ 0.0001) and later VOL09 (rs = −0.53; p ≤ 0.0001) were both strongly negative. Stecklings that were stockier at crown closure tended to have greater stem volume at age 11 and continued to produce more volume in subsequent growing seasons. After 29 growing seasons, the relationship between HDR09 and VOL09 was weakly positive (rs = 0.27; p ≤ 0.001) meaning that relatively slender stecklings generally had a larger stem volume in trial 2.
The two largest trial 2 grove samples by mean VOL09 demonstrated this contrasting relationship between HDR and VOL. Mountain Home grove samples with the largest mean VOL09 in trial 2, had mean HDR91 (µ = 39.0; s.d. = 3.3) and HDR09 (µ = 39.7; s.d. = 4.4) below the trial 2 steckling mean by 16% and 10%, respectively. Converse Basin grove samples ranked second in VOL09 and had higher mean HDR91 (µ = 46.8; s.d. = 7.7) and HDR09 (µ = 45.6; s.d. = 6.5) than Mountain Home, which were approximately equal to the trial 2 steckling mean. The same trends in HDR in these two grove samples were also observed in trial 1.

3.1.8. Trial 2 Steckling Form Traits after 29 Growing Seasons

As of 2009, steckling grove samples with the greatest levels of basal swelling of the lower stem (SWEL) compared to the trial 2 steckling mean were North Calaveras (118%; CV = 29%), Tuolumne (117%; CV = 22%), and Mountain Home (118%; CV = 43%) (Figure S17). Packsaddle grove samples, originating at giant sequoia’s southern range limit, had the least amount of SWEL at 32% of the steckling mean with a high CV of 88%. However, differences among grove samples were not statistically significant in trial 2. Black Mountain 1 (108%; CV = 39%) grove samples had above-average levels of SWEL, differing substantially from Black Mountain 2 (81%; CV = 60%) in this trait (Figure S17). The trend in these grove samples was reversed in trial 1 with Black Mountain I expressing low levels of SWEL and Black Mountain II expressing SWEL above the trial mean. These grove samples were propagated from seed collected in the same native grove.
Merced, Windy Gulch, Giant Forest, and Mountain Home grove samples expressed the greatest amounts of asymmetry (ASYM) of the lower stem (Figure S18). Packsaddle, South Calaveras, and Placer grove samples expressed the least ASYM. Differences among grove samples were not statistically significant for this trait. ASYM was strongly correlated to FLUT (rs = 0.64; p ≤ 0.0001) and moderately correlated to DBH09 (rs = 0.34; p ≤ 0.001) and VOL09 (rs = 0.35; p ≤ 0.001) indicating that larger trees tended to have more asymmetrical lower stems.
In trial 2, fluting of the lower stem (FLUT) had high amounts of variation within and among grove samples. The coefficient of variation among all grove samples was 113% with a high of 224% for Placer and Cedar Flat/South Fork and a low of 70% for Nelder grove samples. The grove samples exhibiting the greatest mean FLUT include several of the top performers by mean VOL09 including Giant Forest (188%; CV = 115%), Converse Basin, and Cabin Creek (Figure S19). Nelder grove samples, which were 65% of the mean VOL09, ranked second in mean FLUT at 169% of the mean (CV = 70%). The fluting of the lower stem had a moderate positive correlation with HT09 (rs = 0.39; p ≤ 0.01), DBH09 (rs = 0.40; p ≤ 0.01), and VOL09 (rs = 0.42; p ≤ 0.01), indicating that taller, larger trees tended to produce more fluted lower stems in trial 2.
Crown fullness (FULL) of stecklings differed significantly (p ≤ 0.05) among grove samples in trial 2. The grove samples with the highest ranks for FULL were South Calaveras (218%; CV = 65%), Merced (174%; CV = 79%), and Placer (140%; CV = 66%) (Figure S20). Each of these were north-region grove samples, and there was a weak-to-moderate correlation of FULL with the latitude of the native grove (rs = 0.20; p ≤ 0.05). Crown fullness was more strongly and negatively correlated with native grove elevation (rs = −0.26; p ≤ 0.01), indicating stecklings in grove samples propagated from higher-elevation native groves tended to have sparser crowns. The grove samples with the lowest levels of FULL were Black Mountain 1, Packsaddle, and Atwell Mill. Atwell Mill grove samples were the highest elevation of the native groves planted. The Black Mountain I and Black Mountain II grove samples, propagated from seed collected from the same native grove, differed in mean FULL with Black Mountain I at 54% (CV = 78%) of the trial steckling mean and Black Mountain II slightly above the mean at 102% (CV = 40%) (Figure S20).
Epicormic sprouting (EPI) was the most variable trait assessed with a coefficient of variation among grove samples of 259%. Ten of the 21 steckling grove samples exhibited no epicormic sprouting, including most of the north-region grove samples (Figure S21). Packsaddle, the southernmost grove sample in trial 2, produced the largest mean EPI at nearly 600% of the trial 2 steckling mean. The Placer grove samples (138%; CV = 224%) exhibited above-average epicormic sprouting. Differences in the mean level of epicormic sprouting among steckling grove samples were statistically significant at alpha = 0.1 in trial 2.

3.2. Comparison of Steckling Performance and Morphology in Pure vs. Mixed Planting

After 29 growing seasons at FSO, the steckling mean height (HT09) was significantly greater in trial 2 (µ = 11.7 m; s.d. = 3.3 m) than in trial 1 (µ = 10.1 m; s.d. = 2.7 m) (p ≤ 0.0001) (Figure S22). Assuming that the height growth of trees was free from competition—aided by the thinning of both trials in 1991 and 1999—the superior average HT09 of the trial 2 site (upper slope) suggested that it was a significantly higher quality site for giant sequoia than the adjacent trial 1 site (ridge top). However, this apparent site-quality effect may be confounded with any advantage or disadvantage of growing in mixed vs. pure stands.
Prior to thinning, the stecklings in trial 1 (µ = 2.5 m; s.d. = 0.7 m) were significantly taller than the trial 2 stecklings (µ = 2.2 m; s.d. = 0.5 m) in HT88 (p ≤ 0.0001) (Figure S22). This was prior to crown closure when the trees were relatively free to grow. At around the time of canopy closure in 1991 prior to thinning, trial 2 stecklings (µ = 4.4 m; s.d. = 0.9 m) were significantly taller than trial 1 stecklings (µ = 4.0 m; s.d. = 1.0 m). The stecklings were growing better with mixed conifer neighbors than the stecklings with giant sequoia steckling and seedling neighbors. At this time, trial 2 stecklings were being outgrown in terms of HT91 by ponderosa pine (µ = 6.4 m; s.d. = 1.1 m), sugar pine (µ = 4.6 m; s.d. = 1.2 m), and incense cedar (µ = 4.4 m; s.d. = 1.3 m) neighbors; in trial 1, stecklings were being outgrown by giant sequoia seedlings (µ = 4.8 m; s.d. = 0.9 m). Following thinning in 1991 and again in 1999, which removed mixed conifer neighbors in trial 2 and giant sequoia seedling neighbors in trial 1, trial 2 stecklings continued to outgrow trial 1 stecklings with significant differences in both HT97 and HT09 (Figure S22).
After 29 growing seasons, the mean stem diameter at breast height (DBH09) did not differ between trial 1 and trial 2. There were no differences between the two trials in DBH91 or DBH97 either (Figure S23). Trial 2 steckling mean conic stem volume (VOL09) was greater than trial 1 after 29 growing seasons, but the difference was not significant (Figure S24). Nor were the differences between the trials in VOL91 or VOL97 significant. With significantly greater height growth in trial 2 in HT91, HT97, and HT09, the trial 2 mean height–diameter ratio (HDR) was significantly greater than in trial 1 in each of the measurement years (Figure S25).
The best and worst performing grove samples within trials 1 and 2 were consistent after 29 growing seasons. In both trials, Mountain Home, Converse Basin, and Giant Forest grove samples ranked highly for HT09, DBH09, and VOL09. The most notable difference in grove sample performance between the two trials was the relatively better performance in trial 2 of several central region grove samples, particularly Cabin Creek. The Cabin Creek grove sample ranked third in trial 2 in VOL09 at 44% above the within-trial steckling mean, while trial 1 ranked 16th with mean VOL09 14% below the within-trial steckling mean.
In Kruskal–Wallis nonparametric ANOVAs, the mean expressions of form traits between trial 1 and 2 stecklings differed significantly for SWEL, FULL, and EPI after 29 growing seasons (Figure S26). The mean SWEL was greater in trial 2 than in trial 1 stecklings (p ≤ 0.001) (Figure S26). The only grove sample to express high levels of SWEL in both trials was North Calaveras. The crowns of stecklings in trial 1 had a greater mean FULL by a highly significant margin (p ≤ 0.0001). The mean EPI in trial 1 stecklings was significantly greater than in trial 2 stecklings (p ≤ 0.05) (Figure S26).

3.3. Seedling Performance and Morphology

3.3.1. Trial 1 Seedling Grove Sample Tree-Size Traits

There were six seedling grove samples planted originating from seed collected in North Calaveras, Redwood Mountain, Giant Forest, Cedar Flat, Garfield, and Mountain Home groves in the giant sequoia’s native range. The best-performing seedling grove sample after 29 growing seasons by HT09, DBH09, and VOL09 was the Redwood Mountain grove sample (Table S9). The mean HT09 of Redwood Mountain seedlings was 14.0 m (s.d. = 3.4 m), 107% of the overall mean and 0.2 m greater than the second-ranked Garfield seedlings. The mean VOL09 of Redwood Mountain seedlings was 0.50 m3 (s.d. = 0.27 m3), 127% of the seedling mean of 0.39 m3 (s.d. = 0.21 m3) (Table S9). This was 25% greater than the second ranked Garfield grove with a mean VOL09 of 0.40 m3 (s.d. = 0.22 m3). Most notable was the poor performance in VOL09 of the Mountain Home seedling grove samples, ranking fifth out of six, at 0.37 m3 (s.d. = 0.18 m3) or 94% of the seedling mean. This contrasts with the performance of the stecklings in the Mountain Home grove sample which was the largest steckling grove sample by a wide margin at 195% of the steckling mean. Garfield seedlings had the highest mean HDR09 among the seedlings at 43 (s.d. = 9.1), which was 107% of the seedling mean of 40 (s.d. = 5.1). There was little variation among seedlings in mean HDR09, which had a CV of 12.6%.
There were several notable changes in rank of seedling grove sample performance over the 29 growing seasons. After 11 growing seasons, Cedar Flat seedlings ranked second in mean VOL91 at 121% of the mean behind Redwood Mountain seedlings at 132% of the seedling mean (Table S9). In 2009, the Cedar Flat seedling mean VOL09 was 100% of the mean, ranking fourth, and 27% lower than the VOL09 of the Redwood Mountain seedlings. North Calaveras seedlings fell from 90% of the mean VOL91 to 79% of the mean VOL09, though dropped only one place. Mountain Home seedlings ranked last in mean VOL91 at 77% of the mean and were 94% of the mean VOL09, climbing one rank to fifth. There were no statistically significant differences among seedling grove samples detected for the tree-size traits or height–diameter ratios in any measurement year.

3.3.2. Trial 1 Seedling Grove Sample Form Traits

North Calaveras seedlings exhibited the greatest mean SWEL among the seedling grove samples (Table S10). The North Calaveras mean was 128% (CV = 21%) of the overall seedling mean. Giant Forest and Redwood Mountain seedling grove samples ranked second at 105% of the mean with CV = 39% and CV = 32%, respectively. The Garfield seedlings exhibited the least mean SWEL at 74% (CV = 37%). The differences in SWEL among seedling grove samples were statistically significant (p ≤ 0.01).
Giant Forest expressed the greatest amounts of FLUT and ASYM of the lower stem among seedling grove samples (Table S10). These two traits were highly correlated among seedlings at rs = 0.59 (p ≤ 0.01). Giant Forest’s mean FLUT was 140% of the overall mean (CV = 83%) with 36% more FLUT than the Cedar Flat and Redwood Mountain seedlings. Giant Forest’s seedling mean ASYM was only 3% greater than the second-ranked Cedar Flat seedlings and 19% greater than Garfield seedlings, which exhibited the least ASYM among the seedling grove samples. The differences among seedling means for FLUT and ASYM were not statistically significant among seedling grove samples after 29 growing seasons.
Mean crown fullness (FULL) was greatest in Cedar Flat seedlings at 138% (CV = 53%) of the seedling mean (Table S10). The crowns of Garfield seedlings ranked last at 60% (CV = 77%) of the seedling mean for FULL. Differences in FULL among seedling means were significantly different (p ≤ 0.1) at alpha = 0.1. Shorter seedlings with lower height–diameter ratios tended to have crowns that scored highly in FULL according to correlations of FULL with HT (rs = −0.21) and HDR (rs = −0.46).
Epicormic sprouting (EPI) was highly variable among seedling grove samples after 29 growing seasons with a CV = 340%. Many individual giant sequoia seedlings had no epicormic sprouts as of 2009. One seedling grove sample, Giant Forest, had no incidence of epicormic sprouting observed in 2009. The Garfield seedling grove samples had the greatest mean EPI at 196% of the seedling mean with a CV = 171%, indicating great within-grove sample variability for this trait. All seedling grove samples had at least one individual that had no incidence of epicormic sprouting observed as of 2009. Differences among seedling grove samples were not statistically significant for this trait.

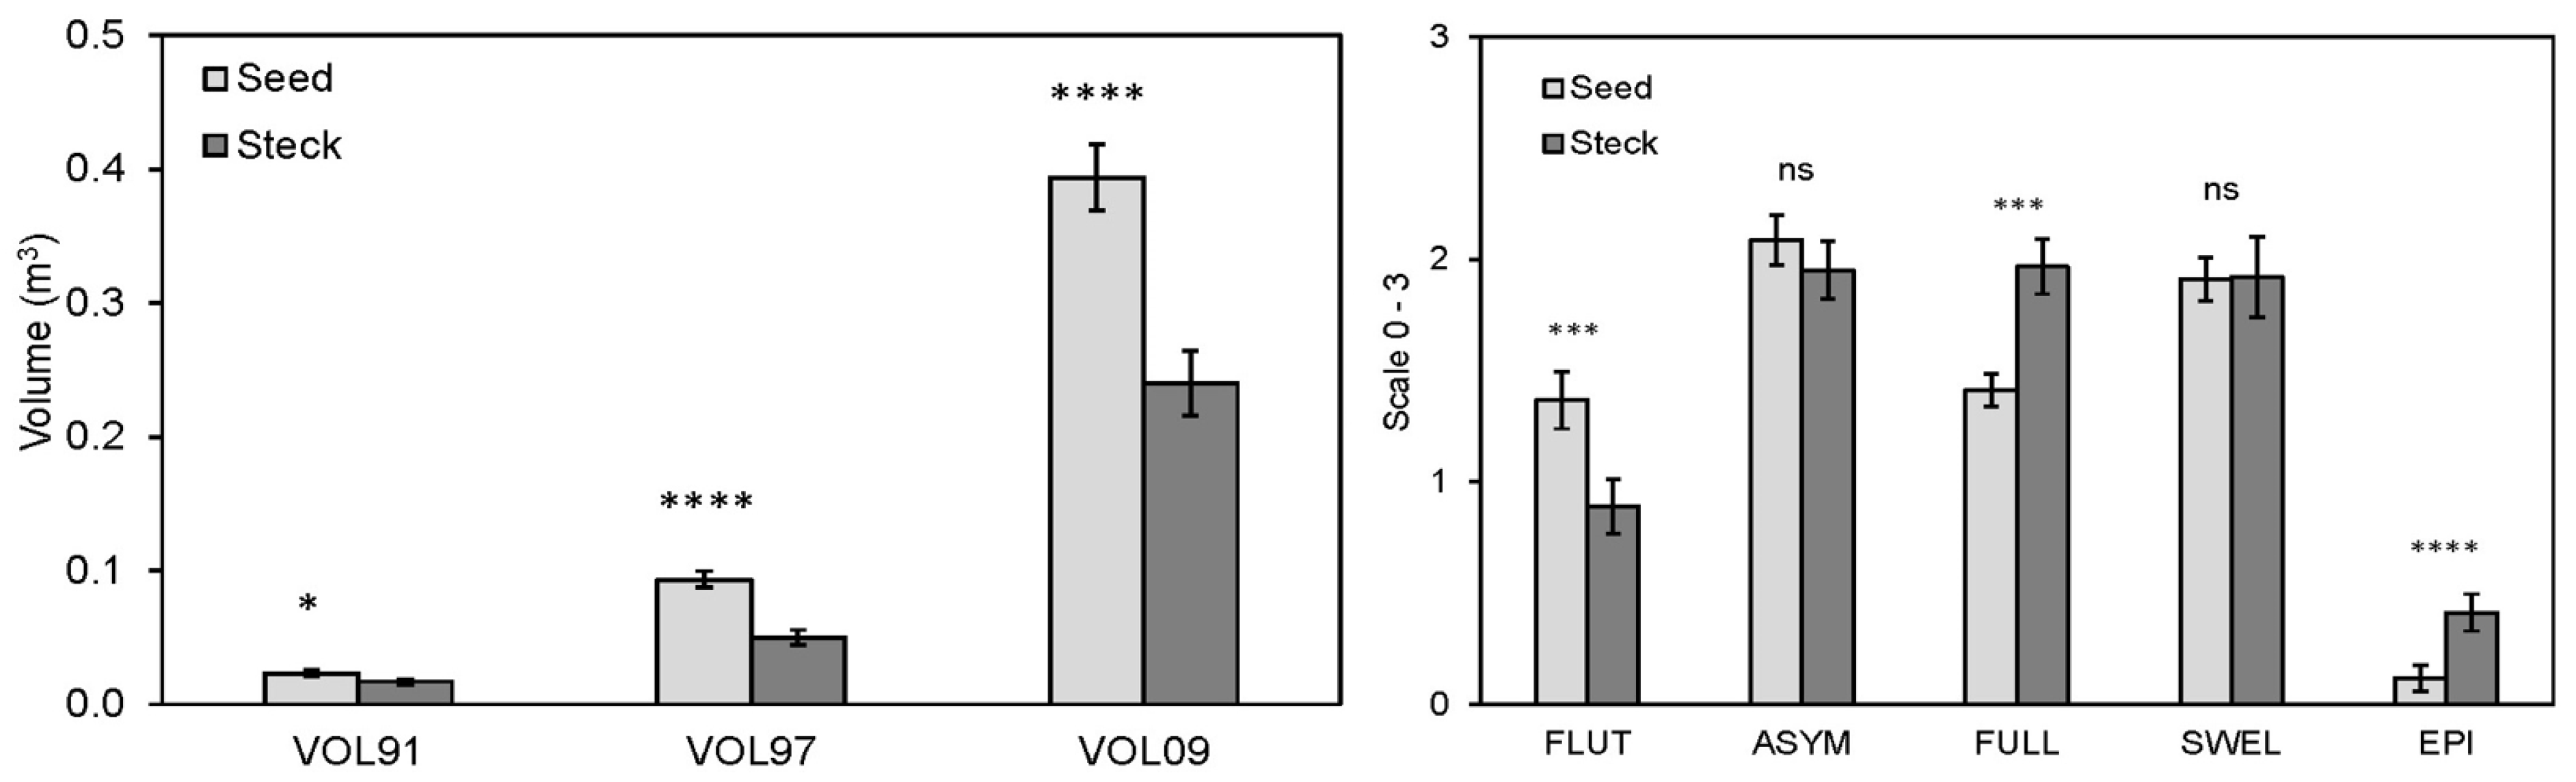
3.3.3. Trial 1 Comparative Performance and Morphology of Seedlings and Stecklings

After 29 growing seasons, giant sequoia seedlings were larger than the stecklings in mean HT09, DBH09, and VOL09 with statistically significant differences for each trait (Figures S27 and S28, and Figure 3). Height differences between seedlings and stecklings were statistically significant in each measurement year except after the first growing season HT81 (Figure S27). A nursery effect may have confounded comparison of stecklings with seedlings. The mean HDR09s of stecklings and seedlings were significantly different after 29 growing seasons (p ≤ 0.01). In the two earlier measurement years, HDR91 and HDR97 did not differ significantly (Figure S29).
The planting-stock types differed in form trait expression for mean FLUT (p ≤ 0.001), FULL (p ≤ 0.001), and EPI (p ≤ 0.0001) after 29 growing seasons (Figure 3). There was no evidence of significant differences between seedlings and stecklings in SWEL. The North Calaveras seedling and steckling grove samples both exhibited large mean SWEL values with the seedlings exceeding the overall mean by ~15% more than the stecklings. The seedlings demonstrated greater mean ASYM than the stecklings, but this was not a significant difference (Figure 3). Larger trees expressed more FLUT with moderate significant correlations between FLUT and VOL09 (rs = 0.37; p ≤ 0.001).
The mean FULL was greater among stecklings than seedlings after 29 growing seasons, and this difference was statistically significant (p ≤ 0.001) (Figure 3). There was a negative correlation between FULL and HDR09 among seedlings (rs = −0.38; p ≤ 0.001) and stecklings (rs = −0.32; p ≤ 0.001). This correlation indicated that stockier trees carried more branches per stem length or larger branches with a bushier appearance than more slender trees. Epicormic sprout formation was more frequent in stecklings after 29 growing seasons than in seedlings. Many individuals of both planting-stock types did not have any epicormic sprouts in 2009. Only ~7% of the seedlings had epicormic sprouts, while 33% of the steckling sample trees had live epicormic sprouts at the time of assessment in 2009.

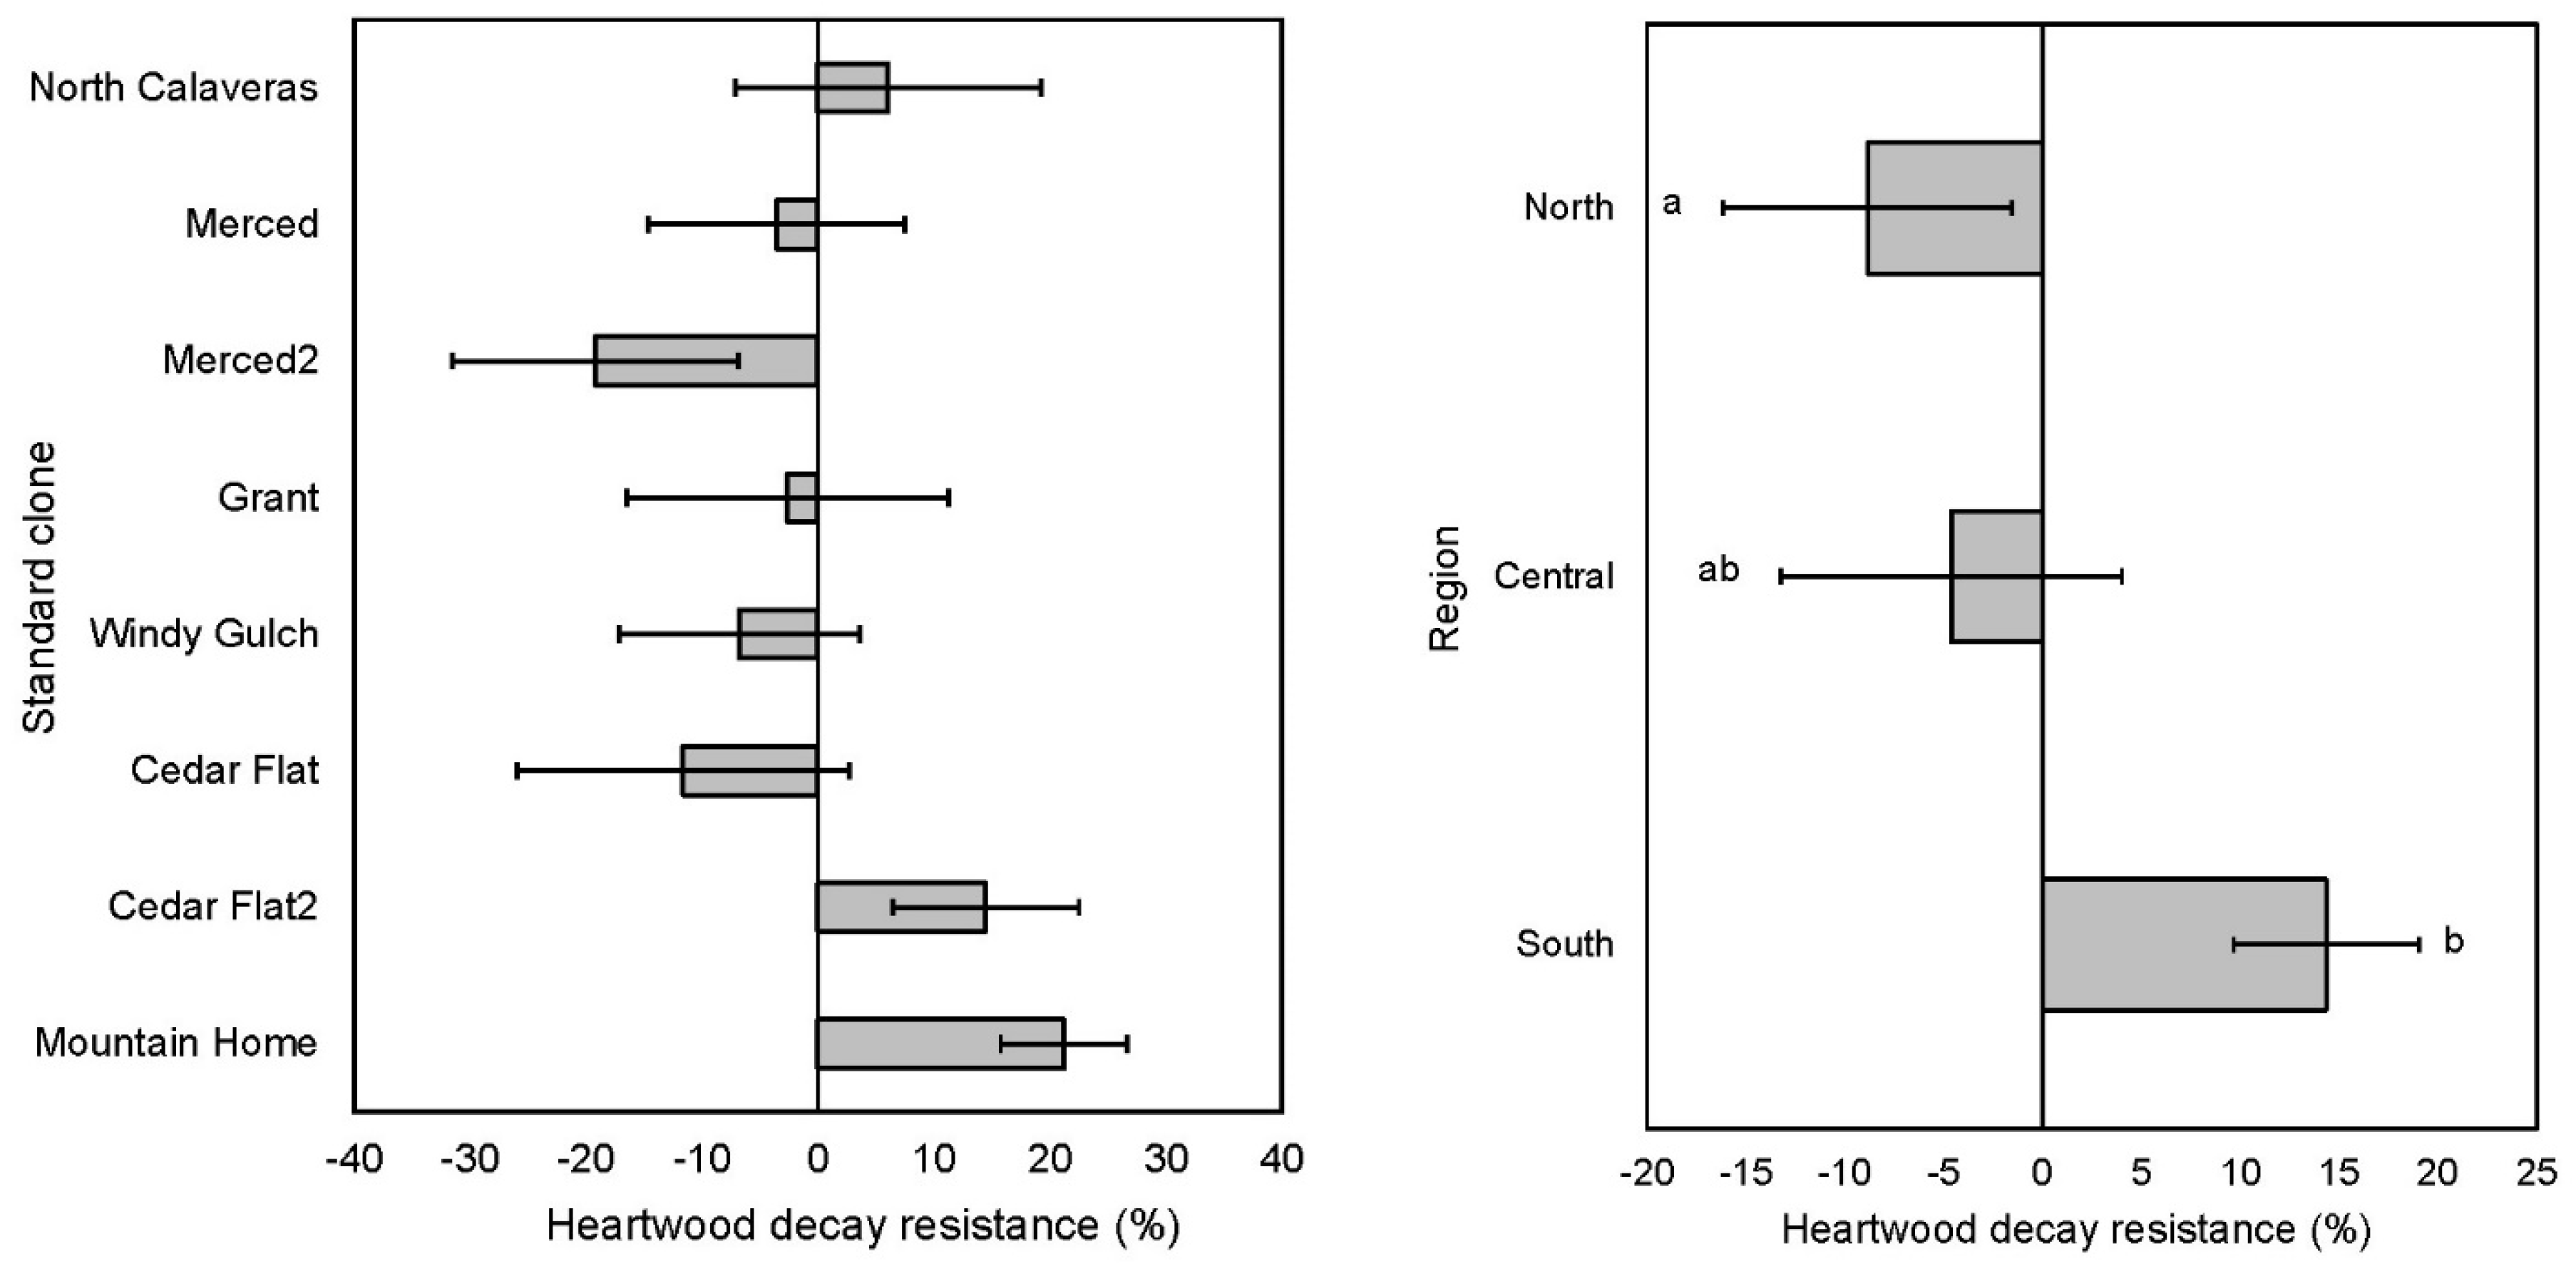
3.4. Heartwood Decay Resistance in Stumps 11 Years after Thinning

In stumps of seedling grove samples thinned in trial 1 in 1999, there was little variation in mean heartwood decay resistance (Table 2). The seedling grove sample with the largest mean decay resistance and the lowest mean decay resistance differed by only 12%. Most of the grove samples had mean decay-resistance scores near or greater than two on a four-point scale, indicating that thinned stumps had generally sound heartwood as of 2010. It may be that insufficient time had passed to produce substantial decay in the heartwood of giant sequoia. Tree size was investigated for a relationship with heartwood decay resistance hypothesizing that larger trees would produce more decay-resistant heartwood, but correlations and regression indicated no evidence of a relationship.
In stumps of standard clones thinned in 1999, heartwood decay resistance was more variable than among seedlings. Heartwood decay resistance was greatest on average in standard clones in the Mountain Home grove sample (Table 2; Figure 4) in 2010, eleven years after thinning in 1999. The stumps of three standard-clone grove samples had above-average heartwood decay resistance: North Calaveras, Cedar Flat 2, and Mountain Home (Figure 4). Two of these standard-clone grove samples with above-average decay resistance originated in small area native groves, the stecklings of which performed poorly in tree-size traits over 29 growing seasons. The other, Mountain Home, was a large area grove sample and the Mountain Home stecklings were the largest by tree-size traits. However, variability in decay resistance was high and differences in heartwood decay resistance were not significant among the stumps of standard clones from eight grove samples thinned in 1999 (p = 0.47; Table 2; Figure 4).
In the analysis of the heartwood decay resistance of standard-clone stumps thinned in 1999, the region of clone origin in the native range was a significant explanatory variable (p ≤ 0.05) (Figure 4). Heartwood decay resistance was greatest in the thinned stumps of standard clones with origins in the south region of the native range, which were significantly different from north-region stumps in a multiple comparison test (p ≤ 0.05) (Figure 4). The mean DBH of standard clones in 1997 two years before thinning was included in the analysis to account for the effect of size differences in the cut stumps on heartwood decay resistance. The covariate for DBH97 was not significant (p = 0.39) in this analysis.

4. Discussion

4.1. Performance and Morphology Varied by Grove Origins

After 29 growing seasons, there was variation between the two trials, but the same grove samples had the largest mean HT09, DBH09, and VOL09 in both trials 1 and 2: Mountain Home, Converse Basin, and Giant Forest. All statistically significant differences among grove samples in multiple comparison tests for DBH09 and VOL09 involved the Mountain Home grove samples being significantly greater than several grove samples from throughout the range. Seed collection from this native grove, as well as Converse Basin and Giant Forest, home to the largest individual tree by volume, General Sherman, should make good sources of future seed collections for outplantings, for which prioritizing volume growth will be a primary objective. However, among these three grove samples, HDR09 was relatively low for Mountain Home and relatively high (i.e., more slenderness) for Converse Basin and Giant Forest grove samples, suggesting that stecklings within grove samples differ in their resource-allocation strategies. Furthermore, in the pure planting, Mountain Home and Giant Forest had above-average SWELs, while Converse Basin expressed a below-average SWEL and higher levels of ASYM. In pure and mixed plantings, larger trees generally exhibited more FLUT, and the grove samples exhibiting greater amounts of FLUT included Giant Forest and Converse Basin. Greater FLUT was also found associated with larger tree diameters for giant sequoia planted in New Zealand [21].
Taken collectively, these findings indicate that larger fast-grown trees will likely have greater expression of stem-form traits characteristic of giant sequoia, which may partially offset the benefits of faster growth for timber production. Nevertheless, while spacing strongly affects both height and diameter growth [35], Cox et al. [36] found that larger giant sequoia stems resulting from faster growth at wider spacing had higher merchantable volume. Since genetics and stand density management both influence tree growth, we need more experimentation to ascertain how these factors interact in the context of giant sequoia tree growth, form, and wood quality for timber production. When planning to collect seed for the conservation of the species and its genetic diversity, we note that most grove samples exhibited roughly similar growth rates at Foresthill. This suggested that only the poorest-performing groves should be avoided, and that seed collection could cover a wide range of groves to capture differences in morphology without great sacrifice in growth. However, it is unknown whether enhanced gene flow among populations that eventually arises from planting diverse range-wide collections under assisted migration results in enhanced adaptation to locations experiencing a warming climate [37].

4.2. Growth and Tree Size Differed between Pure vs. Mixed Planting

Information on growth and form traits in pure and mixed plantings will help guide outplanting strategies for conservation and timber utilization. It is likely that giant sequoia will be planted on timberlands in California with other commercial Sierra conifer species, such as ponderosa pine and Douglas-fir [25]. Comparing the growth of stecklings in the mixed species planting of trial 2 with growth in the pure planting of trial 1 alerts land managers to differences in growth or form traits in these different planting mixtures.
The stecklings in the two trials differed primarily in tree HT. The mean tree HT in trial 2 was statistically significantly greater than in trial 1 in each measurement year from age 11 in 1991 to age 29 in 2009. The difference in mean HT in the two trials may be related to an environmental gradient in which trial 2 slopes gently westward, and it is apparent that tree HT increases downslope along this gradient. Trees in both trials have their leaders at about the same level in the canopy as the trial slopes downhill to the west. Soil depths, moisture, and nutrients may increase along this slope, improving site quality for greater HT growth in trial 2 (upper slope) compared to trial 1 (ridge top). The two trials did not differ significantly in DBH or VOL in any of the measurement periods from 1991 to 2009, suggesting that the differences in HT were largely driven by the environmental gradient. However, the mean VOL of the stecklings was greater in trial 2 at 109% of the overall steckling mean after 29 growing seasons.
It is important to note that while giant sequoia in trial 2 were interplanted with mixed conifer neighbors until thinning in 1999, the stecklings in trial 1 were interplanted with the much larger giant sequoia seedlings until thinning in 1999. Reconstructing the stand density in the trials prior to thinning in 1999 would help establish the influence of these competing trees on growth differences in giant sequoia stecklings in the two trials. This was not possible with the available data. Observation of the thinnings suggested that more large trees were removed from trial 1 than from trial 2, with the effect that trees in trial 1 likely had more available growing space following thinning. If this was the case, and trial 2 had a higher stand density than trial 1, then the greater mean tree size in trial 2 may be understated by these results. As of 2009, the basal area in trial 2 was ~50% greater than in trial 1. However, the measured basal area of both trials accounted for the entire trial and not just the portion of the respective trials occupied by the stecklings. It is also possible that in the mixed species environment of trial 2, giant sequoia stecklings were better able to exploit resource niches not occupied by the other conifer species due to differences in the timing of growth or belowground competition, consistent with other species tested in monospecific and mixed stands e.g., [38].

4.3. Differences among Steckling and Seedling Tree-Size and Form Traits

After 29 growing seasons, stecklings were significantly smaller than giant sequoia seedlings in HT, DBH, and VOL with lower height–diameter ratios. Part of these differences can be attributed to a nursery effect that caused many stecklings to check their growth in the first few years following planting. The seedlings were nonsignificantly larger than stecklings after one year’s growth as of 1981. From 1981–1983, the seedlings grew faster than the stecklings in HT, leading to statistically significant differences in mean HT83 in year 3 (1983). This early difference in mean tree HT83 was maintained through HT09 and resulted in a large and statistically significant difference in mean tree volume between stecklings and seedlings at age 29.
The large differences in size between the stecklings and the seedlings at age 29 may have been largely the product of the nursery effect and the resulting large early size differences which continued to compound as the larger neighbor seedlings outcompeted the smaller stecklings until they were separated in 1999 by thinning. A strong conclusion as to whether stecklings will lag behind seedlings in outplantings was largely confounded by the nursery effect. Nevertheless, we caution that the outplanting of stecklings may result in reduced height or volume growth compared to seedlings of the same grove origins.
A potential benefit of clonal forestry and the planting of vegetatively propagated stecklings has been the unconfirmed observation that stecklings may exhibit lower levels of undesirable stem-form traits like basal swelling, which will lead to inefficient utilization of stemwood volume at the mill. At FSO after 29 growing seasons, the stecklings and seedlings were expressing similar levels of basal swelling (SWEL). However, there were large differences in the mean tree size of stecklings and seedlings, which the visual assessment of SWEL may not have accounted for. This differed from the trend that was observed in coast redwood stecklings, which consistently expressed less basal swelling than seedlings [39]. At FSO, there was no support for the observation that stecklings may produce less basal swelling than seedlings.
The other form traits assessed at FSO correlated with tree size. The smaller stecklings produced statistically significantly more epicormic sprouts (EPI) than seedlings, consistent with pruned Picea sitchensis (Bong.) Carr. (Sitka spruce) in southeast Alaska [40]. The large difference in mean FLUT between the seedlings and stecklings was likely related to the difference in mean tree size between the larger seedlings and smaller stecklings. In general, the larger giant sequoia seedlings expressed more fluting (FLUT) of the lower stem, consistent with Thuja plicata Donn ex D.Don (western redcedar) in British Columbia, Canada [41] and Tsuga heterophylla (Raf.) Sarg. (western hemlock) in southeast Alaska [42,43], while both giant sequoia planting-stock types expressed comparable amounts of lower stem asymmetry. The stecklings also expressed greater levels of crown fullness (FULL), which could indicate a tendency in the seedlings to have widely spaced branches due to faster height growth. The stecklings also had statistically significantly lower mean HDR than seedlings at age 29. At this age, HDR was moderately positively correlated with VOL (rs = 0.32) suggesting stecklings may be stockier trees with less mean VOL than seedlings.
The findings at FSO were inconclusive as to whether giant sequoia stecklings or seedlings express better form traits from a timber perspective. Both types of planting stock exhibited form problems that may result in less efficient sawn timber recovery at the sawmill. However, not all form problems lead to value loss. For example, O’Hara and Berrill [44] found that much epicormic sprouting was short lived and that genetic effects were ephemeral in coast redwood. Similarly, Waring and O’Hara [45] found much epicormic sprouting following pruning of Larix occidentalis Nutt. (western larch) in Montana, USA to be temporary. Regarding stem asymmetry, Kellogg and Barber [46] reported that stem eccentricity does not have an important negative effect on tree value in western hemlock in British Columbia, Canada.

4.4. Heartwood Decay Resistance of Thinned Stumps

The analyses of heartwood decay resistance were largely inconclusive with results in the two seedling and standard-clone thinned stump samples in disagreement. There was significant variation in standard-clone stump heartwood decay resistance among regions, but no such trend in the seedling stumps.
There were no significant differences among grove samples for seedling or standard-clone data with an overall mean of ~2, which is on the high side of the scale. This may be an indication that most stumps were still reasonably free of decay 11 years after thinning. It may be that sufficient time had not passed for pronounced differences in decay to have been expressed. In both planting-stock types, the correlation between decay resistance and DBH97, the diameter of trees two years before thinning, was weak (rs ≤ 0.16). This suggested that the differences in decay resistance that were assessed were not strongly related to the size of the thinned stump. This finding is not consistent with various Larix spp. (larch) that exhibited high heritability for heartwood content and greater heartwood content in trees with more rapid diameter growth in provenance trials [47].

4.5. Limitations and Recommendations for Future Research

The main limitation of our study was that we only evaluated the performance and morphology of giant sequoia from a range-wide sample at a single site. Our relatively warm low-elevation study site may serve as a proxy for the forecasted future climate throughout much of giant sequoia’s current range; however, testing is needed at multiple sites within and outside its range to make broad inferences about responses to environmental factors [48].
The observed differences in HT09 growth between giant sequoia stecklings in trial 1 and trial 2 could be better understood by investigating microsite differences between the two trials. An analysis of soil water-holding capacity and nutrient availability within these trials would help to explain whether the differences in HT growth are microsite related or may be due to competitive differences in growth in pure and mixed plantings. These measurements should be done both early in the growing season and late in the growing season when the Pinaceae species have ceased growth, but giant sequoia and incense cedar may still be growing depending on resource availability. These soil data will also help to determine habitat differences between the FSO study site and groves in the native range. This will also help to better understand the relatively poor growth of giant sequoia in comparison to ponderosa pine, sugar pine, and Douglas-fir after 29 growing seasons.
The decay status of cut stumps was difficult to assess. Many stumps had sound heartwood at the time of measurement in 2010, and our assessment may not have captured the variability present in this trait. Instead of visual assessments, we recommend collecting heartwood samples for laboratory testing or partially burying samples in ‘graveyard tests’ of decay resistance.

5. Conclusions

Our analysis of data from common-garden experiments outside giant sequoia’s range indicated that performance and several stem-form traits varied according to the grove of origin and only differed slightly when giant sequoia was planted in pure stands vs. mixed with common conifer associates. Tree growth at this warm low-elevation site was roughly similar among most genotypes with the exception of a few grove samples exhibiting either very good or very poor growth. This may suggest broad adaptability under assisted migration for climate adaptation. Some fast-growing grove samples exhibited greater stem asymmetry, fluting, and epicormic sprouting, which are all considered form problems for timber production; yet, these could be unique attributes enhancing conservation value. However, morphological traits generally exhibited within-grove sample variability that may have obscured differences among groves. In addition, we found that planted seedlings outperformed clonal stock of the same grove origins, and that cut stumps from a subsample of southern groves exhibited greater heartwood decay resistance, but that decay resistance was highly variable and requires further study.

Supplementary Materials

The following supporting information can be downloaded at: https://www.mdpi.com/article/10.3390/conservation3040035/s1.

Author Contributions

Conceptualization, W.J.L.; Formal analysis, C.M.V.; Funding acquisition, W.J.L. and J.-P.B.; Methodology, C.M.V., W.J.L. and J.-P.B.; Project administration, J.-P.B.; Supervision, J.-P.B.; Writing—original draft, C.M.V.; Writing—review & editing, C.M.V., W.J.L. and J.-P.B. All authors have read and agreed to the published version of the manuscript.

Funding

This research was funded by the Save-the-Redwoods League and Sierra Pacific Industries.

Data Availability Statement

The data presented in this study are available on request from the corresponding author.

Acknowledgments

We appreciate field assistance from Brandon Namm and Dustin Revel. We are grateful that the USDA Forest Service maintained the Sequoiadendron giganteum trials at Foresthill Seed Orchard and provided housing for summer data collection.

Conflicts of Interest

The authors declare no conflict of interest. The funders had no role in the design of the study; in the collection, analyses, or interpretation of data; in the writing of the manuscript, or in the decision to publish the results.

References

  1. Dirnböck, T.; Essl, F.; Rabitsch, W. Disproportional risk for habitat loss of high-altitude endemic species under climate change. Glob. Change Biol. 2011, 17, 990–996. [Google Scholar] [CrossRef]
  2. Sáenz-Romero, C.; O’Neill, G.; Aitken, S.N.; Lindig-Cisneros, R. Assisted migration field tests in Canada and Mexico: Lessons, limitations, and challenges. Forests 2021, 12, 9. [Google Scholar] [CrossRef]
  3. Burdon, R.D.; Libby, W.J.; Brown, A. Domestication of Radiata Pine; Springer International: Cham, Switzerland, 2017; 480p. [Google Scholar]
  4. Rundel, P.W. An Annotated Check List of the Groves of Sequoiadendron giganteum in the Sierra Nevada, California. Madroño 1972, 21, 319–328. [Google Scholar]
  5. Harvey, H.T.; Shellhammer, H.S.; Stecker, R.E. Giant Sequoia Ecology; Scientific Monograph Series, 12; U.S. Department of Interior, National Park Service: Washington, DC, USA, 1980; 182p.
  6. Willard, D.A. Guide to the Sequoia Groves of California; Yosemite Association: El Portal, CA, USA, 2000; 124p. [Google Scholar]
  7. Hartesveldt, R.J.; Harvey, H.T.; Shellhammer, H.S.; Stecker, R.E. The Giant Sequoia of the Sierra Nevada; U.S. Department of Interior: Washington, DC, USA, 1975; 180p.
  8. Fins, L.; Libby, W.J. Population variation in Sequoiadendron: Seed and seedling studies, vegetative propagation, and isozyme variation. Silvae Genet. 1982, 31, 102–110. [Google Scholar]
  9. Libby, W.J. Genetic Variation and Early Performance of Giant Sequoia in Plantation; General Technical Report PSW-95; Pacific Southwest Forest and Range Experiment Station, Forest Service, U.S. Department of Agriculture: Berkeley, CA, USA, 1986.
  10. Rundel, P.W. Community structure and stability in the giant sequoia groves of the Sierra Nevada, California. Am. Midl. Nat. 1971, 85, 478–492. [Google Scholar] [CrossRef]
  11. DeSilva, R.; Dodd, R.S. Fragmented and isolated: Limited gene flow coupled with weak isolation by environment in the paleoendemic giant sequoia (Sequoiadendron giganteum). Am. J. Bot. 2020, 107, 45–55. [Google Scholar] [CrossRef]
  12. Rundel, P.W. Habitat restriction in giant sequoia: The environmental control of grove boundaries. Am. Midl. Nat. 1972, 87, 81–99. [Google Scholar] [CrossRef]
  13. Stephenson, N.L. Long-term dynamics of giant sequoia populations: Implications for managing a pioneer species. In Proceedings of the Symposium on Giant Sequoias: Their Place in the Ecosystem and Society; General Technical Report PSW-151; Aune, P., Ed.; Pacific Southwest Research Station, Forest Service, U.S. Department of Agriculture: Albany, CA, USA, 1994; pp. 56–63. [Google Scholar]
  14. Van Mantgem, P.J.; Stephenson, N.L.; Byrne, J.C.; Daniels, L.D.; Franklin, J.F.; Fule, P.Z.; Harmon, M.E.; Larson, A.J.; Smith, J.M.; Taylor, A.H.; et al. Widespread increase of tree mortality rates in the western United States. Science 2009, 323, 521–524. [Google Scholar] [CrossRef]
  15. Pile, L.S.; Meyer, M.D.; Rojas, R.; Roe, O.; Smith, M.T. Drought impacts and compounding mortality on forest trees in the southern Sierra Nevada. Forests 2019, 10, 237. [Google Scholar] [CrossRef]
  16. Harvey, H.T. Evolution and History of Giant Sequoia; General Technical Report PSW-95; Pacific Southwest Forest and Range Experiment Station, Forest Service, U.S. Department of Agriculture: Berkeley, CA, USA, 1986.
  17. Millar, C.I.; Woolfenden, W.B. Sierra Nevada Forests: Where did they come from? Where are they going? What does it mean? In Transcripts of 64th North American Wildlands and Natural Resources Conference; Wildlife Management Institute: Washington, DC, USA, 1999; pp. 206–236. [Google Scholar]
  18. Aitken, S.N.; Yeaman, S.; Holliday, J.A.; Wang, T.; Curtis-McLane, S. Adaptation, migration or extirpation: Climate change outcomes for tree populations. Evol. Appl. 2008, 1, 95–111. [Google Scholar] [CrossRef]
  19. York, R.A.; Stephenson, N.L.; Meyer, M.; Hanna, S.; Moody, T.; Carrio, T.; Battles, J.J. Giant Sequoia. In A Natural Resource Condition Assessment for Sequoia and Kings Canyon National Parks; Sydoriak, C., Panek, J.A., Battles, J.J., Nydick, K.R., Eds.; Natural Resource Report NPS/SEKI/NRR-2013/665.11a; National Park Service: Fort Collins, CO, USA, 2013; 81p. [Google Scholar]
  20. Harris, A.S.; Farr, W.A. The Forest Ecosystem of Alaska: Forest Ecology and Management; General Technical Report PNW-25; Pacific Northwest Forest and Range Experiment Station, Forest Service, U.S. Department of Agriculture: Portland, OR, USA, 1974; 116p.
  21. De La Mare, P. Sequoiadendron. In The Proceedings of a Farm Forestry Seminar on Special Purpose Tree Plantings; New Zealand Farm Forestry Association: Telford Polytechnic: Waitepeka, New Zealand, 2004; pp. 11–14. [Google Scholar]
  22. Weatherspoon, C. Sequoiadendron giganteum (Lindl.) Buchholz. In Silvics of North America. Vol. 1. Conifers; Burns, R.M., Honkala, B.H., Eds.; Agriculture Handbook 654; USDA Forest Service: Washington, DC, USA, 1990; pp. 552–562. Available online: http://www.na.fs.fed.us/spfo/pubs/silvics_manual/table_of_contents.htm (accessed on 9 May 2016).
  23. Kozlowski, T.T.; Pallardy, S.G. Physiology of Woody Plants, 2nd ed.; Academic Press, Inc.: San Diego, CA, USA, 1997; 411p. [Google Scholar]
  24. O’Hara, K.L.; York, R.A.; Heald, R.C. Effect of pruning severity and timing of treatment on epicormic sprout development in giant sequoia. Forestry 2008, 81, 103–110. [Google Scholar] [CrossRef]
  25. Kitzmiller, J.H.; Lunak, G. Growth of giant sequoia compared to ponderosa pine and other mixed-conifers in California plantations. West. J. Appl. For. 2012, 27, 196–204. [Google Scholar] [CrossRef]
  26. Piirto, D.D. Wood of Giant Sequoia: Properties and Unique Characteristics; General Technical Report PSW-95; Pacific Southwest Forest and Range Experiment Station, Forest Service, U.S. Department of Agriculture: Berkeley, CA, USA, 1986.
  27. Ukrainetz, N.K.; Kang, K.-Y.; Aitken, S.N.; Stoehr, M.; Mansfield, S.D. Heritability and phenotypic and genetic correlations of coastal Douglas-fir (Pseudotsuga menziesii) wood quality traits. Can. J. For. Res. 2008, 38, 1536–1546. [Google Scholar] [CrossRef]
  28. WRCC. Western Regional Climate Center: Cooperative Climatological Data Summaries. 2014. Available online: http://www.wrcc.dri.edu/climatedata/climsum/ (accessed on 23 February 2014).
  29. Thornton, P.E.; Thornton, M.M.; Mayer, B.W.; Wilhelmi, N.; Wei, Y.; Cooke, R.B. Daymet: Daily Surface Weather on a 1 km Grid for North America 1980–2011; Oak Ridge National Laboratory Distributed Active Archive Center: Oak Ridge, TN, USA, 2013. [CrossRef]
  30. Fins, L. Genetic Architecture of Giant Sequoia. Ph.D. Dissertation, University of California, Berkeley, CA, USA, 1979; 237p. [Google Scholar]
  31. Mahalovich, M.F. A Genetic Architecture Study of Giant Sequoia: Early Growth Characteristics. Master’s Thesis, University of California, Berkeley, CA, USA, 1985; 98p. [Google Scholar]
  32. Libby, W.J.; Cockerham, C.C. Random non-contiguous plots in interlocking field layouts. Silvae Genet. 1980, 29, 183–190. [Google Scholar]
  33. Harry, D.E. Shoot elongation and growth plasticity in incense-cedar. Can. J. For. Res. 1987, 17, 484–489. [Google Scholar] [CrossRef]
  34. Conover, W.J.; Johnson, M.E.; Johnson, M.M. A comparative study of homogeneity of variances, with application to the outer continental shelf bidding data. Technometrics 1981, 23, 351–361. [Google Scholar] [CrossRef]
  35. York, R.A.; O’Hara, K.L.; Battles, J.J. Density effects on giant sequoia (Sequoiadendron giganteum) growth through 22 years: Implications for restoration and plantation management. West. J. Appl. For. 2013, 28, 30–36. [Google Scholar] [CrossRef]
  36. Cox, L.E.; York, R.A.; Battles, J.J. Growth and form of giant sequoia (Sequoiadendron giganteum) in a plantation spacing trial after 28 years. For. Ecol. Manag. 2021, 488, 119033. [Google Scholar] [CrossRef]
  37. Sexton, J.P.; Hangartner, S.B.; Hoffmann, A.A. Genetic isolation by environment or distance: Which pattern of gene flow is most common? Evolution 2014, 68, 1–15. [Google Scholar] [CrossRef]
  38. Pretzsch, H.; Grams, T.; Häberle, K.H.; Pritsch, K.; Bauerle, T.; Rötzer, T. Growth and mortality of Norway spruce and European beech in monospecific and mixed-species stands under natural episodic and experimentally extended drought. Results of the KROOF throughfall exclusion experiment. Trees 2020, 34, 957–970. [Google Scholar] [CrossRef]
  39. Rydelius, J.A.; Libby, W.J. Arguments for clonal redwood forestry. In Clonal Forestry II; Ahuja, M.A., Libby, W.J., Eds.; Springer: Berlin/Heidelberg, Germany, 1993; pp. 158–168. [Google Scholar]
  40. Deal, R.L.; Barbour, R.J.; McClellan, M.H.; Parry, D.L. Development of epicormic sprouts in Sitka spruce following thinning and pruning in south-east Alaska. West. J. Appl. For. 2003, 76, 401–412. [Google Scholar] [CrossRef]
  41. DeBell, J.D.; Gartner, B.L. Stem characteristics on the lower log of 35-year-old western redcedar grown at several spacings. West. J. Appl. For. 1997, 12, 9–15. [Google Scholar] [CrossRef]
  42. Julin, K.R.; Shaw, C.G., III; Farr, W.A.; Hinckley, T.M. The fluted western hemlock of Alaska. I. Morphological studies and experiments. For. Ecol. Manag. 1993, 60, 119–132. [Google Scholar] [CrossRef]
  43. Julin, K.R.; Shaw III, C.G.; Farr, W.A.; Hinckley, T.M. The fluted western hemlock of Alaska. II. Stand observations and synthesis. For. Ecol. Manag. 1993, 60, 133–141. [Google Scholar] [CrossRef]
  44. O’Hara, K.L.; Berrill, J.-P. Epicormic sprout development in pruned coast redwood: Pruning severity, genotype, and sprouting characteristics. Ann. For. Sci. 2009, 66, 409. [Google Scholar] [CrossRef]
  45. Waring, K.M.; O’Hara, K.L. Ten-year growth and epicormic sprouting response of western larch to pruning in western Montana. West. J. Appl. For. 2005, 20, 228–232. [Google Scholar] [CrossRef]
  46. Kellogg, R.M.; Barber, F.J. Stem eccentricity in coastal western hemlock. Can. J. For. Res. 1981, 11, 715–718. [Google Scholar] [CrossRef]
  47. Paques, L.E. Genetic control of heartwood content in larch. Silvae Genet. 2001, 50, 69–75. [Google Scholar]
  48. Ahuja, M.R. Genetic constitution and diversity in four narrow endemic redwoods from the family Cupressaceae. Euphytica 2008, 165, 5–19. [Google Scholar] [CrossRef]
Figure 1. Map of 23 sampled giant sequoia native groves with progeny planted at the Foresthill Seed Orchard study site, located north of the northernmost native grove (top left of map).
Conservation 03 00035 g001
Figure 2. Trial 1 (pure planting; left) and trial 2 (mixture; right) giant sequoia steckling grove sample mean stem volume (VOL09) in percent above or below the steckling mean after 29 growing seasons at Foresthill Seed Orchard as of 2009. Among-grove differences were statistically significant (p ≤ 0.1) in a Kruskal–Wallis one-way ANOVA at alpha = 0.1. Placer and Deer Creek grove samples were not included in the analysis. Error bars are relative standard errors of the grove sample mean, where the grove sample standard error is divided by the mean and expressed as a percent (%). Grove samples are arranged from north to south in the figure. Some groves are not represented in mixed planting (Trial 2).
Conservation 03 00035 g002
Figure 3. Trial 1 seedling (Seed; n = 68) and steckling (Steck; n = 63) conic stem volume in three measurement years over 29 growing seasons (left) and form traits assessed in 2009 after 29 growing seasons (right) at Foresthill Seed Orchard. Form traits assessed on a four-point scale (0 = weaker; 3 = stronger). Only grove samples with both seedlings and stecklings planted in trial 1 were included in this analysis. Tests of significance were conducted using the nonparametric Kruskal–Wallis test. Levels of significance for each growth period are indicated by asterisks (ns = no significance; * p < 0.05; ** p <0.01; *** p < 0.001; and **** p < 0.0001).
Conservation 03 00035 g003
Figure 4. Trial 1 heartwood decay resistance of giant sequoia standard-clone stumps thinned in 1999 in percent above or below the mean heartwood decay-resistance score assigned in 2010 (left), and by region of clone origin in the native range in percent above or below the mean (right), 11 years after thinning at Foresthill Seed Orchard. Differences among regions were significant (p ≤ 0.05). Letters indicate significant differences among regions in a multiple comparison test. The number of stumps assessed were north = 41, central = 27, and south = 34 stumps.
Conservation 03 00035 g004
Table 1. Descriptive statistics summarized for trial 1 giant sequoia steckling by grove sample for height (m), diameter at breast height (cm), conic stem volume (m3), and height–diameter ratio (HDR) after 29 growing seasons at Foresthill Seed Orchard. Grove sample rankings (R) included (1 = largest; 23 = smallest).
Height (m)Diameter (cm)Volume (m3)HDR
GrovenMeans.d.MaxMinRMeans.d.MaxMinRMeans.d.MaxMinRMeans.d.MaxMinR
Placer86.22.19.93.62214.83.920.29.4230.040.030.110.0123424.249382
N. Calaveras198.92.615.93.81923.35.232.89.7200.150.090.450.0119383.7493310
S. Calaveras1310.12.413.66.41128.45.738.221.140.240.140.470.075354.1433016
Tuolumne129.33.115.25.81624.66.935.214.8180.180.150.490.0316384.9443112
Merced107.62.311.34.22024.26.333.113.5190.140.100.320.0220313.4362623
Mariposa89.71.611.87.31326.94.734.418.4110.200.090.370.0712364.6422615
Nelder69.01.810.56.31825.34.031.220.2160.160.070.270.0718353.7403116
McKinley1310.02.615.35.81226.73.533.220.3130.200.100.440.0612376.8522914
Cabin Creek109.41.811.85.41526.63.732.820.5140.180.080.330.0616354.2402616
Converse Basin1411.71.815.59.3229.04.137.423.720.270.120.570.143413.546343
Lockwood1110.42.914.46.8926.76.336.218.3120.220.140.480.0610394.848326
Windy Gulch510.31.712.88.41027.14.434.022.2100.210.110.390.1111382.941348
Grant79.22.614.26.61728.86.538.918.330.230.170.560.067324.9392621
Redwood Mtn1910.63.315.94.6627.56.035.514.880.240.150.520.035385.946309
Giant Forest1111.13.116.36.3328.48.039.116.050.280.210.650.042394.045335
Atwell Mill109.63.215.04.11424.77.837.010.9170.190.160.470.0114394.845327
Cedar Flat37.23.210.64.42122.26.928.014.6210.110.100.220.0221325.5382722
Mtn. Home1112.03.117.18.0133.86.847.925.910.410.271.030.141353.8423016
Wheel Meadow1310.63.115.35.6627.95.937.016.560.250.140.480.044386.0512813
Black Mtn. I1310.82.816.77.6427.44.936.720.990.230.150.590.097407.251284
Black Mtn. II810.72.112.87.4525.34.030.320.4150.190.090.310.0914423.547351
Packsaddle1110.52.415.16.3827.74.636.317.970.230.120.520.057383.9433310
Deer Creek26.23.48.63.82218.910.326.111.6220.080.100.150.0122330.1333320
All2379.92.817.13.6 26.56.347.99.4 0.210.151.030.01 375.35226
Table 2. Summary data for heartwood decay resistance (Decay) and stem diameter at breast height (DBH97) of giant sequoia seedling stumps (n = 139) and standard clone stumps (n = 102) thinned in 1999 by seedling grove sample at Foresthill Seed Orchard. Heartwood decay was evaluated on a four-point scale (0 = mostly decayed; 3 = decay resistant) in 2010, 11 years after thinning in 1999.
DecayDBH97
GrovenMeans.d.MaxMin%meanMeans.d.MaxMin%mean
Seedlings
N. Calaveras252.10.63110118.33.5251291
Redwood Mtn.212.20.73110621.02.52617104
Giant Forest221.90.8309420.05.0291199
Cedar Flat172.10.83010220.84.22910103
Garfield262.10.73110419.93.9301398
Mountain Home281.90.7319321.24.13114105
All 2.10.730 20.34.03110100
Clones
N. Calaveras102.10.93110616.01.6191398
Merced111.90.7319614.52.7191089
Merced 2201.60.9308118.33.7278112
Grant141.91.0309712.93.6221279
Windy Gulch131.80.7319315.93.6261198
Cedar Flat41.80.5218815.32.6191194
Cedar Flat 2152.30.73111417.54.6278107
Mountain Home152.40.53212117.74.9256109
All 2.00.830 16.34.12710100
Disclaimer/Publisher’s Note: The statements, opinions and data contained in all publications are solely those of the individual author(s) and contributor(s) and not of MDPI and/or the editor(s). MDPI and/or the editor(s) disclaim responsibility for any injury to people or property resulting from any ideas, methods, instructions or products referred to in the content.

