
Valorisation of Madagascar’s Wildlife Trade and Wildlife Tourism: What Are the Conservation Benefits?

Abstract
:1. Introduction
1.1. Socioeconomic Aspects of Wildlife Valorisation in Madagascar
1.2. Wildlife Tourism Revenue
1.3. Flora and Fauna Trade Revenues
2. Materials and Methods
3. Results
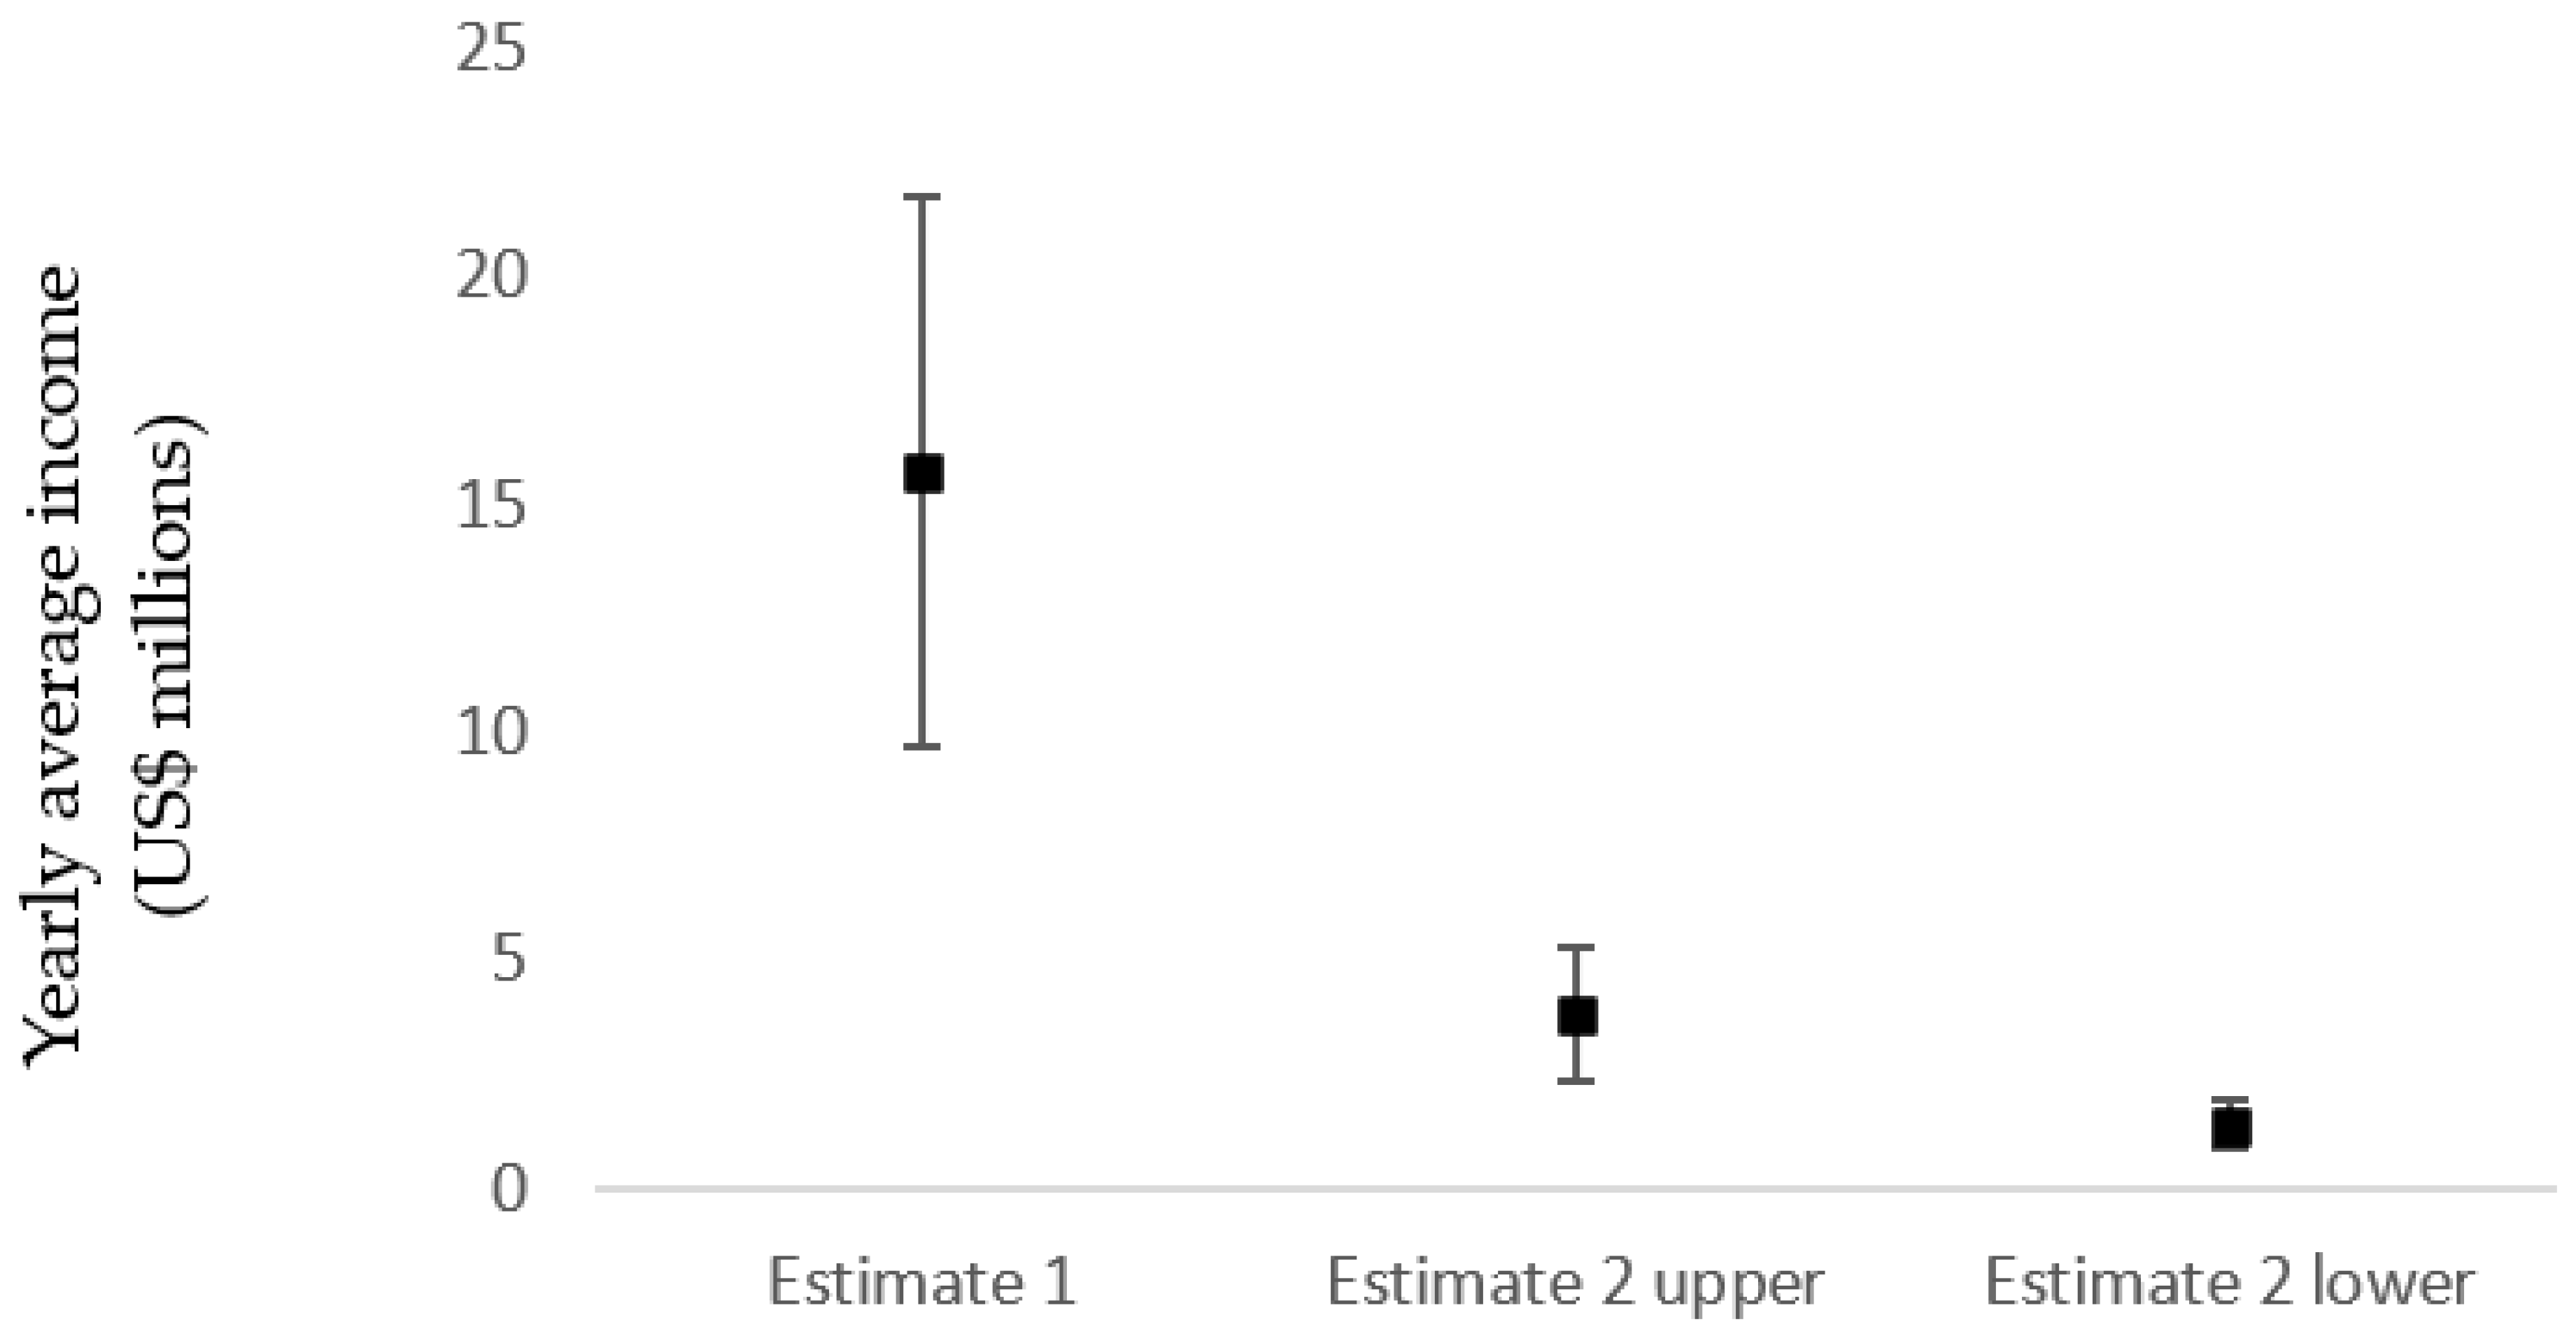
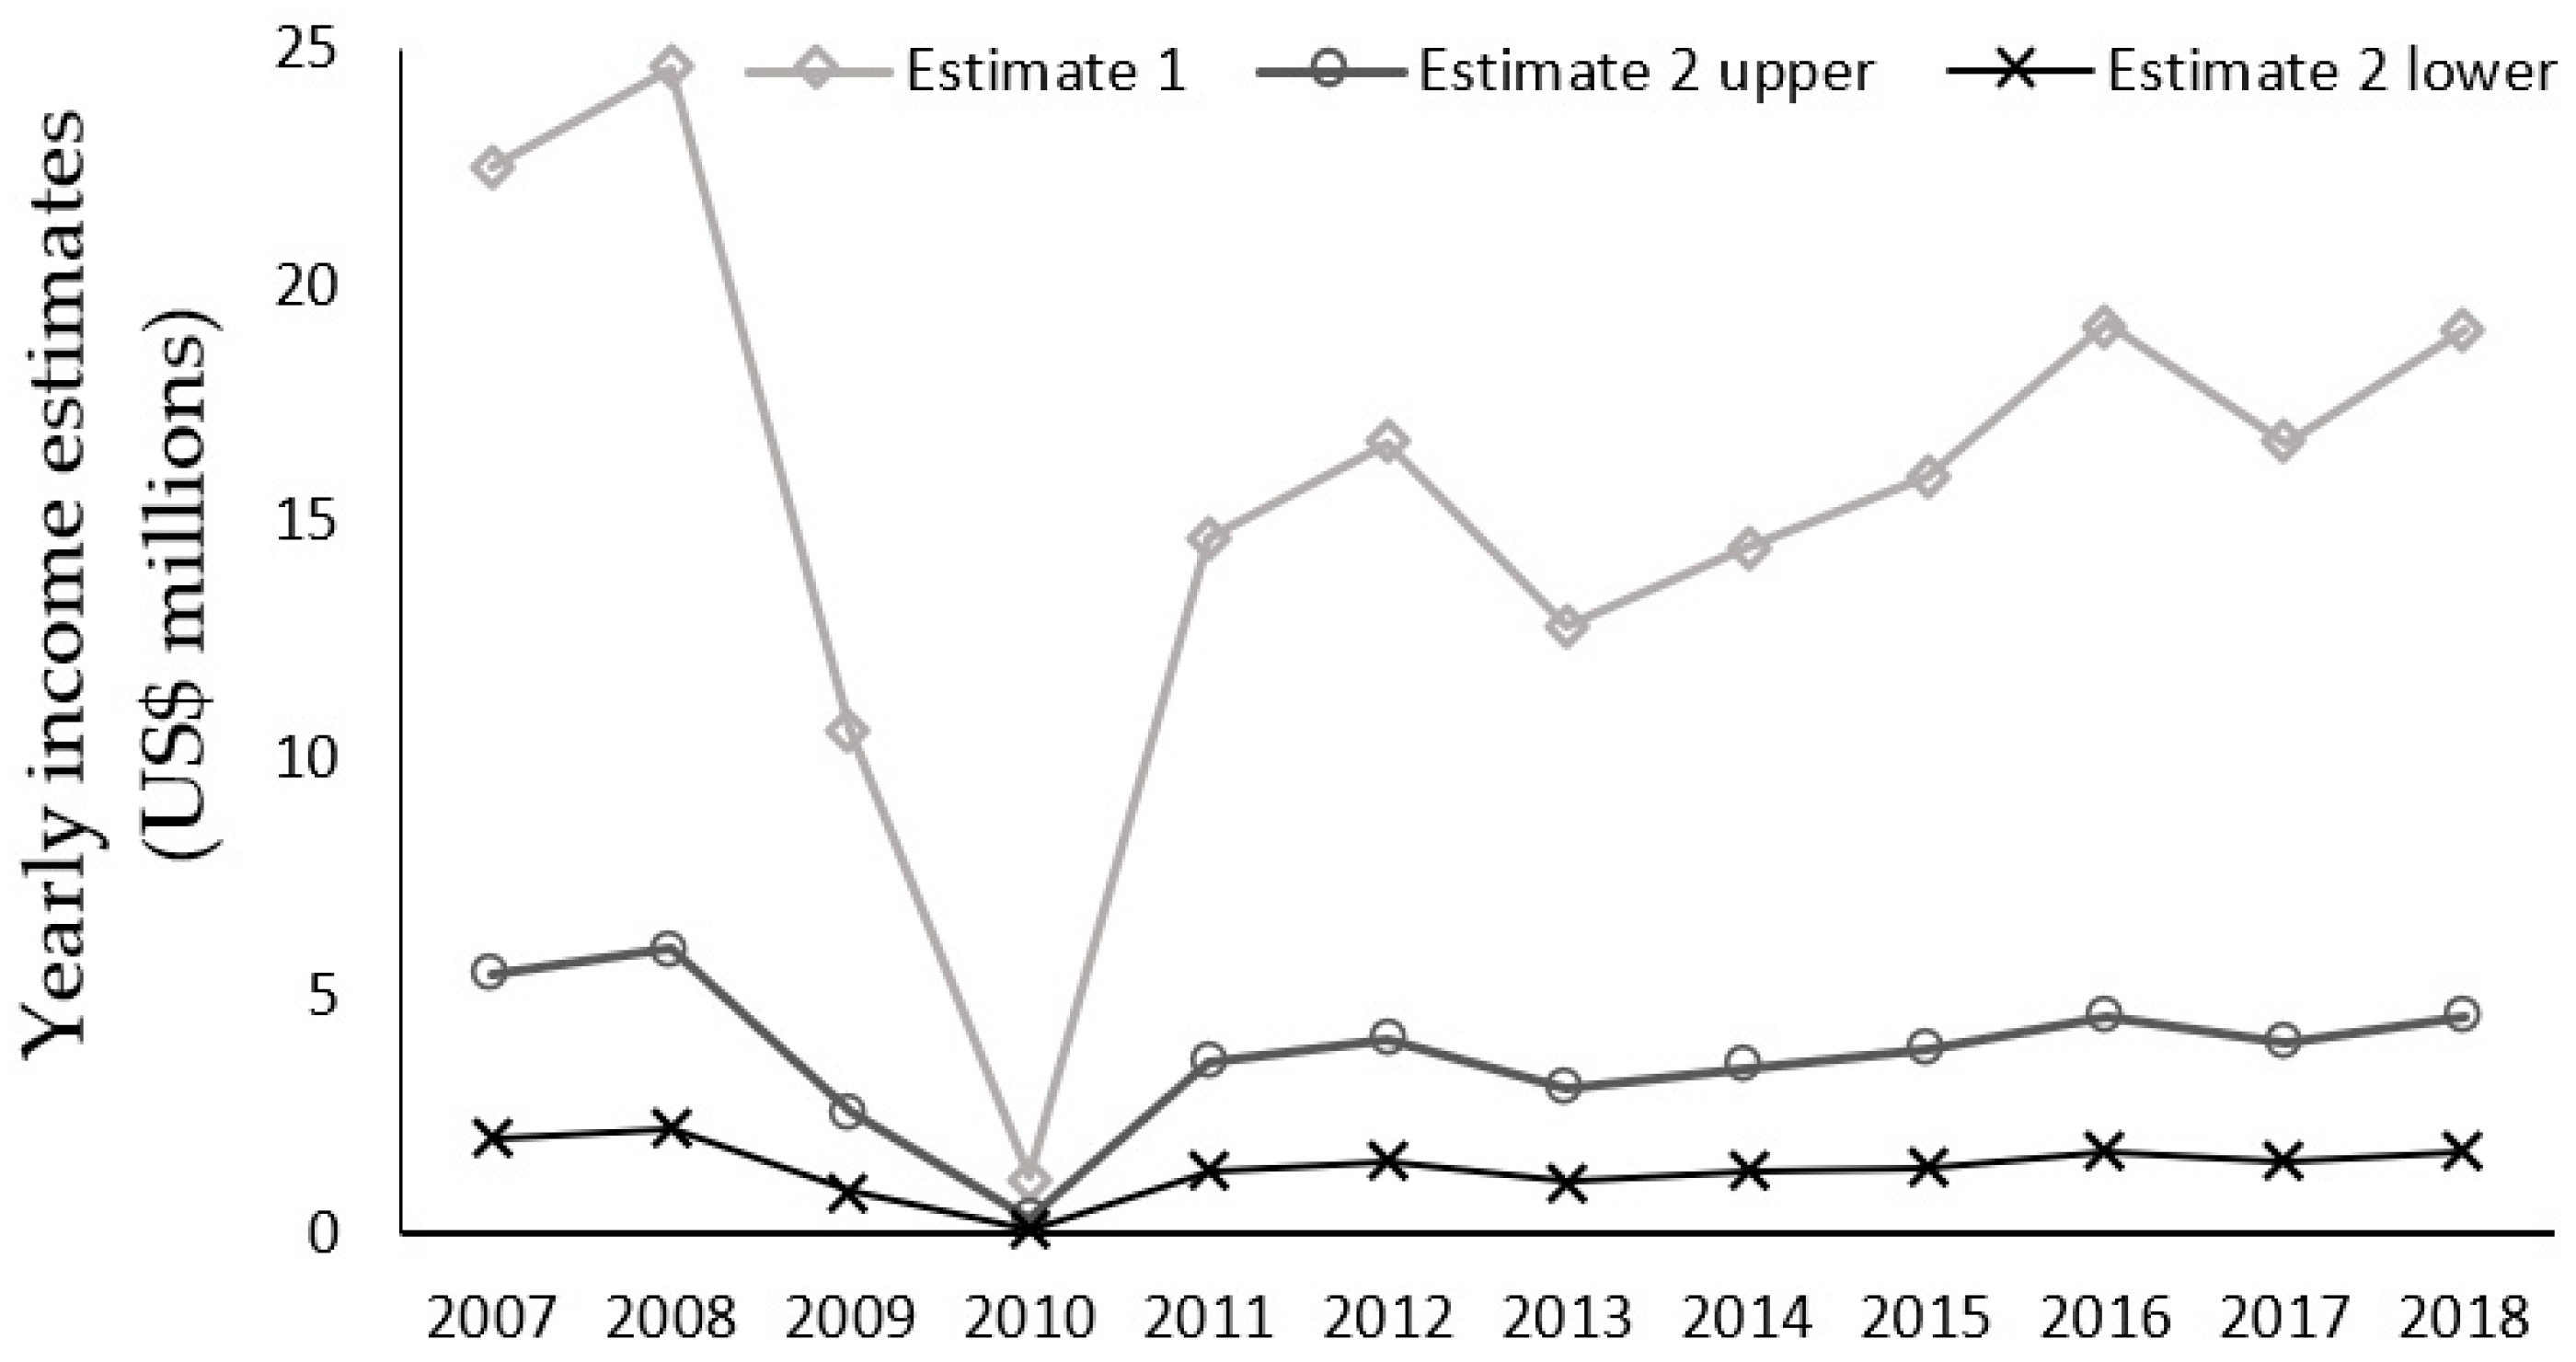
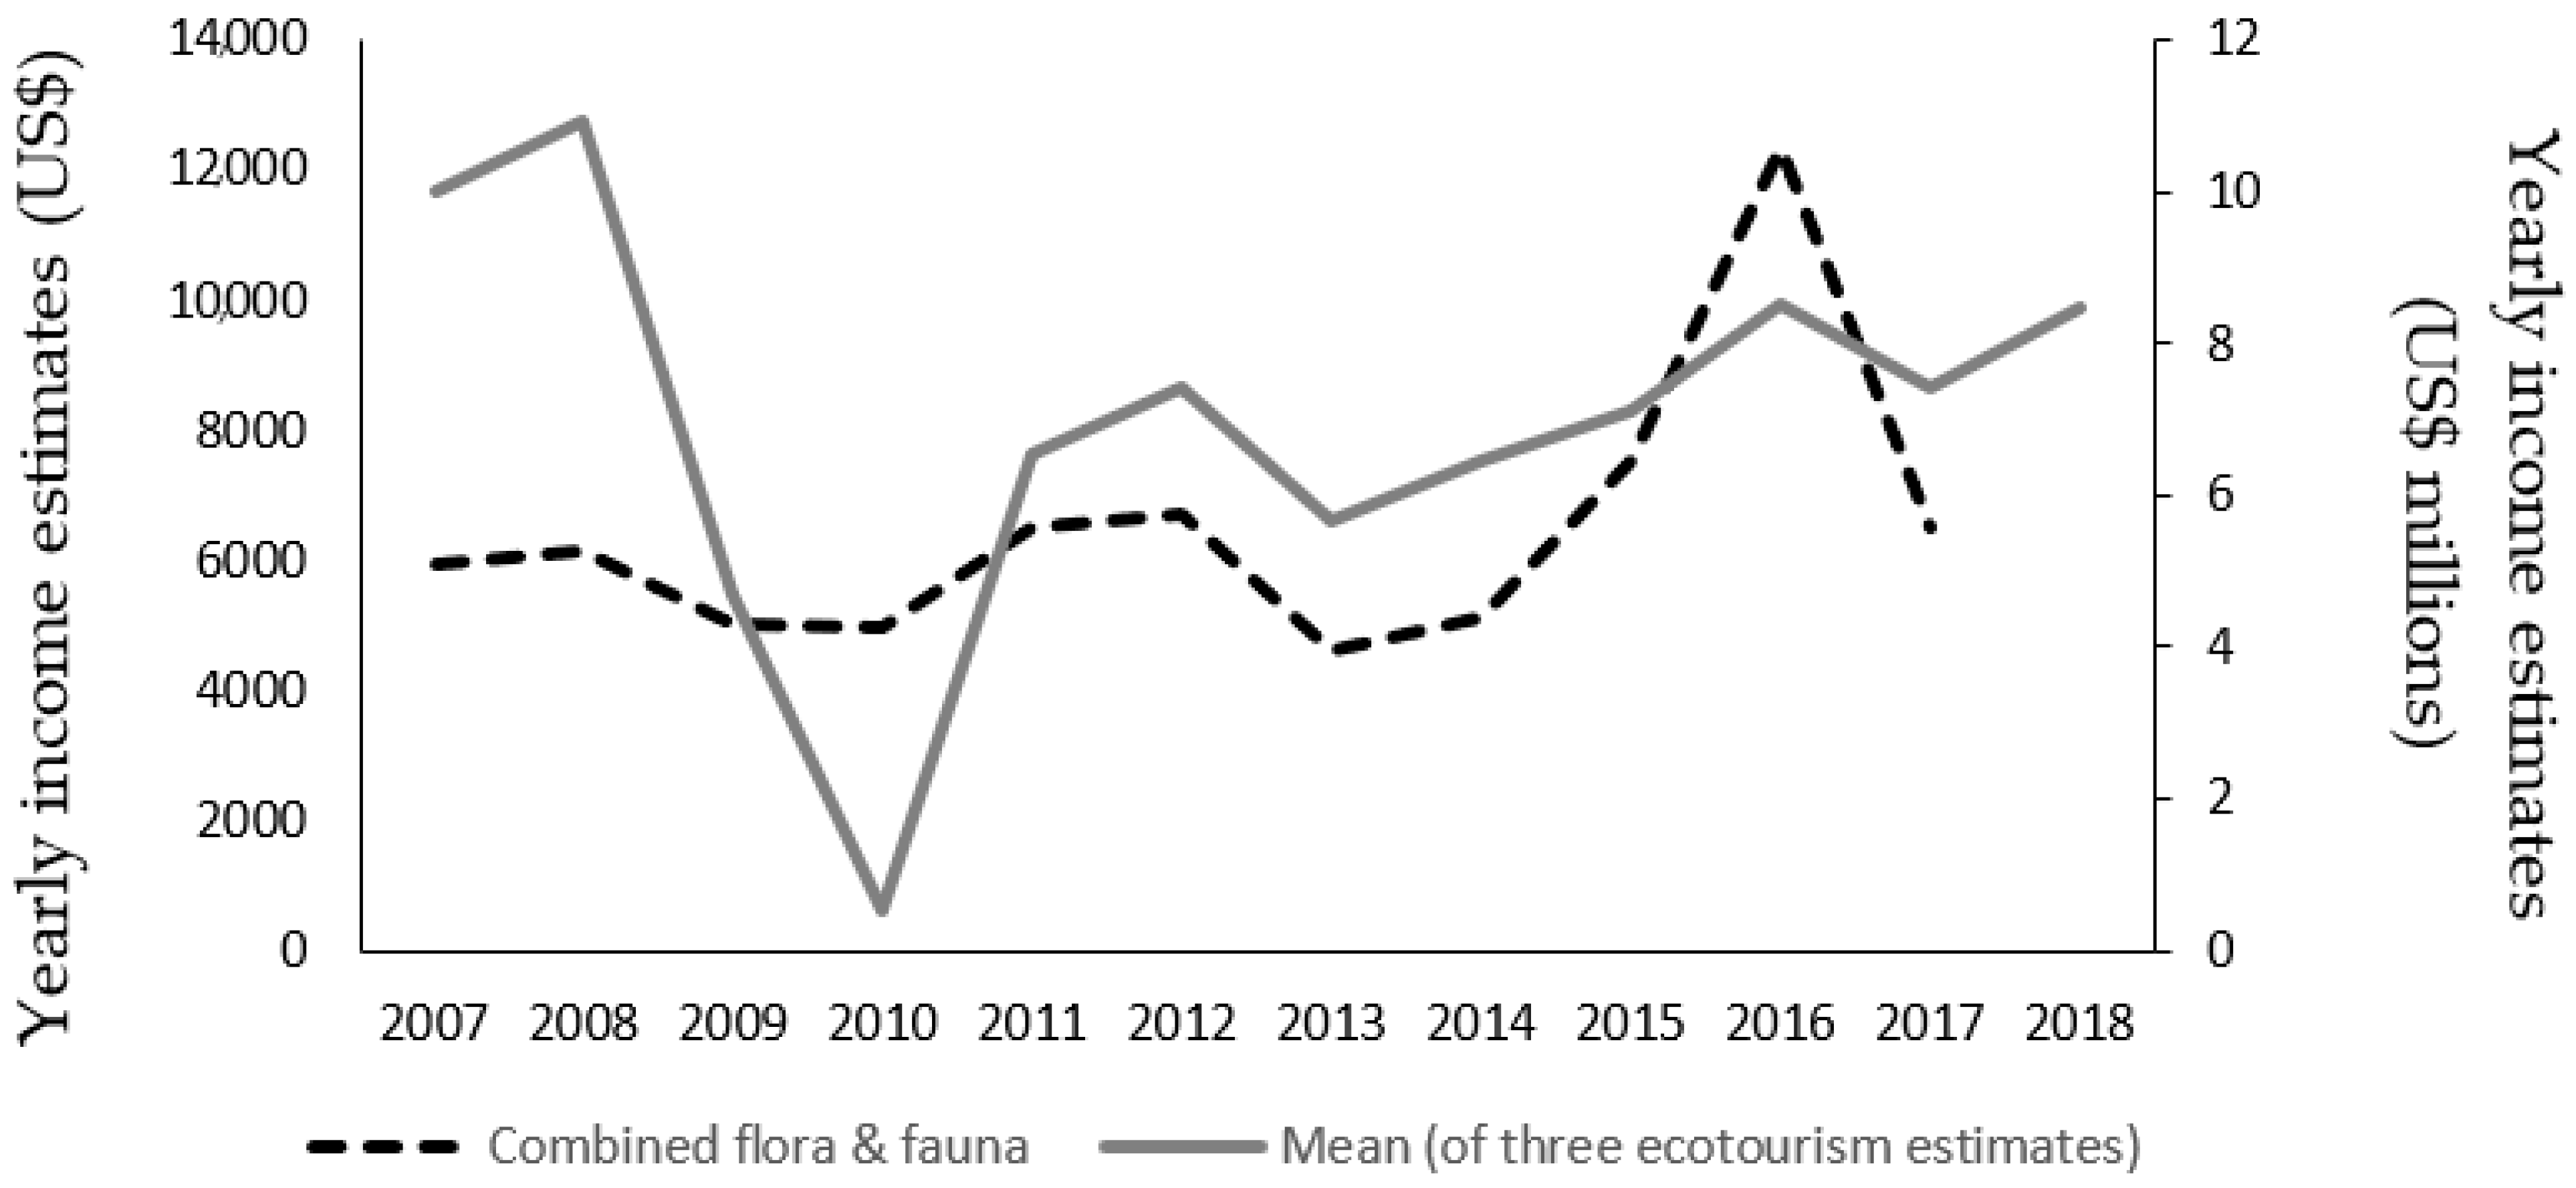
3.1. Ecotourism Revenue Generation
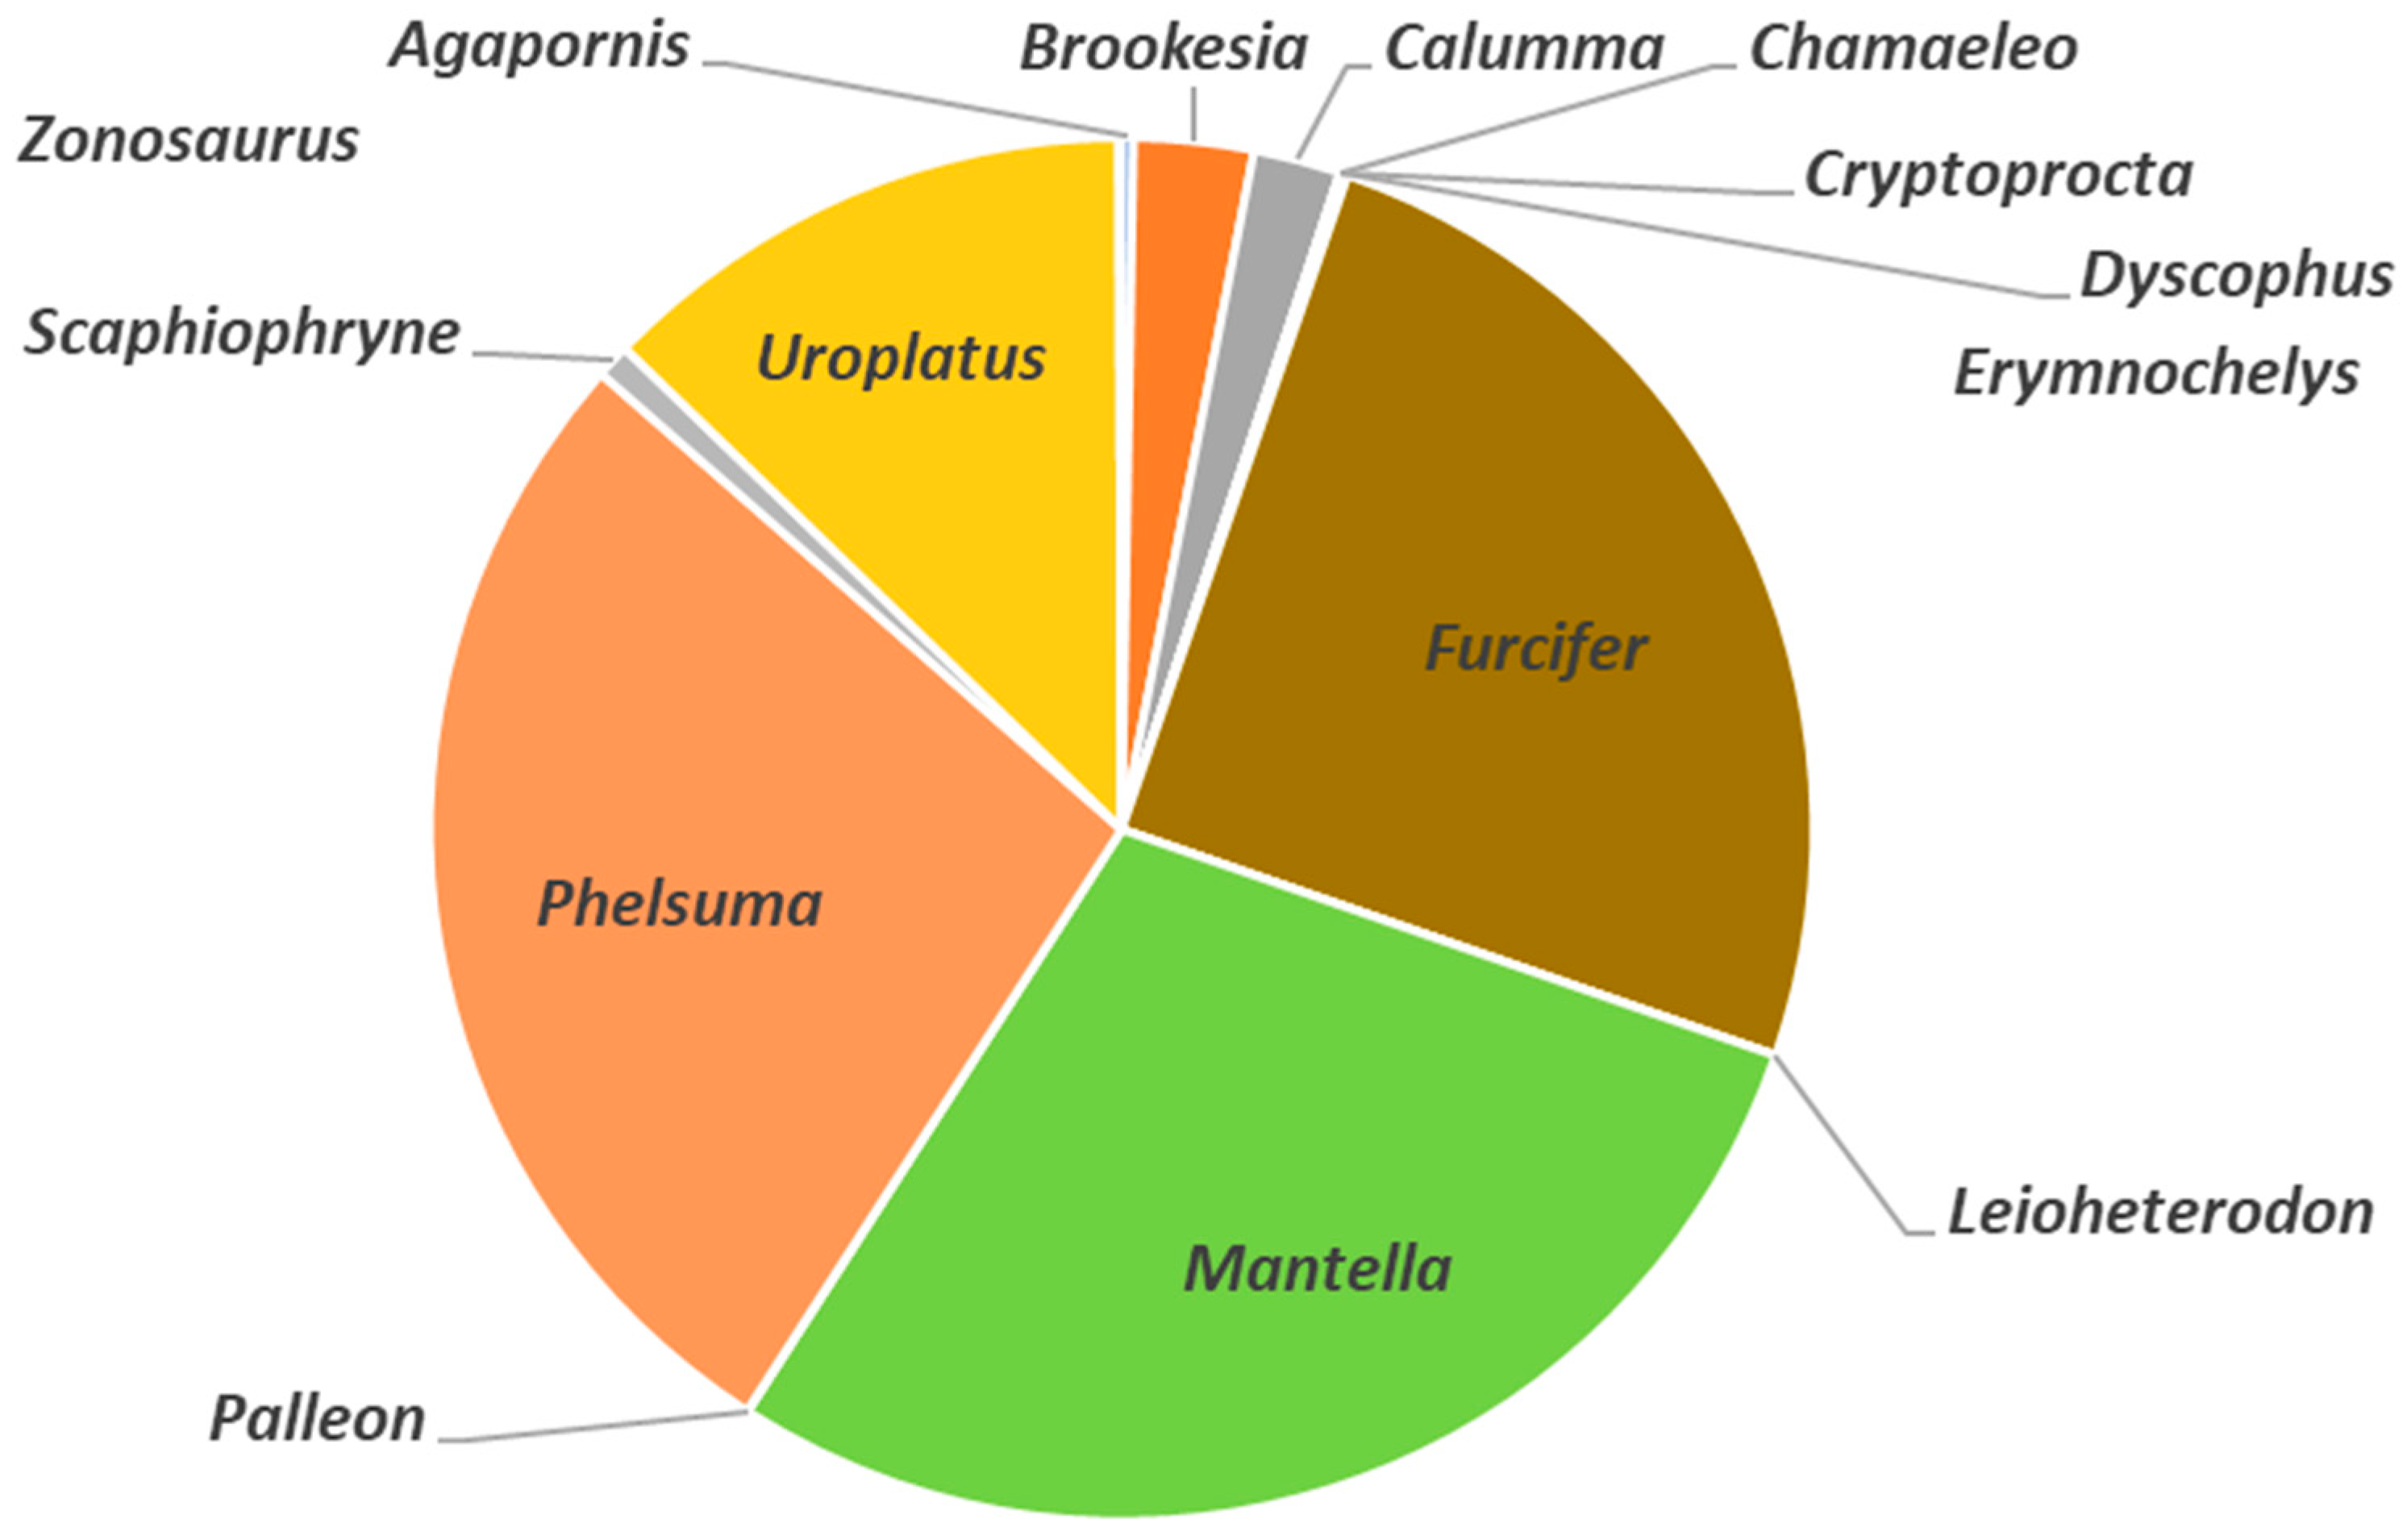
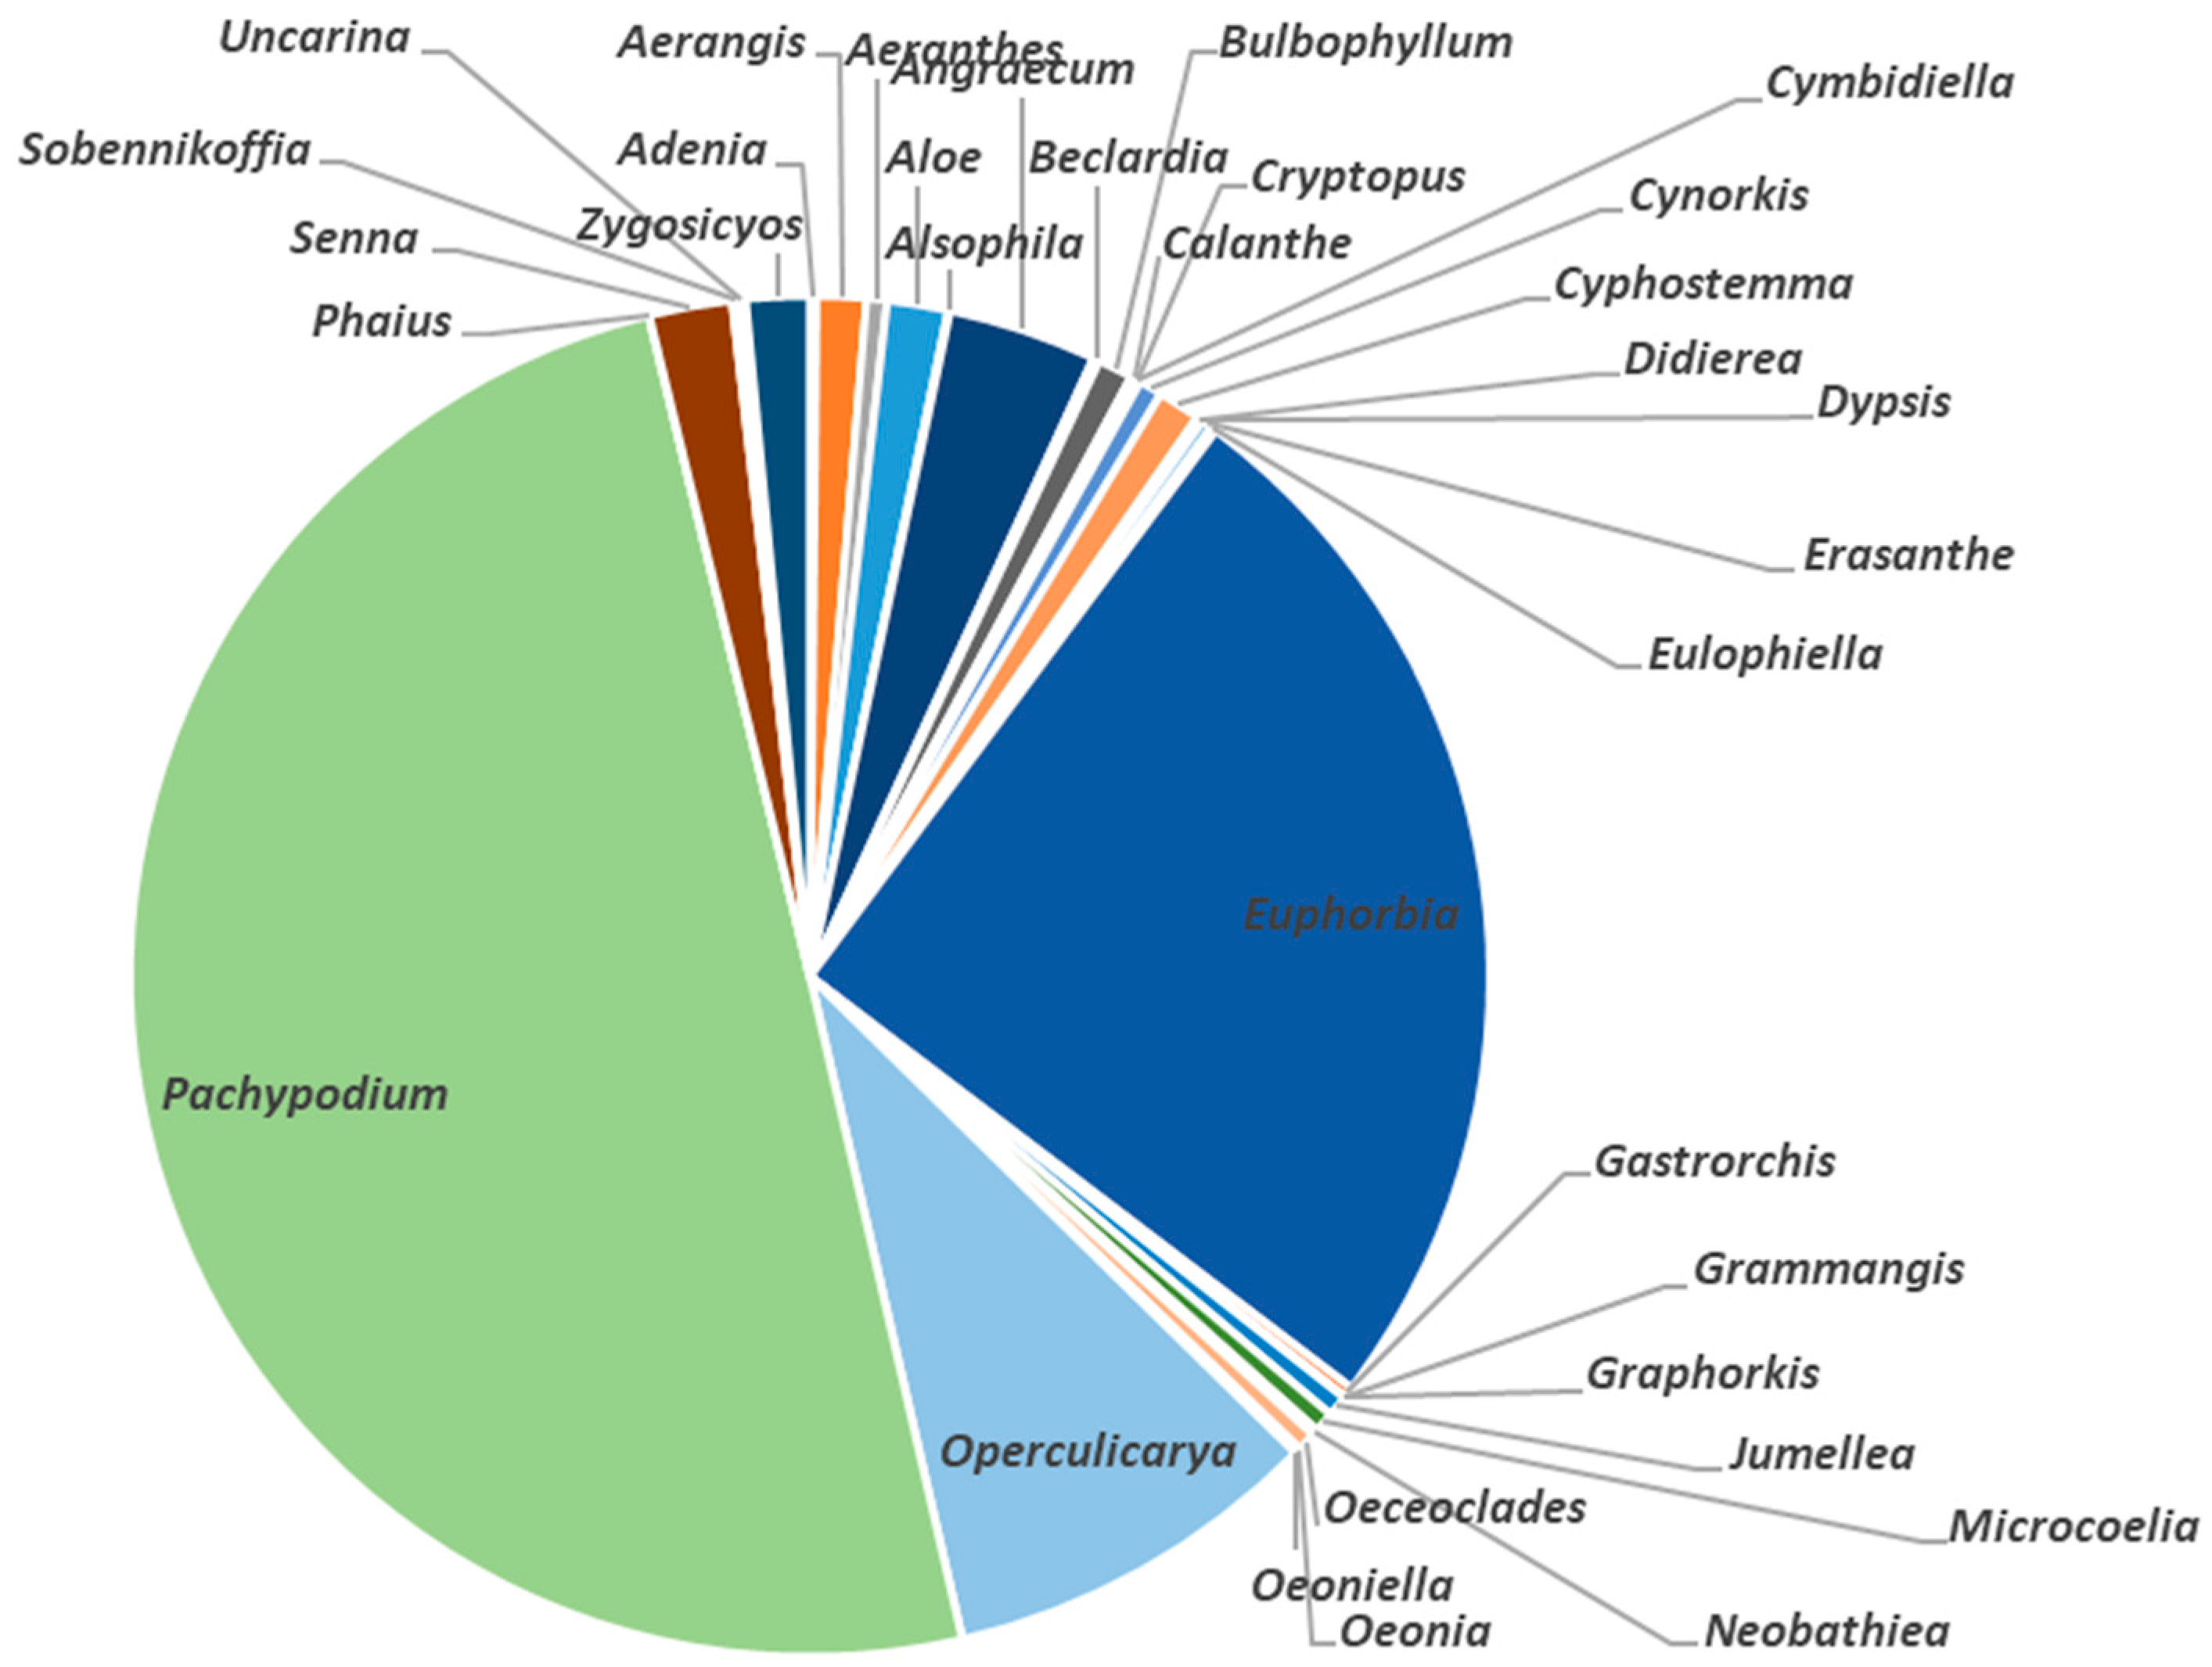
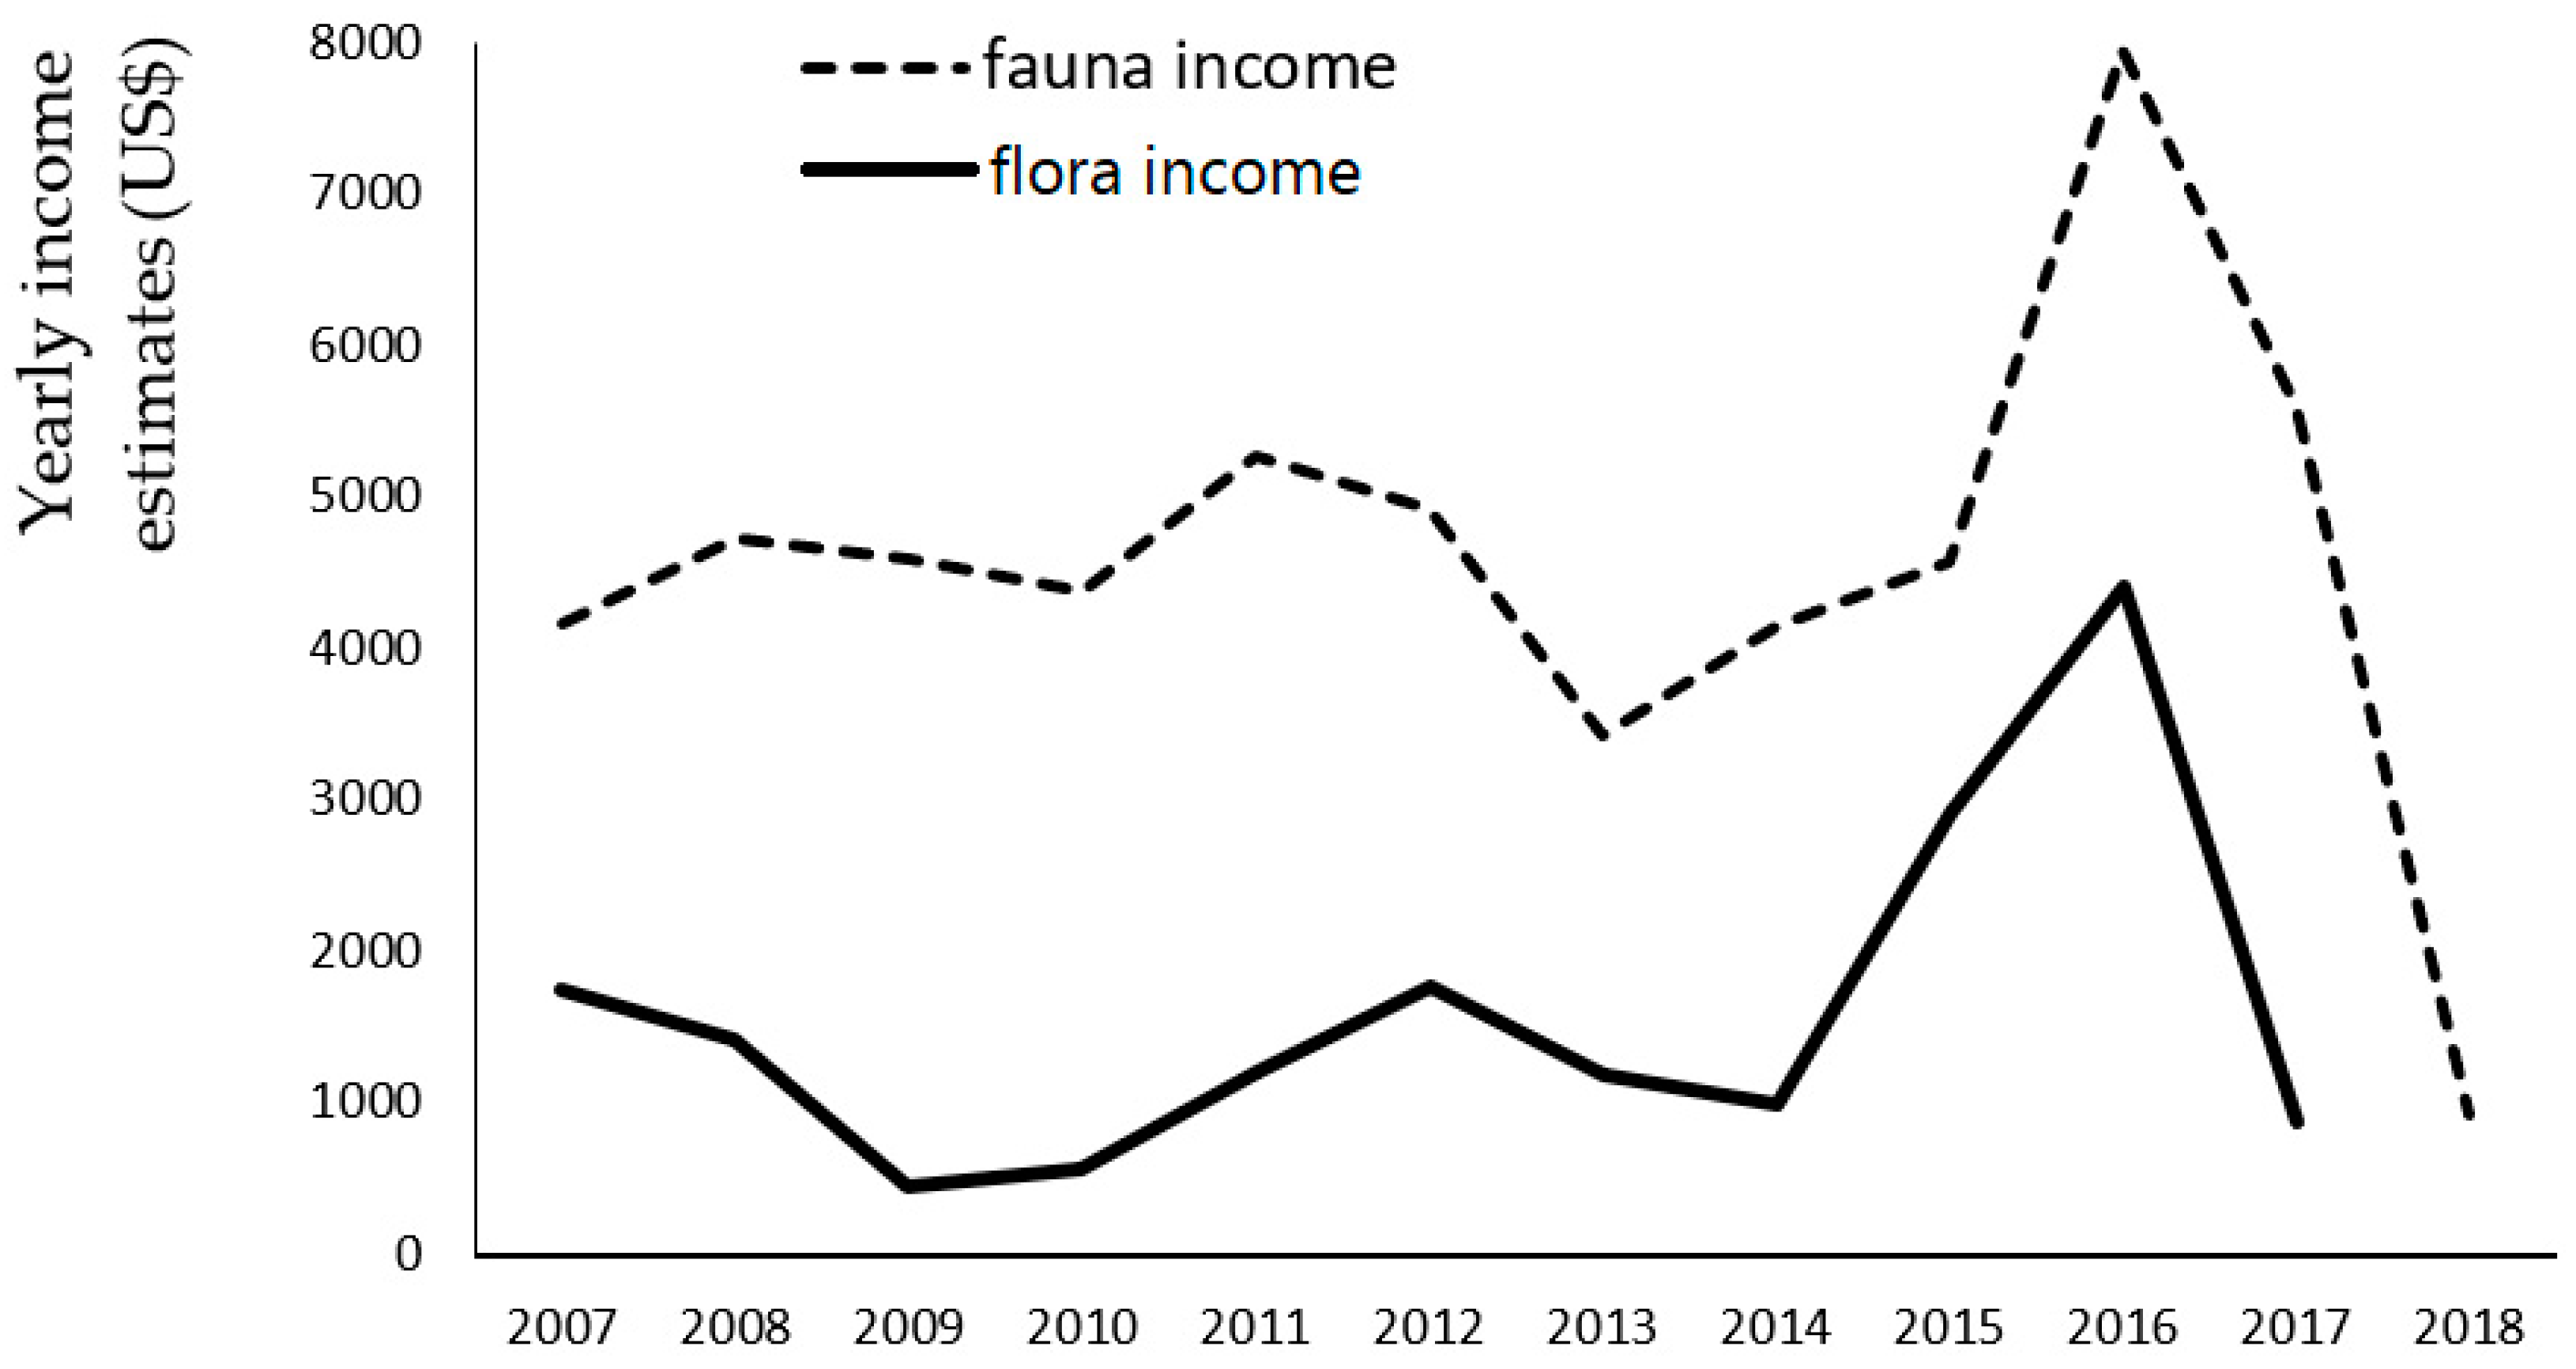
3.2. Flora and Fauna Trade Revenues
4. Discussion
5. Conclusions
Author Contributions
Funding
Data Availability Statement
Acknowledgments
Conflicts of Interest
References
- IPBES. Global Assessment Report on Biodiversity and Ecosystem Services of the 733 Intergovernmental Science-Policy Platform on Biodiversity and Ecosystem Services; IPBES Secretariat: Bonn, Germany, 2019. [Google Scholar]
- Low, B.R.; Costanza, E.; Ostrom, J.; Wilson, S.C. Human-ecosystem interactions: A dynamic integrated model. Ecol. Econ. 1999, 31, 227–242. [Google Scholar] [CrossRef]
- Milner-Gulland, E.; Mace, R. Conservation of Biological Resources; Blackwell Science: Oxford, UK, 1998. [Google Scholar]
- Brown, D. Participatory biodiversity conservation rethinking the strategy in the low potential areas of tropical Africa. In Natural Resource Perspectives; Overseas Development Institute: London, UK, 1998; Volume 44. [Google Scholar]
- Martin, A.; McGuire, S.; Sullivan, S. Global environmental justice and biodiversity conservation. Geogr. J. 2013, 179, 122–131. [Google Scholar] [CrossRef]
- Walker, G. Environmental Justice: Concepts, Evidence and Politics; Routledge: London, UK, 2012. [Google Scholar]
- Chan, K.; Satterfield, T. Justice, equity and biodiversity. In The Encyclopedia of Biodiversity; Levin, S., Daily, G.C., Colwell, R.K., Eds.; Elsevier: Oxford, UK, 2007; pp. 1–9. [Google Scholar]
- Casse, T.; Milhøj, A.; Ranaivoson, S.; Randriamanarivo, J.R. Causes of deforestation in southwestern Madagascar: What do we know? For. Policy Econ. 2004, 6, 33–48. [Google Scholar] [CrossRef]
- Golden, C.D.; Bonds, M.H.; Brashares, J.S.; Rasolofoniaina, B.J.R.; Kremen, C. Economic Valuation of Subsistence Harvest of Wildlife in Madagascar. Conserv. Biol. 2014, 28, 234–243. [Google Scholar] [CrossRef] [PubMed]
- Norman, D. Man and tegu lizards in eastern Paraguay. Biol. Conserv. 1987, 41, 39–56. [Google Scholar] [CrossRef]
- IPBES; Pascual, U.; Balvanera, P.; Christie, M.; Baptiste, B.; González-Jiménez, D.; Anderson, C.B.; Athayde, S.; Barton, D.N.; Chaplin-Kramer, R.; et al. (Eds.) Summary for Policymakers of the Methodological Assessment Report on the Diverse Values and Valuation of Nature of the Intergovernmental Science-Policy Platform on Biodiversity and Ecosystem Services; IPBES Secretariat: Bonn, Germany, 2022. [Google Scholar] [CrossRef]
- Gibbons, J.W.; Scott, D.E.; Ryan, T.J.; Buhlmann, K.A.; Tuberville, T.D.; Metts, B.S.; Greene, J.L.; Mills, T.; Leiden, Y.; Poppy, S.; et al. The Global Decline of Reptiles, Déjà Vu Amphibians. BioScience 2000, 50, 653–666. [Google Scholar] [CrossRef]
- Reuter, K.E.; LaFleur, M.; Clarke, T.A. Illegal lemur trade grows in Madagascar. Nature 2017, 541, 157. [Google Scholar] [CrossRef]
- Patel, E.R. Logging of rare Rosewood and Palisander (Dalbergia spp.) within Marojejy National Park, Madagascar. Madag. Conserv. Dev. 2007, 2, 11–16. [Google Scholar]
- Jenkins, R.K.B.; Tognelli, M.F.; Bowles, P.; Cox, N.; Brown, J.L.; Chan, L.; Andreone, F.; Andriamazava, A.; Andriantsimanarilafy, R.R.; Anjeriniaina, M.; et al. Extinction Risks and the Conservation of Madagascar’s Reptiles. PLoS ONE 2014, 9, 100173. [Google Scholar] [CrossRef]
- Glaw, F.; Vences, M. Current counts of species diversity and endemism of Malagasy amphibians and reptiles. In Diversité et Endémisme à Madagascar; Lourenço, W.R., Goodman, S.M., Eds.; Mémoires de la Société de Biogéographie: Paris, France, 2000; pp. 243–248. [Google Scholar]
- Goodman, S.M. (Ed.) The New Natural History of Madagascar; Princeton University Press: Princeton, NJ, USA, 2022. [Google Scholar]
- Rabesahala Horning, N. Madagascar’s biodiversity conservation challenge: From local- to national-level dynamics. Environ. Sci. 2008, 5, 109–128. [Google Scholar] [CrossRef]
- Ferraro, P.J. The local costs of establishing protected areas in low-income nations: Ranomafana National Park, Madagascar. Ecol. Econ. 2002, 43, 261–275. [Google Scholar] [CrossRef]
- Shyamsundar, P.; Kramer, R. Biodiversity conservation—At what cost? A study of households in the vicinity of Madagascar’s Mantadia National Park. Ambio 1997, 26, 180–184. [Google Scholar]
- Nicoll, M.E.; Langrand, O. Madagascar: Revue de la Conservation et des Aires Protégées; WWF: Gland, Switzerland, 1989. [Google Scholar]
- Durbin, J.; Ralambo, J.A. The role of local people in the successful maintenance of protected areas in Madagascar. Environ. Conserv. 1994, 21, 115–120. [Google Scholar] [CrossRef]
- Gardner, C.J.; Nicoll, M.E.; Mbohoahy, T.; Oleson, K.L.L.; Ratsifandrihamanana, A.N.; Ratsirarson, J.; de Roland, L.-A.R.; Virah-Sawmy, M.; Zafindrasilivonona, B.; Davies, Z.G. Protected areas for conservation and poverty alleviation: Experiences from Madagascar. J. Appl. Ecol. 2013, 50, 1289–1294. [Google Scholar] [CrossRef]
- Keane, A.; Ramarolahy, A.A.; Jones, J.P.G.; Milner-Gulland, E.J. Evidence for the effects of environmental engagement and education on knowledge of wildlife laws in Madagascar. Conserv. Lett. 2011, 4, 55–63. [Google Scholar] [CrossRef]
- Dixon, J.A.; Pagiola, S. Ecotourism: Incentives for Conservation Success; Environment Department, World Bank: Washington, DC, USA, 2001. [Google Scholar]
- Buckley, R. Conservation Tourism; CABI: Cambridge, UK, 2010. [Google Scholar]
- Ormsby, A.; Mannle, K. Ecotourism benefits and the role of local guides at Masoala National Park, Madagascar. J. Sustain. Tour. 2006, 14, 271–287. [Google Scholar] [CrossRef]
- Neudert, R.; Ganzhorn, J.U.; Wathold, F. Global benefits and local costs—The dilemma of tropical forest conservation: A review of the situation in Madagascar. Environ. Conserv. 2017, 44, 82–96. [Google Scholar] [CrossRef]
- Kasim, A. Towards a wider adoption of environmental responsibility in the hotel sector. Int. J. Hosp. Tour. Adm. 2007, 8, 25–49. [Google Scholar] [CrossRef]
- Platt, J.R. Ring-Tailed Lemurs Threatened by Illegal Pet Trade. Scientific American. 7 August 2015. Available online: https://blogs.scientificamerican.com/extinction-countdown/ring-tailed-lemurs-pet-trade/ (accessed on 1 December 2019).
- Moorhouse, T.P.; Dahlsjö, C.A.; Baker, S.E.; D’Cruze, N.C.; Macdonald, D.W. The customer isn’t always right—Conservation and animal welfare implications of the increasing demand for wildlife tourism. PLoS ONE 2015, 10, e0138939. [Google Scholar] [CrossRef]
- Moorhouse, T.; D’Cruze, N.C.; Macdonald, D.W. Unethical use of wildlife in tourism: What’s the problem, who is responsible, and what can be done? J. Sustain. Tour. 2017, 25, 505–516. [Google Scholar] [CrossRef]
- Peters, J. Sharing national park entrance fees: Forging new partnerships in Madagascar. Soc. Nat. Resour. 1998, 11, 517–530. [Google Scholar] [CrossRef]
- Wollenberg, K.C.; Jenkins, R.K.; Randrianavelona, R.; Rampilamanana, R.; Ralisata, M.; Ramanandraibe, A.; Ravoahangimalala, O.R.; Vences, M. On the shoulders of lemurs: Pinpointing the ecotouristic potential of Madagascar’s unique herpetofauna. J. Ecotourism 2011, 10, 101–117. [Google Scholar] [CrossRef]
- Brady, L.D.; Griffiths, R.A. Status Assessment of Chameleons in Madagascar; IUCN Species Survival Commission, IUCN: Cambridge, UK, 1999. [Google Scholar]
- Robinson, J.E.; Fraser, I.M.; John, F.A.V.S.; Randrianantoandro, J.C.; Andriantsimanarilafy, R.R.; Razafimanahaka, J.H.; Griffiths, R.A.; Roberts, D.L. Wildlife supply chains in Madagascar from local collection to global export. Biol. Conserv. 2018, 226, 144–152. [Google Scholar] [CrossRef]
- Ganzhorn, J.; Manjoazy, T.; Paplow, O.; Randrianavelona, R.; Razafimanahaka, J.; Ronto, W.; Walker, R. Rights to trade for species conservation: Exploring the issue of the radiated tortoise in Madagascar. Environ. Conserv. 2015, 42, 291–293. [Google Scholar] [CrossRef]
- Waeber, P.O.; Wilmé, L. Madagascar rich and intransparent. Madag. Conserv. Dev. 2013, 8, 52–54. [Google Scholar] [CrossRef]
- Morgan, J.; Chng, S. Rising internet-based trade in the Critically Endangered ploughshare tortoise Astrochelys yniphora in Indonesia highlights need for improved enforcement of CITES. Oryx 2018, 52, 744–750. [Google Scholar] [CrossRef]
- Innes, J.L. Madagascar rosewood, illegal logging and the tropical timber trade. Madag. Conserv. Dev. 2010, 5, 6–10. [Google Scholar] [CrossRef]
- Rabemananjara, F.C.E.; Raminosoa, N.R.; Ramilijaona, O.R.; Rakotondravony, D.; Andreone, F.; Bora, P.; Carpenter, A.I.; Glaw, F.; Razafindrabe, T.; Vallan, D.; et al. Malagasy poison frogs in the pet trade: A survey of levels of exploitation of species in the genus Mantella. In Conservation Strategy for the Amphibians of Madagascar Proceedings; Andreone, F., Ed.; Monografie del Museo Regionale di Scienze Natural di Torino: Turin, Italy, 2008; pp. 277–300. [Google Scholar]
- Carpenter, A.I.; Robson, O. Madagascan amphibians as a wildlife resource and their potential as a conservation tool: Species and numbers exported, revenue generation and bio-economic models to explore conservation benefits. In Conservation Strategy for the Amphibians of Madagascar Proceedings; Andreone, F., Ed.; Monografie del Museo Regionale di Scienze Natural di Torino: Turin, Italy, 2008; pp. 357–376. [Google Scholar]
- Carpenter, A.I.; Rowcliffe, M.; Watkinson, A.R. The dynamics of the global trade in chameleons. Biol. Conserv. 2004, 120, 295–305. [Google Scholar] [CrossRef]
- Carpenter, A.I.; Andreone, F.; Moore, R.D.; Griffiths, R.A. A review of the global trade in amphibians: The types of trade, levels and dynamics in CITES listed species. Oryx 2014, 48, 565–574. [Google Scholar] [CrossRef]
- Carpenter, A.I.; Robson, O.; Rowcliffe, M.; Watkinson, A.R. The impacts of international and national governance on a traded resource: A case study of Madagascar and its chameleon trade. Biol. Conserv. 2005, 123, 279–287. [Google Scholar] [CrossRef]
- Vaglica, V.; Sajeva, M.; McGough, H.N.; Hutchison, D.; Russo, C.; Gordon, A.D.; Ramarosandratana, A.V.; Stuppy, W.; Smith, M.J. Monitoring internet trade to inform species conservation actions. Endanger. Species Res. 2017, 32, 223–235. [Google Scholar] [CrossRef]
- Reuter, K.E.; Clarke, T.A.; LaFleur, M.; Rodriguez, L.; Hanitriniaina, S.; Schaefer, M.S. Trade of parrots in urban areas of Madagascar. Madag. Conserv. Dev. 2017, 12, 41–48. [Google Scholar] [CrossRef]
- World’s Top Exports. Madagascar’s Top 10 Exports. 2019. Available online: http://www.worldstopexports.com/madagascars-top-10-exports/ (accessed on 15 October 2019).
- Jacobson, S.K.; Lopez, A.F. Biological impacts of ecotourism: Tourists and nesting turtles in Tortuguero National Park, Costa Rica. Wildl. Soc. Bull. 1994, 22, 414–419. [Google Scholar]
- Meissner, A.M.; Christiansen, F.; Martinez, E.; Pawley, M.D.; Orams, M.B.; Stockin, K.A. Behavioural effects of tourism on oceanic common dolphins, Delphinus sp., in New Zealand: The effects of markov analysis variations and current tour operator compliance with regulations. PLoS ONE 2015, 10, e0116962. [Google Scholar] [CrossRef] [PubMed]


| 2007 | 2008 | 2009 | 2010 | 2011 | 2012 | 2013 | 2014 | 2015 | 2016 | 2017 | 2018 | |
|---|---|---|---|---|---|---|---|---|---|---|---|---|
| Number of tourists arriving on Madagascar * | 344,348 | 375,010 | 162,687 | 19,052 | 225,055 | 255,942 | 196,375 | 222,374 | 244,321 | 293,185 | 255,460 | 291,299 |
| Tourist income generation (USD millions) | 313 | 45,965 | 1785 | 2111 | 26,249 | 27,981 | 39,042 | 64,962 | 58,538 | 748,297 | 668,262 | |
| Number of ecotourists (17%; Wollenberg et al., 2011 [34]) | 58,539 | 63,752 | 27,657 | 3239 | 38,259 | 43,510 | 33,384 | 37,804 | 41,535 | 49,841 | 43,428 | 49,521 |
| Genus | Species | No. | % |
|---|---|---|---|
| AMPHIBIANS | |||
| Mantella | 68,798 | ||
| Mantella betsileo | 22,737 | 33.0 | |
| Mantella baroni | 21,110 | 30.7 | |
| Mantella nigricans | 7306 | 10.6 | |
| Mantella pulchra | 5969 | 8.7 | |
| REPTILES | |||
| Phelsuma | 65,329 | ||
| Phelsuma lineata | 17,939 | 27.5 | |
| Phelsuma quadriocellata | 15,534 | 23.8 | |
| Phelsuma laticauda | 14,124 | 21.6 | |
| Phelsuma madagascariensis | 10,563 | 16.2 | |
| Uroplatus | 30,335 | ||
| Uroplatus sikorae | 10,059 | 33.2 | |
| Uroplatus fimbriatus | 6170 | 20.3 | |
| Uroplatus phantasticus | 5002 | 16.5 | |
| Uroplatus ebenaui | 4202 | 13.9 | |
| Brookesia | 6686 | ||
| Brookesia superciliaris | 1927 | 28.8 | |
| Brookesia stumpffi | 1657 | 24.8 | |
| Brookesia thieli | 1326 | 19.8 | |
| Brookesia therezieni | 1169 | 17.5 | |
| Furcifer | 59,722 | ||
| Furcifer pardalis | 19,029 | 31.9 | |
| Furcifer lateralis | 15,908 | 26.6 | |
| Furcifer oustaleti | 11,268 | 18.9 | |
| Furcifer verrucosus | 11,312 | 18.9 | |
| Genus | Species | No. | % |
|---|---|---|---|
| Pachypodium | 22,967 | ||
| Pachypodium spp. | 7532 | 32.8 | |
| Pachypodium brevicaule | 4219 | 18.4 | |
| Pachypodium densiflorum | 4232 | 18.4 | |
| Pachypodium eburneum | 2352 | 10.2 | |
| Euphorbia | 11,608 | ||
| Euphorbia primulifolia | 3184 | 27.4 | |
| Euphorbia spp. | 1222 | 10.5 | |
| Euphorbia itremensis | 1088 | 9.4 | |
| Euphorbia guillauminiana | 1029 | 8.9 | |
| Operculicarya | 4175 | ||
| Operculicarya pachypus | 3337 | 79.9 | |
| Operculicarya decaryi | 430 | 10.3 | |
| Operculicarya hyphaenoides | 408 | 9.8 | |
| Angraecum | 1632 | ||
| Angraecum urschianum | 113 | 6.9 | |
| Angraecum breve | 95 | 5.8 | |
| Angraecum germinyanum | 95 | 5.8 | |
| Angraecum teretifolium | 89 | 5.5 |
| Animals | 2007 | Price | Value | 2008 | Price | Value | 2009 | Price | Value | 2010 | Price | Value | 2011 | Price | Value | 2012 | Price | Value | 2013 | Price | Value | 2014 | Price | Value | 2015 | Price | Value | 2016 | Price | Value | 2017 | Price | Value | 2018 | Price | Value | Grand Total | ||
|---|---|---|---|---|---|---|---|---|---|---|---|---|---|---|---|---|---|---|---|---|---|---|---|---|---|---|---|---|---|---|---|---|---|---|---|---|---|---|---|
| Anura | 7772 | 7348 | 8076 | 8000 | 6194 | 6191 | 6815 | 6395 | 3346 | 6070 | 4140 | 703 | 71,050 | ||||||||||||||||||||||||||
| Dyscophus | 0.25 | 0 | 0.26 | 0 | 0.26 | 0 | 0.26 | 0 | 0.27 | 0 | 0.28 | 0 | 0.28 | 0 | 0.28 | 0 | 0.28 | 0 | 0.29 | 0 | 232 | 0.29 | 67.28 | 110 | 0.3 | 33 | 342 | ||||||||||||
| Mantella * | 7307 | 0.11 | 803.77 | 7177 | 0.11 | 789.47 | 7699 | 0.11 | 846.89 | 7698 | 0.11 | 846.78 | 6003 | 0.12 | 720.36 | 6028 | 0.12 | 723.36 | 6644 | 0.12 | 797.28 | 6347 | 0.12 | 761.64 | 3346 | 0.12 | 401.52 | 6070 | 0.12 | 728.4 | 3886 | 0.13 | 505.18 | 593 | 0.13 | 77.09 | 68,798 | ||
| Scaphiophryne | 465 | 0.25 | 116.25 | 171 | 0.26 | 44.46 | 377 | 0.26 | 98.02 | 302 | 0.26 | 78.52 | 191 | 0.27 | 51.57 | 163 | 0.28 | 45.64 | 171 | 0.28 | 47.88 | 48 | 0.28 | 13.44 | 0.28 | 0 | 0.29 | 0 | 22 | 0.29 | 6.38 | 0.3 | 0 | 1910 | |||||
| Carnivora | 0 | 4 | 4 | ||||||||||||||||||||||||||||||||||||
| Cryptoprocta | 0 | 0 | 0 | 0 | 0 | 0 | 0 | 0 | 0 | 4 | 0 | 0 | 4 | ||||||||||||||||||||||||||
| Psittaciformes | 0 | 250 | 300 | 100 | 650 | ||||||||||||||||||||||||||||||||||
| Agapornis ^ | 0.3 | 0 | 0.31 | 0 | 0.31 | 0 | 0.31 | 0 | 0.32 | 0 | 0.33 | 0 | 250 | 0.33 | 82.5 | 300 | 0.34 | 102 | 0.34 | 0 | 0.34 | 0 | 0.35 | 0 | 100 | 0.36 | 36 | 650 | |||||||||||
| Sauria | 12,991 | 0 | 14,995 | 14,030 | 13,253 | 16,697 | 14,812 | 8937 | 11,677 | 14,923 | 24,873 | 17,351 | 2592 | 167,131 | |||||||||||||||||||||||||
| Brookesia | 267 | 0.25 | 66.75 | 267 | 0.26 | 69.42 | 396 | 0.26 | 102.96 | 348 | 0.26 | 90.48 | 564 | 0.27 | 152.28 | 386 | 0.28 | 108.08 | 298 | 0.28 | 83.44 | 212 | 0.28 | 59.36 | 922 | 0.28 | 258.16 | 1781 | 0.29 | 516.49 | 1010 | 0.29 | 292.9 | 235 | 0.3 | 70.5 | 6686 | ||
| Calumma | 0.25 | 0 | 0.26 | 0 | 0.26 | 0 | 0.26 | 0 | 0.27 | 0 | 0.28 | 0 | 0.28 | 0 | 262 | 0.28 | 73.36 | 1326 | 0.28 | 371.28 | 2103 | 0.29 | 609.87 | 1152 | 0.29 | 334.08 | 28 | 0.3 | 8.4 | 4871 | |||||||||
| Chamaeleo Ϯ | 0.25 | 0 | 0.26 | 0 | 0.26 | 0 | 0.26 | 0 | 0.27 | 0 | 0.28 | 0 | 0.28 | 0 | 0.28 | 0 | 0.28 | 0 | 10 | 0.29 | 2.9 | 0.29 | 0 | 0.3 | 0 | 10 | |||||||||||||
| Furcifer | 4079 | 0.25 | 1019.75 | 4794 | 0.26 | 1246.44 | 4046 | 0.26 | 1051.96 | 4549 | 0.26 | 1182.74 | 6116 | 0.27 | 1651.32 | 6638 | 0.28 | 1858.64 | 4259 | 0.28 | 1192.52 | 5410 | 0.28 | 1514.8 | 4997 | 0.28 | 1399.16 | 8364 | 0.29 | 2425.56 | 5512 | 0.29 | 1598.48 | 958 | 0.3 | 287.4 | 59,722 | ||
| Palleon | 0.25 | 0 | 0.26 | 0 | 0.26 | 0 | 0.26 | 0 | 0.27 | 0 | 0.28 | 0 | 0.28 | 0 | 0.28 | 0 | 6 | 0.28 | 1.68 | 15 | 0.29 | 4.35 | 11 | 0.29 | 3.19 | 0.3 | 0 | 32 | |||||||||||
| Phelsuma | 4273 | 0.25 | 1068.25 | 4830 | 0.26 | 1255.8 | 5577 | 0.26 | 1450.02 | 5203 | 0.26 | 1352.78 | 7776 | 0.27 | 2099.52 | 6383 | 0.28 | 1787.24 | 3556 | 0.28 | 995.68 | 4539 | 0.28 | 1270.92 | 5617 | 0.28 | 1572.76 | 8942 | 0.29 | 2593.18 | 7328 | 0.29 | 2125.12 | 1305 | 0.3 | 391.5 | 65,329 | ||
| Uroplatus | 4297 | 0.25 | 1074.25 | 5104 | 0.26 | 1327.04 | 3990 | 0.26 | 1037.4 | 3153 | 0.26 | 819.78 | 2241 | 0.27 | 605.07 | 1405 | 0.28 | 393.4 | 824 | 0.28 | 230.72 | 1254 | 0.28 | 351.12 | 2055 | 0.28 | 575.4 | 3633 | 0.29 | 1053.57 | 2338 | 0.29 | 678.02 | 41 | 0.3 | 12.3 | 30,335 | ||
| Zonosaurus | 75 | 0.25 | 18.75 | 0.26 | 0 | 21 | 0.26 | 5.46 | 0.26 | 0 | 0.27 | 0 | 0.28 | 0 | 0.28 | 0 | 0.28 | 0 | 0.28 | 0 | 25 | 0.29 | 7.25 | 0.29 | 0 | 25 | 0.3 | 7.5 | 146 | ||||||||||
| Serpentes | 0 | 5 | 16 | 21 | |||||||||||||||||||||||||||||||||||
| Leioheterodon | 0.25 | 0 | 5 | 0.26 | 1.3 | 0.26 | 0 | 16 | 0.26 | 4.16 | 0.27 | 0 | 0.28 | 0 | 0.28 | 0 | 0.28 | 0 | 0.28 | 0 | 0.29 | 0 | 0.29 | 0 | 0.3 | 0 | 21 | ||||||||||||
| Testudines | 14 | 0 | 3 | 10 | 2 | 16 | 8 | 15 | 16 | 10 | 11 | 105 | |||||||||||||||||||||||||||
| Erymnochelys | 14 | 0.25 | 3.5 | 3 | 0.26 | 0.78 | 10 | 0.26 | 2.6 | 2 | 0.26 | 0.52 | 0.27 | 0 | 16 | 0.28 | 4.48 | 8 | 0.28 | 2.24 | 15 | 0.28 | 4.2 | 16 | 0.28 | 4.48 | 10 | 0.29 | 2.9 | 11 | 0.29 | 3.19 | 0.3 | 0 | 105 | ||||
| Animal total | 20,777 | 4171.27 | 22,351 | 4734.71 | 22,116 | 4595.31 | 21,271 | 4375.76 | 22,891 | 5280.12 | 21,019 | 4920.84 | 16,010 | 3432.26 | 18,387 | 4150.84 | 18,285 | 4584.44 | 30,953 | 7944.47 | 21,506 | 5613.82 | 3395 | 923.69 | 238,961 | ||||||||||||||
| Plants | 2007 | Price | Value | 2008 | Price | Value | 2009 | Price | Value | 2010 | Price | Value | 2011 | Price | Value | 2012 | Price | Value | 2013 | Price | Value | 2014 | Price | Value | 2015 | Price | value | 2016 | Price | Value | 2017 | Price | Value | ||||||
| Arecales | 32.93 | 34.2 | 34.07 | 34.63 | 35.73 | 36.47 | 37 | 37.6 | 37.64 | 38.12 | 38.93 | ||||||||||||||||||||||||||||
| Dypsis | 3 | 0.33 | 0.99 | 0.34 | 0 | 0.34 | 0 | 0.35 | 0 | 0.36 | 0 | 0.37 | 0 | 0.37 | 0 | 0.38 | 0 | 0.38 | 0 | 0.38 | 0 | 0.39 | 0 | 3 | |||||||||||||||
| Caryophyllales | 0.33 | 0 | 0.34 | 0 | 0.34 | 0 | 0.35 | 0 | 0.36 | 0 | 0.37 | 0 | 0.37 | 0 | 0.38 | 0 | 0.38 | 0 | 0.38 | 0 | 0.39 | 0 | |||||||||||||||||
| Alluaudia | 0.33 | 0 | 0.34 | 0 | 0.34 | 0 | 0.35 | 0 | 0.36 | 0 | 0.37 | 0 | 0.37 | 0 | 0.38 | 0 | 0.38 | 0 | 0.38 | 0 | 0.39 | 0 | |||||||||||||||||
| Didierea | 0.33 | 0 | 0.34 | 0 | 0.34 | 0 | 50 | 0.35 | 17.5 | 0.36 | 0 | 0.37 | 0 | 0.37 | 0 | 3 | 0.38 | 1.14 | 0.38 | 0 | 20 | 0.38 | 7.6 | 0.39 | 0 | 73 | |||||||||||||
| Cyatheales | 0.33 | 0 | 0.34 | 0 | 0.34 | 0 | 0.35 | 0 | 0.36 | 0 | 0.37 | 0 | 0.37 | 0 | 0.38 | 0 | 0.38 | 0 | 0.38 | 0 | 0.39 | 0 | |||||||||||||||||
| Alsophila | 20 | 0.33 | 6.6 | 0.34 | 0 | 0.34 | 0 | 0.35 | 0 | 0.36 | 0 | 0.37 | 0 | 0.37 | 0 | 0.38 | 0 | 0.38 | 0 | 0.38 | 0 | 0.39 | 0 | 20 | |||||||||||||||
| Euphorbiales | 0.33 | 0 | 0.34 | 0 | 0.34 | 0 | 0.35 | 0 | 0.36 | 0 | 0.37 | 0 | 0.37 | 0 | 0.38 | 0 | 0.38 | 0 | 0.38 | 0 | 0.39 | 0 | |||||||||||||||||
| Euphorbia | 1381 | 0.33 | 455.73 | 1033 | 0.34 | 351.22 | 620 | 0.34 | 210.8 | 370 | 0.35 | 129.5 | 895 | 0.36 | 322.2 | 1600 | 0.37 | 592 | 710 | 0.37 | 262.7 | 1104 | 0.38 | 419.52 | 1411 | 0.38 | 536.18 | 1974 | 0.38 | 750.12 | 510 | 0.39 | 198.9 | 11,608 | |||||
| Fabales | 0.33 | 0 | 0.34 | 0 | 0.34 | 0 | 0.35 | 0 | 0.36 | 0 | 0.37 | 0 | 0.37 | 0 | 0.38 | 0 | 0.38 | 0 | 0.38 | 0 | 0.39 | 0 | |||||||||||||||||
| Senna | 0.33 | 0 | 0.34 | 0 | 0.34 | 0 | 0.35 | 0 | 0.36 | 0 | 0.37 | 0 | 0.37 | 0 | 55 | 0.38 | 20.9 | 502 | 0.38 | 190.76 | 350 | 0.38 | 133 | 0.39 | 0 | 907 | |||||||||||||
| Gentianales | 0.33 | 0 | 0.34 | 0 | 0.34 | 0 | 0.35 | 0 | 0.36 | 0 | 0.37 | 0 | 0.37 | 0 | 0.38 | 0 | 0.38 | 0 | 0.38 | 0 | 0.39 | 0 | |||||||||||||||||
| Pachypodium | 2798 | 0.33 | 923.34 | 2434 | 0.34 | 827.56 | 530 | 0.34 | 180.2 | 945 | 0.35 | 330.75 | 1876 | 0.36 | 675.36 | 2598 | 0.37 | 961.26 | 1425 | 0.37 | 527.25 | 1156 | 0.38 | 439.28 | 3175 | 0.38 | 1206.5 | 5470 | 0.38 | 2078.6 | 560 | 0.39 | 218.4 | 22,967 | |||||
| Liliales | 0.33 | 0 | 0.34 | 0 | 0.34 | 0 | 0.35 | 0 | 0.36 | 0 | 0.37 | 0 | 0.37 | 0 | 0.38 | 0 | 0.38 | 0 | 0.38 | 0 | 0.39 | 0 | |||||||||||||||||
| Aloe | 390 | 0.33 | 128.7 | 130 | 0.34 | 44.2 | 0.34 | 0 | 0.35 | 0 | 100 | 0.36 | 36 | 50 | 0.37 | 18.5 | 0.37 | 0 | 0.38 | 0 | 0.38 | 0 | 0.38 | 0 | 0.39 | 0 | 670 | ||||||||||||
| Orchidales | 0.33 | 0 | 0.34 | 0 | 0.34 | 0 | 0.35 | 0 | 0.36 | 0 | 0.37 | 0 | 0.37 | 0 | 0.38 | 0 | 0.38 | 0 | 0.38 | 0 | 0.39 | 0 | |||||||||||||||||
| Aerangis | 75 | 0.33 | 24.75 | 35 | 0.34 | 11.9 | 20 | 0.34 | 6.8 | 0.35 | 0 | 0.36 | 0 | 0.37 | 0 | 30 | 0.37 | 11.1 | 0.38 | 0 | 138 | 0.38 | 52.44 | 143 | 0.38 | 54.34 | 100 | 0.39 | 39 | 541 | |||||||||
| Aeranthes | 30 | 0.33 | 9.9 | 55 | 0.34 | 18.7 | 0.34 | 0 | 0.35 | 0 | 0.36 | 0 | 0.37 | 0 | 20 | 0.37 | 7.4 | 0.38 | 0 | 51 | 0.38 | 19.38 | 30 | 0.38 | 11.4 | 38 | 0.39 | 14.82 | 224 | ||||||||||
| Angraecum | 93 | 0.33 | 30.69 | 185 | 0.34 | 62.9 | 0.34 | 0 | 0.35 | 0 | 0.36 | 0 | 0.37 | 0 | 80 | 0.37 | 29.6 | 0.38 | 0 | 460 | 0.38 | 174.8 | 558 | 0.38 | 212.04 | 256 | 0.39 | 99.84 | 1632 | ||||||||||
| Beclardia | 13 | 0.33 | 4.29 | 0.34 | 0 | 0.34 | 0 | 0.35 | 0 | 0.36 | 0 | 0.37 | 0 | 10 | 0.37 | 3.7 | 0.38 | 0 | 22 | 0.38 | 8.36 | 18 | 0.38 | 6.84 | 7 | 0.39 | 2.73 | 70 | |||||||||||
| Bulbophyllum | 10 | 0.33 | 3.3 | 40 | 0.34 | 13.6 | 0.34 | 0 | 0.35 | 0 | 0.36 | 0 | 0.37 | 0 | 30 | 0.37 | 11.1 | 0.38 | 0 | 73 | 0.38 | 27.74 | 143 | 0.38 | 54.34 | 88 | 0.39 | 34.32 | 384 | ||||||||||
| Calanthe | 0.33 | 0 | 20 | 0.34 | 6.8 | 0.34 | 0 | 0.35 | 0 | 0.36 | 0 | 0.37 | 0 | 10 | 0.37 | 3.7 | 0.38 | 0 | 15 | 0.38 | 5.7 | 18 | 0.38 | 6.84 | 0.39 | 0 | 63 | ||||||||||||
| Cryptopus | 0.33 | 0 | 0.34 | 0 | 0.34 | 0 | 0.35 | 0 | 0.36 | 0 | 0.37 | 0 | 0.37 | 0 | 0.38 | 0 | 0.38 | 0 | 3 | 0.38 | 1.14 | 0.39 | 0 | 3 | |||||||||||||||
| Cymbidiella | 11 | 0.33 | 3.63 | 15 | 0.34 | 5.1 | 0.34 | 0 | 0.35 | 0 | 0.36 | 0 | 0.37 | 0 | 5 | 0.37 | 1.85 | 0.38 | 0 | 4 | 0.38 | 1.52 | 12 | 0.38 | 4.56 | 1 | 0.39 | 0.39 | 48 | ||||||||||
| Cynorkis | 9 | 0.33 | 2.97 | 45 | 0.34 | 15.3 | 0.34 | 0 | 0.35 | 0 | 0.36 | 0 | 0.37 | 0 | 60 | 0.37 | 22.2 | 0.38 | 0 | 40 | 0.38 | 15.2 | 94 | 0.38 | 35.72 | 9 | 0.39 | 3.51 | 257 | ||||||||||
| Erasanthe | 33 | 0.33 | 10.89 | 30 | 0.34 | 10.2 | 0.34 | 0 | 0.35 | 0 | 0.36 | 0 | 0.37 | 0 | 0.37 | 0 | 0.38 | 0 | 16 | 0.38 | 6.08 | 23 | 0.38 | 8.74 | 12 | 0.39 | 4.68 | 114 | |||||||||||
| Eulophiella | 3 | 0.33 | 0.99 | 0.34 | 0 | 0.34 | 0 | 0.35 | 0 | 0.36 | 0 | 0.37 | 0 | 5 | 0.37 | 1.85 | 0.38 | 0 | 3 | 0.38 | 1.14 | 35 | 0.38 | 13.3 | 13 | 0.39 | 5.07 | 59 | |||||||||||
| Gastrorchis | 2 | 0.33 | 0.66 | 0.34 | 0 | 0.34 | 0 | 0.35 | 0 | 0.36 | 0 | 0.37 | 0 | 25 | 0.37 | 9.25 | 0.38 | 0 | 24 | 0.38 | 9.12 | 36 | 0.38 | 13.68 | 25 | 0.39 | 9.75 | 112 | |||||||||||
| Grammangis | 9 | 0.33 | 2.97 | 0.34 | 0 | 0.34 | 0 | 0.35 | 0 | 0.36 | 0 | 0.37 | 0 | 0.37 | 0 | 0.38 | 0 | 2 | 0.38 | 0.76 | 6 | 0.38 | 2.28 | 1 | 0.39 | 0.39 | 18 | ||||||||||||
| Graphorkis | 2 | 0.33 | 0.66 | 0.34 | 0 | 0.34 | 0 | 0.35 | 0 | 0.36 | 0 | 0.37 | 0 | 0.37 | 0 | 0.38 | 0 | 0.38 | 0 | 0.38 | 0 | 0.39 | 0 | 2 | |||||||||||||||
| Jumellea | 3 | 0.33 | 0.99 | 30 | 0.34 | 10.2 | 0.34 | 0 | 0.35 | 0 | 0.36 | 0 | 0.37 | 0 | 35 | 0.37 | 12.95 | 0.38 | 0 | 45 | 0.38 | 17.1 | 66 | 0.38 | 25.08 | 50 | 0.39 | 19.5 | 229 | ||||||||||
| Microcoelia | 0.33 | 0 | 20 | 0.34 | 6.8 | 0.34 | 0 | 0.35 | 0 | 0.36 | 0 | 0.37 | 0 | 60 | 0.37 | 22.2 | 0.38 | 0 | 40 | 0.38 | 15.2 | 60 | 0.38 | 22.8 | 45 | 0.39 | 17.55 | 225 | |||||||||||
| Neobathiea | 2 | 0.33 | 0.66 | 0.34 | 0 | 0.34 | 0 | 0.35 | 0 | 0.36 | 0 | 0.37 | 0 | 0.37 | 0 | 0.38 | 0 | 36 | 0.38 | 13.68 | 16 | 0.38 | 6.08 | 11 | 0.39 | 4.29 | 65 | ||||||||||||
| Oeceoclades | 150 | 0.33 | 49.5 | 0.34 | 0 | 0.34 | 0 | 30 | 0.35 | 10.5 | 0.36 | 0 | 0.37 | 0 | 0.37 | 0 | 0.38 | 0 | 3 | 0.38 | 1.14 | 23 | 0.38 | 8.74 | 4 | 0.39 | 1.56 | 210 | |||||||||||
| Oeonia | 3 | 0.33 | 0.99 | 0.34 | 0 | 0.34 | 0 | 0.35 | 0 | 0.36 | 0 | 0.37 | 0 | 0.37 | 0 | 0.38 | 0 | 33 | 0.38 | 12.54 | 17 | 0.38 | 6.46 | 3 | 0.39 | 1.17 | 56 | ||||||||||||
| Oeoniella | 6 | 0.33 | 1.98 | 0.34 | 0 | 0.34 | 0 | 0.35 | 0 | 0.36 | 0 | 0.37 | 0 | 0.37 | 0 | 0.38 | 0 | 0.38 | 0 | 1 | 0.38 | 0.38 | 0.39 | 0 | 7 | ||||||||||||||
| Phaius | 0.33 | 0 | 0.34 | 0 | 0.34 | 0 | 0.35 | 0 | 0.36 | 0 | 0.37 | 0 | 0.37 | 0 | 0.38 | 0 | 3 | 0.38 | 1.14 | 3 | 0.38 | 1.14 | 1 | 0.39 | 0.39 | 7 | |||||||||||||
| Sobennikoffia | 40 | 0.33 | 13.2 | 0.34 | 0 | 15 | 0.34 | 5.1 | 0.35 | 0 | 0.36 | 0 | 0.37 | 0 | 0.37 | 0 | 0.38 | 0 | 0.38 | 0 | 12 | 0.38 | 4.56 | 2 | 0.39 | 0.78 | 69 | ||||||||||||
| (blank) | 230 | 0.33 | 75.9 | 103 | 0.34 | 35.02 | 124 | 0.34 | 42.16 | 204 | 0.35 | 71.4 | 239 | 0.36 | 86.04 | 0.37 | 0 | 305 | 0.37 | 112.85 | 0.38 | 0 | 641 | 0.38 | 243.58 | 0.38 | 0 | 2 | 0.39 | 0.78 | 1848 | ||||||||
| Rhamnales | 0.33 | 0 | 0.34 | 0 | 0.34 | 0 | 0.35 | 0 | 0.36 | 0 | 0.37 | 0 | 0.37 | 0 | 0.38 | 0 | 0.38 | 0 | 0.38 | 0 | 0.39 | 0 | |||||||||||||||||
| Cyphostemma | 0.33 | 0 | 0.34 | 0 | 0.34 | 0 | 0.35 | 0 | 0.36 | 0 | 33 | 0.37 | 12.21 | 120 | 0.37 | 44.4 | 21 | 0.38 | 7.98 | 155 | 0.38 | 58.9 | 125 | 0.38 | 47.5 | 10 | 0.39 | 3.9 | 464 | ||||||||||
| Sapindales | 0.33 | 0 | 0.34 | 0 | 0.34 | 0 | 0.35 | 0 | 0.36 | 0 | 0.37 | 0 | 0.37 | 0 | 0.38 | 0 | 0.38 | 0 | 0.38 | 0 | 0.39 | 0 | |||||||||||||||||
| Operculicarya | 0.33 | 0 | 0.34 | 0 | 0.34 | 0 | 50 | 0.35 | 17.5 | 231 | 0.36 | 83.16 | 511 | 0.37 | 189.07 | 84 | 0.37 | 31.08 | 229 | 0.38 | 87.02 | 545 | 0.38 | 207.1 | 2031 | 0.38 | 771.78 | 494 | 0.39 | 192.66 | 4175 | ||||||||
| Scrophulariales | 0.33 | 0 | 0.34 | 0 | 0.34 | 0 | 0.35 | 0 | 0.36 | 0 | 0.37 | 0 | 0.37 | 0 | 0.38 | 0 | 0.38 | 0 | 0.38 | 0 | 0.39 | 0 | |||||||||||||||||
| Uncarina | 0.33 | 0 | 0.34 | 0 | 0.34 | 0 | 0.35 | 0 | 0.36 | 0 | 0.37 | 0 | 0.37 | 0 | 1 | 0.38 | 0.38 | 80 | 0.38 | 30.4 | 0.38 | 0 | 0.39 | 0 | 81 | ||||||||||||||
| Violales | 0.33 | 0 | 0.34 | 0 | 0.34 | 0 | 0.35 | 0 | 0.36 | 0 | 0.37 | 0 | 0.37 | 0 | 0.38 | 0 | 0.38 | 0 | 0.38 | 0 | 0.39 | 0 | |||||||||||||||||
| Adenia | 0.33 | 0 | 0.34 | 0 | 0.34 | 0 | 0.35 | 0 | 0.36 | 0 | 0.37 | 0 | 0.37 | 0 | 1 | 0.38 | 0.38 | 0.38 | 0 | 70 | 0.38 | 26.6 | 0.39 | 0 | 71 | ||||||||||||||
| Zygosicyos | 0.33 | 0 | 0.34 | 0 | 0.34 | 0 | 0.35 | 0 | 5 | 0.36 | 1.8 | 20 | 0.37 | 7.4 | 179 | 0.37 | 66.23 | 45 | 0.38 | 17.1 | 163 | 0.38 | 61.94 | 263 | 0.38 | 99.94 | 20 | 0.39 | 7.8 | 695 | |||||||||
| Plant total | 5316 | 1754.28 | 4175 | 1419.5 | 1309 | 445.06 | 1649 | 577.15 | 3346 | 1204.56 | 4812 | 1780.44 | 3193 | 1181.41 | 2615 | 993.7 | 7680 | 2918.4 | 11,620 | 4415.6 | 2262 | 882.18 | 47,977 | ||||||||||||||||
Disclaimer/Publisher’s Note: The statements, opinions and data contained in all publications are solely those of the individual author(s) and contributor(s) and not of MDPI and/or the editor(s). MDPI and/or the editor(s) disclaim responsibility for any injury to people or property resulting from any ideas, methods, instructions or products referred to in the content. |
© 2023 by the authors. Licensee MDPI, Basel, Switzerland. This article is an open access article distributed under the terms and conditions of the Creative Commons Attribution (CC BY) license (https://creativecommons.org/licenses/by/4.0/).
Share and Cite
Carpenter, A.I.; Andreone, F. Valorisation of Madagascar’s Wildlife Trade and Wildlife Tourism: What Are the Conservation Benefits? Conservation 2023, 3, 509-522. https://doi.org/10.3390/conservation3040033
Carpenter AI, Andreone F. Valorisation of Madagascar’s Wildlife Trade and Wildlife Tourism: What Are the Conservation Benefits? Conservation. 2023; 3(4):509-522. https://doi.org/10.3390/conservation3040033
Chicago/Turabian StyleCarpenter, Angus I., and Franco Andreone. 2023. "Valorisation of Madagascar’s Wildlife Trade and Wildlife Tourism: What Are the Conservation Benefits?" Conservation 3, no. 4: 509-522. https://doi.org/10.3390/conservation3040033