


Transcriptional Changes during Phytophthora capsici Infection Reveal Potential Defense Mechanisms in Squash
 ,
,
Abstract
:1. Introduction
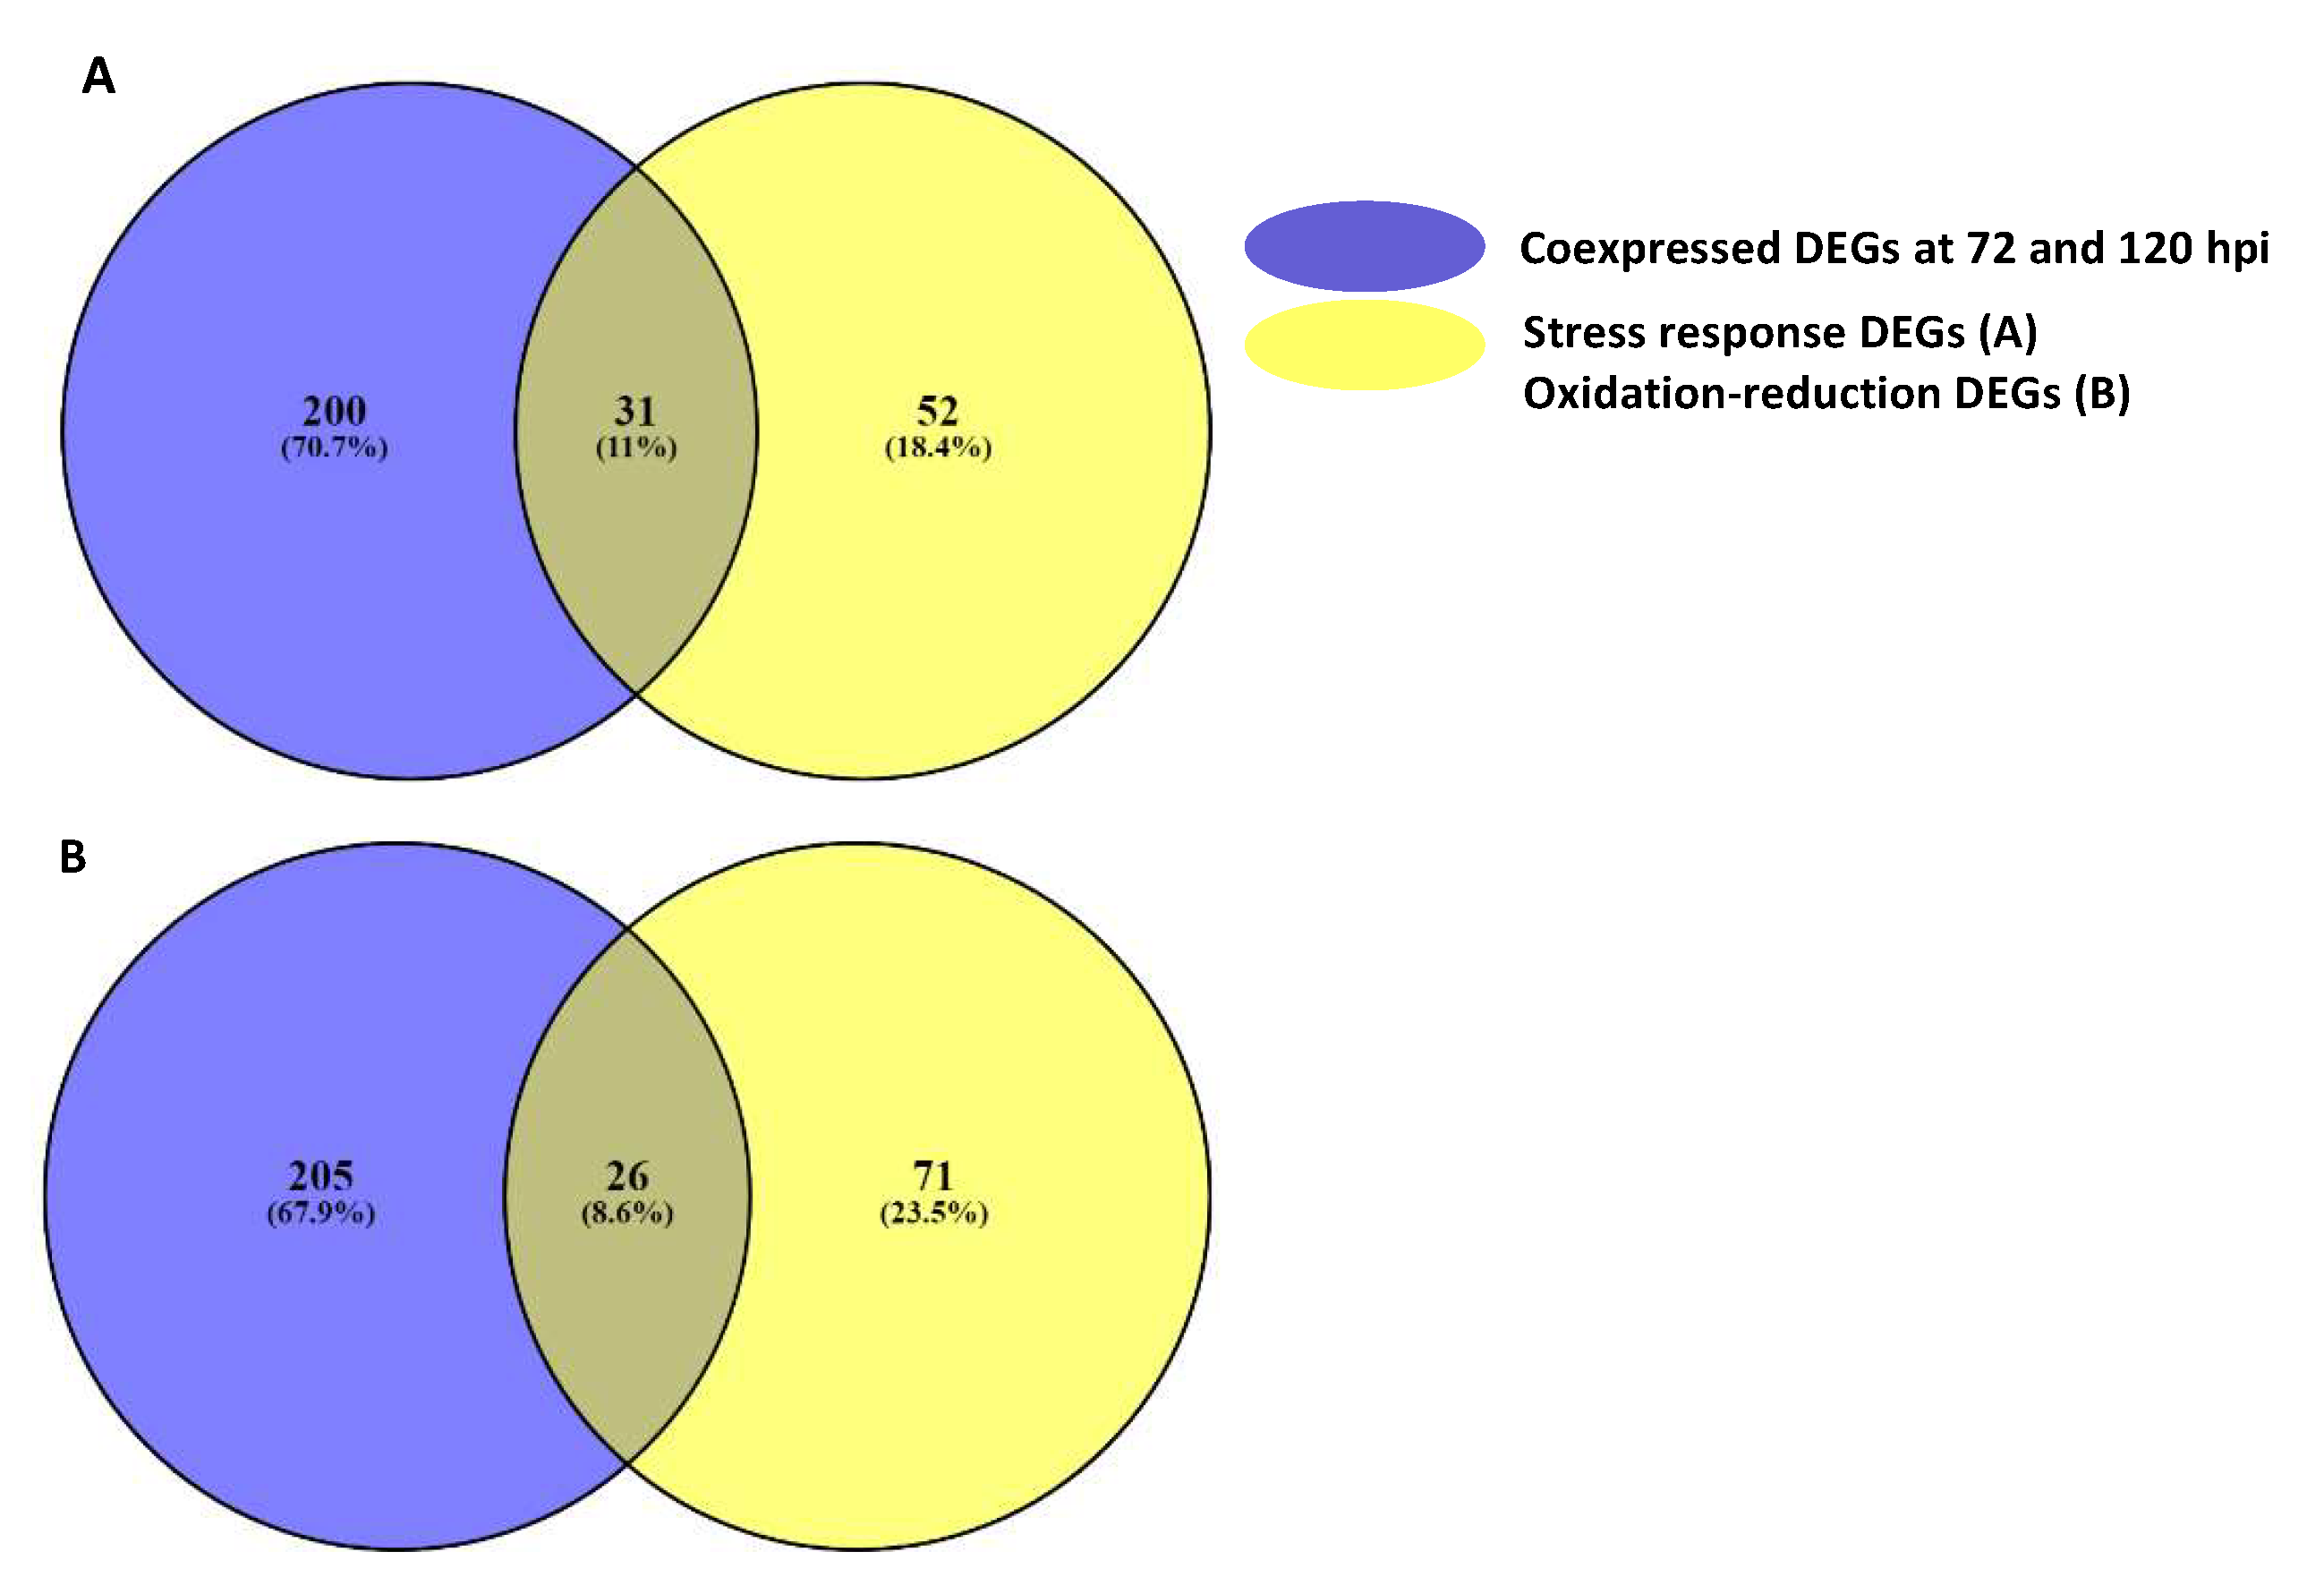
2. Results
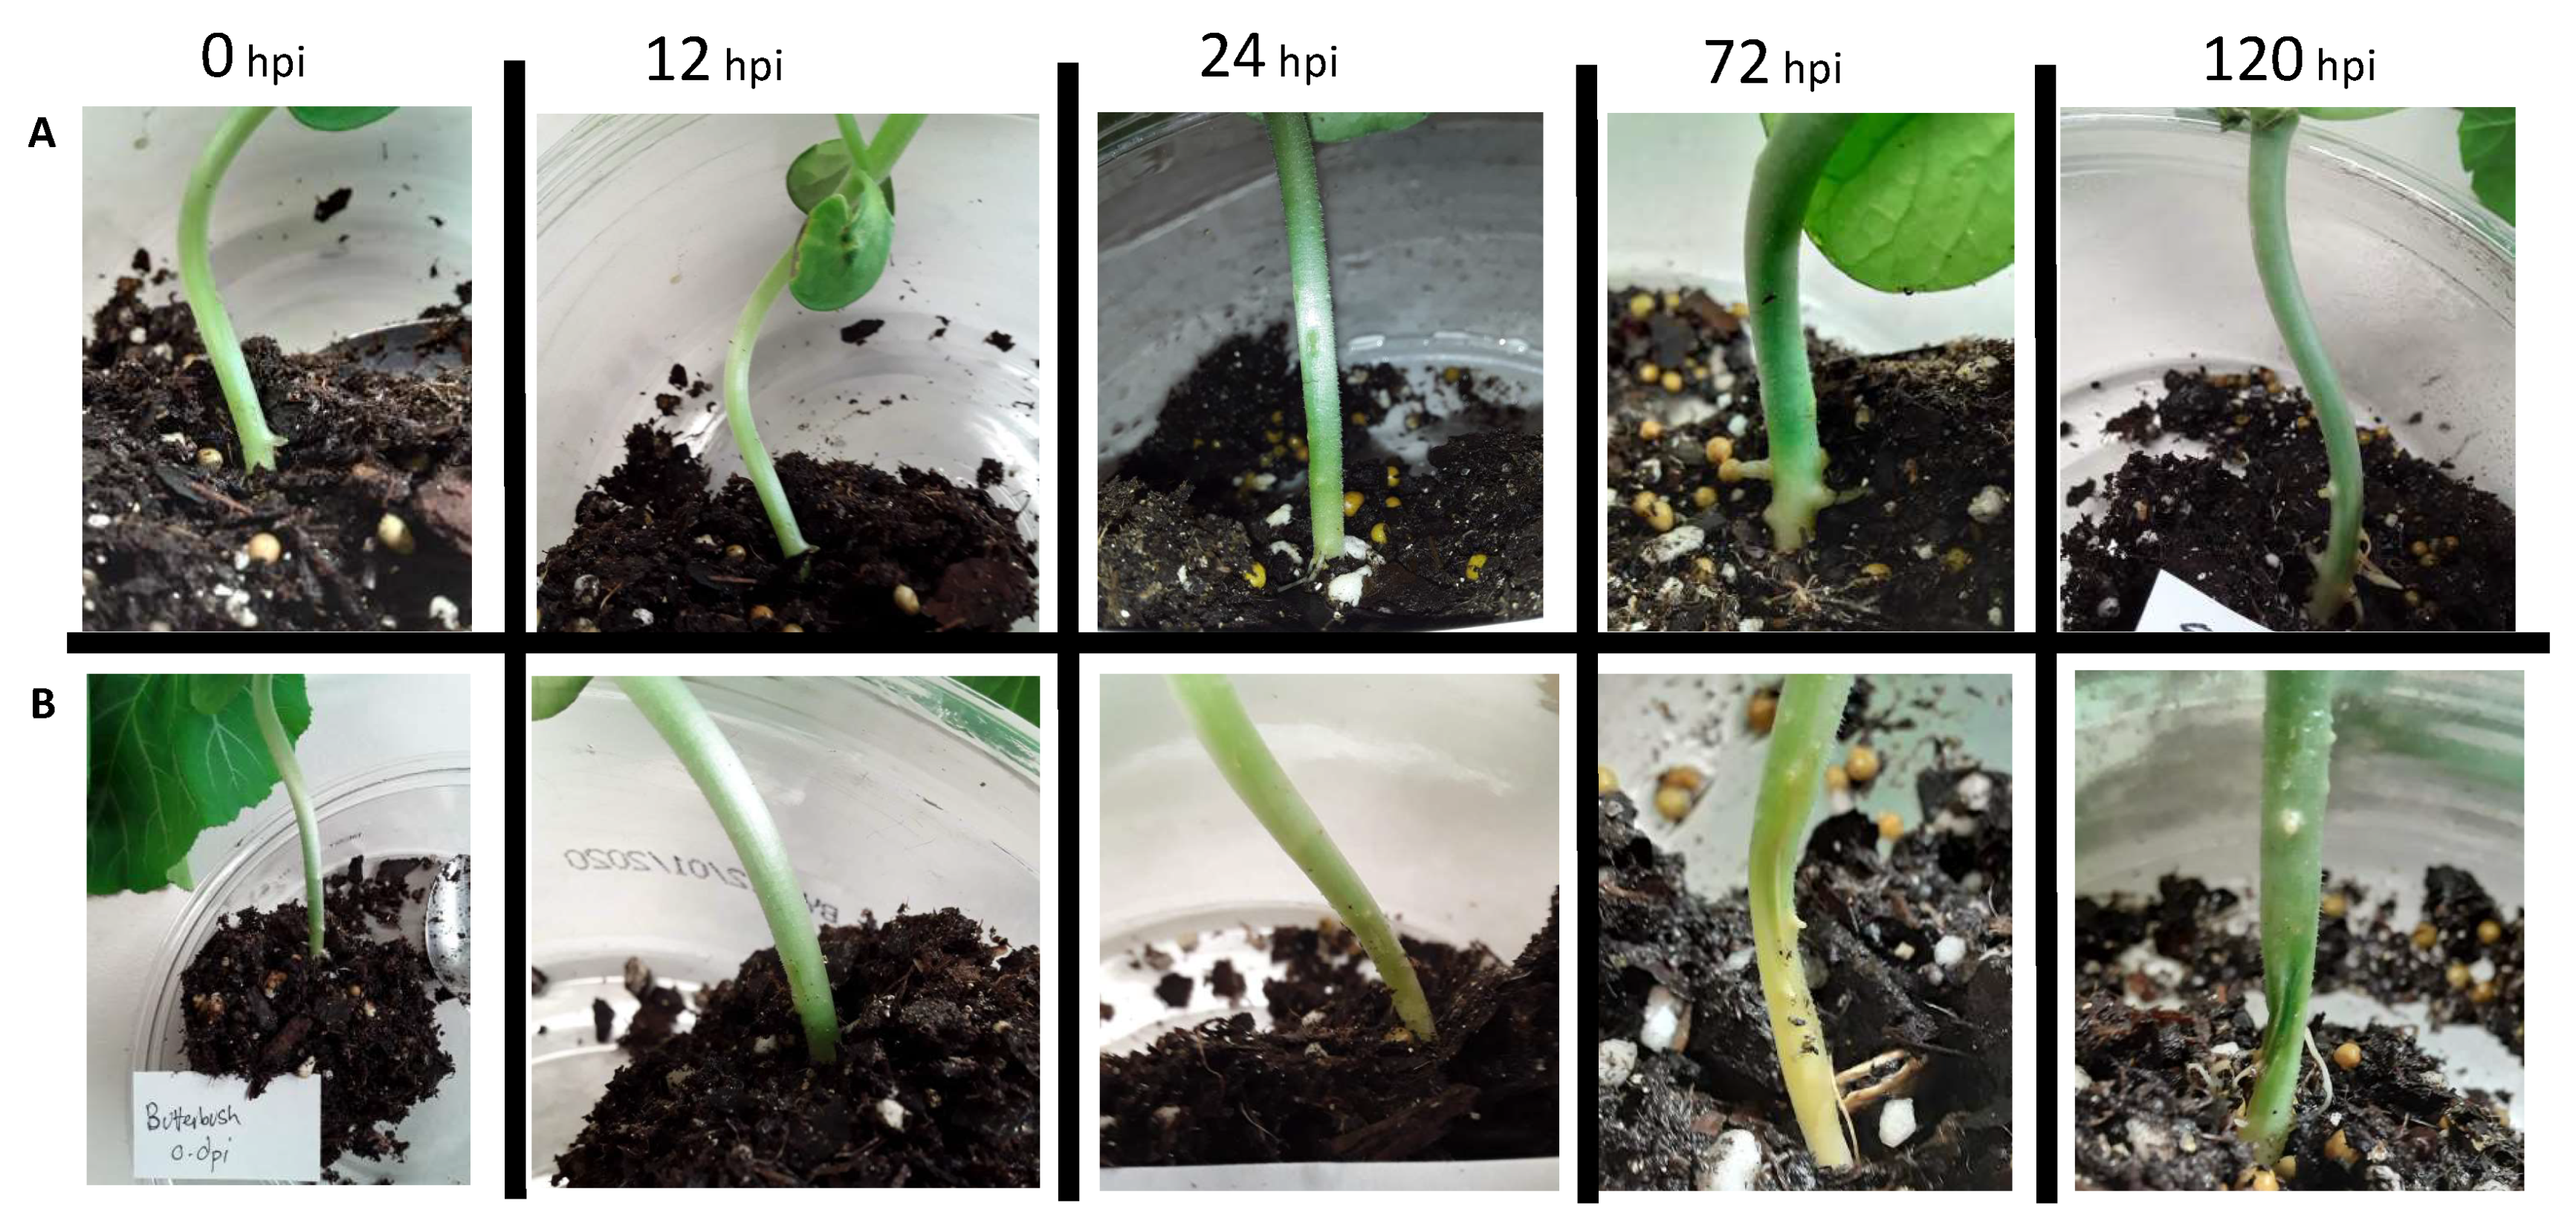
2.1. Phenotypic Response of Resistant and Susceptible Genotypes
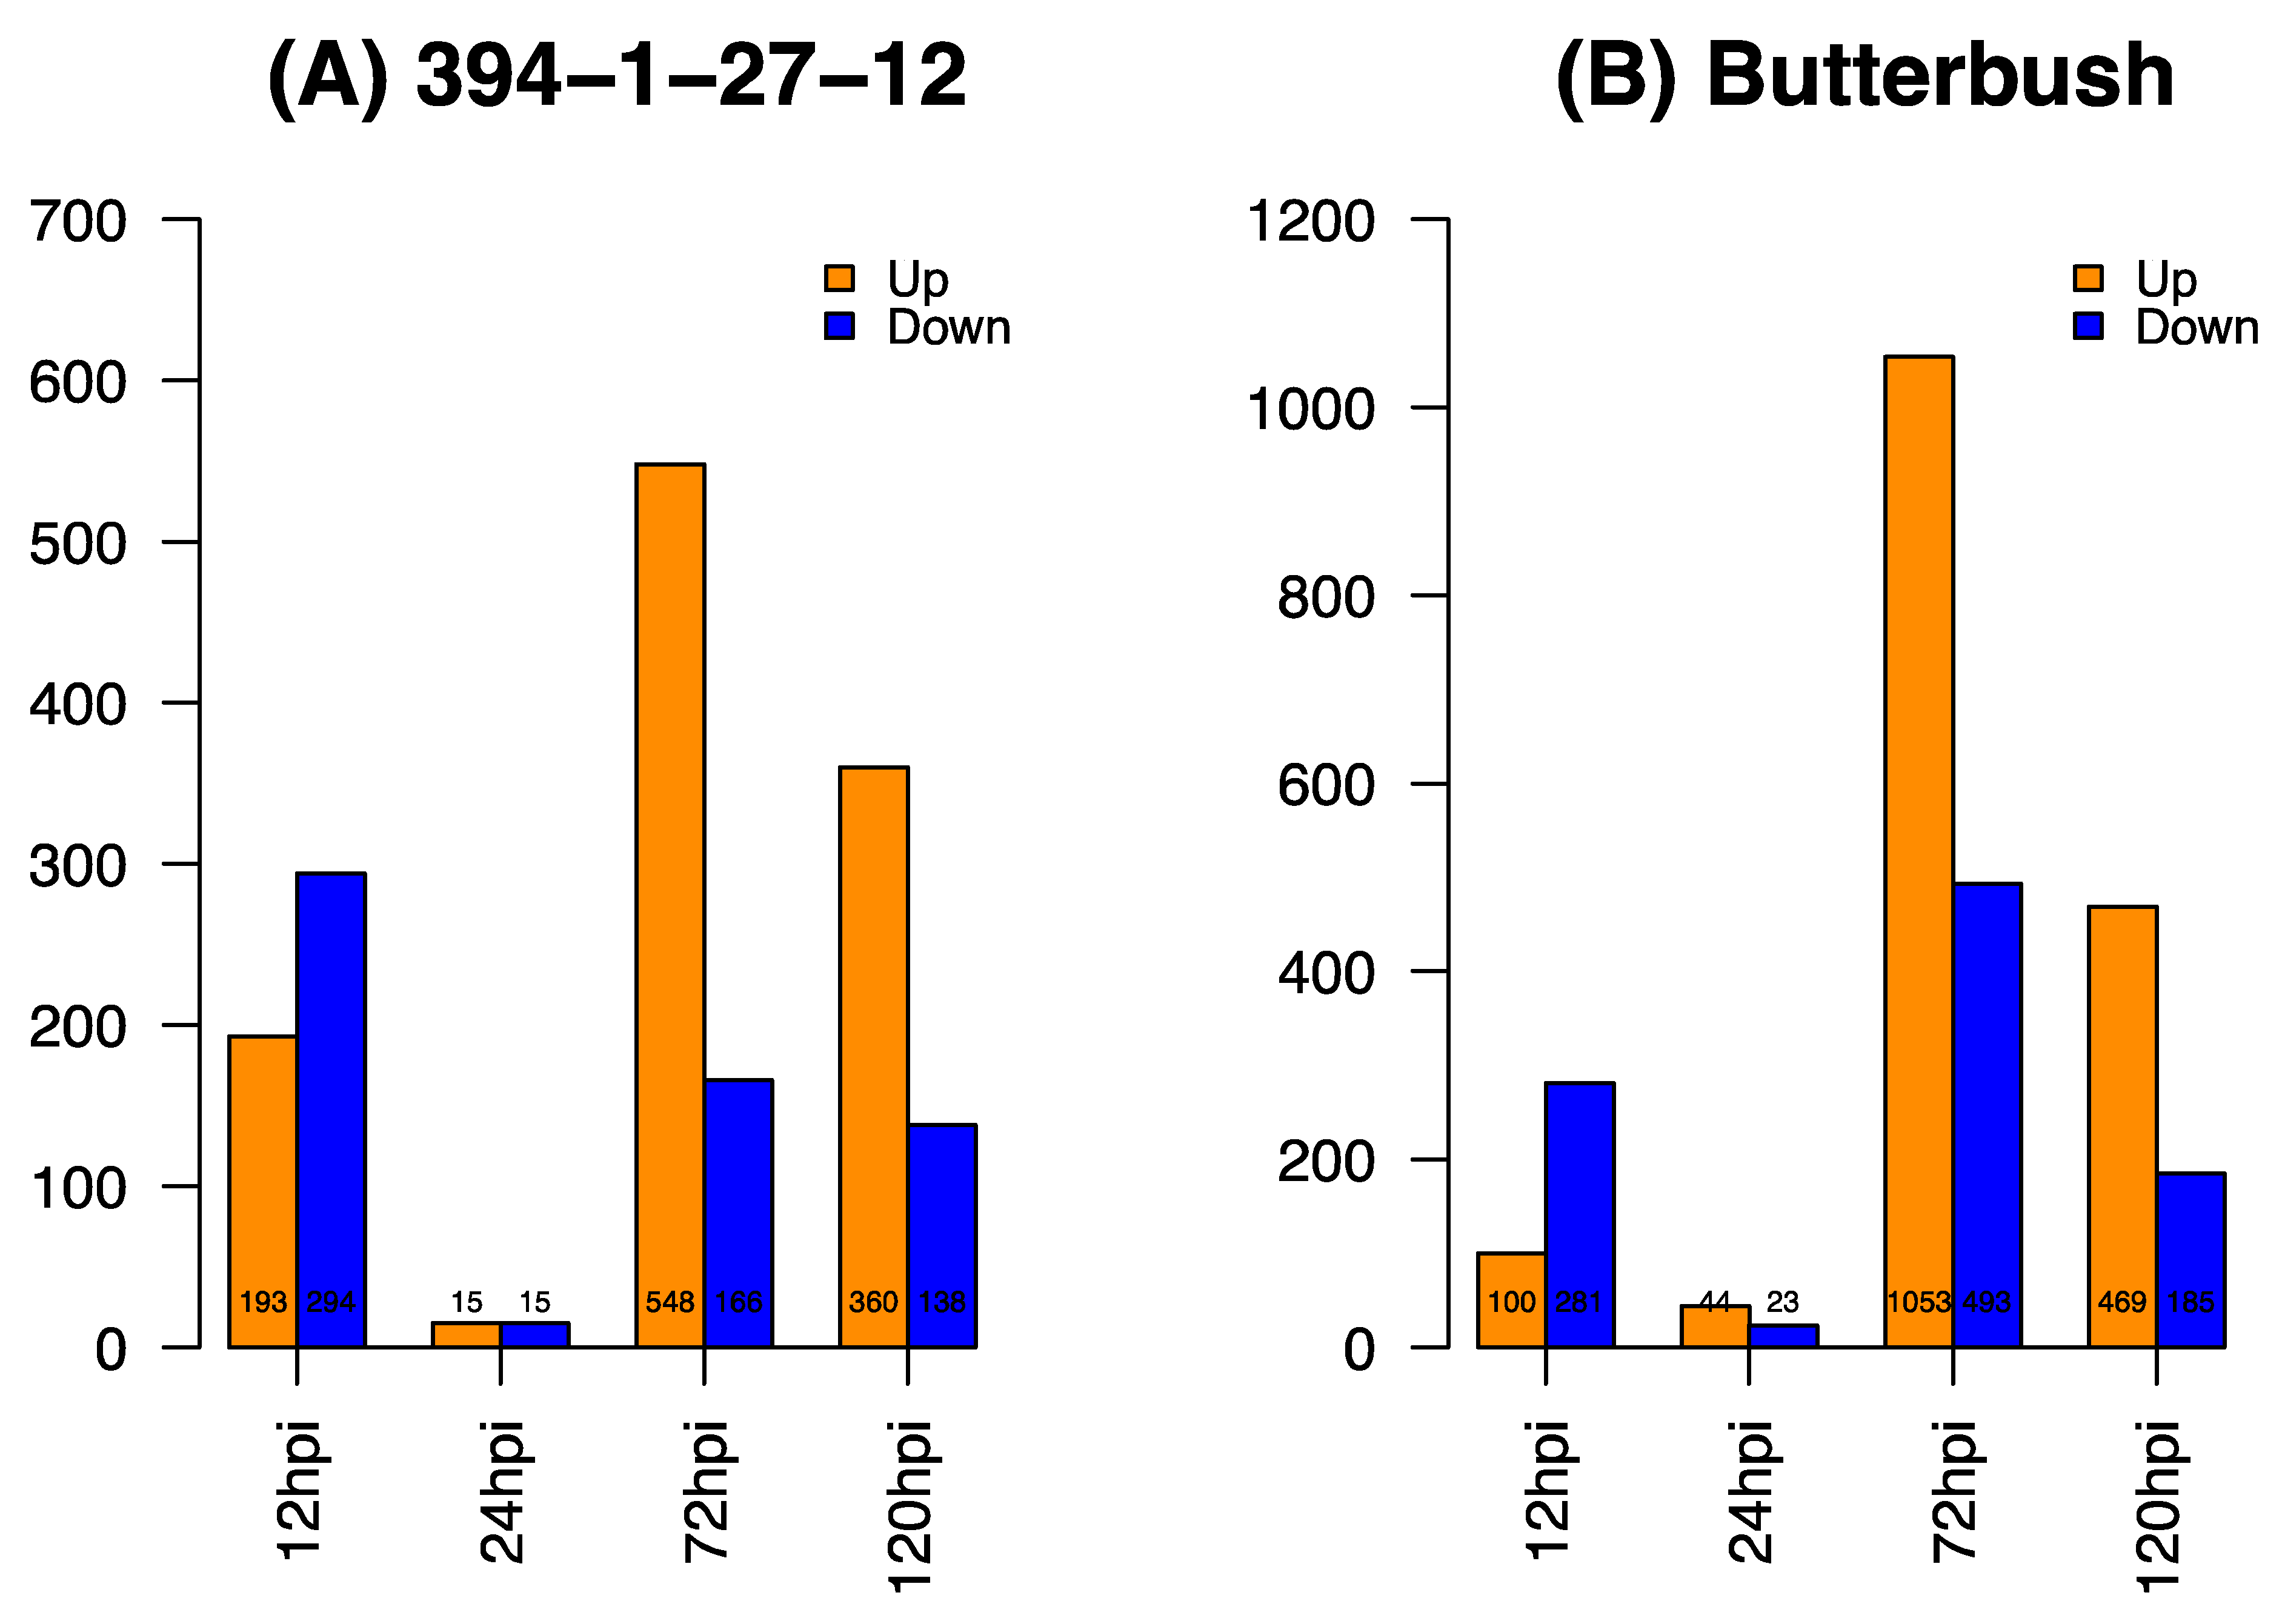
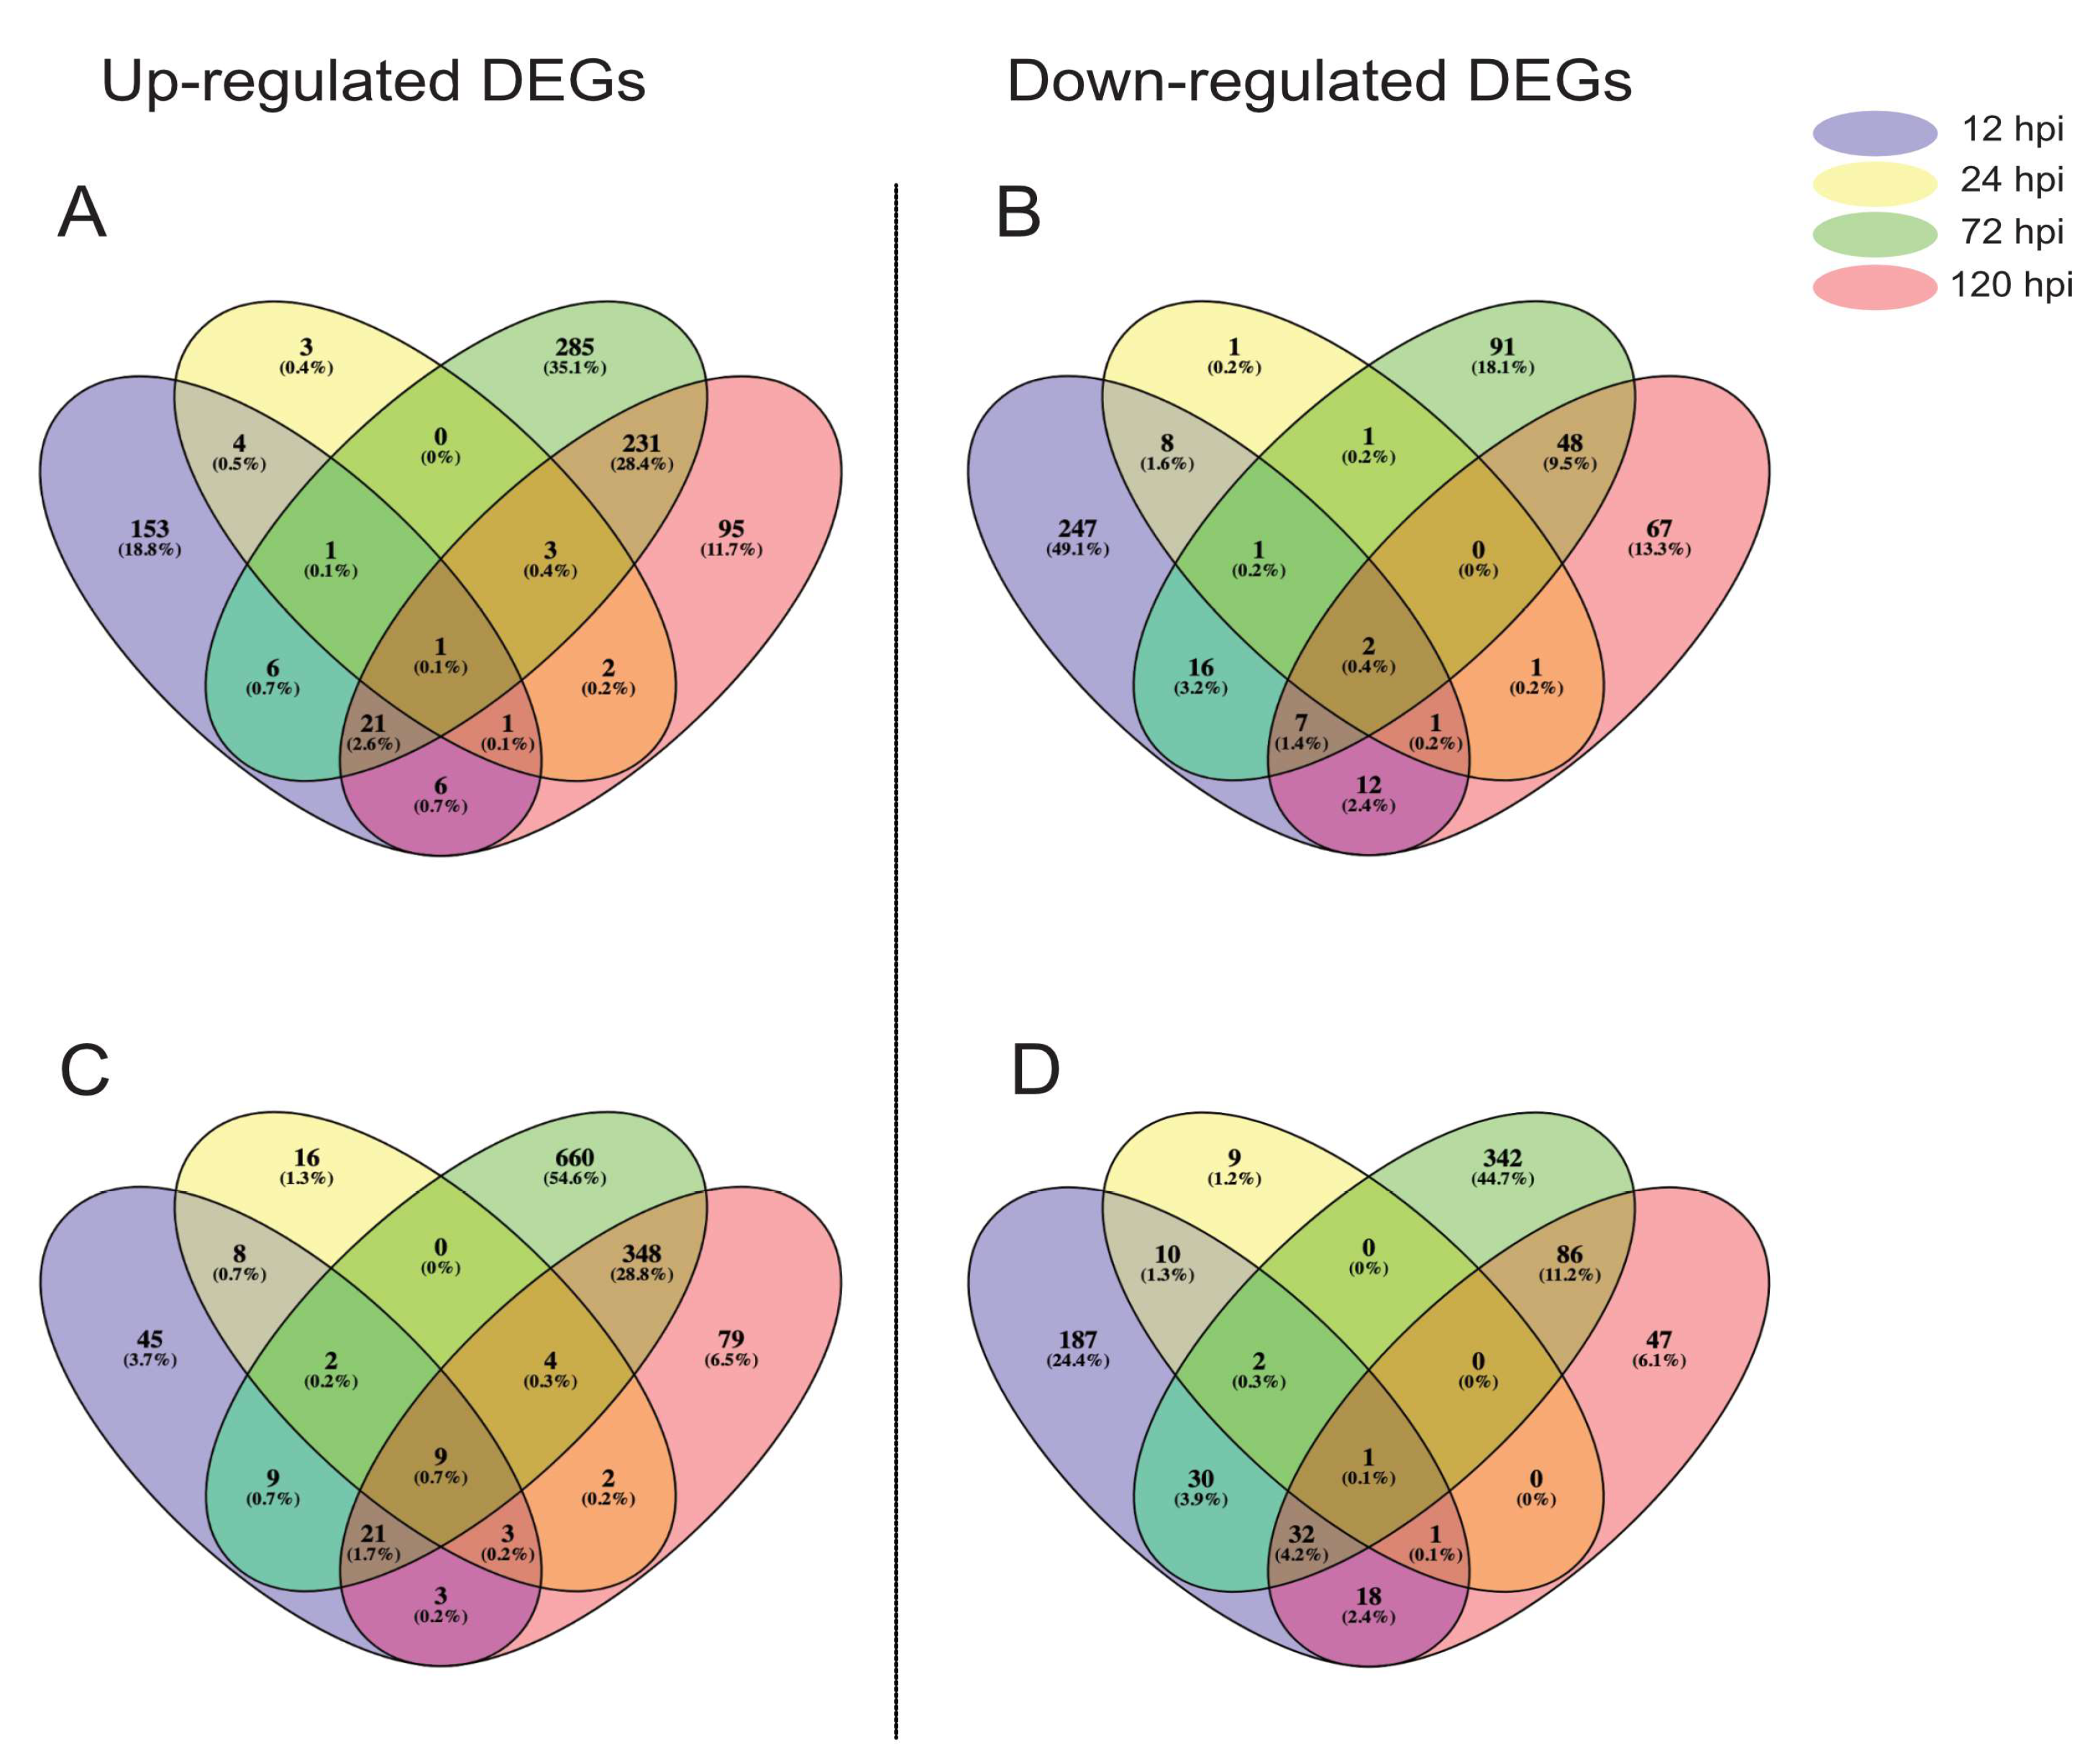
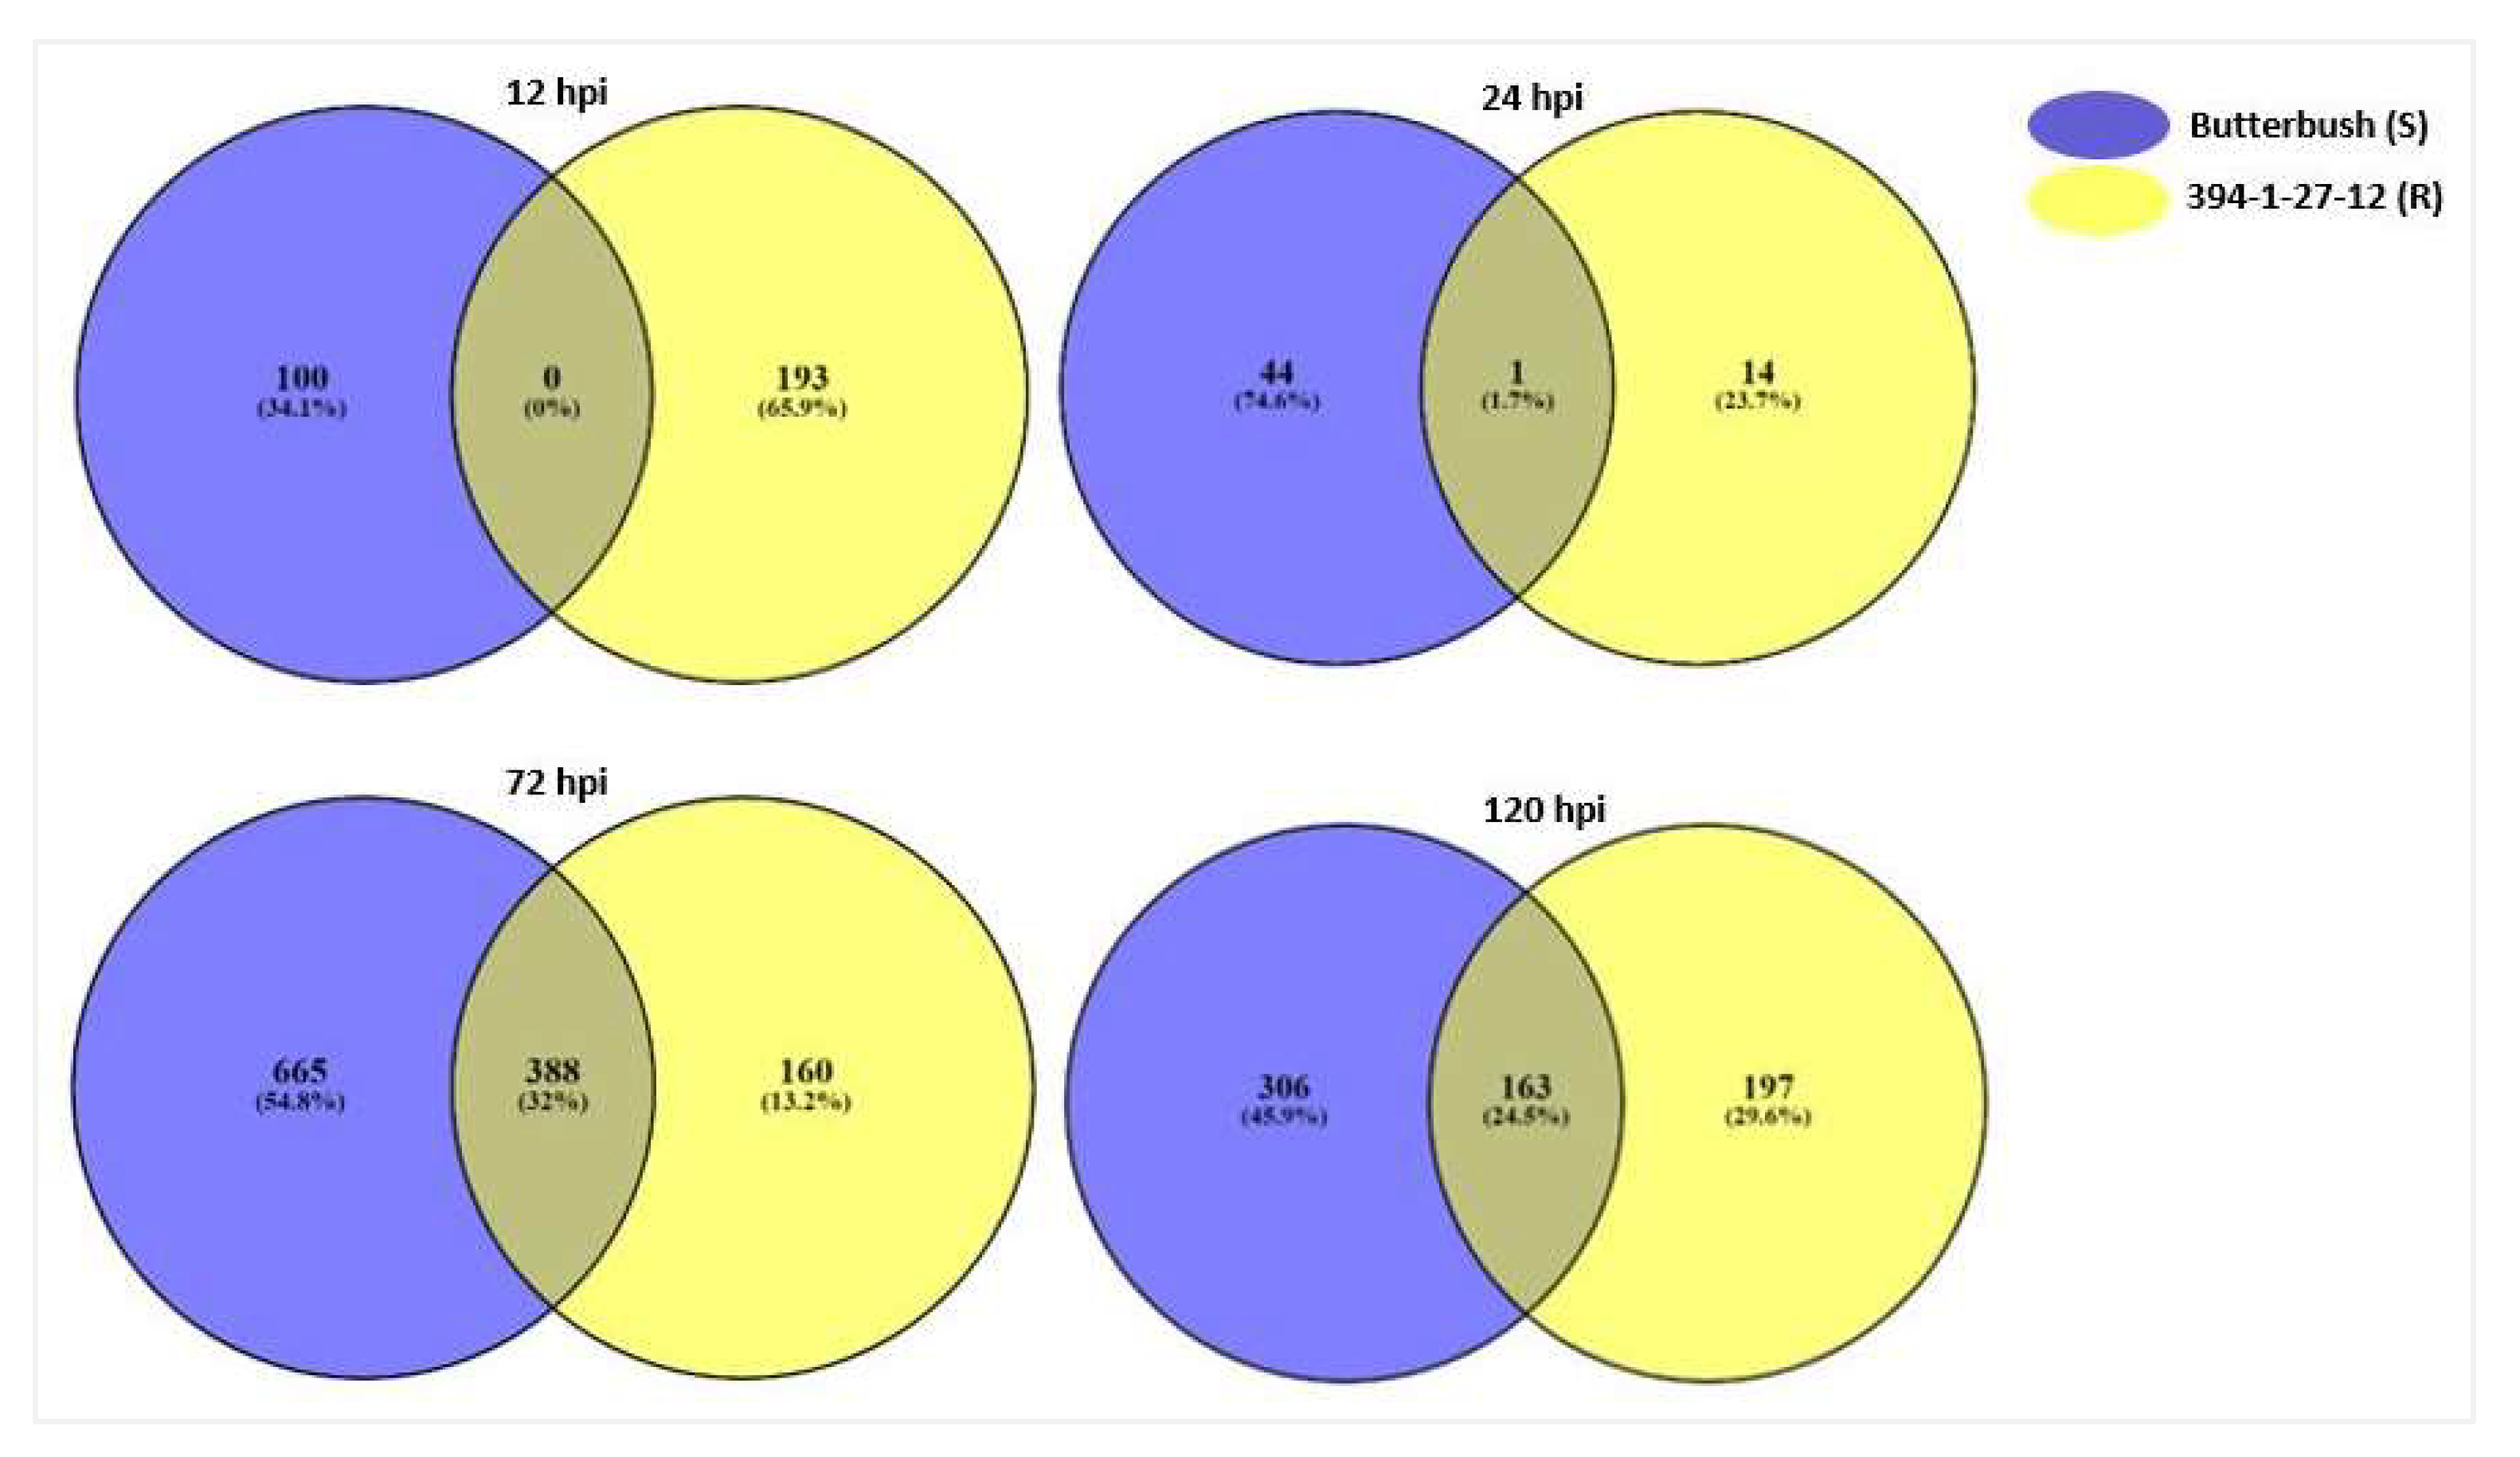
2.2. RNA Sequencing and Differential Gene Expression
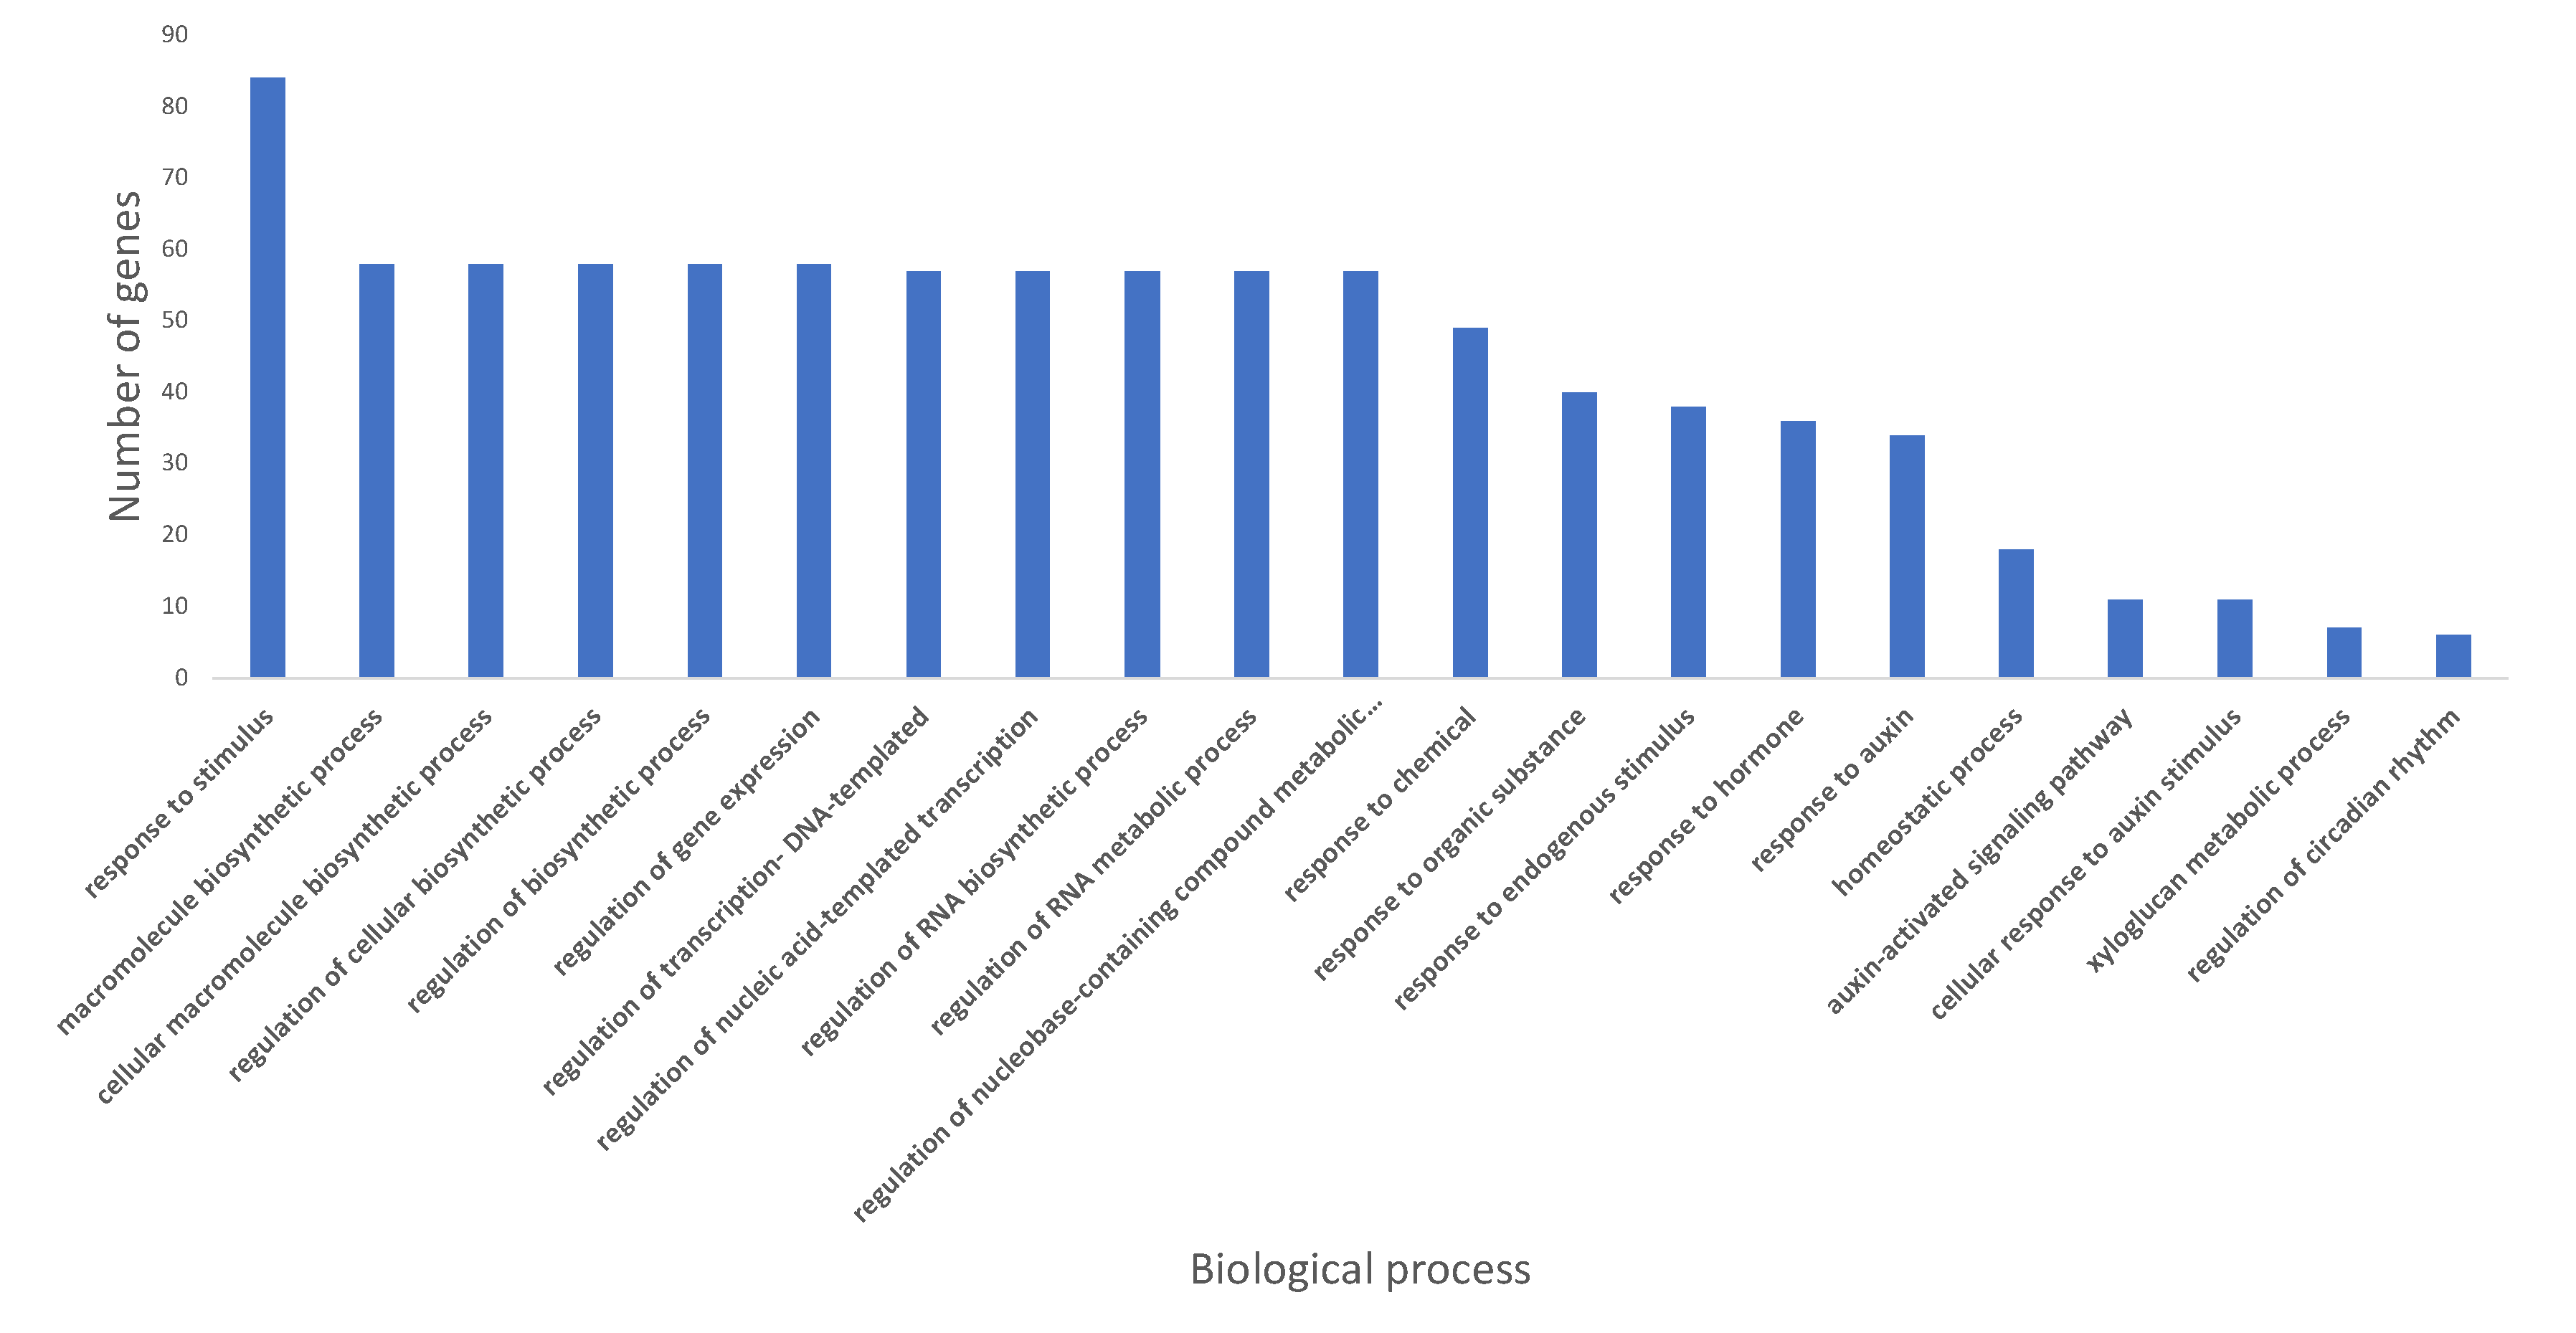
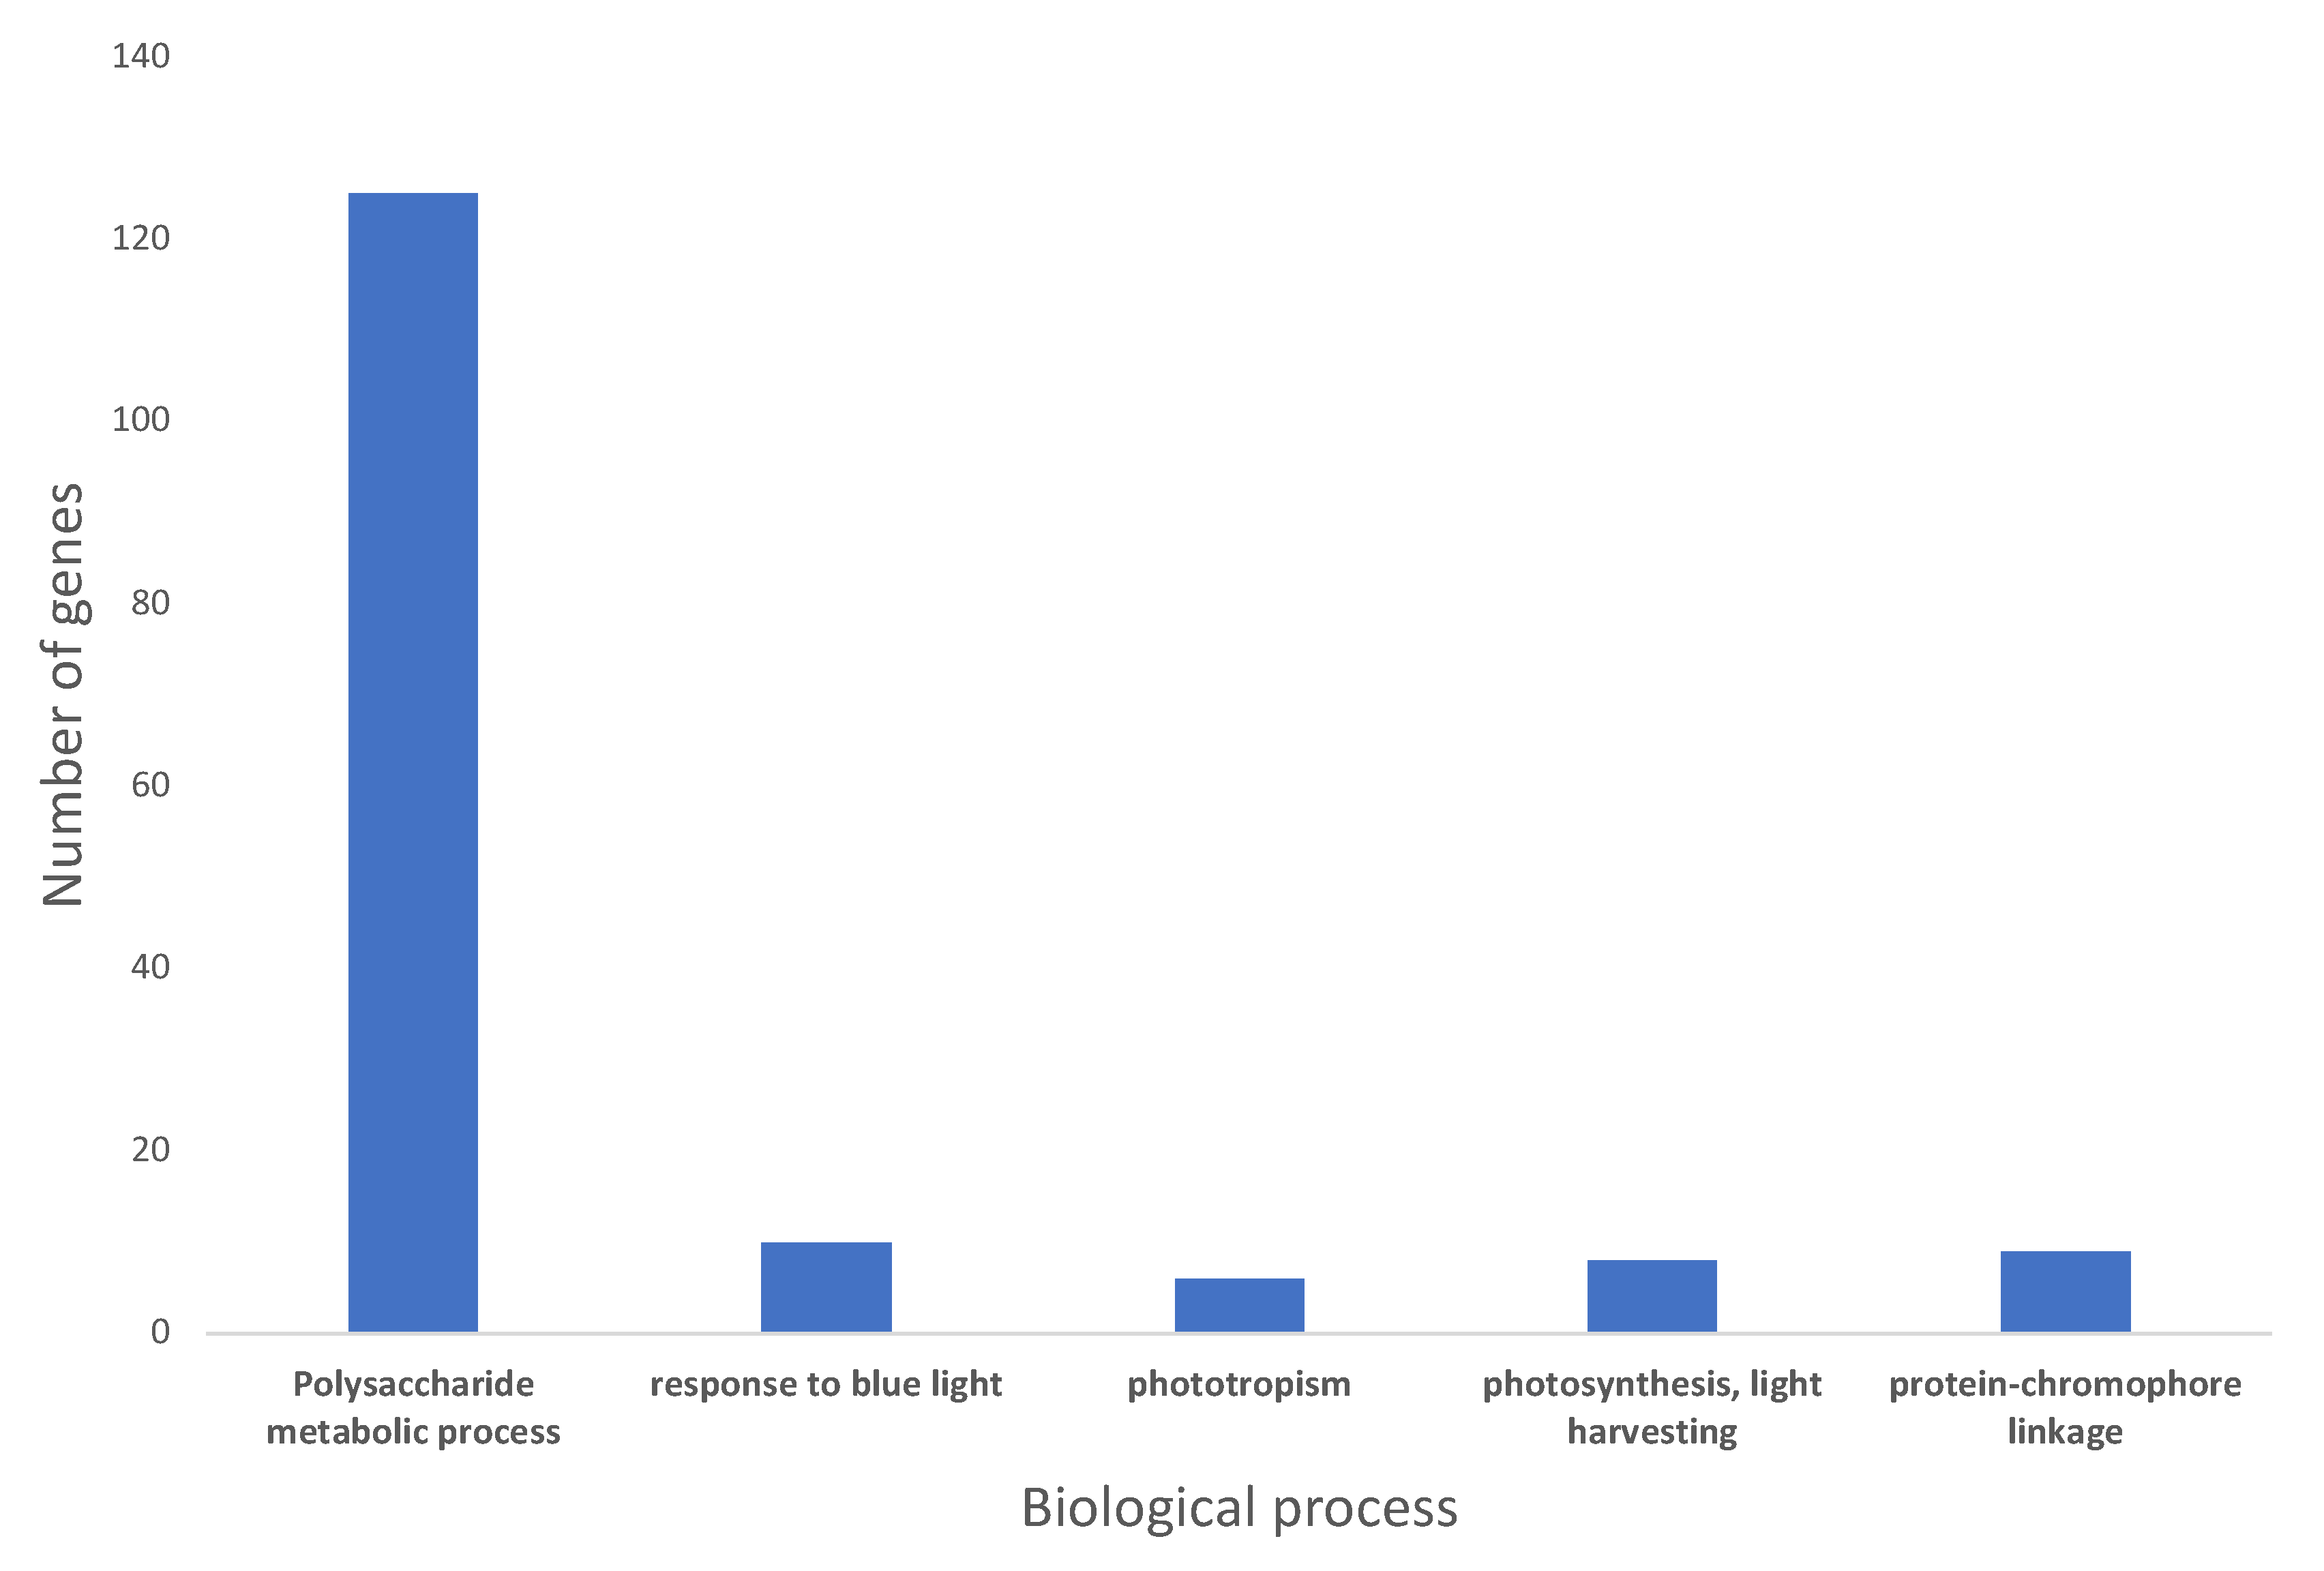
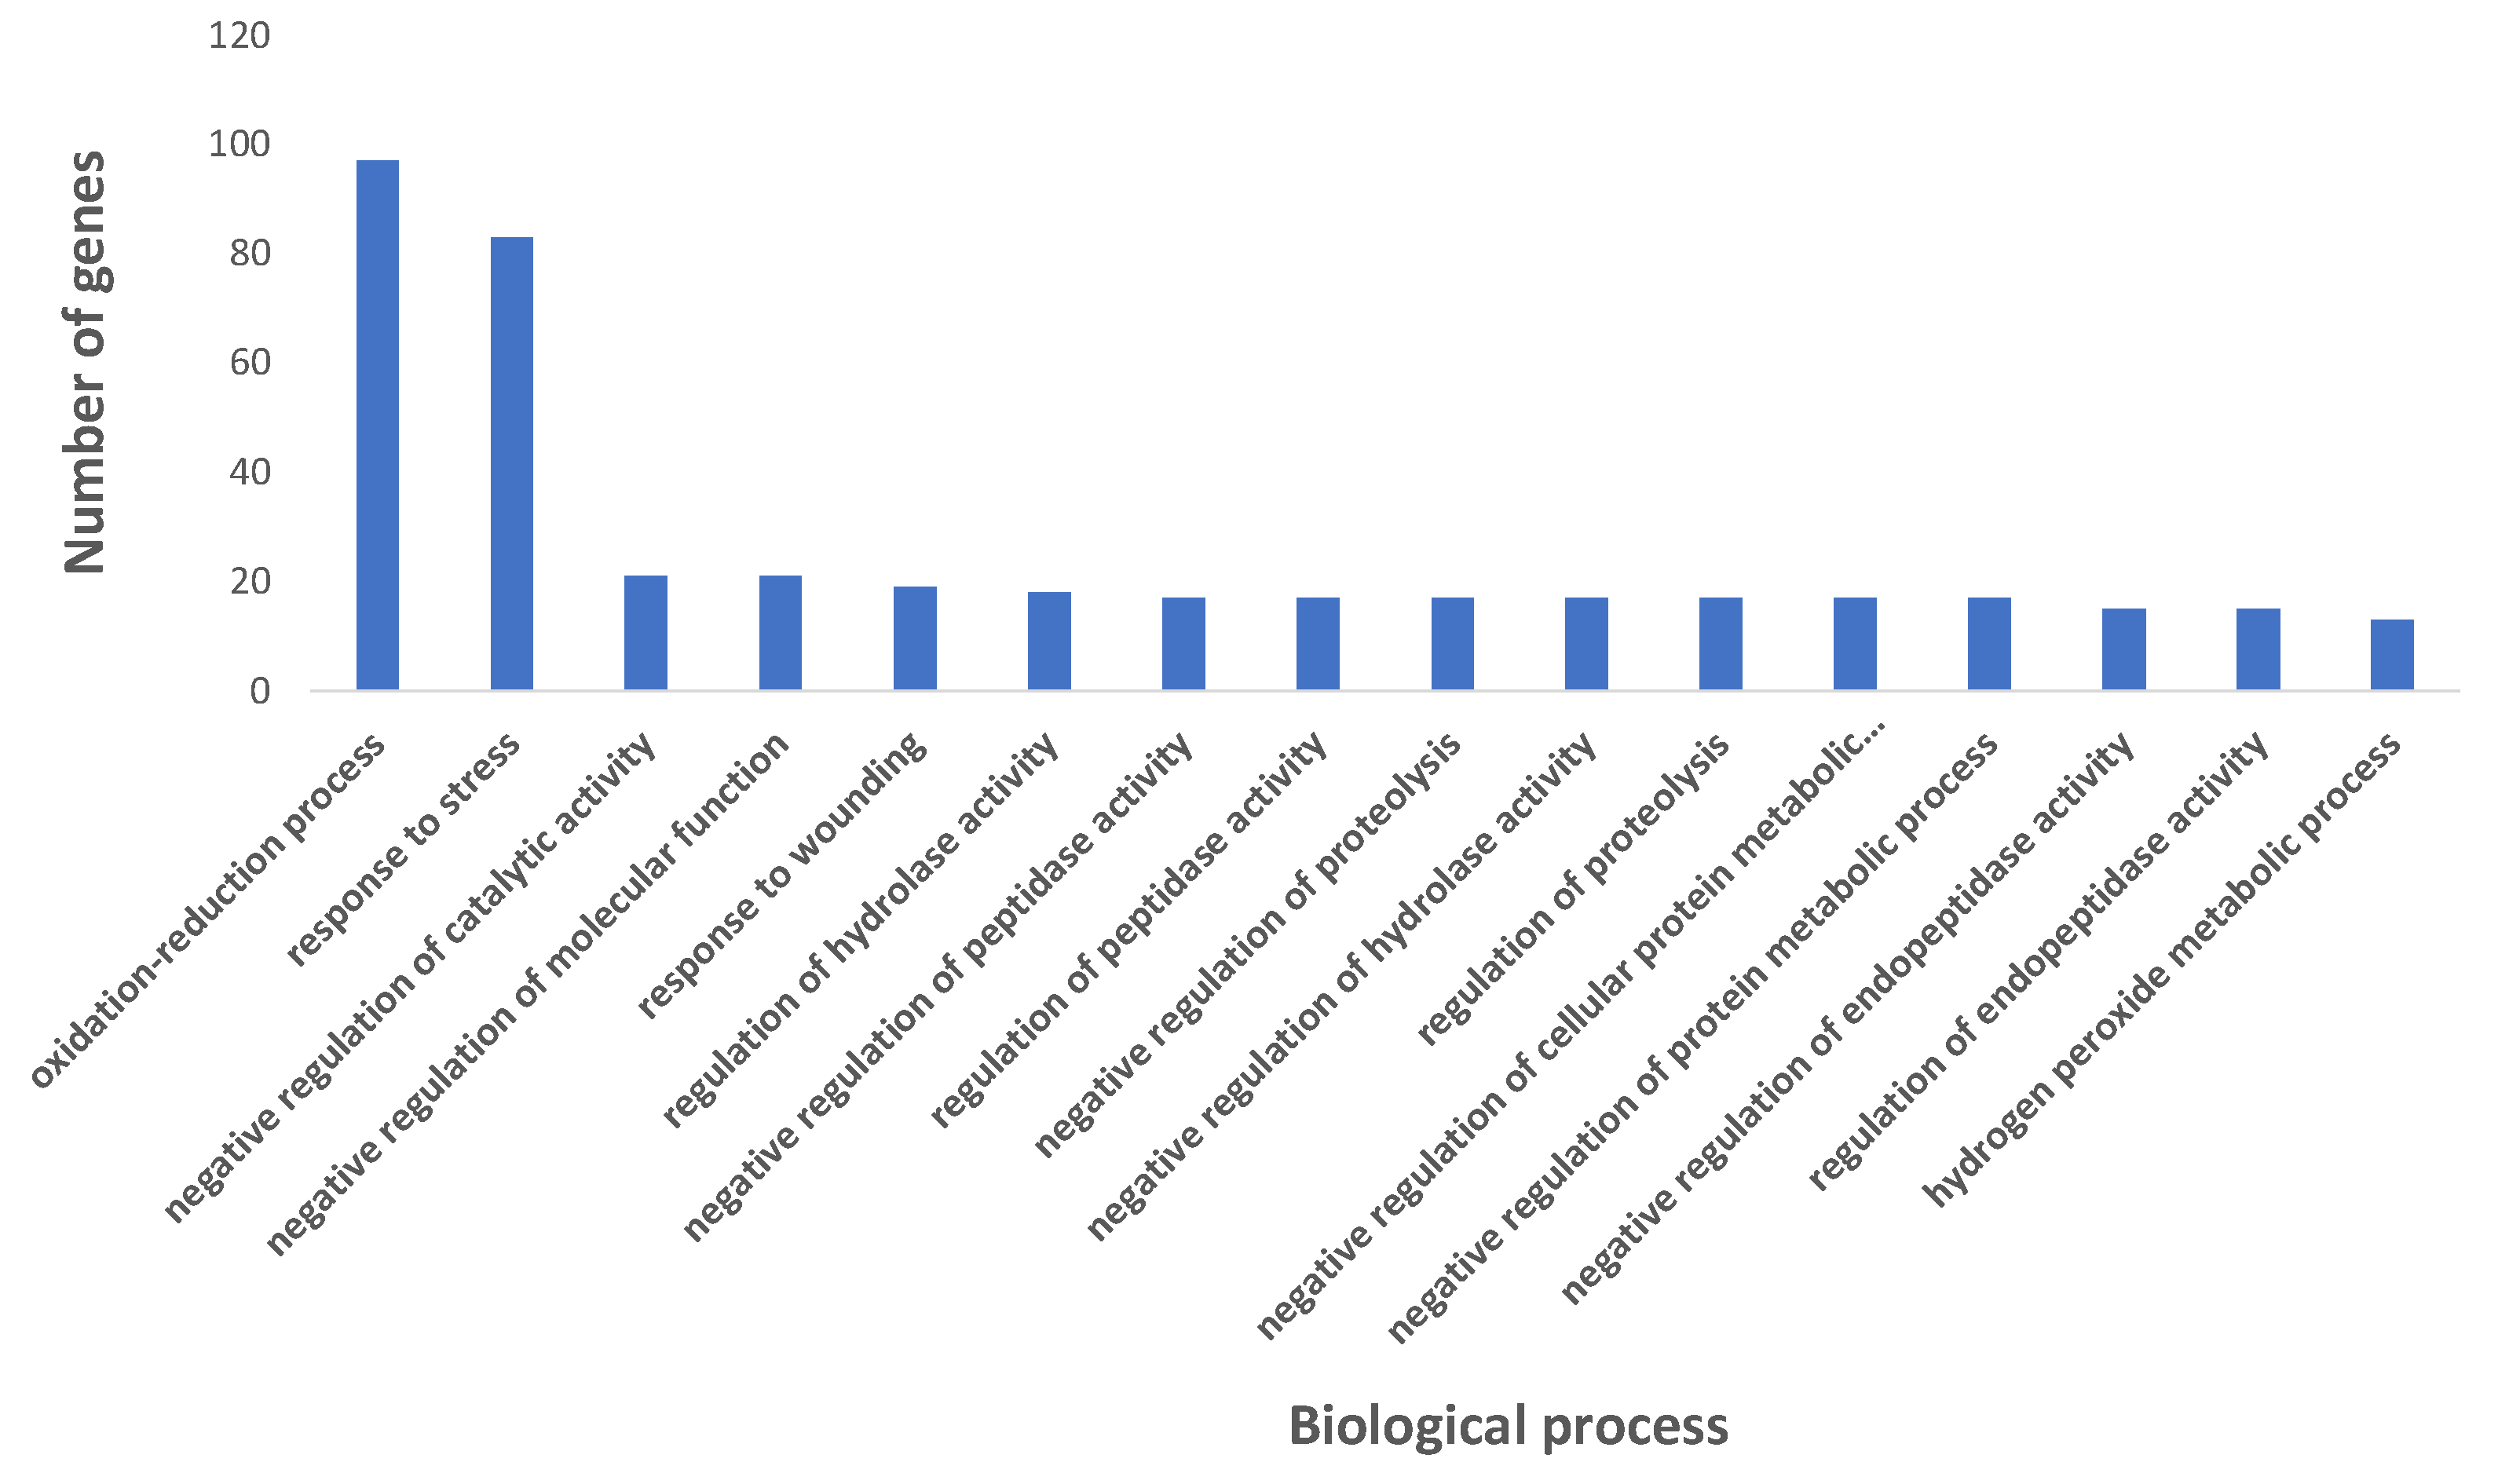
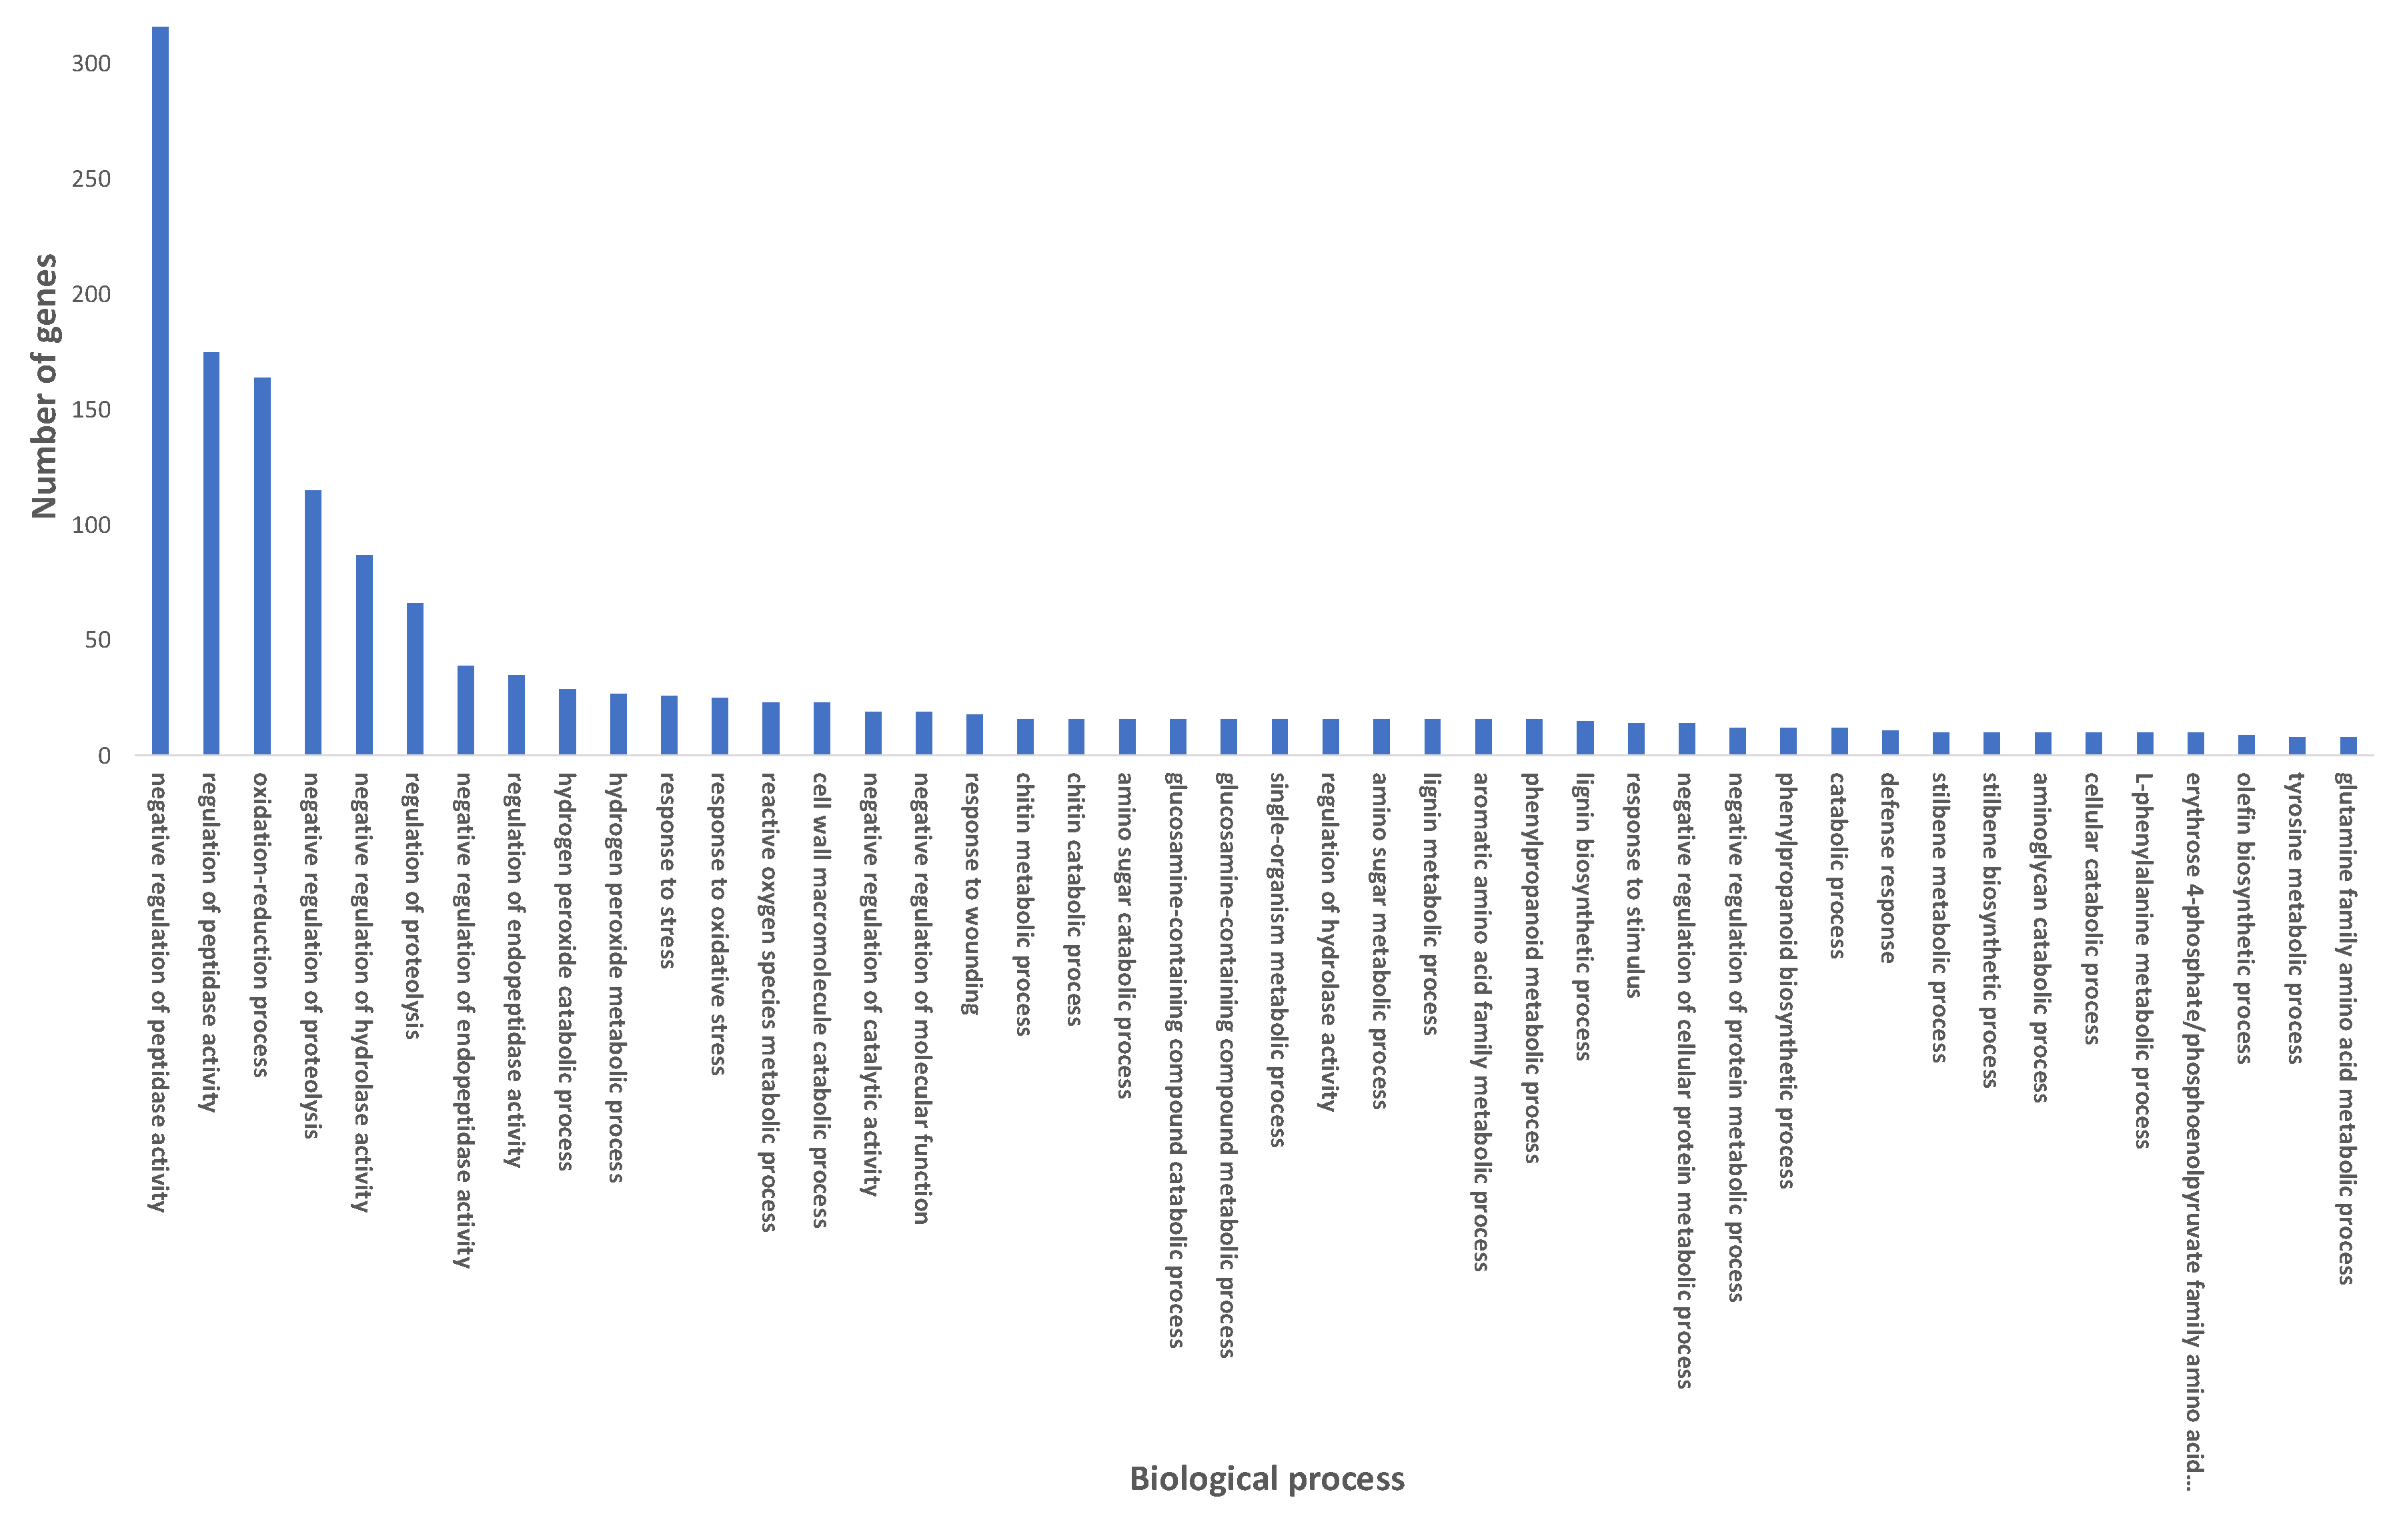
2.3. Gene Ontology Pathway Enrichment Analysis
2.4. Candidate Resistant Genes in 394-1-27-12
3. Materials and Methods
3.1. Plant Materials and Inoculation
3.2. RNA Extraction and Sequencing
3.3. RNA-Seq Data Analysis
4. Discussion
5. Conclusions
Supplementary Materials
Author Contributions
Funding
Data Availability Statement
Conflicts of Interest
References
- Babadoost, M.; Islam, S.Z. Fungicide Seed Treatment Effects on Seedling Damping-off of Pumpkin Caused by Phytophthora capsici. Plant Dis. 2003, 87, 63–68. [Google Scholar] [CrossRef]
- Krasnow, C.S.; Hausbeck, M.K. Pathogenicity of Phytophthora Capsici to Brassica Vegetable Crops and Biofumigation Cover Crops (Brassica Spp.). Plant Dis. 2015, 99, 1721–1726. [Google Scholar] [CrossRef] [PubMed]
- Lamour, K.H.; Hausbeck, M.K. Mefenoxam insensitivity and the sexual stage of Phytophthora capsici in Michigan cucurbit fields. Phytopathology 2000, 90, 396–400. [Google Scholar] [CrossRef] [PubMed]
- Hausbeck, M.K.; Lamour, K.H. Phytophthora capsici on Vegetable Crops: Research Progress and Management Challenges. Plant Dis. 2004, 88, 1292–1303. [Google Scholar] [CrossRef] [PubMed]
- Meyer, M.D.; Hausbeck, M.K. Using cultural practices and cultivar resistance to manage Phytophthora crown rot on summer squash. HortScience 2012, 47, 1080–1084. [Google Scholar] [CrossRef]
- Krasnow, C.S.; Hammerschmidt, R.; Hausbeck, M.K. Characteristics of resistance to Phytophthora Root and Crown rot in Cucurbita pepo. Plant Dis. 2017, 101, 659–665. [Google Scholar] [CrossRef] [PubMed]
- Kabelka, E.A.; Padley, L.D., Jr.; Roberts, P.; Ramos, L.; Martinez, M.; Klassen, W. Resistance to Phytophthora capsici within winter squash (Cucurbita moschata) derived from a wild Cucurbita species. HortScience 2007, 42, 1014. [Google Scholar]
- Padley, L.D.; Kabelka, E.A.; Roberts, P.D. Inheritance of resistance to Crown rot caused by Phytophthora capsici in Cucurbita. HortScience 2009, 44, 211–213. [Google Scholar] [CrossRef]
- Chavez, D.J.; Kabelka, E.A.; Chaparro, J.X. Screening of Cucurbita moschata Duchesne Germplasm for Crown Rot Resistance to Floridian Isolates of Phytophthora capsici Leonian. HortSci. Horts 2011, 46, 536–540. [Google Scholar] [CrossRef]
- Kousik, C.S.; Ikerd, J.L.; Wechter, W.P.; Branham, S.; Turechek, W. Broad Resistance to Post-Harvest Fruit Rot in USVL Watermelon Germplasm Lines to Isolates of Phytophthora capsici Across the United States. Plant Dis. 2022, 106, 711–719. [Google Scholar] [CrossRef]
- Padley, L.D.; Kabelka, E.A.; Roberts, P.D.; French, R. Evaluation of Cucurbita pepo accessions for Crown rot resistance to isolates of Phytophthora capsici. HortScience 2008, 43, 1996–1999. Available online: http://hortsci.ashspublications.org/content/43/7/1996.short (accessed on 15 September 2020). [CrossRef]
- Michael, V.N.; Fu, Y.; Meru, G. Inheritance of Resistance to Phytophthora Crown Rot in Cucurbita pepo. HortSci. Horts 2019, 54, 1156–1158. [Google Scholar] [CrossRef]
- Ramos, A.; Fu, Y.; Michael, V.; Meru, G. QTL-seq for identification of loci associated with resistance to Phytophthora crown rot in squash. Sci. Rep. 2020, 10, 5326. [Google Scholar] [CrossRef] [PubMed]
- Michael, V.N.; Fu, Y.; Shrestha, S.; Meru, G. A Novel QTL for Resistance to Phytophthora Crown Rot in Squash. Plants 2021, 10, 2115. [Google Scholar] [CrossRef] [PubMed]
- Vogel, G.; LaPlant, K.E.; Mazourek, M.; Gore, M.A.; Smart, C.D. A combined BSA-Seq and linkage mapping approach identifies genomic regions associated with Phytophthora root and crown rot resistance in squash. Theor. Appl. Genet. 2021, 134, 1015–1031. [Google Scholar] [CrossRef] [PubMed]
- Zipfel, C.; Robatzek, S. Pathogen-associated molecular pattern-triggered immunity: Veni, vidi…? Plant Physiol. 2010, 154, 551–554. [Google Scholar] [CrossRef] [PubMed]
- Jones, J.D.G.; Dangl, J.L. The plant immune system. Nature 2006, 444, 323–329. [Google Scholar] [CrossRef]
- Lo Presti, L.; Lanver, D.; Schweizer, G.; Tanaka, S.; Liang, L.; Tollot, M.; Zuccaro, A.; Reissmann, S.; Kahmann, R. Fungal effectors and plant susceptibility. Annu. Rev. Plant Biol. 2015, 66, 513–545. [Google Scholar] [CrossRef]
- Bozkurt, T.O.; Schornack, S.; Banfield, M.J.; Kamoun, S. Oomycetes, effectors, and all that jazz. Curr. Opin. Plant Biol. 2012, 15, 483–492. [Google Scholar] [CrossRef]
- Chen, X.-R.; Xing, Y.-P.; Li, Y.-P.; Tong, Y.-H.; Xu, J.-Y. RNA-Seq Reveals Infection-Related Gene Expression Changes in Phytophthora capsici. PLoS ONE 2013, 8, e74588. [Google Scholar] [CrossRef]
- Fawke, S.; Doumane, M.; Schornack, S. Oomycete Interactions with Plants: Infection Strategies and Resistance Principles. Microbiol. Mol. Biol. Rev. 2015, 79, 263–280. [Google Scholar] [CrossRef] [PubMed]
- Stam, R.; Jupe, J.; Howden, A.J.M.; Morris, J.A.; Boevink, P.C.; Hedley, P.E.; Huitema, E. Identification and Characterisation CRN Effectors in Phytophthora capsici Shows Modularity and Functional Diversity. PLoS ONE 2013, 8, e59517. [Google Scholar] [CrossRef]
- Feng, B.-Z.; Zhu, X.-P.; Fu, L.; Lv, R.-F.; Storey, D.; Tooley, P.; Zhang, X.-G. Characterization of necrosis-inducing NLP proteins in Phytophthora capsici. BMC Plant Biol. 2014, 14, 126. [Google Scholar] [CrossRef] [PubMed]
- Alzohairy, S.A.; Hammerschmidt, R.; Hausbeck, M.K. Changes in winter squash fruit exocarp structure associated with age-related resistance to Phytophthora capsici. Phytopathology 2020, 110, 447–455. [Google Scholar] [CrossRef] [PubMed]
- Wang, Z.; Gerstein, M.; Snyder, M. RNA-Seq: A revolutionary tool for transcriptomics. Nat. Rev. Genet. 2009, 10, 57–63. [Google Scholar] [CrossRef]
- Guo, W.-L.; Chen, B.-H.; Chen, X.-J.; Guo, Y.-Y.; Yang, H.-L.; Li, X.-Z.; Wang, G.-Y. Transcriptome profiling of pumpkin (Cucurbita moschata Duch.) leaves infected with powdery mildew. PLoS ONE 2018, 13, e0190175. [Google Scholar] [CrossRef] [PubMed]
- Amoroso, C.G.; Andolfo, G.; Capuozzo, C.; Di Donato, A.; Martinez, C.; Tomassoli, L.; Ercolano, M.R. Transcriptomic and genomic analysis provides new insights in molecular and genetic processes involved in zucchini ZYMV tolerance. BMC Genom. 2022, 23, 371. [Google Scholar] [CrossRef]
- Vitiello, A.; Rao, R.; Corrado, G.; Chiaiese, P.; Digilio, M.C.; Cigliano, R.A.; D’Agostino, N. De novo transcriptome assembly of Cucurbita pepo L. leaf tissue infested by Aphis gossypii. Data 2018, 3, 36. [Google Scholar] [CrossRef]
- Carvajal, F.; Rosales, R.; Palma, F.; Manzano, S.; Cañizares, J.; Jamilena, M.; Garrido, D. Transcriptomic changes in Cucurbita pepo fruit after cold storage: Differential response between two cultivars contrasting in chilling sensitivity. BMC Genom. 2018, 19, 125. [Google Scholar] [CrossRef]
- Xie, J.; Lei, B.; Niu, M.; Huang, Y.; Kong, Q.; Bie, Z. High throughput sequencing of small RNAs in the two Cucurbita germplasm with different sodium accumulation patterns identifies novel microRNAs involved in salt stress response. PLoS ONE 2015, 10, e0127412. [Google Scholar] [CrossRef]
- Huang, H.-X.; Yu, T.; Li, J.-X.; Qu, S.-P.; Wang, M.-M.; Wu, T.-Q.; Zhong, Y.-J. Characterization of Cucurbita maxima Fruit Metabolomic Profiling and Transcriptome to Reveal Fruit Quality and Ripening Gene Expression Patterns. J. Plant Biol. 2019, 62, 203–216. [Google Scholar] [CrossRef]
- Pomares-Viciana, T.; Del Río-Celestino, M.; Román, B.; Die, J.; Pico, B.; Gómez, P. First RNA-seq approach to study fruit set and parthenocarpy in zucchini (Cucurbita pepo L.). BMC Plant Biol. 2019, 19, 61. [Google Scholar] [CrossRef]
- Wyatt, L.E.; Strickler, S.R.; Mueller, L.A.; Mazourek, M. An acorn squash (Cucurbita pepo ssp. ovifera) fruit and seed transcriptome as a resource for the study of fruit traits in Cucurbita. Hortic. Res. 2015, 2, 14070. [Google Scholar] [CrossRef]
- Wyatt, L.E.; Strickler, S.R.; Mueller, L.A.; Mazourek, M. Comparative analysis of Cucurbita pepo metabolism throughout fruit development in acorn squash and oilseed pumpkin. Hortic. Res. 2016, 3, 16045. [Google Scholar] [CrossRef] [PubMed]
- Xanthopoulou, A.; Montero-Pau, J.; Picó, B.; Boumpas, P.; Tsaliki, E.; Paris, H.S.; Tsaftaris, A.; Kalivas, A.; Mellidou, I.; Ganopoulos, I. A comprehensive RNA-Seq-based gene expression atlas of the summer squash (Cucurbita pepo) provides insights into fruit morphology and ripening mechanisms. BMC Genom. 2021, 22, 341. [Google Scholar] [CrossRef] [PubMed]
- Schroeder, A.; Mueller, O.; Stocker, S.; Salowsky, R.; Leiber, M.; Gassmann, M.; Lightfoot, S.; Menzel, W.; Granzow, M.; Ragg, T. The RIN: An RNA integrity number for assigning integrity values to RNA measurements. BMC Mol. Biol. 2006, 7, 3. [Google Scholar] [CrossRef]
- Kim, D.; Langmead, B.; Salzberg, S.L. HISAT: A fast spliced aligner with low memory requirements. Nat. Methods 2015, 12, 357–360. [Google Scholar] [CrossRef] [PubMed]
- Liao, Y.; Smyth, G.K.; Shi, W. featureCounts: An efficient general purpose program for assigning sequence reads to genomic features. Bioinformatics 2014, 30, 923–930. [Google Scholar] [CrossRef]
- Love, M.I.; Huber, W.; Anders, S. Moderated estimation of fold change and dispersion for RNA-seq data with DESeq2. Genome Biol. 2014, 15, 550. [Google Scholar] [CrossRef]
- Wang, P.; Wu, H.; Zhao, G.; He, Y.; Kong, W.; Zhang, J.; Liu, S.; Liu, M.; Hu, K.; Liu, L.; et al. Transcriptome analysis clarified genes involved in resistance to Phytophthora capsici in melon. PLoS ONE 2020, 15, e0227284. [Google Scholar] [CrossRef]
- Naveed, Z.A.; Ali, G.S. Comparative Transcriptome Analysis between a Resistant and a Susceptible Wild Tomato Accession in Response to Phytophthora parasitica. Int. J. Mol. Sci. 2018, 19, 3735. [Google Scholar] [CrossRef] [PubMed]
- Regente, M.; Pinedo, M.; Clemente, H.S.; Balliau, T.; Jamet, E.; de la Canal, L. Plant extracellular vesicles are incorporated by a fungal pathogen and inhibit its growth. J. Exp. Bot. 2017, 68, 5485–5495. [Google Scholar] [CrossRef]
- Slesak, I.; Libik, M.; Karpinska, B.; Karpinski, S.; Miszalski, Z. The role of hydrogen peroxide in regulation of plant metabolism and cellular signalling in response to environmental stresses. Acta Biochim. Pol. 2007, 54, 39–50. [Google Scholar] [CrossRef] [PubMed]
- Smirnoff, N.; Arnaud, D. Hydrogen peroxide metabolism and functions in plants. New Phytol. 2019, 221, 1197–1214. [Google Scholar] [CrossRef] [PubMed]
- Hung, S.-H.; Yu, C.-W.; Lin, C.H. Hydrogen peroxide functions as a stress signal in plants. Bot. Bull. Acad. Sin. 2005, 46, 1–10. [Google Scholar]
- Narváez-Barragán, D.A.; Tovar-Herrera, O.E.; Torres, M.; Rodríguez, M.; Humphris, S.; Toth, I.K.; Segovia, L.; Serrano, M.; Martínez-Anaya, C. Expansin-like Exl1 from Pectobacterium is a virulence factor required for host infection, and induces a defence plant response involving ROS, and jasmonate, ethylene and salicylic acid signalling pathways in Arabidopsis thaliana. Sci. Rep. 2020, 10, 7747. [Google Scholar] [CrossRef]
- Ahn, Y.O.; Zheng, M.; Bevan, D.R.; Esen, A.; Shiu, S.-H.; Benson, J.; Peng, H.-P.; Miller, J.T.; Cheng, C.-L.; Poulton, J.E.; et al. Functional genomic analysis of Arabidopsis thaliana glycoside hydrolase family 35. Phytochemistry 2007, 68, 1510–1520. [Google Scholar] [CrossRef]
- Hejgaard, J.; Jacobsen, S.; Svendsen, I. Two antifungal thaumatin-like proteins from barley grain. FEBS Lett. 1991, 291, 127–131. [Google Scholar] [CrossRef]
- Alison, J.V.; Roberts, W.K.; Selitrennikoff, C.P. A new family of plant antifungal proteins. Mol. Plant Microbe. Interact. 1991, 4, 315–323. [Google Scholar]
- Roberts, W.K.; Selitrennikoff, C.P. Zeamatin, an antifungal protein from maize with membrane-permeabilizing activity. Microbiology 1990, 136, 1771–1778. [Google Scholar] [CrossRef]
- Abad, L.R.; D’Urzo, M.P.; Liu, D.; Narasimhan, M.L.; Reuveni, M.; Zhu, J.K.; Niu, X.; Singh, N.K.; Hasegawa, P.M.; Bressan, R.A. Antifungal activity of tobacco osmotin has specificity and involves plasma membrane permeabilization. Plant Sci. 1996, 118, 11–23. [Google Scholar] [CrossRef]
- Skadsen, R.; Sathish, P.; Kaeppler, H. Expression of thaumatin-like permatin PR-5 genes switches from the ovary wall to the aleurone in developing barley and oat seeds. Plant Sci. 2000, 156, 11–22. [Google Scholar] [CrossRef] [PubMed]
- Van Loon, L.C.; Van Strien, E.A. The families of pathogenesis-related proteins, their activities, and comparative analysis of PR-1 type proteins. Physiol. Mol. Plant Pathol. 1999, 55, 85–97. [Google Scholar] [CrossRef]
- Saboki Ebrahim, K.U.; Singh, B. Pathogenesis related (PR) proteins in plant defense mechanism. Sci. Microb. Pathog. 2011, 2, 1043–1054. [Google Scholar]
- Sinha, M.; Singh, R.P.; Kushwaha, G.S.; Iqbal, N.; Singh, A.; Kaushik, S.; Kaur, P.; Sharma, S.; Singh, T.P. Current overview of allergens of plant pathogenesis related protein families. Sci. World J. 2014, 2014, 543195. [Google Scholar] [CrossRef] [PubMed]
- Zhu, X.; Li, X.; He, Q.; Guo, D.; Liu, C.; Cao, J.; Wu, Z.; Kang, Z.; Wang, X. TaMYB29: A Novel R2R3-MYB Transcription Factor Involved in Wheat Defense against Stripe Rust. Front. Plant Sci. 2021, 12, 783388. [Google Scholar] [CrossRef] [PubMed]
- Müller, M.; Munné-Bosch, S. Ethylene Response Factors: A Key Regulatory Hub in Hormone and Stress Signaling. Plant Physiol. 2015, 169, 32–41. [Google Scholar] [CrossRef]
- Imano, S.; Fushimi, M.; Camagna, M.; Tsuyama-Koike, A.; Mori, H.; Ashida, A.; Tanaka, A.; Sato, I.; Chiba, S.; Kawakita, K.; et al. AP2/ERF transcription factor NbERF-IX-33 is involved in the regulation of phytoalexin production for the resistance of Nicotiana benthamiana to Phytophthora infestans. Front. Plant Sci. 2022, 12, 821574. [Google Scholar] [CrossRef]
- Qiu, J.-L.; Fiil, B.K.; Petersen, K.; Nielsen, H.B.; Botanga, C.J.; Thorgrimsen, S.; Palma, K.; Suarez-Rodriguez, M.C.; Sandbech-Clausen, S.; Lichota, J.; et al. Arabidopsis MAP kinase 4 regulates gene expression through transcription factor release in the nucleus. EMBO J. 2008, 27, 2214–2221. [Google Scholar] [CrossRef]
- Chen, Y.-J.; Perera, V.; Christiansen, M.W.; Holme, I.B.; Gregersen, P.L.; Grant, M.R.; Collinge, D.B.; Lyngkjær, M.F. The barley HvNAC6 transcription factor affects ABA accumulation and promotes basal resistance against powdery mildew. Plant Mol. Biol. 2013, 83, 577–590. [Google Scholar] [CrossRef]
- Hu, Y.; Han, Y.-T.; Wei, W.; Li, Y.-J.; Zhang, K.; Gao, Y.-R.; Zhao, F.-L.; Feng, J.-Y. Identification, isolation, and expression analysis of heat shock transcription factors in the diploid woodland strawberry Fragaria vesca. Front. Plant Sci. 2015, 6, 736. [Google Scholar] [CrossRef] [PubMed]
- Hoang, T.V.; Vo, K.T.X.; Rahman, M.; Choi, S.-H.; Jeon, J.-S. Heat stress transcription factor OsSPL7 plays a critical role in reactive oxygen species balance and stress responses in rice. Plant Sci. 2019, 289, 110273. [Google Scholar] [CrossRef] [PubMed]
- Kan, C.-C.; Chung, T.-Y.; Wu, H.-Y.; Juo, Y.-A.; Hsieh, M.-H. Exogenous glutamate rapidly induces the expression of genes involved in metabolism and defense responses in rice roots. BMC Genom. 2017, 18, 186. [Google Scholar] [CrossRef] [PubMed]
- Seifi, H.S.; Van Bockhaven, J.; Angenon, G.; Höfte, M. Glutamate metabolism in plant disease and defense: Friend or foe? Mol. Plant-Microbe Interact. 2013, 26, 475–485. [Google Scholar] [CrossRef] [PubMed]
- Granrut, A.D.B.D.; Cacas, J.-L. How Very-Long-Chain Fatty Acids Could Signal Stressful Conditions in Plants? Front. Plant Sci. 2016, 7, 1490. [Google Scholar] [CrossRef]


| Pathway ID | Enriched Pathway | p-Value | Number of Genes |
|---|---|---|---|
| Upregulated DEGs | |||
| 394-1-27-12 | |||
| PWY-7214 | Baicalein degradation | 0.000583 | 6 |
| PWY-7445 | Luteolin triglucuronide degradation | 0.000583 | 6 |
| PWY0-1305 | L-glutamate degradation IX | 0.0028 | 2 |
| Butterbush | |||
| PWY-7214 | Baicalein degradation | 0.000000303 | 15 |
| PWY-7445 | Luteolin triglucuronide degradation | 0.000000303 | 15 |
| PWY-361 | Phenylpropanoid biosynthesis | 0.0448 | 7 |
| Downregulated DEGs | |||
| 394-1-27-12 | |||
| PWY-6433 | Hydroxylated fatty acid biosynthesis | 0.000291 | 4 |
| Gene Annotation | Stress Responsive Gene | 394-1-27-12 | |
|---|---|---|---|
| Log2FC | |||
| 72 hpi | 120 hpi | ||
| CmoCh19G007900 | Expansin-like A3 | 16.4 | 28.8 |
| CmoCh19G002930 | Thaumatin-like protein | 14.1 | 12 |
| CmoCh07G002420 | Heat Stress Transcription Factor B-2a | 5.6 | 3.3 |
| CmoCh05G012280 | Wound-Induced Protein WIN1 | 6.1 | 6.3 |
| CmoCh17G007590 | Plant Cadmium Resistance 8 | 5 | 3.4 |
| CmoCh08G010590 | Myb Transcription Factor | 5.6 | 5.6 |
| CmoCh15G009030 | Defensin-Like Protein 1 | 8.9 | 8.4 |
| CmoCh11G011760 | Respiratory-Burst Oxidase, Putative | 4.3 | 3.8 |
| CmoCh05G012270 | Wound-Induced Protein | 6.6 | 7.7 |
| CmoCh14G018460 | Ethylene-Responsive Transcription Factor 1B | 4.4 | 3.1 |
| CmoCh04G022620 | Defensin-Like Protein 6 | 8 | 9.1 |
| Gene Annotation | Oxidation Reduction Gene | 394-1-27-12 | |
|---|---|---|---|
| Log2FC | |||
| 72 hpi | 120 hpi | ||
| CmoCh11G011760 | Respiratory-burst oxidase | 4.3 | 3.8 |
| CmoCh05G007700 | (Cinnamate-4-hydroxylase) (Cytochrome P450 protein) | 4.9 | 3.1 |
| CmoCh20G009870 | Cytochrome P450 family protein | 4.7 | 5.1 |
| CmoCh09G001800 | Cytochrome P450 | 5.8 | 4.9 |
| CmoCh09G001790 | Cytochrome P450 | 4.9 | 3.9 |
| CmoCh09G002630 | Cytochrome P450 | 5.7 | 5.2 |
| CmoCh11G013370 | Putative heme-binding peroxidase | 4.6 | 4.6 |
| CmoCh11G013380 | Putative heme-binding peroxidase | 4.9 | 4.7 |
| CmoCh20G003430 | Peroxidase | 6.3 | 4.8 |
Disclaimer/Publisher’s Note: The statements, opinions and data contained in all publications are solely those of the individual author(s) and contributor(s) and not of MDPI and/or the editor(s). MDPI and/or the editor(s) disclaim responsibility for any injury to people or property resulting from any ideas, methods, instructions or products referred to in the content. |
© 2023 by the authors. Licensee MDPI, Basel, Switzerland. This article is an open access article distributed under the terms and conditions of the Creative Commons Attribution (CC BY) license (https://creativecommons.org/licenses/by/4.0/).
Share and Cite
Acharya, S.R.; Shrestha, S.; Michael, V.N.; Fu, Y.; Sabharwal, P.; Thakur, S.; Meru, G. Transcriptional Changes during Phytophthora capsici Infection Reveal Potential Defense Mechanisms in Squash. Stresses 2023, 3, 827-841. https://doi.org/10.3390/stresses3040056
Acharya SR, Shrestha S, Michael VN, Fu Y, Sabharwal P, Thakur S, Meru G. Transcriptional Changes during Phytophthora capsici Infection Reveal Potential Defense Mechanisms in Squash. Stresses. 2023; 3(4):827-841. https://doi.org/10.3390/stresses3040056
Chicago/Turabian StyleAcharya, Shailesh Raj, Swati Shrestha, Vincent Njung’e Michael, Yuqing Fu, Prerna Sabharwal, Shallu Thakur, and Geoffrey Meru. 2023. "Transcriptional Changes during Phytophthora capsici Infection Reveal Potential Defense Mechanisms in Squash" Stresses 3, no. 4: 827-841. https://doi.org/10.3390/stresses3040056