
Osmotic Stress Alleviation in Saccharomyces cerevisiae for High Ethanol Fermentations with Different Wort Substrates

 , , , ,
Abstract
:1. Introduction
2. Results
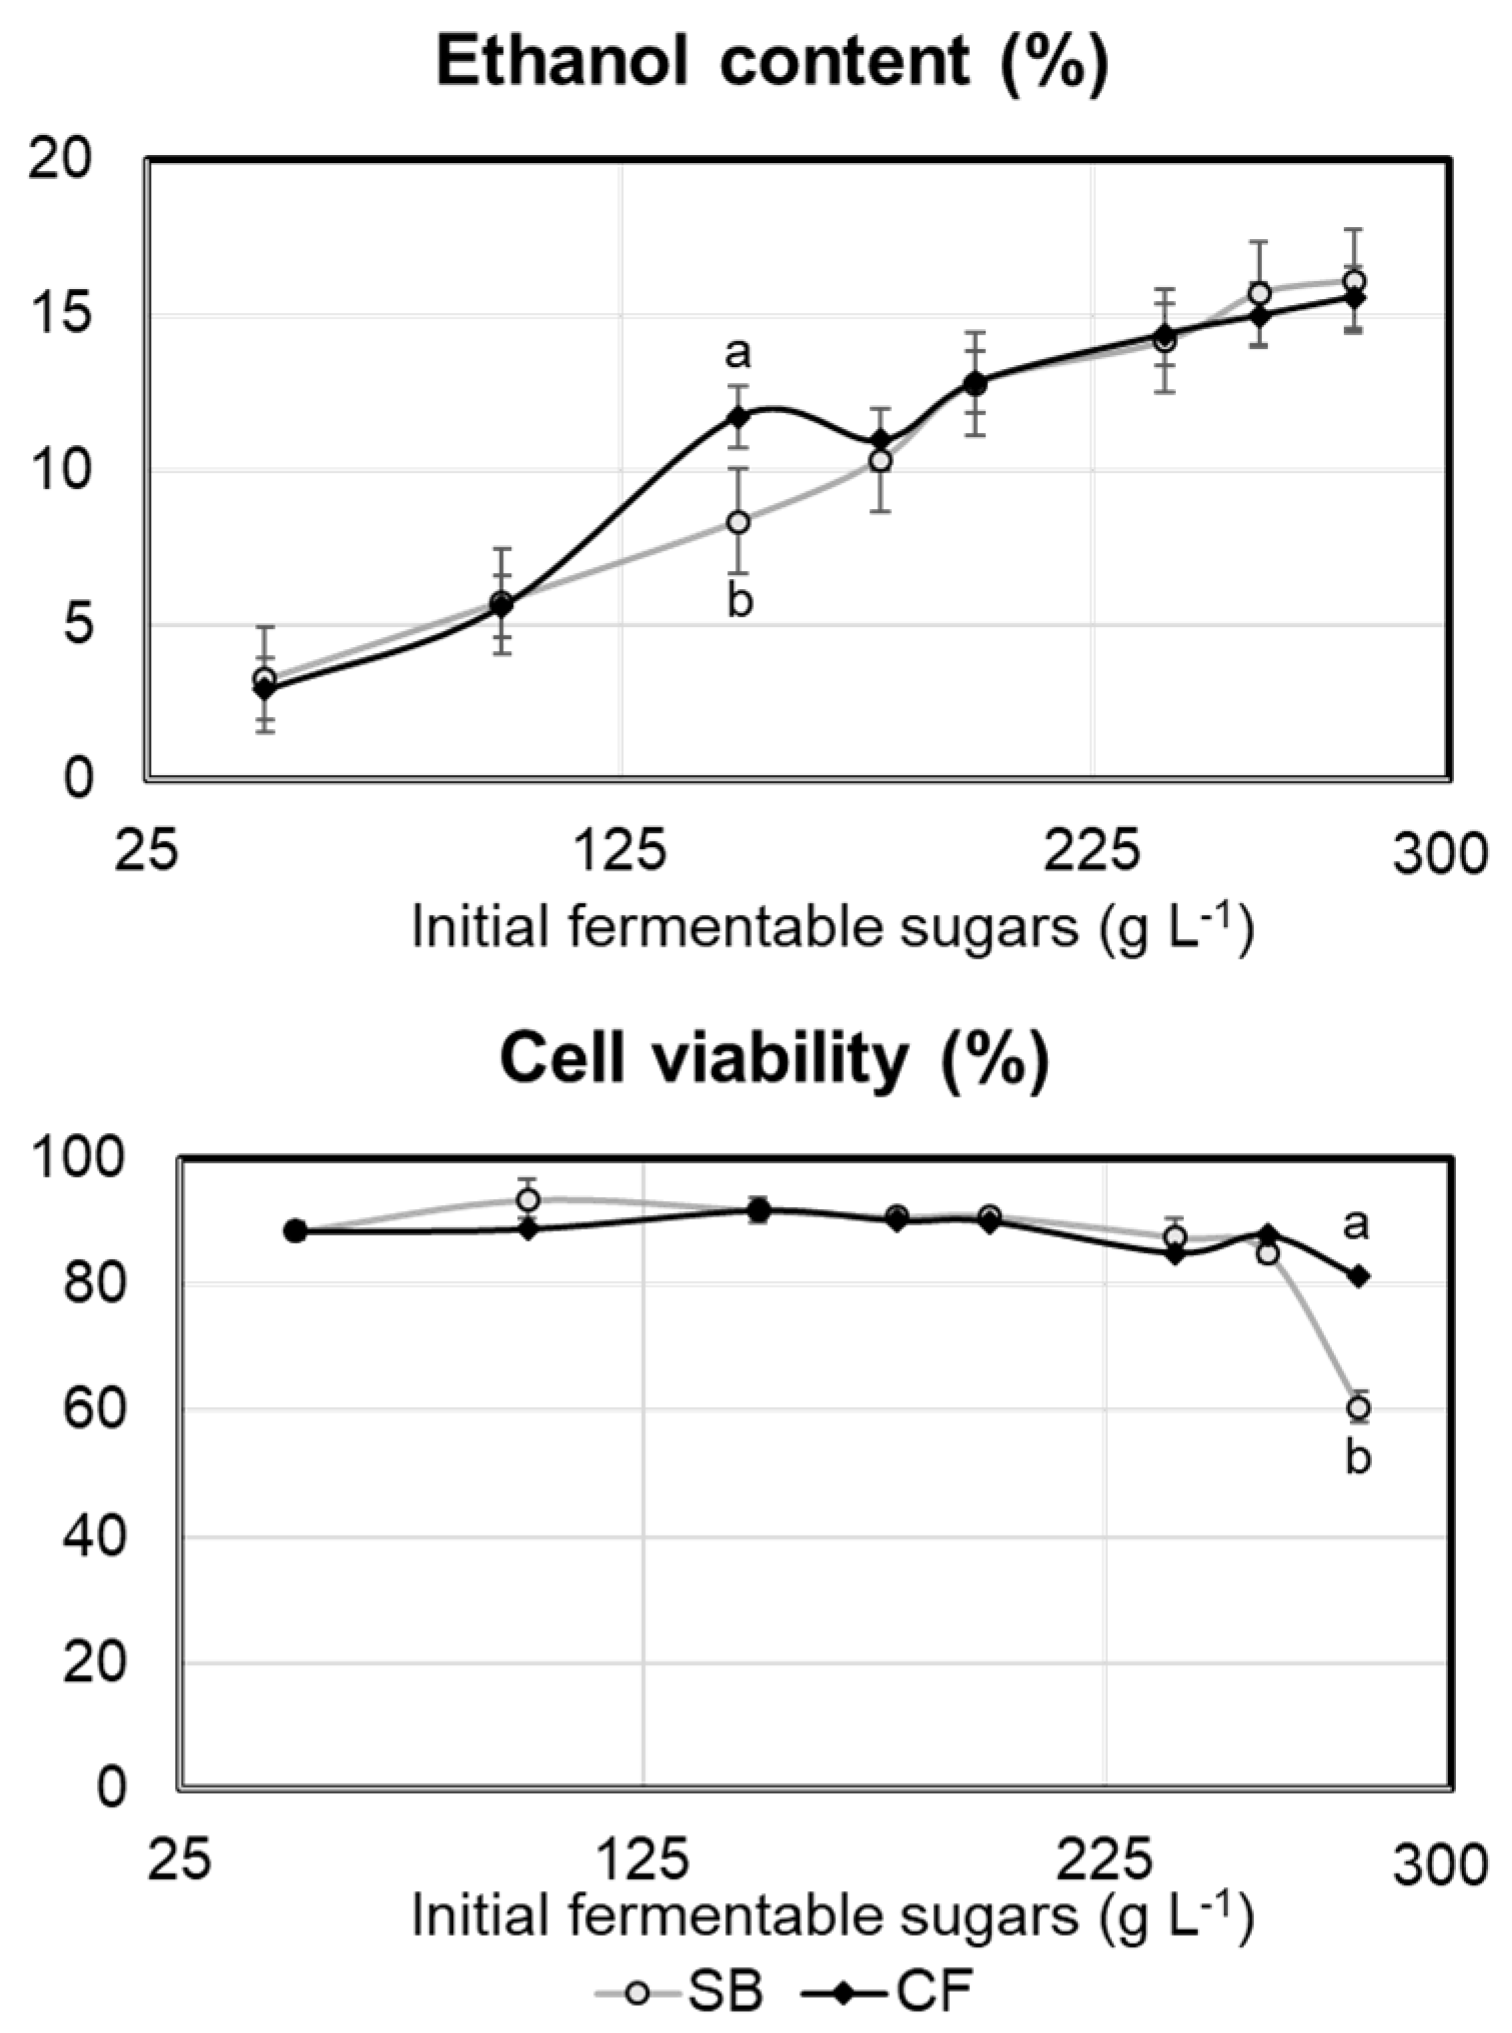
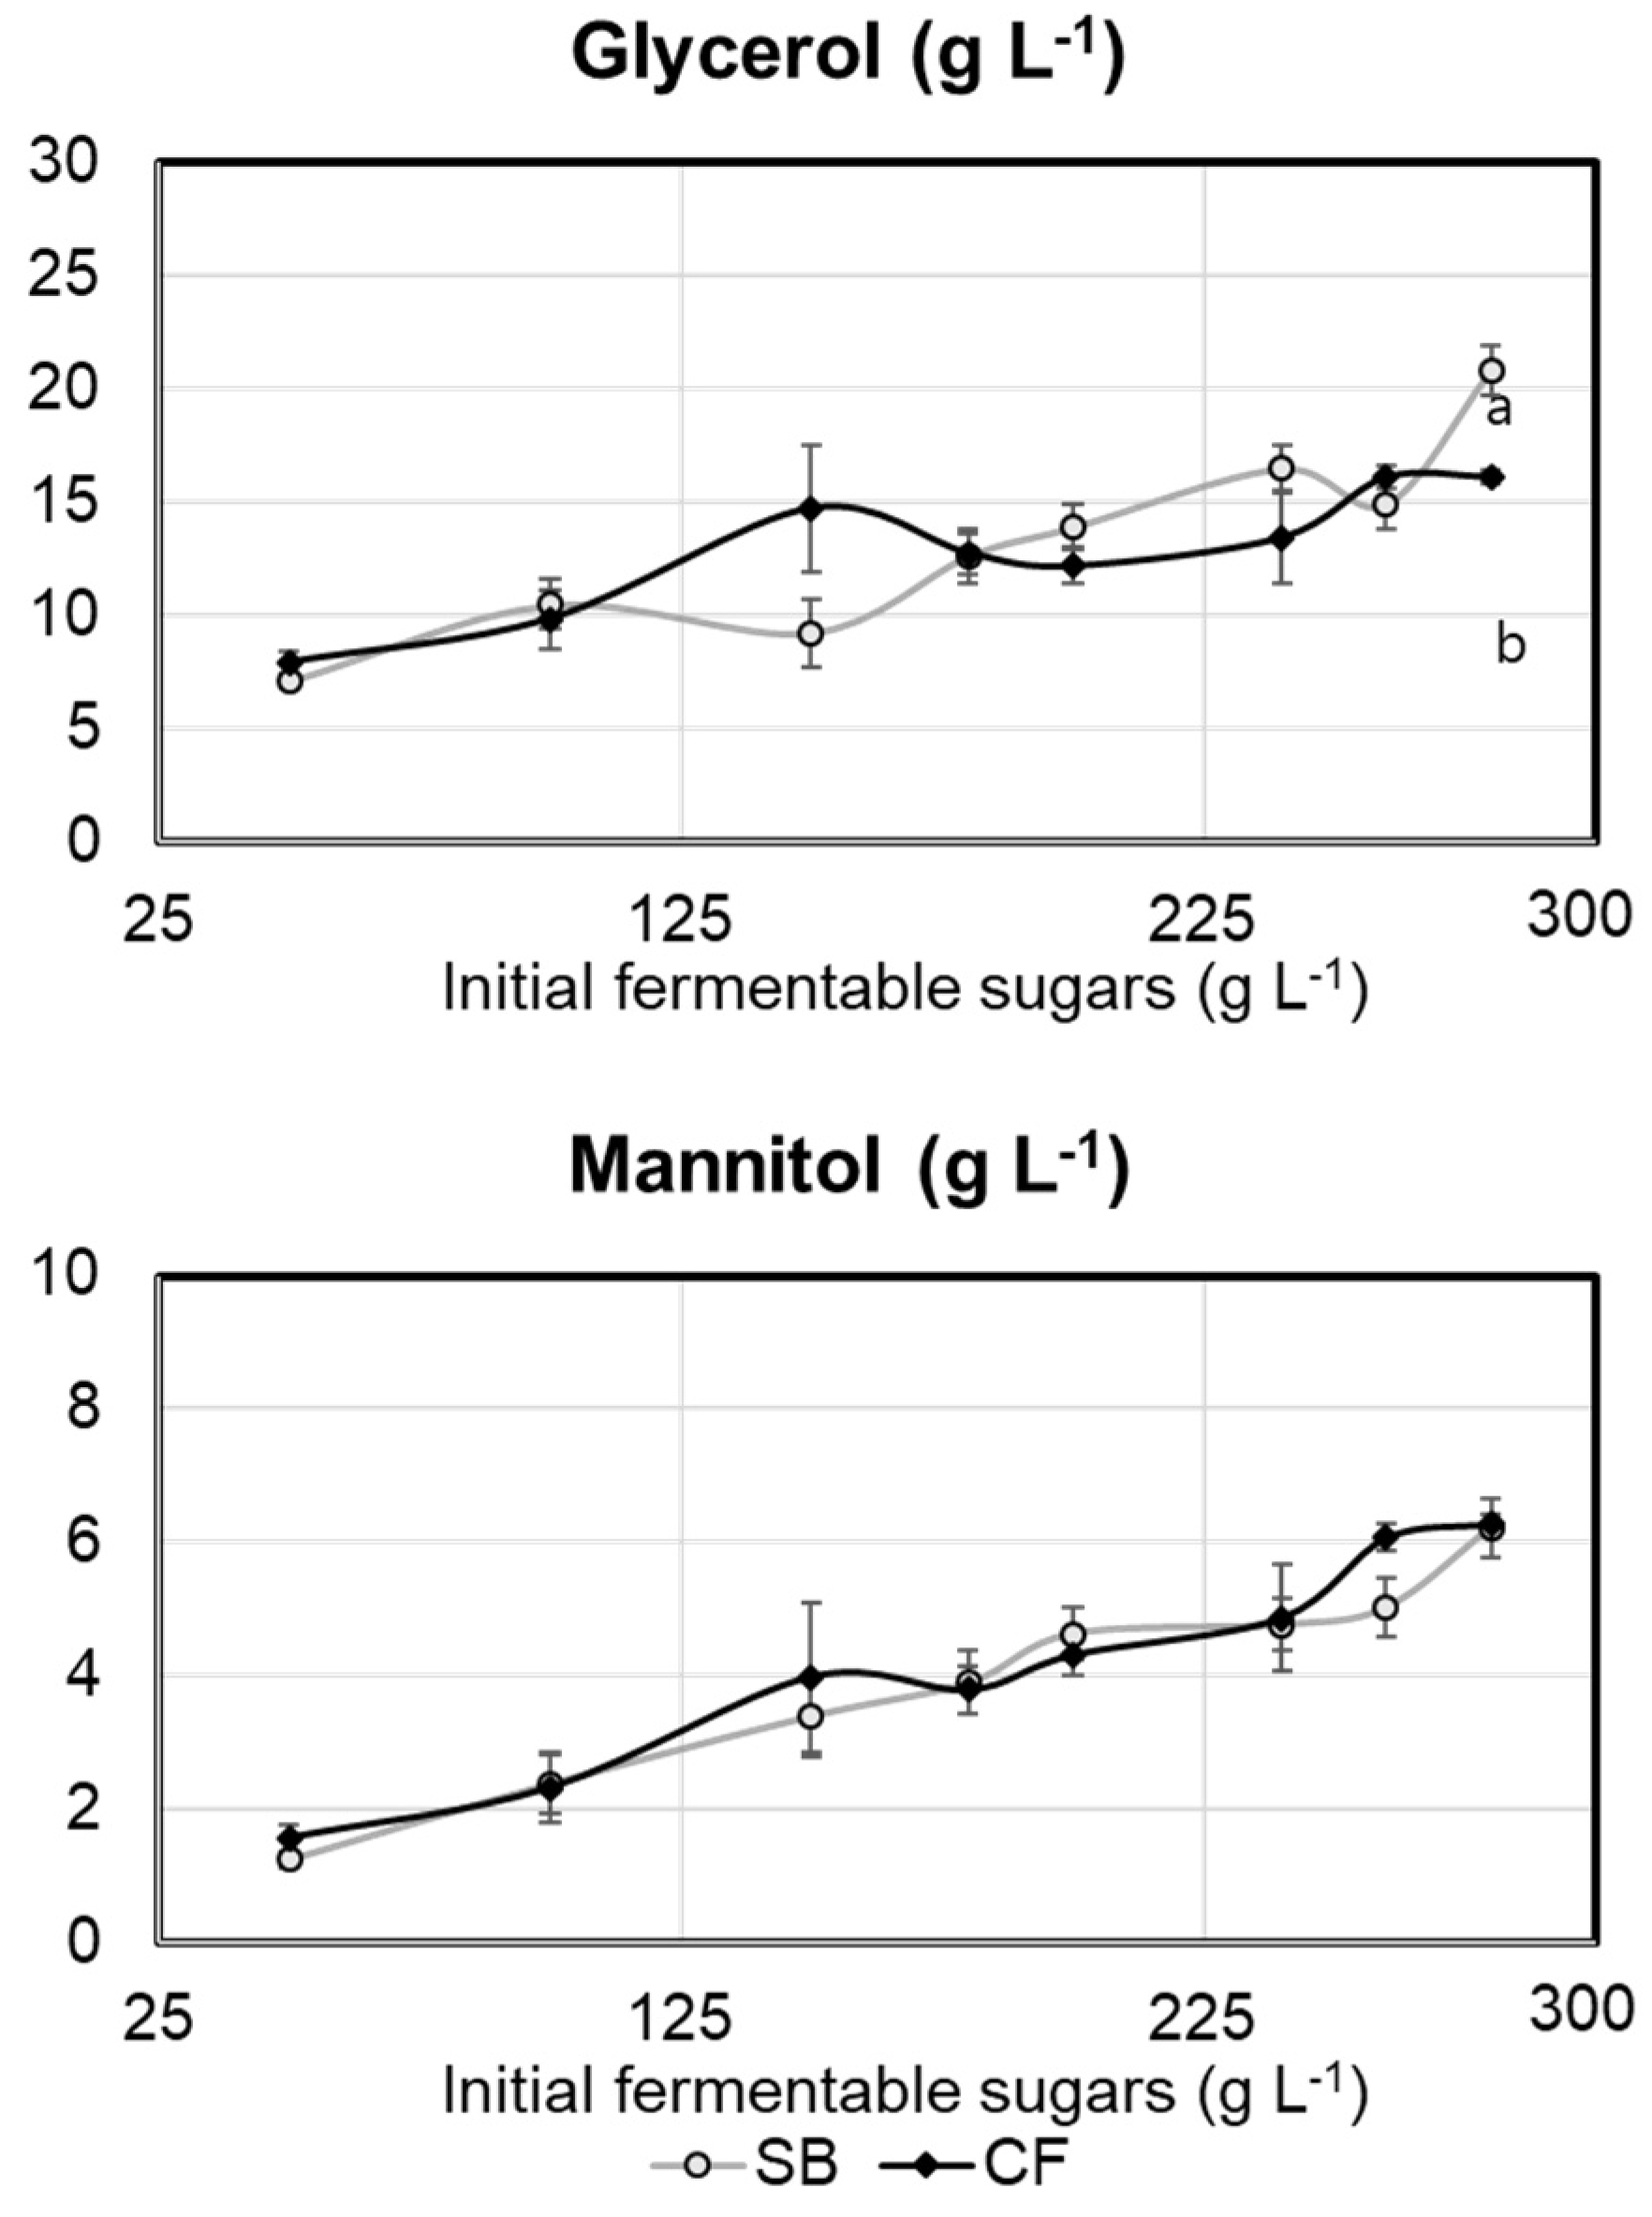
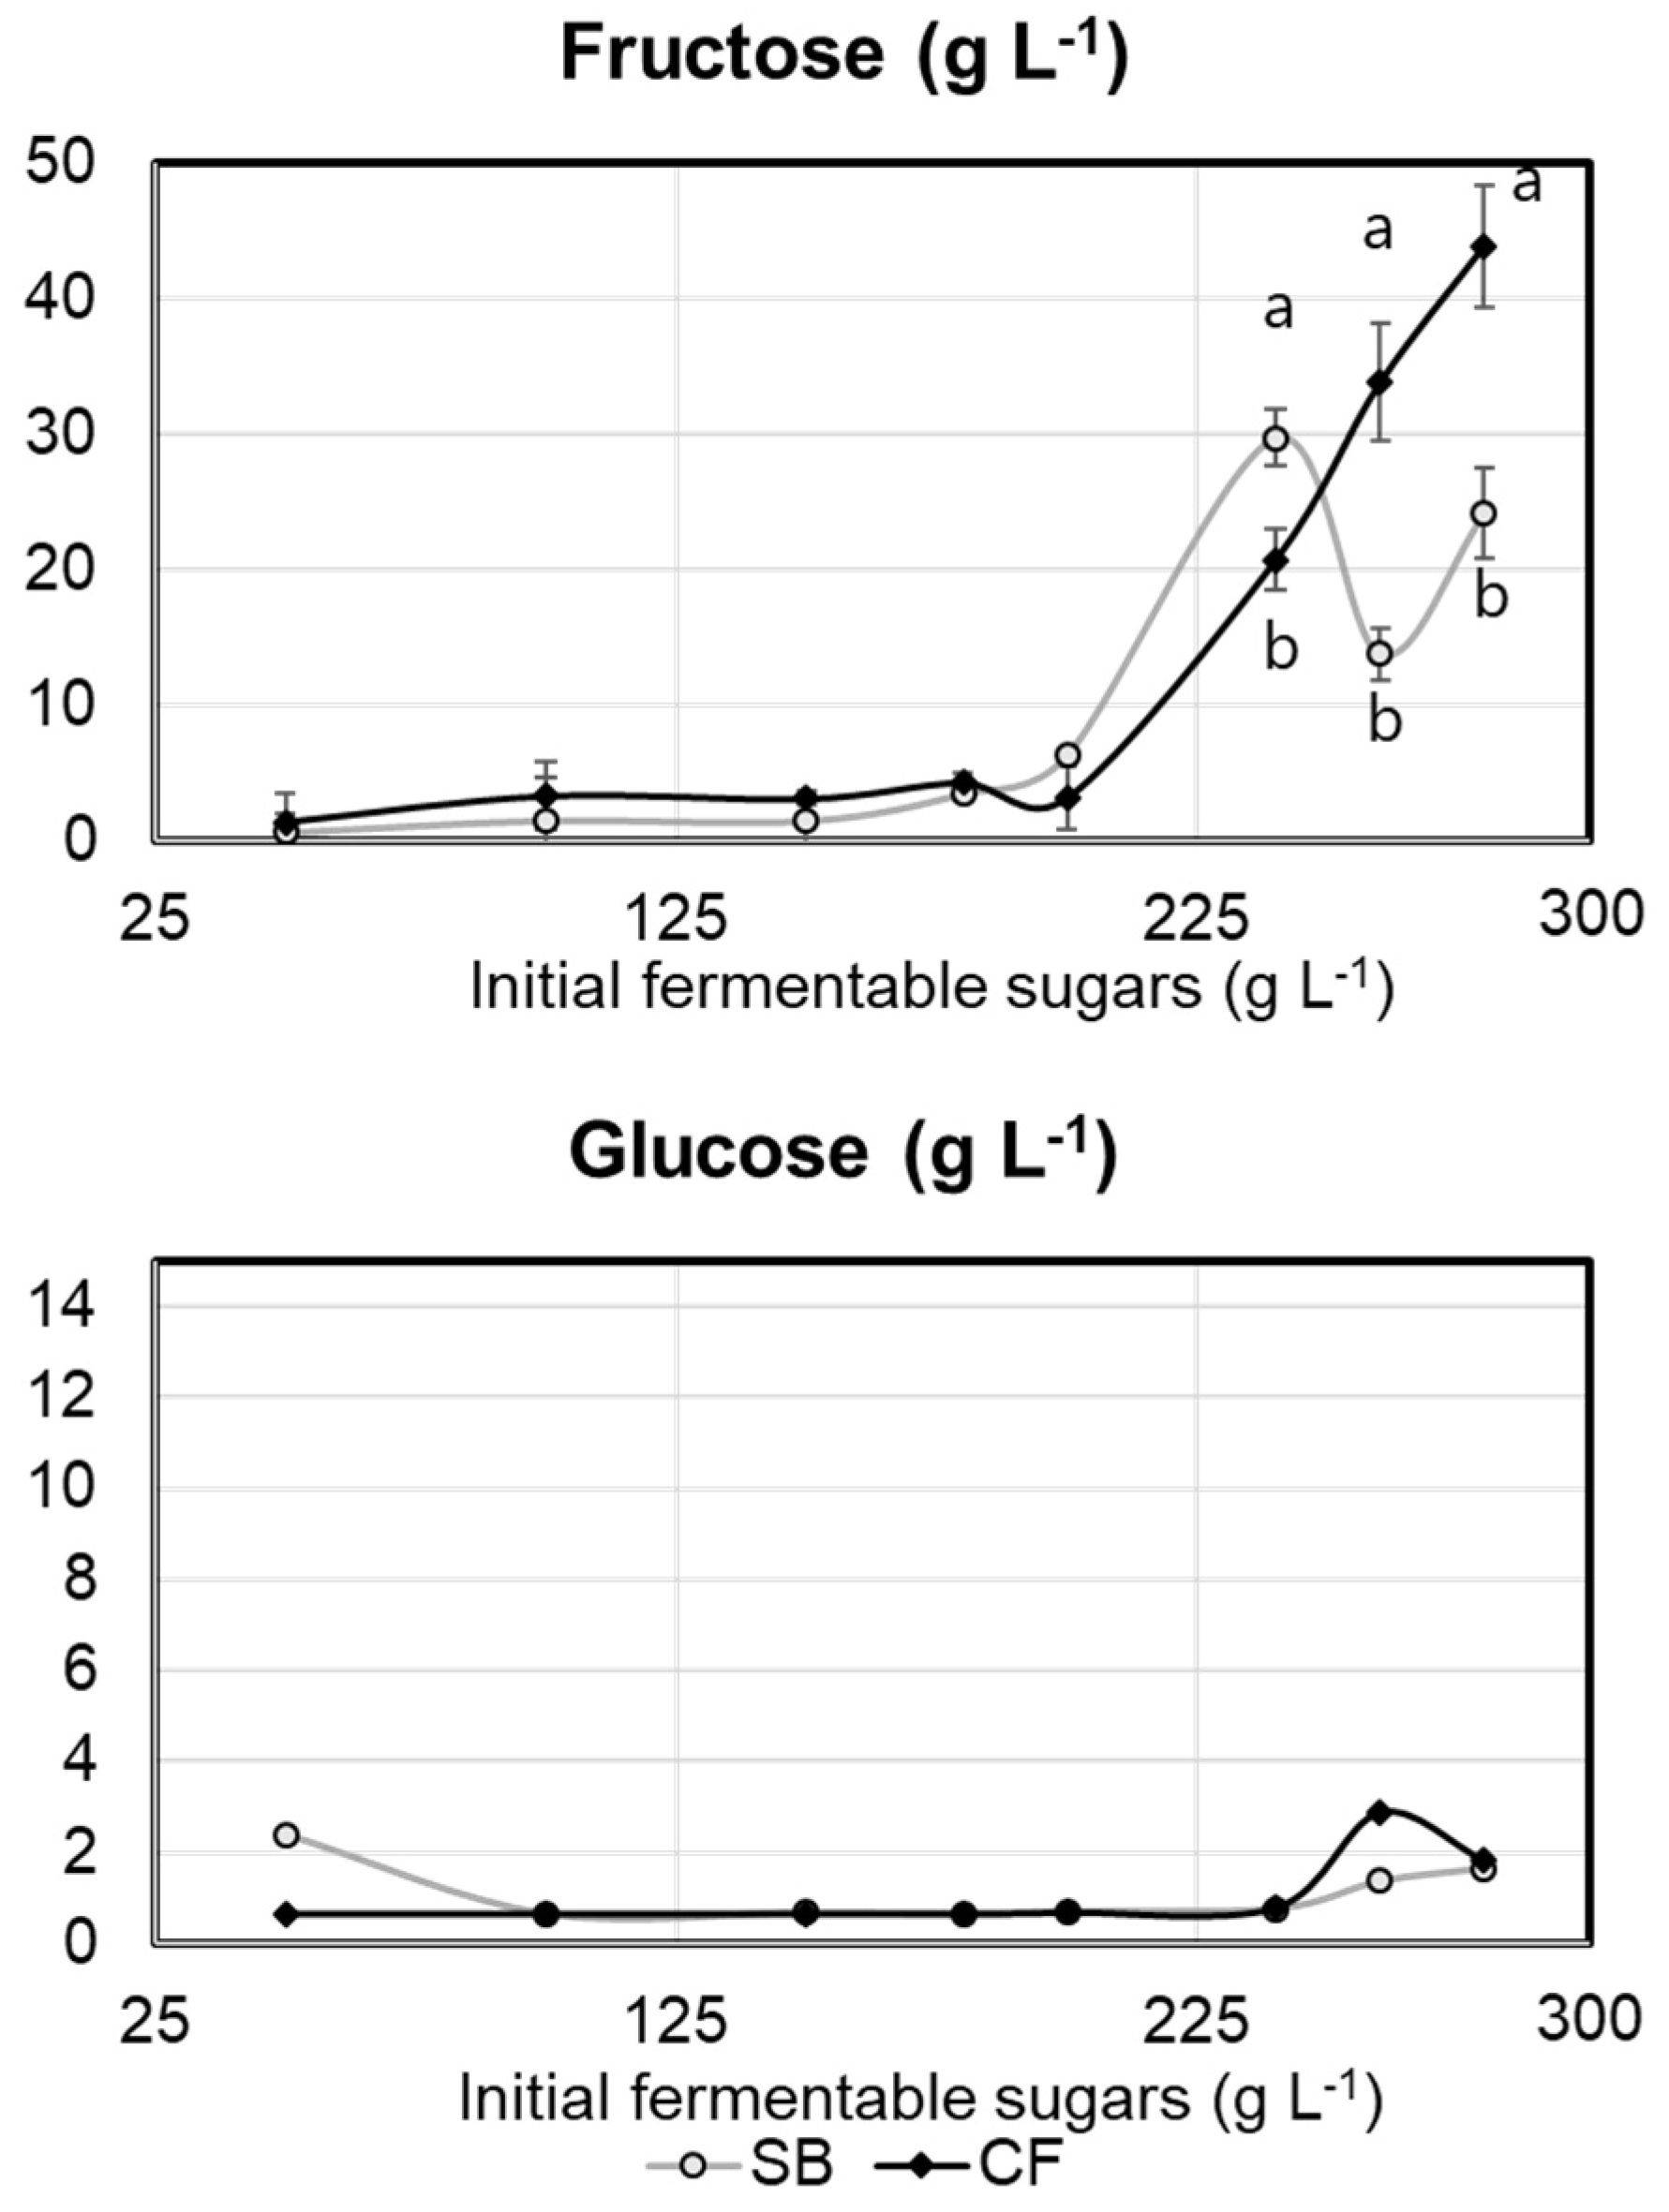
2.1. Experiment 1
2.2. Experiment 2
3. Discussion
3.1. Wort Disinfection
3.2. Yeast Osmotic Stress
3.3. Effects of High Ethanol Content on Fermentation Efficiency
3.4. Effects of Substrate on Fermentation Efficiency and Future Perspectives
4. Materials and Methods
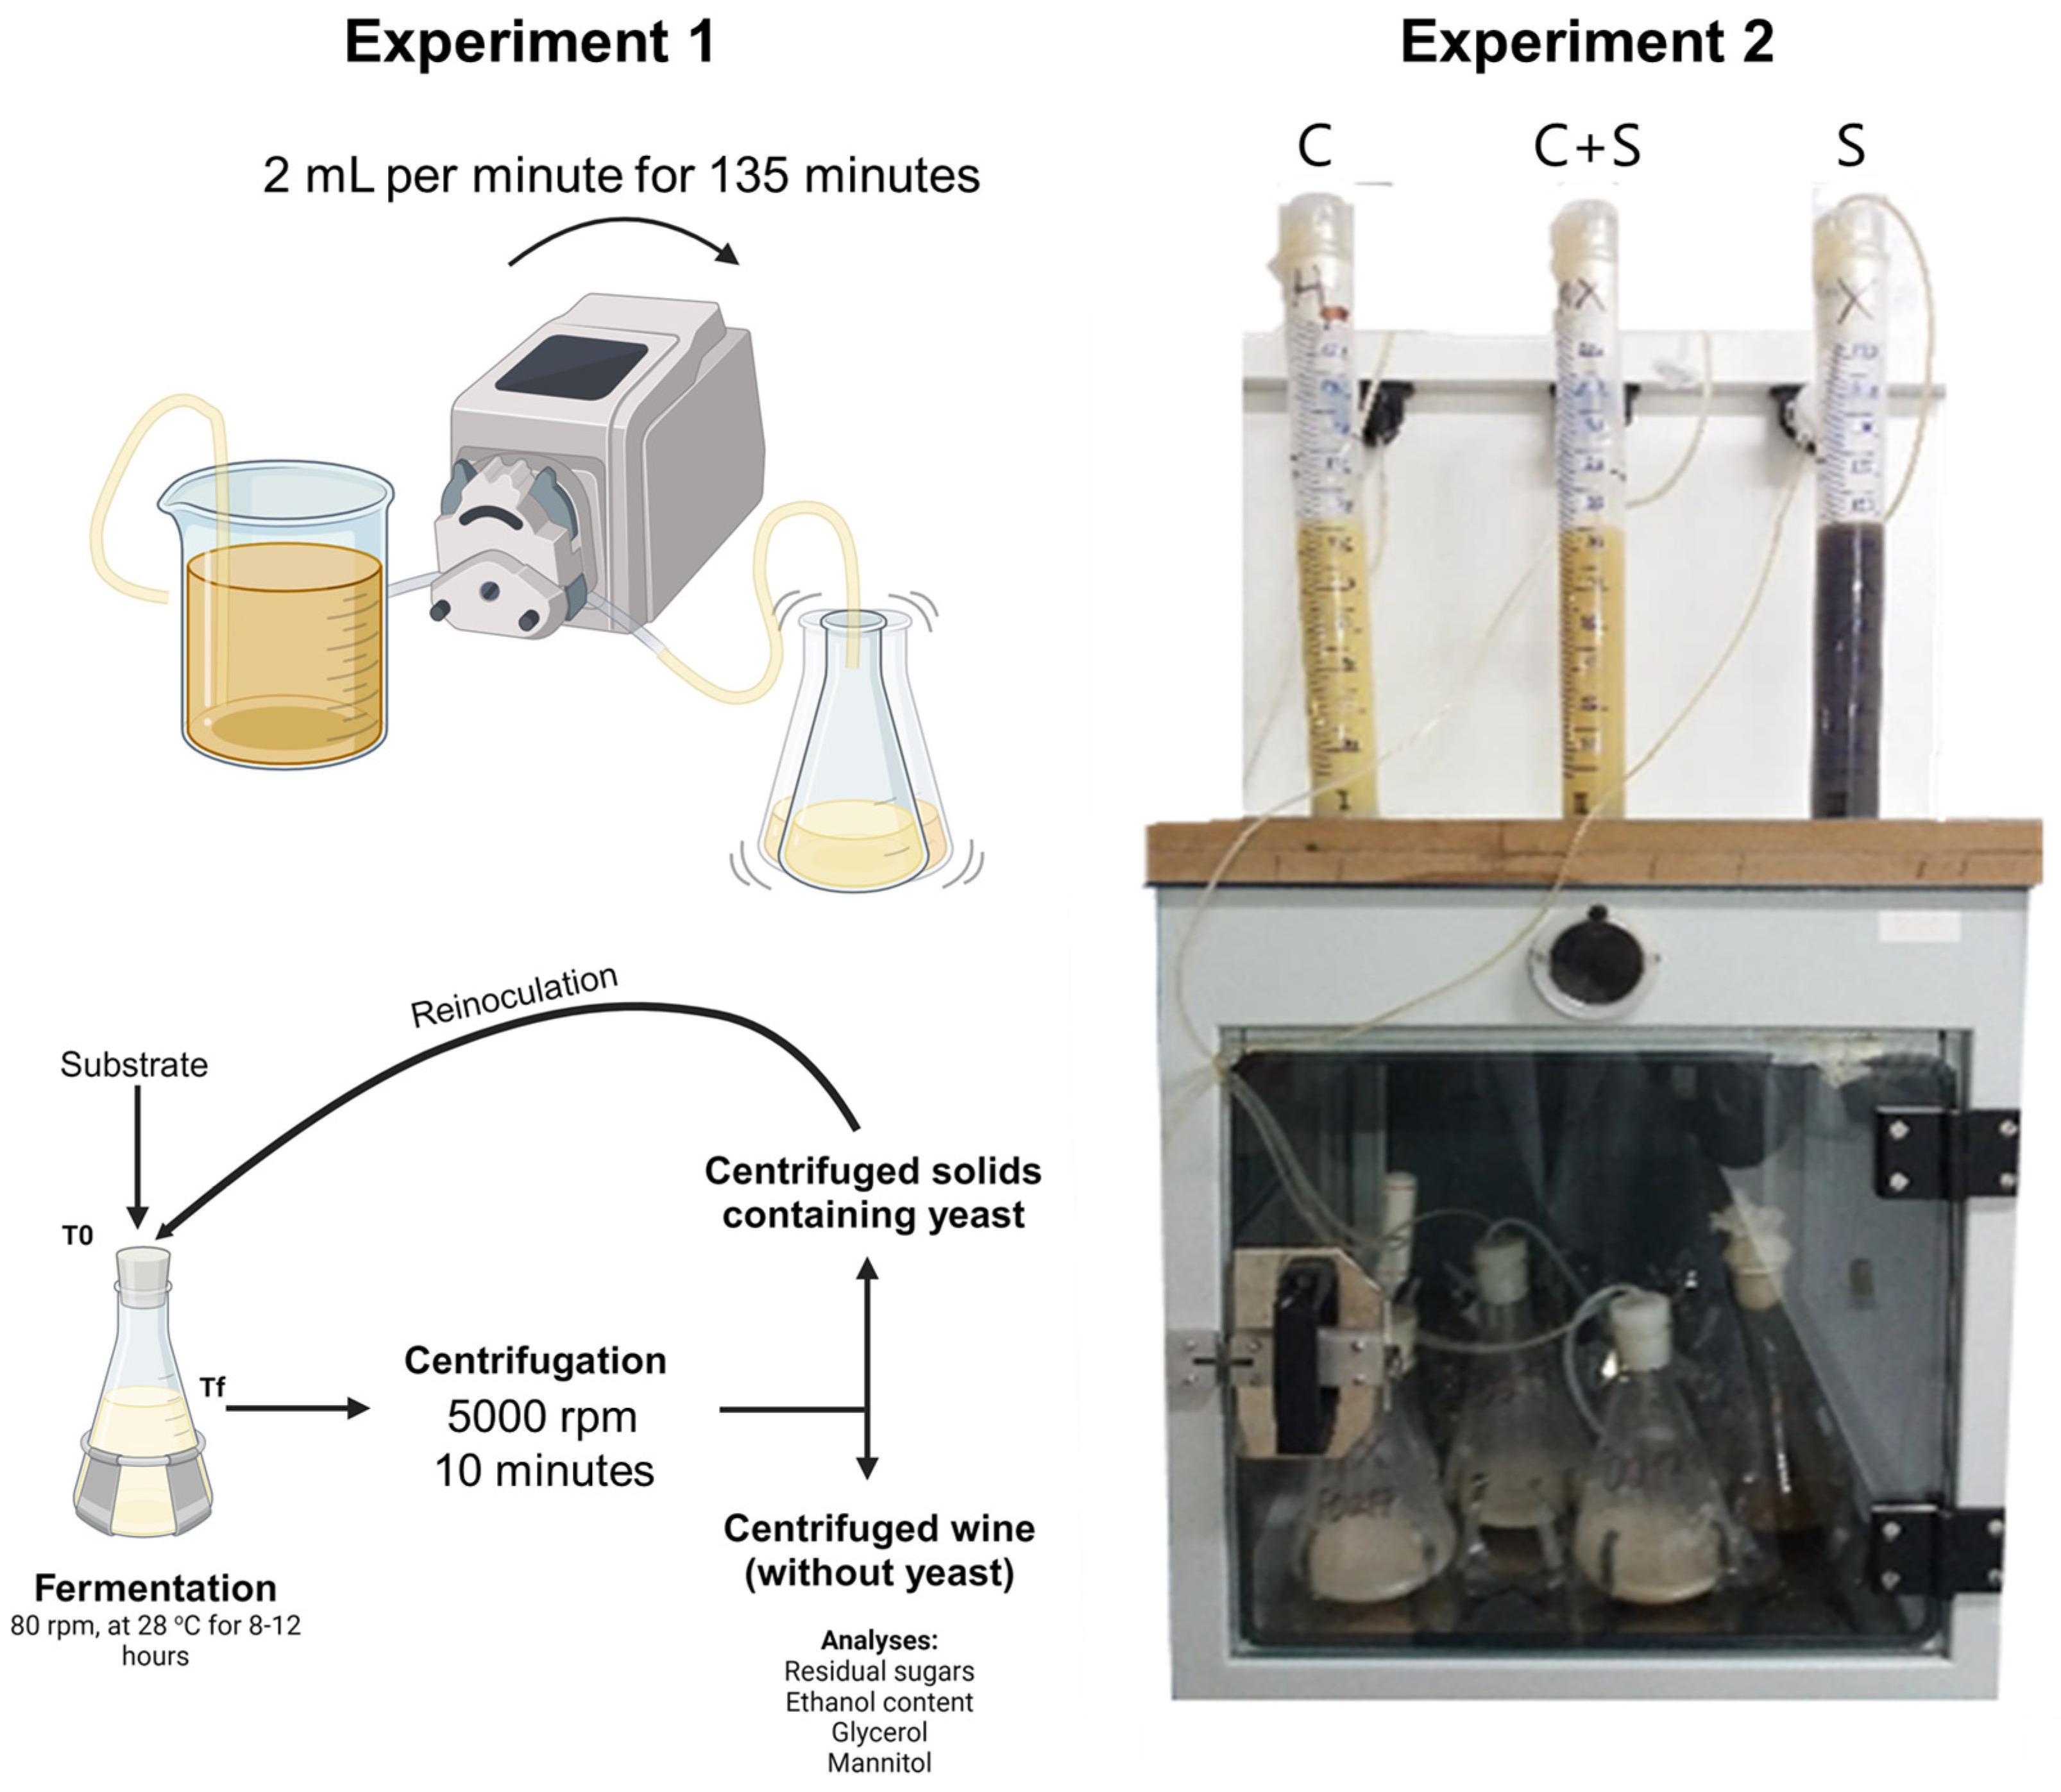
4.1. Experiment 1 Setup
4.2. Experiment 2 Setup
4.3. Analytical Procedures
4.4. Statistical Analysis
5. Conclusions
Author Contributions
Funding
Data Availability Statement
Acknowledgments
Conflicts of Interest
References
- Renewable Fuel Association World Fuel Ethanol Production by Region. Available online: https://ethanolrfa.org/markets-and-statistics/annual-ethanol-production (accessed on 7 October 2023).
- Grassi, M.C.B.; Pereira, G.A.G. Energy-Cane and RenovaBio: Brazilian Vectors to Boost the Development of Biofuels. Ind. Crop. Prod. 2019, 129, 201–205. [Google Scholar] [CrossRef]
- ANP RenovaCalc. Available online: http://www.anp.gov.br/producao-de-biocombustiveis/renovabio/renovacalc (accessed on 10 November 2019).
- Oliveira, M.E.D.; Burton, E.V.; Rykiel, E.J. Ethanol as Fuel: Energy, Carbon Dioxide Balances, and Ecological Footprint. Bioscience 2005, 55, 593–602. [Google Scholar] [CrossRef]
- Goldemberg, J. Ethanol for a Sustainable Energy Future. Science 2007, 315, 808–810. [Google Scholar] [CrossRef] [PubMed]
- Santana Junior, A.E.; Duda, R.M.; de Oliveira, R.A. Improving the Energy Balance of Ethanol Industry with Methane Production from Vinasse and Molasses in Two-Stage Anaerobic Reactors. J. Clean. Prod. 2019, 238, 117577. [Google Scholar] [CrossRef]
- Barros, S.; Woody, K. Corn Ethanol Production Booms in Brazil; U.S. Agribusiness Trade Mission Cements U.S. Presence in Southeast Asia: Brasilia, Brazil, 2020.
- Sica, P.; Prado, L.M.L.M.; Granja, P.; de Carvalho, E.M.; Mattos, E.d.C.; Calegari, R.P.; Silverio, M.; Martins, B.C.; Baptista, A.S. Effects of Energy Cane (Saccharum Spp.) Juice on Corn Ethanol (Zea mays) Fermentation Efficiency: Integration towards a More Sustainable Production. Fermentation 2021, 7, 30. [Google Scholar] [CrossRef]
- Silva, A.P.M.d.; Sica, P.; Pires, L.d.A.N.; Spironello, L.; Mota, L.A.; Peixoto, G.T.; Calegari, R.P.; Basso, T.O.; Tonso, A.; Gomes, M.P.; et al. Integration of Corn and Cane for Ethanol Production: Effects of Lactobacilli Contamination on Fermentative Parameters and Use of Ionizing Radiation Treatment for Disinfection. Fermentation 2023, 9, 89. [Google Scholar] [CrossRef]
- Moraes, B.S.; Zaiat, M.; Bonomi, A. Anaerobic Digestion of Vinasse from Sugarcane Ethanol Production in Brazil: Challenges and Perspectives. Renew. Sustain. Energy Rev. 2015, 44, 888–903. [Google Scholar] [CrossRef]
- Freire, W.J.; Cortez, L.A.B. Vinasse from Sugarcane, 1st ed.; Agropecuária: Guaíba, Brazil, 2000. (In Portuguese) [Google Scholar]
- Sica, P.; Carvalho, R.; Beltrame, H.; Baptista, A.S. Assessment of the Effects of Sugarcane Straw Addition to the Flocculation/Coagulation Process on Vinasse Concentration. Acta Technol. Agric. 2020, 23, 132–136. [Google Scholar] [CrossRef]
- Thomas, K.C.; Hynes, S.H.; Ingledew, W.M. Practical and Theoretical Considerations in the Production of High Concentrations of Alcohol by Fermentation. Process Biochem. 1996, 31, 321–331. [Google Scholar] [CrossRef]
- Sica, P.; Carvalho, R.; Das, K.C.C.; Baptista, A.S.A.S. Biogas and Biofertilizer from Vinasse: Making Sugarcane Ethanol Even More Sustainable. J. Mater. Cycles Waste Manag. 2020, 22, 1427–1433. [Google Scholar] [CrossRef]
- Sica, P.; Marabesi, A.O.; Seleghim, A.R.; Das, K.C.; Baptista, A.S. Effects of Vinasse Concentration on Biogas Production: An Experimental Work and Case Study in the Context of RenovaBio in Brazil. Bioresour. Technol. Rep. 2024, 25, 101698. [Google Scholar] [CrossRef]
- MAGER, W.; SIDERIUS, M. Novel Insights into the Osmotic Stress Response of Yeast. FEMS Yeast Res. 2002, 2, 251–257. [Google Scholar] [CrossRef] [PubMed]
- Van Wuytswinkel, O.; Reiser, V.; Siderius, M.; Kelders, M.C.; Ammerer, G.; Ruis, H.; Mager, W.H. Response of Saccharomyces Cerevisiae to Severe Osmotic Stress: Evidence for a Novel Activation Mechanism of the HOG MAP Kinase Pathway. Mol. Microbiol. 2000, 37, 382–397. [Google Scholar] [CrossRef] [PubMed]
- Hohmann, S. Shaping up: The Responses of Yeast to Osmotic Stress. In Yeast Stress Responses; Hohmann, S., Mager, W.H., Eds.; R. G. Landes Company: Austin, TX, USA, 1997; Volume 1, pp. 101–146. [Google Scholar]
- D’amore, T.; Panchal, C.J.; Russell, I.; Stewart, G.G. A Study of Ethanol Tolerance in Yeast. Crit. Rev. Biotechnol. 1989, 9, 287–304. [Google Scholar] [CrossRef]
- Rose, A.H.; Harrison, J.N. The Yeasts; Academic Press Inc.: London, UK, 1970. [Google Scholar]
- Johnson, E.A.; Echavarri-Erasun, C. Yeast Biotechnology. In Yeast Biotechnology; Kurtzman, C.P., Fell, J.W., Boekhout, T., Eds.; Elsevier B.V.: Amsterdam, The Netherlands, 2011; Volume 1, pp. 21–44. ISBN 9780444521491. [Google Scholar]
- Crumplen, R.; D’amore, T.; Panchal, C.J.; Russell, I.; Stewart, G.G. Industrial Uses of Yeast Present and Future. Int. Symp. Yeasts 1988, 5, 3–9. [Google Scholar]
- Walker, G.M.; Walker, R.S.K. Enhancing Yeast Alcoholic Fermentations. Adv. Appl. Microbiol. 2018, 1, 87–129. [Google Scholar] [CrossRef]
- Tonoli, F.C. Adaptação de Leveduras Para Fermentação Com Alto Teor Alcoólico. Master’s Thesis, University of Sao Paulo, Sao Paulo, Brazil, 2017. [Google Scholar]
- Iglesias, C.; Sesmero, J.P. Economic Analysis of Supplementing Sugarcane with Corn for Ethanol Production in Brazil: A Case Study in Uberaba. Bioenergy Res. 2015, 8, 627–643. [Google Scholar] [CrossRef]
- Thomas, K.C.; Hynes, S.H.; Ingledew, W.M. Effect of Lactobacilli on Yeast Growth, Viability and Batch and Semi-Continuous Alcoholic Fermentation of Corn Mash. J. Appl. Microbiol. 2001, 90, 819–828. [Google Scholar] [CrossRef]
- Ceccato-Antonini, S.R. Conventional and Nonconventional Strategies for Controlling Bacterial Contamination in Fuel Ethanol Fermentations. World J. Microbiol. Biotechnol. 2018, 34, 80. [Google Scholar] [CrossRef]
- Giannattasio, S.; Guaragnella, N.; Ždralević, M.; Marra, E. Molecular Mechanisms of Saccharomyces Cerevisiae Stress Adaptation and Programmed Cell Death in Response to Acetic Acid. Front. Microbiol. 2013, 4, 33. [Google Scholar] [CrossRef]
- Borrely, S.I.; Del Mastro, N.L.; Sampa, M.H.O. Improvement of Municipal Wastewaters by Electron Beam Accelerator in Brazil. Radiat. Phys. Chem. 1998, 52, 333–337. [Google Scholar] [CrossRef]
- Podadera, P. Estudo Das Propriedades Do Açúcar Líquido Invertido Processado Com Radiação Gama e Feixe de Elétrons. Ph.D. Thesis, University of Sao Paulo, Sao Paulo, Brazil, 2007. [Google Scholar]
- Rela, P.R. Desenvolvimento De Dispositivo De Irradiação Para Tratamento De Efluentes Industriais Com Feixe De Elétrons. Ph.D. Thesis, University of Sao Paulo, Sao Paulo, Brazil, 2003. [Google Scholar]
- Bhat, R.; Karim Alias, A.; Paliyath, G. Use of Electron Beams in Food Preservation. In Progress in Food Preservation; Bhat, R., Karim, A., Alias, G.P., Eds.; Wiley-Blackwell: Oxford, UK, 2012; Volume 17, pp. 343–372. [Google Scholar]
- Calegari, R.P.; da Silva, E.A.; da Silva, A.P.M.; Gomes, M.P.; Mota, L.A.; Arthur, V.; Baptista, A.S. Wort Disinfection Treatment with Electron Beam for Bioethanol Production. Sci. Agric. 2023, 80, e20210260. [Google Scholar] [CrossRef]
- John, G.S.M.; Gayathiri, M.; Rose, C.; Mandal, A.B. Osmotic Shock Augments Ethanol Stress in Saccharomyces Cerevisiae MTCC 2918. Curr. Microbiol. 2012, 64, 100–105. [Google Scholar] [CrossRef] [PubMed]
- Basso, T.O.; de Kok, S.; Dario, M.; do Espirito-Santo, J.C.A.; Müller, G.; Schlölg, P.S.; Silva, C.P.; Tonso, A.; Daran, J.-M.; Gombert, A.K.; et al. Engineering Topology and Kinetics of Sucrose Metabolism in Saccharomyces Cerevisiae for Improved Ethanol Yield. Metab. Eng. 2011, 13, 694–703. [Google Scholar] [CrossRef] [PubMed]
- Yue, G.; Yu, J.; Zhang, X.; Tan, T. The Influence of Nitrogen Sources on Ethanol Production by Yeast from Concentrated Sweet Sorghum Juice. Biomass Bioenergy 2012, 39, 48–52. [Google Scholar] [CrossRef]
- Mattenberger, F.; Sabater-Muñoz, B.; Hallsworth, J.E.; Fares, M.A. Glycerol Stress in Saccharomyces Cerevisiae: Cellular Responses and Evolved Adaptations. Environ. Microbiol. 2017, 19, 990–1007. [Google Scholar] [CrossRef] [PubMed]
- Klein, M.; Swinnen, S.; Thevelein, J.M.; Nevoigt, E. Glycerol Metabolism and Transport in Yeast and Fungi: Established Knowledge and Ambiguities. Environ. Microbiol. 2017, 19, 878–893. [Google Scholar] [CrossRef]
- Cherubin, R.A. Efeitos Da Viabilidade Da Levedura e Da Contaminação Bacteriana Na Fermentação Alcoólica. Ph.D. Thesis, University of Sao Paulo, Sao Paulo, Brazil, 2003. [Google Scholar]
- Rapin, J.D.; Marison, I.W.; von Stockar, U.; Reilly, P.J. Glycerol Production by Yeast Fermentation of Whey Permeate. Enzym. Microb. Technol. 1994, 16, 143–150. [Google Scholar] [CrossRef]
- Cronwright, G.R.; Rohwer, J.M.; Prior, B.A. Metabolic Control Analysis of Glycerol Synthesis in Saccharomyces Cerevisiae. Appl. Environ. Microbiol. 2002, 68, 4448–4456. [Google Scholar] [CrossRef]
- Dijken, J.P.; Scheffers, W.A. Redox Balances in the Metabolism of Sugars by Yeasts. FEMS Microbiol. Lett. 1986, 32, 199–224. [Google Scholar] [CrossRef]
- Albers, E.; Larsson, C.; Liden, G.; Niklasson, C.; Gustafsson, L. Influence of the Nitrogen Source on Saccharomyces Cerevisiae Anaerobic Growth and Product Formation. Appl. Environ. Microbiol. 1996, 62, 3187–3195. [Google Scholar] [CrossRef] [PubMed]
- Jones, A.M.; Thomas, K.C.; Ingledew, W.M. Ethanolic Fermentation of Blackstrap Molasses and SugarCane Juice Using Very High Gravity Technology. J. Agric. Food Chem. 1994, 42, 1242–1246. [Google Scholar] [CrossRef]
- Berthels, N.; Corderootero, R.; Bauer, F.; Thevelein, J.; Pretorius, I. Discrepancy in Glucose and Fructose Utilisation during Fermentation by Wine Yeast Strains. FEMS Yeast Res. 2004, 4, 683–689. [Google Scholar] [CrossRef] [PubMed]
- Henderson, C.M.; Block, D.E. Examining the Role of Membrane Lipid Composition in Determining the Ethanol Tolerance of Saccharomyces Cerevisiae. Appl. Environ. Microbiol. 2014, 80, 2966–2972. [Google Scholar] [CrossRef]
- Olivério, J.L. The Dedini and the Private Effort during the 40 Years of Pro-Alcohol, Or… from the Sugar Mill to the Sustainable Plant. Available online: http://www.fapesp.br/eventos/2016/11/proalcool/Dedini.pdf (accessed on 6 February 2020). (In Portuguese).
- Devantier, R.; Pedersen, S.; Olsson, L. Characterization of Very High Gravity Ethanol Fermentation of Corn Mash. Effect of Glucoamylase Dosage, Pre-Saccharification and Yeast Strain. Appl. Microbiol. Biotechnol. 2005, 68, 622–629. [Google Scholar] [CrossRef] [PubMed]
- Sica, P. Sugarcane Breeding for Enhanced Fiber and Its Impacts on Industrial Processes. In Sugarcane—Biotechnology for Biofuels; Khan, M.S., Ed.; IntechOpen: London, UK, 2021; p. 16. [Google Scholar]
- Sica, P.; de Castro Mattos, E.; Silveira, G.M.; Abdalla, J.P.; Alves, V.K.; Borges, I.S.; Landell, M.; Xavier, M.A.; Baptista, A.S. Quantitative and Qualitative Evaluation of Novel Energy Cane Accessions for Sugar, Bioenergy, 1 G, and 2 G Ethanol Production. Ind. Crop. Prod. 2023, 203, 117163. [Google Scholar] [CrossRef]
- Wang, M.; Han, J.; Dunn, J.B.; Cai, H.; Elgowainy, A. Well-to-Wheels Energy Use and Greenhouse Gas Emissions of Ethanol from Corn, Sugarcane and Cellulosic Biomass for US Use. Environ. Res. Lett. 2012, 7, 045905. [Google Scholar] [CrossRef]
- Poisot, M.; Ramirez, G.; Rubio-Arroyo, M.; Juarez, M.; Vivanco-Loyo, P. Bio-Ethanol Obtained by Fermentation Process with Continuous Feeding of Yeast. J. Mex. Chem. Soc. 2011, 55, 242–245. [Google Scholar]
- Silva, N.D.; Alvim, M.R.; Rosario, C.G.A.; Espinosa, D.C.R.; Baltazar, M.d.P.G. Nutrients’ Supplementation Impacts on Alcholoic Fermentation of Corn and Sugarcane Mixed Wort. Res. Sq. Prepriting 2022, 1–26. [Google Scholar] [CrossRef]
- Shiyan, P.; Mudrak, T.; Kyrylenko, R.; Kovalchuk, S. Effect of Nitrogen and Mineral Composition of the High-Concentrated Wort Made from Starch-Containing Raw Materials on the Cultivation of Yeast. East.-Eur. J. Enterp. Technol. 2017, 6, 72–77. [Google Scholar] [CrossRef]
- Kovalchuk, S.; Shiyan, P.; Mudrak, T.; Kuts, A.; Kyrylenko, R. Investigation of the Influence of Nanoparticles of Metals on Fermenttation of Wort of High Concentrations. EUREKA Life Sci. 2017, 6, 51–56. [Google Scholar] [CrossRef]
- Novo, M.T.; Beltran, G.; Rozes, N.; Guillamon, J.M.; Mas, A. Effect of Nitrogen Limitation and Surplus upon Trehalose Metabolism in Wine Yeast. Appl. Microbiol. Biotechnol. 2005, 66, 560–566. [Google Scholar] [CrossRef] [PubMed]
- Kraus, J.K.; Scopp, R.; Chen, S.L. Effect of Rehydration on Dry Wine Yeast Activity. Am. J. Enol. Vitic. 1981, 32, 132–134. [Google Scholar] [CrossRef]
- Pierce, J.S. Analysis Committee Measurement of Yeast Viability. J. Inst. Brew. 1970, 76, 442–443. [Google Scholar] [CrossRef]
- Oliveira, A.; Gallo, C.; Alcarde, V.; Godoy, A.; Amorim, H. Methods for Microbiological Control in Sugar and Alcohol Production; FERMENTEC/ESALQ/FEALQ: Piracicaba, Brazil, 1996. (In Portuguese) [Google Scholar]
- Amerine, M.A.; Ough, C.S. Methods for Analysis of Musts and Wines. J. Inst. Brew. 1981, 87, 223–224. [Google Scholar]


| Cell Viability | Total Acidity | pH | ||||
|---|---|---|---|---|---|---|
| Substrate * | Initial | Final | Initial | Final | Initial | Final |
| (%) | (g L−1) | |||||
| C | 87.7 ± 6 | 12.9 ± 1 b | 2.44 ± 0.1 | 5.79 ± 0.4 | 5.59 | 4.44 |
| C + S | 87.6 ± 4 | 38.3 ± 2 a | 2.32 ± 0.1 | 6.02 ± 0.4 | 5.51 | 4.49 |
| S | 87.2 ± 2 | 35.1 ± 4 a | 1.84 ± 0.1 | 5.82 ± 0.5 | 5.30 | 4.53 |
| Residual Sugars | Ethanol Content | Productivity | Efficiency | |
|---|---|---|---|---|
| (g L−1) | % | g L−1 h−1 | % | |
| C | 54.9 ± 0.1 a | 12.25 ± 0.35 b | 2.68 ± 0.08 b | 89.8 ± 3.0 b |
| C + S | 60.9 ± 0.2 a | 14.87 ± 0.22 a | 3.26 ± 0.05 a | 96.8 ± 2.4 a |
| S | 20.3 ± 0.2 b | 14.01 ± 0.36 ab | 3.07 ± 0.08 ab | 88.4 ± 1.8 b |
| Experiment 1 | |
| Treatments: | Simple batch (SB) and continuous fed batch (CF) |
| Yeast: | Saccharomyces cerevisiae, strain: C22 mycofer |
| Substrate: | Diluted sugarcane syrup |
| Cycles: | 8 cycles with increasing initial fermentable sugars: |
| 50, 100, 150, 180, 200, 240, 260, 280 g L−1 | |
| Experiment 2 | |
| Treatments (substrates): | Different substrates: Corn hydrolysate (C), corn plus sugarcane juice hydrolysate (C + S), and sugarcane juice (S) |
| Yeast: | Saccharomyces cerevisiae, strain: Thermosacc |
| Feeding System: | Fed batch for first 135 min (1 mL min−1), based on the results of experiment 1 |
Disclaimer/Publisher’s Note: The statements, opinions and data contained in all publications are solely those of the individual author(s) and contributor(s) and not of MDPI and/or the editor(s). MDPI and/or the editor(s) disclaim responsibility for any injury to people or property resulting from any ideas, methods, instructions or products referred to in the content. |
© 2023 by the authors. Licensee MDPI, Basel, Switzerland. This article is an open access article distributed under the terms and conditions of the Creative Commons Attribution (CC BY) license (https://creativecommons.org/licenses/by/4.0/).
Share and Cite
Douradinho, R.; Sica, P.; Tonoli, F.; Mattos, E.; Oliveira, M.; Pinto, A.; Mota, L.; Faria, T.; Costa, V.F.; Leite, G.; et al. Osmotic Stress Alleviation in Saccharomyces cerevisiae for High Ethanol Fermentations with Different Wort Substrates. Stresses 2023, 3, 813-826. https://doi.org/10.3390/stresses3040055
Douradinho R, Sica P, Tonoli F, Mattos E, Oliveira M, Pinto A, Mota L, Faria T, Costa VF, Leite G, et al. Osmotic Stress Alleviation in Saccharomyces cerevisiae for High Ethanol Fermentations with Different Wort Substrates. Stresses. 2023; 3(4):813-826. https://doi.org/10.3390/stresses3040055
Chicago/Turabian StyleDouradinho, Rafael, Pietro Sica, Fernando Tonoli, Eduardo Mattos, Matheus Oliveira, Alana Pinto, Layna Mota, Tamires Faria, Vitória Franco Costa, Gabriela Leite, and et al. 2023. "Osmotic Stress Alleviation in Saccharomyces cerevisiae for High Ethanol Fermentations with Different Wort Substrates" Stresses 3, no. 4: 813-826. https://doi.org/10.3390/stresses3040055