An Anchoring Capacity Study Focused on a Wheel’s Curvature Geometry for an Autonomous Underwater Vehicle with a Traveling Function during Contact with Loose Ground Containing Water

Abstract
:
1. Introduction
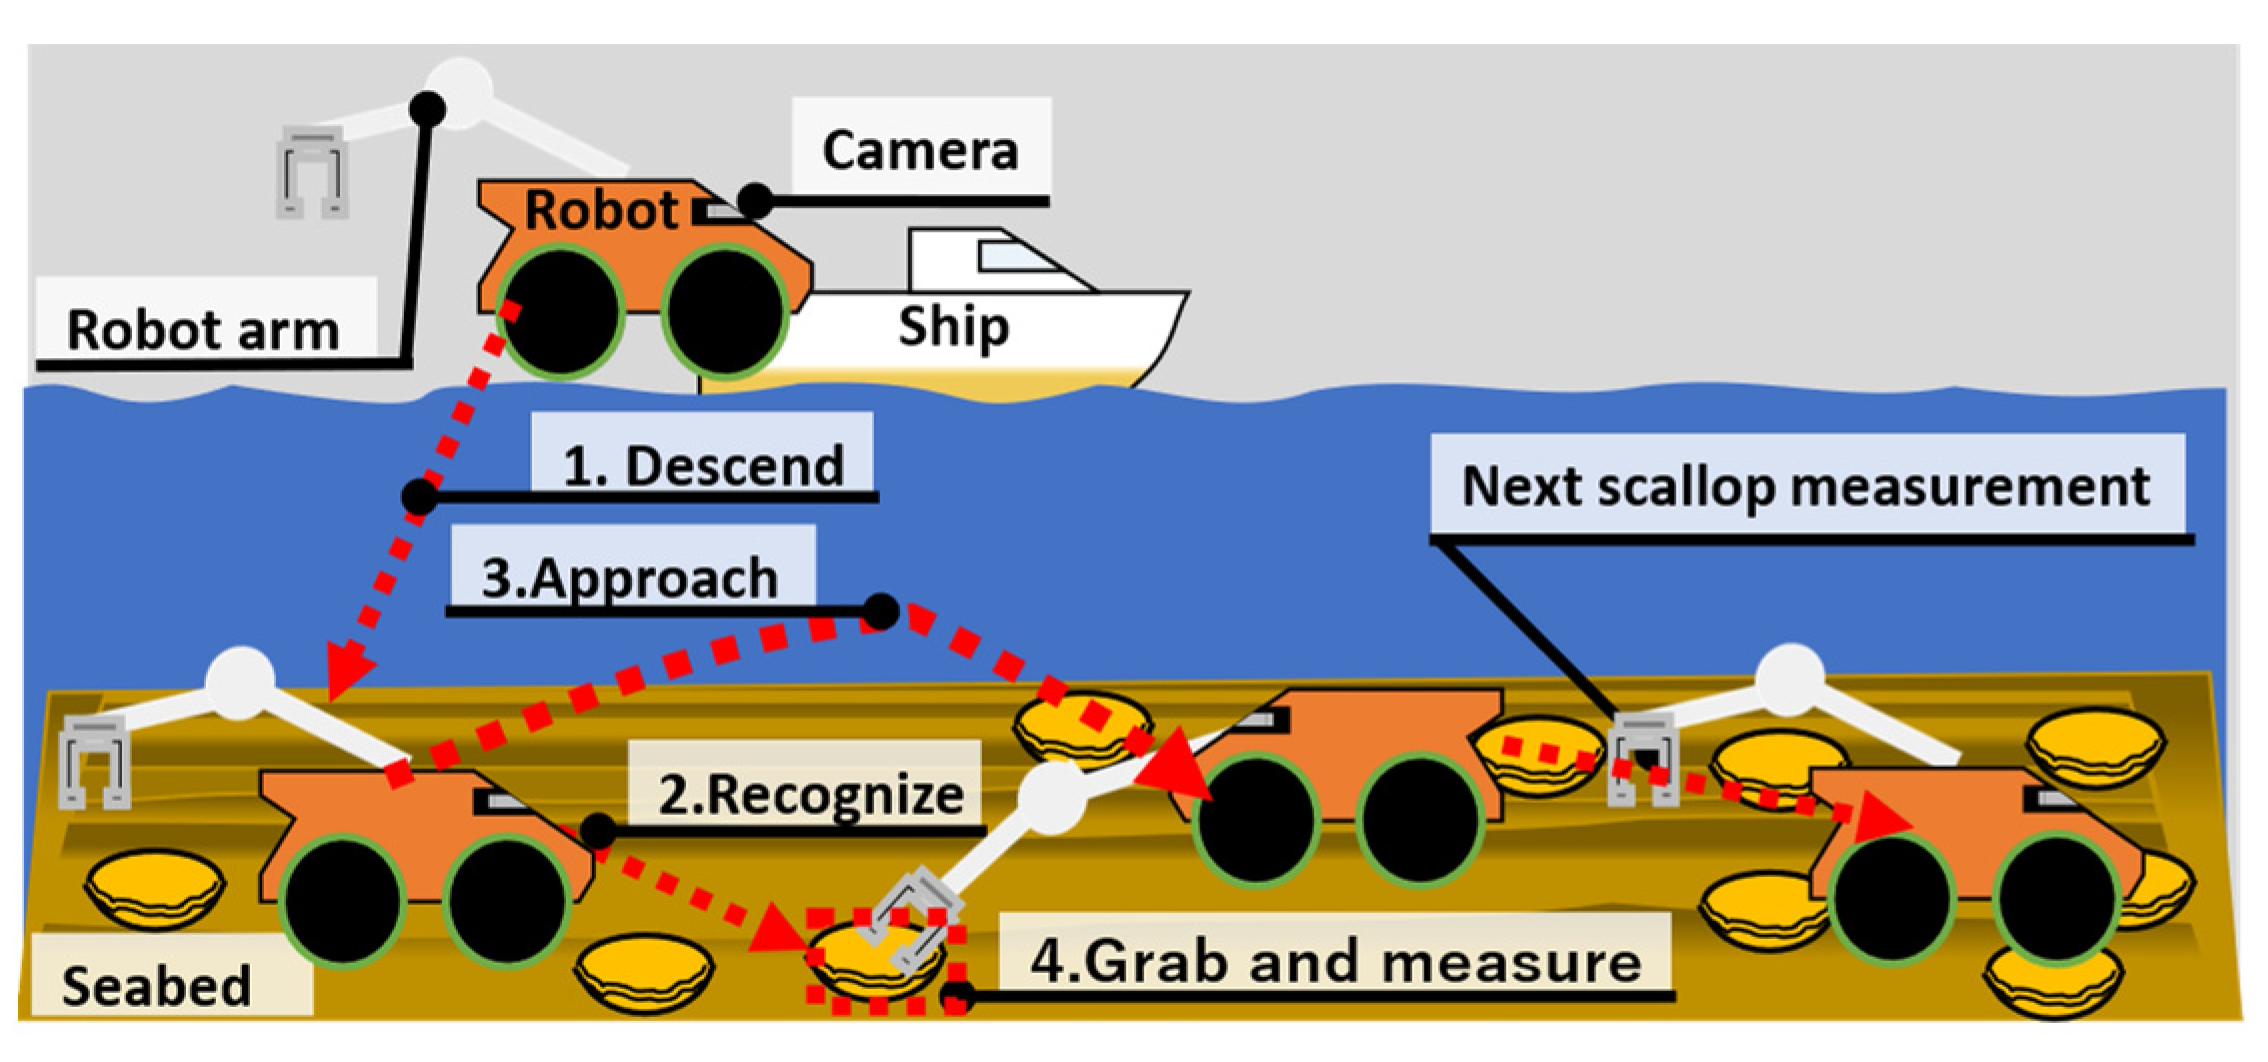
- First, lower the robot with a robotic arm and camera from the ship.
- Second, use the robot’s camera to recognize scallops.
- Third, navigate the robot to the location of the scallop until the robot arm reaches the scallop.
- Fourth, instruct the robot to seize the scallop and measure its physical quantity.
- Fifth, instruct the robot to release the scallop and begin to recognize other scallops.

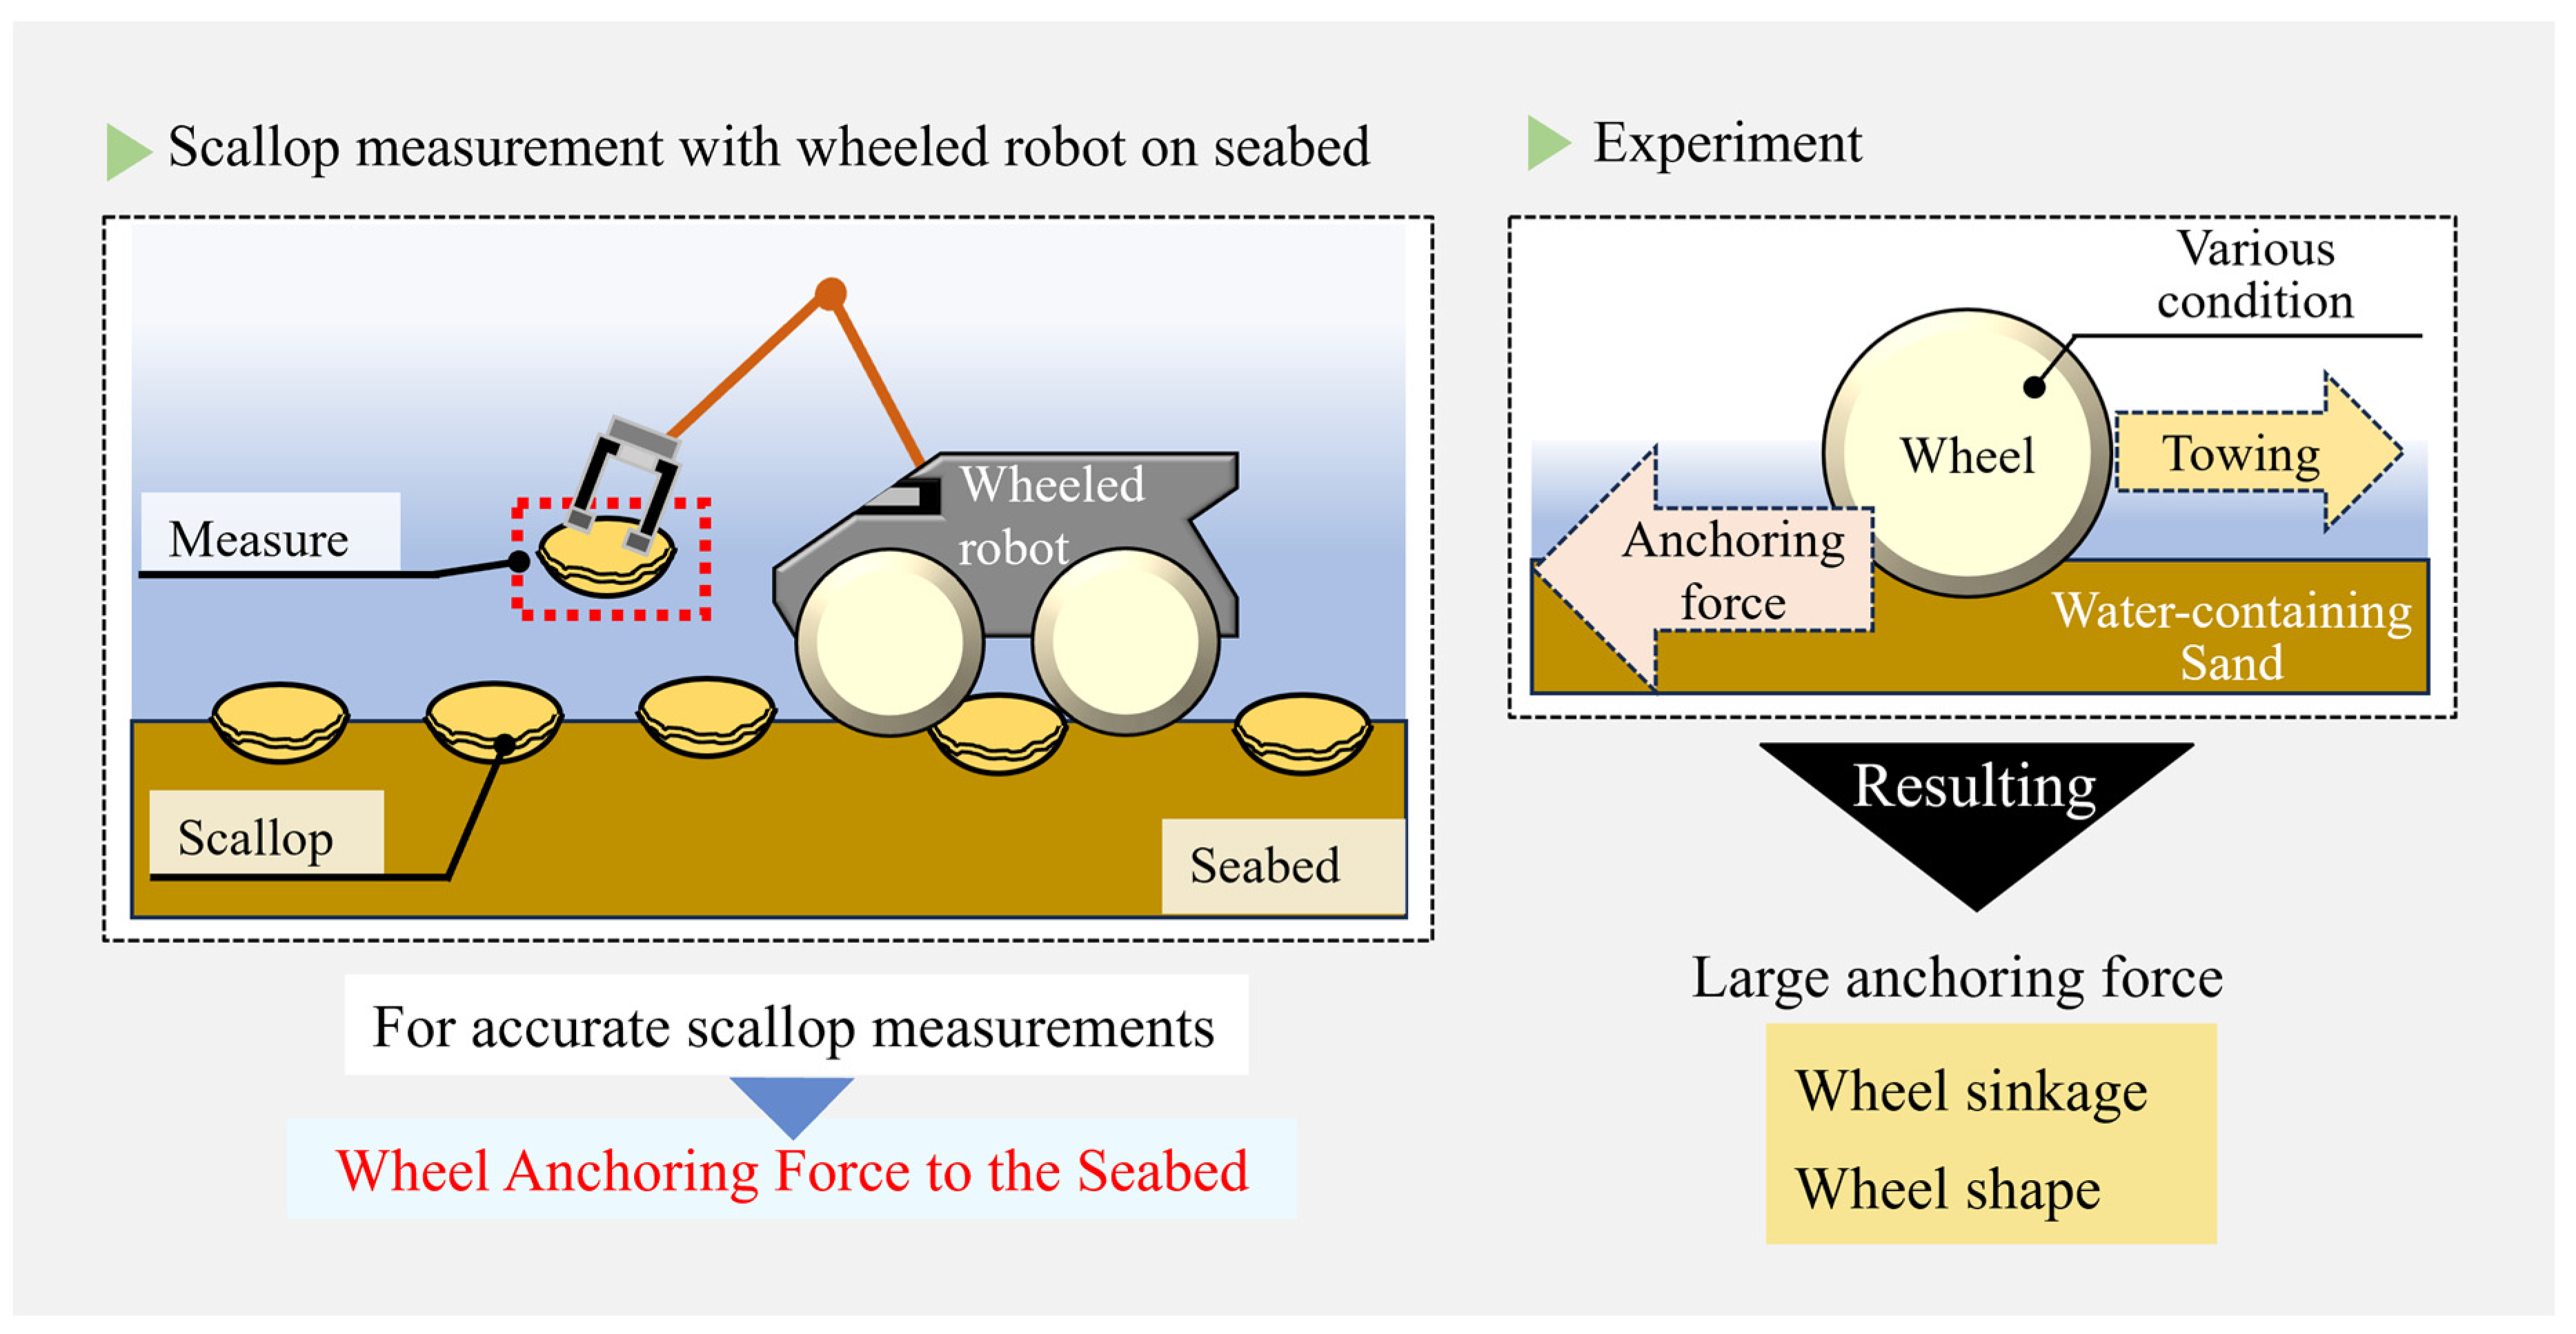
2. Problems of Scallop Measurement with Wheeled Robots on the Seabed
3. Experiments to Confirm the Effect of Water on Wheel Anchoring Capacity
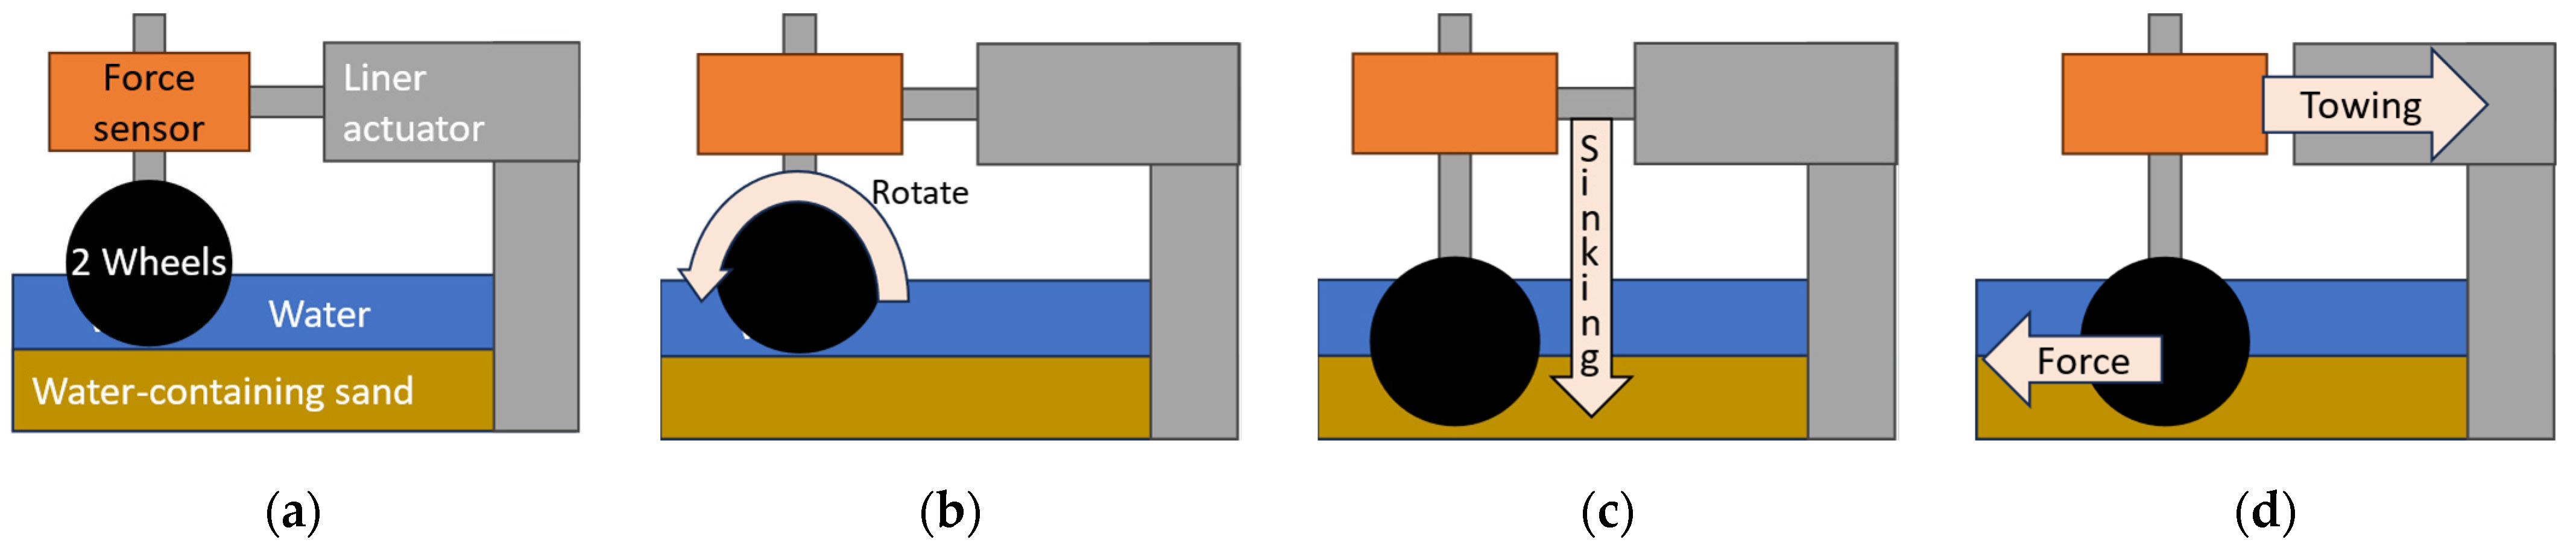
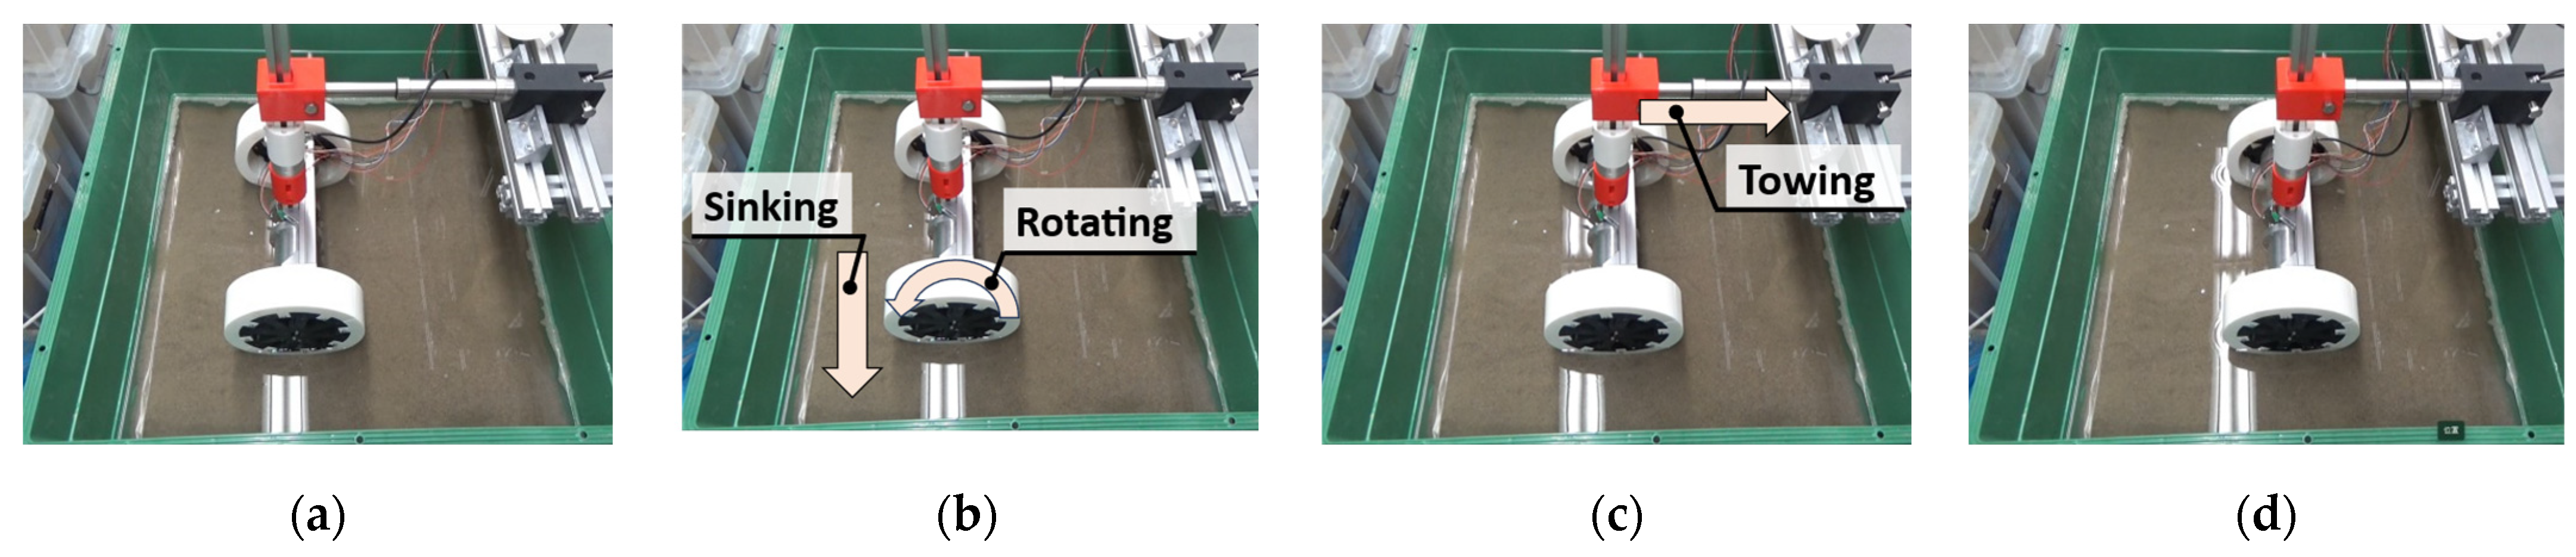
3.1. Experimental Procedure
- First, carefully set the wheels on the water-containing sand (Figure 4a). The sinkage at this time must be set to 0 mm (static sinkage). When the wheels are on the soil, they sink into the soil due to their weight. This form of sinkage is defined as static sinkage.
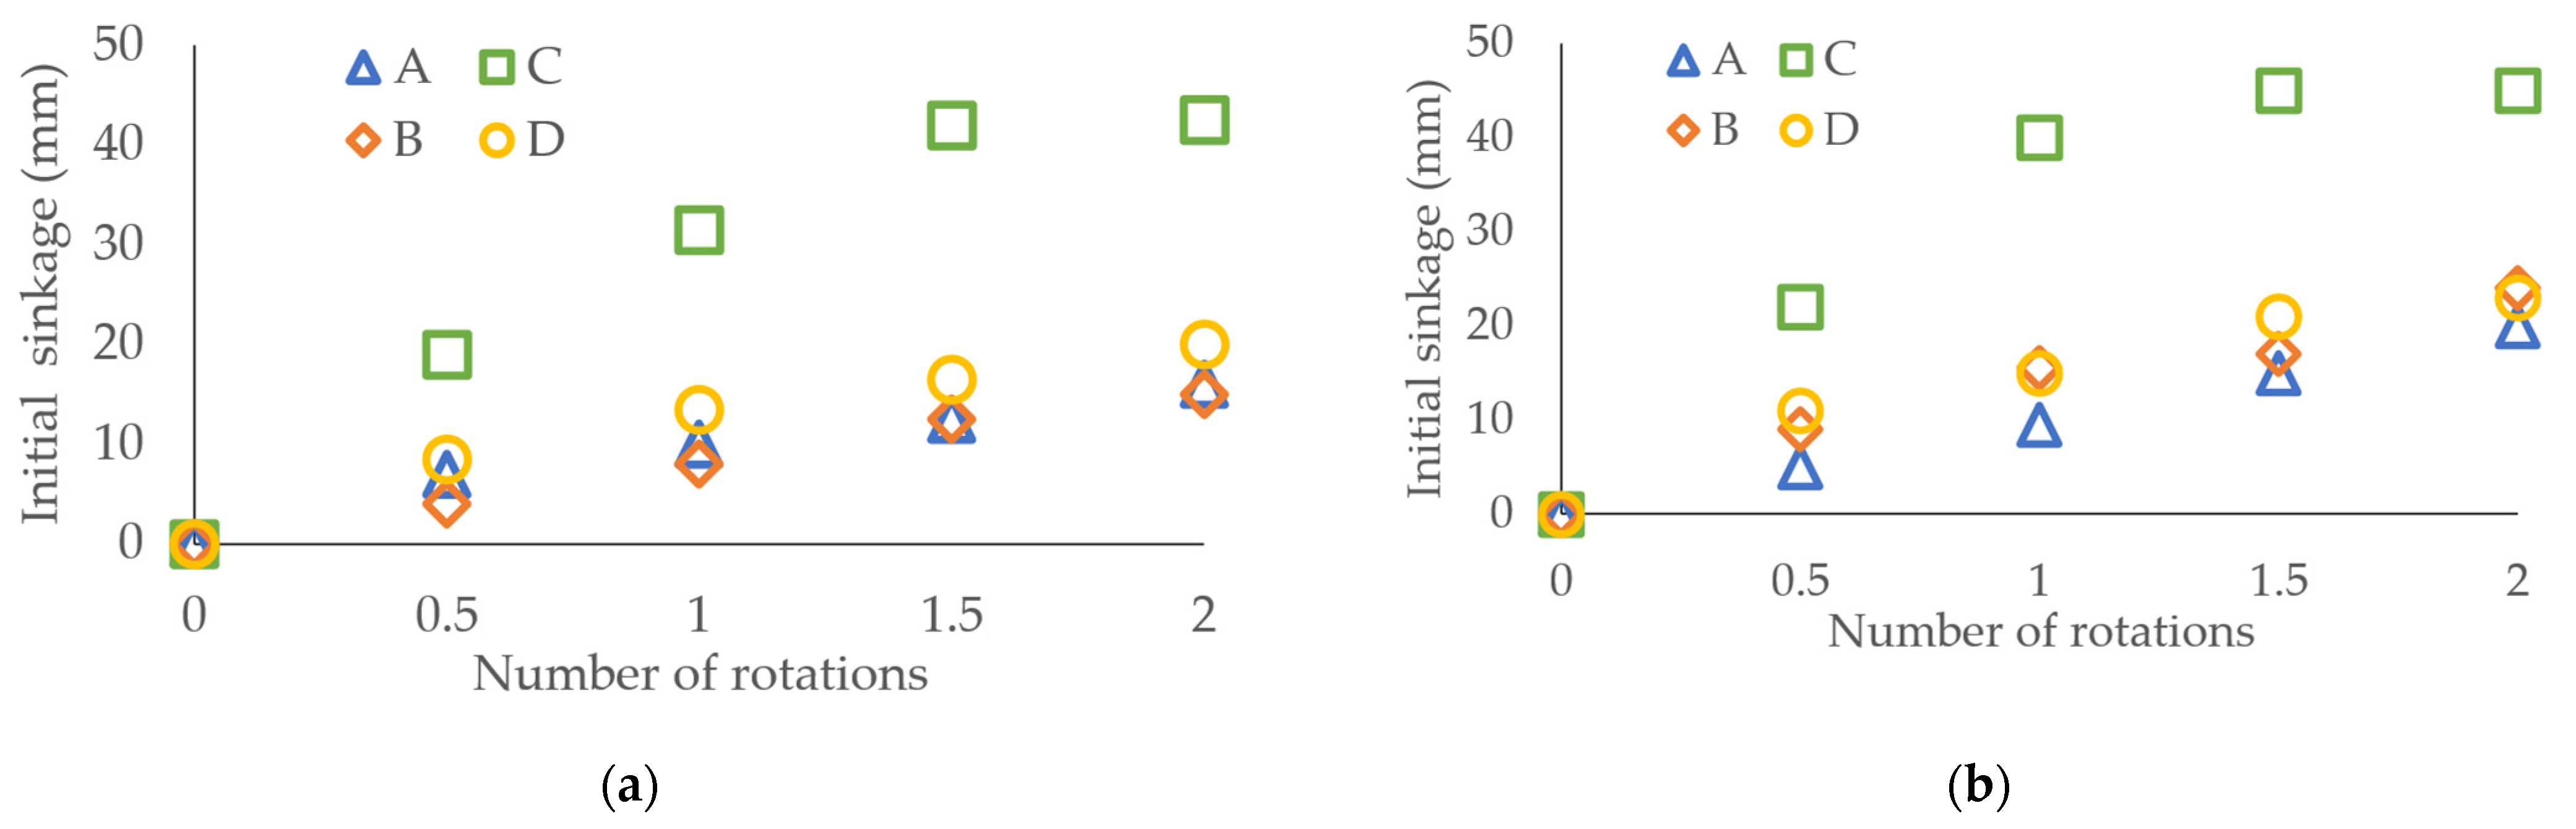
- Second, rotate the wheels (number of rotations: 0, 0.5, 1, 1.5, or 2) to increase the degree of sinkage (Figure 4b,c).
- Third, measure the degree of sinkage. The measured sinkage degree is taken as the initial sinkage.
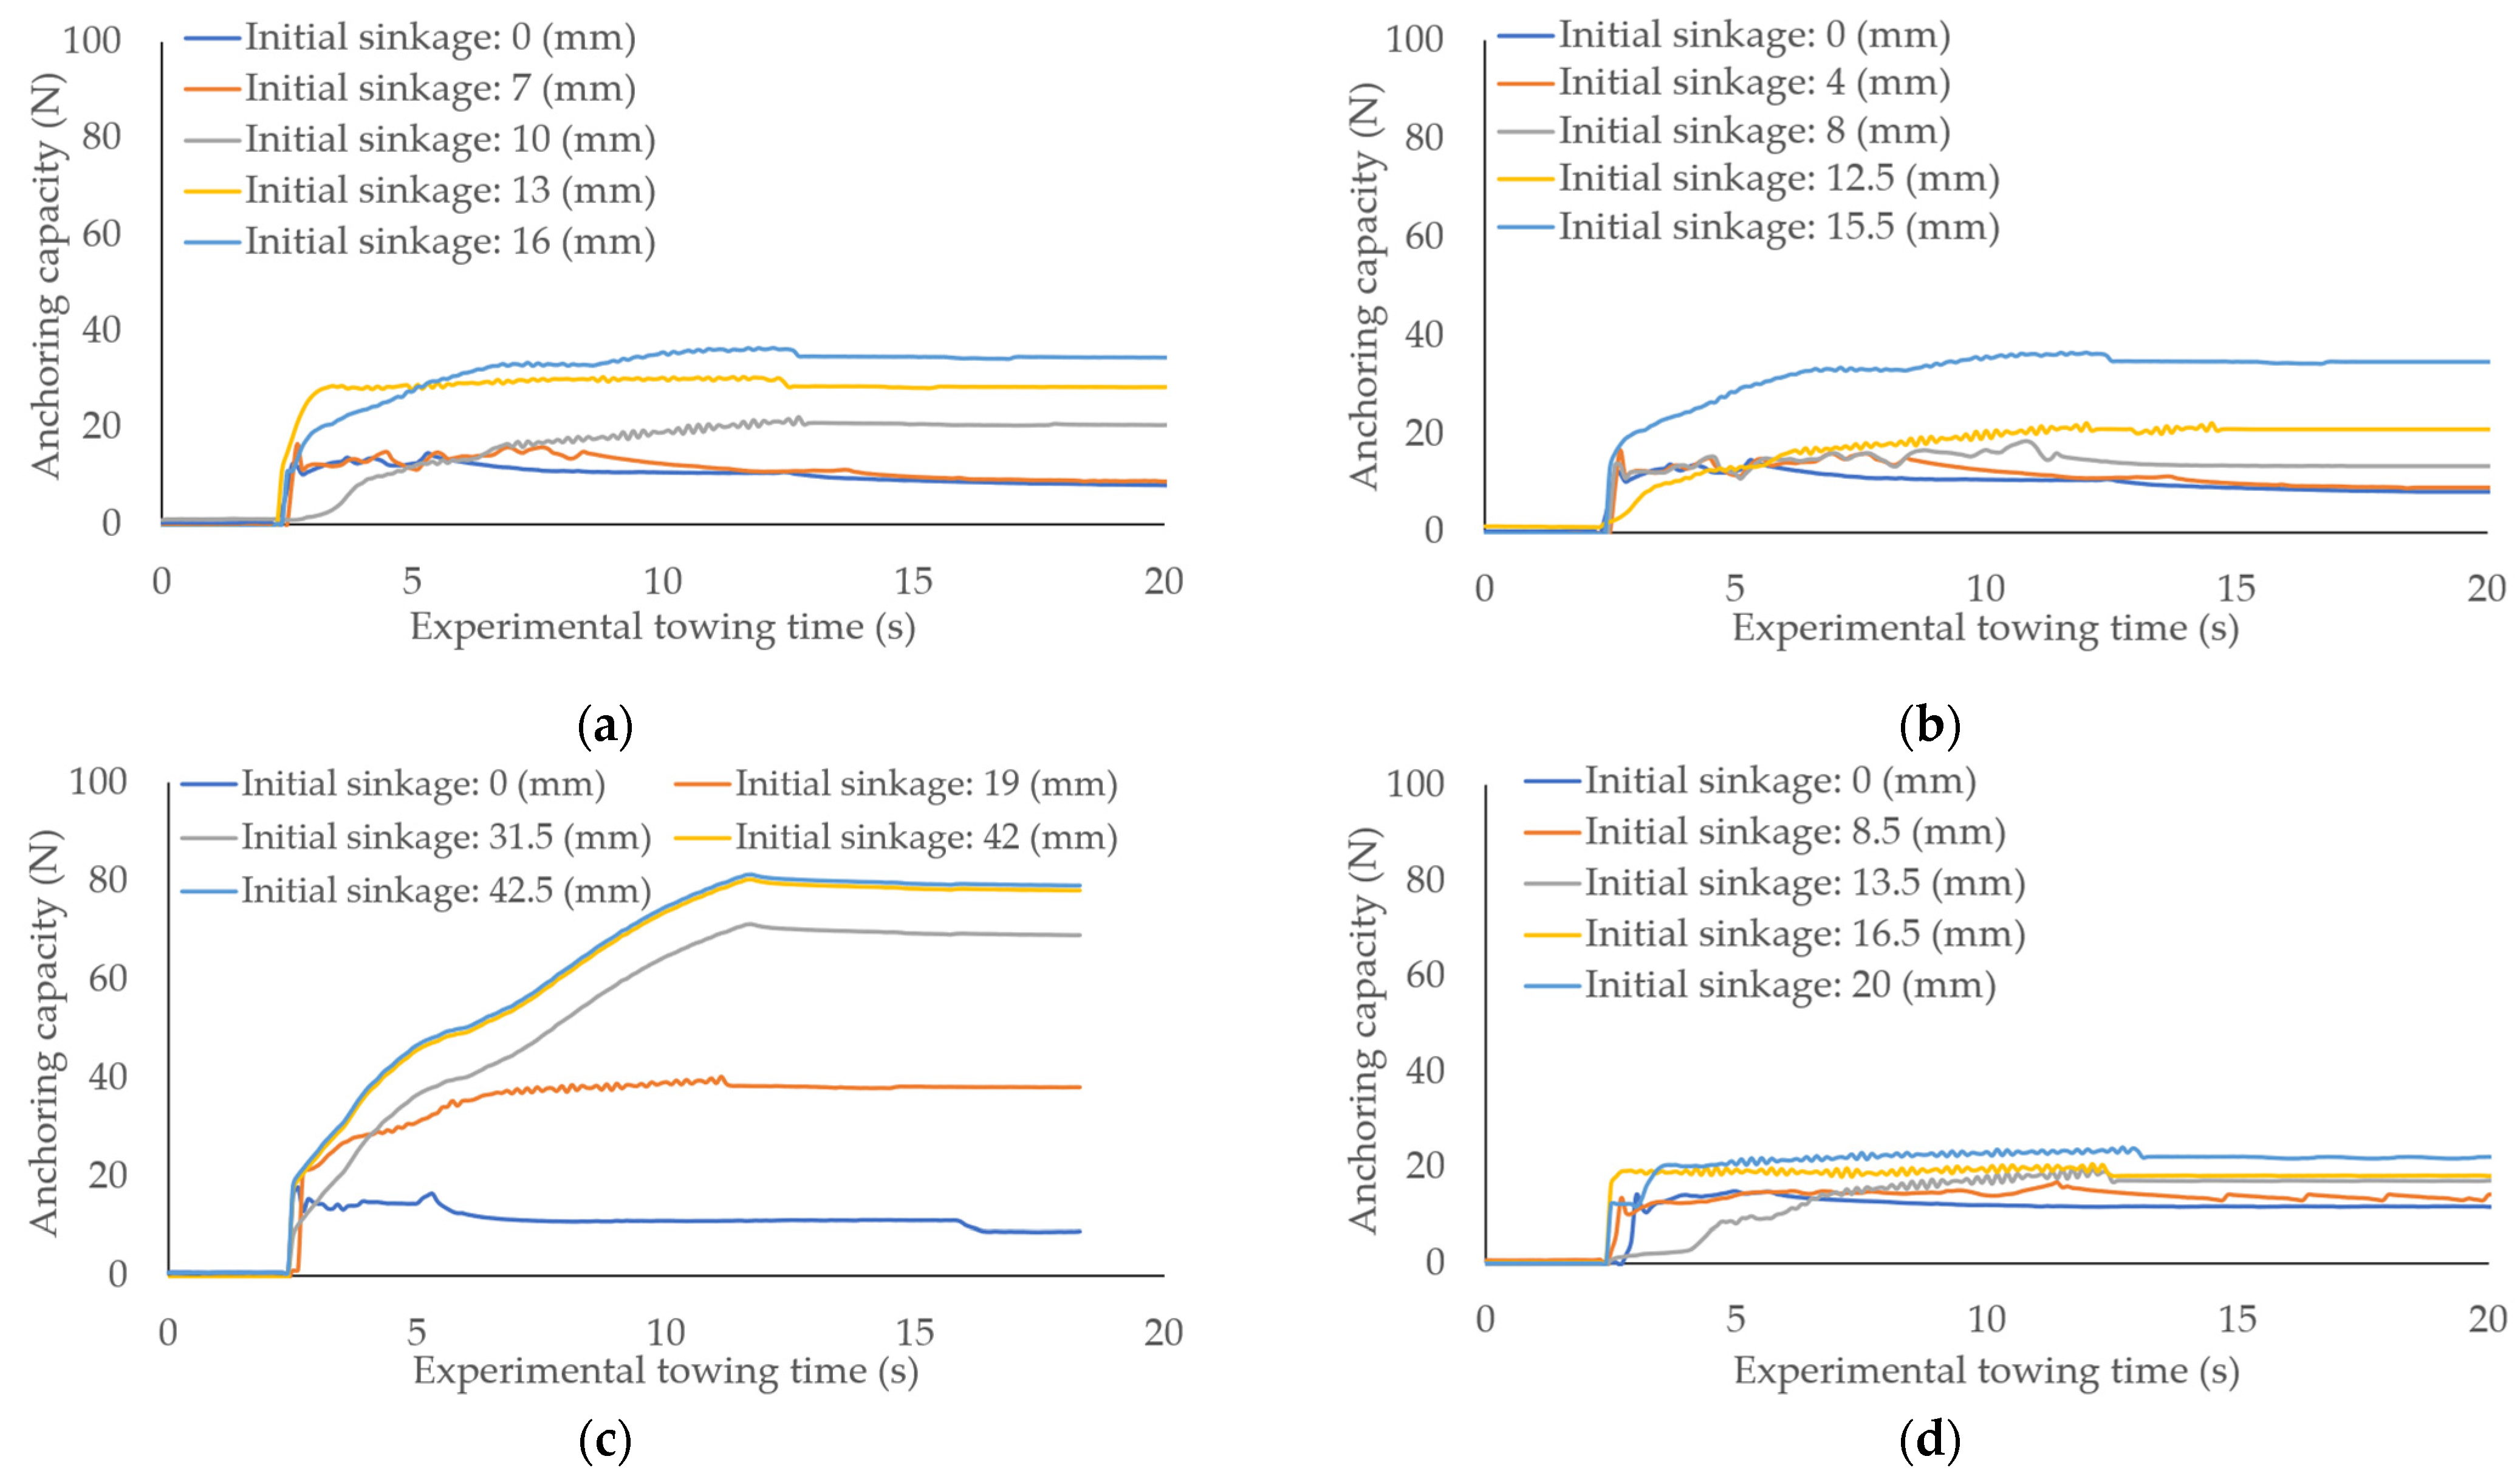
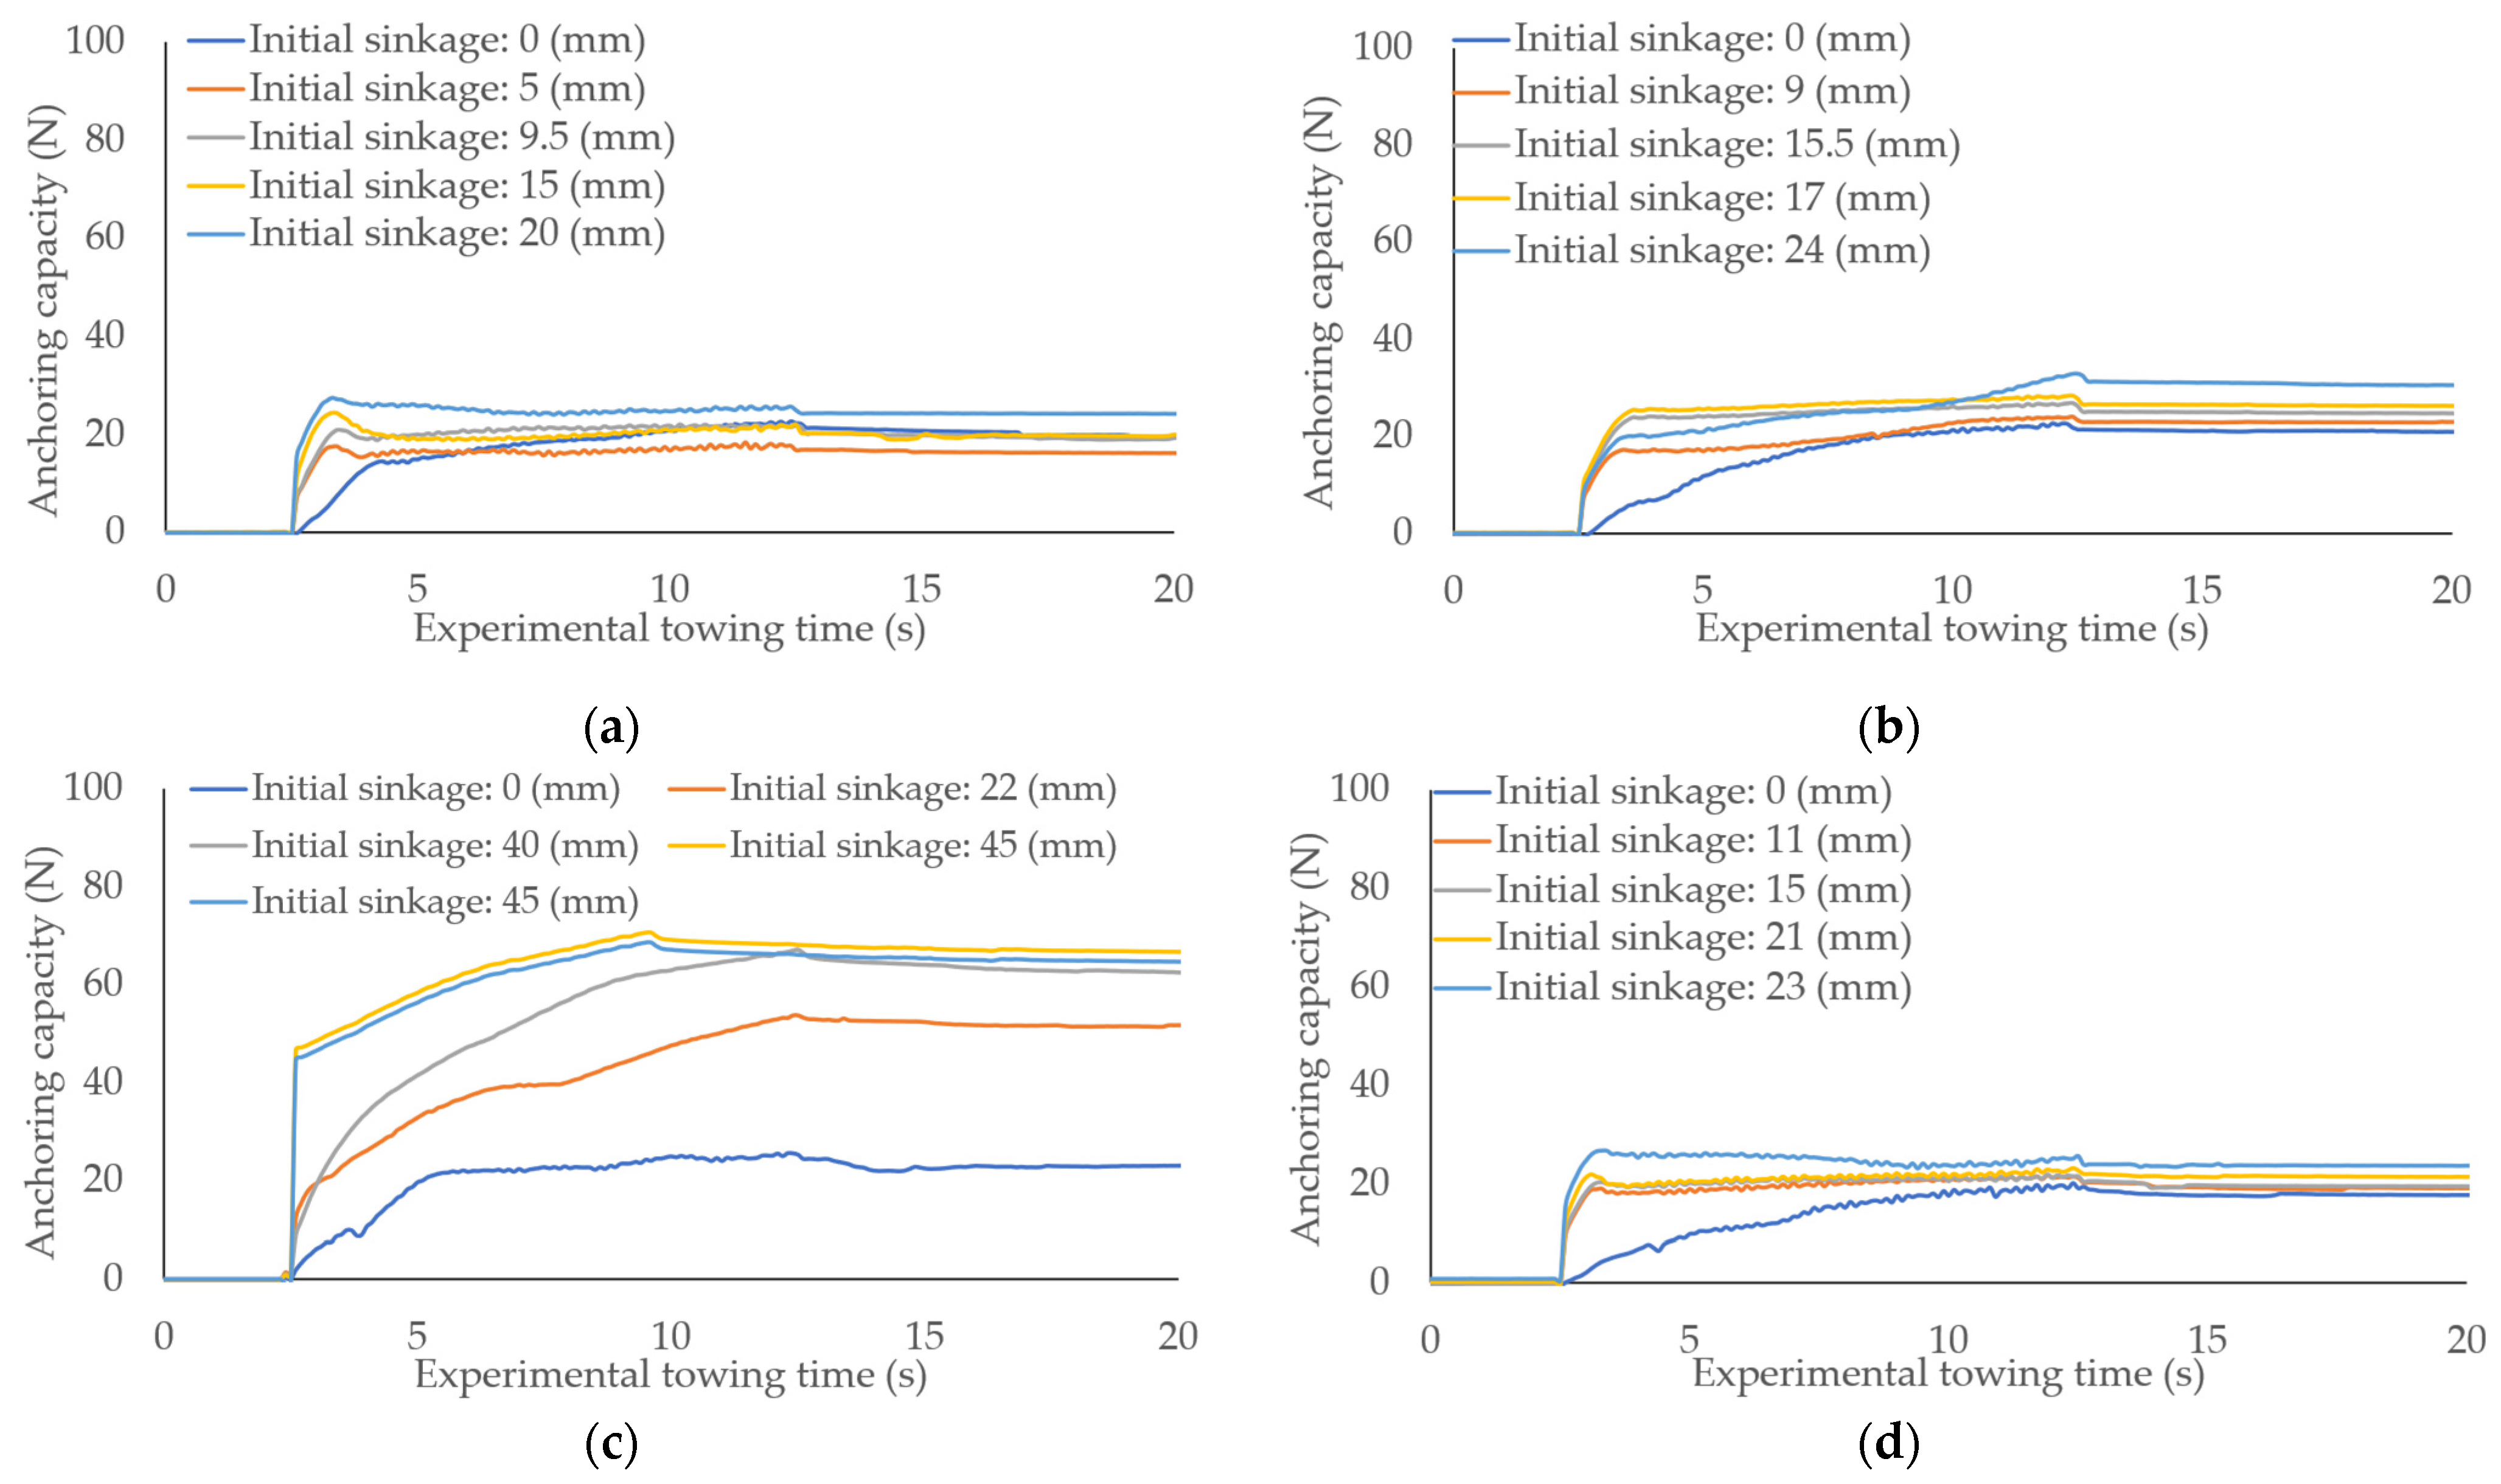
- Fourth, the linear actuator tows the wheel unit, and the force sensor measures the resistance force acting on the wheel (Figure 4d).
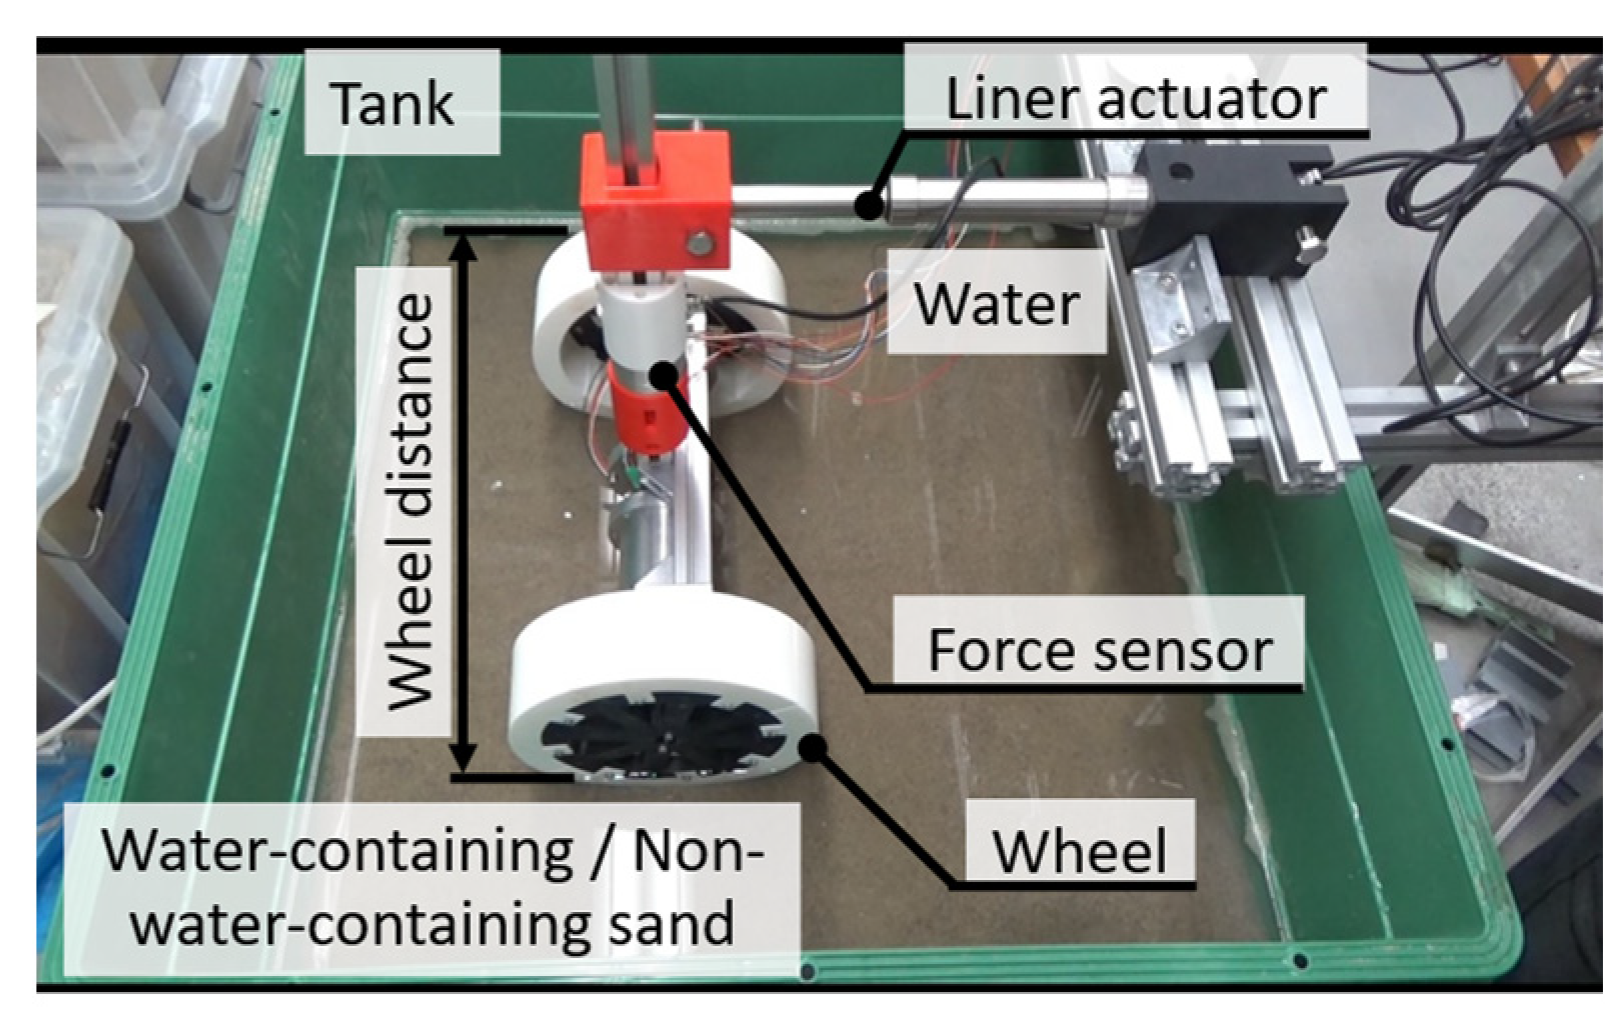
3.2. Experimental Conditions and Environment
3.3. Experimental Results and Considerations
4. Conclusions
- The anchoring capacity of the same wheel at the same sinkage level tends to be lower on water-containing sand. This fact suggests that water weakens the ground strength, and the wheeled robot’s ability to maintain its posture on water-containing sand decreases.
- An increase in the sinkage level is effective at increasing the anchoring capacity of the wheel even underwater. The greater the degree of initial sinkage, the greater the anchoring capacity, even on water-containing sand.
- The wheel shape affects the wheel’s anchoring capacity in water. Wheeled robots require appropriate wheel shapes for high posture maintenance performance and mobility efficiency.
Author Contributions
Funding
Data Availability Statement
Conflicts of Interest
References
- Enomoto, K.; Toda, M.; Kuwahara, Y. Detection Method of Scallop and Asteroid from Seabed Video. In Proceedings of the IAPR International Conference on Machine Vision Applications, Kyoto, Japan, 20–23 May 2013. [Google Scholar]
- Enomoto, K.; Toda, M.; Kuwahara, Y. Extraction Method of Scallop Area in Gravel Seabed Images for Fishery Investigation. Inst. Electron. Inf. Commun. Eng. 2010, 93, 1754–1760. [Google Scholar] [CrossRef]
- Enomoto, K.; Toda, M.; Kuwahara, Y. Extraction Method of Scallop Areas Using Shelly Rim Features Considering Bottom Sediment of Sand. In Proceedings of the IAPR Conference on Machine Vision Applications, Nara, Japan, 13–15 June 2011. [Google Scholar]
- Enomoto, K.; Toda, M.; Shimizu, Y.; Kuwahara, Y. Fluorescent Staining for Detecting Larvae of Japanese Scallops Mizuhopecten Yessoenics. Trans. Inst. Syst. Control Inf. Eng. 2018, 31, 419–427. [Google Scholar]
- Enomoto, K.; Toda, M.; Kuwahara, Y. Extraction Method of Scallop Area in Sand Seabed Images. Inst. Electron. Inf. Commun. Eng. 2014, 97, 130–138. [Google Scholar] [CrossRef]
- Enomoto, K.; Toda, M.; Kuwahara, Y.; Masaki, W.; Hatanaka, K. Scallop Detection from Gravel-Seabed Images for Fishery Investigation. In Proceedings of the IAPR International Conference on Machine Vision Applications, Yokohama, Japan, 20–23 May 2009.
- Pandian, R.S.; Sakagami, N. Extraction, System Integration Aspects of Underwater Vehicle-Manipulator Systems for Oceanic Exploration. Meas. Control 2008, 47, 830–836. [Google Scholar]
- Weerakoon, T.; Sonoda, T.; Nassiraei, F.A.A.; Godler, I.; Ishii, K. Underwater Manipulator for Sampling Mission with AUV in Deep-Sea. In Proceedings of the JSME Conference on Robotics and Mechatronics, Fukuoka, Japan, 10–13 May 2017. [Google Scholar]
- Zheng, X.; Tian, Q.; Zhang, Q. Development and Control of an Innovative Underwater Vehicle Manipulator System. J. Mar. Sci. Eng. 2023, 11, 548. [Google Scholar] [CrossRef]
- Ofuchi, A.; Iizuka, K.; Fujiwara, D.; Enomoto, K.; Toda, M.; Kuwahara, Y.; Miyoshi, K. Proposal of gripper for scallop harvesting using underwater negative pressure. J. Jpn. Soc. Des. Eng. 2021, 56, 449–464. [Google Scholar] [CrossRef]
- Ofuchi, A.; Iizuka, K.; Fujiwara, D. Study on the Applicability Considering on the Relationship between Shape and Flexibility of the Adsorption Gripper Tip. In Proceedings of the 2022 7th International Conference on Control and Robotics Engineering (ICCRE), Beijing, Chaina, 15–17 April 2022. [Google Scholar]
- Nagashima, Y.; Taguchi, N.; Ishimatsu, T. Development of a Compact Hybrid Underwater Vehicle Using Variable Vector Propeller. In Proceedings of the ISARC International Symposium on Automation and Robotics in Construction, Tokyo, Japan, 3–5 October 2006. [Google Scholar]
- Itoh, R.; Okazaki, T. Development of an Underwater Robot for Detecting Shallow Water in a Port. J. Robot. Mechatron. 2020, 34, 64–71. [Google Scholar] [CrossRef]
- Naruse, T. Development of Bottom-Reliant Type Underwater Robots. J. Robot. Mechatron. 2014, 26, 279–286. [Google Scholar] [CrossRef]
- Xia, M.; Lu, H.; Yang, J.; Sun, P. Multi-Body Dynamics Modeling and Straight-Line Travel Simulation of a Four-Tracked Deep-Sea Mining Vehicle on Flat Ground. J. Mar. Sci. Eng. 2023, 5, 1005. [Google Scholar] [CrossRef]
- Picardi, G.; Chellapurath, M.; Iacoponi, S.; Stefanni, S.; Laschi, C.; Calisti, M. Bioinspired underwater legged robot for seabed exploration with low environmental disturbance. Sci. Robot. 2020, 11, eaaz1012. [Google Scholar] [CrossRef] [PubMed]
- Guan, H.; Luo, T.; Lian, W.; Lei, Y. Design of Adsorption Track Wheel for Underwater Wall-climbing Robot. In Proceedings of the 2022 6th International Conference on Robotics and Automation Sciences (ICRAS), Wuhan, China, 9–11 June 2022; IEEE: Piscataway, NJ, USA, 2022. [Google Scholar]
- Picardi, G.; Astolfi, A.; Chatzievangelou1, D.; Aguzzi, J.; Calisti, M. Underwater legged robotics: Review and perspectives. Bioinspir. Biomim. 2023, 18, 031001. [Google Scholar] [CrossRef] [PubMed]
- Surveyor Amphibious Surface Inspection and Load Delivery Robot. Available online: https://www.newtonlabs.com/robot_surveyor.html (accessed on 18 January 2024).
- Aquatic Rover Goes for a Drive under the Ice. Available online: https://www.jpl.nasa.gov/news/aquatic-rover-goes-for-a-drive-under-the-ice (accessed on 18 January 2024).
- Boh, T.; Billingsley, J.; Bradbeer, R.S.; Hodson, P. Terramechanics based traction control of underwater wheeled robot. In Proceedings of the OCEANS’10, Sydney, Australia, 24–27 May 2010; IEEE: Piscataway, NJ, USA, 2010. [Google Scholar]
- Ofuchi, A.; Iizuka, K.; Fujiwara, D. Fundamental Experiment on Mobility of Wheeled Underwater Mobile Robot on Water-containing Sand. In Proceedings of the JSME Conference on Robotics and Mechatronics, Nagoya, Japan, 22–25 May 2013. [Google Scholar]
- Bouri, D.; Krim, A.; Brahim, A.; Arab, A. Shear strength of compacted Chlef sand: Effect of water content, fines content and others parameters. Stud. Geotech. Mech. 2020, 42, 18–35. [Google Scholar] [CrossRef]
- Lanzerstorfer, C. The water content of sand required for the maximum strength for building sand castles. Carpathian J. Earth Environ. Sci. 2019, 14, 61–66. [Google Scholar] [CrossRef]
- Khen, S.F.; Azam, S.; Raghunandan, M.E.; Clark, R. Compressive Strength of Compacted Clay-Sand Mixes. Adv. Mater. Sci. Eng. 2014, 2014, 921815. [Google Scholar] [CrossRef]
- Fujiwara, D.; Oshima, T.; Iizuka, K. Measuring the Normal Stress Distribution Acting on a Locked-Wheel of Push–Pull Locomotion Rovers via a Wheel Sensor System. Sensor 2020, 20, 4434. [Google Scholar] [CrossRef] [PubMed]
- Wong, J.Y. Mechanics of vehicle-terrain interactionterramechanics. In Theory of Ground Vehicles, 2nd ed.; Mech, E., Editor, B., II, Eds.; John Wiley & Sons: Hoboken, NJ, USA, 2007; Volume 3, pp. 100–146. [Google Scholar]
- Beeker, M.G. Mechanics of Off-the-Road Locomotion. Proc. Inst. Mech. Eng. Automob 1962, 16, 22–44. [Google Scholar] [CrossRef]


| Name | Model | Role | |
|---|---|---|---|
| Liner actuator | Concens A/S Linear actuator con35(con350100–141220+449900) | Wheel towing | |
| Force sensor | PFS055YA251U6 | Measuring anchoring capacity | |
| Name | Parameter | Numerical value | |
| Testing machine unit | Mass of testing machine (kg) | 6.4 | |
| Wheel distance (mm) | 450 | ||
| Tank | Width (mm) | 847 | |
| Length (mm) | 847 | ||
| Height (mm) | 341 | ||
| Water | Type | Freshwater | |
| Depth (mm) | 80 | ||
| Sand | Type | Silica sand No. 5 | |
| Depth (mm) | 50 | ||
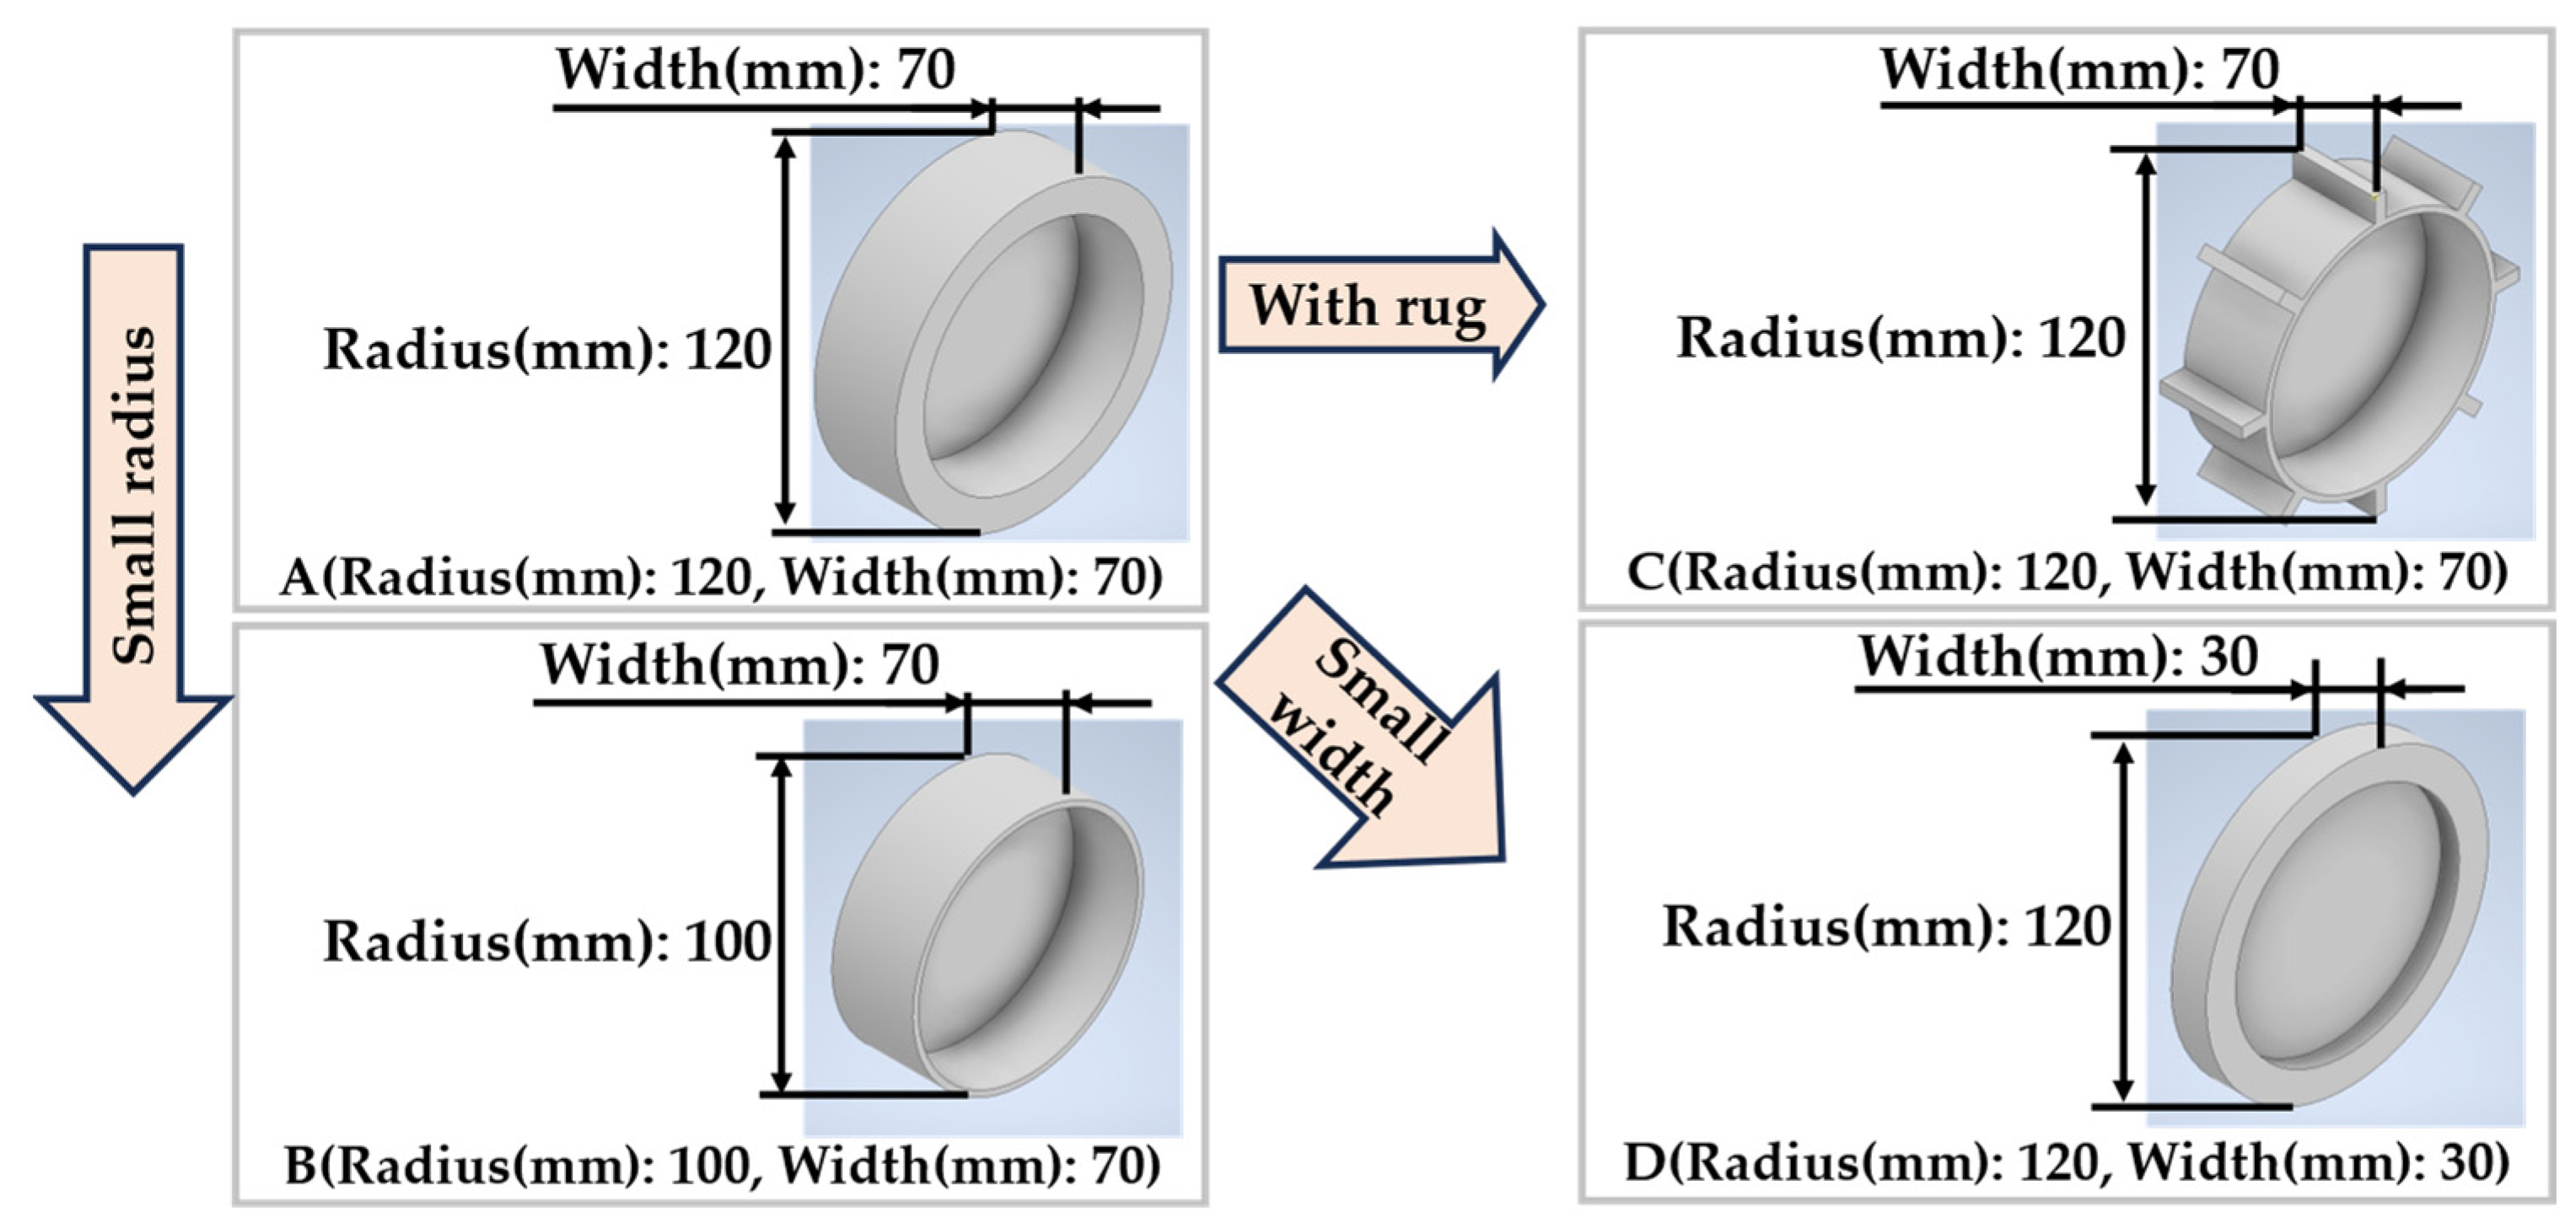
| Wheeled type | Radius (mm) | Width (mm) | Length of lug (mm) |
| A | 120 | 70 | 0 |
| B | 100 | 70 | 0 |
| C | 120 | 70 | 20 |
| D | 120 | 30 | 0 |
| Wheel Type | Sand State | Number of Rotations | Initial Sinkage (mm) | Maximum Anchoring Capacity (N) |
|---|---|---|---|---|
| A (Base wheel) | Non-water-containing sand | 0 | 0 (static sinkage) | 14.7 |
| 0.5 | 7 | 16.7 | ||
| 1 | 10 | 22.2 | ||
| 1.5 | 13 | 30.6 | ||
| 2 | 16 | 36.6 | ||
| Water-containing sand | 0 | 0 | 22.7 | |
| 0.5 | 5 | 18.4 | ||
| 1 | 9.5 | 22.0 | ||
| 1.5 | 15 | 24.4 | ||
| 2 | 20 | 27.5 | ||
| B (Small radius) | Non-water-containing sand | 0 | 0 (static sinkage) | 14.8 |
| 0.5 | 4 | 16.9 | ||
| 1 | 8 | 18.6 | ||
| 1.5 | 12.5 | 22.2 | ||
| 2 | 15.5 | 36.6 | ||
| Water-containing sand | 0 | 0 | 22.7 | |
| 0.5 | 9 | 24.1 | ||
| 1 | 15.5 | 26.9 | ||
| 1.5 | 17 | 28.4 | ||
| 2 | 24 | 32.9 | ||
| C (With lugs) | Non-water-containing sand | 0 | 0 (static sinkage) | 17.8 |
| 0.5 | 19 | 20.3 | ||
| 1 | 31.5 | 71.3 | ||
| 1.5 | 42 | 80.3 | ||
| 2 | 42.5 | 81.3 | ||
| Water-containing sand | 0 | 0 | 25.6 | |
| 0.5 | 22 | 53.7 | ||
| 1 | 40 | 67.2 | ||
| 1.5 | 45 | 70.7 | ||
| 2 | 45 | 68.7 | ||
| D (Small width) | Non-water-containing sand | 0 | 0 (static sinkage) | 15.0 |
| 0.5 | 8.5 | 16.8 | ||
| 1 | 13.5 | 19.8 | ||
| 1.5 | 16.5 | 20.8 | ||
| 2 | 20 | 24.2 | ||
| Water-containing sand | 0 | 0 | 20.2 | |
| 0.5 | 11 | 21.7 | ||
| 1 | 15 | 21.9 | ||
| 1.5 | 21 | 23.2 | ||
| 2 | 23 | 26.8 |
Disclaimer/Publisher’s Note: The statements, opinions and data contained in all publications are solely those of the individual author(s) and contributor(s) and not of MDPI and/or the editor(s). MDPI and/or the editor(s) disclaim responsibility for any injury to people or property resulting from any ideas, methods, instructions or products referred to in the content. |
© 2024 by the authors. Licensee MDPI, Basel, Switzerland. This article is an open access article distributed under the terms and conditions of the Creative Commons Attribution (CC BY) license (https://creativecommons.org/licenses/by/4.0/).
Share and Cite
Ofuchi, A.; Fujiwara, D.; Iizuka, K. An Anchoring Capacity Study Focused on a Wheel’s Curvature Geometry for an Autonomous Underwater Vehicle with a Traveling Function during Contact with Loose Ground Containing Water. Geotechnics 2024, 4, 350-361. https://doi.org/10.3390/geotechnics4020019
Ofuchi A, Fujiwara D, Iizuka K. An Anchoring Capacity Study Focused on a Wheel’s Curvature Geometry for an Autonomous Underwater Vehicle with a Traveling Function during Contact with Loose Ground Containing Water. Geotechnics. 2024; 4(2):350-361. https://doi.org/10.3390/geotechnics4020019
Chicago/Turabian StyleOfuchi, Akira, Daisuke Fujiwara, and Kojiro Iizuka. 2024. "An Anchoring Capacity Study Focused on a Wheel’s Curvature Geometry for an Autonomous Underwater Vehicle with a Traveling Function during Contact with Loose Ground Containing Water" Geotechnics 4, no. 2: 350-361. https://doi.org/10.3390/geotechnics4020019