
Impact of Gap-Graded Soil Geometrical Characteristics on Soil Response to Suffusion
Abstract
:1. Introduction
2. Methodology
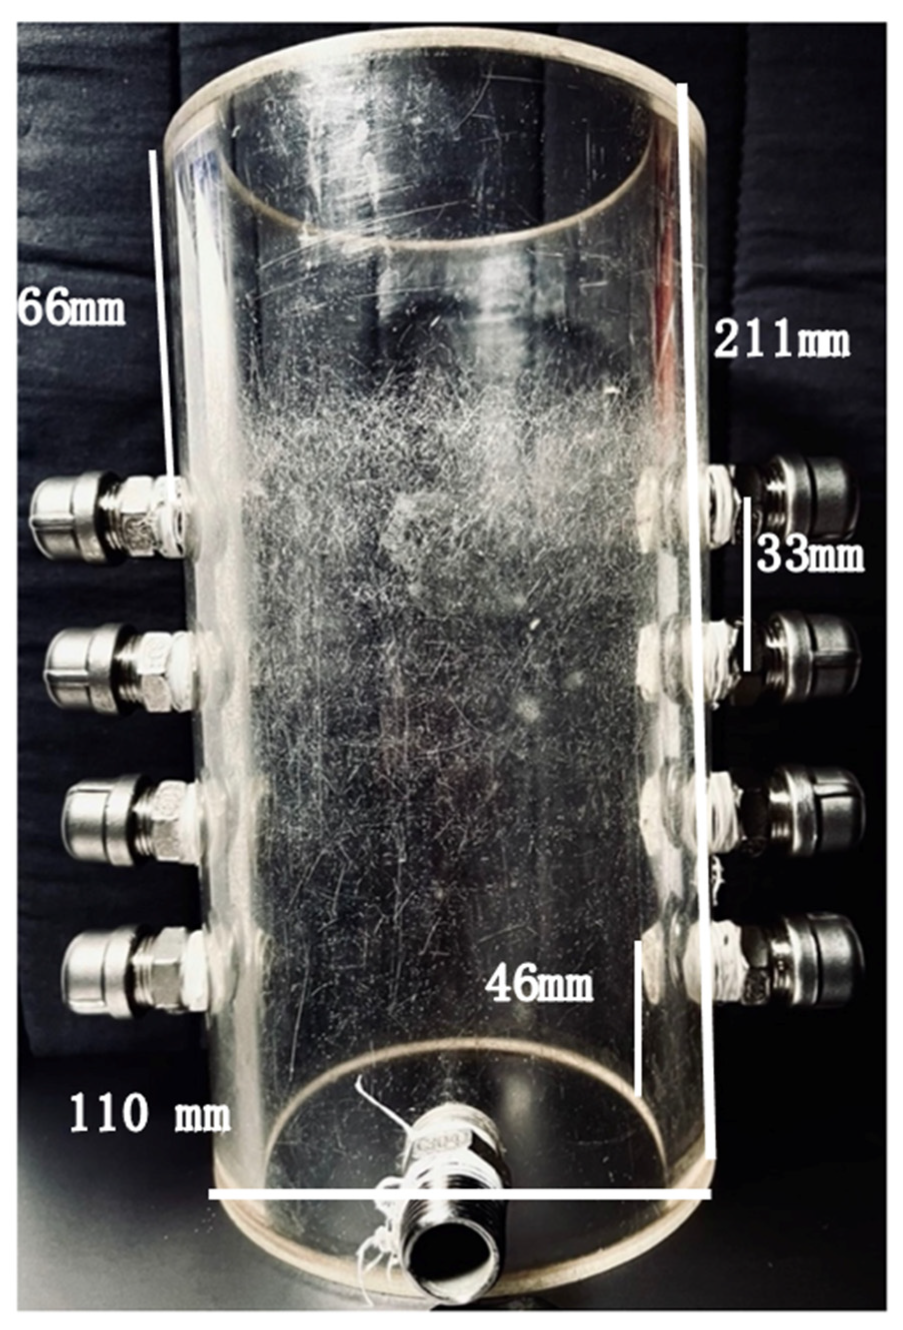
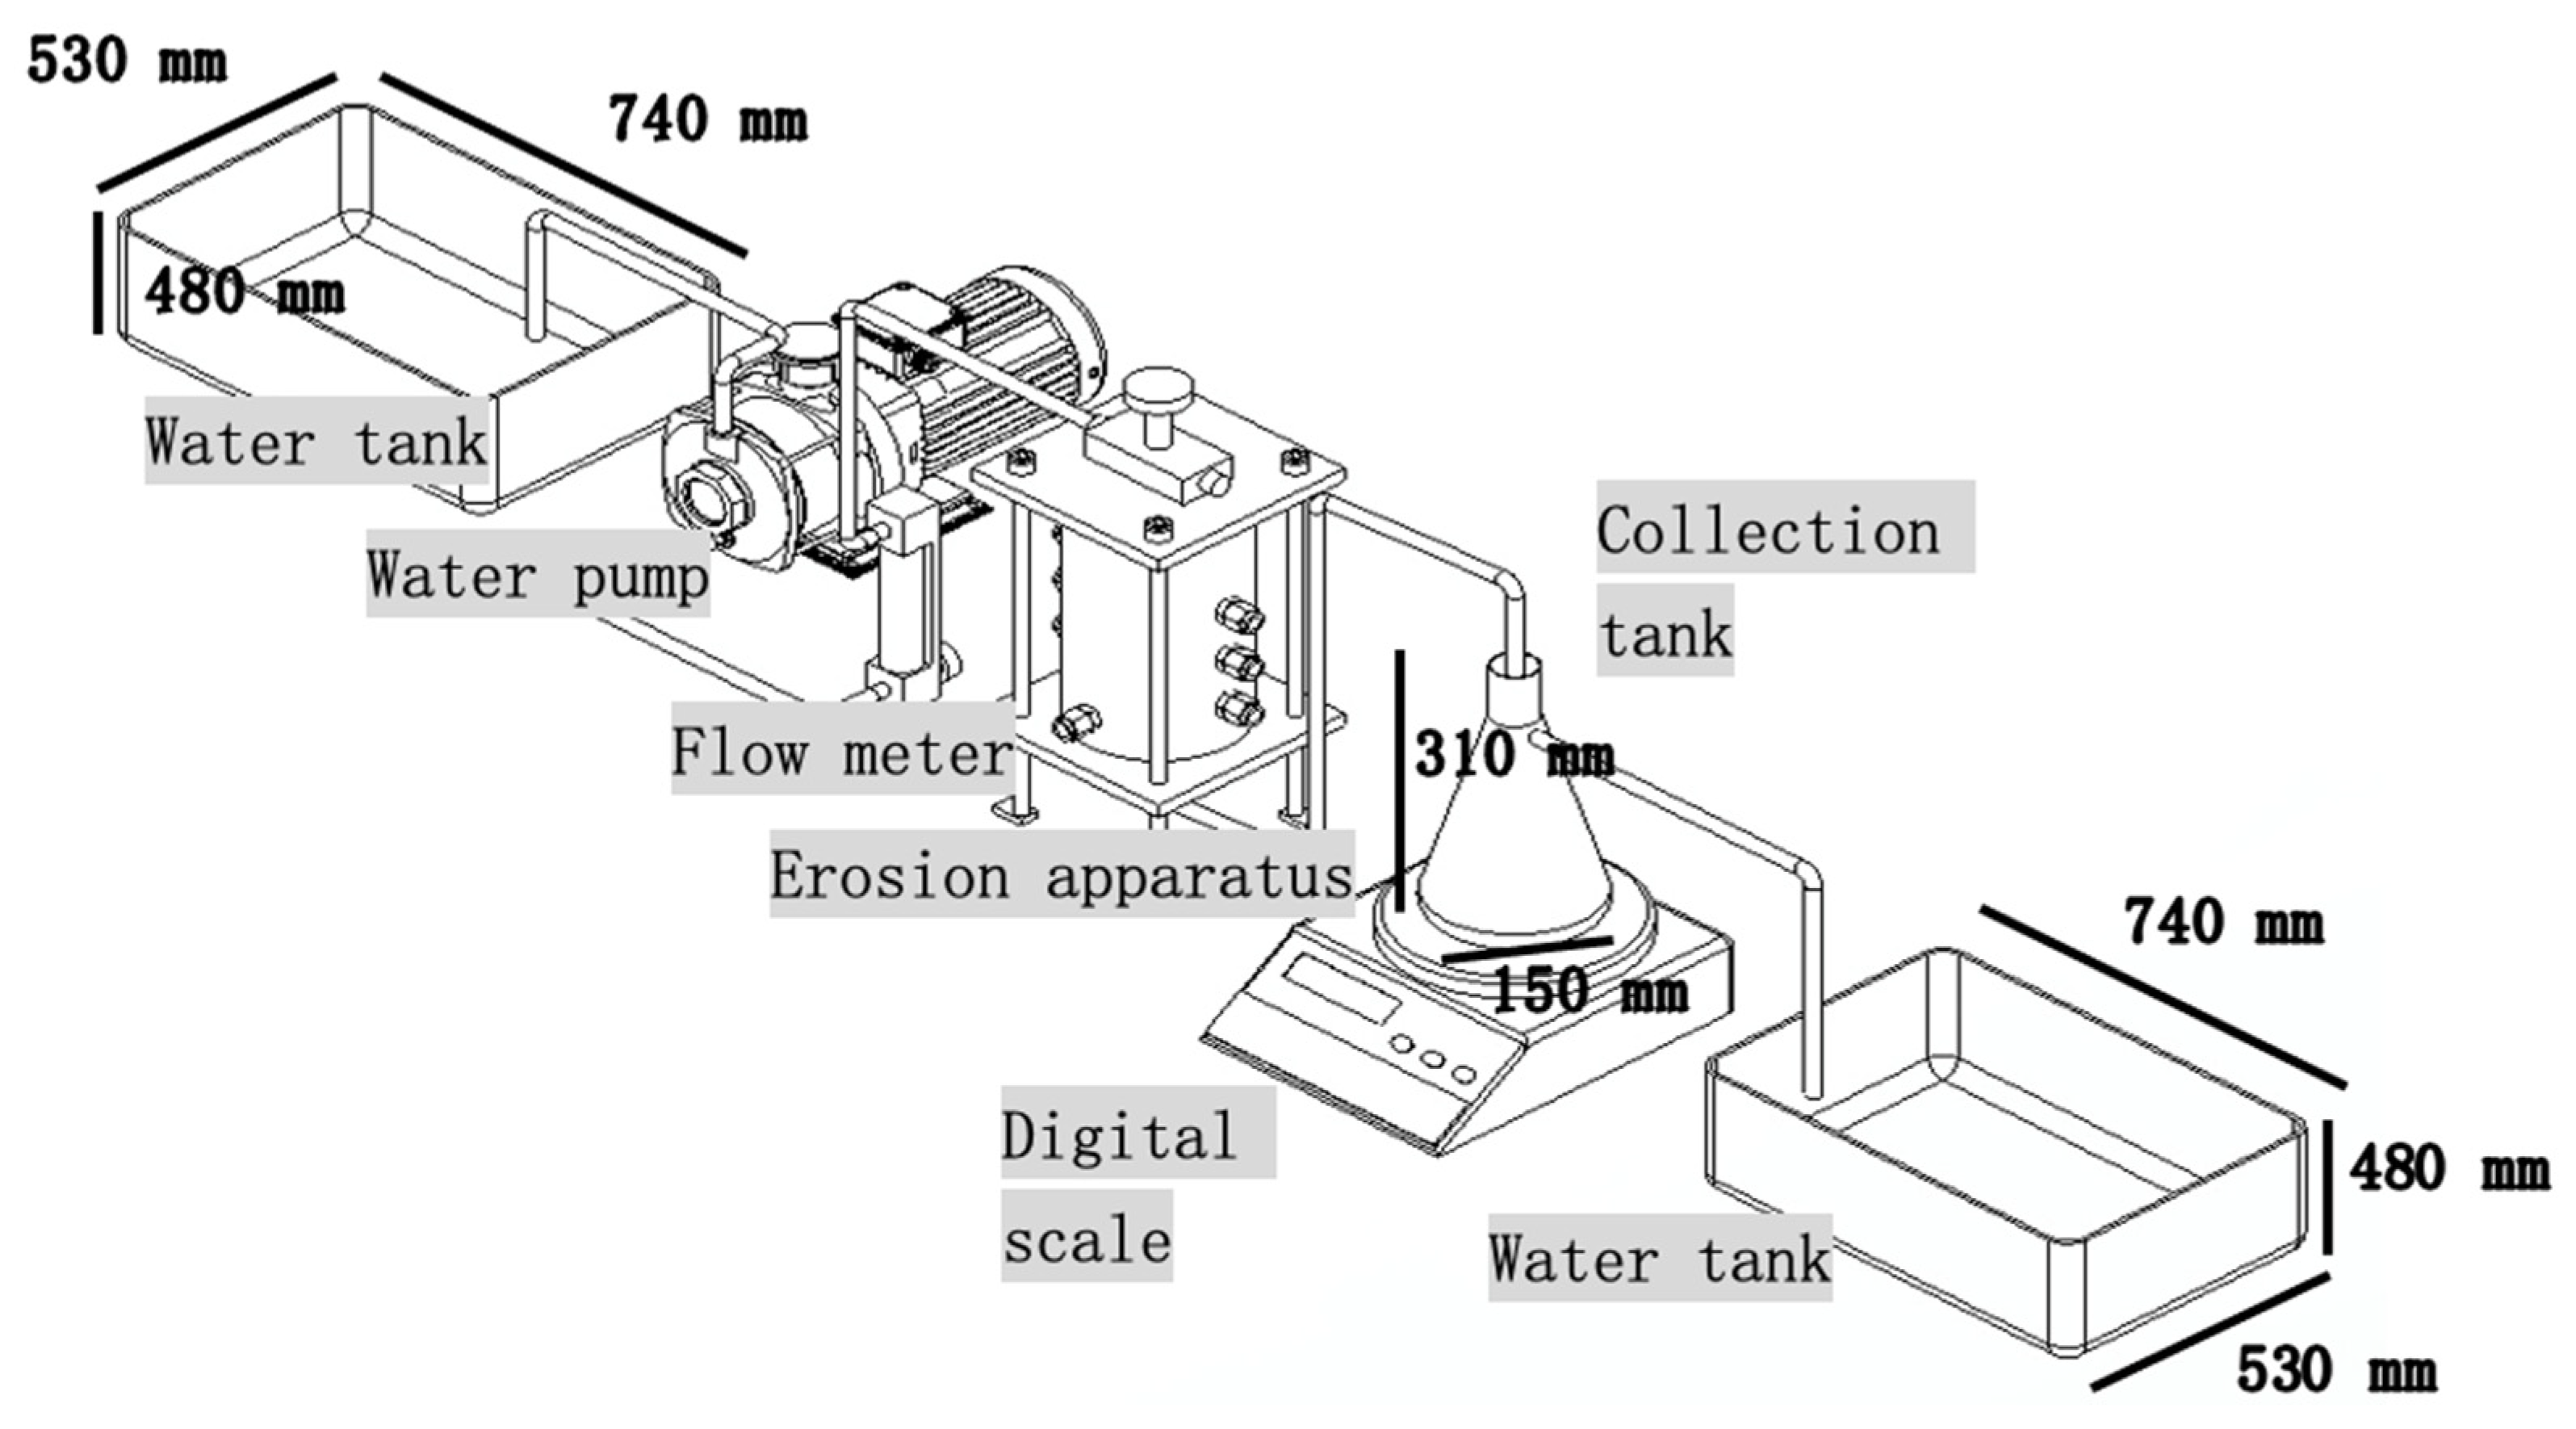
2.1. Apparatus
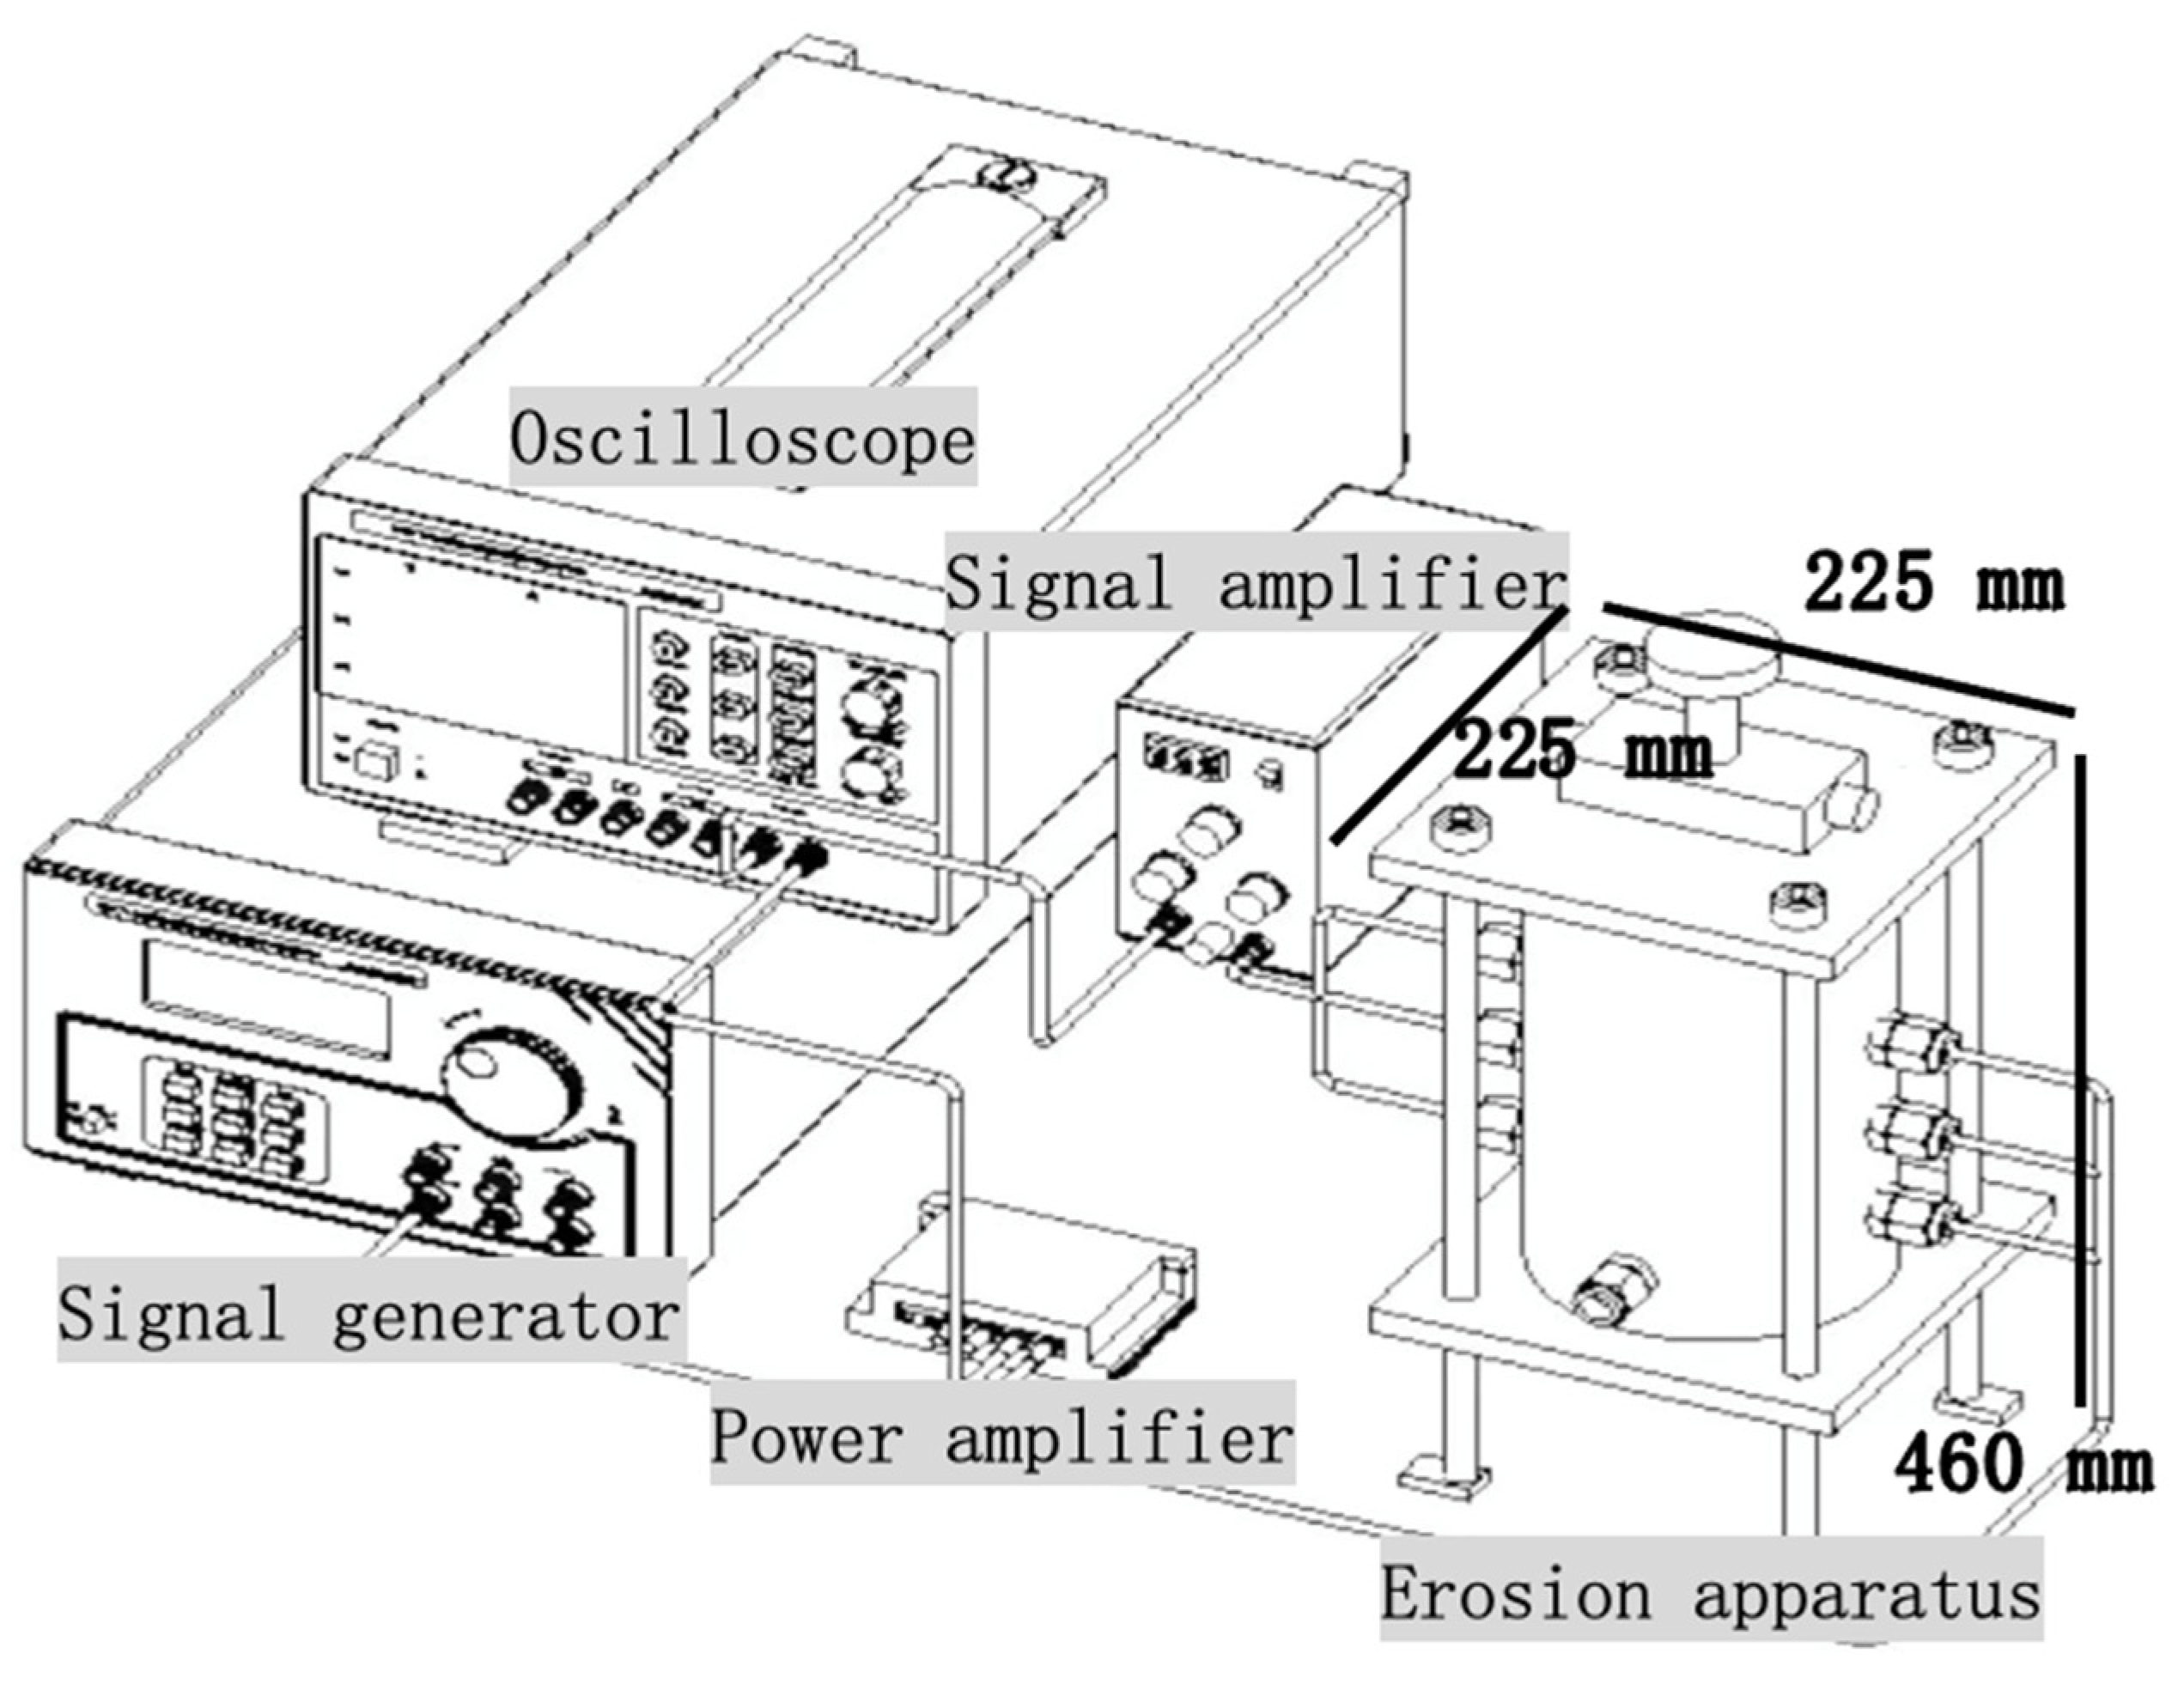
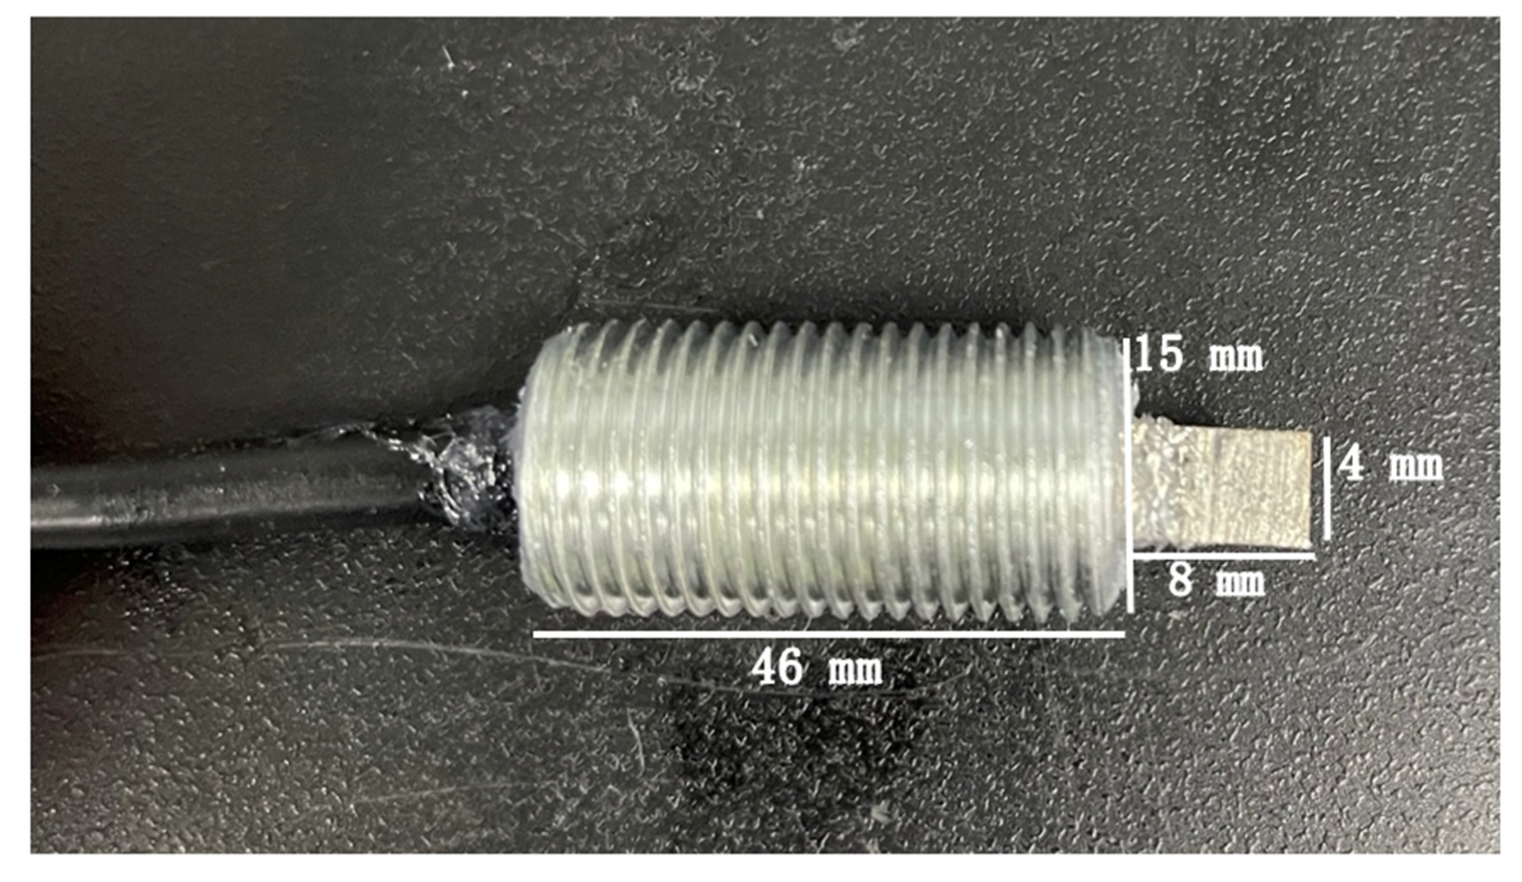
2.2. Bender Element Assembles
2.3. Specimen Preparation Technique
2.4. Erosion Testing Regime
3. Results and Discussion
4. Conclusions
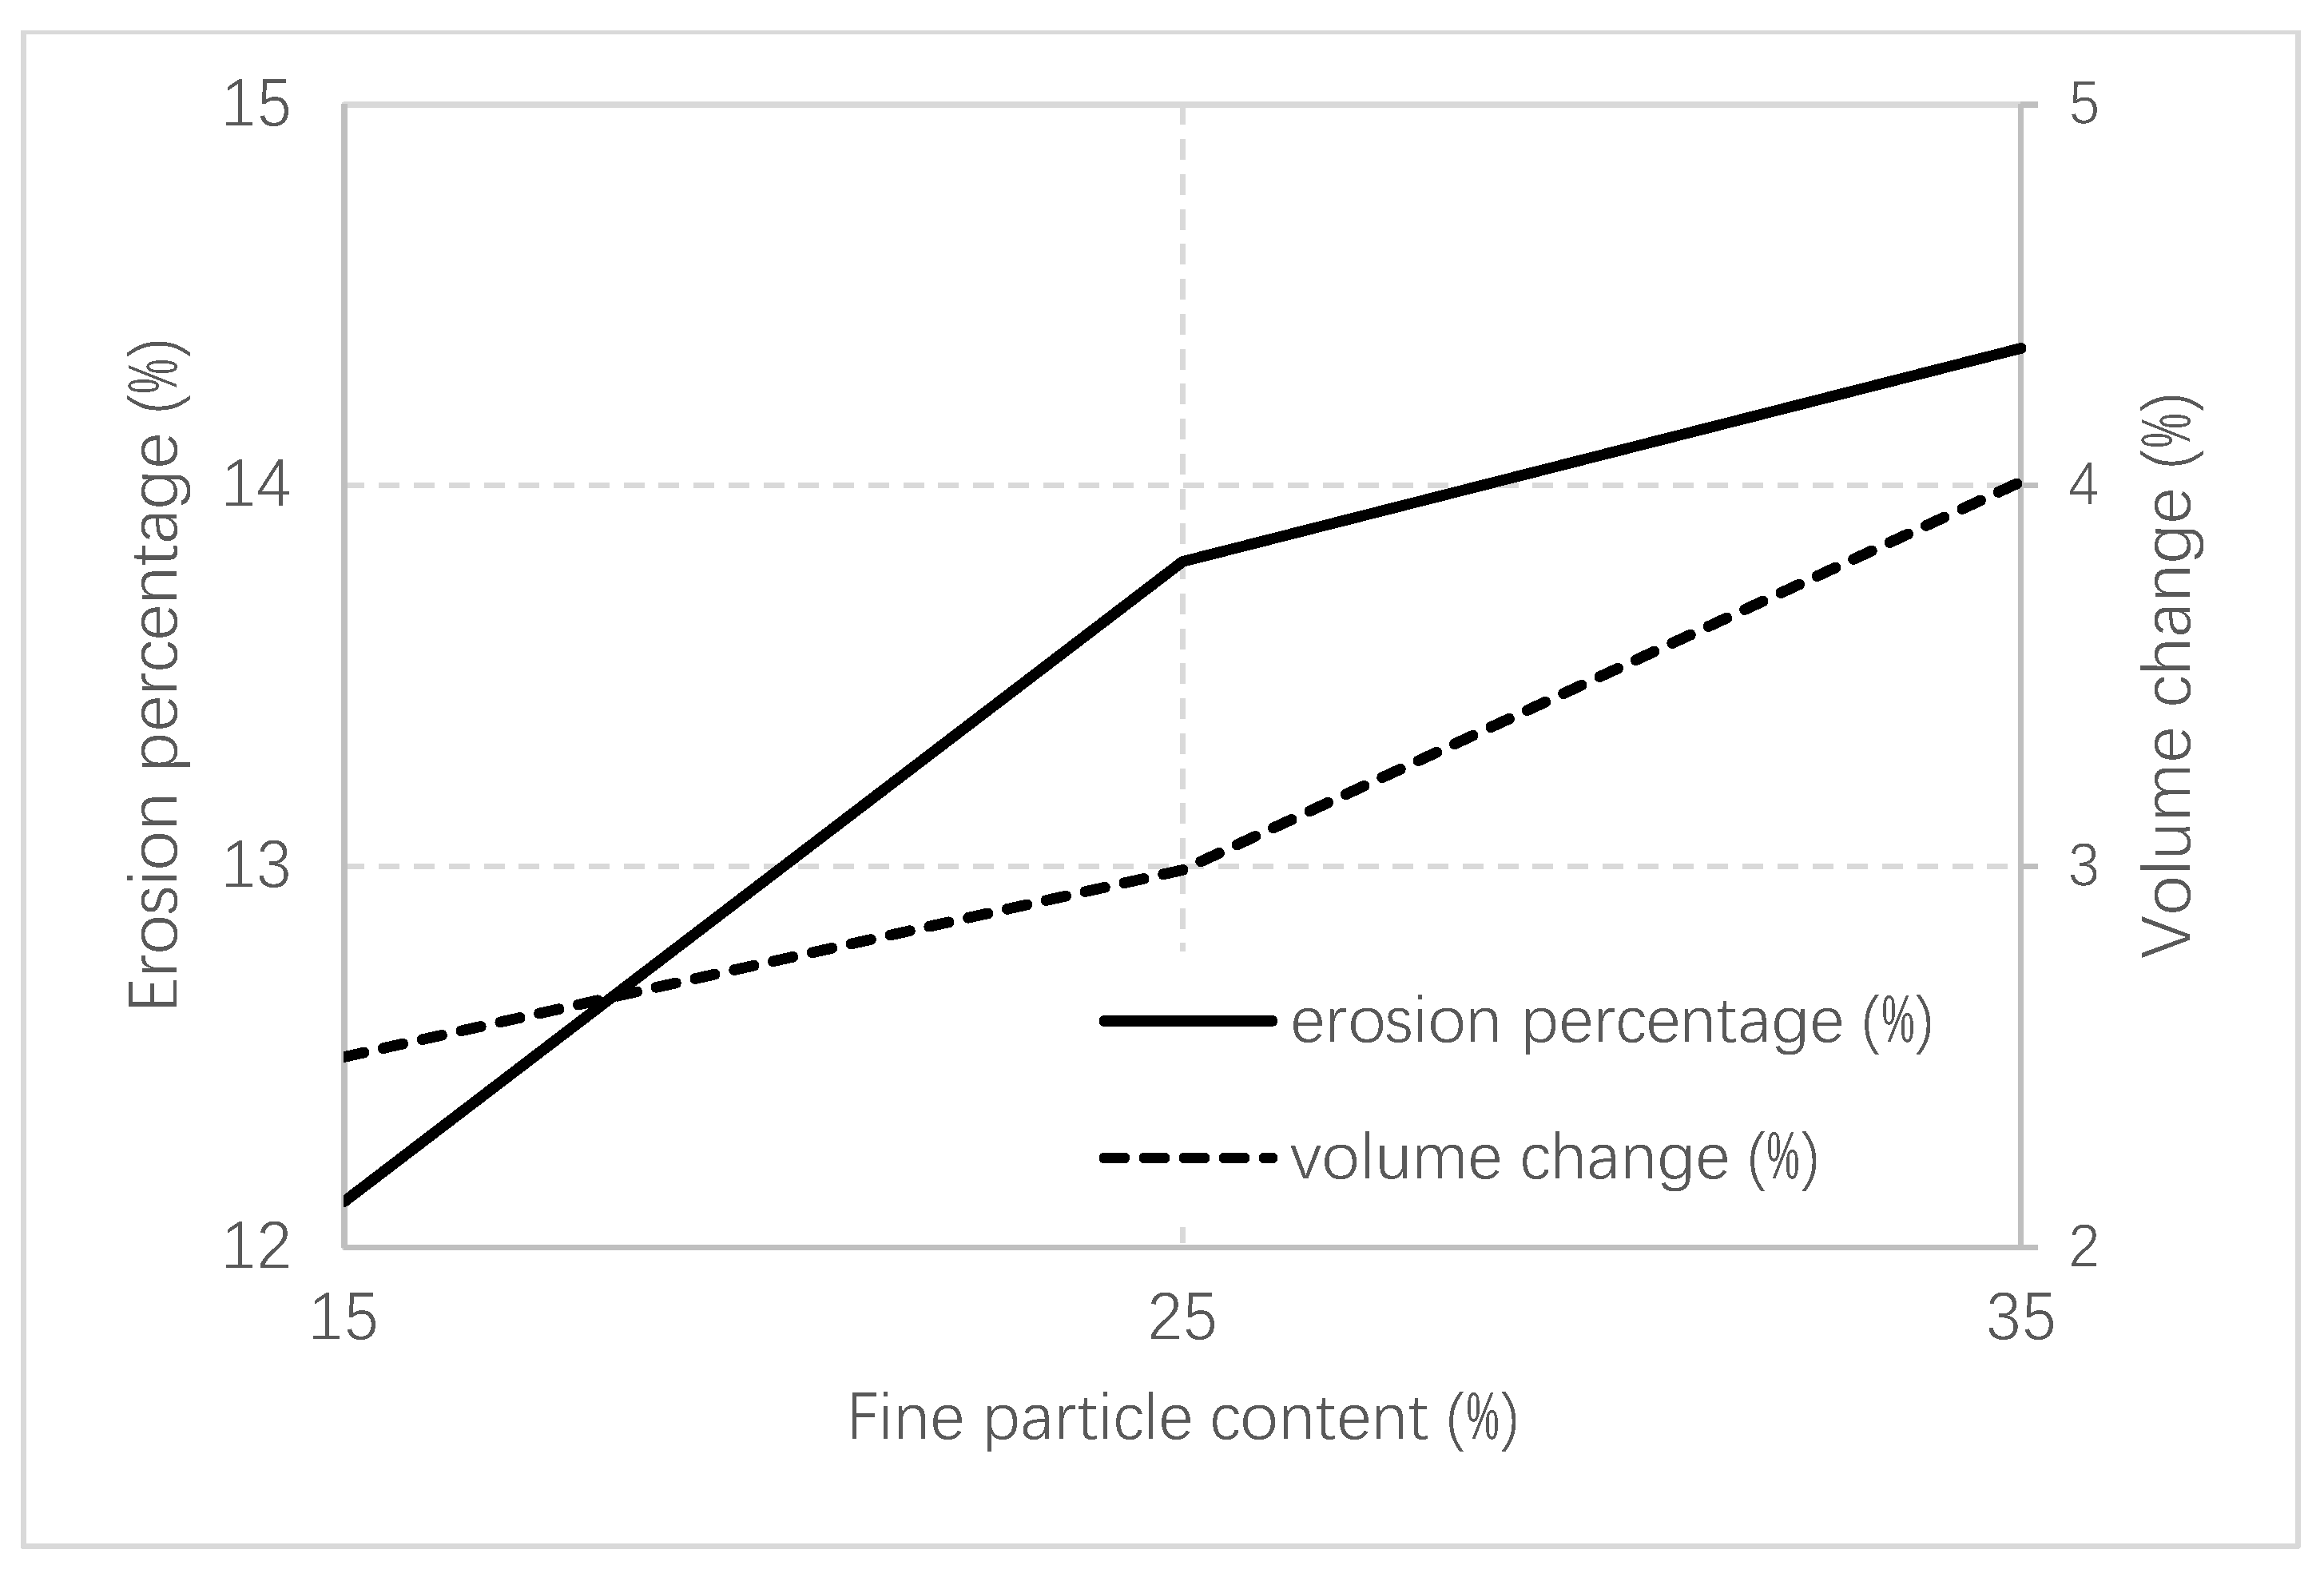
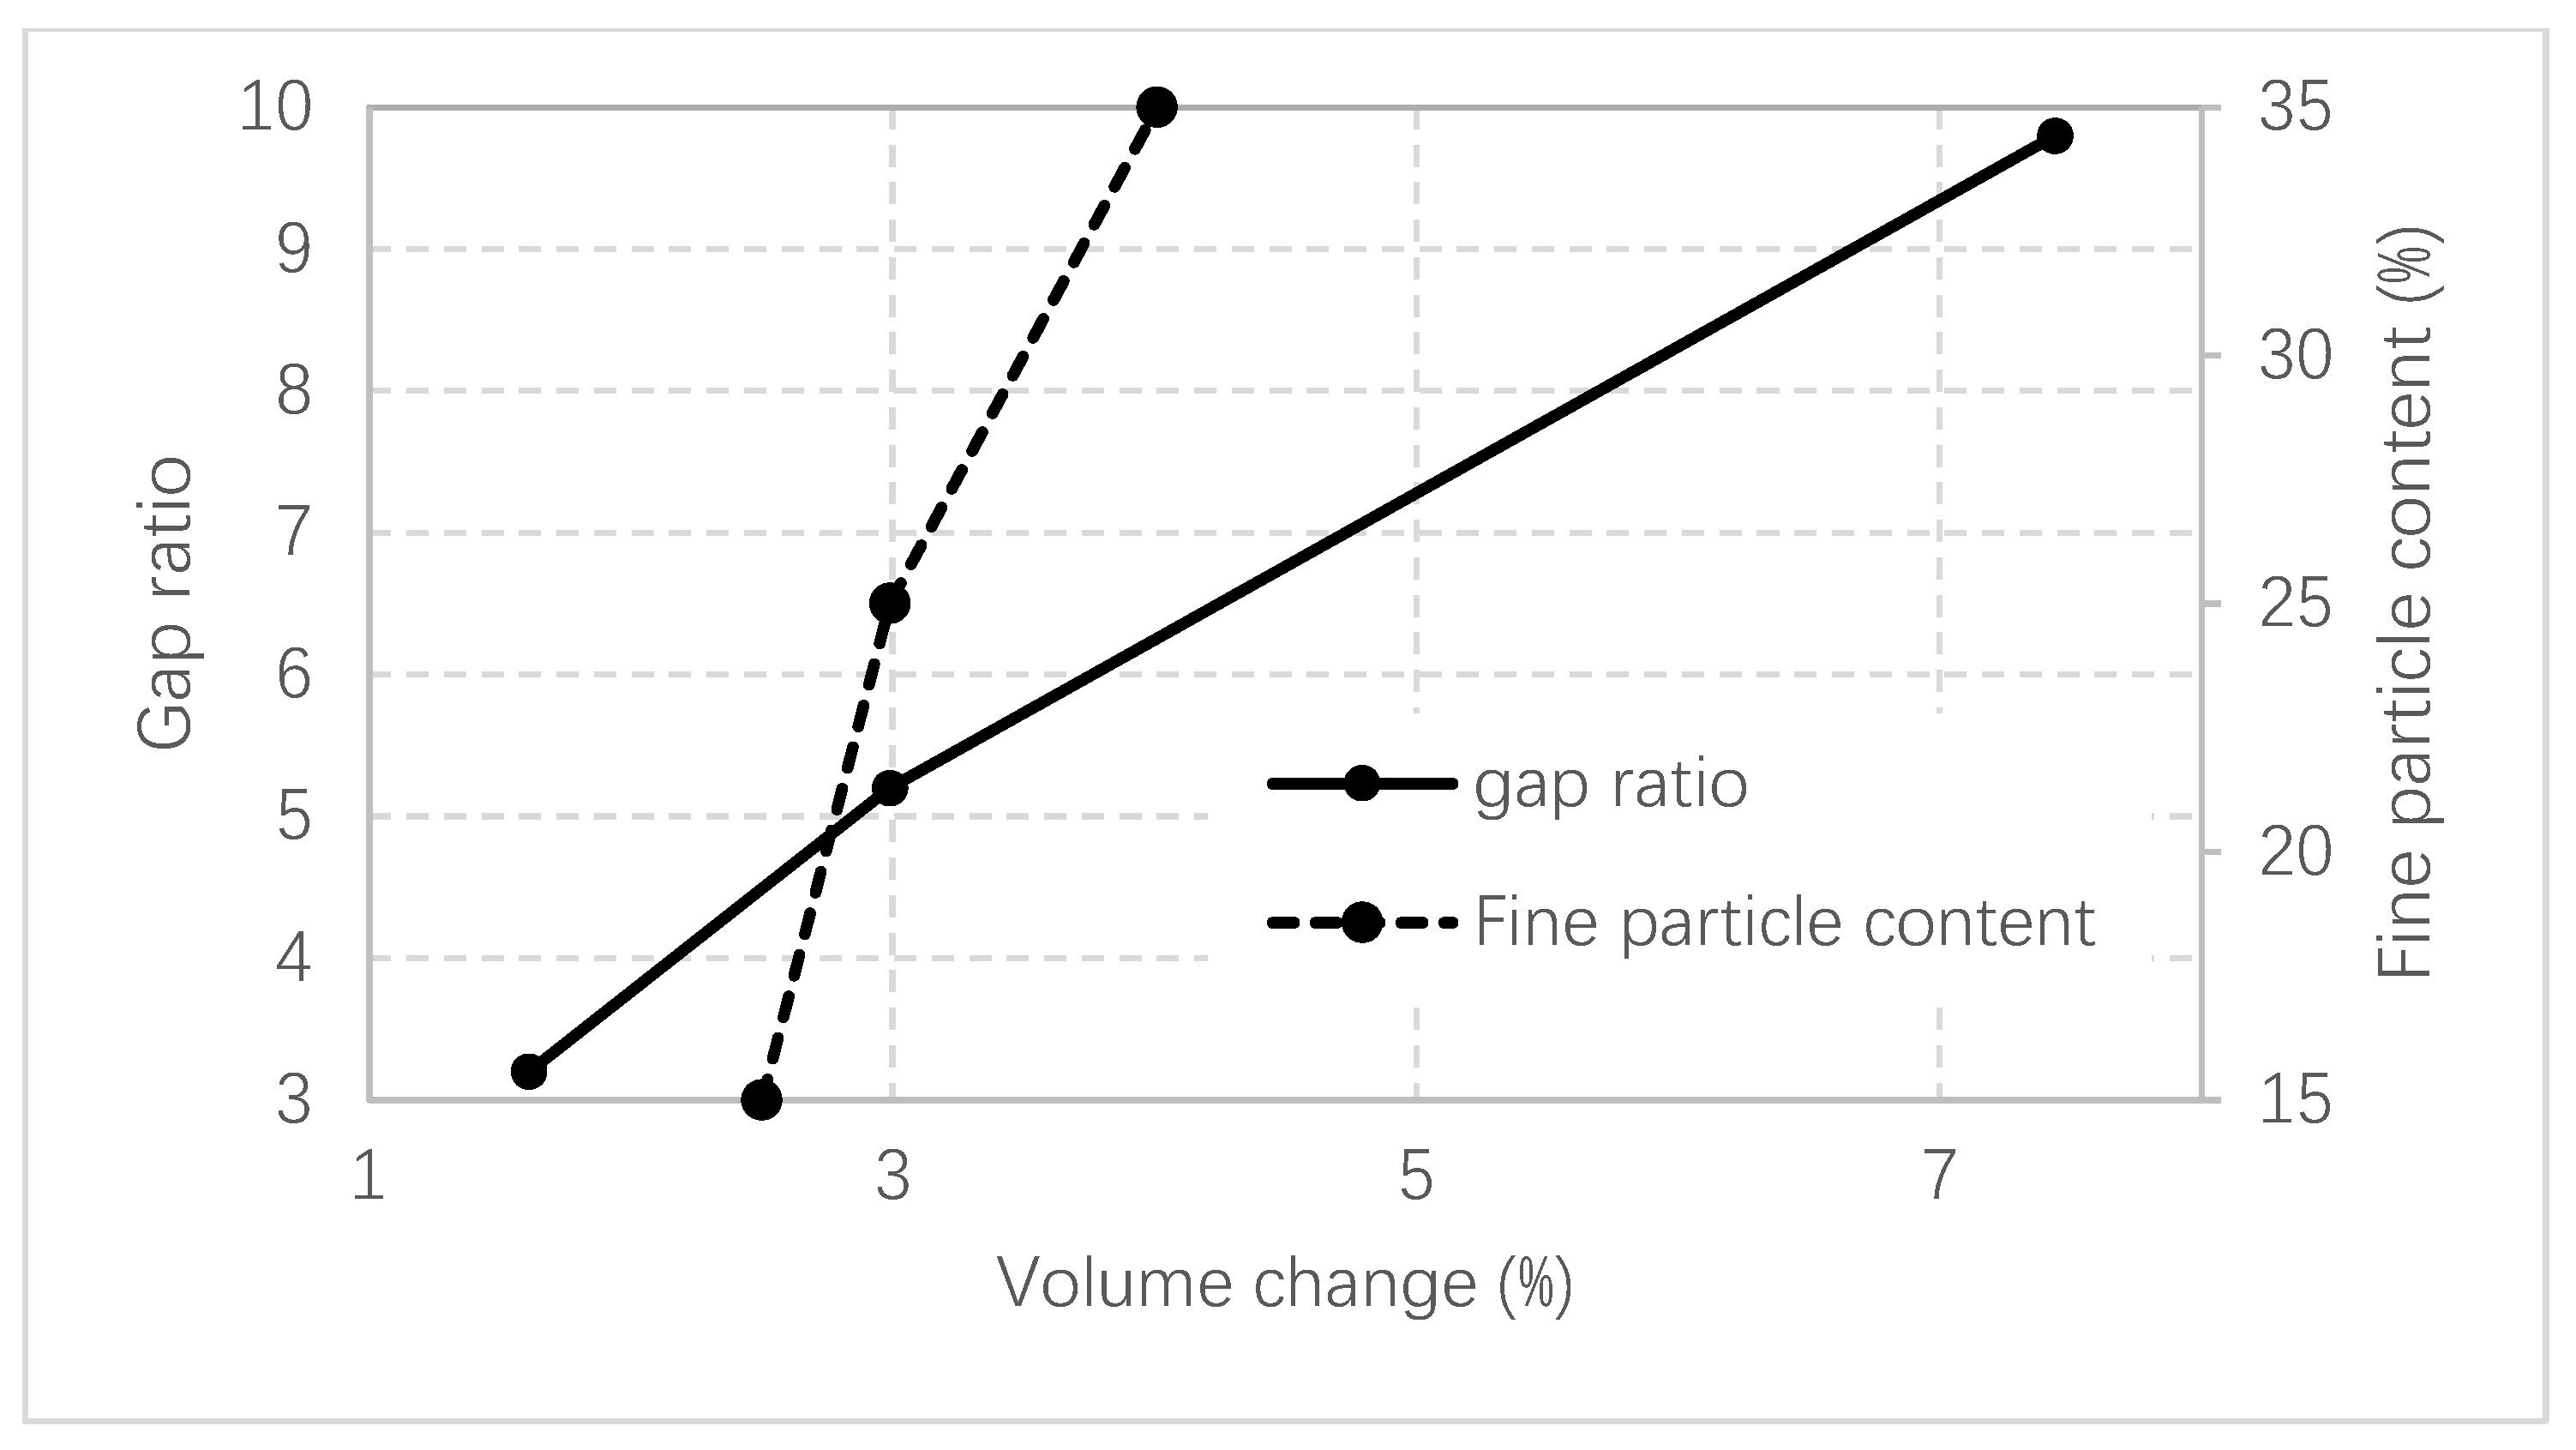
- The percent of erosion follows the trend of global volume change with increasing fine particle content in the 15% to 35% range. It is possible that the influence of particle readjustment could overwhelm fine particle loss. Either a higher initial fine particle content or gap ratio presents a severe change in global volume of the specimen.
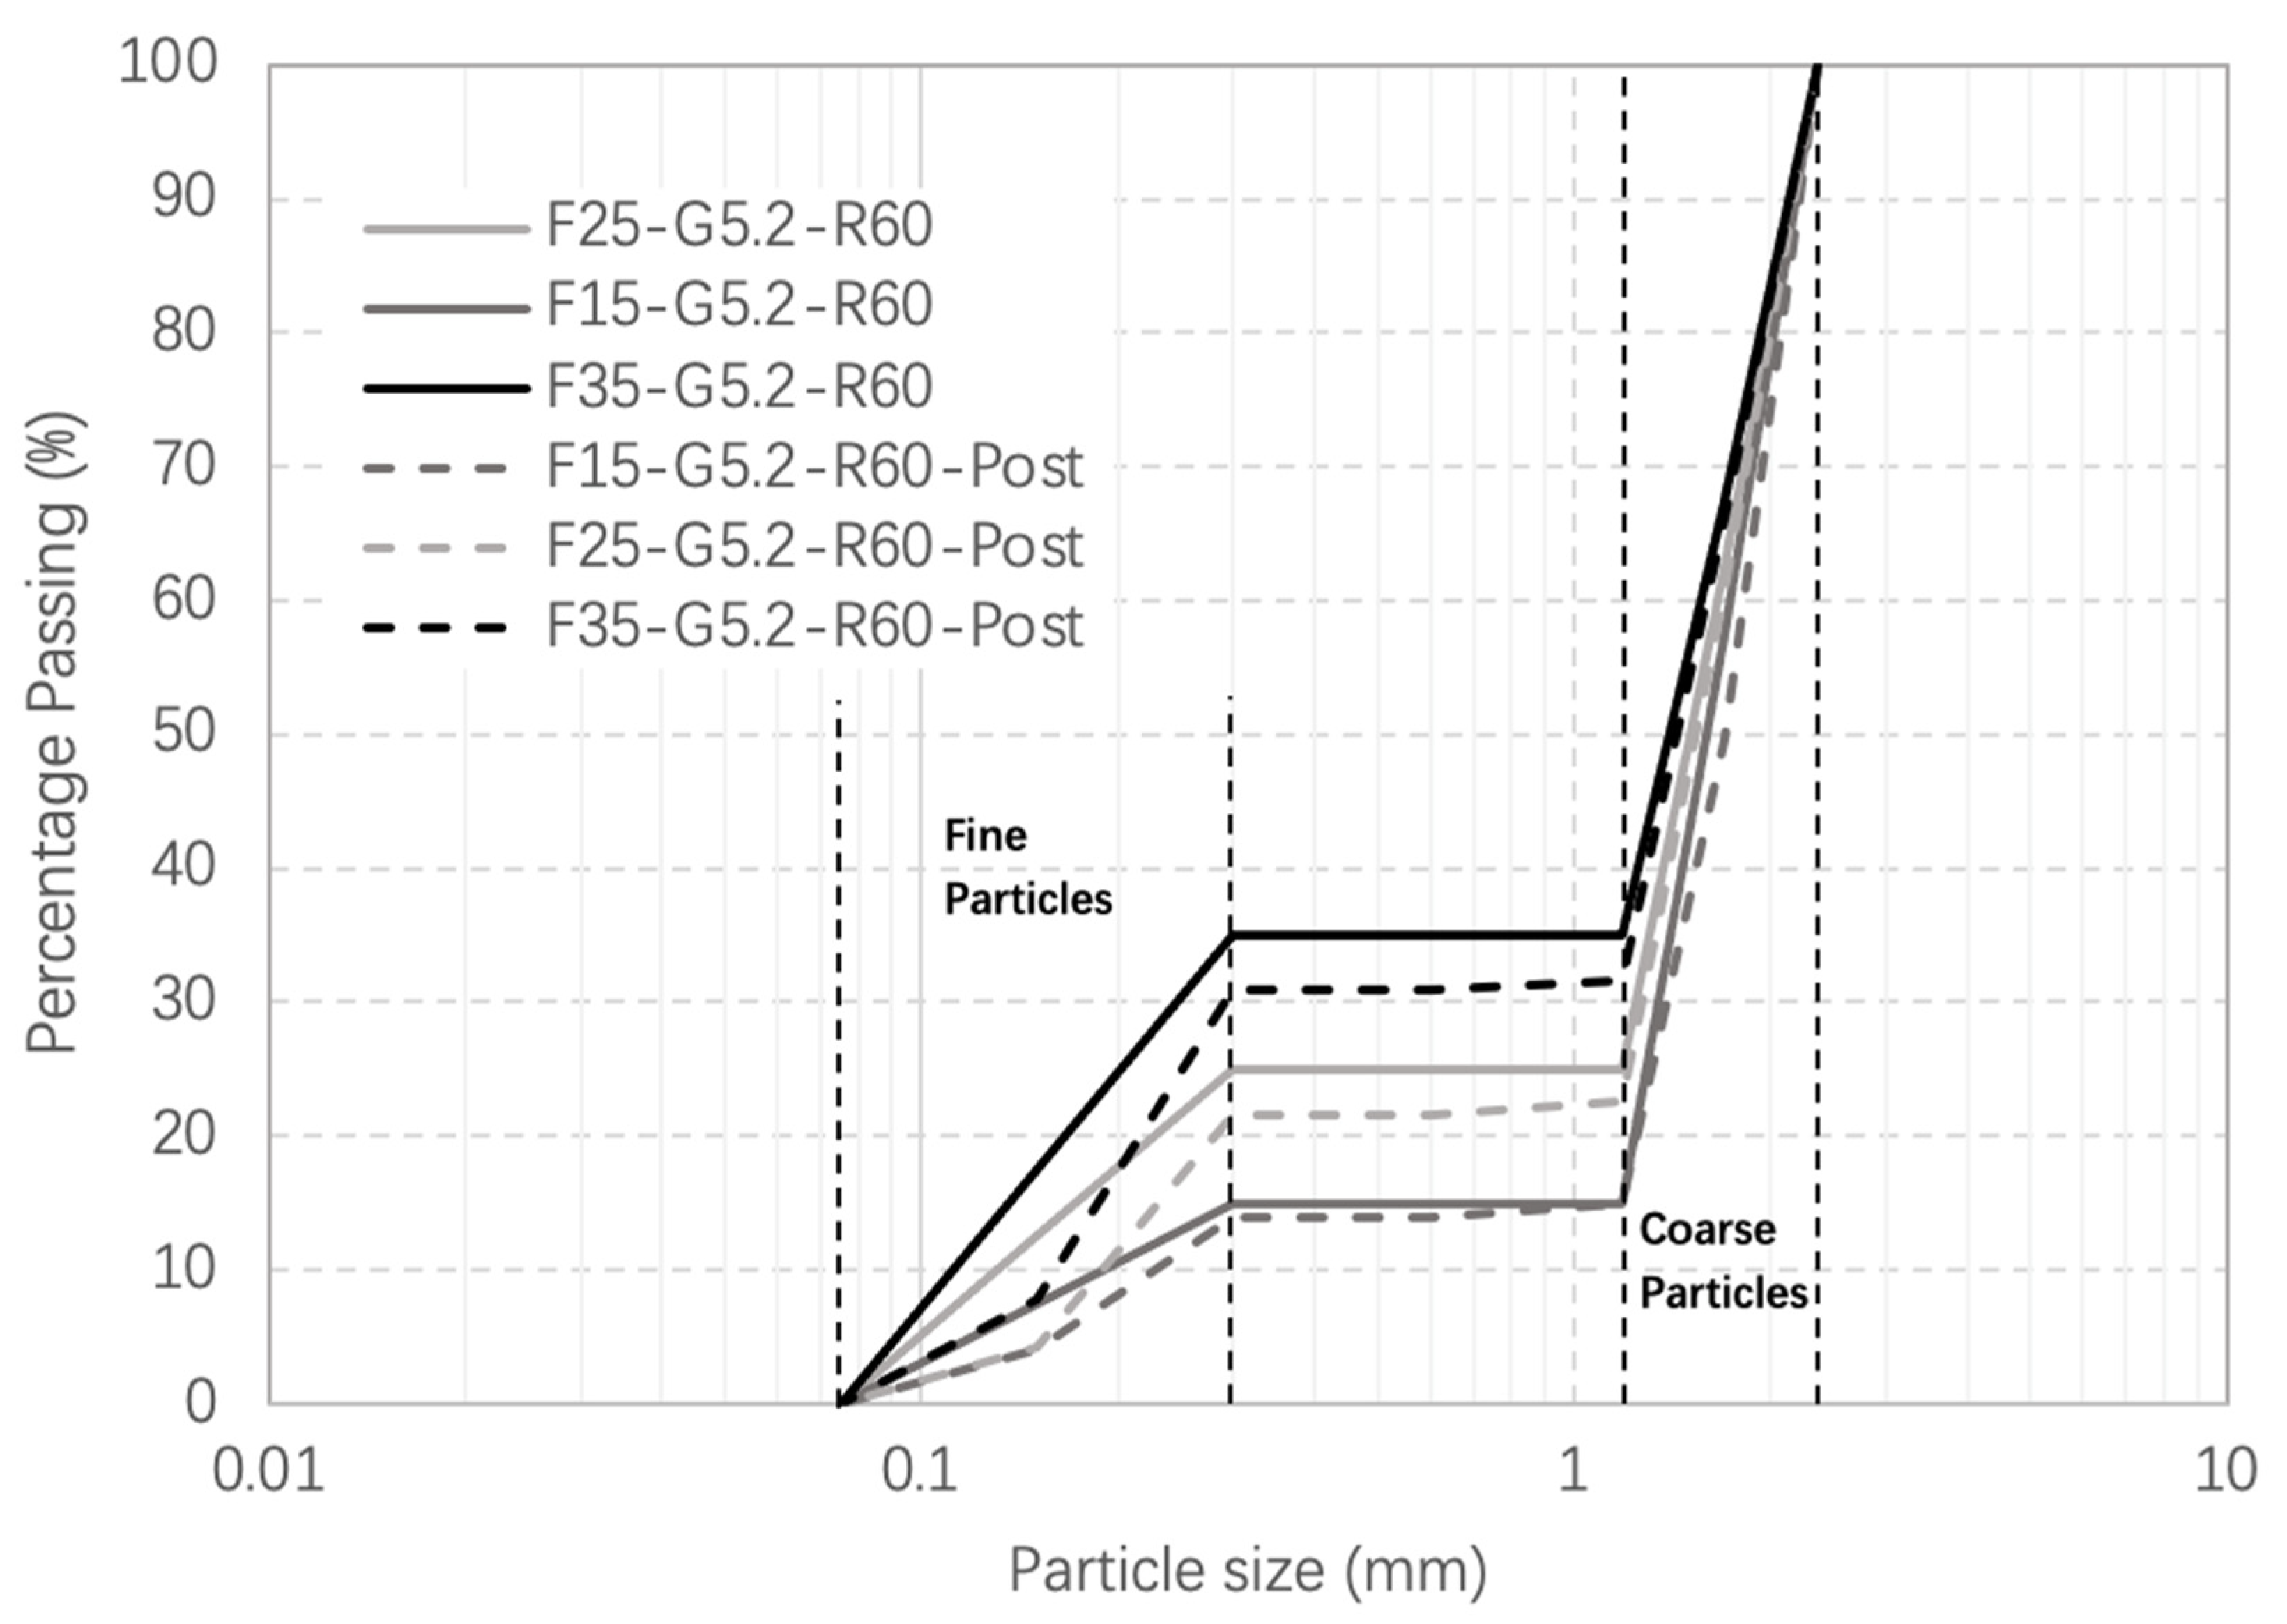
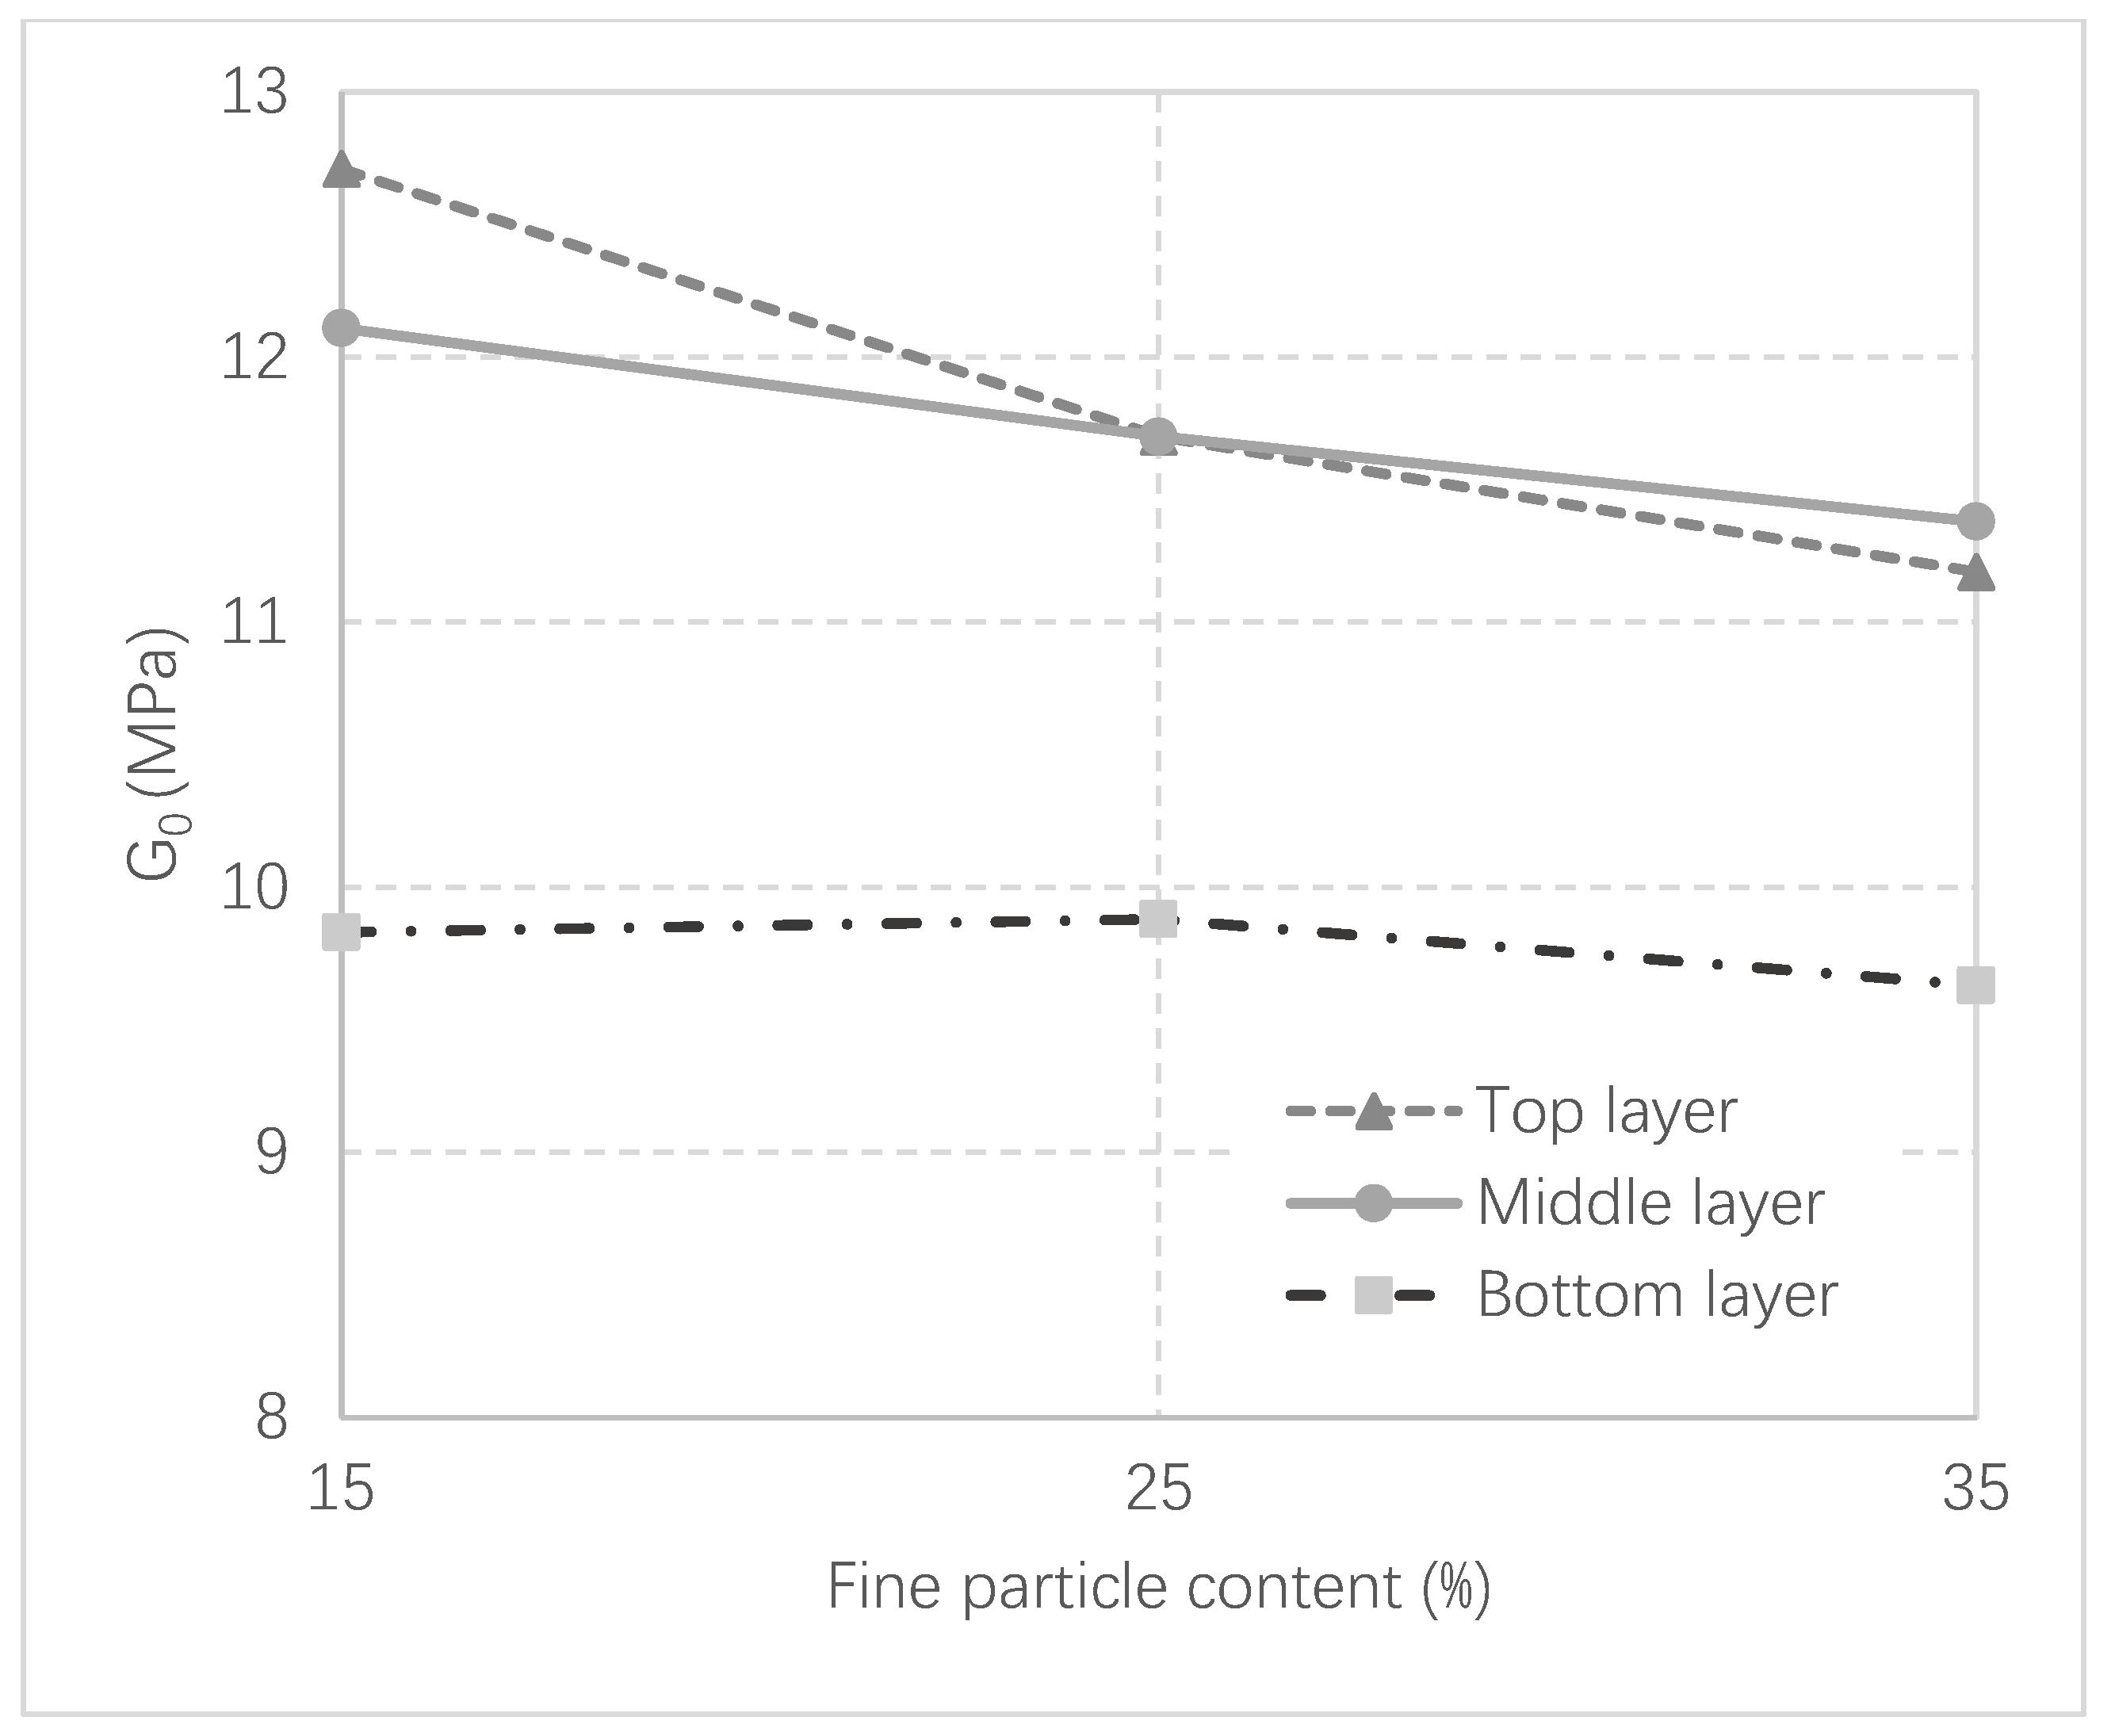
- The soil particle content in the bottom layer obviously overshoots that of the upper soil layers by stacking, whereas the upper layers of the soil samples show a similar percentage and pattern of granule loss.
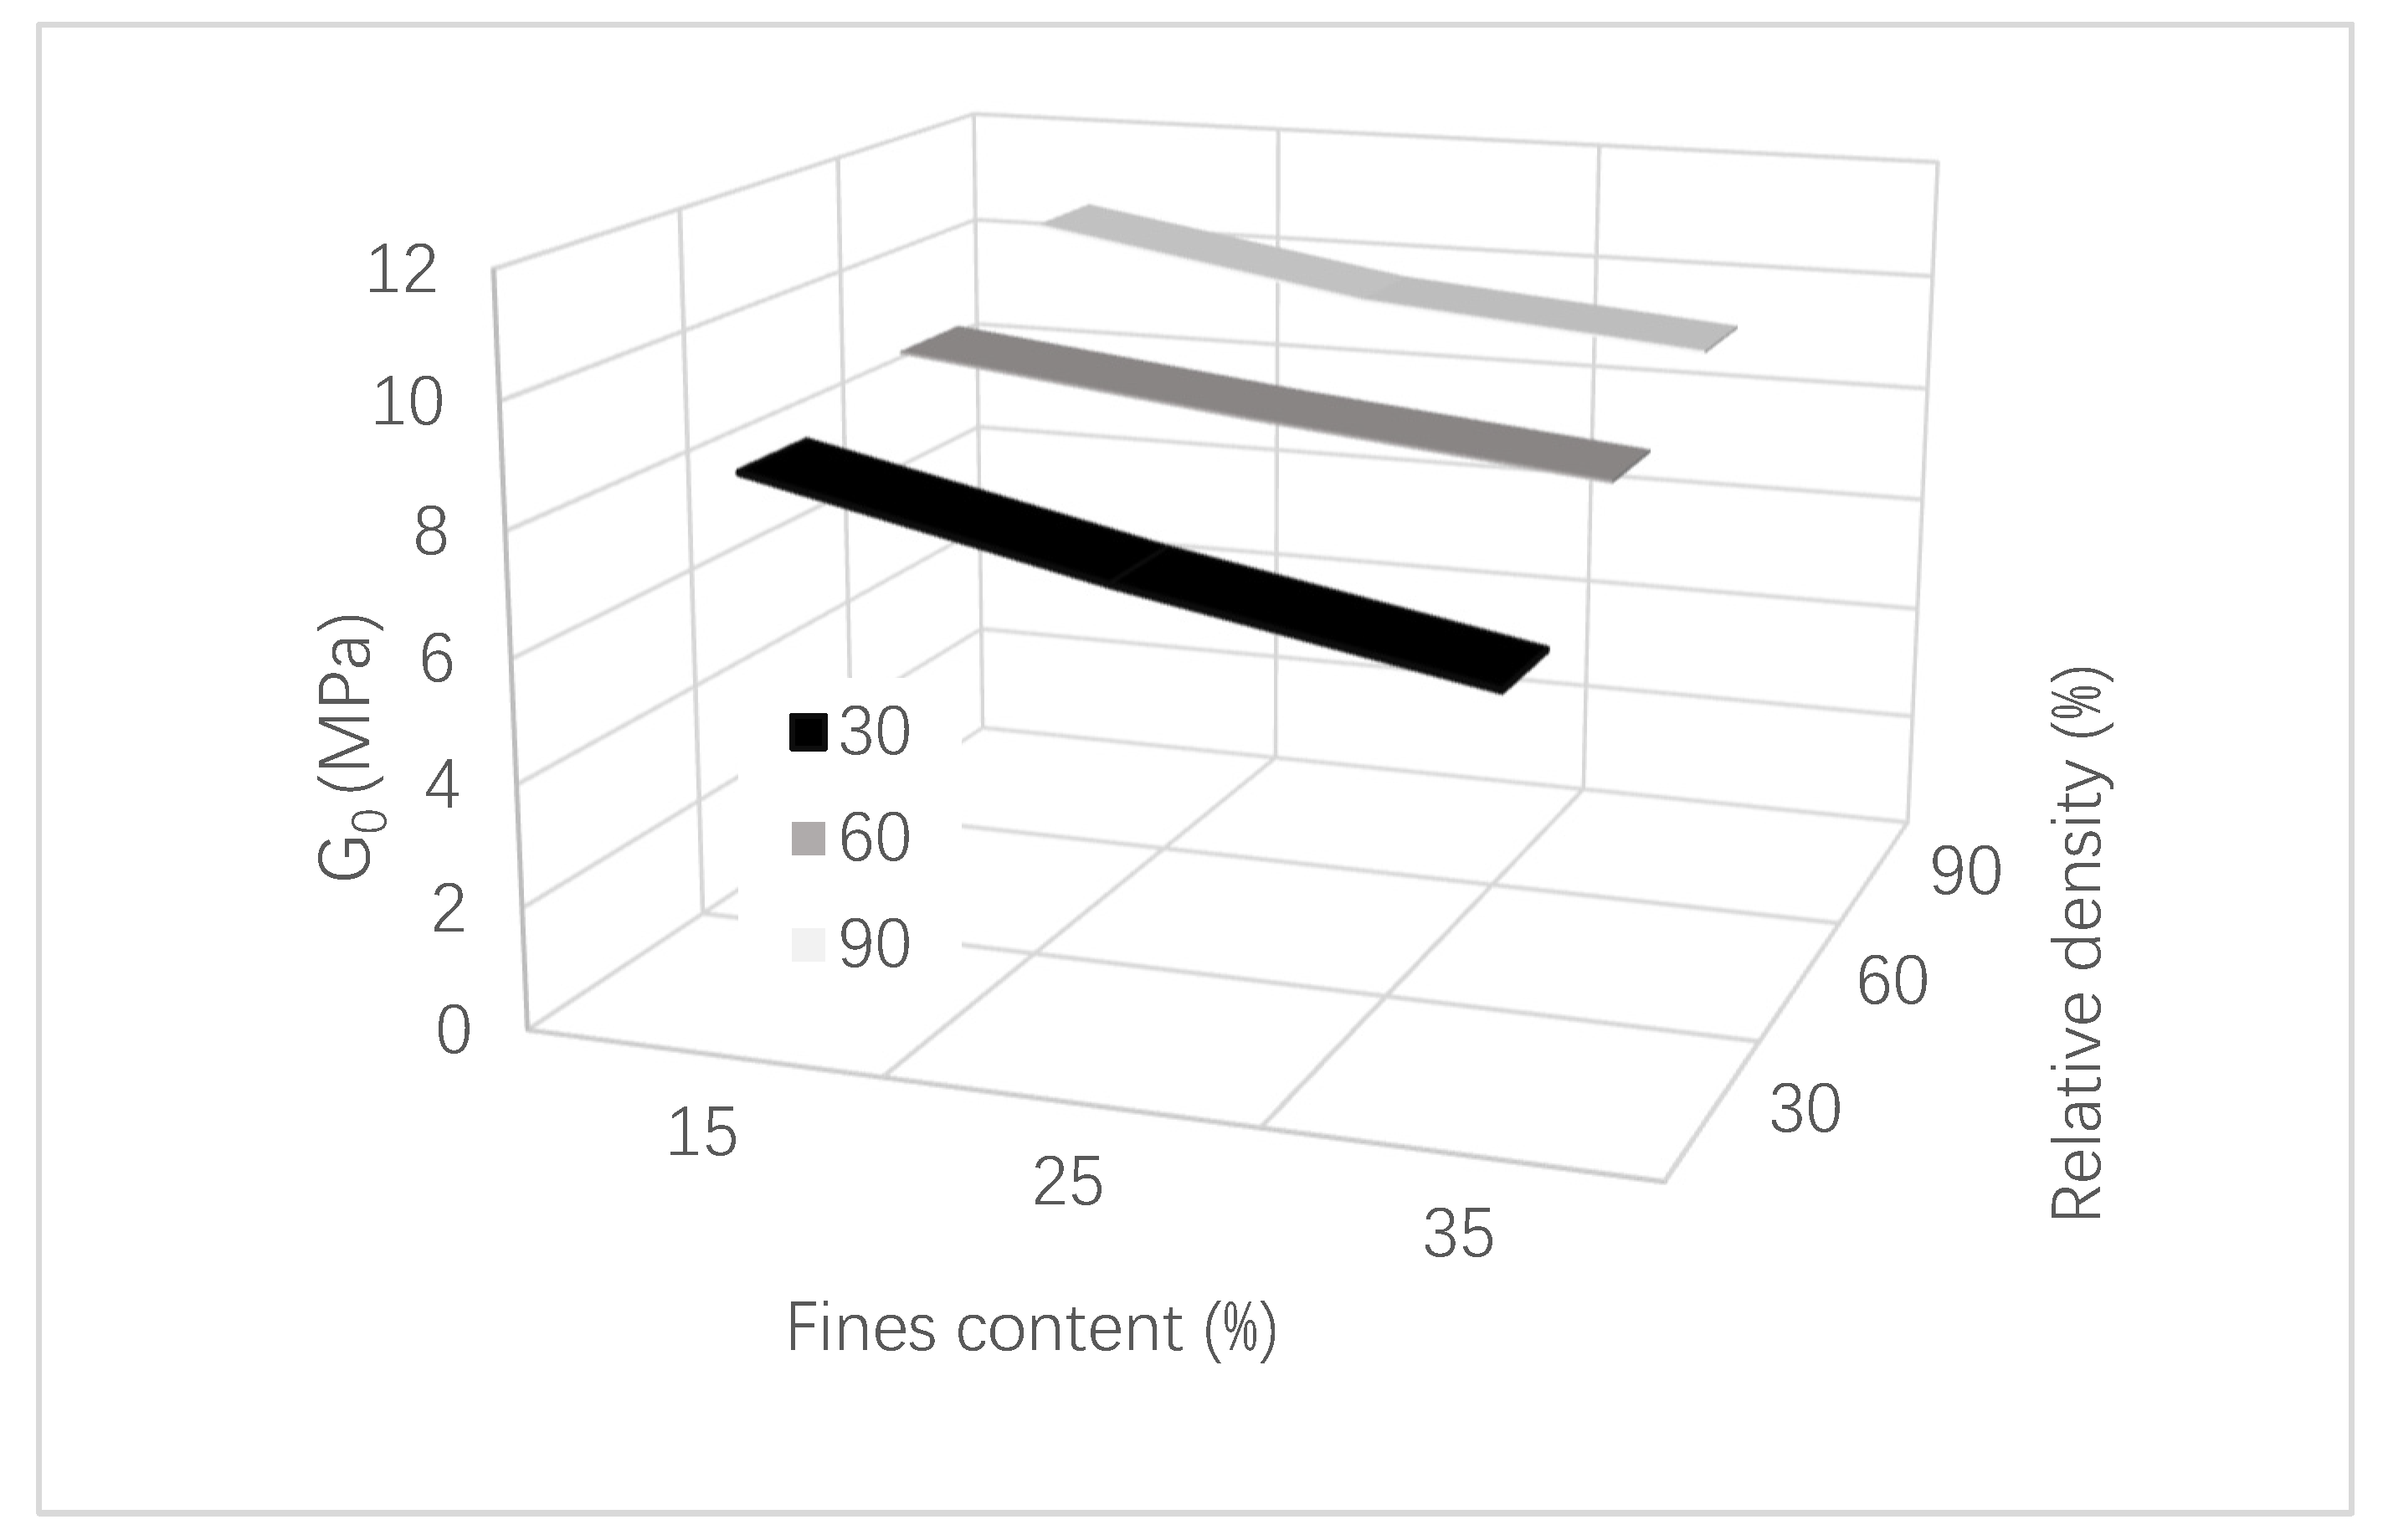
- Fine particle content has a negative impact on the transmission of shear waves through soil, whereas relative density is positively associated with shear wave velocity independent of the assumed unstable, metastable, and stable status of soils.
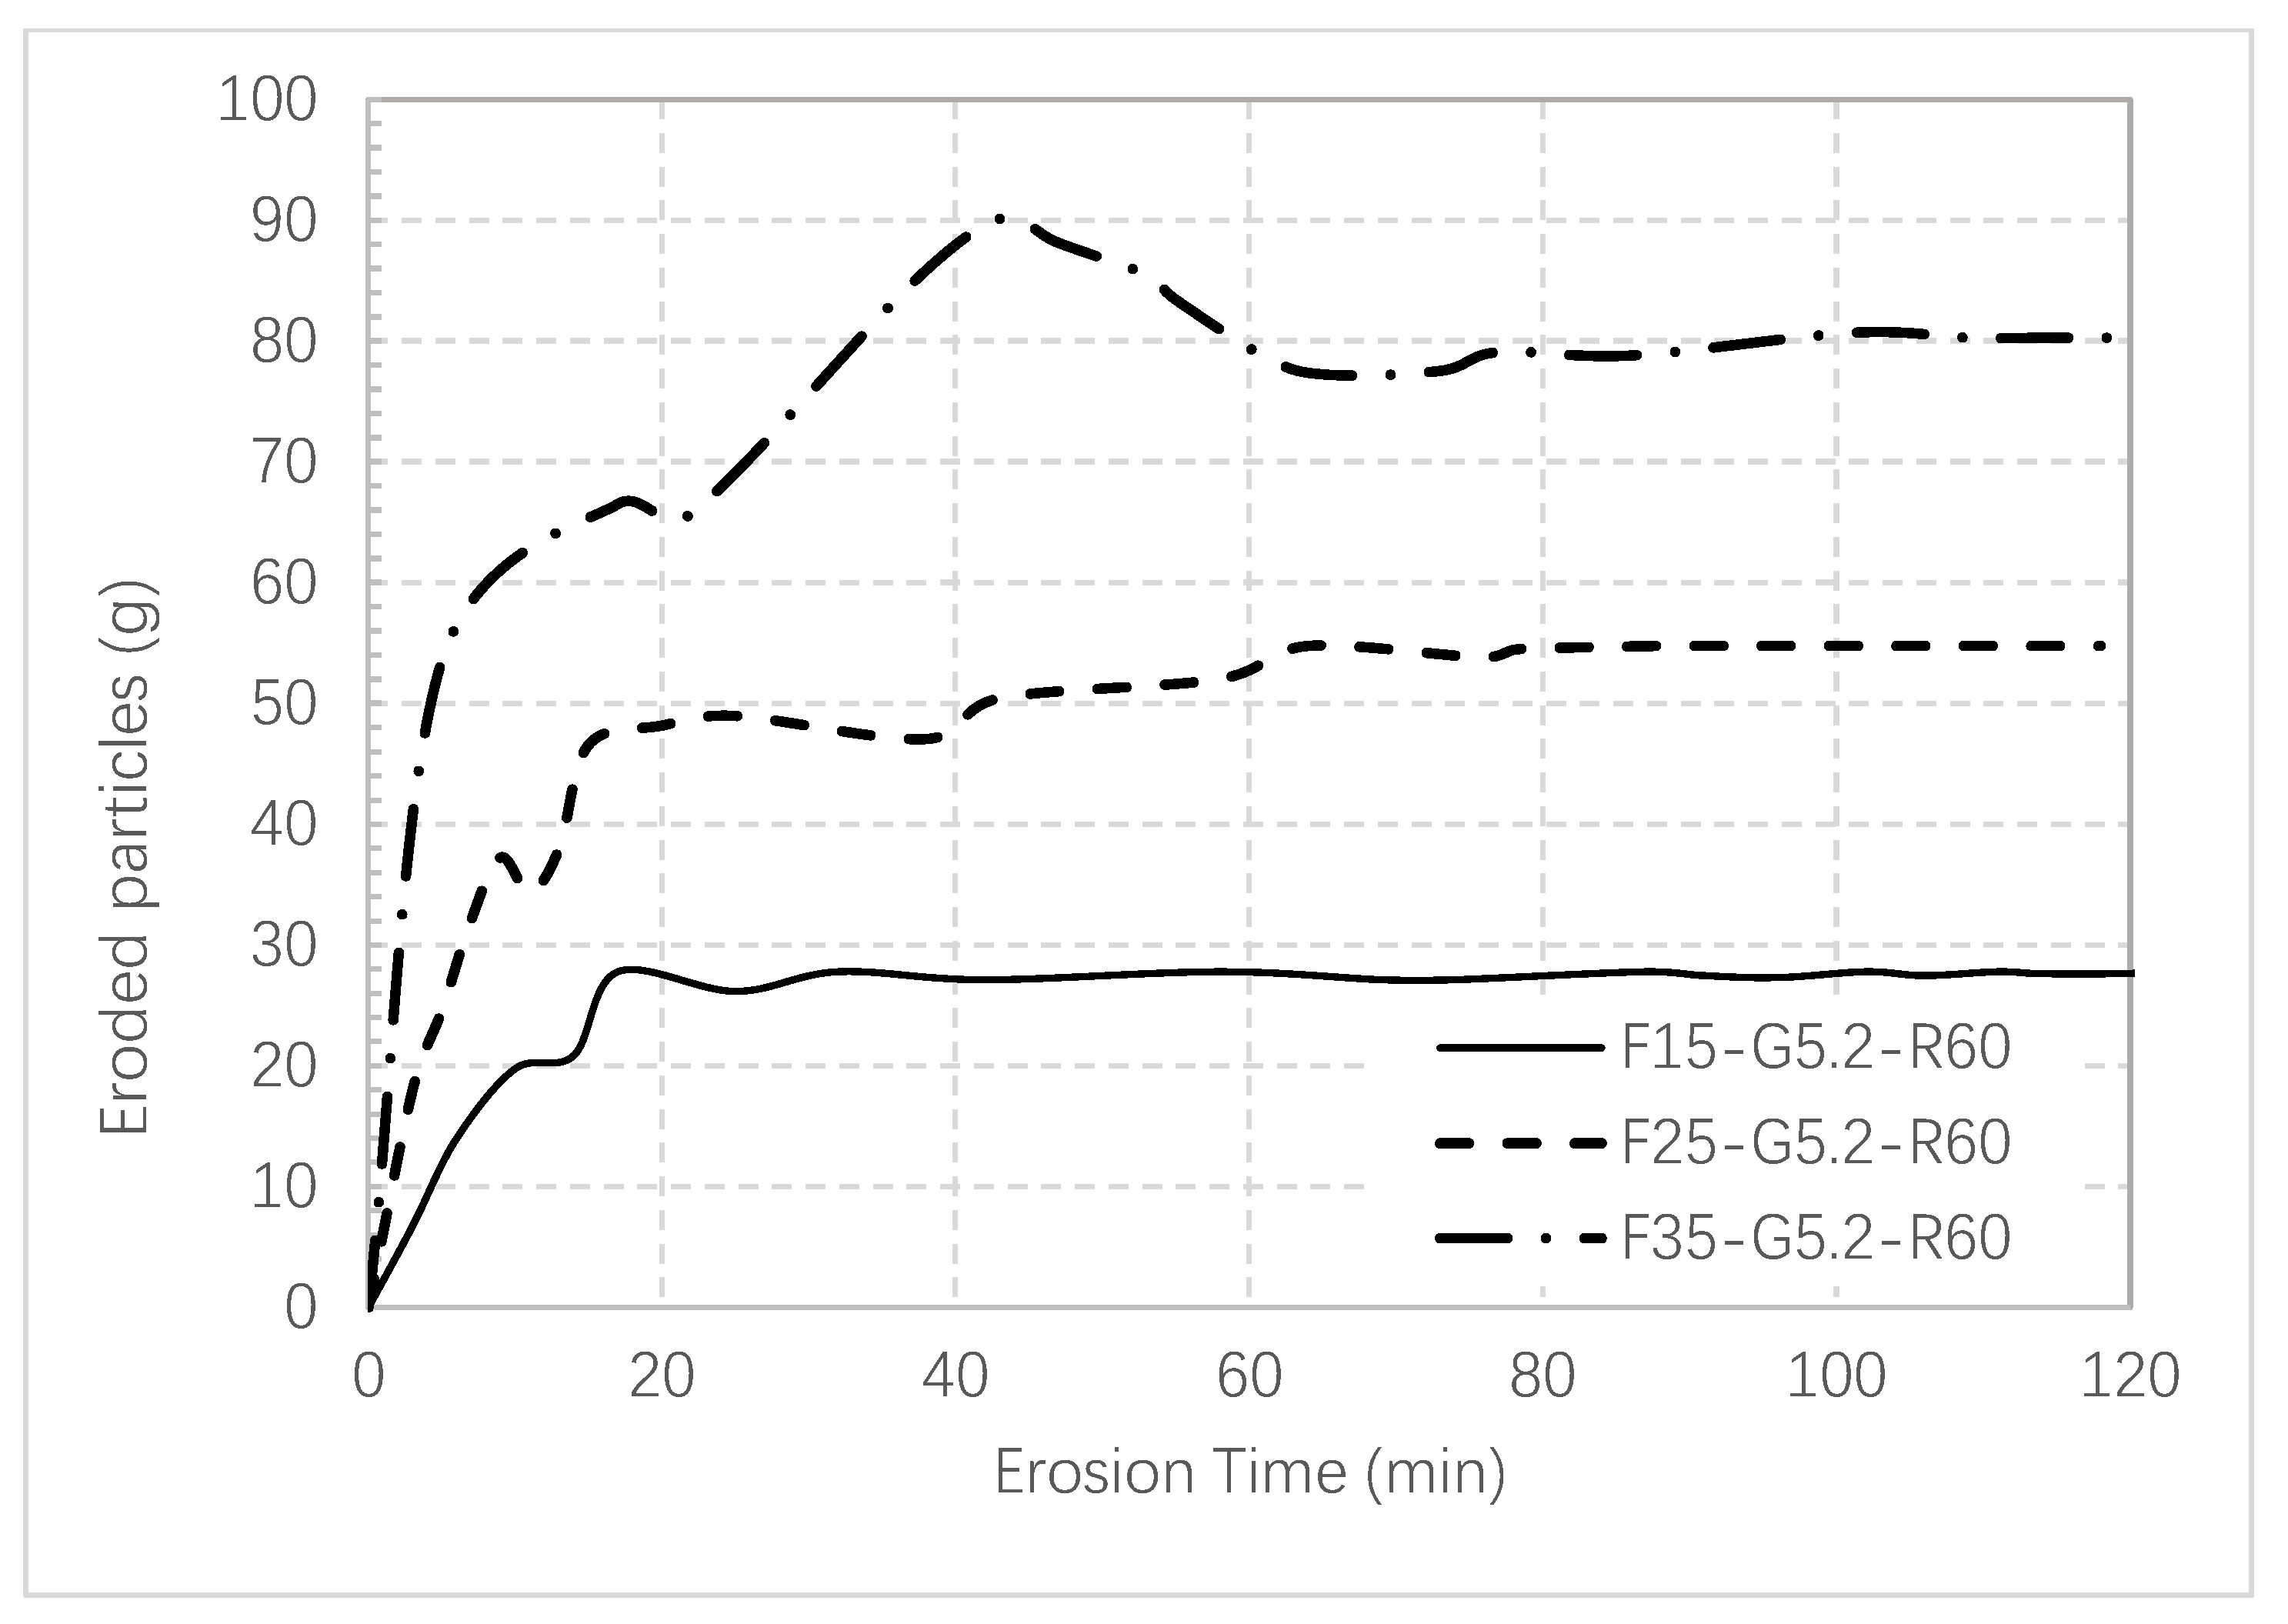
- Samples with a higher initial fine particle content are prone to experience more erosion percentage.
- The erosion process tends to take place concentrating on the initial 20 min despite varied fine particle proportions, with a slight fluctuation afterwards. For the sample with a higher fine particle content (35%), the effective erosion period is lengthened, but 120 min is sufficient to complete the erosion process with a reasonable surplus.
Author Contributions
Funding
Data Availability Statement
Conflicts of Interest
References
- Chitravel, S.; Otsubo, M.; Kuwano, R. Effects of internal erosion on the cyclic and post-cyclic mechanical behaviours of reconstituted volcanic ash. Soils Found. 2022, 62, 101111. [Google Scholar] [CrossRef]
- Chien, L.-K.; Oh, Y.-N.; Chang, C.-H. Effects of fines content on liquefaction strength and dynamic settlement of reclaimed soil. Can. Geotech. J. 2002, 39, 254–265. [Google Scholar] [CrossRef]
- Xenaki, V.C.; Athanasopoulos, G.A. Liquefaction resistance of sand–silt mixtures: An experimental investigation of the effect of fines. Soil Dyn. Earthq. Eng. 2003, 23, 1–12. [Google Scholar] [CrossRef]
- Mehdizadeh, A.; Disfani, M.M.; Evans, R.; Arulrajah, A.; Ong, D.E.L. Mechanical consequences of suffusion on undrained behaviour of a gap-graded cohesionless soil-an experimental approach. Geotech. Test. J. 2017, 40, 1026–1042. [Google Scholar] [CrossRef]
- Mehdizadeh, A.; Disfani, M.M.; Evans, R.; Arulrajah, A. Progressive in ternal erosion in a gap-graded internally unstable soil: Mechanical and geometrical effects. Int. J. Geomech. 2018, 18, 04017160. [Google Scholar] [CrossRef]
- Ke, L.; Takahashi, A. Strength reduction of cohesionless soil due to in ternal erosion induced by one-dimensional upward seepage flow. Soils Found. 2012, 52, 698–711. [Google Scholar] [CrossRef]
- Chang, D.S.; Zhang, L.M. Extended internal stability criteria for soils under seepage. Soils Found. 2013, 53, 569–583. [Google Scholar] [CrossRef]
- Tian, D.; Xie, Q.; Fu, X.; Zhang, J. Experimental study on the effect of fine contents on internal erosion in natural soil deposits. Bull. Eng. Geol. Environ. 2020, 79, 4135–4150. [Google Scholar] [CrossRef]
- Zhu, Q.; Su, L.; Liu, Z.; Wang, B. An evaluation method for internal erosion potential of gravelly soil based on particle size distribution. J. Mt. Sci. 2022, 19, 1203–1214. [Google Scholar] [CrossRef]
- Kezdi, P.; Rosenbaum, M.B. Classification of ventricular extrasystoles according to form. J. Electrocardiol. 1969, 2, 289–297. [Google Scholar] [CrossRef]
- Sherard, J.L. Sinkholes in dams of coarse, broadly graded soils. In Proceedings of the Transactions, 13th International Congress on Large Dams, New Delhi, India, 29 October–2 November 1979; Volume 2, pp. 25–35. [Google Scholar]
- Chen, L.; He, J.; Yao, B.; Lei, C.; Zhang, Z. Influence of the Initial Relative Density on the Drained Strength Properties of Soils Subjected to Internal Erosion. Soil Mech. Found. Eng. 2019, 56, 273–279. [Google Scholar] [CrossRef]
- Wang, S.; Luna, R.; Yang, J. Postcyclic behavior of low-plasticity silt with limited excess pore pressures. Soil Dyn. Earthq. Eng. 2013, 54, 39–46. [Google Scholar] [CrossRef]
- McDougall, J.; Kelly, D.; Barreto, D. Particle loss and volume change on dissolution: Experimental results and analysis of particle size and amount effects. Acta Geotech. 2013, 8, 619–627. [Google Scholar] [CrossRef]
- Fam, M.A.; Cascante, G.; Dusseault, M.B. Large and small strain proper ties of sands subjected to local void increase. J. Geotech. Geoenviron. Eng. 2002, 128, 1018–1025. [Google Scholar] [CrossRef]
- Shin, H.; Santamarina, J.C. Mineral dissolution and the evolution of k 0. J. Geotech. Geoenviron. Eng. 2009, 135, 1141–1147. [Google Scholar] [CrossRef]
- Truong, Q.H.; Eom, Y.H.; Lee, J.S. Stiffness characteristics of soluble mixtures. Géotechnique 2010, 60, 293–297. [Google Scholar] [CrossRef]
- Shirley, D.J.; Hampton, L.D. Shear-wave measurements in laboratory sediments. J. Acoust. Soc. Am. 1978, 63, 607–613. [Google Scholar] [CrossRef]
- Lee, J.-S.; Santamarina, J.C. Bender elements: Performance and signal interpretation. J. Geotech. Geoenviron. Eng. 2005, 131, 1063–1070. [Google Scholar] [CrossRef]
- Salgado, R.; Bandini, P.; Karim, A. Shear strength and stiffness of silty sand. J. Geotech. Geoenviron. Eng. 2000, 126, 451–462. [Google Scholar] [CrossRef]
- Eseller-Bayat, E.; Gokyer, S.; Yegian, M.; Deniz, R.; Alshawabkeh, A. Bender Elements and Bending Disks for Measurement of Shear and Compression Wave Velocities in Large Fully and Partially Saturated Sand Specimens. Geotech. Test. J. 2013, 36, 20120024. [Google Scholar] [CrossRef]
- Montoya, B.M.; Gerhard, R.; DeJong, J.T.; Wilson, D.W.; Weil, M.H.; Martinez, B.C.; Pederson, L. Fabrication, operation, and health monitoring of bender elements for aggressive environments. Geotech. Test. J. 2012, 35, 728–742. [Google Scholar] [CrossRef]
- Brandenberg, S.J.; Choi, S.; Kutter, B.L.; Wilson, D.W.; Santamarina, J.C. A bender element system for measuring shear wave velocities in centrifuge models. In Proceedings of the 6th International Conference on Physical Modeling in Geotechnics 2006, Hong Kong, China, 4–6 August 2006; pp. 165–170. [Google Scholar]
- da Fonseca Ferreira, C.M.; da Fonseca, A.J.P.V. International Parallel Tests on Bender Elements at the University of Porto, Portugal; University of Porto: Porto, Portugal, 2005. [Google Scholar]
- DeJong, J.T.; Fritzges, M.B.; Nüsslein, K. Microbially induced cementation to control sand response to undrained shear. J. Geotech. Geoenviron. Eng. 2006, 132, 1381–1392. [Google Scholar] [CrossRef]
- Fu, L.; Zeng, X.; Figueroa, J.L. Shear wave velocity measurement in centrifuge using bender elements. Int. J. Phys. Model. Geotech. 2004, 4, 1–11. [Google Scholar] [CrossRef]
- Terzaghi, K. Erdbaumechanik; Franz Deuticke: Vienna, Austria, 1925. [Google Scholar]
- Shire, T.; O’Sullivan, C.; Hanley, K.J.; Fannin, R.J. Fabric and Effective Stress Distribution in Internally Unstable Soils. J. Geotech. Geoenviron. Eng. 2014, 140, 04014072. [Google Scholar] [CrossRef]
- Dallo, Y.A.H.; Wang, Y.; Ahmed, O.Y. Assessment of the internal stability of granular soils against suffusion. Eur. J. Environ. Civ. Eng. 2013, 17, 219–230. [Google Scholar] [CrossRef]
- Moraci, N.; Mandaglio, M.C.; Ielo, D. Analysis of the internal stability of granular soils using different methods. Can. Geotech. J. 2014, 51, 1063–1072. [Google Scholar] [CrossRef]
- US. Army. Filter Experiments and Design Criteria; Technical Memorandum: Vickburg, MI, USA, 1953; Volume 52, pp. 3–360.
- Ladd, R.S. Preparing test specimens using undercompaction. Geotech. Test. J. 1978, 1, 16–23. [Google Scholar] [CrossRef]


| Gr | Fc | Rd | Soil Gradation | emax | emin | ||||
|---|---|---|---|---|---|---|---|---|---|
| D60 (mm) | D30 (mm) | D10 (mm) | Cu | Cc | |||||
| 5.2 | 15 | 30% | 1.8 | 1.4 | 0.19 | 9.5 | 5.7 | 0.70 | 0.44 |
| 60% | 1.8 | 1.4 | 0.19 | 9.5 | 5.7 | 0.70 | 0.44 | ||
| 90% | 1.8 | 1.4 | 0.19 | 9.5 | 5.7 | 0.70 | 0.44 | ||
| 3.2 | 25 | 60% | 1.5 | 0.7 | 0.14 | 10.7 | 2.3 | 0.63 | 0.40 |
| 5.2 | 30% | 1.7 | 1.3 | 0.14 | 12.1 | 7.1 | 0.67 | 0.36 | |
| 60% | 1.7 | 1.3 | 0.14 | 12.1 | 7.1 | 0.67 | 0.36 | ||
| 90% | 1.7 | 1.3 | 0.14 | 12.1 | 7.1 | 0.67 | 0.36 | ||
| 9.8 | 60% | 1.8 | 1.2 | 0.1 | 18.0 | 8.0 | 0.77 | 0.29 | |
| 5.2 | 35 | 30% | 1.6 | 0.25 | 0.12 | 13.3 | 0.3 | 0.62 | 0.38 |
| 60% | 1.6 | 0.25 | 0.12 | 13.3 | 0.3 | 0.62 | 0.38 | ||
| 90% | 1.6 | 0.25 | 0.12 | 13.3 | 0.3 | 0.62 | 0.38 | ||
| Tested Soil | Loading | Erosion | Initial Water Content | |
|---|---|---|---|---|
| Specimen | Vertical Pressure (kPa) | Inflow Velocity (mL/min) | Duration (min) | Percentage (%) |
| F15-G5.2-R60 | 27.56 | 600 | 120 | 6 |
| F25-G5.2-R60 | 27.56 | 610 | 117 | 6 |
| F35-G5.2-R60 | 27.56 | 600 | 122 | 6 |
| F25-G3.2-R60 | 27.56 | 590 | 122 | 6 |
| F25-G9.8-R60 | 27.56 | 605 | 119 | 6 |
| Sample Code | Mass Density | Frequency | Travel Time | Shear Wave Velocity | G0 |
|---|---|---|---|---|---|
| (kg/m3) | (kHz) | () | (m/s) | (MPa) | |
| F15-G5.2-R30 | 1.77 | 5.0 | 1250 | 70.40 | 8.76 |
| F25-G5.2-R30 | 1.82 | 5.3 | 1410 | 62.41 | 7.52 |
| F35-G5.2-R30 | 1.85 | 5.2 | 1490 | 59.06 | 6.47 |
| F15-G5.2-R60 | 1.86 | 5.0 | 1230 | 71.54 | 9.51 |
| F25-G5.2-R60 | 1.93 | 5.1 | 1300 | 67.69 | 8.84 |
| F35-G5.2-R60 | 1.94 | 5.1 | 1350 | 65.19 | 8.26 |
| F15-G5.2-R90 | 1.96 | 5.0 | 1190 | 73.95 | 10.70 |
| F25-G5.2-R90 | 2.06 | 5.1 | 1280 | 68.75 | 9.73 |
| F35-G5.2-R90 | 2.04 | 5.0 | 1310 | 67.18 | 9.22 |
Disclaimer/Publisher’s Note: The statements, opinions and data contained in all publications are solely those of the individual author(s) and contributor(s) and not of MDPI and/or the editor(s). MDPI and/or the editor(s) disclaim responsibility for any injury to people or property resulting from any ideas, methods, instructions or products referred to in the content. |
© 2024 by the authors. Licensee MDPI, Basel, Switzerland. This article is an open access article distributed under the terms and conditions of the Creative Commons Attribution (CC BY) license (https://creativecommons.org/licenses/by/4.0/).
Share and Cite
Dong, C.; Disfani, M.M. Impact of Gap-Graded Soil Geometrical Characteristics on Soil Response to Suffusion. Geotechnics 2024, 4, 337-349. https://doi.org/10.3390/geotechnics4010018
Dong C, Disfani MM. Impact of Gap-Graded Soil Geometrical Characteristics on Soil Response to Suffusion. Geotechnics. 2024; 4(1):337-349. https://doi.org/10.3390/geotechnics4010018
Chicago/Turabian StyleDong, Chen, and Mahdi M. Disfani. 2024. "Impact of Gap-Graded Soil Geometrical Characteristics on Soil Response to Suffusion" Geotechnics 4, no. 1: 337-349. https://doi.org/10.3390/geotechnics4010018