Article

Advancements in Understanding Interface Friction: A Combined Experimental and Machine Learning Approach Using Multiple Linear and Random Forest Regressions

by
Firas Daghistani
1,2 and
Hossam Abuel-Naga
1,*
1
Department of Civil Engineering, La Trobe University, Bundoora, VIC 3086, Australia
2
Department of Civil Engineering, University of Business and Technology, Jeddah 21448, Saudi Arabia
*
Author to whom correspondence should be addressed.
Geotechnics 2024, 4(1), 109-126; https://doi.org/10.3390/geotechnics4010006
Submission received: 7 December 2023 / Revised: 31 December 2023 / Accepted: 7 January 2024 / Published: 9 January 2024

Abstract

:
The interface friction between granular materials and continuum surfaces is fundamental in civil engineering, especially in geotechnical projects where sand of varying sizes and shapes contacts surfaces with different roughness and hardness. The aim of this research is to investigate the parameters that influence the peak interface friction, taking into consideration the properties of both sand and continuum surfaces. This will be accomplished by employing a combination of experimental and machine learning techniques. In the experiment, a series of interface shear tests were conducted using a direct shear apparatus under differing levels of normal stress and density. Utilising machine learning techniques, the study considered eleven input features: mean particle size, void ratio, specific gravity, particle regularity, coefficient of uniformity, coefficient of curvature, granular rubber content, carpet fibre content, normal stress, surface roughness, and surface hardness. The output measured was the peak interface friction. The machine learning techniques enable us to explore the complex relationships between the input features and the peak interface friction, and to develop an empirical equation that can accurately predict the interface friction. The experiment findings reveal that density, inclusion of recycled material, and normalised roughness impact peak interface friction. The machine learning findings validate the efficacy of both multiple linear regression and random forest regression models in predicting the peak interface friction, with the latter outperforming the former in terms of accuracy when compared to the experiment results. Furthermore, the most important features from both models were identified.

Graphical Abstract

1. Introduction

The study of the friction between surfaces is a branch of mechanical engineering known as tribology [1]. An interface is the point where two materials meet and interact, representing the common boundary between two surfaces. In geotechnical engineering, engineers frequently encounter interfaces between soil and various construction materials such as geomembranes, steel, concrete, polymers, wood, etc. The interaction between metals, such as steel and aluminium, and sand is observed in various geotechnical applications, including retaining walls, soil-nail walls, reinforced soil slopes, pile foundations, pipelines, sheet pile walls, cofferdams, etc. An experimental study by Su, Zhou [2] examined the effect of D50 on sand only, and the interface shear behaviour between dry sand and steel with different normalised roughness (Rn) values ranging from 1 to 2. Their experiment used a modified interface direct shear box apparatus with three sand samples of different D50 against a steel plate with constant hardness. The results show that changing D50 values had a greater effect on the internal friction angle of pure sand compared with the interface friction angle of the sand versus steel. This confirms the statement by Dove, Frost [3] that the soil/structure interface is often considered weaker than the shear strength of the soil.
The shape of sand particles can also influence interface mechanisms. In an experiment conducted by Vaid and Rinne [4], the interface friction between a PVC geomembrane and two different sand shapes (Ottawa: rounded, Target: angular) was studied using a ring shear apparatus under 100 kPa normal stress. The experiment showed that the angular-shaped particles (Target) had a slightly higher interface friction angle compared to the round-shaped particles (Ottawa). Interface friction is usually measured by the interface friction coefficient (μ), which is represented by Equation (1).
μ p = tan δ = τ p   σ n
where μ p is peak interface friction coefficient, τ p is interface shear strength, and σ n is normal stress. When examining the effect of particle size on interface shear strength characteristics, Frost and Han [5] studied the interface behaviour between sand and fibre-reinforced polymers. They concluded that the peak interface friction coefficient μp decreases as the mean grain size D50 increases. Vangla and Latha Gali [6] also investigated the effect of particle size on interface behaviour and found that when the particle size matches the asperity surface, higher interface shear strength is achieved due to the better interlocking of sand particles with the asperities. This led to the identification of an important factor among twenty-three different surface roughness parameters [7] known as normalised roughness (Rn), which links the granular material with the continuum counter-face surface. Normalised roughness can be defined as shown in Equation (2).
R n = R t D 50
where Rt is the relative vertical distance along a surface profile between the highest peak and lowest valley, and D50 is mean particle size. Kishida and Uesugi [8] recommended that the reference gauge length be equal to the D50 diameter of the granular sand.
Shaia and Abuel-Naga [9] proposed that the hardness of the counter-face material is a variable that can influence interface shear strength. They found that on the sand/fibre-reinforced polymer (FRP) interface, the Rnμp relationship depends on D50. In contrast, the Rnμp relationship on the sand/steel interface is D50 independent. This is because the difference in hardness between steel and FRP influences sand movement (ploughing resistance) during interface shear. Further investigation by Abuel-Naga, Shaia [10] demonstrated the coupling effect of normalised roughness and hardness on the peak interface friction coefficient where four different continuum counter-face surfaces (GFRP, copper, high carbon steel, and mild steel) interact with glass beads and sand. The results showed that μp increased as Rn increased where the percentage of the increase was dependent on hardness.
The interface friction coefficient can be impacted by many factors such as normal stress, the shape and size of the particles, gradation, void ratio, and continuum surface roughness and hardness. Despite these known factors, as yet, no detailed study that combines all of these into a single, easy-to-understand model has been conducted, mainly because these factors interact in complicated ways. In artificial intelligence, machine learning algorithms have helped solve complex problems in the geotechnical field, such as understanding soil mechanics behaviour [11,12,13] and improving the use of recycled materials in soil stabilisation [14,15,16,17,18,19].
Cevallos, Jerves [20] presents a research paper introducing a convolutional neural network (CNN) to enhance the image processing and segmentation of granular materials from 3D X-ray computed tomography scans. The paper discusses the development of original and improved image processing algorithms, details the CNN architecture and training process, and provides insights into CNN performance across various soil samples. The primary goal is to automate and streamline the creation of level set-based digital twins of individual grains for 3D level set discrete element method simulations, with potential applications in engineering and space exploration. The paper also addresses challenges and limitations of the approach while hinting at future directions. In another research article, a team led by Jain, Chhabra [21] introduces machine learning techniques to predict metamaterial microwave absorption performance. They propose a compact, ultra-thin metamaterial absorber exhibiting four distinct absorption peaks in X- and Ku-band applications. Multiple machine learning regression models, including decision trees, random forests, extra trees, and gradient boosting, are compared to optimise metamaterial absorber design and predictive modelling. Notably, the extra trees regressor emerges as the top-performing model in terms of accuracy, computational efficiency, and generalisation. Mital and Andrade [22] present a research paper outlining a data-driven framework utilising convolutional neural networks (CNNs) to bridge length scales in granular materials. Drawing an analogy between images and granular systems, the authors employ CNNs to uncover micromechanical relationships between grain-scale features and macroscopic properties like stress and strain. This framework is validated using experimental datasets of two-dimensional granular assemblies under uniaxial compression and simple shear. The study also explores the impact of factors like redundant features, noisy data, partial data, and time-biased data on framework performance, unveiling a new pattern discovered by the CNN model. Lastly, a research paper by Zhang, Yin [23] proposes a novel method for reconstructing 3D granular grains from CT images, with implications for studying the mechanical properties of granular soils. The method integrates a hybrid algorithm of particle swarm optimisation and random forest (PSO-RF) for grain classification and segmentation, alongside a convolution kernel and level set method for grain identification and reconstruction. Experimental testing on representative CT slice images with various types of grains demonstrates the method’s high accuracy and efficiency in grain segmentation and reconstruction, surpassing traditional watershed algorithms. This approach is versatile and capable of handling challenges such as image noise, over-segmentation, and identification across different grain sizes and shapes.
The application of machine learning for predicting the interface friction coefficient of granular materials, considering the aforementioned factors, has not been sufficiently investigated. This study aims to fill this gap by conducting and analysing a series of interface shear tests across different granular sizes and shapes. To achieve this aim, we employ both multiple linear regression (MLR) and random forest regression (RFR) models, which are powerful machine learning techniques for regression analysis. The models used eleven input features to predict the peak interface friction: mean particle size (D50), void ratio (e), specific gravity (Gs), particle regularity ( r ), coefficient of uniformity (Cu), coefficient of curvature (Cc), granular rubber content (GRC), carpet fibre content (CFC), normal stress (σn), surface roughness (Rt), and surface hardness (HD). The research then presents an empirical equation for predicting the interface friction coefficient, considering the eleven input features. Finally, after careful examination of the results of the models, the study presents the most effective model and investigates the significance of the inputs involved in each model. This study provides a strong base for a deep investigation into a new area that has not previously been explored.

2. Materials and Methods

2.1. Material

In this experiment, we utilised various granular materials, including sand, which was categorised according to Australian Standards [24] as fine sand (B1-Sand), medium sand (B4-Sand), and coarse sand (B6-Sand). Additionally, we used glass beads (GB5), which have a sphericity and roundness equal to 1. Furthermore, we created mixtures of sand with recycled materials, including granular rubber (GR-A) and carpet fibre (CF).
The GR-A had a size range of 2.36 to 0.075 mm. The CF had lengths ranging from 15 mm to 25 mm, averaging 20 mm, with a specific gravity of 1.64. The granular rubber content varied, consisting of 10%, 20%, and 50% of the sand–rubber mixture’s dry weight. The carpet fibre content was made up of 0.25%, 0.5%, and 1% of the sand–carpet fibre mixture’s dry weight. The content of granular rubber and carpet fibre in the mixture was quantified using Equations (3) and (4), respectively.
G R C = M G R M T o t a l
C F C = M C F M T o t a l
where GRC is the granular rubber content, MGR is the mass of granular rubber, MTotal is the mass of the mixture, and CFC and MCF represent the carpet fibre content and the mass of carpet fibre, respectively. The size ratio of the sand–rubber mixture, calculated by dividing the D50 of the rubber by the D50 of the sand, was found to be 0.29. Consequently, the experiment encompassed a range of particle sizes and shapes, as well as sand mixed with recycled material including granular rubber and carpet fibre material. Details regarding the properties of the granular materials utilised are presented in Table 1, and a sieve analysis, conducted in accordance with Australian Standards [25], can be seen in Figure 1.
Three continuum surfaces were used: two steel surfaces with different roughness levels, and one aluminium plate with a smooth surface. The surface roughness (Rt) of these materials was determined using a stylus profilometer, an instrument designed to accurately measure surface texture. Furthermore, the surface hardness (HD) was measured using the Vickers hardness test, a method that evaluates material hardness based on the ability to resist plastic deformation from a standardised force. The properties for the used continuum materials are shown in Table 2.

2.2. Methods

A Matest direct shear apparatus was used to measure the interface friction. Two holes were created on each continuum surface to link it with the top mould of the direct shear. This setup aids in preparing the sample at different densities without disturbing it before placement in the apparatus. After maintaining normal stress on the granular sample for 10 min, two screws were used to lift the top mould. This ensured that the interface shear occurred between the continuum surface and the granular material, preventing contact with the edges of the top mould, as illustrated in the schematic diagram in Figure 2. The interface shear tests conducted on dry samples followed the Australian Standards [26] with a shear rate of 1 mm/min. The normal stresses applied were 25, 50, 100, and 200 kPa. Each sample was prepared anew for every normal stress to determine the peak interface friction. This led to a total of 108 tests for different granular materials, at different densities, and on different continuum surfaces, under various normal stresses.
For the granular sand sample, the density was achieved using the sand raining technique. In the sand–GR mixture and sand–CF mixture, the density was attained by applying a specific amount of compaction energy [27]. Equation (5) was used to determine the energy applied to reach the density required in this study.
E = N b l o w s . N l a y e r s . W h a m m e r . H d r o p V m o l d
where E, Nblows, Nlayers, Whammer, Hdrop, and Vmold represent the input compaction energy, the number of blows per layer, the number of compaction layers, the weight of the hammer, the height of the hammer drop, and the volume of the mould, respectively. An energy of 476 kJ was applied to achieve the desired density. The compaction energy parameters for the sand–recycled material mixture can be found in Table 3.
Two separate ML methods, MLR and RFR, are used for comparative analysis in machine learning. This comparison provides valuable insights into the strengths and limitations of each method when applied to a dataset. For instance, while MLR may excel in terms of simplicity and interpretability, RFR can offer a more robust model in the presence of complex, non-linear relationships. The eleven input features selected for the machine learning models are based on properties of both the granular material and the continuum surface that affect peak interface friction. Each feature is explained in the table (Table 4) below.

3. Results and Discussion

The peak interface friction is found to be impacted by D50, shape, gradation of the granular material, the inclusion of recycled material, and the roughness and hardness of the continuum surface. The results of the experiment are shown in the appendix in Table A1.

3.1. Internal versus Interface Friction

As the normal stress increases, both the shear strength of the sand alone and the friction of the sand interface with the continuum surface increase, as shown in Table 5. However, it was observed that the friction of granular sand alone is significantly greater when compared to its interface friction with steel surfaces. These findings are consistent with the work of Su, Zhou [2]. Furthermore, the friction at the sand/rough steel interface shows higher peak friction compared to the sand/smooth steel interface, though not as high as that of sand alone, which exhibits the highest shear strength.

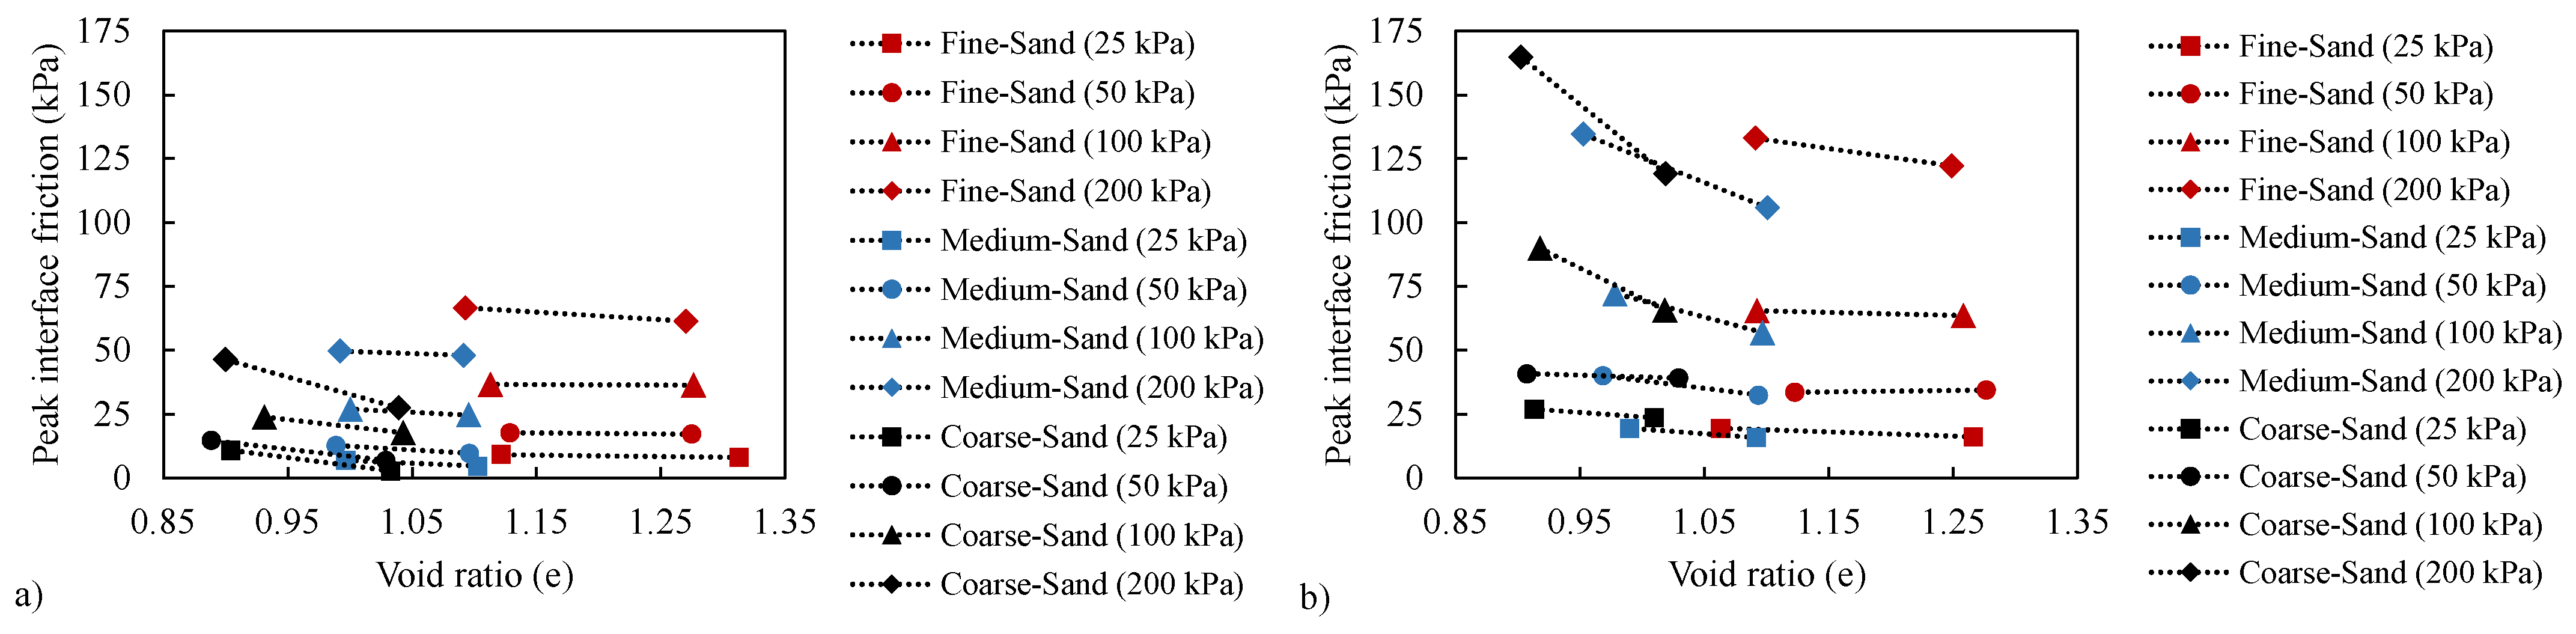
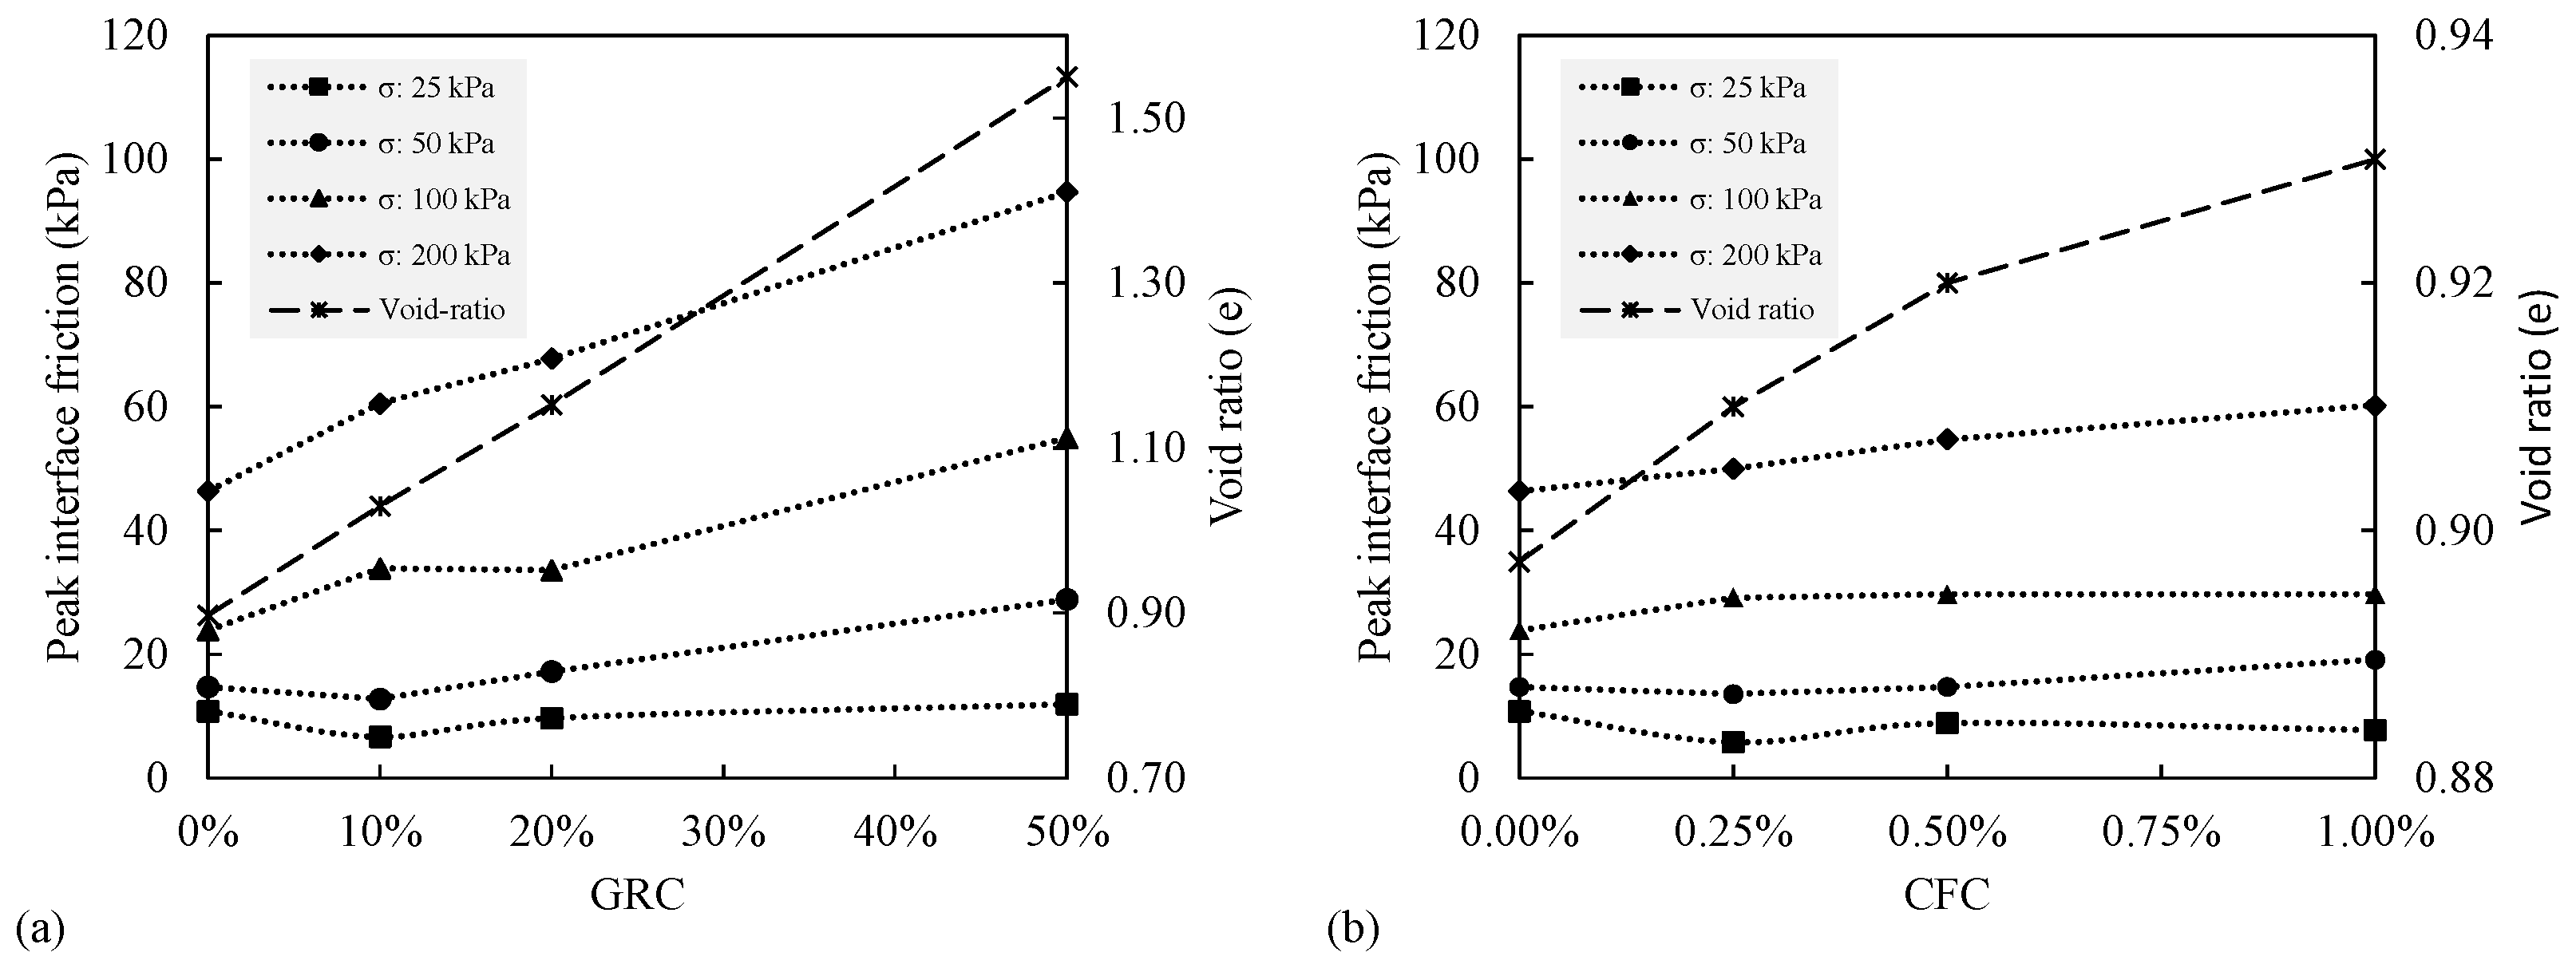
3.2. Void Ratio Impact

Theoretically, the void ratio of the granular sample can impact the peak interface friction at the sand/smooth steel surface interface. This can be explained by the fact that the dense sample has a higher number of grains interfacing with the continuum surface compared to the loose sample, as shown in Figure 3. Furthermore, a well-graded sample has a high density and low void ratio. Consequently, it has a larger contact surface area and higher peak interface friction.
Experimentally, to measure the impact of the void ratio only, uniform glass beads were used. The impact of particle shape and size was neglected due to the similarity in the shape and size of the glass beads. The samples were prepared at two different densities: loose state and dense state. The results, as shown in Figure 4, indicate that the dense sample produced higher peak interface friction at different normal stresses compared to the loose sample.

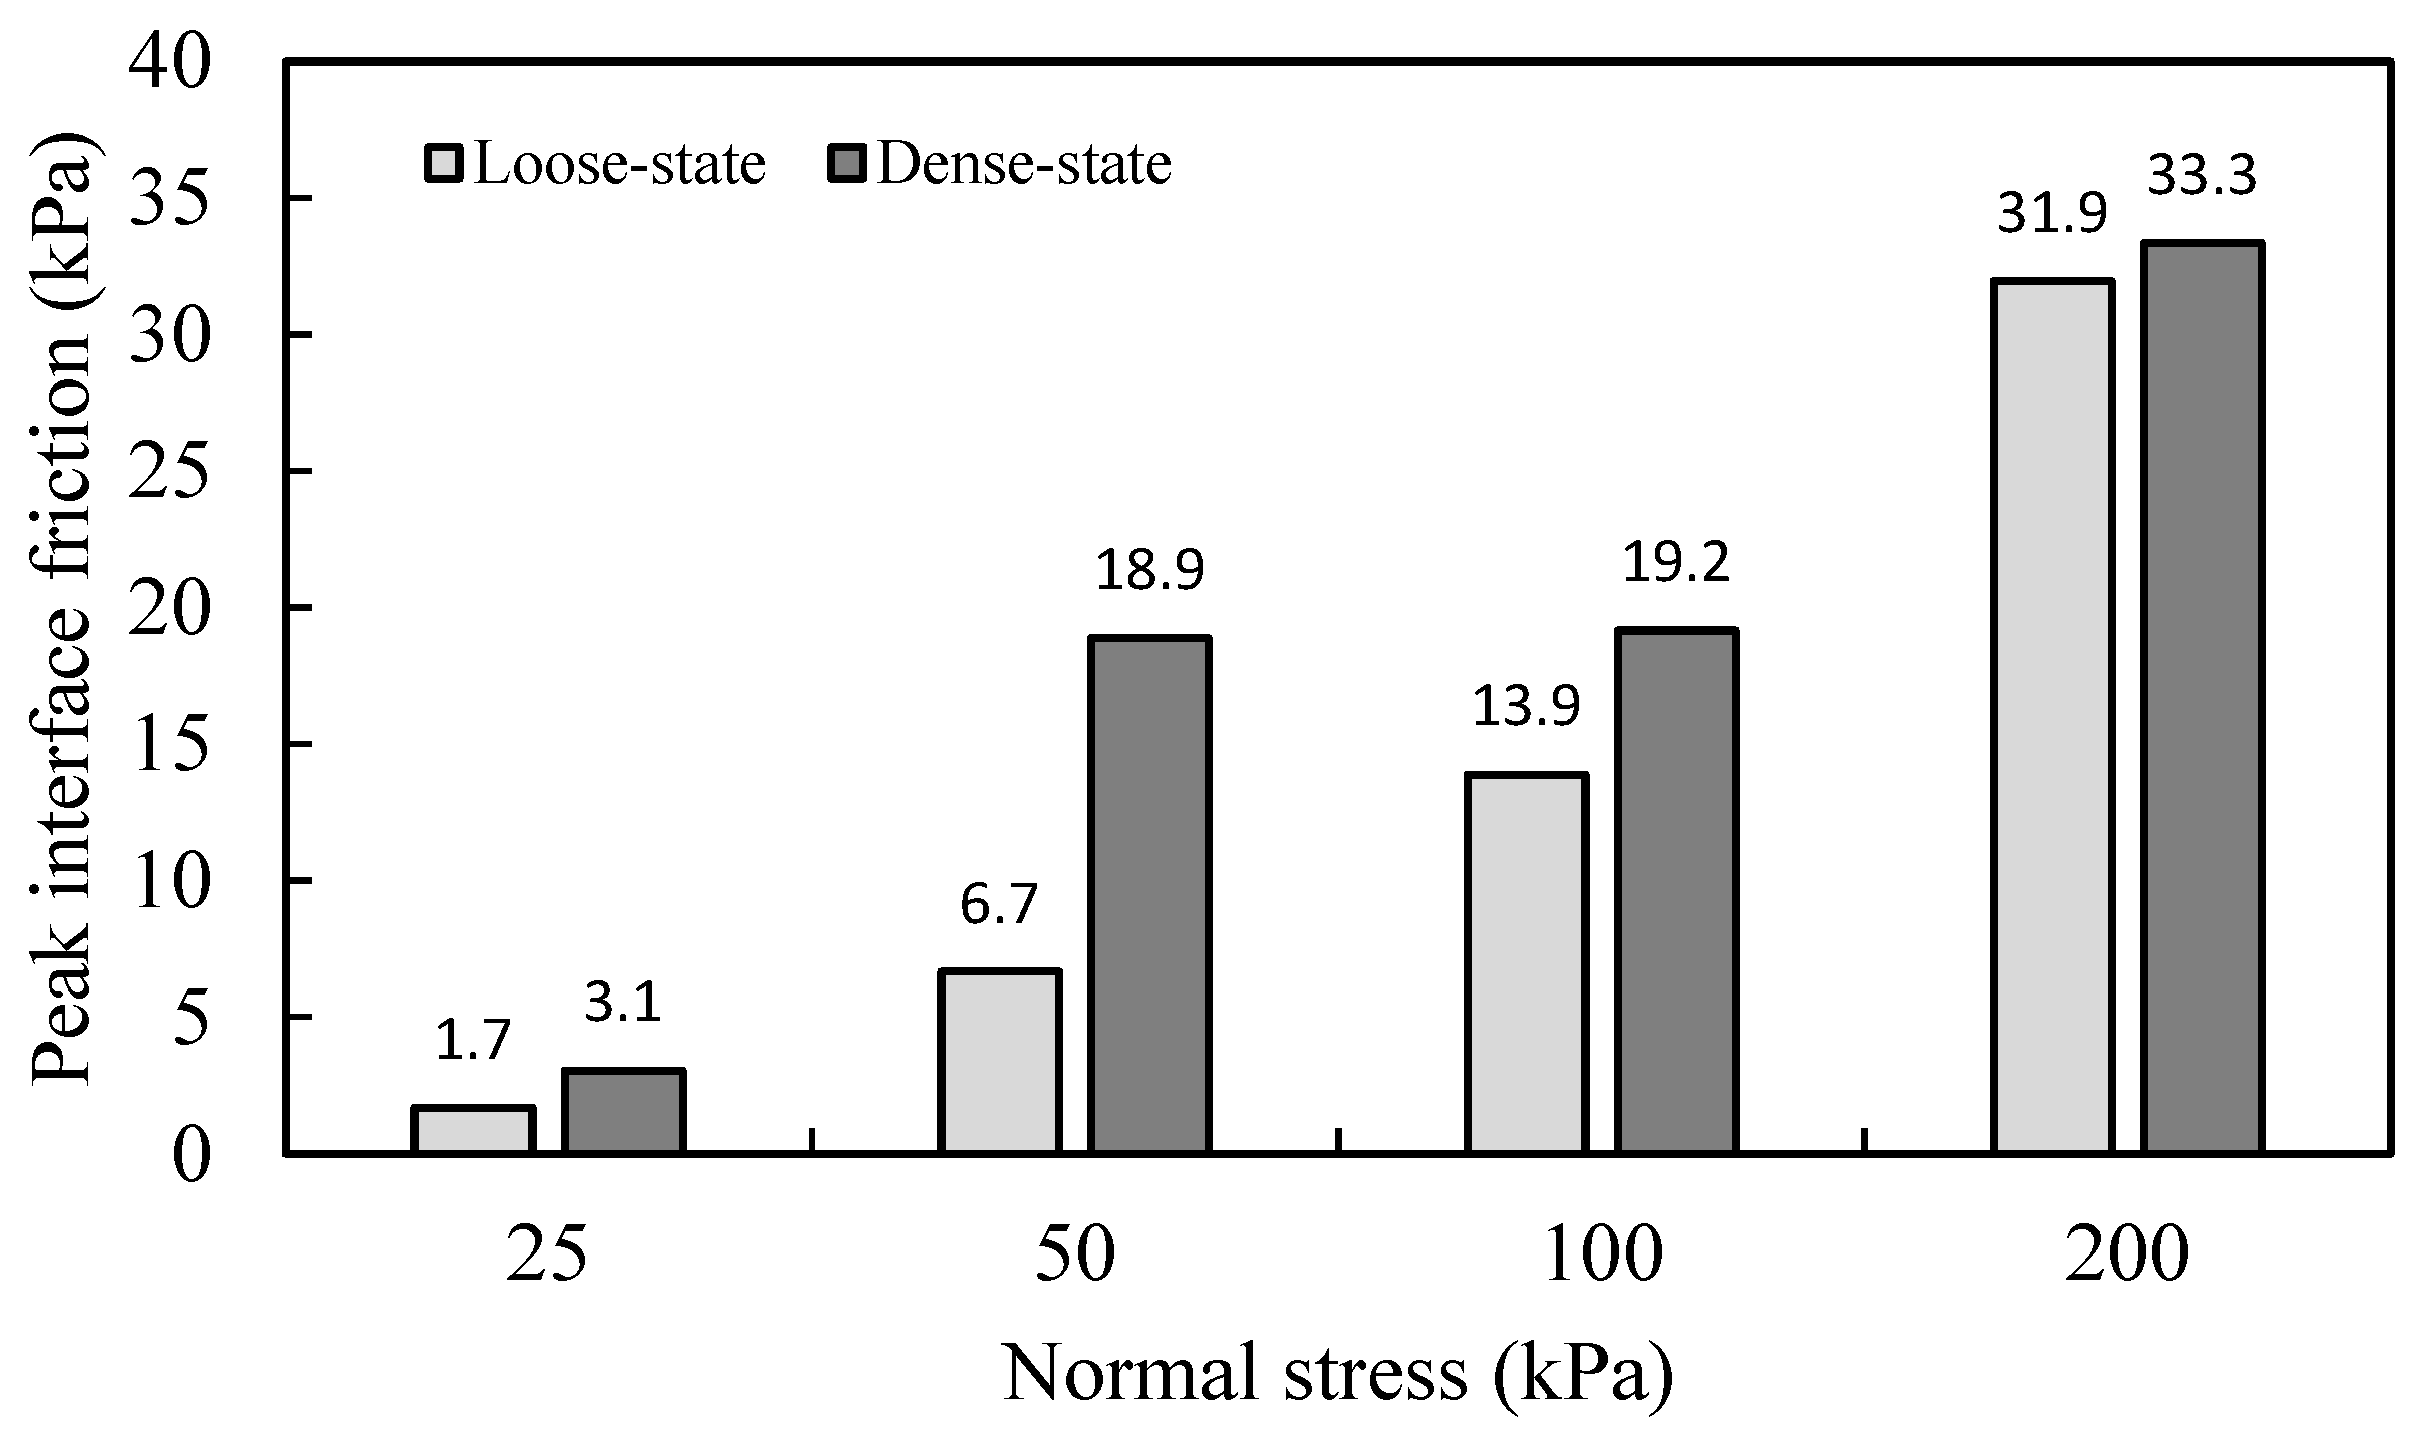
3.3. Peak Interface Friction

In the peak interface friction between sand and smooth and rough steel surfaces, as shown in Figure 5, the rough steel shows significantly higher peak interface friction compared with the smooth steel. Furthermore, the impact of the void ratio becomes clearer on the coarser sample, where the increase in peak interface friction is higher, specifically at high normal stresses.
The particle shape and orientation with the continuum surface have an impact on the peak interface friction and are considered important parameters, as shown in Figure 6. For this specific particle shape, when the particle is flat on the surface, it has a larger contact area and more frictional resistance. Conversely, when the particle is perpendicular to the surface, it has a smaller contact area and less frictional resistance.

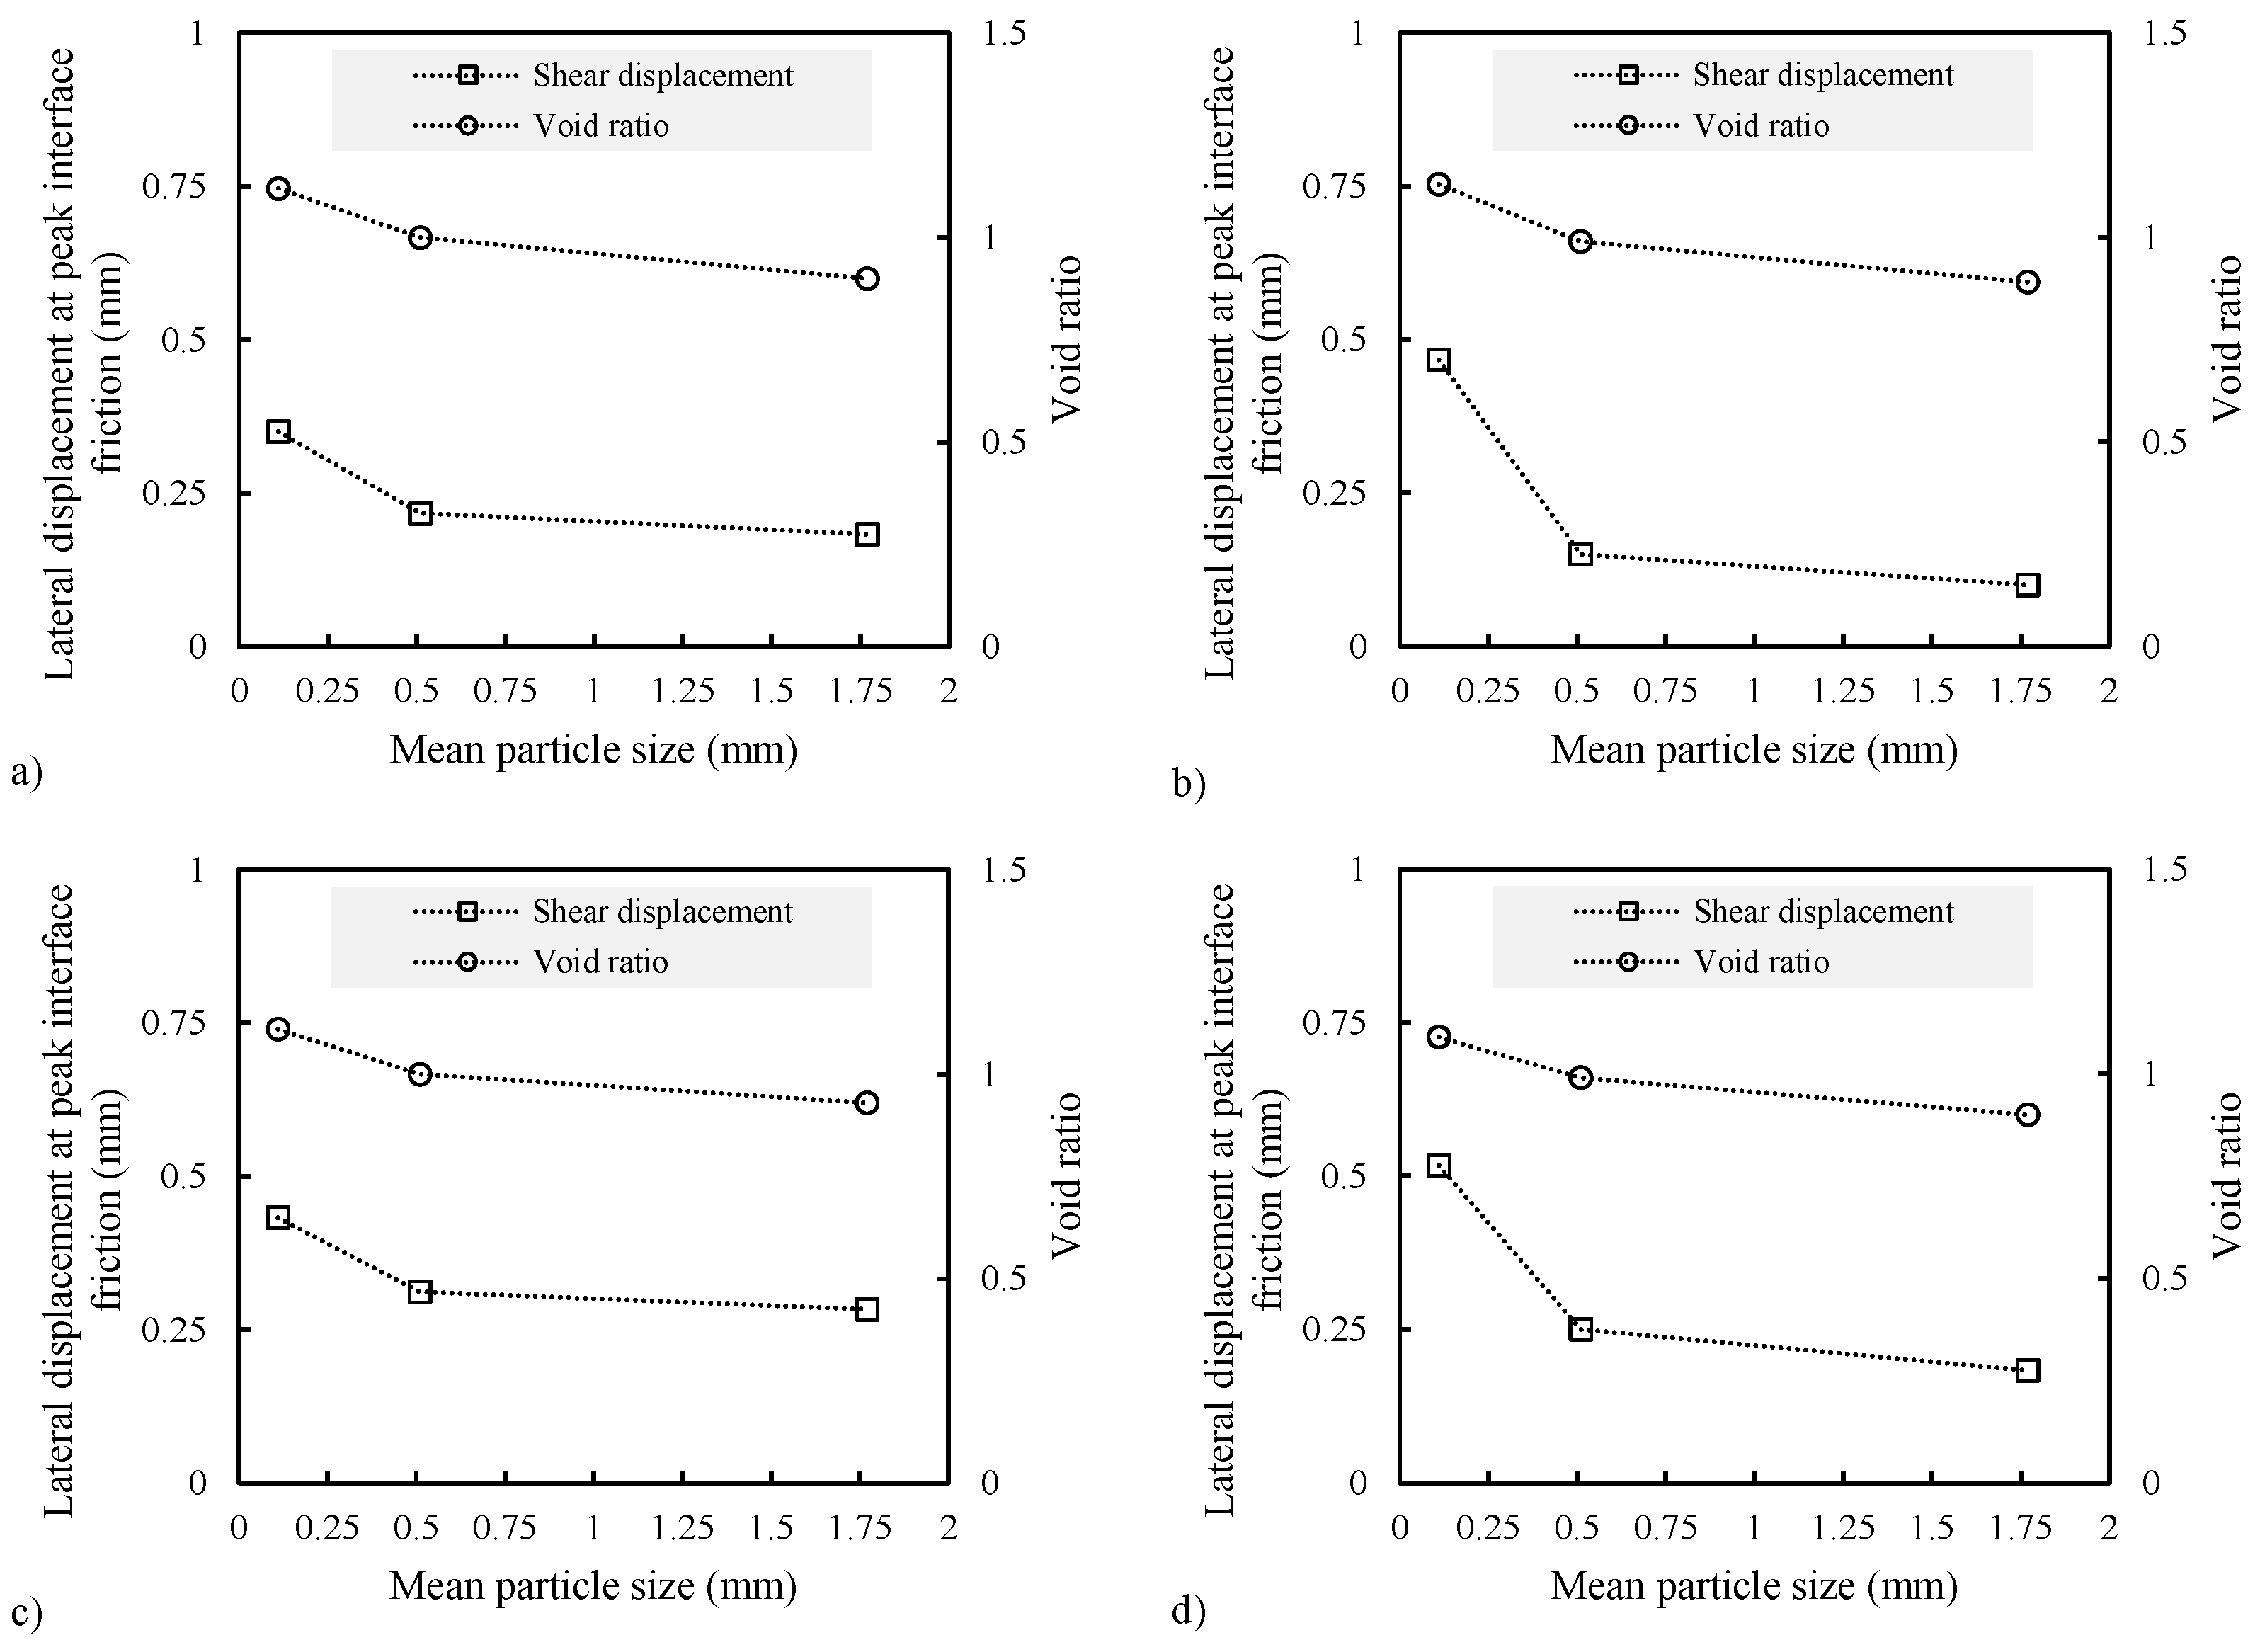
3.4. Lateral Displacement versus Peak Interface Friction

The coarser sand samples reach their peak interface frictional resistance at a smaller displacement compared to medium and fine sand, as illustrated in Figure 7. This can be explained by the fact that coarser samples have a lower void ratio between their particles, which is especially noticeable near the interface with the continuous surface, thus allowing them to reach their peak interface friction faster in comparison to medium and fine sand.

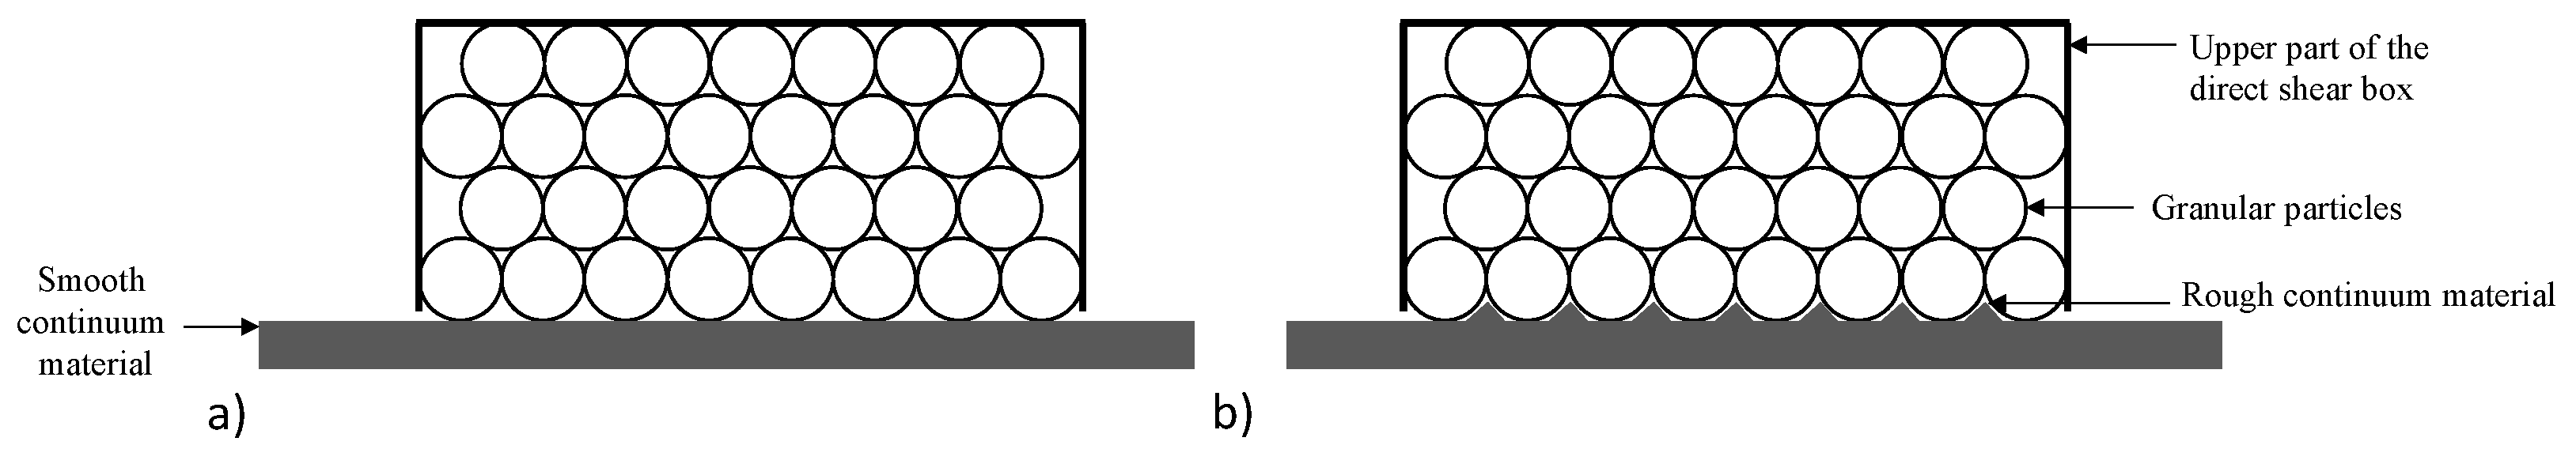
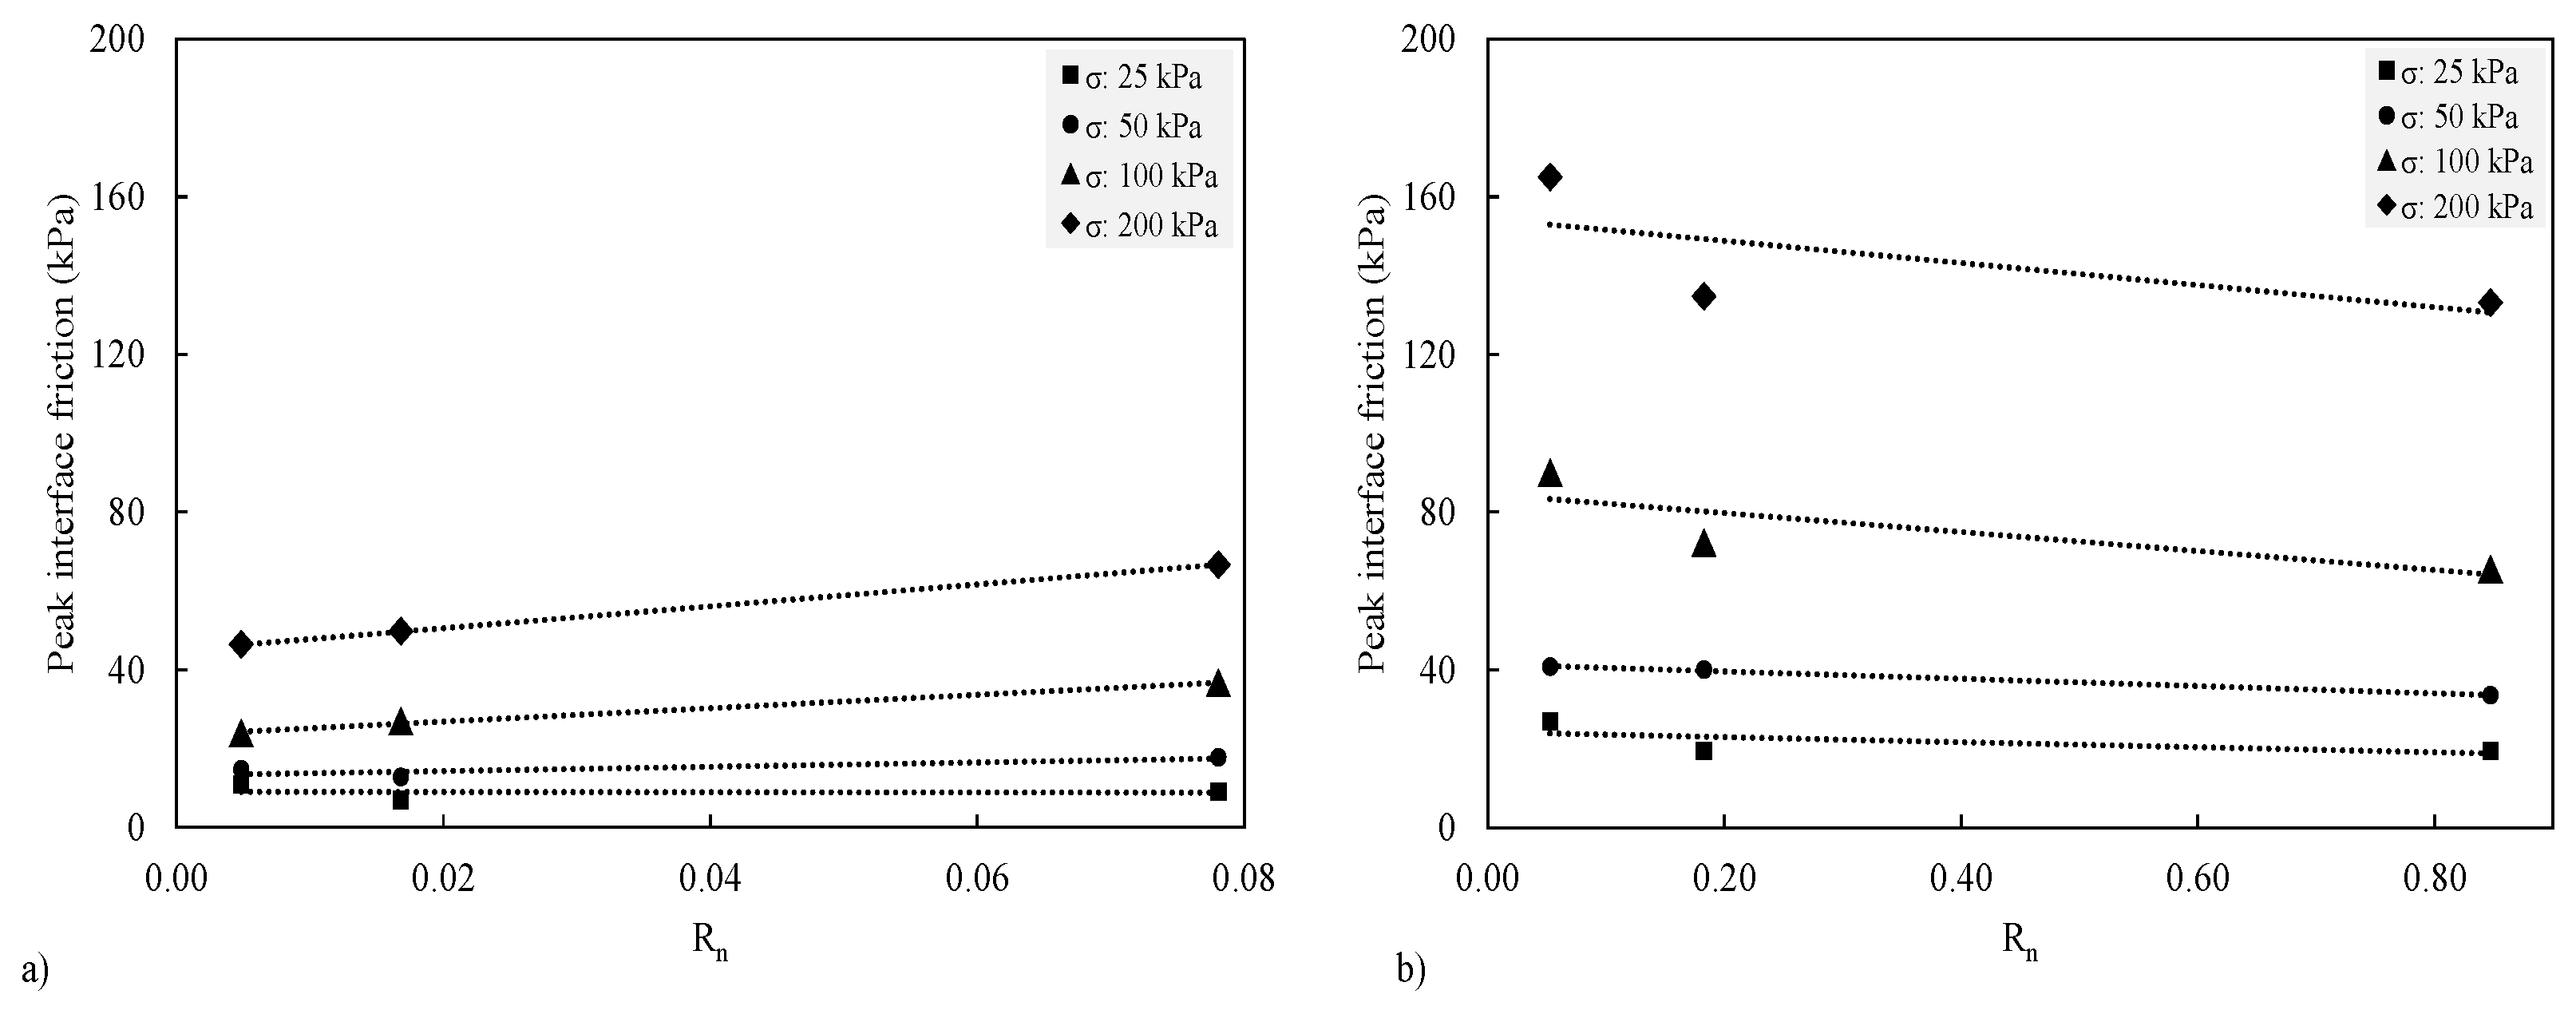
3.5. Normalise Roughness

The degree of surface roughness on a continuum surface significantly influences the frictional resistance it experiences when encountering granular particles. Rougher surfaces tend to exhibit higher interface shear resistance due to the granular interlock occurring within the asperities of the continuum surface as shown in Figure 8.
The normalised roughness parameter, which is the ratio of Rt to D50, accounts for variations in granular size and surface roughness. As the normalised roughness increases, different effects on smooth and rough steel surfaces are observed as shown in Figure 9. The experiment used sands with different mean particle sizes (fine, medium, and coarse sand). On smooth steel, friction increases due to the finer particles achieving better contact with the smooth surface. In contrast, on rough steel, particles initially create higher friction by interlocking with the surface texture, however, as the normalised roughness increases, friction decreases. The coarsest sand has the highest friction, due to the particles effectively interlocking with the surface’s asperities. As the particle size decreases (meaning normalised roughness increases), there is a notable decrease in shear friction. This suggests that the particles move more freely, potentially beginning to roll, rather than firmly sticking to the asperities as with coarser sand.

3.6. Sand–Recycled Material/Steel Interface

The addition of recycled materials, such as granular rubber and carpet fibre to sand influences the void ratio and peak interface friction, as shown in Figure 10. In the sand–granular rubber (sand–GR) mixture, the angular and irregular shape of granular rubber typically increases the void spaces upon their addition. In the case of the sand–carpet fibre (sand–CF) mixture, the inclusion of fibres maintains separation between sand particles, thereby contributing to an increased void ratio.
In the sand–GR/smooth steel interface, the peak interface friction increases with a greater amount of GRC, especially under higher normal stress conditions. For example, at a normal stress of 200 kPa, the peak interface friction increases significantly from 46.39 kPa at 0% GRC to 94.72 kPa at 50% GRC, revealing a heightened resistance to shearing at the interface. This resistance is further highlighted by the noticeable increase in friction values as normal stress increases from 50 kPa to 100 and 200 kPa, with the most significant increases noted at GRCs above 20%. For GRCs of 20%, the friction values increase from 17.22 kPa at a normal stress of 50 kPa to 33.61 kPa and 67.78 kPa at normal stresses of 100 kPa and 200 kPa, respectively. Further, in the sand–CF/smooth steel interface, the peak interface friction experiences a slight enhancement with incremental increases in CFC. Without CFC, the peak friction at 200 kPa stress is 46.39 kPa, whereas adding 0.25% CFC increases the peak interface friction to 50 kPa and further to 60.28 kPa at 1% CFC. This shows that a small amount of CFC can slightly enhance interface friction.

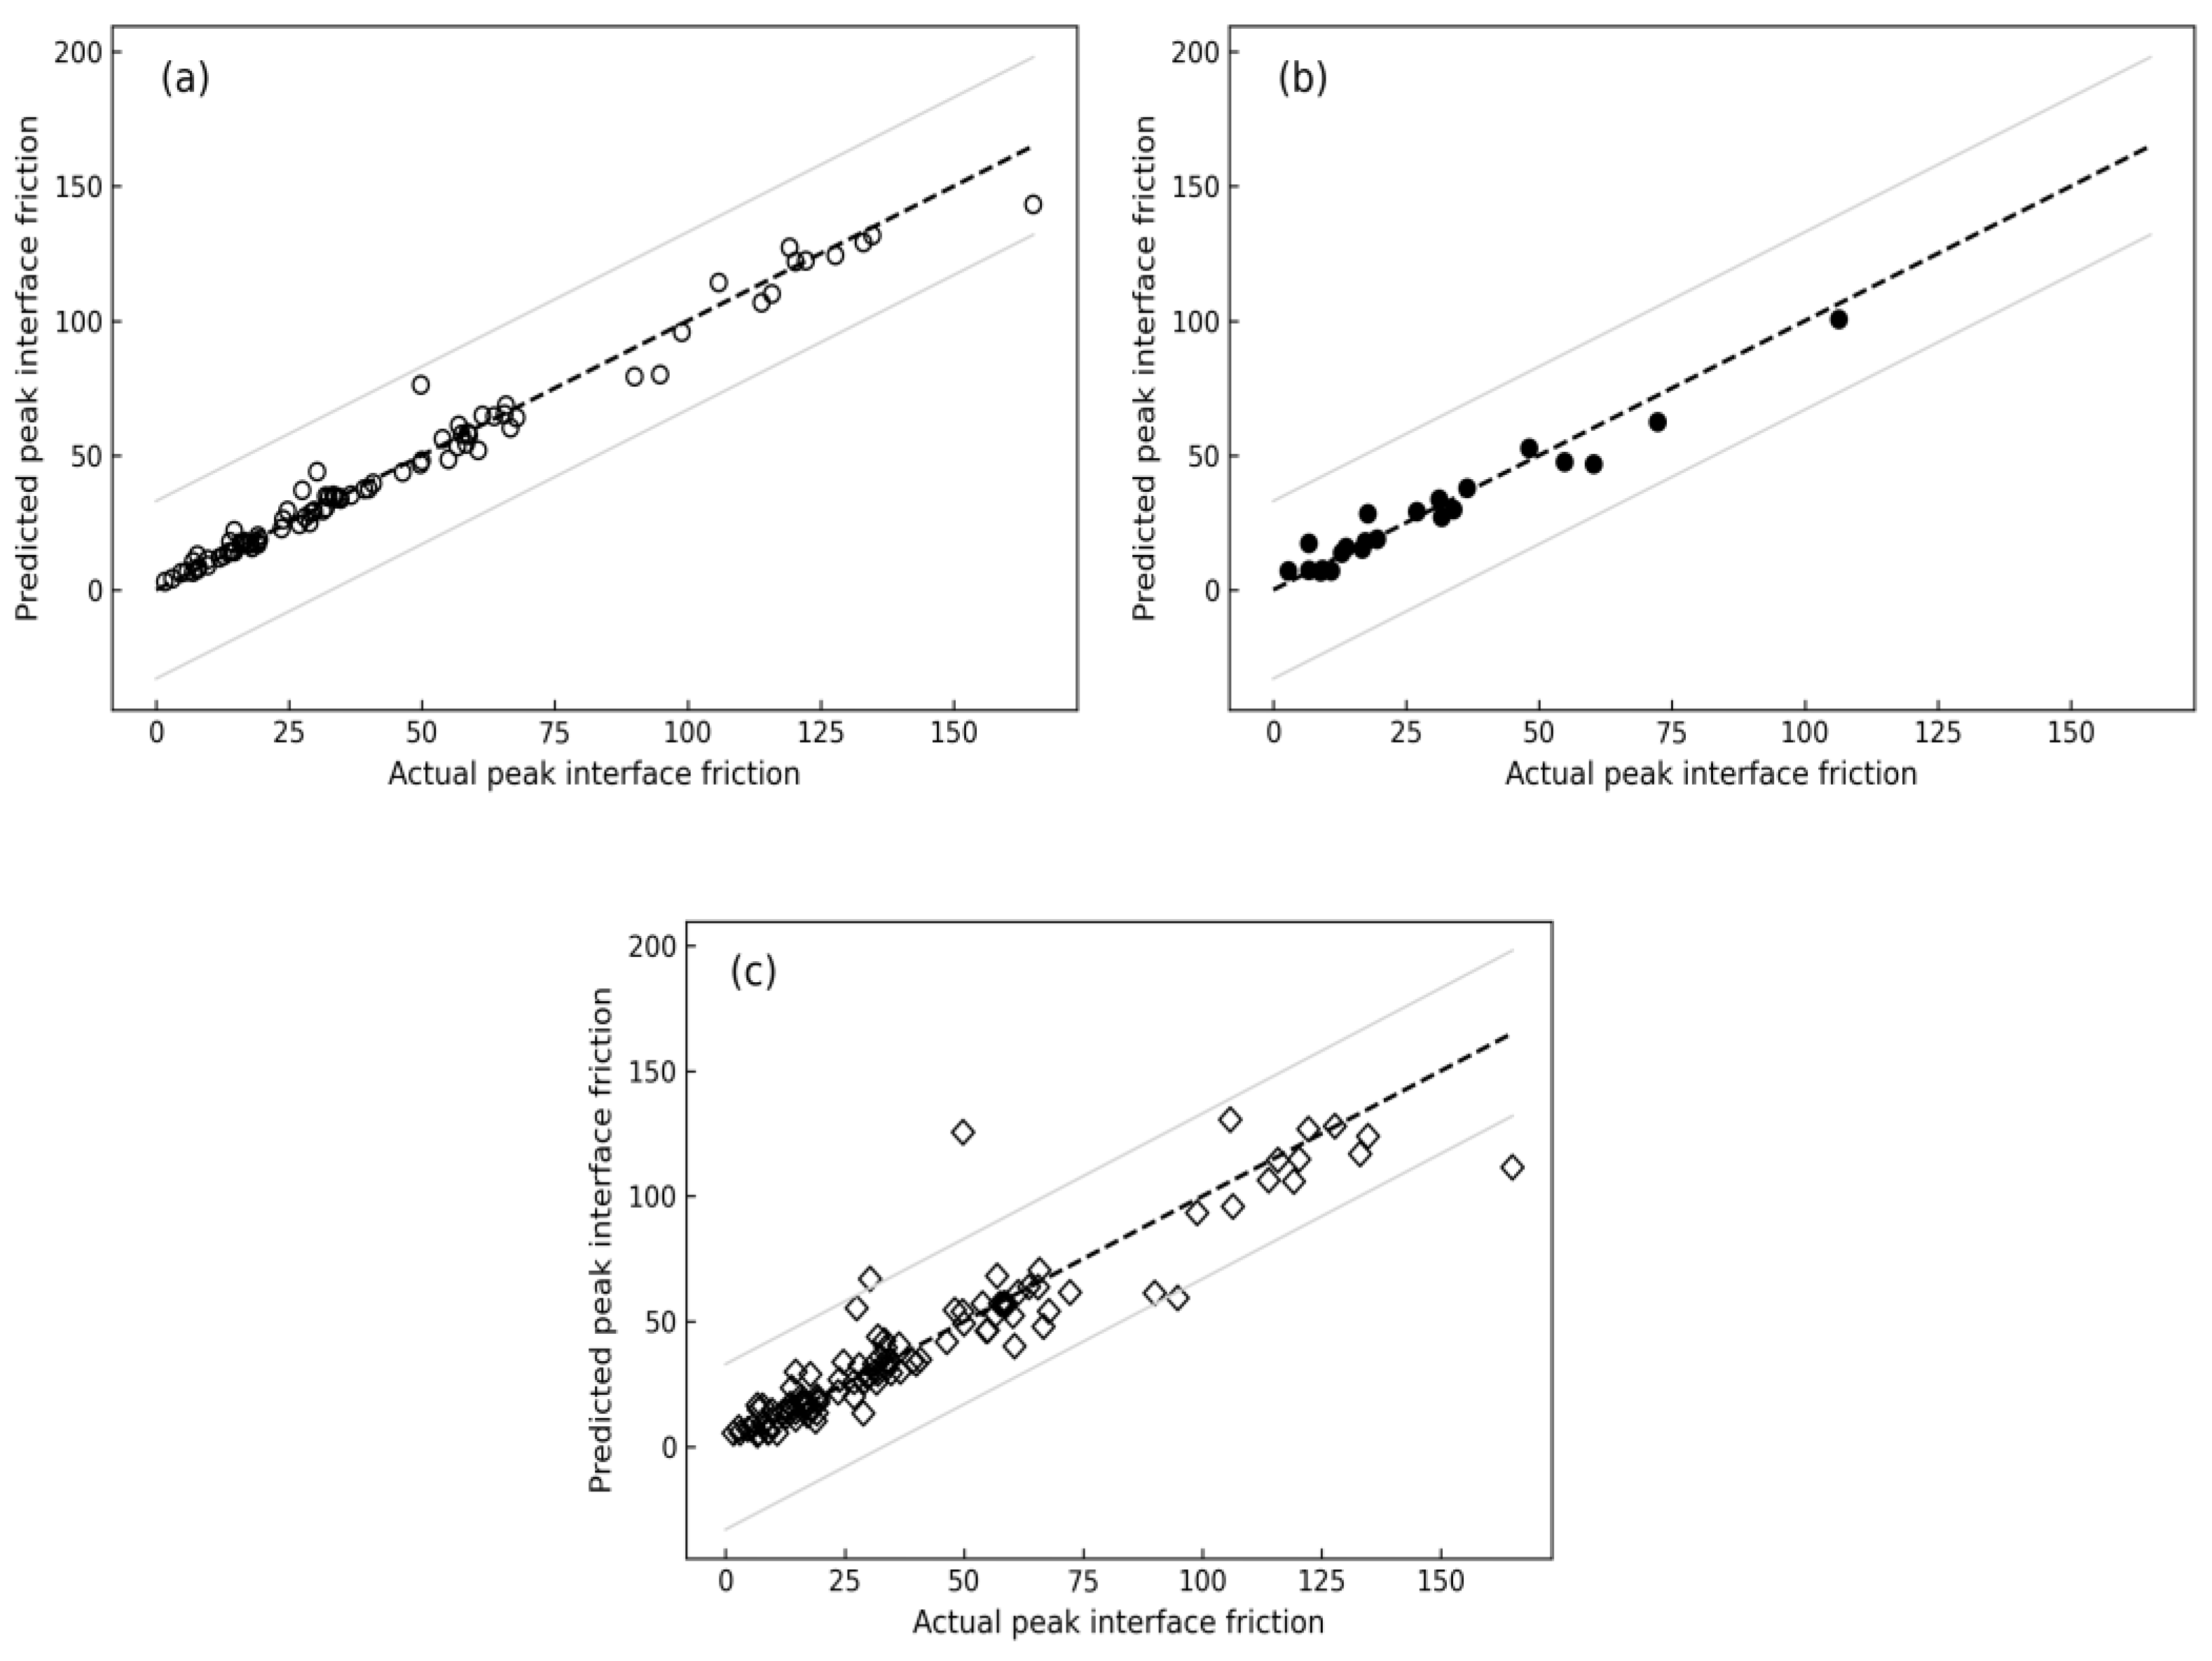
3.7. Multiple Linear Regression

The MLR algorithm was applied to the interface experiment results using the Python language. The code utilises the scikit-learn library with the default hyperparameter values. The numerical hyperparameters that were set for pre-processing data, feature importance estimation, and the visualisation process are displayed in Table 6.
Figure 11 compares the predicted values obtained by the MLR model during training, testing, and 10-fold CV with the actual experiment values. The results show that the MLR model has good accuracy.
An MLR model was used to predict the peak interface friction, as indicated in Table 7, which outlines the metrics from the training, testing, and 10-fold CV datasets. The model’s performance in terms of MAE showed it to be more accurate during the testing phase with a value of 12.59, compared to the training and cross-validation phases, which scored 10.20 and 11.22, respectively. The RMSE presented a contrasting trend, with the training phase scoring 13.79, the testing phase slightly higher at 14.73, and the 10-fold CV showing the highest error at 15.16. The R² values underscore the model’s fitness, with a commendable 0.86 in the training phase, dipping to 0.65 in the testing phase, and slightly increasing to 0.81 in the CV phase. These figures suggest that while the MLR model is generally accurate, its predictive performance varies across different phases, with the testing phase experiencing a dip in R² despite the lower MAE. Overall, the MLR model demonstrates a reasonable degree of precision in its predictions. As a result, an empirical equation has been developed using the eleven input features to accurately estimate the peak interface friction. The equation (Equation (6)), developed from the training dataset, is as follows:
τ p = 48.76 18.91 × D 50 47.15 × e + 0.24 × G s 33.80 × r + 129.76 × C u 23.02 × C c 75.80 × G R C + 8.91 × C F C + 73.99 × σ n + 41.90 × R t ( 24.43 × H D )
where τ p is the peak interface friction, D 50 is the mean particle size, e is the void ratio, G s is specific gravity, r is particle regularity, C u is the coefficient of uniformity, C c is the coefficient of curvature, GRC is the granular rubber content, CFC is the carpet fibre content, σ n is normal stress, R t is surface roughness, and H D is surface hardness.

3.8. Random Forest Regression

An RFR algorithm was applied to the interface experiment results using the Python language. The code utilises the scikit-learn library with the default hyperparameter values. The numerical hyperparameters that were set for pre-processing data, model, and the visualisation process are displayed in Table 8.
A comparison between the actual and predicted values of peak interface friction for training, testing, and the 10-fold CV method is shown in Figure 12. The results show that the RFR model is highly accurate.
The metrics derived from the training, testing, and 10-fold CV data show that the model predicts peak interface friction with excellent accuracy, as shown in Table 9. In the training phase with 86 observations, the RFR model demonstrates outstanding performance, evidenced by an R² value of 0.98 and minimal errors (MAE of 3.20, RMSE of 5.43, RMSLE of 0.12). During the testing phase with 22 observations, there was a slight increase in errors, yet the model maintained high predictability with an R² of 0.95. Finally, in the 10-fold cross-validation with 108 observations, the error metrics increased (MAE of 7.16, RMSE of 12.81, RMSLE of 0.31), but the model still achieved a strong R² of 0.87.

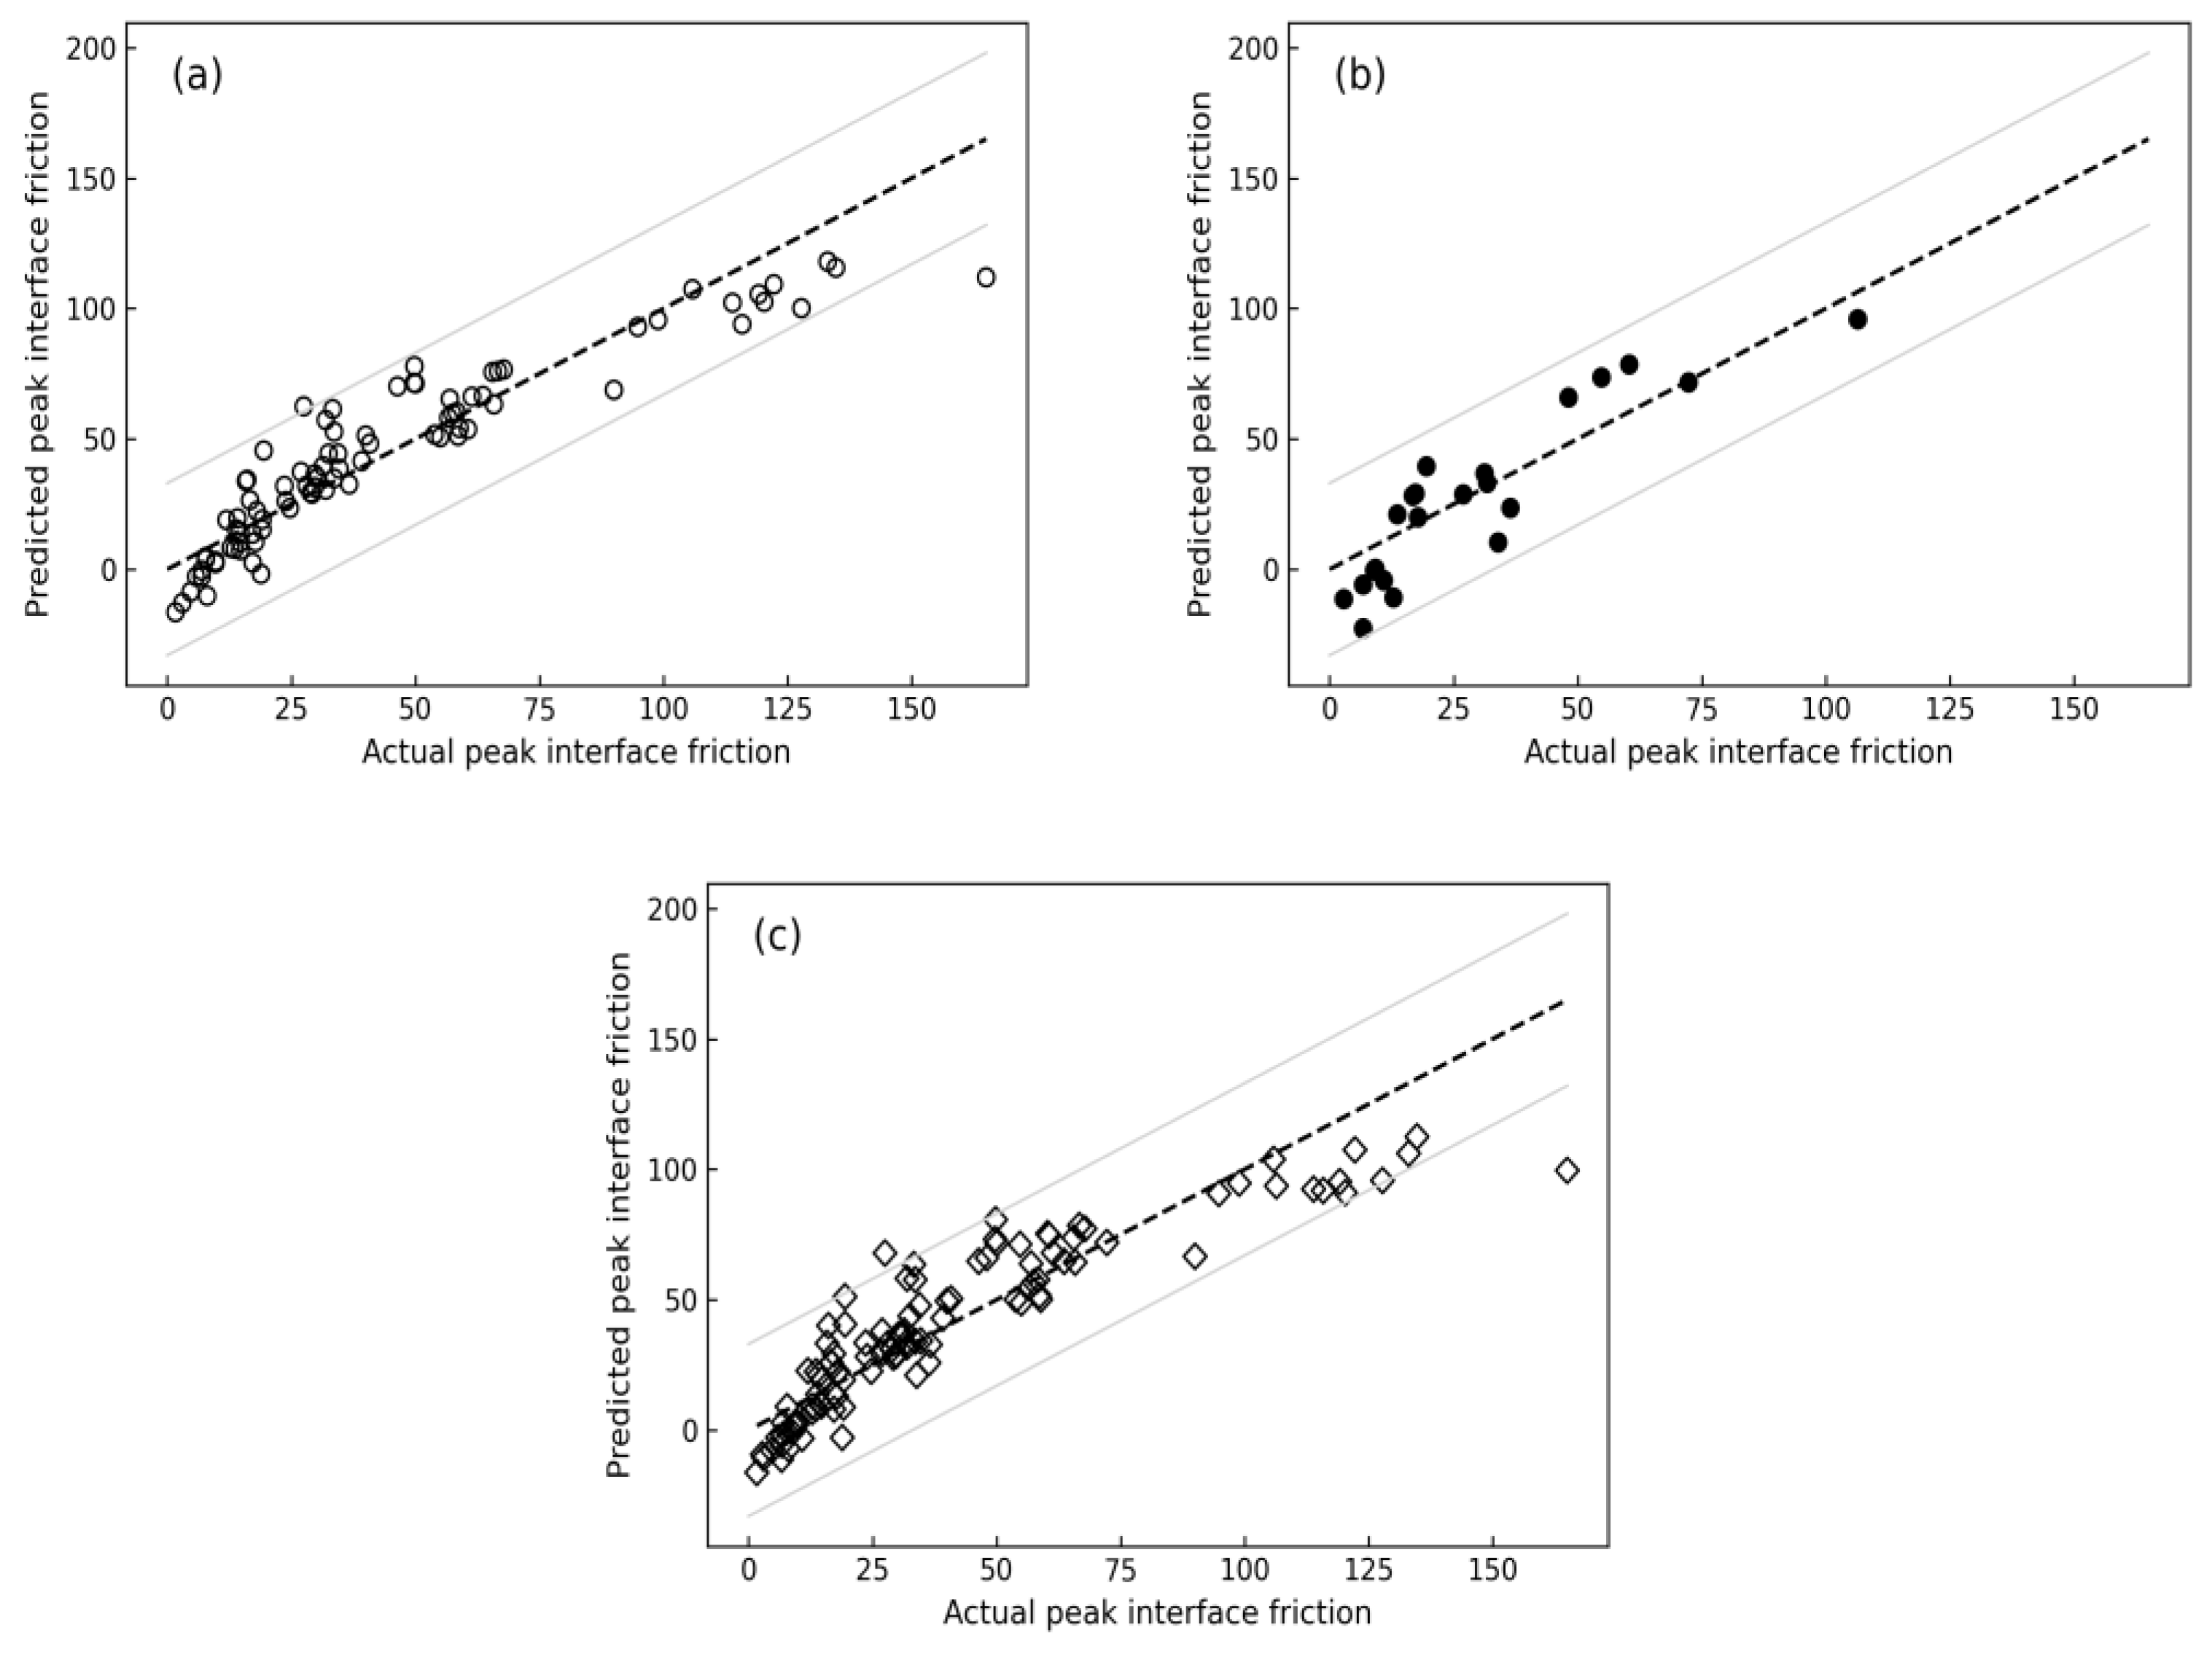
3.9. Method Comparison

An assessment of the performance metrics between the MLR and RFR models reveals different trends in predicting peak interface friction, as summarised in Table 10. In the training dataset, RFR is better than MLR with significantly lower error measurements: the MAE in MLR is 10.20 whereas it is 3.20 in RFR, while the RMSE drops from 13.79 to 5.43, and the RMSLE reduces from 0.49 to 0.12. Correspondingly, the R² value for RFR is an impressive 0.98, which is notably higher than the 0.86 in MLR, highlighting the RFR model’s enhanced precision in predictions.
The high-performance pattern of RFR continues into the testing dataset, where despite a general rise in error rates, RFR continues to demonstrate its strength. It achieves a lower MAE of 4.30 compared to MLR’s 12.59, and a reduced RMSE of 5.65 against 14.73 in the MLR model. In terms of R², RFR maintains its superiority with a score of 0.95, a marked improvement over the 0.65 of the MLR. The RMSLE for RFR in this phase is also indicative of its higher accuracy, at 0.27 as opposed to MLR’s 0.88.
During the 10-fold CV phase, both models experience elevated error rates. However, the gap in performance narrows slightly, with the RFR model recording an MAE of 7.16 and RMSE of 12.81, which are still lower than the MLR’s corresponding values of 11.22 and 15.16. The RFR model has an R² of 0.87 compared to 0.81 in the MLR model, suggesting that RFR has a stronger predictive capability even when subjected to cross-validation. In summary, the RFR model outperforms the MLR model across all metrics in training, testing, and 10-fold CV phases.

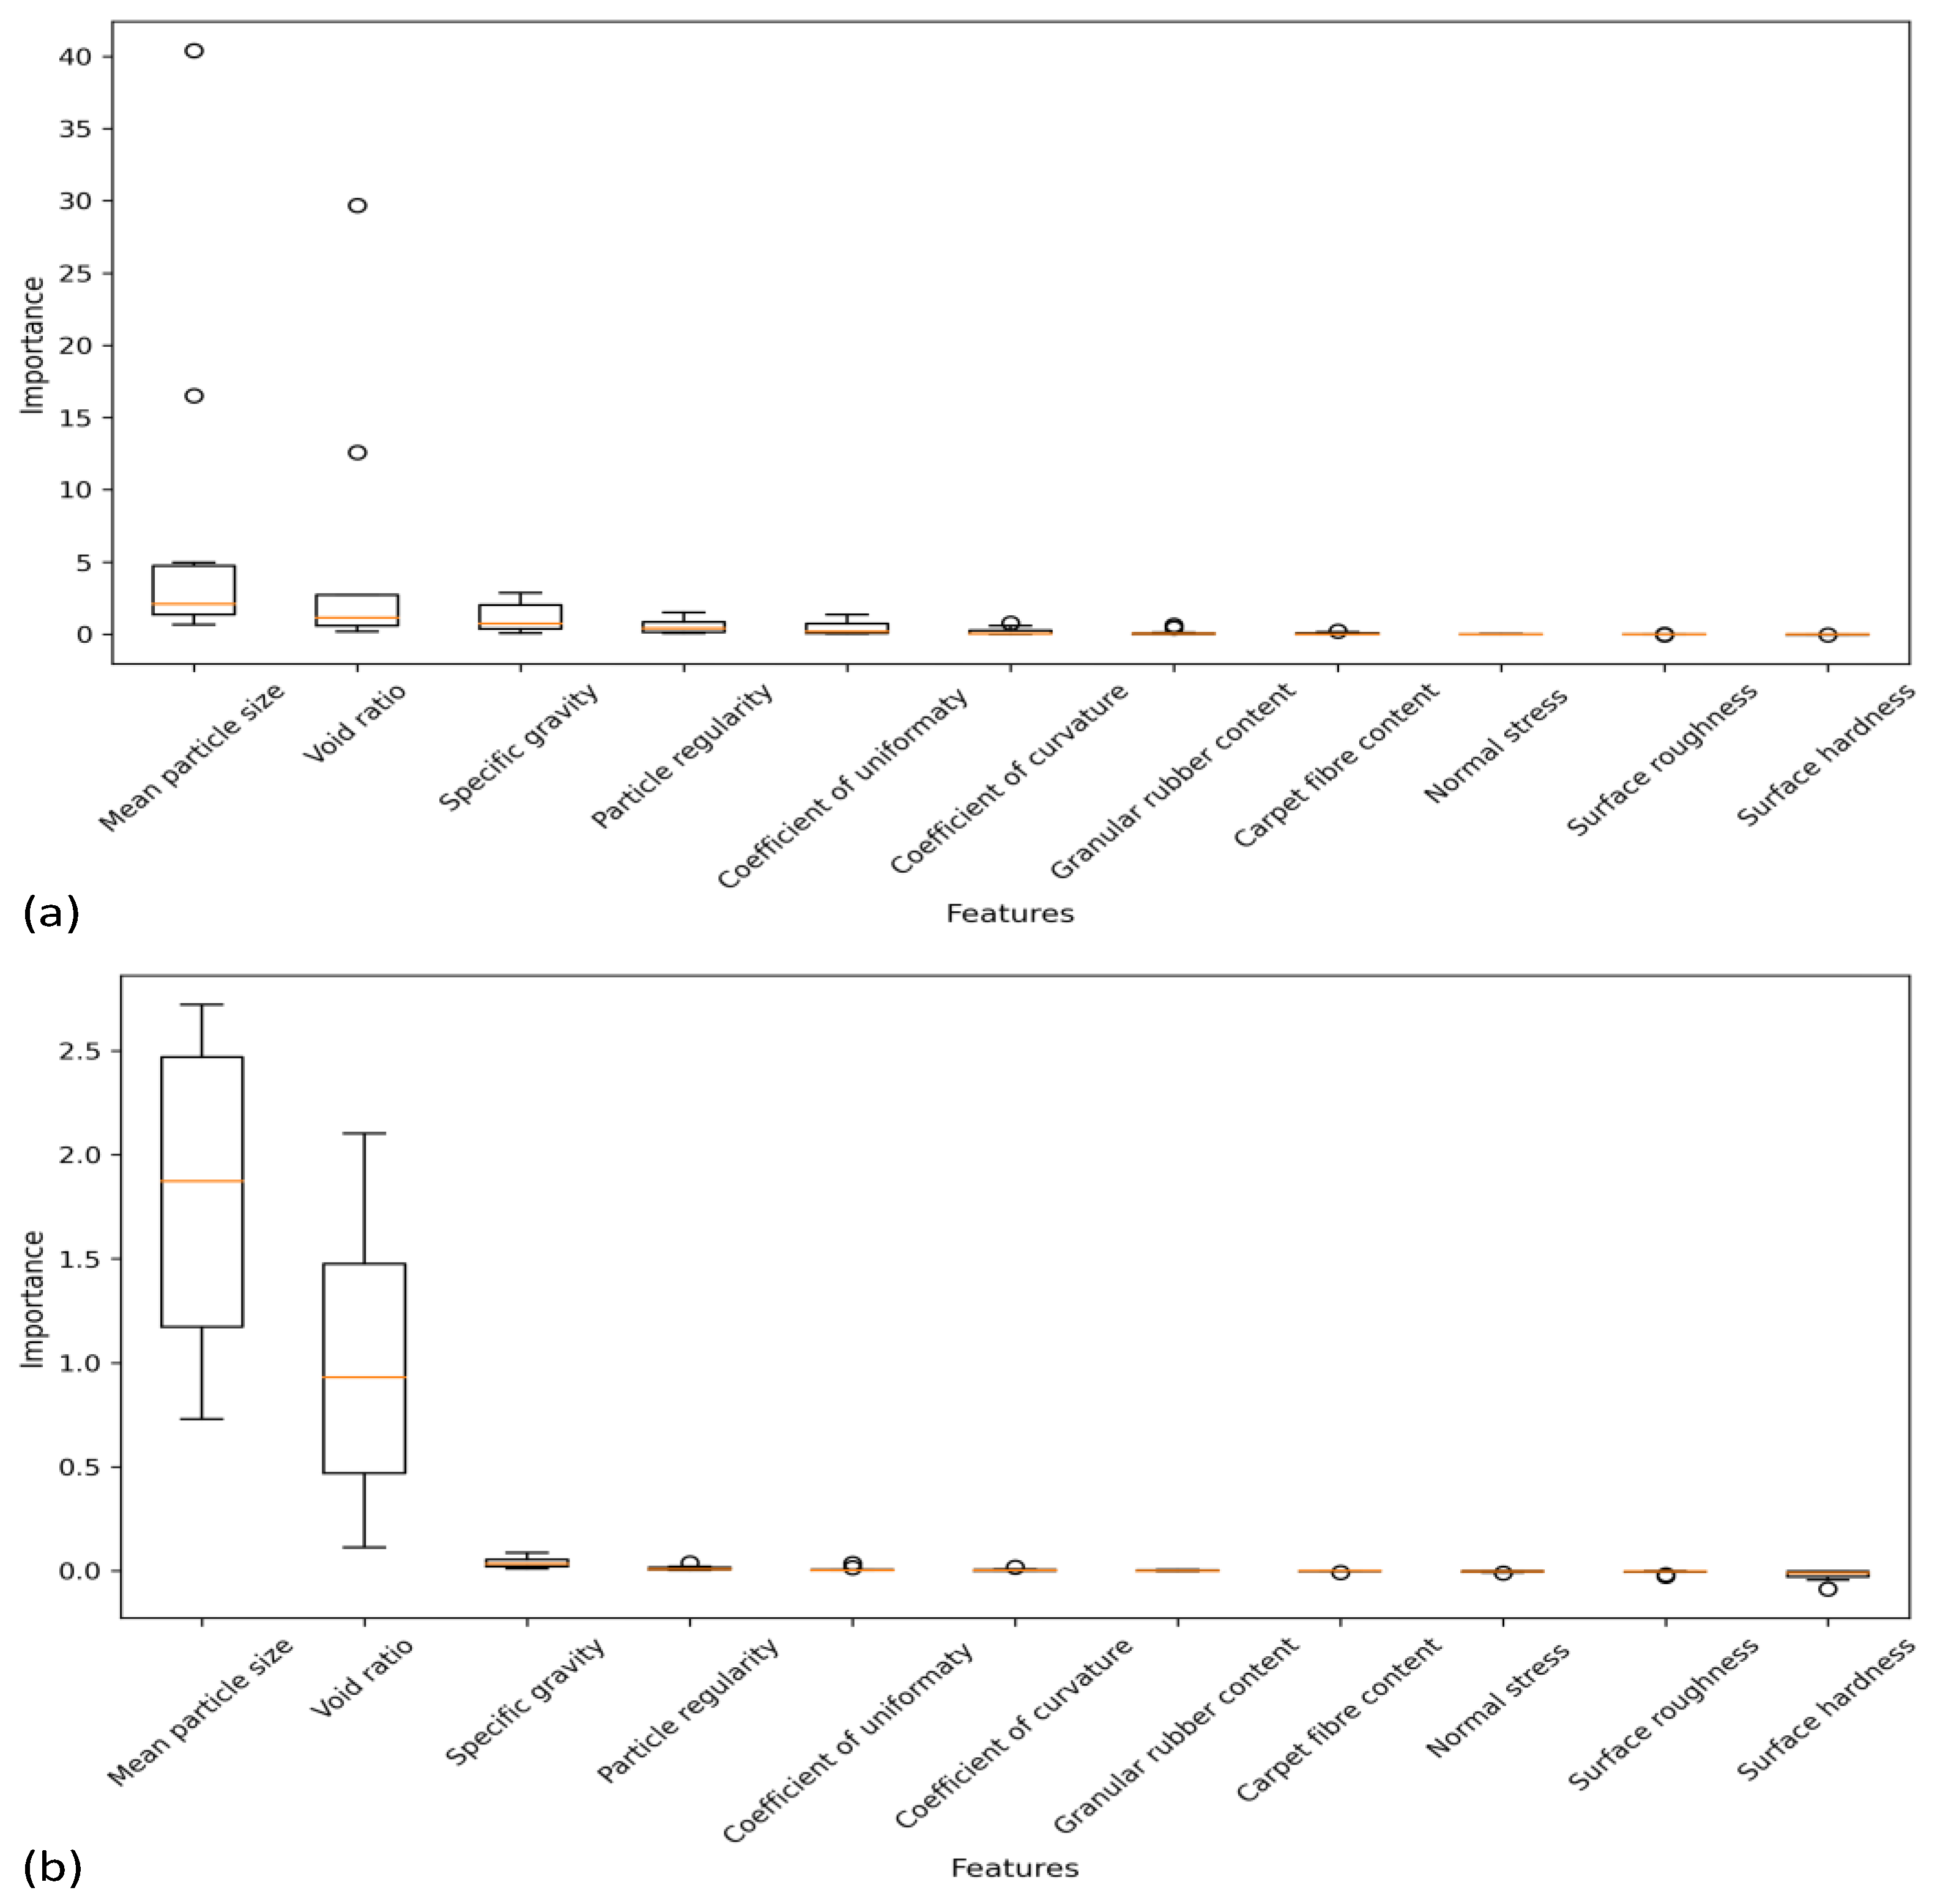
3.10. Importance of Features

In this study, we utilise machine learning algorithms, specifically MLR and RFR, to analyse and predict the relationship between eleven input features namely: D 50 , e , G s , r , C u , C c , GRC, CFC, σ n , R t , and H D and one output variable τ p . Figure 13 shows that both the MLR and RFR models with the 10-fold cross-validation method identify D 50 as the most important feature and e follows as the second most influential parameter.

4. Conclusions

This study investigated the influence of different granular materials, recycled materials, and continuum surfaces on the peak interface friction using experiments and machine learning approaches. The findings can be summarised in the following points:
  • An increase in sample density leads to higher interface friction by reducing the void ratio, which, in turn, increases the contact surface and enhances friction.
  • The shear strength of the sand markedly exceeds the peak interface friction shown at both the sand/smooth steel and sand/rough steel interfaces.
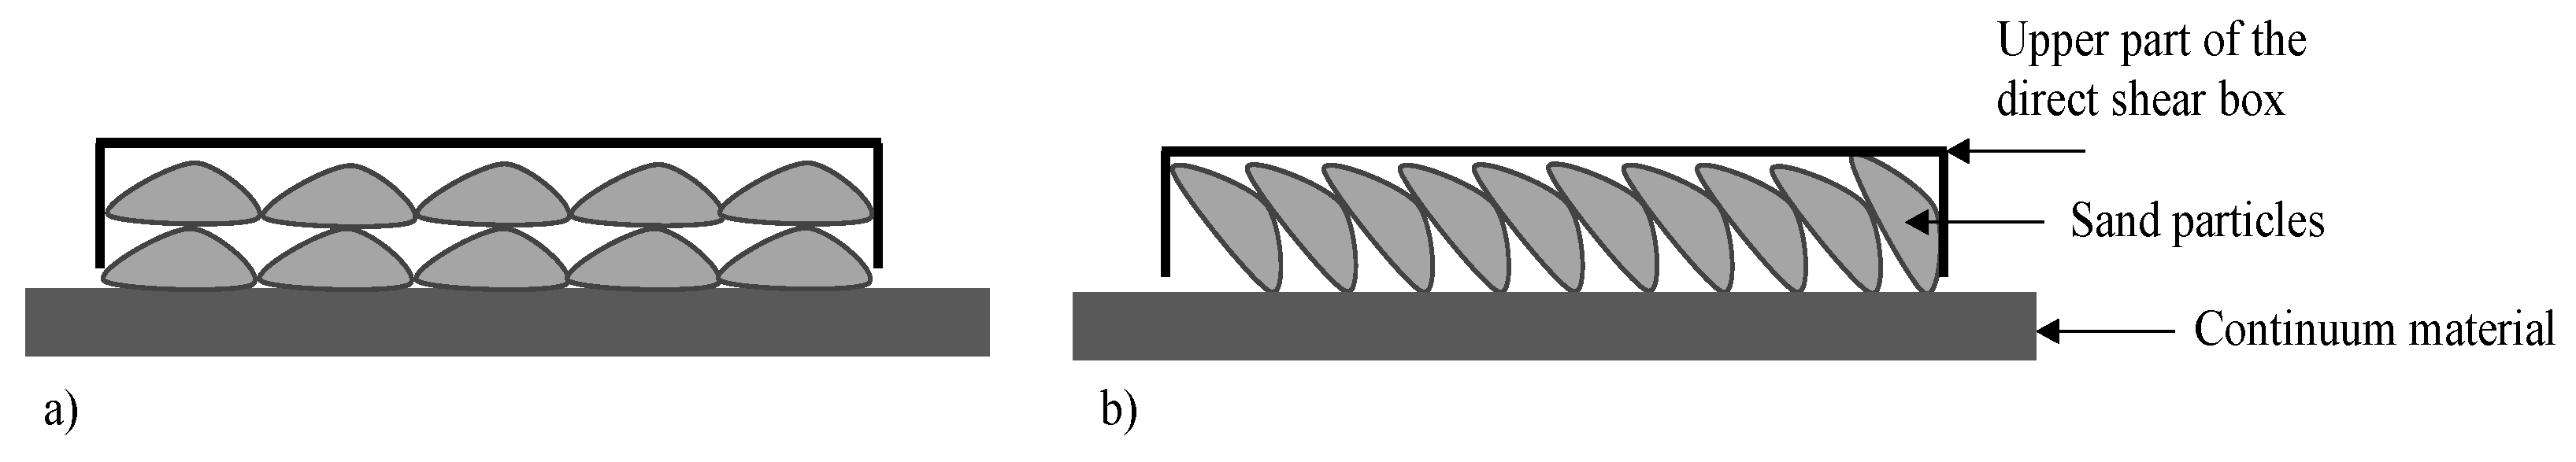
  • Coarse sand specimens attain their peak interface frictional resistance with less lateral deformation than medium and fine-grained sands.
  • The inclusion of recycled material into sand enhances its interface friction. Mixtures of sand and granular rubber show a significant enhancement in peak interface friction, while mixtures with carpet fibre show a slight enhancement.
  • The machine learning findings validate the efficacy of both MLR and RFR models in predicting the peak interface friction, with the latter outperforming the former in terms of accuracy.
  • The application of 10-fold cross-validation reveals that mean particle size and void ratio are the most significant input features.
  • Future research should consider various input parameters, including soil type, sand–rubber size ratio, carpet fibre size ratio, moisture content, temperature, shear rate, and stress history as well as the incorporation of hybrid machine learning techniques.

Author Contributions

Conceptualization, F.D. and H.A.-N.; methodology, F.D. and H.A.-N.; software, F.D.; writing—original draft preparation, F.D.; writing—review and editing, F.D. and H.A.-N.; supervision, H.A.-N. All authors have read and agreed to the published version of the manuscript.

Funding

This research received no external funding.

Data Availability Statement

The data presented in this study are available in the article.

Conflicts of Interest

The authors declare no conflict of interest.

Nomenclature

D50Mean particle size
eVoid ratio
GsSpecific gravity
rParticle regularity
CuCoefficient of uniformity
CcCoefficient of curvature
GRCGranular rubber content
GRGranular rubber
CFCCarpet fibre content
CFCarpet fibre
σnNormal stress
RtSurface roughness
HDSurface hardness
MLMachine learning
MLRMultiple linear regression
RFR Random forest regression
τInterface friction
τpPeak interface friction
μInterface friction coefficient
RnNormalised roughness

Appendix A

Table A1. Data from interface shear experiment used for machine learning analysis.
#D50
(mm)
eGsρrCuCcGRC
(%)
CFC
(%)
σn
(kPa)
Rt
(µm)
HDτp
(kPa)
10.111.3132.700.4541.450.9600.00250.0091508.06
20.111.2752.700.4541.450.9600.00500.00915017.22
30.111.2762.700.4541.450.9600.001000.00915036.39
40.111.2702.700.4541.450.9600.002000.00915061.39
50.511.1032.660.3921.200.9700.00250.0091504.72
60.511.0962.660.3921.200.9700.00500.0091509.72
70.511.0962.660.3921.200.9700.001000.00915024.72
80.511.0922.660.3921.200.9700.002000.00915048.06
91.771.0332.660.4101.450.9600.00250.0091502.78
101.771.0292.660.4101.450.9600.00500.0091506.94
111.771.0432.660.4101.450.9600.001000.00915017.78
121.771.0392.660.4101.450.9600.002000.00915027.50
130.890.7102.451.0001.440.9600.00250.0091501.67
140.890.7102.451.0001.440.9600.00500.0091506.67
150.890.7082.451.0001.440.9600.001000.00915013.89
160.890.7162.451.0001.440.9600.002000.00915031.94
170.111.1222.700.4541.450.9600.00250.0091509.17
180.111.1292.700.4541.450.9600.00500.00915017.78
190.111.1132.700.4541.450.9600.001000.00915036.67
200.111.0932.700.4541.450.9600.002000.00915066.67
210.510.9972.660.3921.200.9700.00250.0091506.94
220.510.9892.660.3921.200.9700.00500.00915012.78
230.511.0002.660.3921.200.9700.001000.00915026.94
240.510.9922.660.3921.200.9700.002000.00915049.72
251.770.9042.660.4101.450.9600.00250.00915010.83
261.770.8892.660.4101.450.9600.00500.00915014.72
271.770.9312.660.4101.450.9600.001000.00915023.89
281.770.9002.660.4101.450.9600.002000.00915046.39
290.890.6452.451.0001.440.9600.00250.0091503.06
300.890.6362.451.0001.440.9600.00500.00915018.89
310.890.6412.451.0001.440.9600.001000.00915019.17
320.890.6402.451.0001.440.9600.002000.00915033.33
330.111.2662.700.4541.450.9600.00250.09315016.11
340.111.2762.700.4541.450.9600.00500.09315034.44
350.111.2582.700.4541.450.9600.001000.09315063.61
360.111.2492.700.4541.450.9600.002000.093150122.22
370.511.0922.660.3921.200.9700.00250.09315015.83
380.511.0942.660.3921.200.9700.00500.09315032.50
390.511.0972.660.3921.200.9700.001000.09315056.94
400.511.1012.660.3921.200.9700.002000.093150105.83
411.771.0102.660.4101.450.9600.00250.09315023.61
421.771.0292.660.4101.450.9600.00500.09315039.17
431.771.0182.660.4101.450.9600.001000.09315065.83
441.771.0192.660.4101.450.9600.002000.093150119.17
450.890.6912.451.0001.440.9600.00250.09315016.67
460.890.6972.451.0001.440.9600.00500.09315031.11
470.890.6932.451.0001.440.9600.001000.09315056.67
480.890.6982.451.0001.440.9600.002000.093150127.78
490.111.0632.700.4541.450.9600.00250.09315019.44
500.111.1232.700.4541.450.9600.00500.09315033.61
510.111.0922.700.4541.450.9600.001000.09315065.56
520.111.0912.700.4541.450.9600.002000.093150133.06
530.510.9902.660.3921.200.9700.00250.09315019.44
540.510.9682.660.3921.200.9700.00500.09315040.00
550.510.9782.660.3921.200.9700.001000.09315072.22
560.510.9522.660.3921.200.9700.002000.093150134.72
571.770.9132.660.4101.450.9600.00250.09315026.94
581.770.9072.660.4101.450.9600.00500.09315040.83
591.770.9182.660.4101.450.9600.001000.09315090.00
601.770.9022.660.4101.450.9600.002000.093150165.00
610.890.6452.451.0001.440.9600.00250.09315017.22
620.890.6652.451.0001.440.9600.00500.09315034.72
630.890.6542.451.0001.440.9600.001000.09315058.33
640.890.6552.451.0001.440.9600.002000.093150120.28
650.111.3072.700.4541.450.9600.00250.0198914.17
660.111.3002.700.4541.450.9600.00500.0198931.94
670.111.3092.700.4541.450.9600.001000.0198958.61
680.111.3002.700.4541.450.9600.002000.01989115.83
690.231.1522.690.4271.450.9600.00250.0198916.67
700.231.1392.690.4271.450.9600.00500.0198931.39
710.231.1582.690.4271.450.9600.001000.0198957.50
720.231.1532.690.4271.450.9600.002000.01989113.89
730.511.0752.660.3921.200.9700.00250.0198918.06
740.511.0682.660.3921.200.9700.00500.0198931.67
750.511.0732.660.3921.200.9700.001000.0198958.89
760.511.0832.660.3921.200.9700.002000.01989106.39
771.770.9802.660.4101.450.9600.00250.0198913.61
781.770.9752.660.4101.450.9600.00500.0198928.06
791.771.0022.660.4101.450.9600.001000.0198953.89
801.770.9722.660.4101.450.9600.002000.0198998.89
811.770.7002.451.0001.450.9600.00250.019897.78
821.770.7002.451.0001.450.9600.00500.0198914.70
831.770.7102.451.0001.450.9600.001000.0198930.30
841.770.7002.451.0001.450.9600.002000.0198949.80
851.701.0502.500.4061.560.96100.00250.0091506.68
861.701.0302.500.4061.560.96100.00500.00915012.80
871.701.0302.500.4061.560.96100.001000.00915033.90
881.701.0102.500.4061.560.96100.002000.00915060.60
891.621.1502.340.4023.451.94200.00250.0091509.73
901.621.1502.340.4023.451.94200.00500.00915017.20
911.621.1502.340.4023.451.94200.001000.00915033.60
921.621.1602.340.4023.451.94200.002000.00915067.80
931.181.4901.870.3904.930.84500.00250.00915011.95
941.181.4901.870.3904.930.84500.00500.00915028.90
951.181.4901.870.3904.930.84500.001000.00915055.00
961.181.4901.870.3904.930.84500.002000.00915094.80
971.770.9202.660.4101.450.9600.25250.0091505.83
981.770.9202.660.4101.450.9600.25500.00915013.61
991.770.9202.660.4101.450.9600.251000.00915029.17
1001.770.9202.660.4101.450.9600.252000.00915050.00
1011.770.9152.650.4101.450.9600.50250.0091508.89
1021.770.9152.650.4101.450.9600.50500.00915014.72
1031.770.9152.650.4101.450.9600.501000.00915029.72
1041.770.9152.650.4101.450.9600.502000.00915054.72
1051.770.9072.650.4101.450.9601.00250.0091507.78
1061.770.9072.650.4101.450.9601.00500.00915019.17
1071.770.9072.650.4101.450.9601.001000.00915029.72
1081.770.9072.650.4101.450.9601.002000.00915060.28

References

  1. Dove, J.E.; Frost, J.D. Peak Friction Behavior of Smooth Geomembrane-Particle Interfaces. J. Geotech. Geoenviron. Eng. 1999, 125, 544–555. [Google Scholar] [CrossRef]
  2. Su, L.-J.; Zhou, W.-H.; Chen, W.-B.; Jie, X. Effects of relative roughness and mean particle size on the shear strength of sand-steel interface. Measurement 2018, 122, 339–346. [Google Scholar] [CrossRef]
  3. Dove, J.E.; Frost, J.D.; Han, J.; Bachus, R.C. The Influence of Geomembrane Surface Roughness on Interface Strength. In Proceedings of the Geosynthetics ’97, Long Beach, CA, USA, 11–13 March 1997. [Google Scholar]
  4. Vaid, Y.; Rinne, N. Geomembrane coefficients of interface friction. Geosynth. Int. 1995, 2, 309–325. [Google Scholar] [CrossRef]
  5. Frost, J.; Han, J. Behavior of interfaces between fiber-reinforced polymers and sands. J. Geotech. Geoenviron. Eng. 1999, 125, 633–640. [Google Scholar] [CrossRef]
  6. Vangla, P.; Latha Gali, M. Effect of particle size of sand and surface asperities of reinforcement on their interface shear behaviour. Geotext. Geomembr. 2016, 44, 254–268. [Google Scholar] [CrossRef]
  7. Ward, H.C. Profile Characterization. In Rough Surfaces, 1st ed.; Thomas, T.R., Ed.; Longman: London, UK, 1982; p. 261. [Google Scholar]
  8. Kishida, H.; Uesugi, M. Tests of the interface between sand and steel in the simple shear apparatus. Géotechnique 1987, 37, 45–52. [Google Scholar] [CrossRef]
  9. Shaia, H.A.; Abuel-Naga, H.M. On the normalized relative roughness for soil-fiber reinforced polymer interface shear behaviour. Lowl. Technol. Int. 2014, 16, 9–13. [Google Scholar] [CrossRef]
  10. Abuel-Naga, H.; Shaia, H.; Bouazza, A. Effect of surface roughness and hardness of Continuum materials on interface shear strength of granular materials. J. Test. Eval. 2017, 46, 826–831. [Google Scholar] [CrossRef]
  11. Daghistani, F.; Abuel-Naga, H. Evaluating the Influence of Sand Particle Morphology on Shear Strength: A Comparison of Experimental and Machine Learning Approaches. Appl. Sci. 2023, 13, 8160. [Google Scholar] [CrossRef]
  12. Zhang, P.; Yin, Z.-Y.; Jin, Y.-F.; Liu, X.-F. Modelling the mechanical behaviour of soils using machine learning algorithms with explicit formulations. Acta Geotech. 2021, 17, 1403–1422. [Google Scholar] [CrossRef]
  13. Yu, H.; Taleghani, A.D.; Al Balushi, F.; Wang, H. Machine learning for rock mechanics problems; an insight. Front. Mech. Eng. 2022, 8, 1003170. [Google Scholar] [CrossRef]
  14. Daghistani, F.; Baghbani, A.; Abuel Naga, H.; Faradonbeh, R.S. Internal Friction Angle of Cohesionless Binary Mixture Sand–Granular Rubber Using Experimental Study and Machine Learning. Geosciences 2023, 13, 197. [Google Scholar] [CrossRef]
  15. Saad, A.H.; Nahazanan, H.; Yusuf, B.; Toha, S.F.; Alnuaim, A.; El-Mouchi, A.; Elseknidy, M.; Mohammed, A.A. A Systematic Review of Machine Learning Techniques and Applications in Soil Improvement Using Green Materials. Sustainability 2023, 15, 9738. [Google Scholar] [CrossRef]
  16. Zarei, C.; Sihag, P.; Rahimi, L. Prediction of Undrained Shear Strength of Crushed Tire Mixture with Fine-Grained Soil by using Machine Learning Approaches. Res. Sq. 2021. [Google Scholar] [CrossRef]
  17. Qi, C.; Fourie, A.; Chen, Q.; Zhang, Q. A strength prediction model using artificial intelligence for recycling waste tailings as cemented paste backfill. J. Clean. Prod. 2018, 183, 566–578. [Google Scholar] [CrossRef]
  18. Ahmad, A.; Farooq, F.; Ostrowski, K.A.; Śliwa-Wieczorek, K.; Czarnecki, S. Application of Novel Machine Learning Techniques for Predicting the Surface Chloride Concentration in Concrete Containing Waste Material. Materials 2021, 14, 2297. [Google Scholar] [CrossRef] [PubMed]
  19. Asteris, P.G.; Koopialipoor, M.; Armaghani, D.J.; Kotsonis, E.A.; Lourenço, P.B. Prediction of cement-based mortars compressive strength using machine learning techniques. Neural Comput. Appl. 2021, 33, 13089–13121. [Google Scholar] [CrossRef]
  20. Cevallos, S.; Jerves, A.X.; Mital, U.; Medina, D.A.; Quinteros, V.S.; Mulas, M.; Torgersrud, Ø. Towards a more accurate characterization of granular media 2.0: Involving AI in the process. Comput. Geotech. 2023, 160, 105510. [Google Scholar] [CrossRef]
  21. Jain, P.; Chhabra, H.; Chauhan, U.; Prakash, K.; Samant, P.; Singh, D.K.; Soliman, M.S.; Islam, M.T. Machine Learning Techniques for Predicting Metamaterial Microwave Absorption Performance: A Comparison. IEEE Access 2023, 11, 128774–128783. [Google Scholar] [CrossRef]
  22. Mital, U.; Andrade, J.E. Bridging length scales in granular materials using convolutional neural networks. Comput. Part. Mech. 2022, 9, 221–235. [Google Scholar] [CrossRef]
  23. Zhang, P.; Yin, Z.-Y.; Chen, Q. Image-based 3D reconstruction of granular grains via hybrid algorithm and level set with convolution kernel. J. Geotech. Geoenviron. Eng. 2022, 148, 04022021. [Google Scholar] [CrossRef]
  24. AS1289.3.6.1; Method of Testing Soils for Engineering Purposes—Soil Classification. Australian Standard: Sydney, Australia, 2009.
  25. AS1774.19; The Determination of Sieve Analysis and Moisture Content. Australian Standard: Sydney, Australia, 2003.
  26. AS1289.6.2.2; Soil Strength and Consolidation Tests—Determination of Shear Strength of a Soil—Direct Shear Test Using a Shear Box. Standards Australia: Sydney, Australia, 2020.
  27. Senthen Amuthan, M.; Boominathan, A.; Banerjee, S. Density and Shear Strength of Particulate Rubber Mixed with Sand and Fly Ash. J. Mater. Civ. Eng. 2018, 30, 04018136. [Google Scholar] [CrossRef]
Figure 1. Sieve analysis of the granular material used for the interface shear test.
Geotechnics 04 00006 g001
Figure 2. Schematic diagram of the interface shear test adapted for the direct shear apparatus.
Geotechnics 04 00006 g002
Figure 3. A cross-sectional schematic diagram showing different densities of glass beads in contact with the continuum surface, where (a) shows the sample in a dense state, and (b) shows the sample in a loose state.
Geotechnics 04 00006 g003
Figure 4. Peak interface friction of glass beads/smooth steel surface at different normal stresses in both loose and dense states.
Geotechnics 04 00006 g004
Figure 5. Peak interface friction versus void ratio for sands of coarse, medium, and fine grain sizes, at different densities and normal stresses with (a) smooth steel, and (b) rough steel.
Geotechnics 04 00006 g005
Figure 6. A cross-sectional schematic diagram shows the particles at different orientations, where in (a) the particles are flat on the surface, and in (b) the particles are perpendicular to the surface.
Geotechnics 04 00006 g006
Figure 7. Lateral displacement of fine, medium, and coarse sand at peak interface friction in a dense state under varying normal stresses: (a) 25 kPa, (b) 50 kPa, (c) 100 kPa, and (d) 200 kPa.
Geotechnics 04 00006 g007
Figure 8. Cross section of the granular/continuum interface at different continuum roughness (a) smooth surface, and (b) rough surface.
Geotechnics 04 00006 g008
Figure 9. Peak interface friction versus normalised roughness at different normal stresses and levels of roughness, where (a) represents smooth steel, and (b) represents rough steel.
Geotechnics 04 00006 g009
Figure 10. Peak interface friction between a dense-state sand–recycled material mixture and smooth steel under different normal stresses, with sand mixed with: (a) granular rubber, and (b) carpet fibre.
Geotechnics 04 00006 g010
Figure 11. MLR was performed to compare the actual with the predicted peak interface friction using (a) the training database, (b) the testing database, and (c) 10-fold CV.
Geotechnics 04 00006 g011
Figure 12. RFR was performed to compare the actual with the predicted peak interface friction using (a) the training database, (b) the testing database, and (c) 10-fold CV.
Geotechnics 04 00006 g012
Figure 13. Feature importance analysis comparing MLR and RFR with 10-fold CV: (a) MLR with 10-fold CV, (b) RFR with 10-fold CV.
Geotechnics 04 00006 g013
Table 1. The properties of the used granular material.
Granular MaterialD50 (mm)CuCcGs r
B1-Sand0.111.450.962.700.454
B4-Sand0.511.200.972.660.392
B6-Sand1.771.450.962.660.410
GB50.891.440.962.451
GR-A0.513.041.191.080.37
Table 2. The properties of the used continuum surfaces.
Tested MaterialRt (µm)HD
Smooth steel 8.588150
Rough steel 93.163150
Aluminium 18.91989
Table 3. The compaction energy parameters for the sand–rubber mixture.
TypeSand–Rubber Mixture
Nblows5
Nlayers1
Whammer (kN)0.026
Hdrop (m)0.30
Vmold (m3)0.000082
Total Energy (kJ)475.61
Table 4. Key features and their descriptions.
FeatureDescription
D50This feature presents the average diameter of the granular particles, which influences the contact area and interlocking with the continuum surface.
eThis feature presents the ratio of the volume of voids to the volume of solids in the granular material, which affects the density and packing of the particles.
GsThis feature presents the ratio of the density of the granular material to the density of water, which reflects the mineral composition and porosity of the particles.
ρrThis feature presents the degree of deviation of the particle shape from a perfect sphere, which affects the frictional resistance and rolling behaviour of the particles
CuThis feature presents the ratio of the particle size corresponding to 60% passing in the sieve analysis to the particle size corresponding to 10% passing, which indicates the gradation and sorting of the granular material.
CcThis feature presents the ratio of the square of the particle size corresponding to 30% passing in the sieve analysis to the product of the particle sizes corresponding to 10% and 60% passing, which indicates the shape of the particle size distribution curve.
GRCThis feature presents the percentage of granular rubber added to the sand by dry weight, which modifies the properties of the sand such as void ratio, specific gravity, and particle regularity.
CFCThis feature presents the percentage of carpet fibre added to the sand by dry weight, which modifies the properties of the sand such as void ratio, specific gravity, and particle regularity.
σnThis feature presents the normal force per unit area applied on the granular material at the interface with the continuum surface, which influences the shear strength and frictional resistance of the interface
RtThis feature presents the relative vertical distance along a surface profile between the highest peak and lowest valley, which indicates the texture and asperity of the continuum surface
HDThis feature presents the ability of the continuum surface to resist plastic deformation from a standardised force, which reflects the material and stiffness of the continuum surface
Table 5. Shear strength of sand alone, and sand versus smooth and rough steel in a dense state.
σn
(kPa)
Sand Only
(kPa)
Sand/Smooth Steel
(kPa)
Sand/Rough Steel
(kPa)
Fine sand
(D50: 0.11)
2523.339.1719.44
504017.7833.61
10073.8936.6765.56
200138.3366.67133.06
Medium sand
(D50: 0.51)
2531.946.9419.44
5054.7212.7840
10094.1726.9472.22
200164.7249.72134.72
Coarse sand
(D50: 1.77)
2548.0610.8326.94
5088.8914.7240.83
100118.6123.8990
200227.2246.39165
Table 6. Hyperparameters for the MLR code, including parameters for both with and without the application of 10-fold CV.
PhaseParameterValue
Train and Test Setstest_size0.2
random_state0
KFold Cross-Validationn_splits10
random_state0
shuffleTrue
Feature Importance Estimationn_repeats10
Visualisationstart_point0
boundary_shift20%
Table 7. The performance of MLR model in predicting the peak interface friction.
Training DatabaseTesting Database10-Fold CV
Observations8622108
MAE10.2012.5911.22
RMSE13.7914.7315.16
RMSLE0.490.88-
0.860.650.81
Table 8. Hyperparameters for the RFR code, including parameters for both with and without the application of 10-fold CV.
PhaseParameterValue
Train and Test Setstest_size0.2
random_state0
KFold Cross-Validationn_splits10
random_state0
shuffleTrue
Modeln_estimators100
random_state0
Visualisationstart_point0
boundary_shift20%
Table 9. The performance of the RFR model in predicting the peak interface friction.
Training DatabaseTesting Database10-Fold CV
Observations8622108
MAE3.204.307.16
RMSE5.435.6512.81
RMSLE0.120.270.31
0.980.950.87
Table 10. Comparative performance of multiple linear regression and random forest regression on training, testing, and 10-fold cross-validation datasets.
Multiple Linear RegressionRandom Forest Regression
Training DataTesting Data10-Fold CVTraining DataTesting Data10-Fold CV
Observation86221088622108
MAE10.2012.5911.223.204.307.16
RMSE13.7914.7315.165.435.6512.81
RMSLE0.490.88-0.120.270.31
R20.860.650.810.980.950.87
Disclaimer/Publisher’s Note: The statements, opinions and data contained in all publications are solely those of the individual author(s) and contributor(s) and not of MDPI and/or the editor(s). MDPI and/or the editor(s) disclaim responsibility for any injury to people or property resulting from any ideas, methods, instructions or products referred to in the content.

