Geogrid-Enhanced Modulus and Stress Distribution in Clay Soil

Louisiana Transportation Research Center, 4101 Gourrier Avenue, Baton Rouge, LA 70808, USA
Geotechnics 2024, 4(1), 41-53; https://doi.org/10.3390/geotechnics4010003
Submission received: 22 November 2023
/
Revised: 15 December 2023
/
Accepted: 26 December 2023
/
Published: 28 December 2023
Abstract
:A series of laboratory and large-scale field model footing tests were conducted to assess the modulus and stress distribution behavior of a clayey soil foundation, both with/without geogrid reinforcement, deviating from the conventional approach of evaluating the strength performance, such as bearing capacity. The modulus was evaluated at three settlement ratios of s/B = 1, 3, and 5%, while the stress distribution angle was estimated at three applied surface pressures of 234 kPa, 468 kPa, and 936 kPa. The results indicated a stiffer load-settlement response when geogrid reinforcement was included. The modulus of reinforced clayey soil remained nearly constant for test sections with the same reinforced ratio, with the modulus improvement increasing as the reinforced ratio (Rr) increased. The modulus improvement also increased with the settlement ratio (s/B). These results demonstrated that the stress distribution improvement decreased as the surface pressure increased. Generally, both the modulus and stress distribution improvement exhibited an increase with an increase in the tensile modulus of the geogrid. While laboratory model tests consistently provided a higher improvement in the modulus than large-scale field model tests in this study due to a higher reinforced ratio, the stress distribution improvement was similar for both.
1. Introduction
The application of geogrid-reinforced soils to support shallow foundations can be dated back to as early as the 1970s. Over the past half-century, significant research efforts have been directed toward exploring the performance of geogrid-reinforced soil foundations (RSFs) across various soil types [1,2,3,4,5,6,7,8,9,10,11,12,13,14]. Varied parameters in these studies include the top layer spacing, number of geogrid layers, vertical spacing between layers, length of geogrid reinforcement, tensile modulus, footing shapes, soil types, etc.
The literature widely recognizes and documents the benefit of geogrids in improving the ultimate bearing capacity of footings [15,16,17,18]. Studies have identified that the primary mechanism of geogrid reinforcement is the confinement effect or lateral restraint effect [19,20]. This confining effect is akin to increasing the effective confining stress of the soil. Since most soils are stress-dependent materials, geogrid reinforcement can enhance the shear strength/modulus of soil through this lateral restraint effect.
Based on this reinforcing mechanism, various numerical and analytical solutions have been developed to assist engineers in estimating the ultimate bearing capacity of a reinforced soil foundation [19,20,21,22]. Settlement prediction is always a challenging task, even for an unreinforced soil foundation. However, in many cases, the settlement of the footing is a critical factor in the design of a shallow foundation system and is often a major contributor to structural damage, e.g., a bump at the end of the bridge (Figure 1), rutting in a flexible pavement structure, and settlement cracks of buildings. Huang [23] and Huang and Hong [24] developed analytical solutions to estimate the settlement of a RSF at the ultimate load.
Recently, artificial intelligence has gained popularity in the research community, with Raja and Shukla [25] creating a multivariate adaptive regression splines model to predict the settlement of reinforced sandy soil foundations at ultimate loads. However, these studies have not adequately addressed the requirements of serviceability limiting the state design, specifically the allowable settlement. Khosrojerdi et al. [26] utilized the results of a numerical parametric study to develop a regression model for estimating the maximum settlement of a RSF under applied static loads ranging from 50 to 600 kPa. Raja and Shukla [27] developed a hybrid AI model for estimating the settlement of a RSF under service loads. It is worth noting that the studies in the literature primarily focus on estimating immediate settlement, representing a limitation, especially in the context of long-term performance considerations.
In this study, data from previous research conducted by the author are utilized to evaluate the modulus of geogrid-reinforced clayey soil, a parameter frequently required for immediate settlement predictions, and the stress distribution angle, a parameter often needed for estimating the consolidation settlement of underlying weak soils.
2. Model Footing Tests
2.1. Material Properties and Test Setup
The author conducted a series of model footing tests, encompassing both laboratory and large-scale field experiments, on a clayey soil foundation reinforced with geogrid [15]. The clayey soil used in this study had a liquid limit of 31 and a plastic index of 15, classified as CL (clay of low-plasticity) according to the Unified Soil Classification System (USCS). The Standard Proctor test determined an optimum moisture content of 18.75%, and the maximum dry density was found to be 1670 kg/m3.
For the laboratory model footing tests, a 1.5 m (length) × 0.91 m (width) × 0.91 m deep steel box was utilized. The model footings, 25.4 mm thick steel plates with dimensions of 152 mm × 152 mm, were tested on soil with an in situ moisture content ranging from 18.0–18.5% and a dry density from 1640–1709 kg/m3.
In the large-scale model footing tests, the model footing utilized comprised steel-reinforced precast concrete blocks, with a thickness of 203 mm and dimensions of 457 mm × 457 mm. The test sections measured 3.658 m (length) × 3.658 m (width) × 1.829 m (height). The in situ dry densities of the soil ranged from 1760–1808 kg/m3, with moisture contents varying between 15.8% and 16.8%.
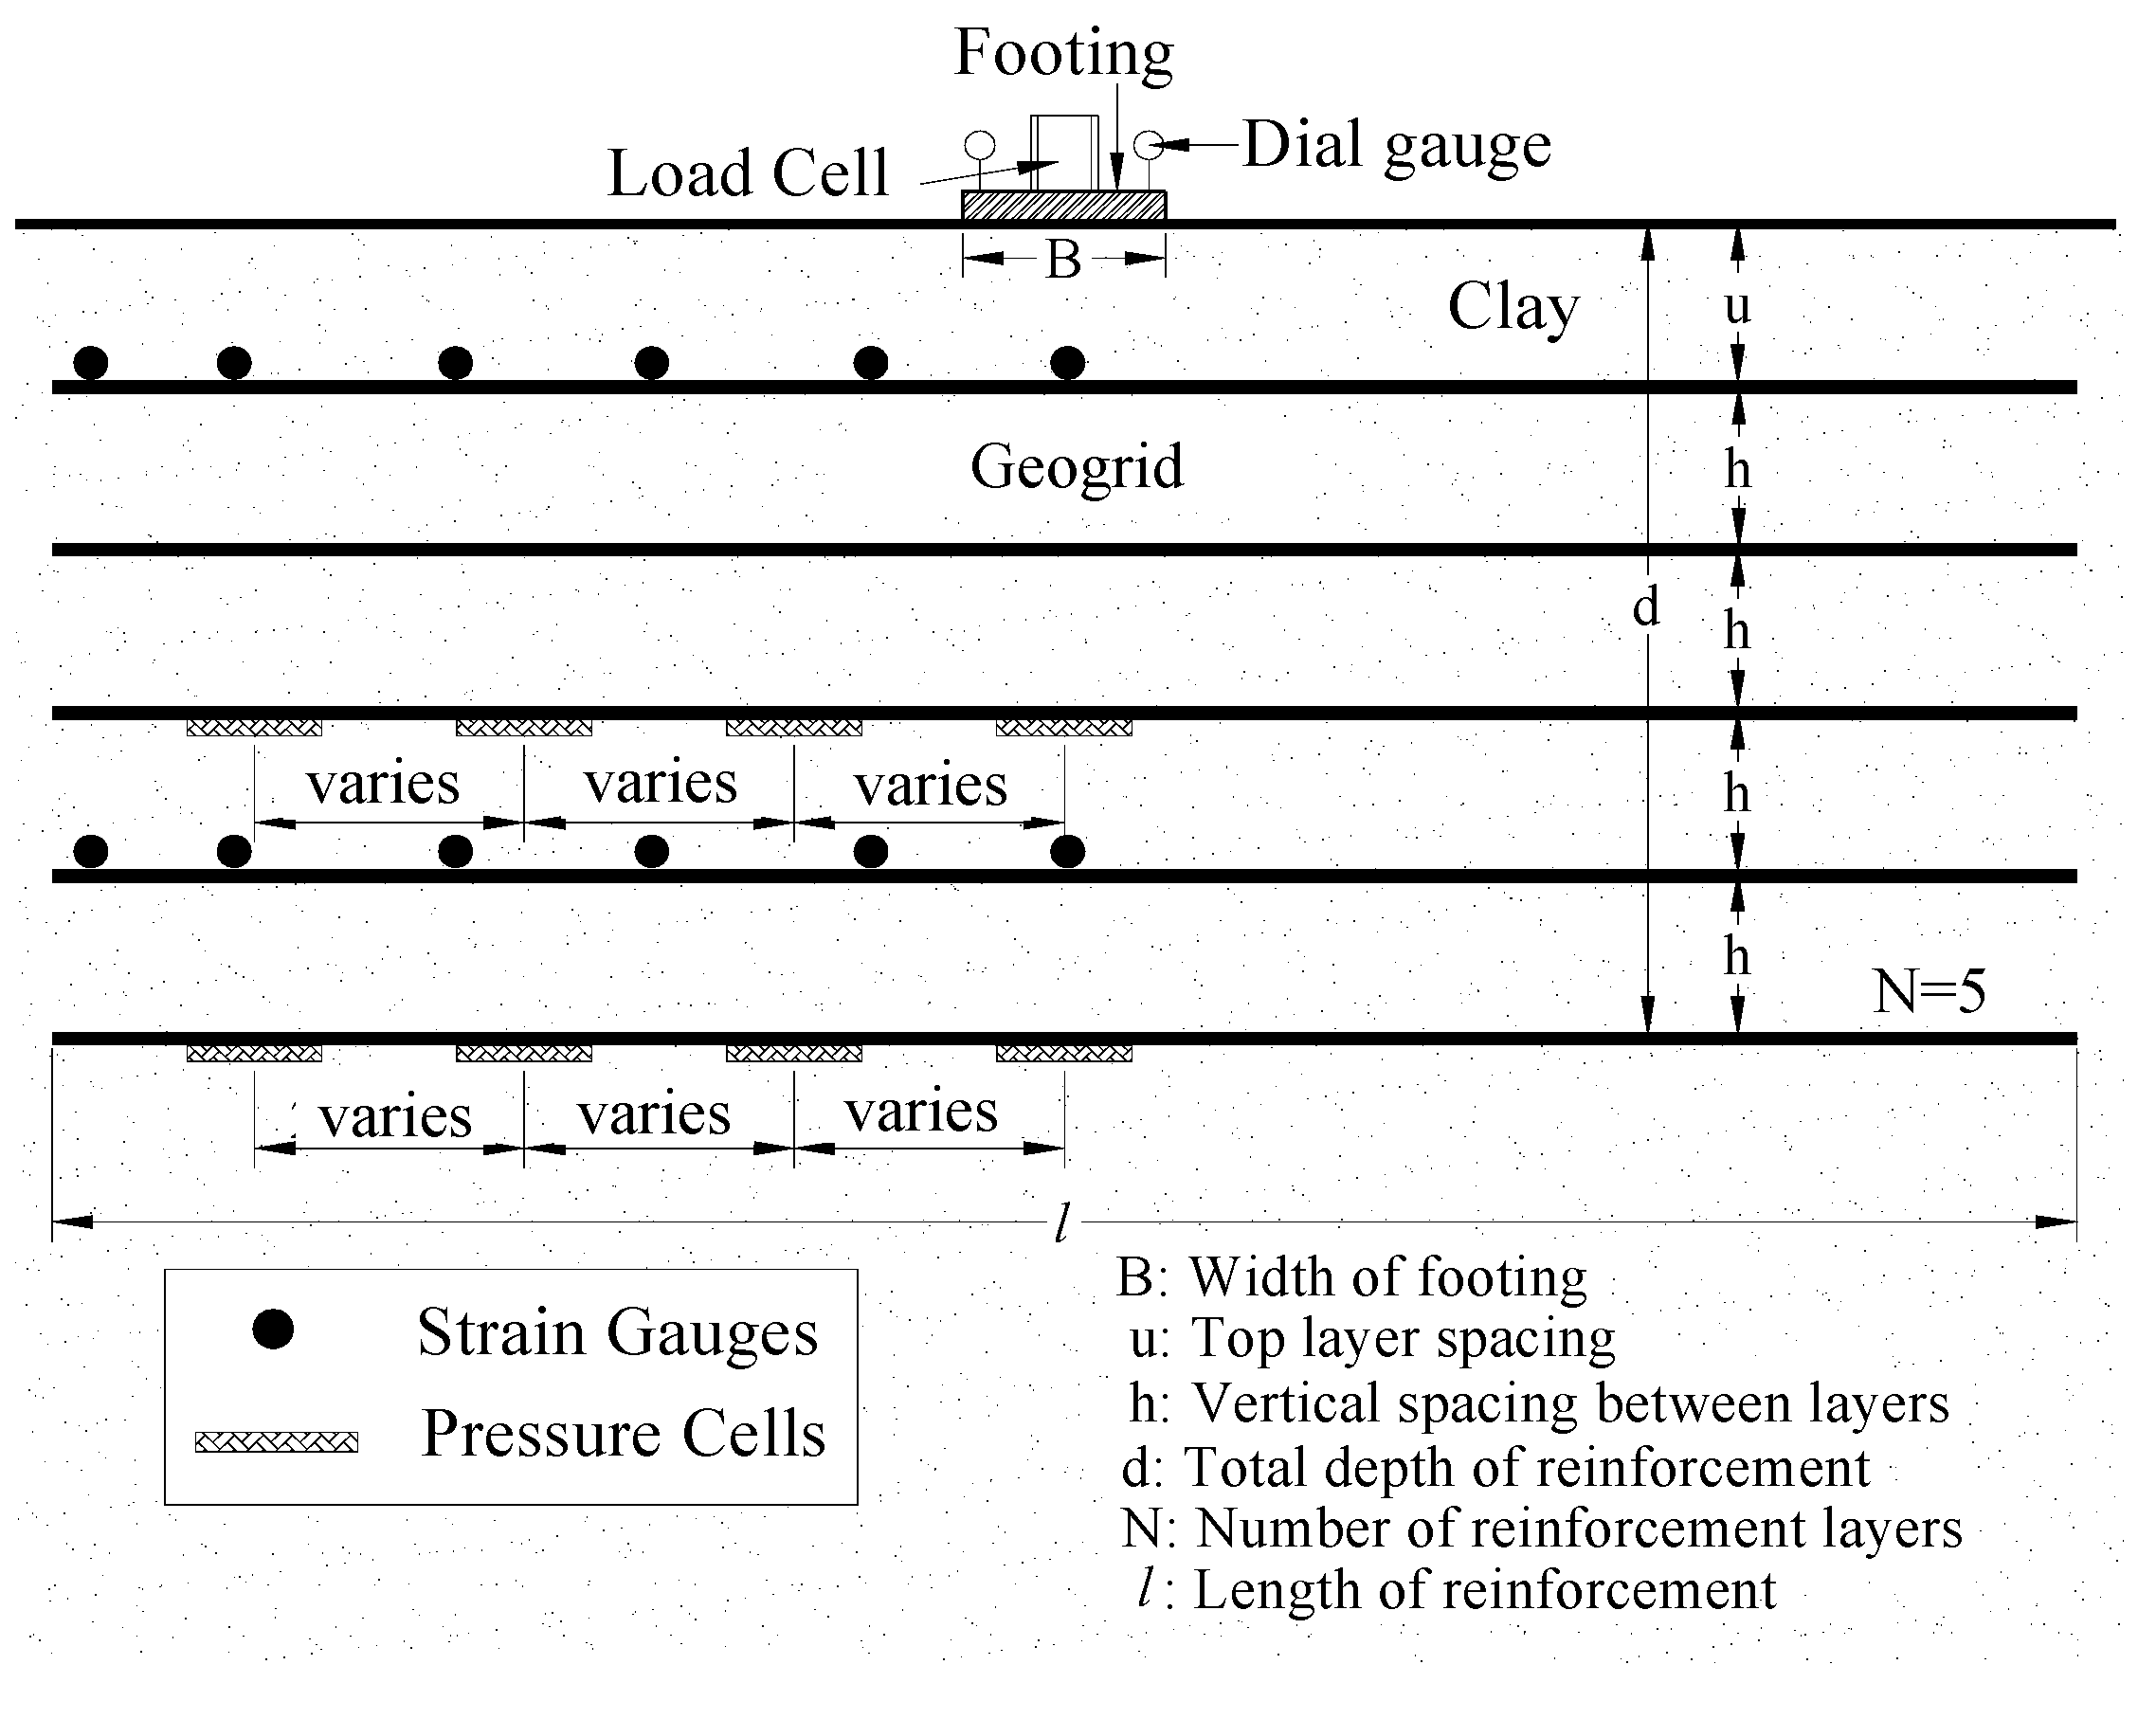
Figure 2 schematically illustrates a typical reinforced soil foundation testing section. The footings underwent loading through a hydraulic jack against a reaction steel frame (Figure 3). The testing protocol adhered to the ASTM (American Society for Testing and Materials) D 1196-93 (2004) procedures [28], with load increments that were applied and sustained until the settlement rate remained below 0.03 mm/min for three consecutive minutes. Measurement of the load and the corresponding footing settlement was conducted using a ring load cell and two dial gauges, respectively.
Three types of geogrids, designated as GG1, GG2, and GG3, were employed in this investigation. The physical and mechanical properties of these geogrids, as furnished by the manufacturers, are detailed in Table 1.
2.2. Test Section Preparation
The clayey soil was layered and compacted for each test section. In the laboratory model footing tests, the layer thickness varied from 25 mm to 102 mm, depending on the spacing of the reinforcement. Test samples were prepared by hand-mixing clay and water. The required amount of clay for each layer was then calculated, poured into the box, leveled with a rake, and compacted to the predetermined height using a 203 mm × 203 mm plate adapted to a vibratory jackhammer.
In the large-scale field model footing tests, the layer thickness ranged from 102 mm to 152 mm, depending on the reinforcement spacing. The necessary quantities of clayey soil and water were computed for each layer. Test sections were prepared by employing a tiller to blend the pre-weighed soil and water. The soil was uniformly distributed across the section, leveled with a rake, and compacted to the predetermined height using a MultiQuip plate compactor(Multiquip Inc., Cypress, USA), followed by a wacker-packer tamper (Wacker Neuson America Corporation, Menomonee Falls, USA) to achieve the desired densities.
Geogrid layers were positioned in the clayey soil at the desired depth. For pressure cells, excavations were made to the predetermined depth using a hand trowel when construction reached the level for pressure cell installation. The bottom of the hole was leveled with a 102 mm diameter steel plate gently struck by the compaction hammer. The pressure cell was subsequently positioned in the holes and adjusted until level with the aid of a small bubble level placed on the pressure cell. The excavated clayey soil was then backfilled and compacted over the pressure cells.
A nuclear density gauge was employed to assess the density of each layer. In the laboratory model footing test sections, the measured dry densities ranged from 1640 to 1709 kg/m3 (equivalent to a relative compaction of 98% to 102%), with moisture contents varying between 18 to 18.5%. For the large-scale field model footing test sections, the measured dry densities ranged from 1760 to 1808 kg/m3 (equivalent to a relative compaction of 105% to 108%), with moisture contents varying between 15.81 and 16.84%.
2.3. Experimental Testing Program
Both the laboratory and large-scale model tests were carried out on unreinforced/reinforced clayey soils under unconfined conditions (i.e., surface footing). Table 2 provides an overview of the testing program and variables.
3. Results and Analysis
3.1. Modulus Analysis
Due to the non-linear load-settlement response, many moduli can be defined from the plate load test results, e.g., the initial tangent, tangent, and secant modulus. In this research study, the equivalent soil modulus, which is defined as the secant modulus at a given settlement level, was determined from the plate load tests using the following equation:
where f is the stress distribution factor, which is assumed as in this study; q is the applied pressure; Be is the equivalent diameter of a square footing, ; is the settlement of the plate at the pressure, q; and is the Poisson ratio, =0.35 for both unreinforced and reinforced clayey soils in this study.
A geogrid reinforced soil foundation can be considered as a two-layer system with a stiff layer (reinforced zone) overlying a relatively soft layer (unreinforced soil). If the modulus of the unreinforced soil is known, the modulus of the reinforced soil can then be calculated by using the following equation:
where Es is the equivalent elastic modulus of the test section; ERS is the elastic modulus of the reinforced soil; hRS is the thickness of the reinforced soil layer; EUS is the elastic modulus of the underlying unreinforced soil; hUS is the thickness of the unreinforced soil layer; ip(RS) is the position factor of the reinforced soil layer; and ip(US) is the position factor of the unreinforced soil layer. The position factor is defined as the ratio of the Boussinesq stress influence factor at the mid-point of the reinforced or unreinforced soil layer (Ii) to the sum of the influence factor ().
The analysis is conducted assuming a zone of influence equal to 3B. The moduli of unreinforced/reinforced soil estimated from the model test results at a relatively small settlement (s/B = 1%), medium settlement (s/B = 3%), and relatively large settlement (s/B = 5%) are presented in Table 3. The modulus improvement factor (IFE) is introduced in this study to numerically evaluate the benefit of the geogrid on the modulus behavior of the reinforced soil. To obtain IFE, the following equation was used:
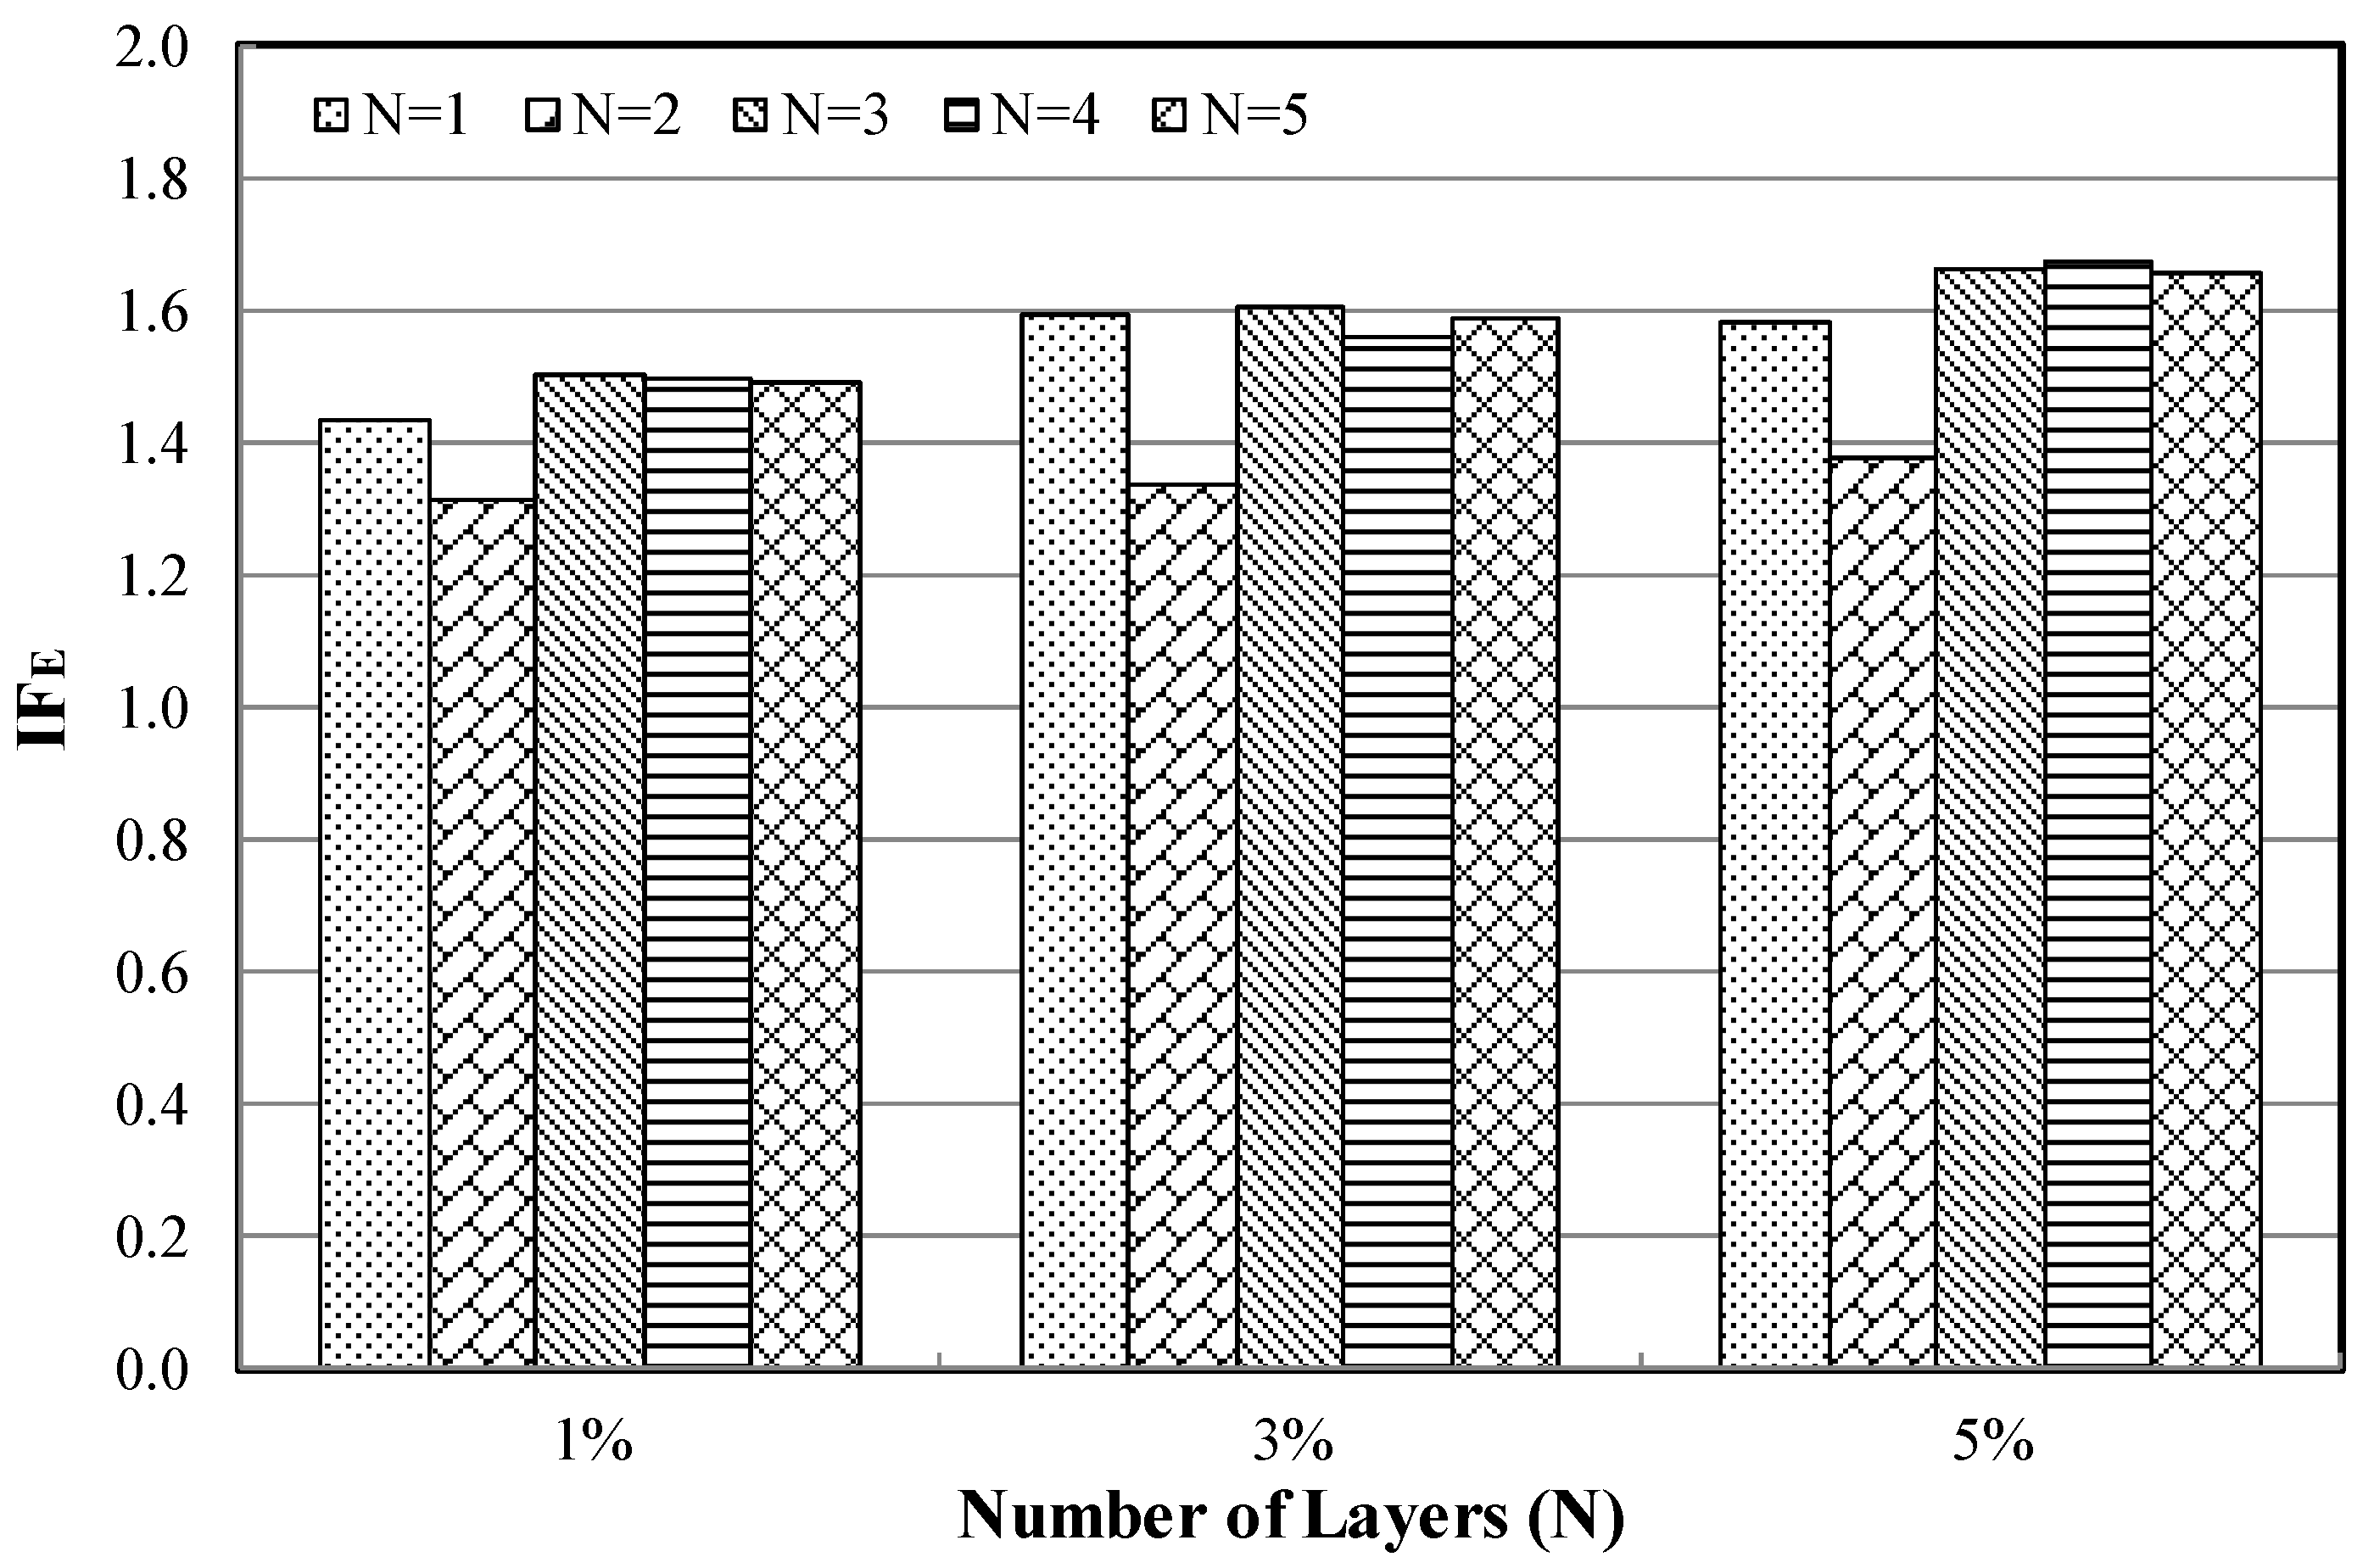
The comparison of the IFE values calculated at s/B = 1%, 3%, and 5% between the laboratory and large-scale field model tests is presented in Figure 4 for five layers of the GG2 geogrid. As can be seen from the figure, a significant dependency on the settlement level was observed for IFE, by which the IFE values increase with an increasing settlement level. The figure also shows that the estimated IFE values for the laboratory model test results consistently exceed those for the large-scale field model tests. This suggests that laboratory model tests may overestimate the benefit of geogrid reinforcement; however, this overestimation decreases with an increasing settlement level. At the settlement ratio (s/B) of 5%, IFE values of 1.65 and 1.56 are estimated for laboratory and large-scale field model tests with five layers of GG2 geogrid, respectively.
Figure 5 presents the IFE values obtained from the laboratory model tests with various layers of GG2 geogrid. It is interested to note that the IFE values are almost constant regardless of the number of layers of geogrid, especially for three or more layers of geogrid. This may be explained by the concept of the reinforced ratio (Rr) [20], which is defined as:
where ER is the elastic modulus of the reinforcement = J/tR; J is the tensile modulus of reinforcement; AR is the area of reinforcement per unit width = NtR × 1; tR is the thickness of the reinforcement; N is the number of reinforcement layers; EUS is the modulus of elasticity of soil; ARS is the area of reinforced soil per unit width = d × 1; and d is the total depth of the reinforced zone = u + (N − 1)h. Since the top layer spacing u is equal to the vertical spacing between layers h for the laboratory model tests with various layers of GG2 geogrid, Equation (4) in this case can be further simplified as , which is independent of the number of layers. Therefore, for laboratory model test sections with various layers of GG2 geogrid in this study, the reinforced ratio of the reinforced zone remains constant. The only difference among the test sections is the depth of the reinforced zone. In other words, the modulus of the reinforced zone is directly related to the reinforced ratio.
Figure 6 presents the IFE values calculated at s/B = 1%, 3%, and 5% for four layers of different types of geogrids. The figure apparently demonstrates that the modulus of reinforced soil increased with the increasing tensile modulus of the geogrid. At a settlement ratio (s/B) of 3%, an increase in IFE from 1.21 with a GG1 geogrid to 1.42 with a GG3 geogrid was calculated. A similar trend was observed for a relatively large settlement (s/B = 5%). In this case, the IFE values increased from 1.24 with a GG1 geogrid to 1.51 with a GG3 geogrid.
The variations of IFE values with reinforcement spacing ratios (h/B) obtained at settlement ratios of s/B = 1%, 3%, and 5% are shown in Figure 7 for a GG2 geogrid. The figure shows that the IFE values decreased with increasing h/B. Similar trends were observed for both laboratory and large-scale field model tests at various levels of settlement ratios (s/B). It is also noted that while most of the geogrid reinforcement benefit was achieved at medium settlement (s/B = 3%), only a small benefit from the geogrid was observed at a relatively small settlement (s/B = 1%). As noted earlier, the reinforced ratio is inversely proportional to the vertical spacing of reinforcement (h). In other words, the smaller the vertical spacing of reinforcement, the higher the reinforced ratio. Consequently, the modulus of the reinforced zone is positively related to the reinforced ratio.
Figure 8 illustrates the variation of IFE values with the reinforced ratio. As expected, the IFE values increased with an increase in the reinforced ratio. Interestingly, the laboratory and large-scale field model tests do not seem to follow the same trend. This discrepancy may be attributed to the fact that the reinforcement spacing in laboratory model test sections is less than 102 mm while the reinforcement spacing for field model test sections is 152 mm and above. Depending on the reinforcement spacing, the interaction between neighboring reinforcement layers can range from full interlayer interactions (i.e., composite behavior) when closely spaced to zero interlayer interactions (i.e., non-composite behavior) when spaced further apart [29]. George et al. [29] determined that full interactions occur when the reinforcement spacing is less than 200 mm, while zero interactions occur when the spacing is greater than 400 mm. The boundary values to separate composite behavior and non-composite behavior are recommended for cases where the coefficient of the soil–geosynthetics interaction exceeds 0.8. The boundary values could be lower for the soil and geogrid used in this study as the coefficient of interaction, determined by a large, direct shear test, is around 0.7 [30]. The disparity in the modulus performance between the laboratory model tests and the large-scale field model tests is thus not surprising. It is also noted that the reinforced ratio of the laboratory model test sections is much higher than that of the large-scale field model test sections. Therefore, the laboratory model tests could overestimate the modulus benefit of geogrid reinforcement.
3.2. Stress Distribution Analysis
With the increased modulus of the reinforced soil mass, not only is the compressibility of the soil in the reinforced zone reduced, but the applied load can also be distributed to a wider area in the soil below the reinforced zone. Applying the concept of approximate stress distribution to the measured stress data, the stress distribution angle can be estimated from the model footing tests on reinforced clayey soil. In this study, the stress distribution angle for the reinforced clayey soil was estimated using the stresses measured under the center of the footing with the following equation:
where P is the applied load at the surface; B is the width of the footing; d is the thickness of the reinforced zone; is the stress distribution angle; and pi is the vertical stress at the top of the underlying unreinforced soil. In the calculation, it is assumed that the stress outside the zone of influence delineated by the value is zero.
Similar to the modulus analysis, the stress distribution improvement factor () is introduced in this study to numerically evaluate the benefit of the geogrid in terms of a wider stress distribution. To obtain , the following equation is used:
where is the stress distribution angle in reinforced soil; and is the stress distribution angle in unreinforced soil.
Figure 9 presents a comparison of values calculated at q = 234 kPa, 468 kPa, and 936 kPa between laboratory and large-scale field model tests for five layers of GG2 geogrid. As seen in the figure, a significant dependency on the pressure level was observed for , with values decreasing as the surface pressure level increased. The figure also indicates that the estimated values for laboratory model test results are similar to those for the large-scale field model tests. These behaviors observed for the stress distribution are different than those observed for the modulus in this study. At a surface footing pressure of 234 kPa, an value of 1.50 is estimated for five layers of GG2 geogrid.
The estimated stress distribution angles for the different test sections are presented in Figure 10. As shown in the figure, a smaller stress distribution improvement factor was estimated for the test section with the lower tensile modulus geogrid GG1. In this case, the stress distribution improvement factor decreased from 1.23 for the surface pressure of 234 kPa to 1.08 for the surface pressure of 936 kPa. The test section with the higher tensile modulus geogrid GG3 indicated a stress distribution improvement factor of 1.37 for the surface pressure of 234 kPa and 1.14 for the surface pressure of 936 kPa, respectively.
3.3. Discussion
The total settlement of a soil foundation consists of three main components: immediate settlement, consolidation settlement, and secondary settlement. The proposed modulus improvement factor (IFE) and stress distribution improvement factor can assist engineers in estimating the immediate and consolidation settlement of a reinforced soil foundation.
The immediate settlement can be estimated as:
The equivalent elastic modulus can be estimated using Equation (2), where the modulus of reinforced soil can be derived from the modulus of unreinforced soil by .
The consolidation settlement (sc) of the underlying unreinforced clay layer for a square footing can be calculated as:
where is the compression index of the underlying unreinforced clay layer; is the thickness of the underlying unreinforced clay layer; is the initial void ratio of the underlying unreinforced clay layer; is the initial effective stress; P is the total load on the footing; and B is the width of the footing.
4. Conclusions
Based on the results of the model footing tests on reinforced clayey soils, the following conclusions can be drawn:
- A stiffer load-settlement response was observed when geogrid reinforcement was included, indicating that the reinforced soil in this study exhibited a higher modulus compared to the unreinforced soil. This modulus improvement increased with the settlement ratio (s/B). At a settlement ratio of 5%, the modulus of the clayey soil increased up to 65% and 56% with the inclusion of geogrid reinforcement for laboratory and large-scale field model tests, respectively.
- Laboratory model tests consistently showed a higher improvement in the modulus than the large-scale field model test in this study. For laboratory model tests with five layers of GG2 geogrid, the modulus improvement factor (IFE) ranged from 1.49 at a settlement ratio of 1% to 1.65 at a settlement ratio of 5%. In comparison, the modulus improvement factor (IFE) of large-scale field model test sections with five layers of GG2 geogrid varied from 1.16 to 1.56 as the settlement ratio increased from 1% to 5%.
- The modulus of the reinforced clayey soil exhibited a good correlation with the reinforced ratio, remaining almost constant for test sections with the same reinforced ratio and increasing with an increase in the reinforced ratio.
- The disparity in the modulus performance between laboratory and large-scale field model tests may be attributed to the reinforcement spacing, which affects the degree of interaction among neighboring reinforcement layers.
- The reinforced ratio for laboratory model test sections is much higher than that for large-scale field model test sections. The laboratory model tests could thus overestimate the modulus benefit of geogrid reinforcement.
- The stress distribution angles estimated for the reinforced sections were higher comparted to the unreinforced sections. The stress distribution improvement decreased as the surface pressure increased. The stress distribution improvement factor ranged from 1.50 at a surface pressure of 234 kPa to 1.30 at a surface pressure of 936 kPa with the inclusion of five layers of GG2 geogrid for both laboratory and large-scale field model tests.
- Both the modulus improvement and stress distribution improvement of the reinforced clayey soil increased with an increase in the tensile modulus of the geogrid.
- The proposed modulus improvement factor (IFE) and stress distribution improvement factor can assist engineers in estimating the immediate and consolidation settlement of a reinforced soil foundation.
Funding
This research received no external funding.
Data Availability Statement
Raw data were generated at the Louisiana Transportation Research Center. Derived data supporting the findings of this study are available in the article.
Conflicts of Interest
The authors declare no conflict of interest.
References
- Adams, M.T.; Collin, J.G. Large model spread footing load tests on geosynthetic reinforced soil foundations. J. Geotech. Geoenviron. Eng. 1997, 123, 66–72. [Google Scholar] [CrossRef]
- Albuja-Sánchez, J.; Cóndor, L.; Oñate, K.; Ruiz, S.; Lal, D. Influence of geogrid arrangement on the bearing capacity of a granular soil on physical models and its comparison to theoretical equations. SN Appl. Sci. 2023, 5, 250. [Google Scholar] [CrossRef]
- Biswas, A.; Krishna, A.M.; Dash, S.K. Behavior of geosynthetic reinforced soil foundation systems supported on stiff clay subgrade. Int. J. Géoméch. 2016, 16, 04016007. [Google Scholar] [CrossRef]
- Chenari, R.J.; Bathurst, R.J. Bearing capacity of strip footings seated on unreinforced and geosynthetic-reinforced granular layers over spatially variable soft clay deposits. J. Geotech. Geoenviron. Eng. 2023, 149, 04023034. [Google Scholar] [CrossRef]
- Das, B.M.; Shin, E.C.; Omar, M.T. The bearing capacity of surface strip foundations on geogrid-reinforced sand and clay? A comparative study. Geotech. Geol. Eng. 1994, 12, 1–14. [Google Scholar] [CrossRef]
- DeMerchant, M.; Valsangkar, A.; Schriver, A. Plate load tests on geogrid-reinforced expanded shale lightweight aggregate. Geotext. Geomembr. 2002, 20, 173–190. [Google Scholar] [CrossRef]
- Guido, V.A.; Chang, D.K.; Sweeney, M.A. Comparison of geogrid and geotextile reinforced earth slabs. Can. Geotech. J. 1986, 23, 435–440. [Google Scholar] [CrossRef]
- Lavasan, A.A.; Ghazavi, M. Behavior of closely spaced square and circular footings on reinforced sand. Soils Found. 2012, 52, 160–167. [Google Scholar] [CrossRef]
- Lingwal, P.; Gupta, A.K. Bearing capacity of clayey soil reinforced with geogrid. Adv. Comput. Methods Geomech. 2020, 1, 173–183. [Google Scholar]
- Neupane, M.; Han, J.; Parsons, R.L. Experimental and analytical evaluations of mechanically-stabilized layers with geogrid over weak subgrade under static loading. In Proceedings of the Geo-Congress 2020, Minneapolis, MN, USA, 25–28 February 2020. [Google Scholar]
- Roy, S.S.; Deb, K. Bearing capacity of rectangular footings on multilayer geosynthetic-reinforced granular fill over soft soil. Int. J. Géoméch. 2017, 17, 04017069. [Google Scholar]
- Pincus, H.; Shin, E.; Das, B.; Puri, V.; Yen, S.-C.; Cook, E. Bearing capacity of strip foundation on geogrid-reinforced clay. Geotech. Test. J. 1993, 16, 534–541. [Google Scholar] [CrossRef]
- Useche-Infante, D.; Martinez, G.A.; Arrúa, P.; Eberhardt, M. Experimental study of behaviour of circular footing on geogrid-reinforced sand. Géoméch. Geoengin. 2022, 17, 45–63. [Google Scholar] [CrossRef]
- Xu, Y.; Yan, G.; Williams, D.J.; Serati, M.; Scheuermann, A.; Vangsness, T. Experimental and numerical studies of a strip footing on geosynthetic-reinforced sand. Int. J. Phys. Model. Geotech. 2020, 20, 267–280. [Google Scholar] [CrossRef]
- Chen, Q. An Experimental Study on Characteristics and Behavior of Reinforced Soil Foundation. Doctoral Dissertation 3361, Louisiana State University, Baton Rouge, LA, USA, 2007. [Google Scholar]
- Chen, Q.; Abu-Farsakh, M. Mitigating the bridge end bump problem: A case study of a new approach slab system with geosynthetic reinforced soil foundation. Geotext. Geomembr. 2016, 44, 39–50. [Google Scholar] [CrossRef]
- Huang, C.-C.; Al-Aghbari, M.Y.; Mohamedzein, Y.E.-A. Ultimate bearing capacity of saturated reinforced horizontal ground. Geosynth. Int. 2016, 23, 1–8. [Google Scholar] [CrossRef]
- Mosallanezhad, M.; Hataf, N.; Taghavi, S.S. Experimental and large-scale field tests of grid-anchor system performance in increasing the ultimate bearing capacity of granular soils. Can. Geotech. J. 2016, 53, 1047–1058. [Google Scholar] [CrossRef]
- Huang, C.-C.; Tatsuoka, F. Bearing capacity of reinforced horizontal sandy ground. Geotext. Geomembr. 1990, 9, 51–82. [Google Scholar] [CrossRef]
- Chen, Q.; Abu-Farsakh, M. Ultimate bearing capacity analysis of strip footings on reinforced soil foundation. Soils Found. 2015, 55, 74–85. [Google Scholar] [CrossRef]
- Michalowski, R.L. Limit loads on reinforced foundation soils. J. Geotech. Geoenviron. Eng. 2004, 130, 381–390. [Google Scholar] [CrossRef]
- Sharma, R.; Chen, Q.; Abu-Farsakh, M.; Yoon, S. Analytical modeling of reinforced soil foundation. Geotextile Geomembr. 2009, 27, 63–72. [Google Scholar] [CrossRef]
- Huang, C.C. Settlement of footings on reinforced level sandy ground at peak footing loads. Geosynth. Int. 2011, 18, 124–136. [Google Scholar] [CrossRef]
- Huang, C.C.; Hong, L.I.L. Ultimate bearing capacity and settlement of footings on reinforced sandy ground. Soils Found. 2000, 40, 67–73. [Google Scholar] [CrossRef] [PubMed]
- Raja, M.N.A.; Shukla, S.K. Multivariate adaptive regression splines model for reinforced soil foundations. Geosynth. Int. 2021, 28, 368–390. [Google Scholar] [CrossRef]
- Khosrojerdi, M.; Xiao, M.; Qiu, T.; Nicks, J. Nonlinear equation for predicting the settlement of reinforced soil foundations. J. Geotech. Geoenviron. Eng. 2019, 145, 04019013. [Google Scholar] [CrossRef]
- Raja, M.N.A.; Shukla, S.K. Predicting the settlement of geoysnthetic-reinforced soil foundations using evolutionary artificial intelligence technique. Geotextile Geomembr. 2021, 49, 1280–1293. [Google Scholar] [CrossRef]
- ASTM Standard D 1196-93 (2004); Standard Test Method for Nonrepetitive Static Plate Load Tests of Soils and Flexible Pavement Components, for Use in Evaluation and Design of Airport and Highway Pavements. ASTM International: West Conshohocken, PA, USA, 2005.
- Zornberg, J.G.; Morsy, A.M.; Kouchaki, B.M.; Christopher, B.; Leshchinsky, D.; Han, J.; Tanyu, B.F.; Gebremariam, F.T.; Shen, P.; Jiang, Y. Defining the Boundary Conditions for Composite Behavior of Geosynthetic-Reinforced Soil Structures; National Cooperative Highway Research Program (NCHRP) Final Report No. 24-41; Transportation Research Board: Washington, DC, USA, 2018. [Google Scholar]
- Coronel, J.J. Frictional Interaction Properties between Geomaterials and Geosynthetics. Master’s Thesis, Louisiana State University, Baton Rouge, LA, USA, 2006. [Google Scholar]
Figure 1.
Bridge end bump problem caused by settlement of an embankment fill.

Figure 2.
Geogrid-reinforced soil foundation.

Figure 3.
Model footing test setup. (a) Laboratory model test setup; (b) Large-scale field model test setup.
Figure 3.
Model footing test setup. (a) Laboratory model test setup; (b) Large-scale field model test setup.

Figure 4.
Comparison of IFE values between laboratory and large-scale field model test sections with five layers of GG2 geogrid (N = 5, u/B = h/B = 0.333).
Figure 4.
Comparison of IFE values between laboratory and large-scale field model test sections with five layers of GG2 geogrid (N = 5, u/B = h/B = 0.333).

Figure 5.
IFE values at different settlement ratios (s/B) for laboratory model test sections with various layers of GG2 geogrid (u/B = h/B = 0.333).
Figure 5.
IFE values at different settlement ratios (s/B) for laboratory model test sections with various layers of GG2 geogrid (u/B = h/B = 0.333).

Figure 6.
IFE values at different settlement ratios (s/B) for large-scale field model test sections with different types of geogrids (N = 4, u/B = 0.333, h/B = 0.444).
Figure 6.
IFE values at different settlement ratios (s/B) for large-scale field model test sections with different types of geogrids (N = 4, u/B = 0.333, h/B = 0.444).

Figure 7.
Variation of IFE with h/B at different settlement ratios (s/B) for test sections with a GG2 geogrid. (a) Laboratory model tests; (b) Large-scale field model tests.
Figure 7.
Variation of IFE with h/B at different settlement ratios (s/B) for test sections with a GG2 geogrid. (a) Laboratory model tests; (b) Large-scale field model tests.

Figure 8.
Variation of IFE with the reinforced ratio (Rr). (a) s/B = 1%; (b) s/B = 3%; (c) s/B = 5%.
Figure 8.
Variation of IFE with the reinforced ratio (Rr). (a) s/B = 1%; (b) s/B = 3%; (c) s/B = 5%.

Figure 9.
Comparison of values between laboratory and large-scale field model test sections with five layers of GG2 geogrid (N = 5, u/B = h/B = 0.333).
Figure 9.
Comparison of values between laboratory and large-scale field model test sections with five layers of GG2 geogrid (N = 5, u/B = h/B = 0.333).

Figure 10.
values at different surface footing pressures for large-scale field model test sections with different types of geogrids (N = 4, u/B = 0.333, h/B = 0.444).
Figure 10.
values at different surface footing pressures for large-scale field model test sections with different types of geogrids (N = 4, u/B = 0.333, h/B = 0.444).


Table 1.
Properties of the geogrids.
| Reinforcement | Polymer Type | T a, kN/m | E b, kN/m | Aperture Size, mm | ||
|---|---|---|---|---|---|---|
| MD c | CD d | MD c | CD d | |||
| GG1 geogrid | Polypropylene | 3.6 | 5.1 | 182 | 255 | 33 × 33 |
| GG2 geogrid | Polypropylene | 5.5 | 7.4 | 274 | 372 | 33 × 33 |
| GG3 geogrid | Polypropylene | 8.5 | 10.0 | 425 | 500 | 25 × 30.5 |
a Tensile strength (at 2% strain), b Tensile modulus (at 2% strain), c Machine direction, d Cross machine direction.
Table 2.
Summary of model testing program.
| Reinforcement Configuration | N | u mm | h mm | |
|---|---|---|---|---|
| Laboratory model tests | Unreinforced | … | … | … |
| GG2 | 1, 2, 3, 4, 5 | 51 | 51 | |
| GG2 | 3 | 51 | 25, 51, 76, 102 | |
| Large-scale model tests | Unreinforced | … | … | … |
| GG1, GG2, GG3 | 4 | 152 | 203 | |
| GG2 | 3 | 152 | 305 | |
| GG2 | 4 | 152 | 203 | |
| GG2 | 5 | 152 | 152 |
Table 3.
Moduli of unreinforced/reinforced soils from the tests.
| Test Section | s/B = 1% | s/B = 3% | s/B = 5% | ||||
|---|---|---|---|---|---|---|---|
| Geogrid | N | u/B | h/B | E, MPa | E, MPa | E, MPa | |
| Large-scale field model tests | Unreinforced | 24.5 | 13.0 | 9.9 | |||
| GG1 | 4 | 0.444 | 0.444 | 25.4 | 15.7 | 12.3 | |
| GG2 | 3 | 0.667 | 0.667 | 25.5 | 14.7 | 11.5 | |
| GG2 | 4 | 0.444 | 0.444 | 26.4 | 17.2 | 13.3 | |
| GG2 | 5 | 0.333 | 0.333 | 28.5 | 19.3 | 15.5 | |
| GG3 | 4 | 0.444 | 0.444 | 26.2 | 18.4 | 14.9 | |
| Laboratory Model Tests | Unreinforced | 17.0 | 9.3 | 6.7 | |||
| GG2 | 1 | 0.333 | … | 24.4 | 14.8 | 10.6 | |
| GG2 | 2 | 0.333 | 0.333 | 22.4 | 12.4 | 9.2 | |
| GG2 | 3 | 0.333 | 0.333 | 25.6 | 14.9 | 11.1 | |
| GG2 | 4 | 0.333 | 0.333 | 25.6 | 14.5 | 11.2 | |
| GG2 | 5 | 0.333 | 0.333 | 25.4 | 14.8 | 11.1 | |
| GG2 | 3 | 0.333 | 0.167 | 25.3 | 17.5 | 14.0 | |
| GG2 | 3 | 0.333 | 0.5 | 24.8 | 13.3 | 9.6 | |
| GG2 | 3 | 0.333 | 0.667 | 21.6 | 12.7 | 9.3 | |
Disclaimer/Publisher’s Note: The statements, opinions and data contained in all publications are solely those of the individual author(s) and contributor(s) and not of MDPI and/or the editor(s). MDPI and/or the editor(s) disclaim responsibility for any injury to people or property resulting from any ideas, methods, instructions or products referred to in the content. |
© 2023 by the author. Licensee MDPI, Basel, Switzerland. This article is an open access article distributed under the terms and conditions of the Creative Commons Attribution (CC BY) license (https://creativecommons.org/licenses/by/4.0/).
Share and Cite
MDPI and ACS Style
Chen, Q. Geogrid-Enhanced Modulus and Stress Distribution in Clay Soil. Geotechnics 2024, 4, 41-53. https://doi.org/10.3390/geotechnics4010003
AMA Style
Chen Q. Geogrid-Enhanced Modulus and Stress Distribution in Clay Soil. Geotechnics. 2024; 4(1):41-53. https://doi.org/10.3390/geotechnics4010003
Chicago/Turabian StyleChen, Qiming. 2024. "Geogrid-Enhanced Modulus and Stress Distribution in Clay Soil" Geotechnics 4, no. 1: 41-53. https://doi.org/10.3390/geotechnics4010003