Effect of the Field-Stress State on the Subgrade Resilient Modulus for Pavement Rutting and IRI


Civil and Environmental Engineering, University of South Carolina, Columbia, SC 29208, USA
*
Author to whom correspondence should be addressed.
Geotechnics 2023, 3(2), 360-374; https://doi.org/10.3390/geotechnics3020021
Submission received: 13 April 2023
/
Revised: 2 May 2023
/
Accepted: 12 May 2023
/
Published: 17 May 2023
Abstract
:The new Mechanistic-Empirical Pavement Design Guide (MEPDG) uses the subgrade resilient modulus (MR) as the key input parameter to represent the subgrade soil behavior for pavement design. The resilient modulus increases with an increase in confining pressure, whereas, for an increase in deviatoric stress, it increases for granular soils and decreases for fine-grained soils. The value of MR is highly stress dependent, with the stress state (i.e., bulk stress) a function of the position of the materials in the pavement structure and applied traffic loading. Applying excessive vertical stress at the top of the subgrade without knowing the appropriate stress state can result in permanent deformation. In situ stress must be calculated so the correct resilient modulus can be determined. To facilitate the implementation of MEPDG, this study develops a methodology to select the appropriate subgrade resilient modulus for predicting rutting and IRI. A comprehensive research methodology was undertaken to study the effect of in situ or undisturbed subgrade MR on pavement performance using the MEPDG. Results show that MR obtained from in situ stress is approximately 1.4 times higher than the MR estimate from NCHRP-285. Thus, the in situ stress significantly affects the calculation of subgrade MR and, subsequently, the use of MR in the predicted rutting, with IRI using the AASHTOWare pavement mechanistic-empirical design. Results also show that the pavement sections were classified as in “Good” and “Fair” conditions for rutting and IRI, respectively, considering in situ MR.
1. Introduction
The new guide for the mechanistic-empirical design of new and rehabilitated pavement structures (M-E Design Guide) and the 1993 guide for the design of pavement structures of the American Association of State Highway and Transportation Officials (AASHTO) recommend the use of resilient modulus (MR) of base and subgrade materials for pavement design and analysis [1,2,3]. MR is the ratio of the applied deviator stress (σd) to the resilient strain (Ɛr) [4]. It represents the stiffness of the pavement unbound layer configuration subjected to repeated traffic loading. It is the primary input for the subgrade soil in MEPDG and is essential for computing stresses, strains, and deformations in pavement structures induced by applied traffic loads [5,6,7,8,9,10]. Laboratory test methods include the repeated load triaxial test (RLTT) (AASHTO-T307-99 2017) [11], the most commonly used method for determining the resilient modulus of subgrade soils.
The RLTT test is commonly used to measure the resilient modulus of subgrade soils in the laboratory [12,13,14,15,16,17,18]. This test is designed to simulate the stress induced by traffic loading through a series of cyclic deviator stresses applied to the specimen at different confining pressures [13]. Seed, Mitry, Monismith, and Chan [19] found that the stress variables (e.g., bulk stress, deviator stress, and octahedral stress) significantly affect the resilient modulus. Several models have been built to predict the resilient modulus of subgrade soils using bulk stress, deviatoric stress, or a combination [20,21,22,23,24,25]. The bulk stress, which includes the confining pressure and deviator stress, is used by most resilient-modulus prediction models. For example, when the bulk stress is 70 kPa, the deviator stress and confining pressure can be 40 kPa and 10 kPa, respectively, and the deviator stress and confining pressure can be 10 kPa and 20 kPa, respectively. The value of the bulk stress is the same, but the stress state is different. The models need to better reflect the effect on the bulk stress under various combinations of the confining pressure and deviator stress. The deviator and bulk-stress models are classified as the two-parameter models and are generally used for cohesive and granular soils, respectively. The three-parameter models, such as octahedral stress and the universal model, are used for cohesive and granular soils [26,27].
Predicting flexible pavement performance is highly dependent on the accuracy of the MR value. Islam and Gassman (2023) [28] found that the laboratory-measured MR obtained using the stress state in NCHRP-285 predicted higher rutting than the MR back calculated from FWD testing and PMED v2.6.2.2 default values. The rutting predicted from the laboratory-measured MR exceeded the field-measured distress but was below the design threshold. Furthermore, the least amount of AC top-down cracking was predicted for pavements with fine-grained subgrade soils when using the laboratory-measured MR. Rada and Witczak (1981) [29] suggested that the applied stress level influenced the MR. It is important to note that the resilient modulus for subgrade soils is highly stress dependent, with the stress state being a function of the position of the material in the pavement structure and applied traffic loading [30]. The MR of fine-grained soil generally decreases with increasing deviatoric stress (this is referred to as ‘stress-softening’ behavior; with increased stress, deformation increases and modulus decreases), whereas the MR of coarse-grained soils generally increases with increasing deviatoric stress (this is referred to as the ‘strain-hardening’ effect due to the reorientation of the grains into the denser state) [30,31,32,33,34]. Model forms characterizing the relationship between MR and deviatoric stress are bi-linear, hyperbolic, semi-log, and log-log [35,36,37]. To properly investigate the “strain-hardening” and “stress-softening” effect of coarse-grained and fine-grained soils, a field-stress state should be considered for determining MR for a typical pavement structure and traffic loading.
To date, limited research has been conducted to evaluate the influence of the methodology used to estimate in situ MR for subgrade soils. Thus, this study calculated an in situ stress state from the existing pavement conditions to overcome the issue. Eleven Asphalt Concrete (AC) pavement sections were available for this study, and 73 boreholes were used to characterize the subgrade soils and develop a correlation between laboratory-measured MR per NCHRP-285 [38] “MR(285)” and in situ subgrade MR from the field- stress state “MR(in situ)”. A research study was undertaken to investigate the effect of field stress on subgrade MR and predict pavement rutting and IRI for flexible pavement. The resilient modulus test results were examined to determine how confining pressure and deviator stress affected the soil’s resilient behavior. A summary of the findings is given to understand better the resilient properties of the in situ stress state of subgrade soil.
2. Research Questions and Objectives
Three research questions were addressed to fulfill the overall research objectives of this study.
- What is the effect of the stress conditions on the calculated MR for subgrade soil?
- How does the subgrade MR affect the predicted rutting and IRI?
- Is it possible to classify pavement conditions based on predicted and measured pavement performance?
To address these research questions, the following research work was completed:
- Task 1: Conduct Repeated Load Triaxial Test (RLTT) as per AASHTO T307 (AASHTO 2017) for coarse-grained and fine-grained samples.
- Task 2: Obtain laboratory-measured MR (MR(285)) as per NCHRP-285 [38] and in situ MR (MR(in situ)) using field-stress conditions. Establish a linear relationship between the MR(285) and MR(in situ) and estimate the Pearson product-moment correlation coefficient (r). The value of r can range from 0.0, indicating no relationship between the two variables, to positive or negative 1.0, indicating a strong linear relationship between the two variables. Bias and Standard Error of Estimate (SEE) were also calculated.
- Task 3: Predict rutting and IRI using MEPDG and compare them with field-measured values. Classify the pavement conditions as “Good”, “Fair”, and “Poor” as per FHWA guidelines [39] for rutting and IRI.
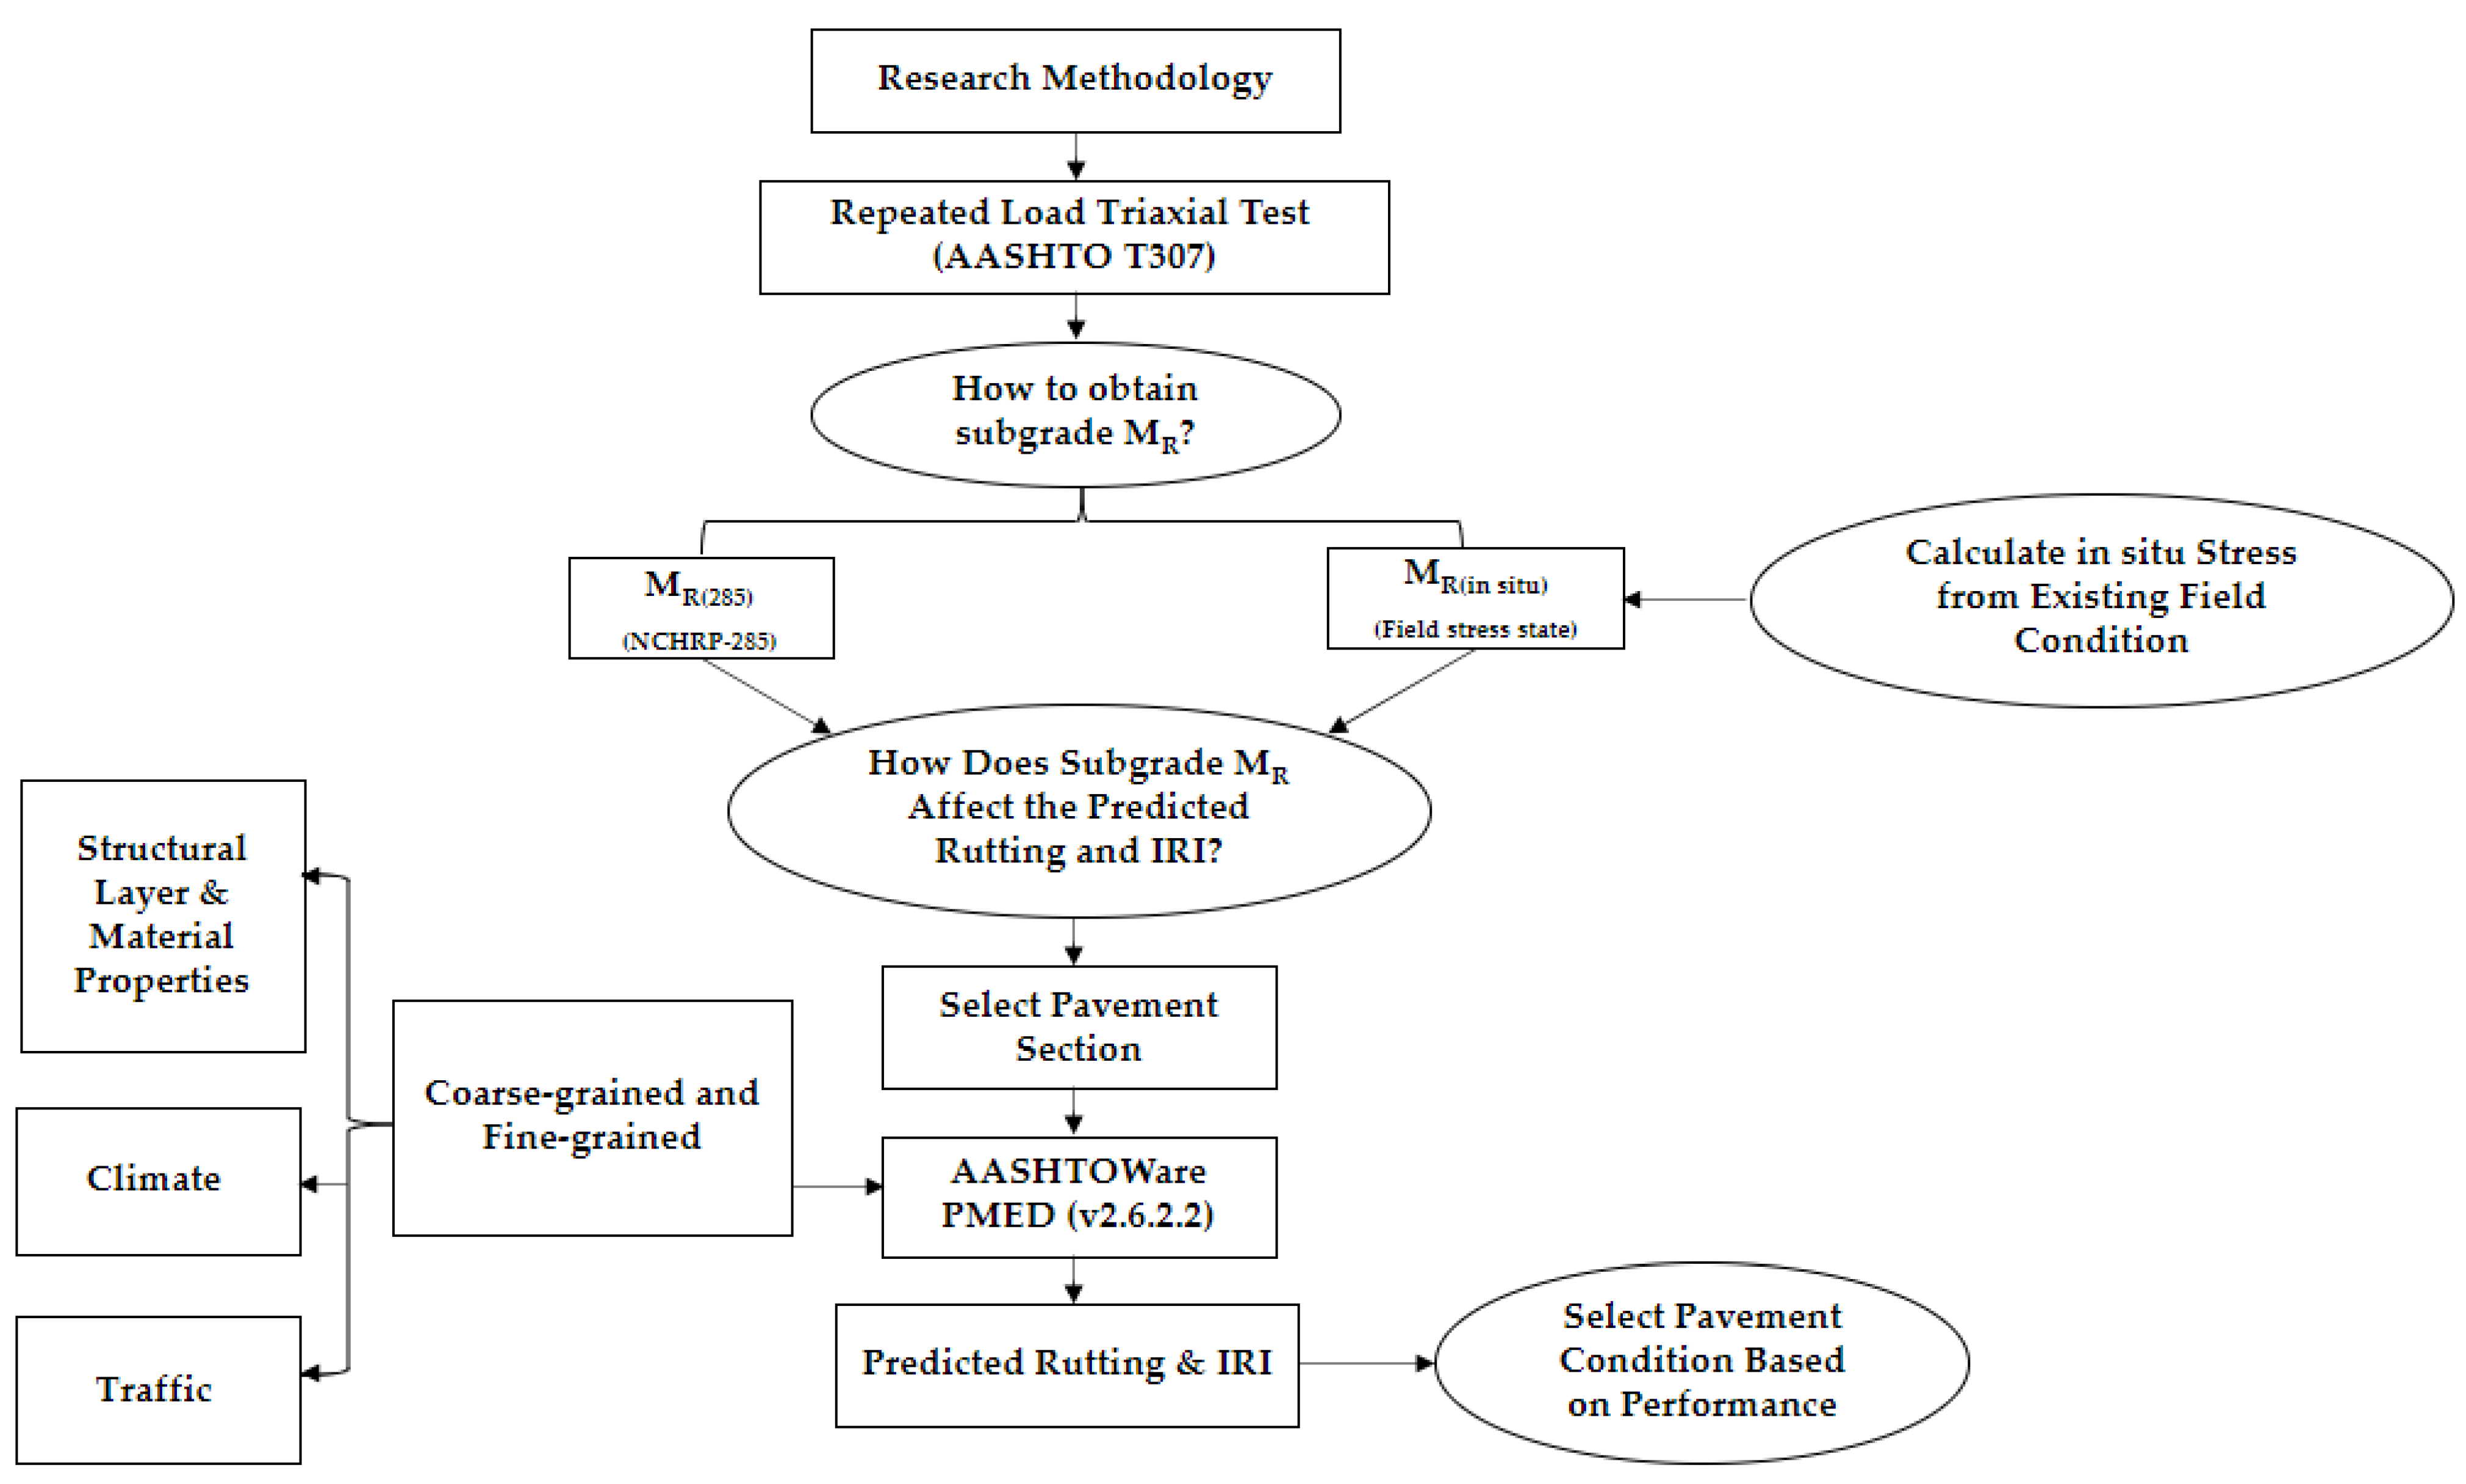
3. Research Methodology
The primary variable to be investigated in this study is the subgrade resilient modulus, MR, that will be used to predict pavement rutting, and IRI, using the AASHTOWare PMED software (v2.6.2.2). Repeated load triaxial tests were performed in the laboratory using AASHTO T307, and the MR was obtained from two different methods: (1) using the stress conditions per NCHRP-285 (MR(285)) and (2) considering the in situ stress (MR (in situ)). Data for 11 asphalt concrete (AC) pavement sections in South Carolina were used in this study (see Table 1). Table 1 tabulates the construction finish year, pavement length, and number of Shelby tube samples for each section. A total of 73 samples of subgrade soil were collected for this study. Pavement sections B278 and L72 will be used to illustrate the methodology. B278 has coarse-grained subgrade soil, and L72 has fine-grained subgrade soil.
At each pavement site, the pavement was cored, layer thicknesses were measured, and samples of subgrade soil were collected from beneath the pavement. Shelby tube samples were used to determine the resilient modulus per AASHTO T307. A hand auger was used to collect bulk samples from each borehole. Tests performed include Atterberg Limits (ASTM D 4318/AASHTO T 89 and T 90), grain size analysis (ASTM D 421 and D 422/AASHTO T 87 and T 88), soil classification (ASTM D 2487/AASHTO M 145), specific gravity (ASTM D 854/AASHTO T 100), moisture content (ASTM D 2216-90/AASHTO T 265), and standard Proctor compaction (ASTM D 698-78/AASHTO T 99-90).
Figure 1 illustrates how subgrade MR obtained by the two methods was used as input to the AASHTOWare PMED process. Using the PMED software (v2.6.2.2), the rutting and IRI were predicted for each trial pavement section based on subgrade MR values and compared with the measured field values. Finally, the pavement section condition was classified per FHWA [39].
3.1. Pavement Profile Layer Information
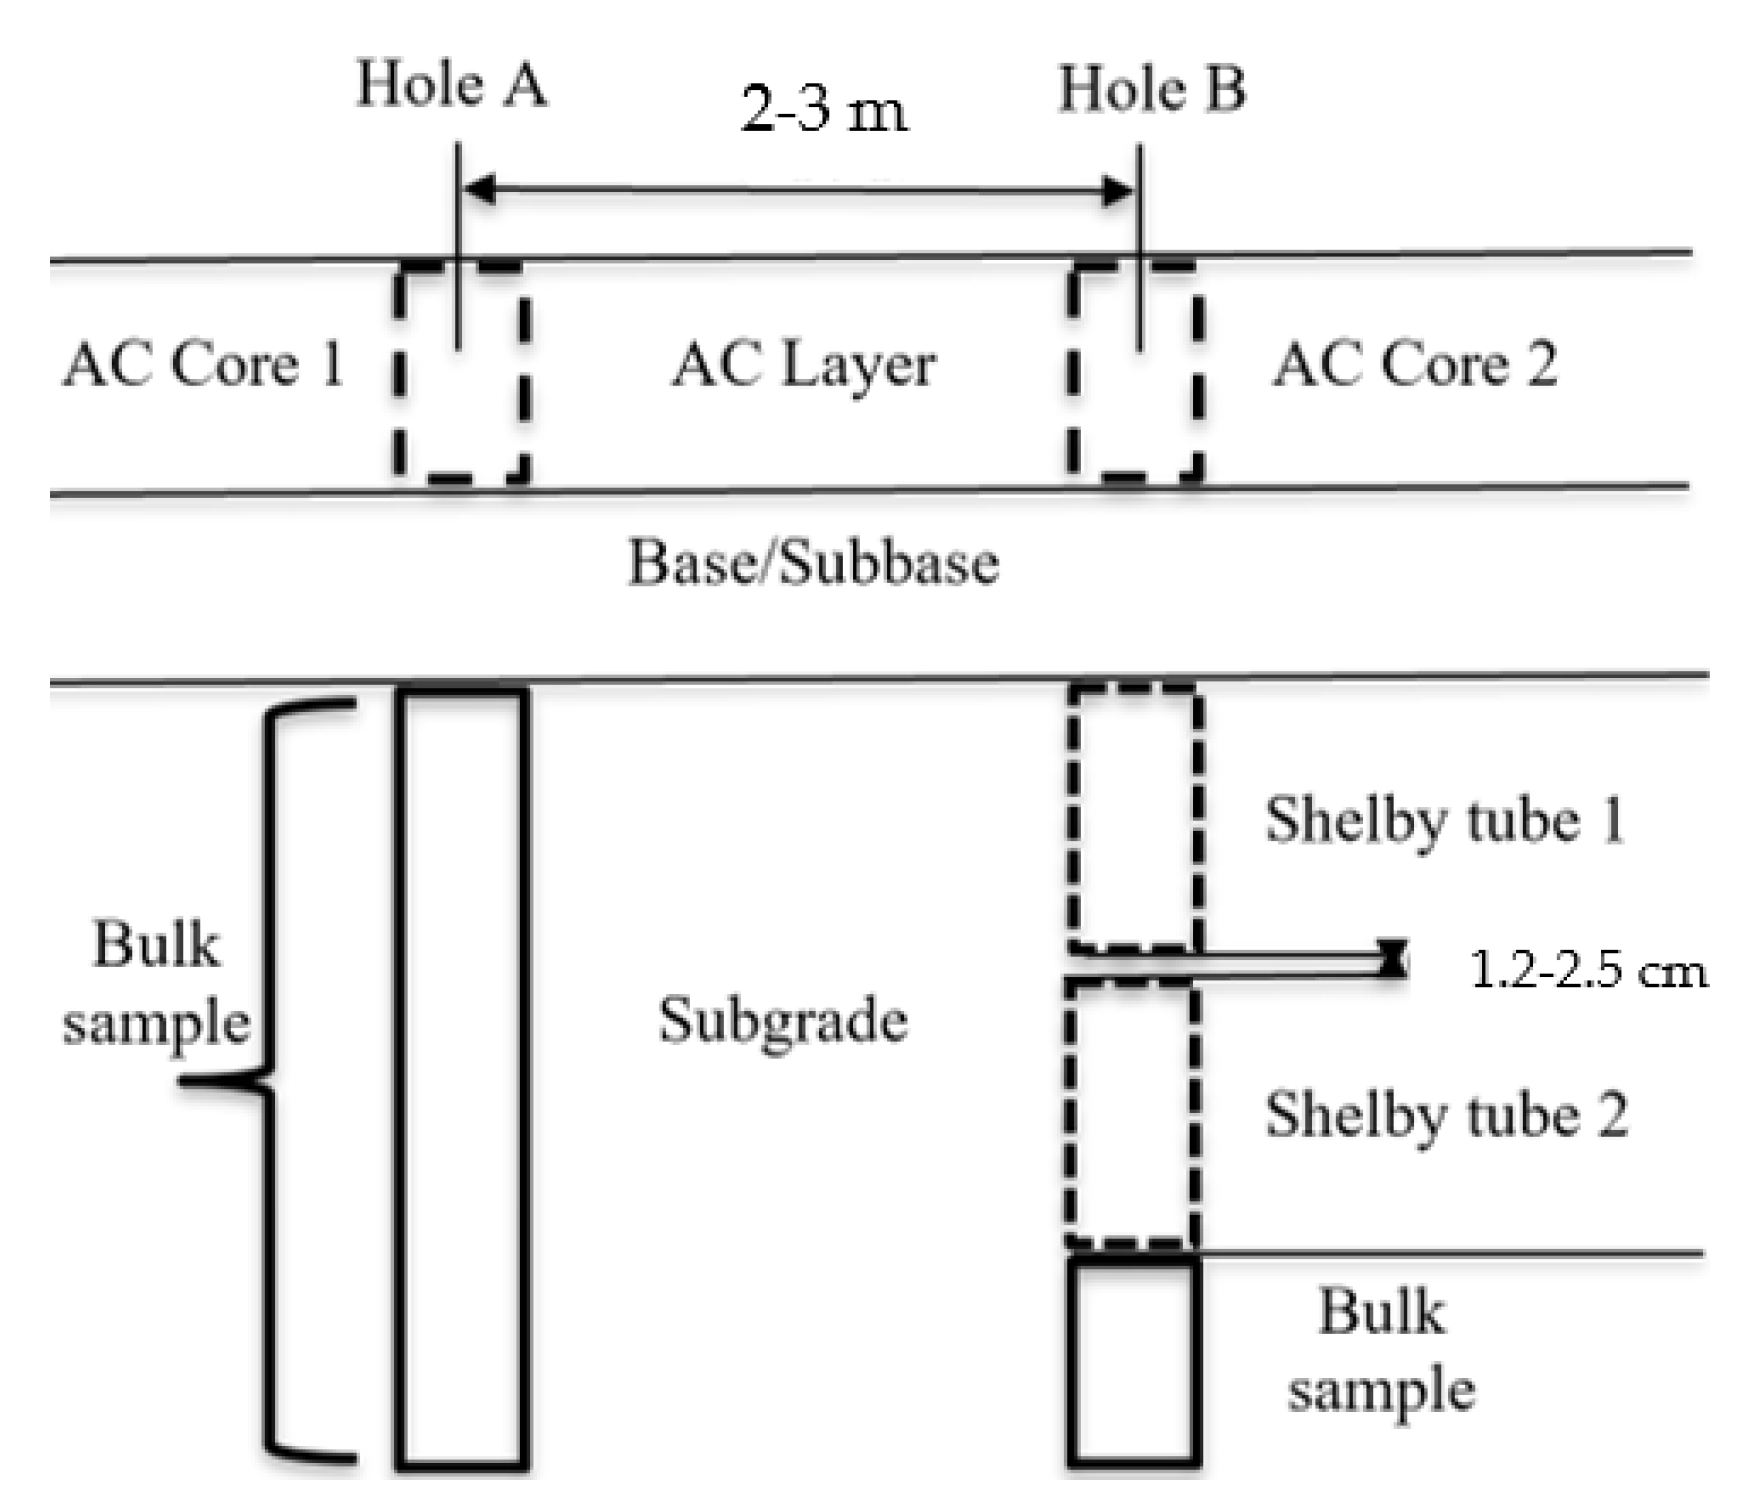
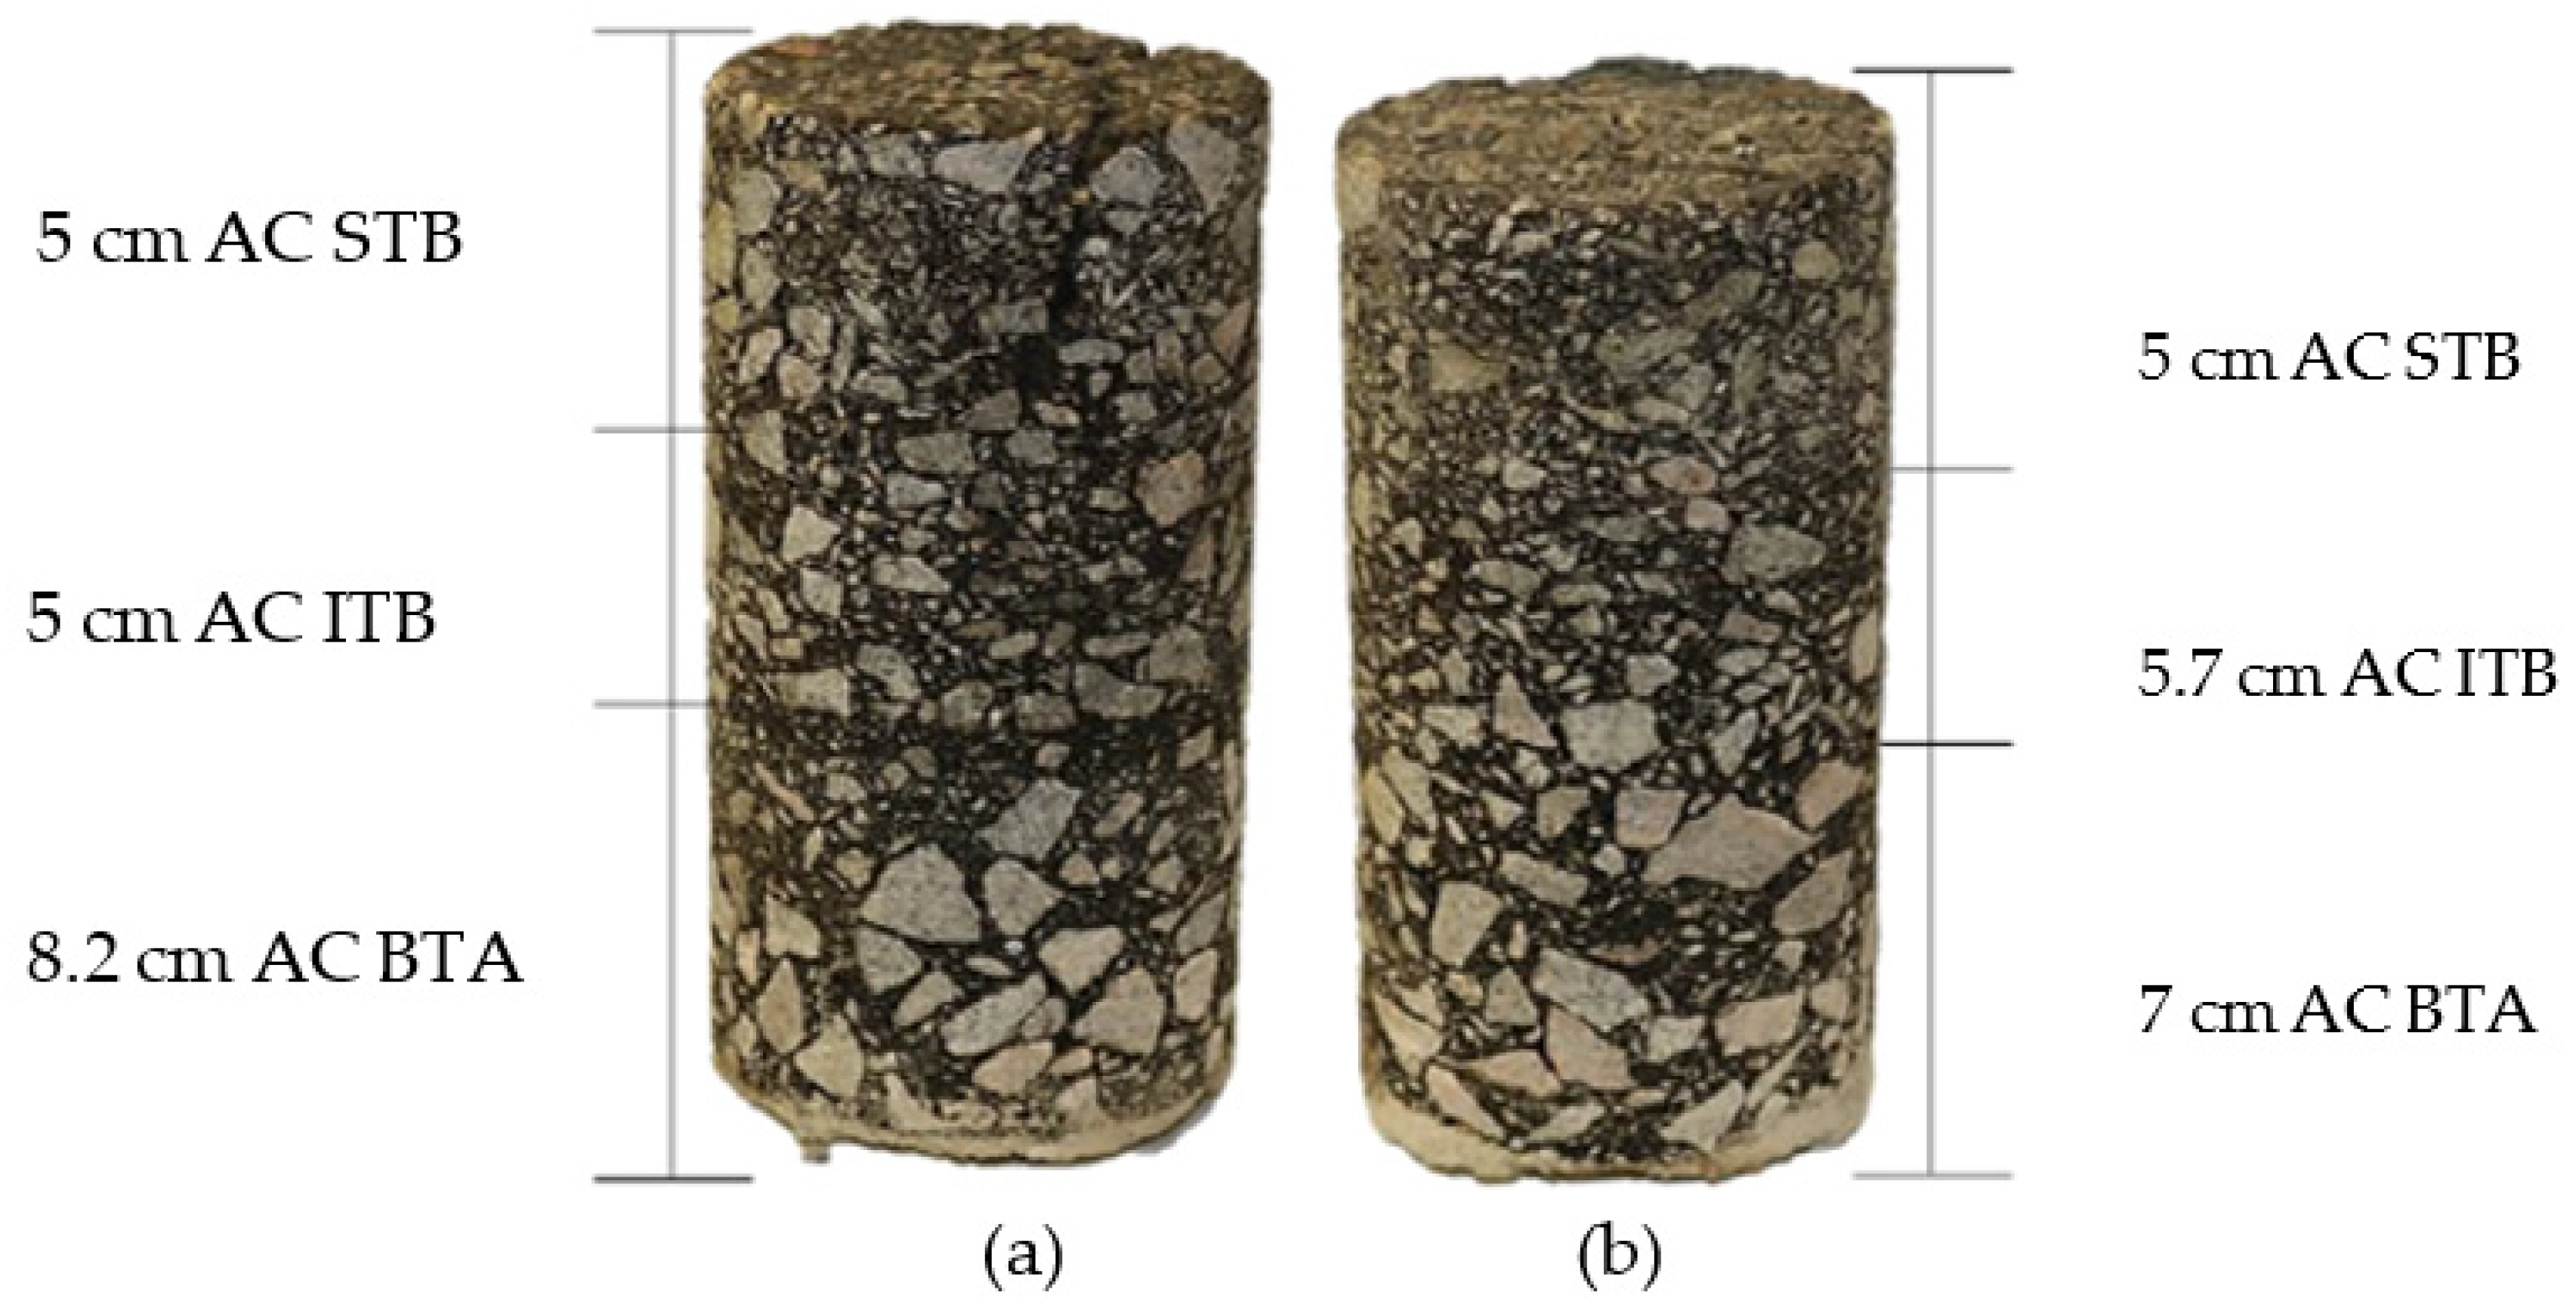
Pavement profiles for eleven sites in South Carolina were obtained from field investigations that included drilling and sampling of the subsurface soils between 2015 and 2021. Two holes were cored for each boring location (see Figure 2). Hole A corresponds to a location on the pavement surface that was free of visible surface distress (“non-distressed”), while Hole B corresponds to a location with surface distress (“distressed”). The core length was measured after extraction, and the number of layers of different asphalt mixture types within the AC layer was identified (see Figure 3). The base/subbase thickness measurements were obtained after extracting the asphalt core. The thickness of each layer and the corresponding unit weight for each borehole along sections B278 and L72 are summarized in Table 2. Each pavement section is divided into segments based on the number of boreholes along each section. For example, B278 has 3 segments, B278--1, B278--2 and B278--3. The detailed procedures used to collect the thin-walled Shelby tube and bulk soil samples are documented in Islam and Gassman (2023) [28]. Note that the AC thickness of Hole A was used to calculate in situ stress.

Table 2.
Summary of Pavement Profile Information.
| Site ID | BH | Asphalt Core | Base Layer | Subgrade Layer | ||||
|---|---|---|---|---|---|---|---|---|
| Thickness (cm) | Unit Weight γ1 (kN/m3) | Thickness (cm) | Unit Weight γ2 a (kN/m3) | Thickness (cm) | Unit weight γ3 b (kN/m3) | |||
| Core 1 (Hole A) | Core 2 (Hole B) | |||||||
| B278 | B278-1 | 17.7 | 18.2 | STB = 22.3 ITB = 22.6 BTA = 22.8 | 15.2 | 20.3 | 15.4 | 16.8 |
| B278-2 | 19.1 | 19.1 | 16.5 | 16.5 | 16.9 | |||
| B278-3 | 15.2 | 15.2 | 17.8 | 17.3 | 17.6 | |||
| L72 | L72-1 | 16.5 | 16.5 | 10.2 | 22.2 | 16.2 | 16.9 | |
| L72-2 | 16.8 | 16.8 | 12.7 | 15.7 | 16.9 | |||
| L72-3 | 36.8 | 35.6 | No base | 16.3 | 16.9 | |||
| L72-4 | 17.8 | 17.8 | 12.7 | 16.5 | 16.9 | |||
| L72-5 | 16.5 | 15.2 | 11.4 | 17.0 | 17.4 | |||
| L72-6 | 17.8 | 17.8 | 10.2 | 16.2 | 16.9 | |||
| L72-7 | 29.2 | 25.4 | No base | 16.2 | 16.9 | |||
| L72-8 | 25.4 | 25.4 | No base | 17.3 | 18.4 | |||
| L72-9 | 27.3 | 26.0 | No base | 17.4 | 18.4 | |||
| L72-10 | 29.2 | 25.4 | No base | 17.3 | 18.4 | |||
| L72-11 | 29.8 | 27.9 | No base | 16.7 | 17.3 | |||
Note: γ1 = average of STB, ITB, and BTA, STB = Surface Type B, ITB = Intermediate Type B, BTA = Base Type A (this average value depends on the layer type, and corresponding unit weights were used), a Base unit weight obtained from Amirkhanian and Corley [40]. b Natural unit weight determined from Shelby tube samples.
3.2. Resilient Modulus Tests
Resilient modulus (MR) tests were performed on the 76 mm-diameter by 152 mm-long specimens obtained from thin-walled Shelby tubes. A GDS Advanced Dynamic Triaxial Testing System performed the tests per AASHTO T 307.
The subgrade MR was obtained using the constitutive model in Equation (1) (NCHRP-1-37A, 2004) [42]:
where
- Pa = atmospheric pressure (101.1 kPa)
- k1, , and = model parameters
- θ = bulk stress = (σ1 + σ2 + σ3)
- σ1, σ2, and σ3 = principal stresses and
- τoct = octahedral shear stress
- =
After completing the MR testing procedure (see Islam and Gassman (2023) [28] for details), the MR was calculated for 15 sequences per AASHTO T307. For determining , , and , Equation (1) was simplified and transferred to the logarithmic function. Two approaches were used to estimate the MR: (1) using the stress state recommended by NCHRP-285 and (2) using the in situ stress state. First, the laboratory-measured resilient modulus (MR(285)) was calculated using Equation (1) with confining stress (σ3) equal to 14 kPa and cyclic stress (deviator) equal to (σd) 41 kPa per NCHRP-285 (2004). Second, the laboratory-measured resilient modulus for the in situ stress state (MR (in situ)) was calculated using Equation (1) with confining stress (σ3) and cyclic stress/deviator (σd) stress calculated from the in situ stress state.
3.3. Calculate In Situ Stress for the Existing Pavement Section
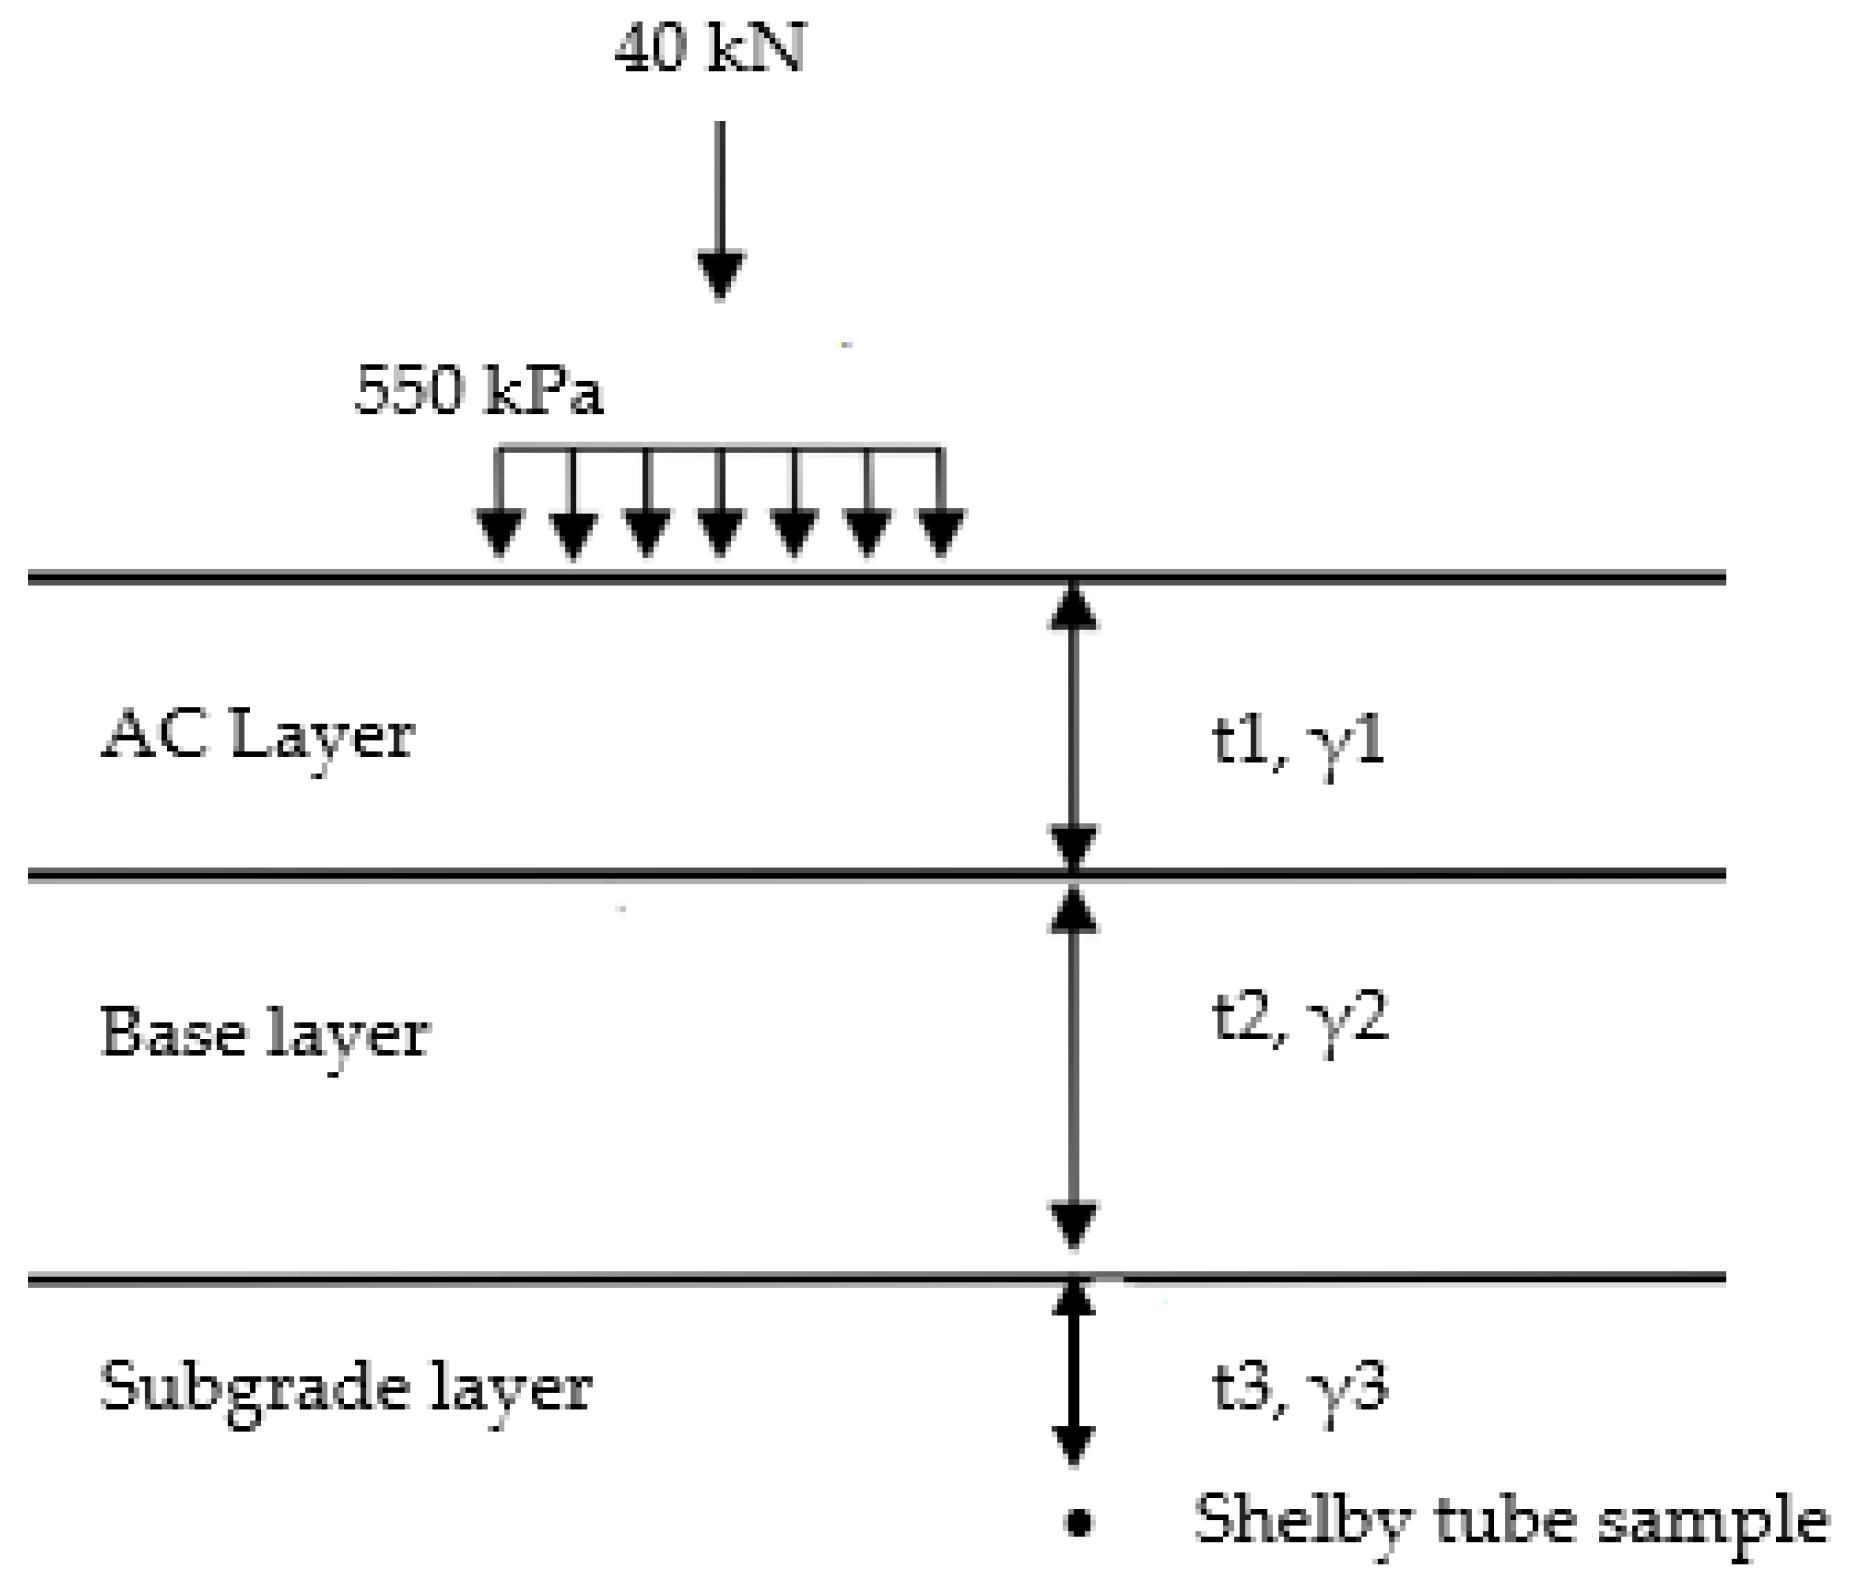
As shown in Figure 4, each pavement section consists of a t1 cm-thick Asphalt Concrete (AC) layer overlying a t2 cm-thick base layer and a t3 cm-thick layer of subgrade soil. The t1 thickness consists of up to 3 layers (STB, ITB, and BTA in Figure 3), and the unit weight of these layers was obtained from laboratory testing (AASHTO T166). The value of the unit weight is 22.3 kN/m3 for STB, 2.6 kN/m3 for ITB, and 22.8 kN/m3 for BTA. An average of these values was used to represent the unit weight of the AC layer. The base unit weight was obtained from Amirkhanian and Corley [40], and the subgrade unit weight was obtained from measurements of the Shelby tube samples. The values are summarized in Table 2.
A 40 kN load was considered to simulate the conditions used in the design process. The 40 kN load level is equivalent to a tire inflation pressure of 520 to 550 kPa (per AASHO 1972) and was used for the analysis.
The total vertical stress acting on the soil sample is the sum of the vertical stresses from the pavement structure (σ1pave) and the applied load (σ1load). Similarly, the total horizontal stress is the sum of the horizontal stresses from the pavement structure (σ3pave) and the applied load (σ3load). The groundwater table was not encountered during sampling, so total and effective stress are considered equal. Equations (2) and (3) present the calculations for the vertical and horizontal stress from the pavement structure.
When the load is applied over a single circular loaded area, the most critical stress-strain and deflection occur under the center of the circular area on the axis of symmetry, where and , so are the principal stresses [43] similar to a flexible plate with a radius ɑ and a uniform pressure q. The stresses beneath the center of the plate can be determined from Equations (4) and (5) [43].
where σ1load = σz; σ3load = σr; Z = (t1 + t2 + t3), cm; uniform pressure, q = P/A, kN/m2, where A = area, m2; circular load, P = 40 kN; assume Poisson’s ratio, = 0 to 0.5
Thus, the total vertical and horizontal stress was calculated using Equations (6) and (7), respectively.
σ1 = σ1pave + σ1load
σ3 = σ3pave + σ3load
3.4. Pavement Input Parameters
Table 4 summarizes the subgrade input parameters, which include the model parameters (k1, k2, and k3) for all boreholes at the two pavement sections and the corresponding resilient modulus, MR(285), found using the stress state per NCHRP-285 and the resilient modulus, MR(in situ), found using the in situ stress state.
PG 64-22 grade AC input was selected as a Level 2 input, and the dynamic modulus value was obtained from laboratory testing per AASHTO T342 and categorized as Level 1 input. The remaining AC and base parameters were used as Level 3 for each pavement trial (PMED v2.6.2.2). The Modern Era Retrospective-Analysis for Research and Applications (MERRA) climate stations were selected for each pavement section. As part of the PMED process, the PMED (v2.6.2.2) program accesses the climate files associated with each station. The files are each reported monthly, including temperature, wind speed, cloud cover, precipitation, and relative humidity. The traffic input parameters for PMED analysis were obtained from Islam and Gassman (2023) [28].
3.5. Threshold Values for Pavement Rutting and IRI
The threshold limit for the rutting and IRI are 12.7 mm and 3157 mm/km, respectively [3]. A ninety percent reliability level was considered for the PMED analysis. Historical records for the pavement sections included IRI measurements obtained periodically but did not include the initial IRI at the end of const ruction. Thus, linear regression was performed on the historical data to estimate the initial IRI for each pavement section. The initial IRI was found by extrapolating the data to the construction time. These values are summarized in Table 4 and categorized as Level 1.
4. Results
The effect of in situ stresses is discussed, and the resilient modulus testing results and the relation between MR(285) and MR(in situ) are presented. The predicted rutting and IRI values found using both MRs are discussed and compared to the field-measured values. Finally, the pavement section was classified based on rutting and IRI values per FHWA (2015).
4.1. Effect of In Situ Stress
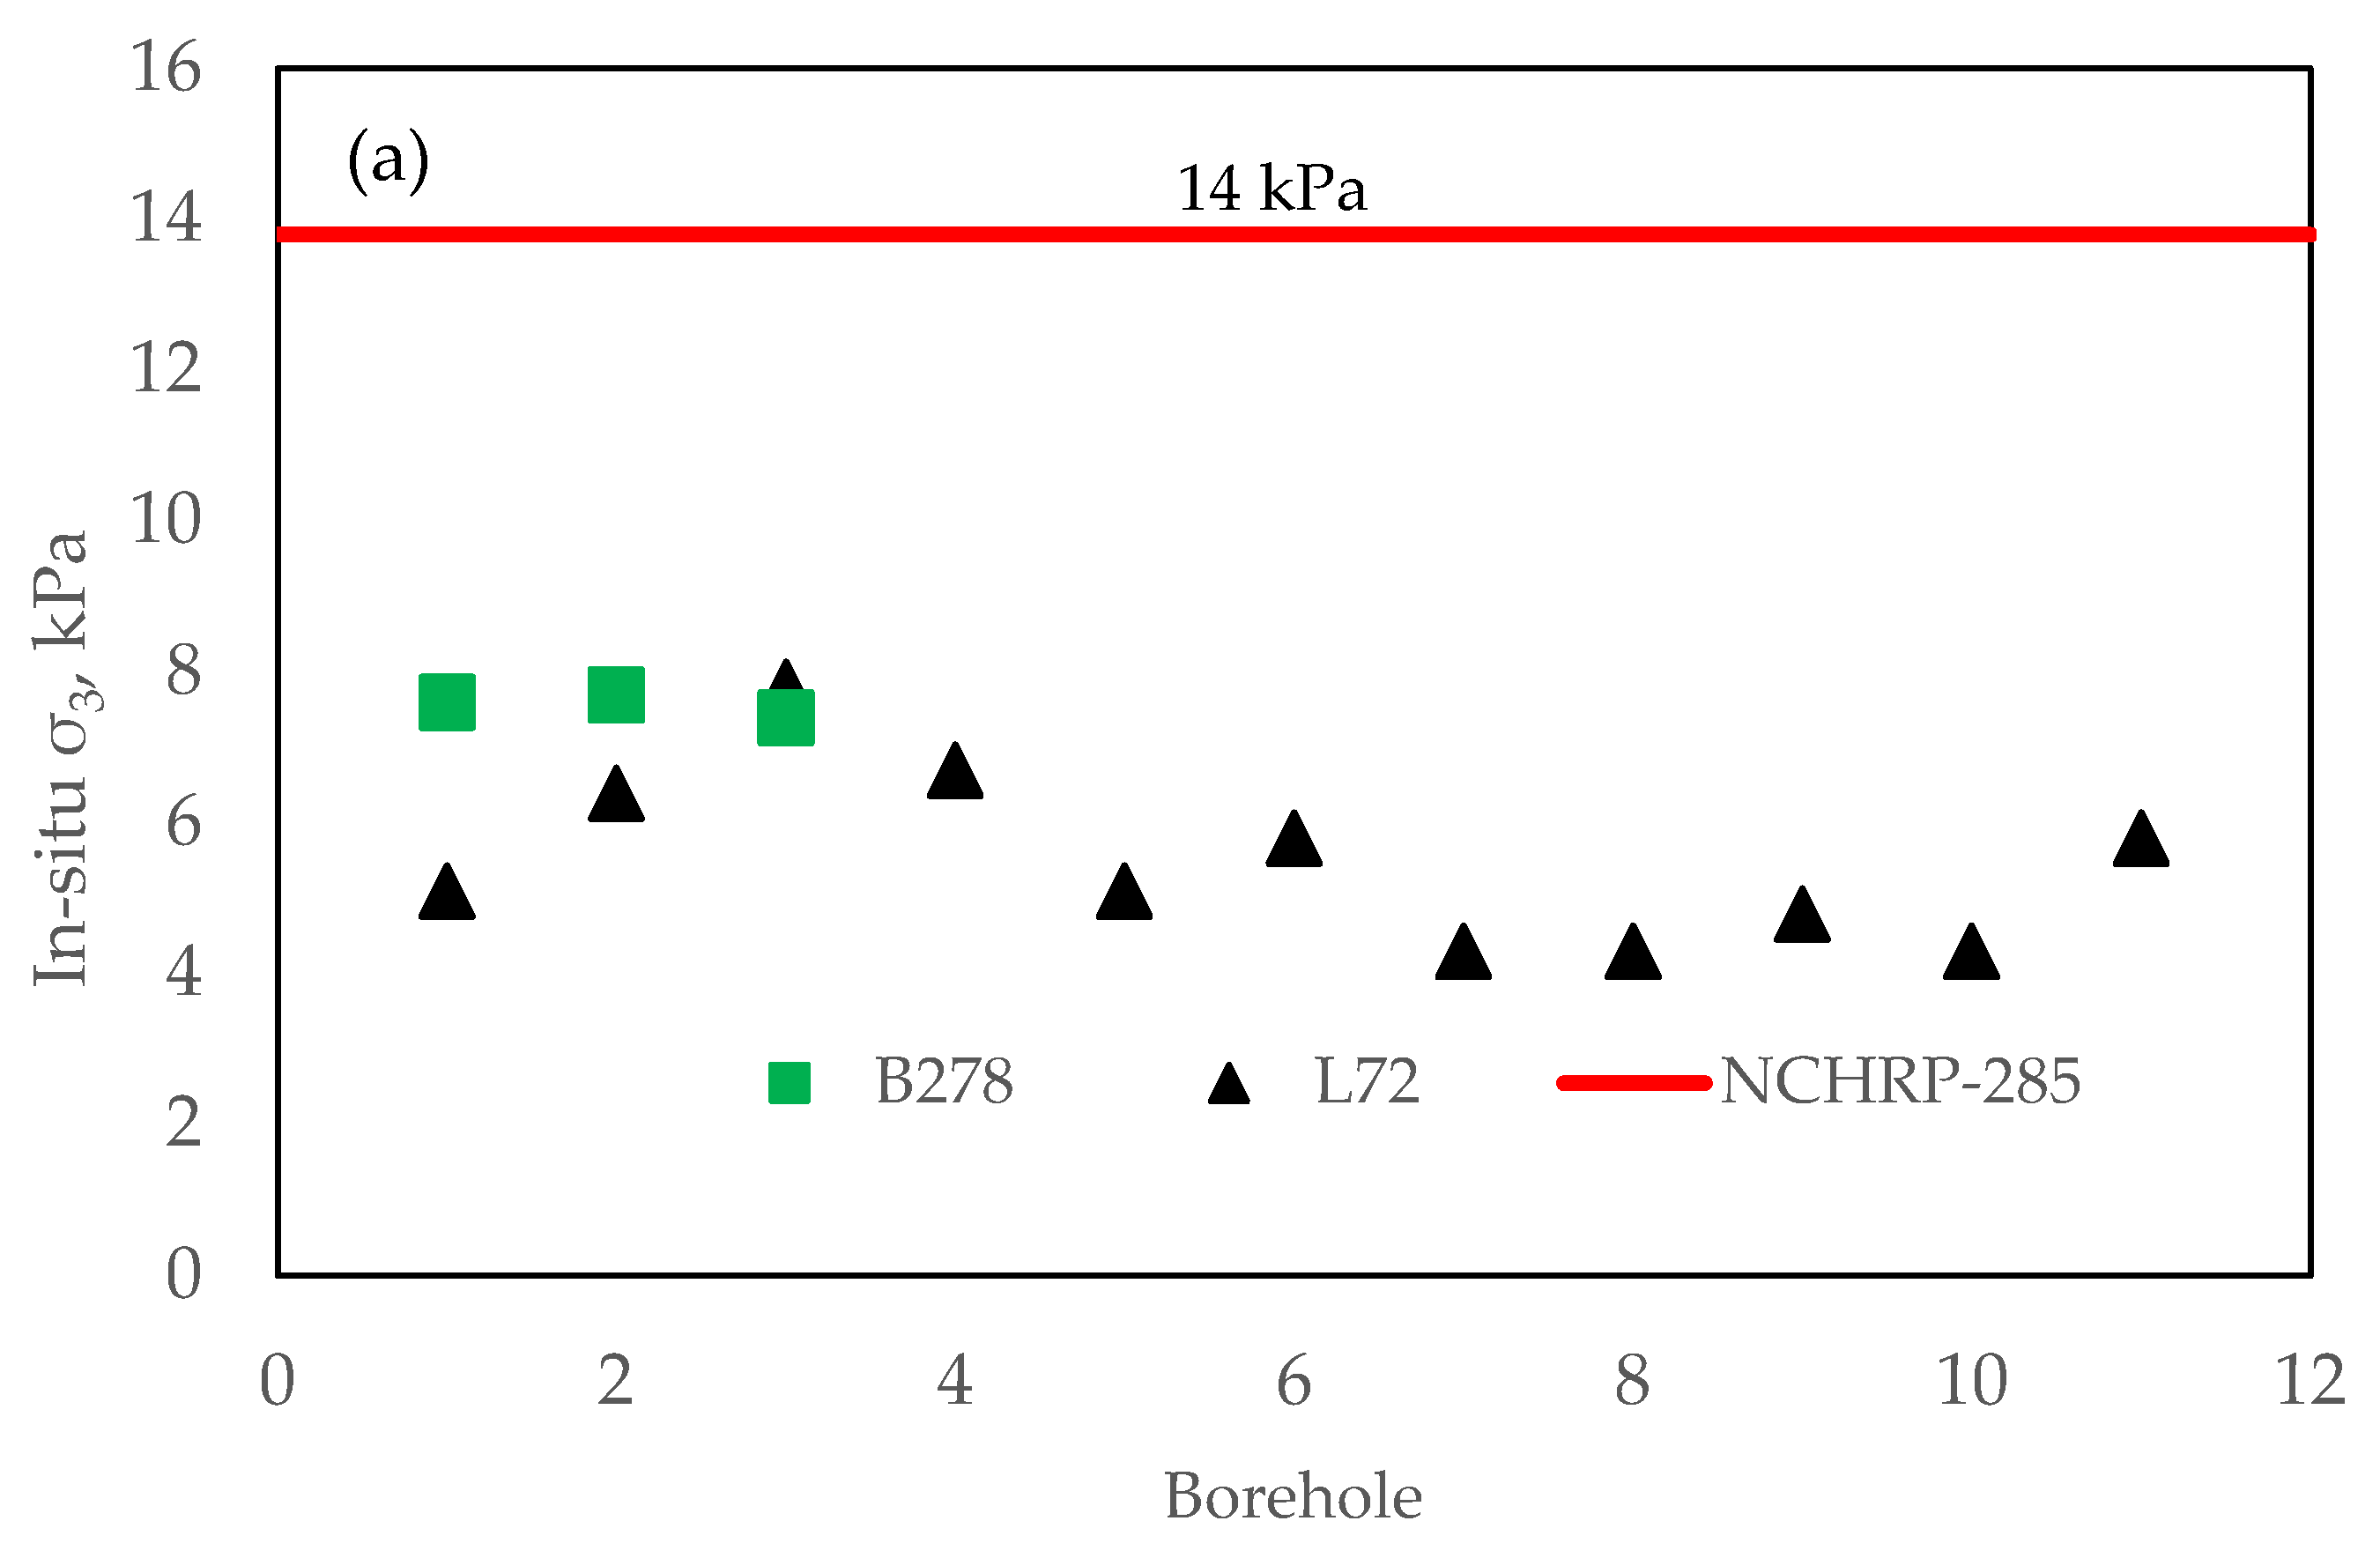
Figure 6 depicts the graphical comparison of in situ stress and stress recommended by NCHRP-285 [38]. As shown in Figure 6a, the in situ σ3 is approximately 2.4 (average) times less than that of NCHRP-285. Similarly, as shown in Figure 6b, the in situ σd is approximately 3.8 (average) times higher than NCHRP-285 [38]. The σd is a function of vertical stress related to the pavement thickness. There is no vertical stress at zero thickness; vertical stress increases with increasing thickness.
4.2. Resilient Modulus Test Result
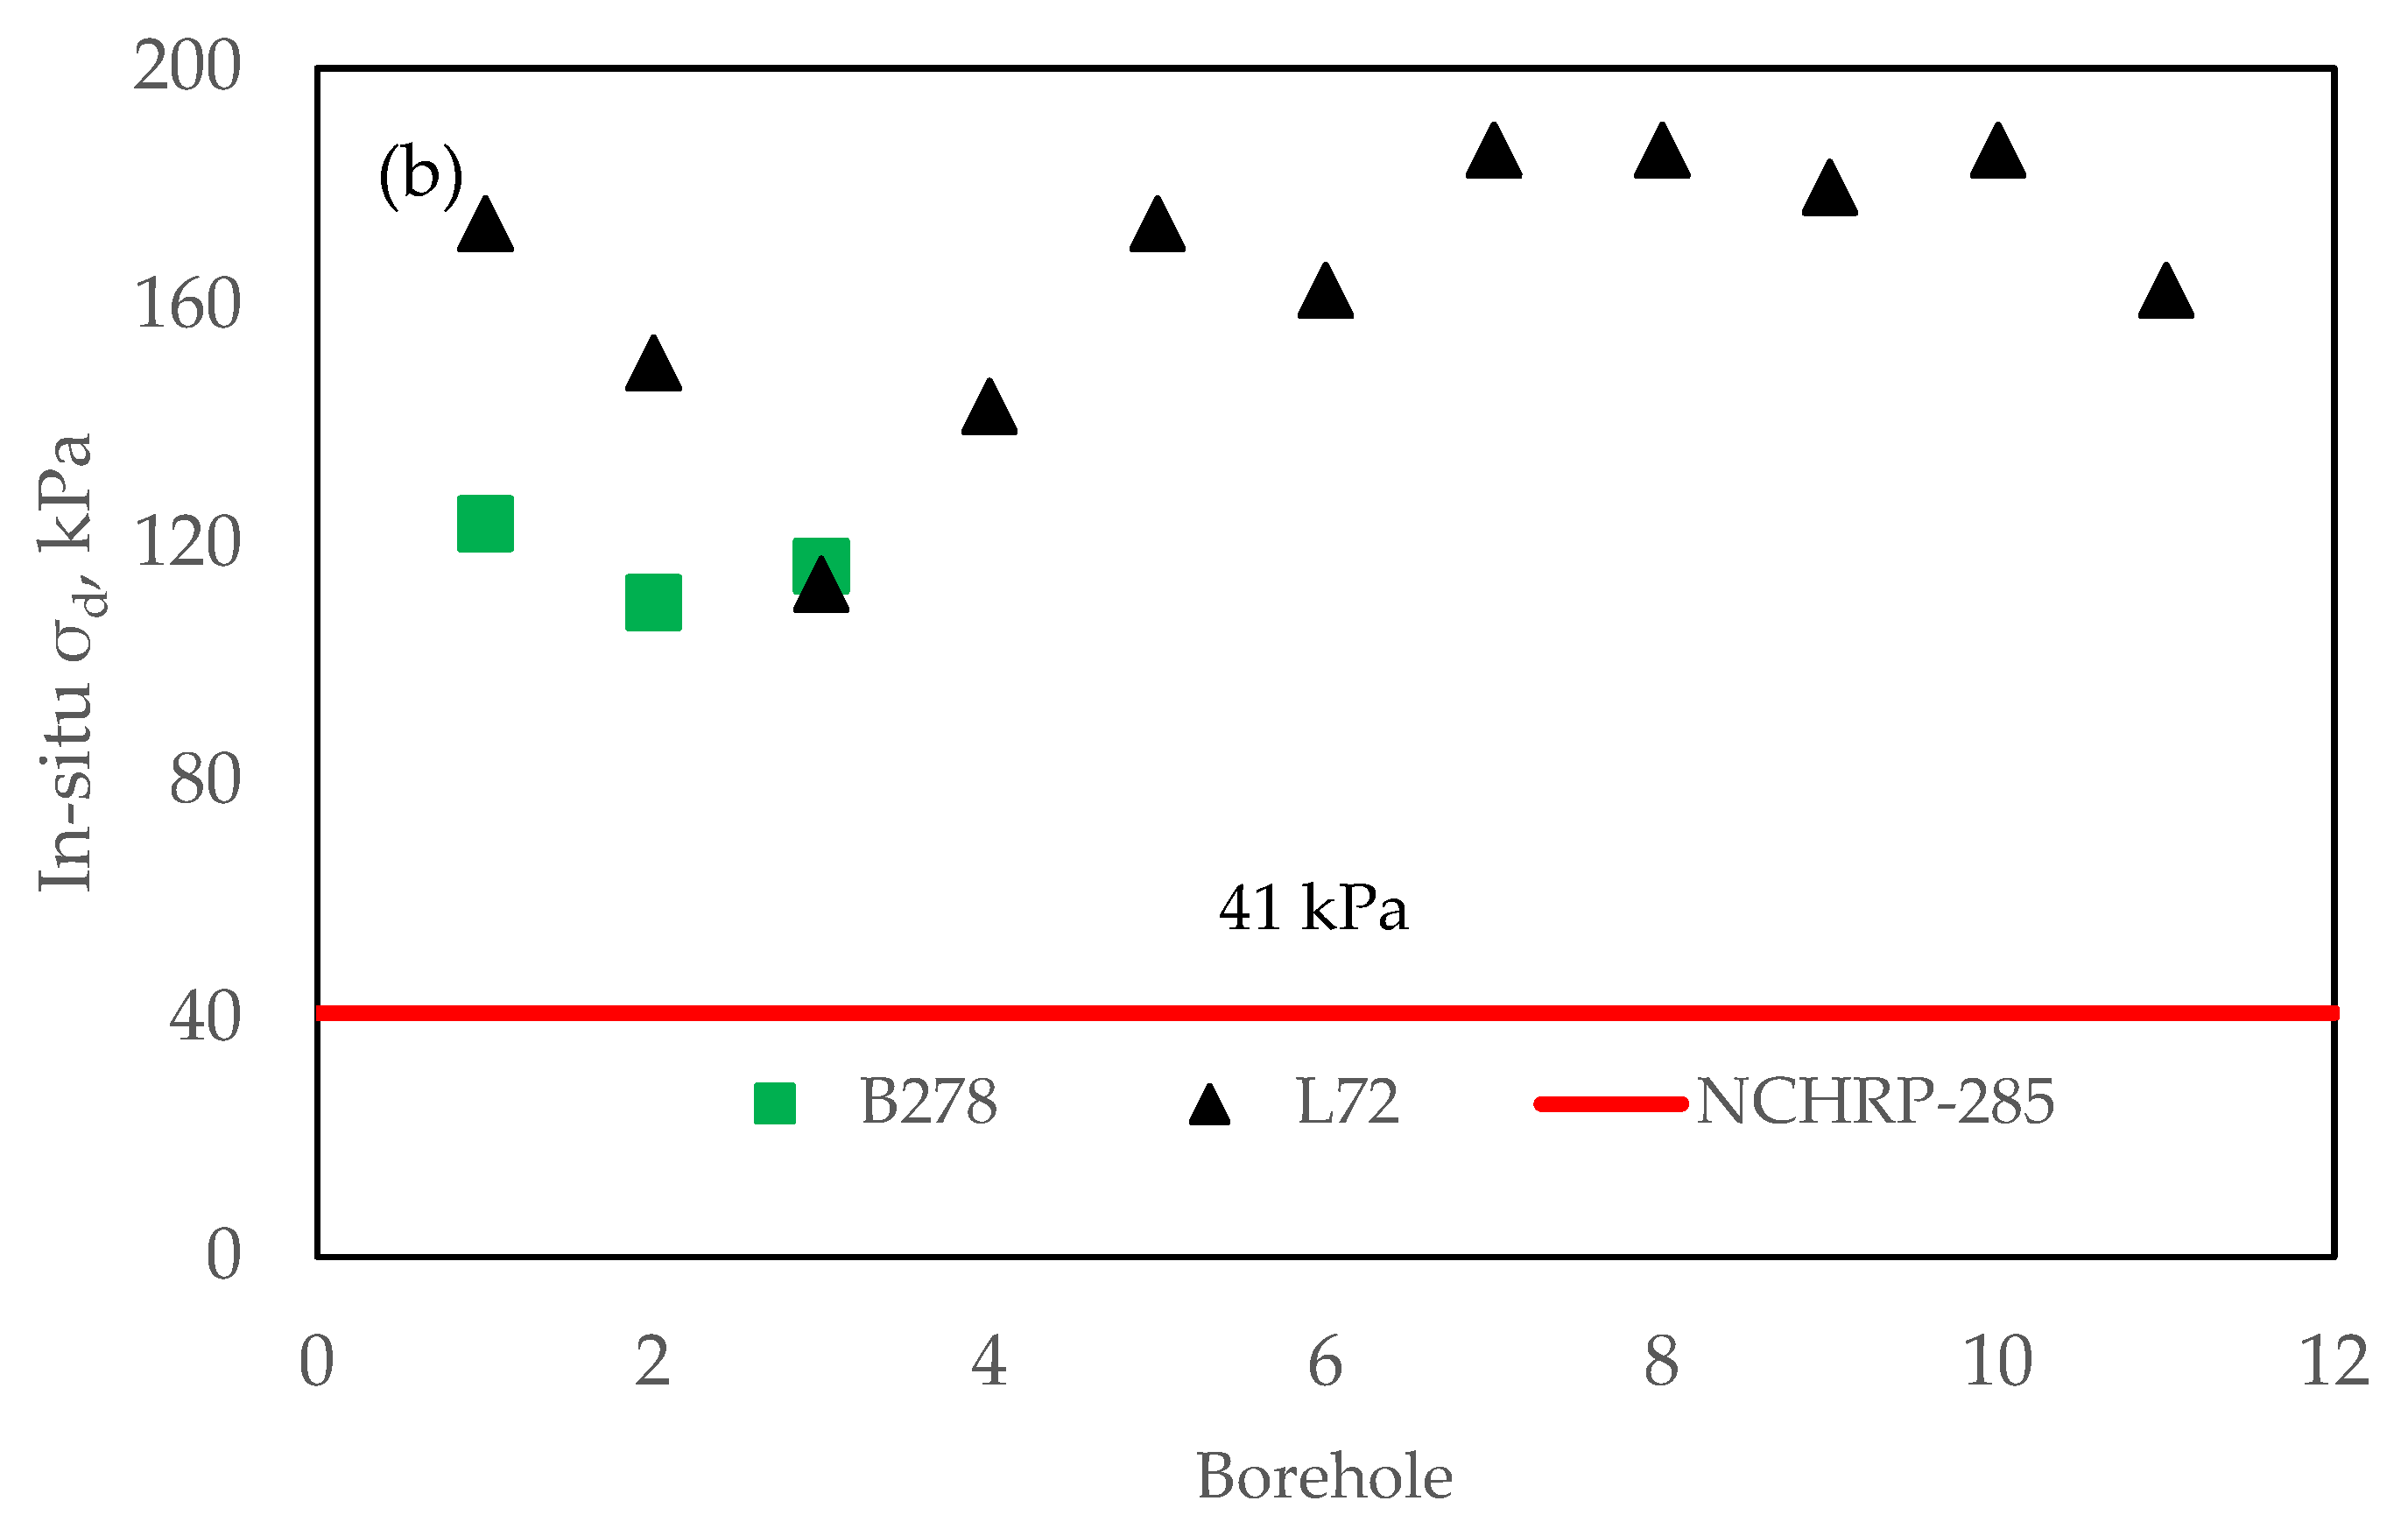
To illustrate the results obtained from the repeated load triaxial tests that were performed on specimens at the in situ moisture content and density, Figure 7 presents MR versus cyclic stress (deviator stress) at three different confining pressures (i.e., 41, 28, and 14 kPa) for tests performed for B278-1 (a coarse-grained soil) and L72-1 (a fine-grained soil). For B278-1, the results show that the MR value increased with increasing cyclic (deviator) stress and exhibited higher MR at higher confining pressure. This result was a good indication of granular materials as expected for A-1-b/SP soil. This is referred to as the ‘strain-hardening’ effect due to the reorientation of the grains into the denser state [30,31,32,33,34]. For the fine-grained soil at L72-1, the MR decreased with increasing cyclic stress, and a lower MR value was obtained. Other studies [15,16,33] have observed this decreasing trend in fine-grained soils. This is referred to as ‘stress-softening’ behavior; with increased stress, deformation increases, and the modulus decreases [30,31,32,33,34].
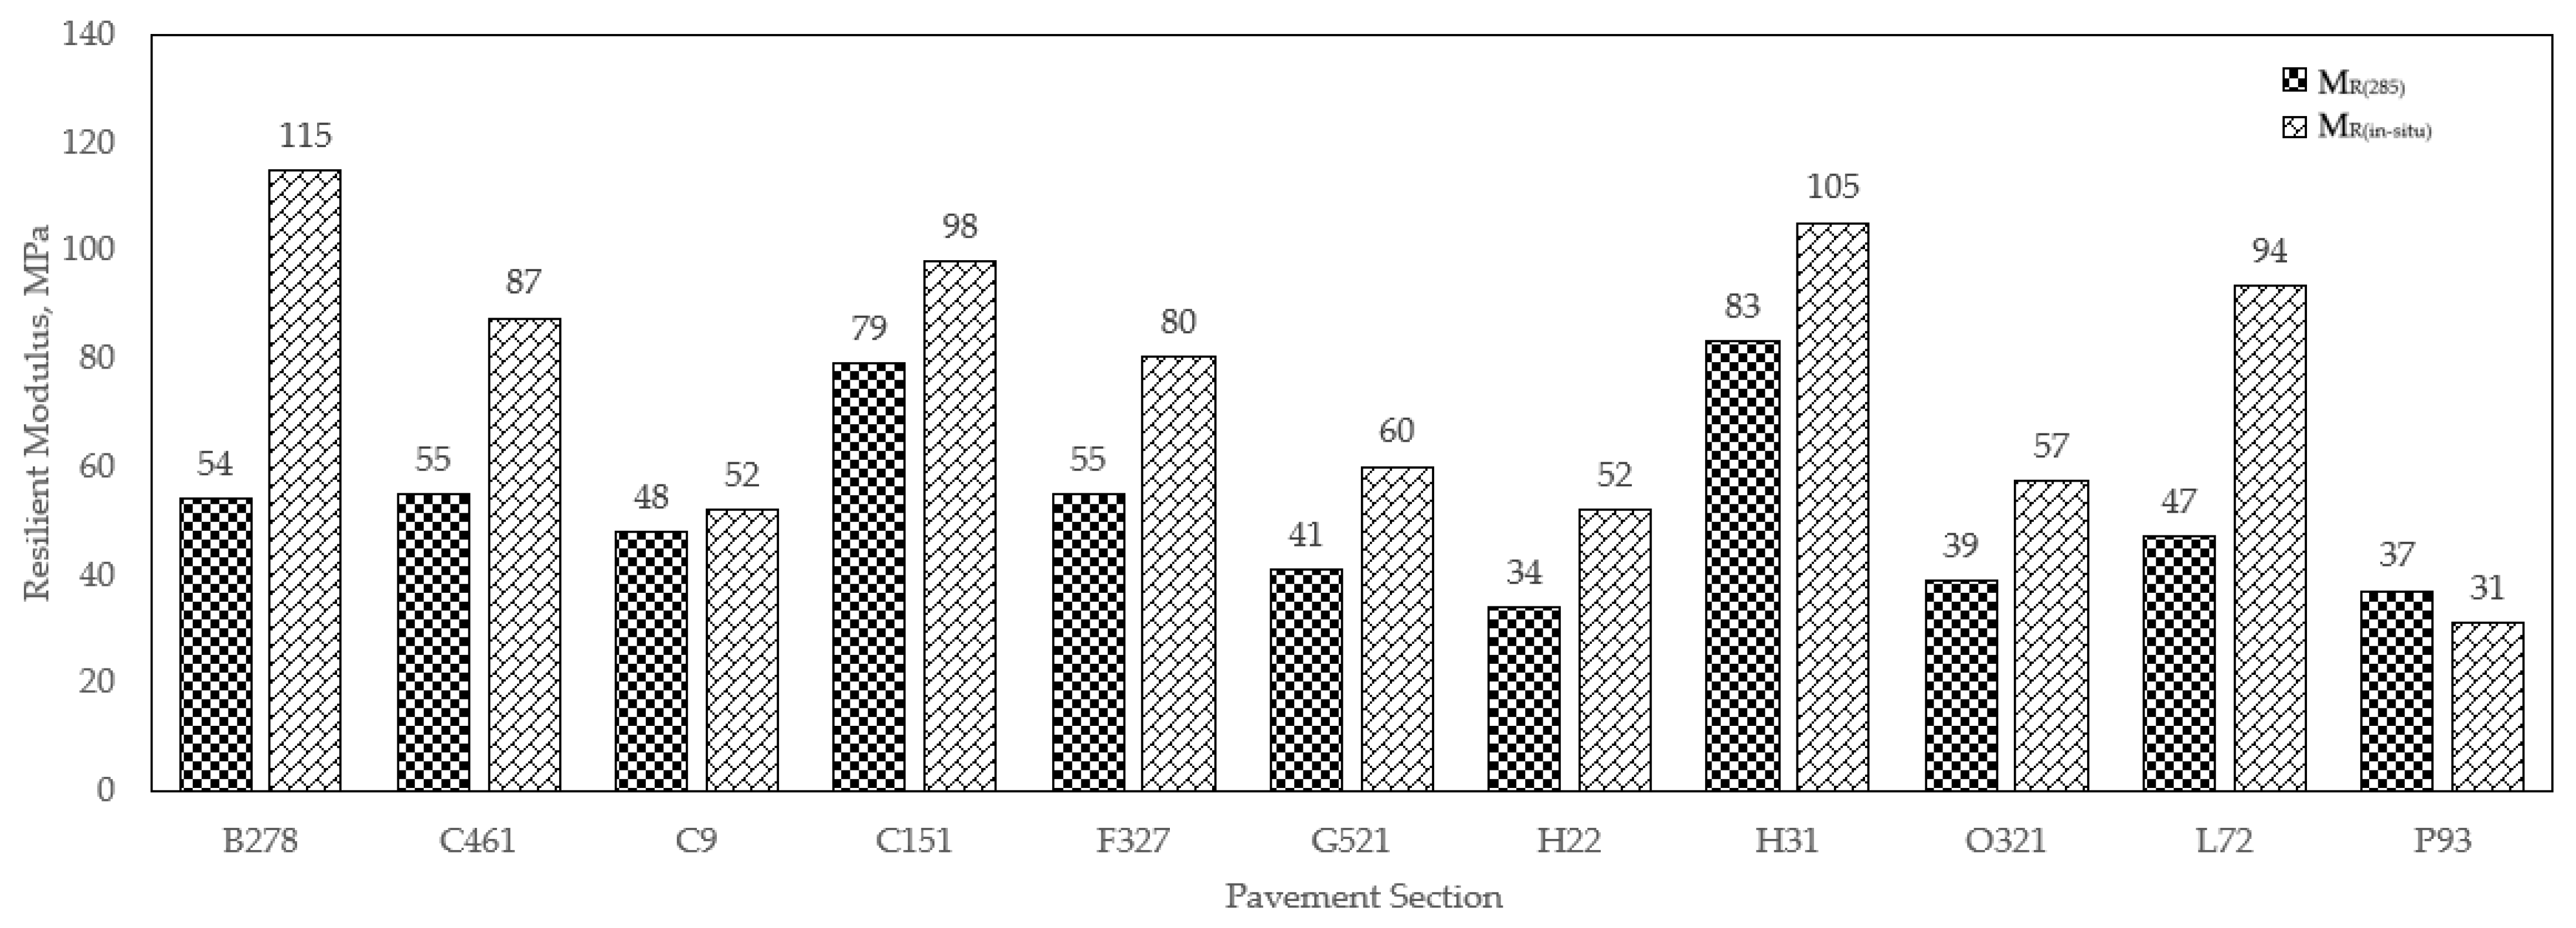
The average MR(285) and MR(in situ) for each pavement section are compared in Figure 8. These values were calculated as the average obtained for all boreholes along each section. Considering all of the AC pavement layer profiles studied herein, the average MR(in situ) is 1.1 to 2.1 (avg 1.4) times greater than the average MR(285), except for P93, which was 0.16 times less. That means in situ stress significantly influences the estimate of subgrade MR.
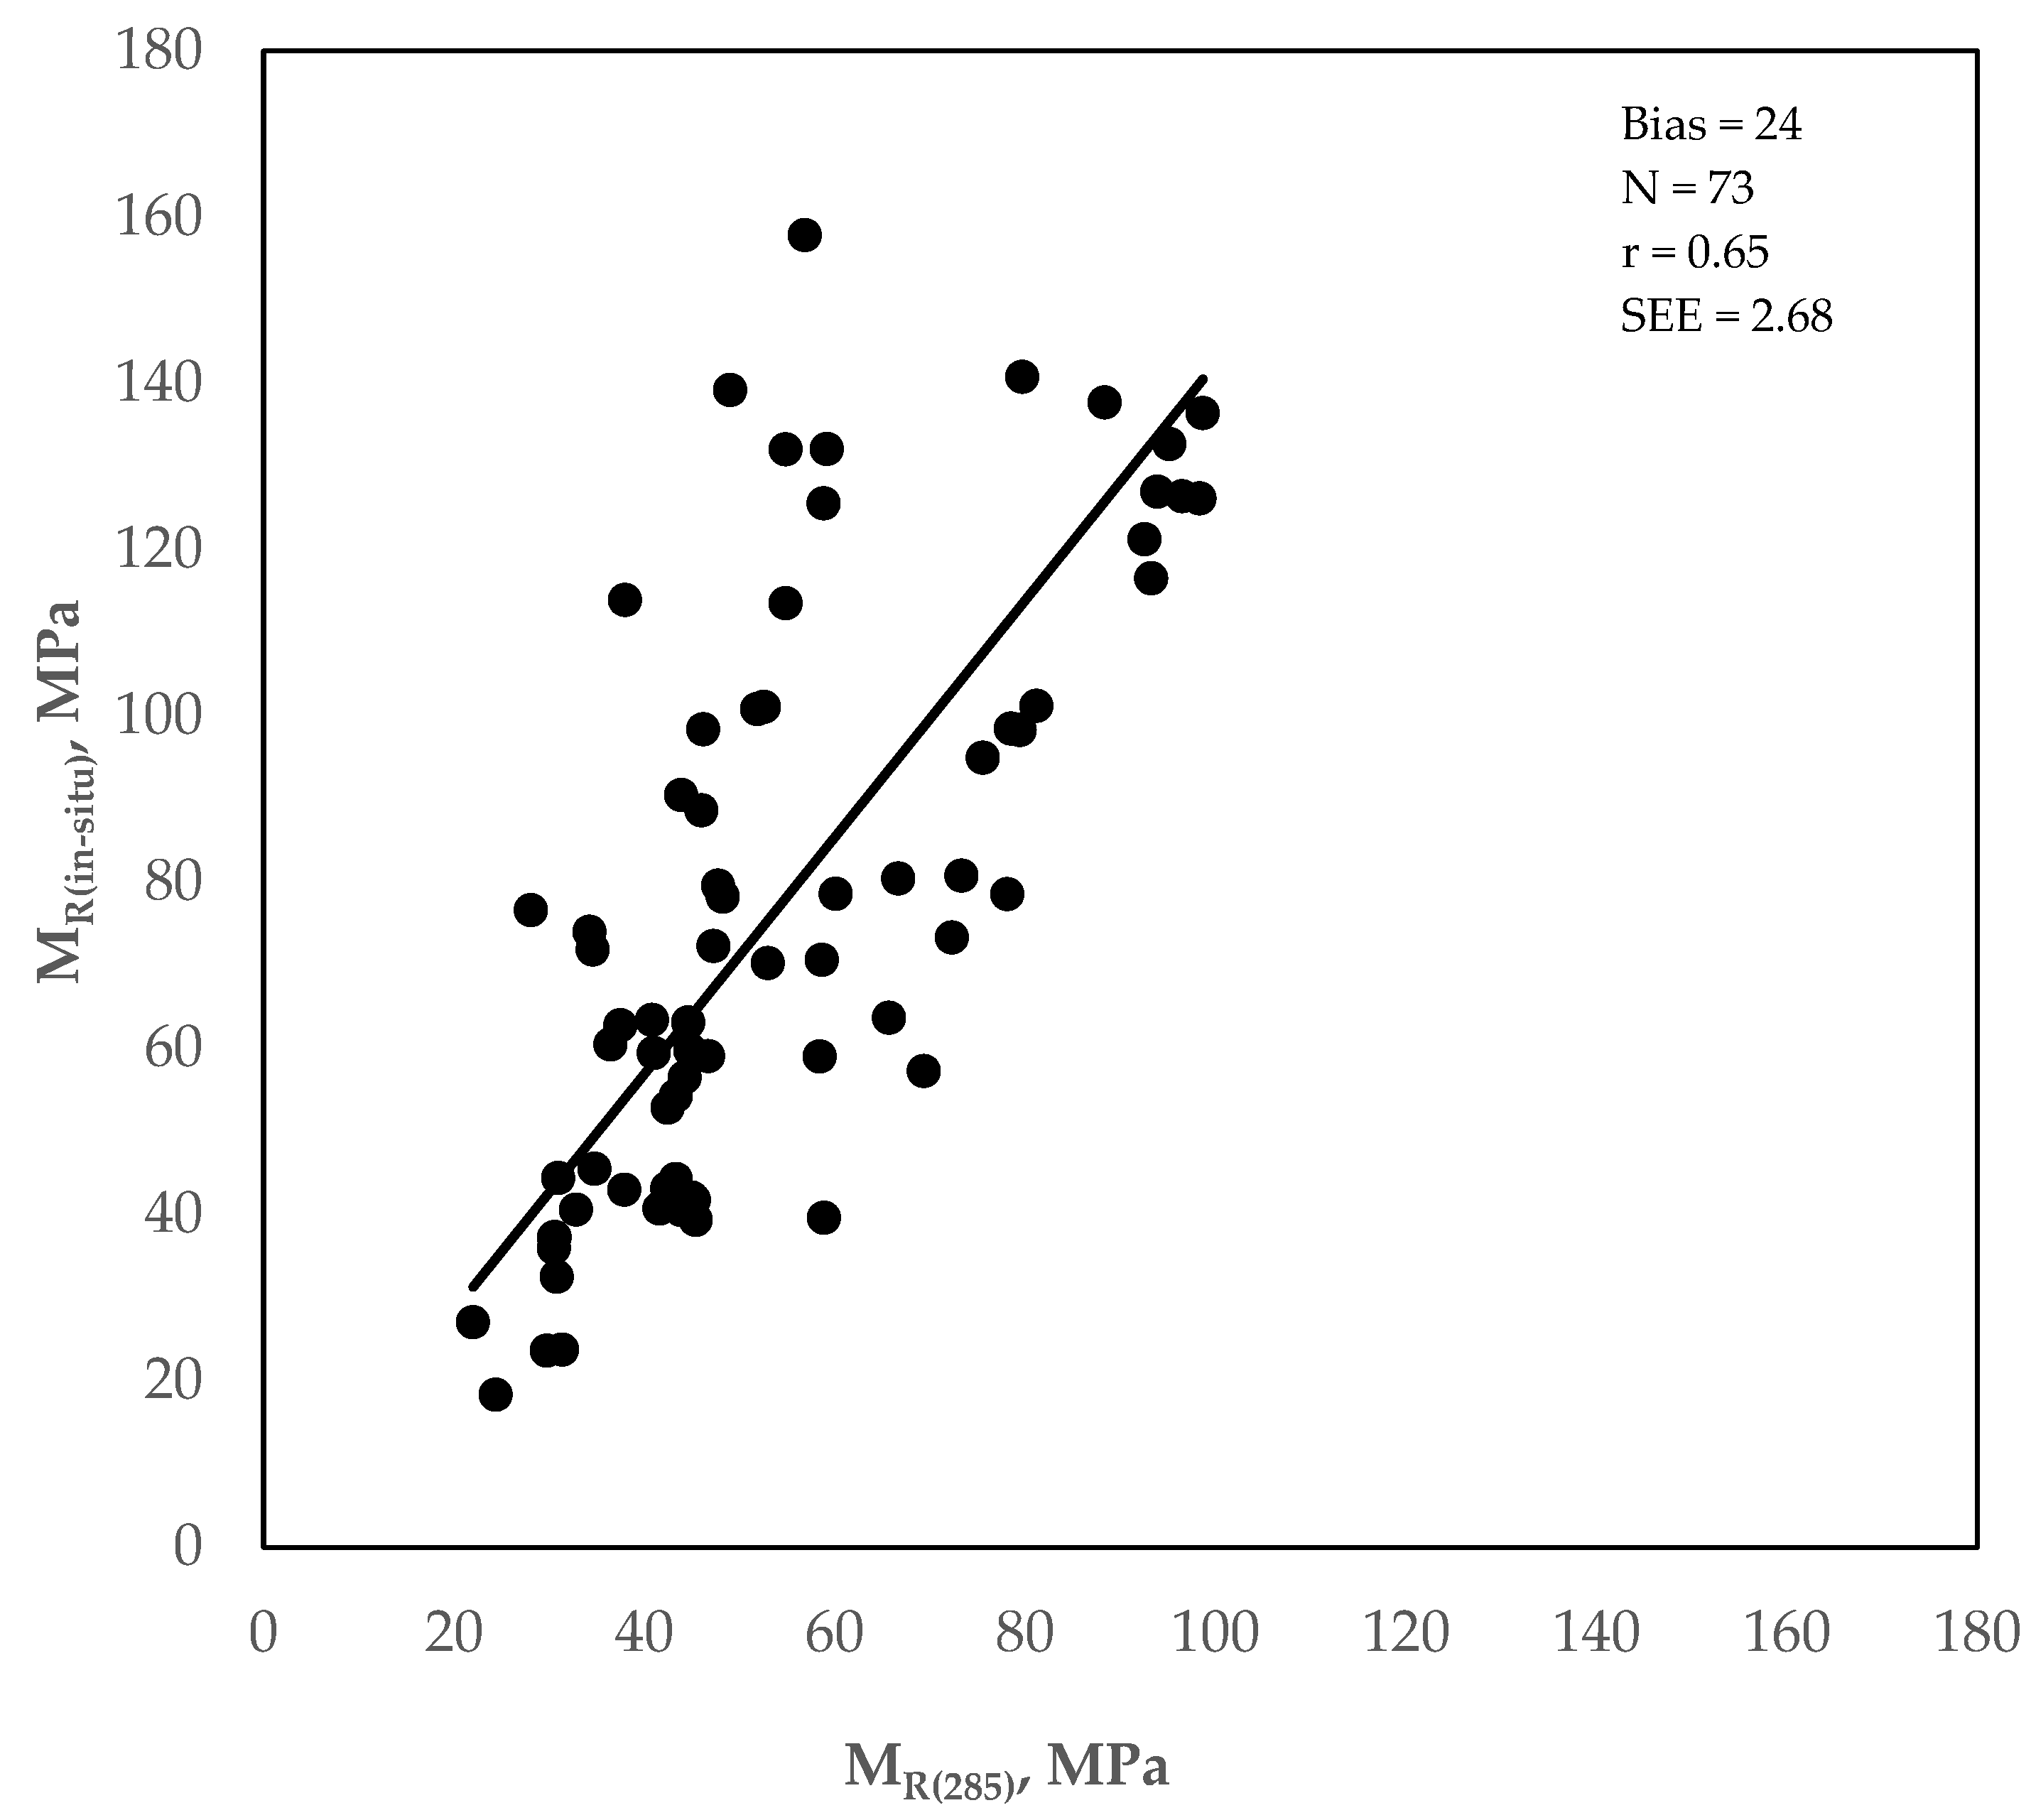
Figure 9 shows the correlation between MR(in situ) and MR(285) using all 73 samples. For this data, the bias = 24, the Pearson moment coefficient (r) = 0.65, and the standard error of estimate (SEE) = 2.68. The standard deviation and coefficient of variance are 20 and 38, respectively, for MR(285), but 37 and 48 for MR(in situ).
4.3. Effect of Subgrade MR for Predicting Rutting and IRI
To address the objectives of this study, the predicted values of rutting and IRI were obtained from the AASHTOWare PMED software (v2.6.2.2) considering the two different subgrades MR (e.g., MR(285) and MR(in situ)).
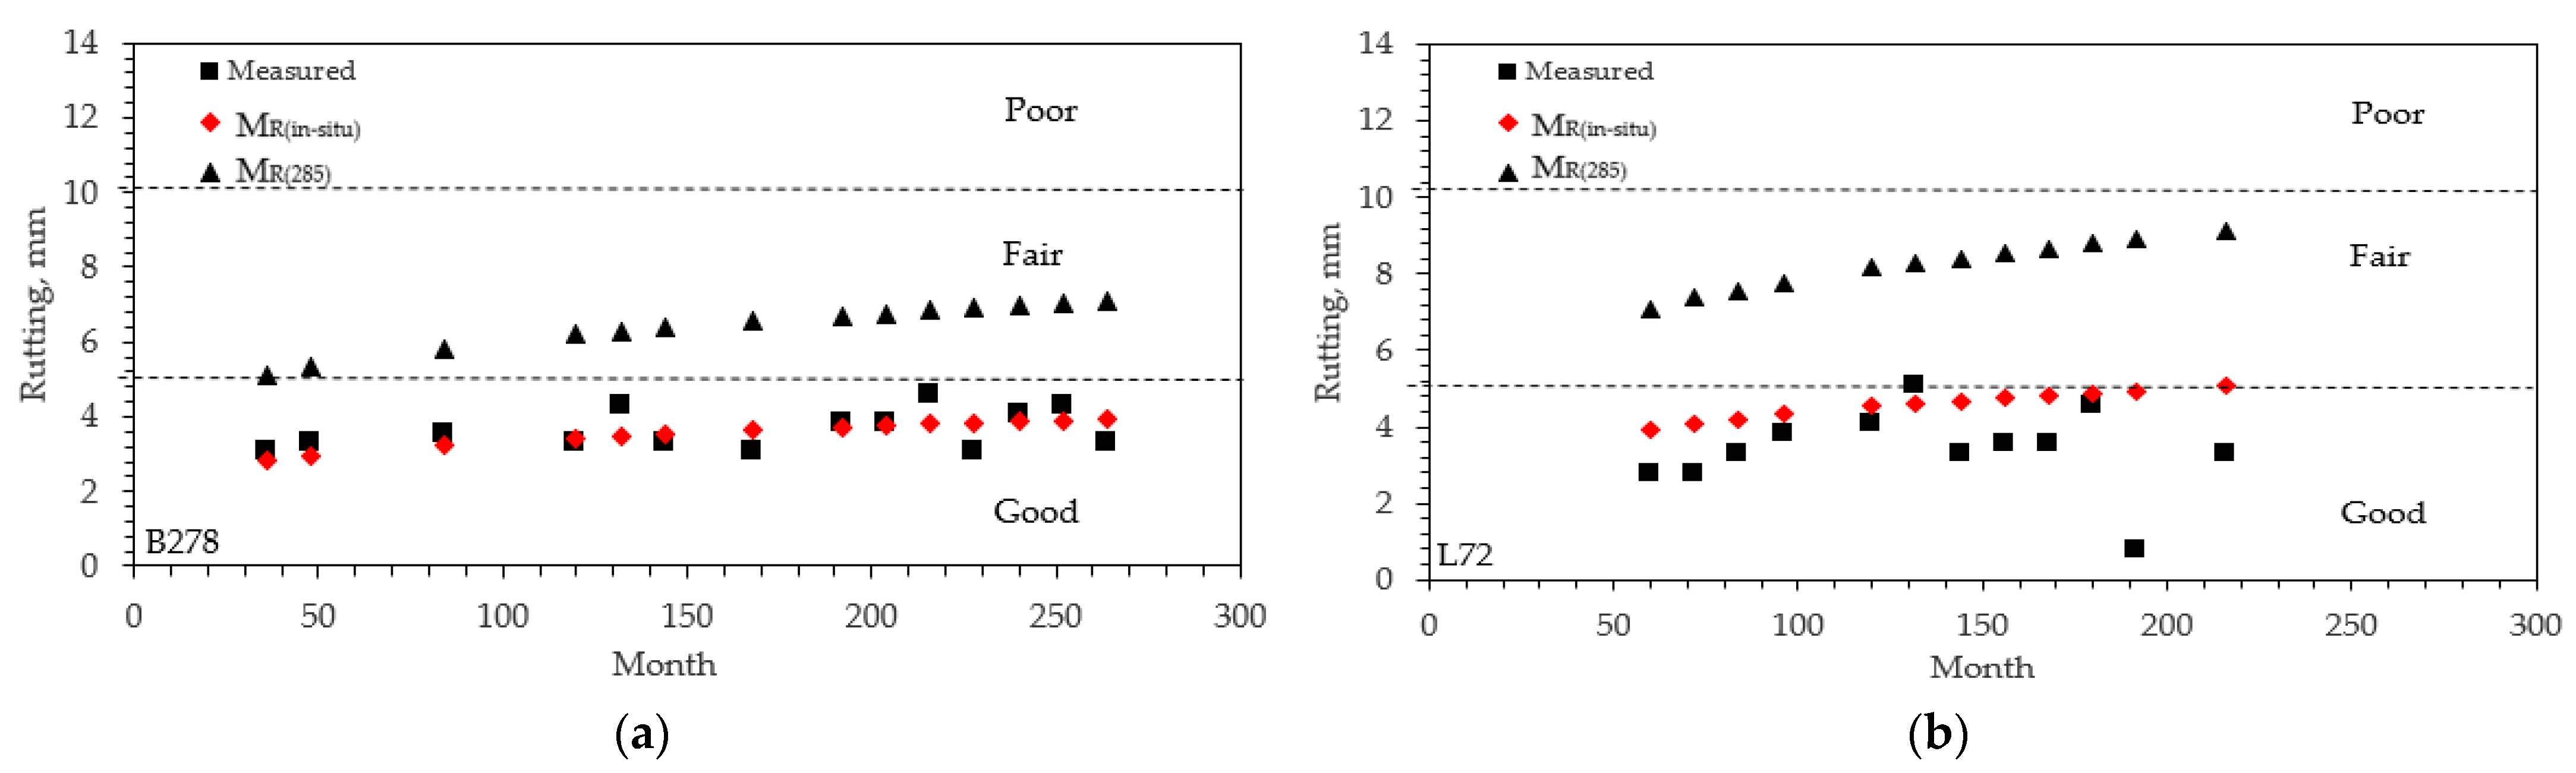
Figure 10 illustrates the predicted and measured rutting as a function of pavement age for pavement segments B278-1 and L72-1. The FHWA rating system of “Good”, “Fair”, and “Poor” is also shown. The data indicate the following:
- For segment B278-1, the predicted rutting using MR(in situ) increased from 3 to 4.9 mm with pavement age. These values indicate that the pavement is in “Good” condition for this period. The field-measured values have a similar magnitude and would also indicate that the pavement is in “Good” condition.
- The predicted rutting using MR(285) ranged from 5 to 7 mm, which is higher than predicted using MR(in situ) and indicates the pavement is in “Fair” condition. This is not in agreement with the “Good” rating from the field-measured values.
- Similar results were observed for segment L72-1, shown in Figure 9b. Furthermore, the predicted rutting for L72-1 using MR(285) indicates a “Fair” condition from 60 months to 216 months (18 years), whereas a “Fair” condition is not reached until 216 months (18 years) for the rutting predicted using MR(in situ).
These observations indicate that both pavement segments were classified as “Fair” using the MR found from NCHRP-285. In contrast, they were classified as “Good” using the MR calculated using the in situ stress state. Furthermore, the classification from the predictions employing the MR calculated using the in situ stress state agreed with the classification based on measure rutting. This illustrates the effect of stress conditions on calculating subgrade MR and, subsequently, using MR in the rutting prediction.
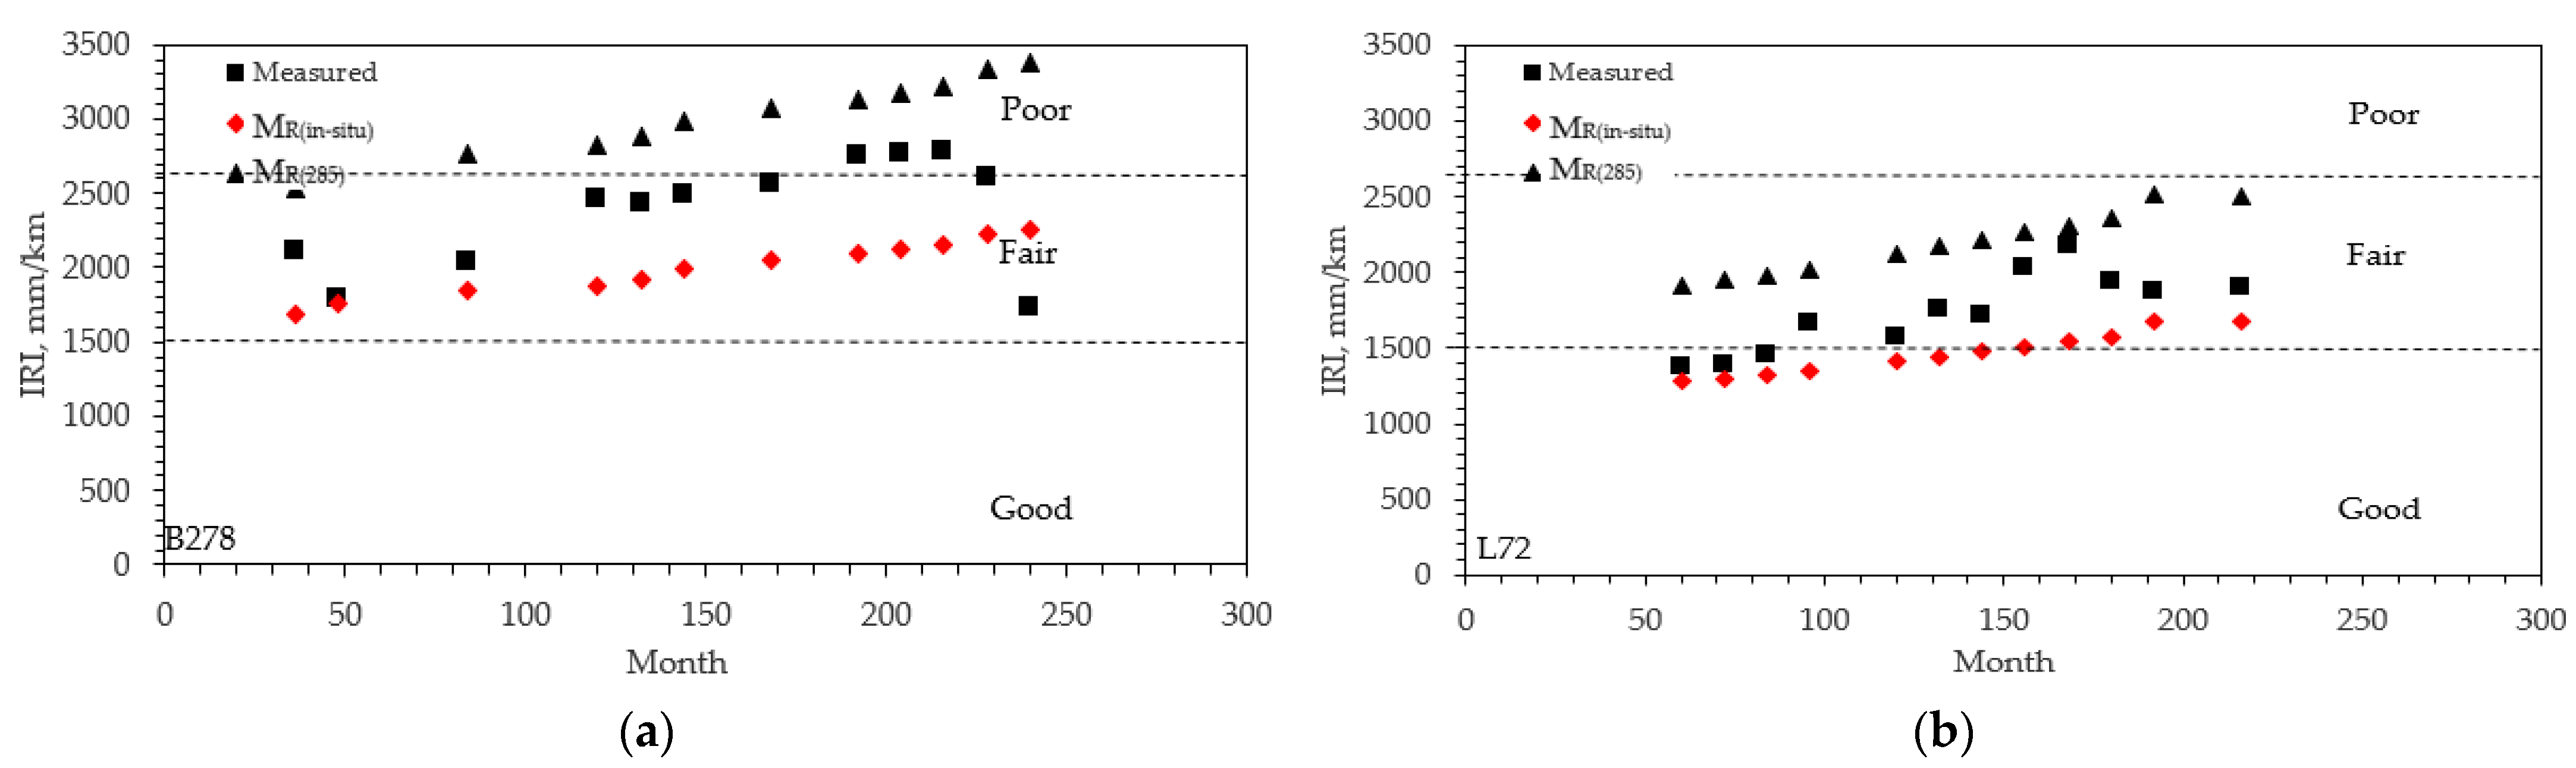
Figure 11 illustrates the progression of predicted and measured IRI for segments B278-1 and L72-1 and provides the FHWA rating system based on the current condition for IRI. The data indicate the following:
- The initial IRI predicted for segment B278-1 is 1689 mm/km for MR(in situ) and 2533 mm/km for MR(285). Both values indicate that the pavement is in “Fair” condition.
- Using MR(285), the predicted IRI indicates that the B278-1 pavement is in “Poor” condition after 80 months, whereas using MR(in situ), the pavement is rated as “Fair” for the duration of the time studied.
- At 240 months, the predicted IRI of B278-1 was 2257 mm/km (“Fair” condition) for MR(in situ), but 3385 mm/km (“Poor” condition) for MR(285). That means the MR(285) predicted an IRI that was 1.5 times higher than predicted using the MR(in situ).
- The measured IRI values for B278-1 were between those predicted by MR(285) and MR(in situ). The measured values corresponded to an initial rating of “Fair” up to 192 months and “Poor” thereafter.
- For section L72-1, the predicted IRI using MR(in situ) was 1277 mm/km at 60 months and increased to 1671 mm/km at 216 months. Thus, this segment is initially rated as “Good” and then rated as “Fair” after 156 months. In contrast, when MR(285) is used, the predicted IRI is equal to 1915 mm/km at 60 months and increases to 2507 mm/km with a “Fair” rating for the duration studied.
- The measured IRIs for segment L72-1 were in between those predicted by MR(285). and MR(in situ)as they were for B278-1. At 216 months, the predicted IRI of L72-1 was 1671 mm/km (“Fair” condition) for MR(in situ), whereas 2507 mm/km (“Fair” condition) for MR(285). That means the MR(285) predicted an IRI that was 1.5 times higher than predicted using the MR(in situ).
These observations indicate that the predicted IRI for B278-1 corresponded to a classification of “Poor” using the MR found from NCHRP-285. In contrast, it was classified as “Fair” using the MR calculated using the in situ stress state. Similarly, for MR(in situ), the section of L72-1 was initially classified as “Good”, and it is rated as “Fair” after 150 months; the section was classified as a “Fair” rating for the duration studied for MR(285). Furthermore, the MR(in situ) predicted 33% less IRI for both sections than the MR(285). When MR(in situ) was used, the predicted IRI was, on average, 17% (less) than in the field-measured values, whereas MR(285) overpredicted the IRI by 21%.
5. Summary of Findings and Conclusions
This study investigated the prediction of rutting and IRI for flexible pavement considering the two different subgrade resilient moduli (i.e., MR(285) & MR(in situ)). The results are summarized below:
- Based on the resilient modulus test results, the MR of coarse-grained soil increases with increasing deviator stress. In contrast, the MR of fine-grained soil decreases with increasing deviator stress because of the “stress hardening” and “stress softening” behavior for coarse-grained and fine-grained soil, respectively.
- Rutting: Both sections were classified as “Fair” using the MR found from NCHRP-285, whereas they were classified as “Good” employing the MR calculated using the in situ stress state. The reason is that the in situ stress significantly affects the calculation of subgrade MR and, subsequently, the use of MR in the rutting prediction. The predictions using MR(in situ) were in close agreement with the field-measured values.
- IRI: For both sections, the predicted IRI using MR(in situ) was 33% less than the IRI predicted using MR(285). Section B278-1 was classified as “Fair” using the MR found from the in situ stress state, whereas it was rated as “Poor” using the MR calculated using the NCHRP-285. Similarly, the section of L72-1 was classified as “Fair” for the duration studied for MR(285). In contrast, it was initially classified as “Good”, and it is rated as “Fair” after 150 months of using MR(in situ). The predicted IRI was approximately 17% (average) less than in the field-measured values when the MR(in situ) was used, whereas 21% was overpredicted using MR(285).
Therefore, in situ stress should be considered to predict rutting and IRI for flexible pavement.
Author Contributions
Conceptualization, Methodology, Software, Validation, Writing—Original draft, Writing—review, and editing, K.M.I.; Conceptualization, Methodology, Writing—review and editing, S.L.G. All authors have read and agreed to the published version of the manuscript.
Funding
This project was funded by the SCDOT and the FHWA under grant SPR 732. Any opinions, findings, conclusions, or recommendations expressed in this material are those of the authors and do not necessarily reflect the views of the SCDOT or the FHWA.
Data Availability Statement
Not applicable.
Acknowledgments
The authors would like to acknowledge the SCDOT and Bradley Putman of Clemson University for facilitating the subgrade soil sampling efforts. Mostaqur is acknowledged for his help with the sample collection, laboratory testing, and laboratory results. The authors also would like to acknowledge Nicolet Devine for analyzing the IRI and traffic growth-rate data, and Clifton Dale Hurley for collecting the measured distress data.
Conflicts of Interest
The authors declare no conflict of interest.
References
- AASHTO. Guide for Design of Pavement Structures; AASHTO: Washington, DC, USA, 1993. [Google Scholar]
- AASHTO. Mechanistic-Empirical Pavement Design Guide: A Manual of Practice, 2nd ed.; AASHTO: Washington, DC, USA, 2015. [Google Scholar]
- AASHTO. Mechanistic-Empirical Pavement Design Guide: A Manual of Practice, 3rd ed.; AASHTO: Washington, DC, USA, 2020. [Google Scholar]
- Seed, H.B.; Chan, C.K.; Lee, C.E. Resilience Characteristics of Subgrade Soils and their Relations to Fatigue Failures in Asphalt Pavements. In Proceedings of the International Conference on the Structural Design of Asphalt Pavements, Ann Arbor, MI, USA, 20–24 August 1962; pp. 77–113. [Google Scholar]
- Brown, S.F. Soil Mechanics in Pavement Engineering, 36th Rankine Lecture of the British Geotechnical Society. Geotechnique 1996, 46, 383–426. [Google Scholar] [CrossRef]
- Ng, K.; Henrichs, Z.R.; Ksaibati, K.; Wulff, S.S. Measurement and Estimation of the Resilient Modulus of Subgrade Materials for Mechanistic-Empirical Pavement Design Guide in Wyoming. In Proceedings of the Transportation Research Board Annual Meeting, Washington, DC, USA, 10–14 January 2016; pp. 1–17. [Google Scholar]
- Brown, S.F. Repeated Load Testing of a Granular Material. J. Geotech. Eng. Div. 1974, 100, 825–841. [Google Scholar] [CrossRef]
- Burczyk, J.M.; Ksaibati KSprecher, R.A.; Farrar, M.J. Factors Influencing Determination of a Subgrade Resilient Modulus Value. In Transportation Research Record 1462; Transportation Research Board, National Research Council: Washington, DC, USA, 1995; pp. 72–78. [Google Scholar]
- Burmister, D.M. The Theory of Stresses and Displacements in Layered Systems and Application to the Design of Airport Runways. Highway Research Board; National Research Council: Washington, DC, USA, 1943; Volume 23, pp. 125–148. [Google Scholar]
- Ng, K.; Hellrung, D.; Ksaibati, K.; Wulff, S.S. Systematic back-calculation protocol and prediction of resilient modulus for MEPDG. IJPE 2018, 19, 62–74. [Google Scholar] [CrossRef]
- AASHTO T 307; Standard Method of Test for Determining the Resilient Modulus of Soils and Aggregate Materials. AASHTO: Washington, DC, USA, 2017.
- Puppala, A.; Mohammad, L.; Allen, A. Engineering Behavior of Lime-Treated Louisiana Subgrade Soil. Transp. Res. Rec. J. Transp. Res. Board 1996, 1546, 24–31. [Google Scholar] [CrossRef]
- Puppala, A.J. Estimating Stiffness of Subgrade and Unbound Materials for Pavement Design; Transportation Research Board: Washington, DC, USA, 2008. [Google Scholar]
- Han, Z.; Vanapalli, S.K. State-of-the-Art: Prediction of Resilient Modulus of Unsaturated Subgrade Soils. Int. J. Geomech. 2016, 16, 04015104. [Google Scholar] [CrossRef]
- Islam, K.M.; Gassman, S.; Rahman, M.M. Field and laboratory characterization of subgrade resilient modulus for pavement mechanistic-empirical pavement design guide application. TRB 2020, 2674, 921–930. [Google Scholar] [CrossRef]
- Rahman, M.M.; Islam, K.M.; Gassman, S. Estimation of resilient modulus for coarse-grained subgrade soils from quick shear tests for mechanistic-empirical pavement designs. Designs 2019, 3, 48. [Google Scholar] [CrossRef]
- Islam, K.M.; Gassman, S.L. Influence of subgrade resilient modulus selection methodology on AASHTOWare pavement ME design. In Geo-Congress; ASCE: Charlotte, North Carolina, 2022; pp. 192–204. [Google Scholar]
- Rahman, M.M.; Gassman, S.L.; Islam, K.M. Effect of Moisture Content on Subgrade Soils Resilient Modulus for Predicting Pavement Rutting. Geosciences 2023, 13, 103. [Google Scholar] [CrossRef]
- Seed, H.; Mitry FMonosmith, C.; Chan, C. Prediction of Pavement Deflection From Laboratory Repeated Load Tests. In Report No. 35; NCHRP, Transportation Research Board: Washington, DC, USA, 1967. [Google Scholar]
- Yao, Y.; Zheng, J.; Zhang, J.; Peng, J.; Li, J. Model for predicting resilient modulus of unsaturated subgrade soils in south China. KSCE J. Civ. Eng. 2018, 22, 2089–2098. [Google Scholar] [CrossRef]
- Zhang, J.; Peng, J.; Zeng, L.; Li, J.; Li, F. Rapid estimation of resilient modulus of subgrade soils using performance-related soil properties. Int. J. Pavement Eng. 2021, 22, 732–739. [Google Scholar] [CrossRef]
- Tamošiūnas, T.; Skuodis, Š. Predictive Stress Modeling of Resilient Modulus in Sandy Subgrade Soils. Infrastructures 2023, 8, 29. [Google Scholar] [CrossRef]
- Kumar, P.; Puppala, A.J.; Tingle, J.S.; Chakraborty, S.; Congress, S.S.C. Resilient Characteristics of Polymer Emulsion-Treated Sandy Soil. Transp. Res. Rec. 2022, 2676, 526–538. [Google Scholar] [CrossRef]
- Zhang, J.; Peng, J.; Liu, W.; Lu, W. Predicting resilient modulus of fine-grained subgrade soils considering relative compaction and matric suction. Road Mater. Pavement Des. 2021, 22, 703–715. [Google Scholar] [CrossRef]
- Kim, S.S.; Pahno, S.; Durham, S.A.; Yang, J.; Chorzepa, M.G. Prediction of Resilient Modulus From the Laboratory Testing of Sandy Soils (No. FHWA-GA-19-1725); Department of Transportation. Office of Performance-Based Management & Research: Atlanta, GA, USA, 2019; Georgia DOT Research project 17–25, Final Report.
- Mohammad, L.N.; Huang BPuppala, A.J.; Allen, A. Regression Model for Resilient Modulus of Subgrade Soils. Transp. Res. Rec. J. Transp. Res. Board 1999, 1687, 47–54. [Google Scholar] [CrossRef]
- Bhuvaneshwari, S.; Robinson, R.G.; Gandhi, S.R. Resilient Modulus of Lime Treated Expansive Soil. Geotech. Geol. Eng. 2018, 37, 305–315. [Google Scholar] [CrossRef]
- Islam, K.M.; Gassman, S.L. Predicting Flexible Pavement Distress and IRI Considering Subgrade Resilient Modulus of Fine-Grained Soils Using MEPDG. Materials 2023, 16, 1126. [Google Scholar] [CrossRef] [PubMed]
- Rada, G.; Witczak, M.W. Comprehensive Evaluation of Laboratory Resilient Moduli Results for Granular Materials. In Transportation Research Record 810; TRB, National Research Council: Washington, DC, USA, 1981; pp. 23–33. [Google Scholar]
- Buchanan, S. Resilient modulus: What, Why, and How? 2007. Available online: https://www.vulcaninnovations.com/public/pdf/2-Resilient-Modulus-Buchanan.pdf (accessed on 1 February 2023).
- Drumm, E.C.; Boateng-Poku, Y.; Johnson Pierce, T. Estimation of subgrade resilient modulus from standard tests. J. Geotech. Eng. 1990, 116, 774–789. [Google Scholar] [CrossRef]
- Kumar, A.; George, V. Effect of soil parameters on resilient modulus using cyclic tri-axial tests on lateritic subgrade soils from Dakshina Kannada, India. Geotech. Geol. Eng. 2018, 36, 3987–4000. [Google Scholar] [CrossRef]
- Maher, A.; Bennert, T.; Gucunski, N.; Papp, W.J., Jr. Resilient Modulus Properties of New Jersey Subgrade Soils (No. FHWA NJ 2000-01); FHWA NJ 2000-01, Final Report; TRIS, USDOT, STATEDOT: Washington, DC, USA, 2000. [Google Scholar]
- Kim, D.; Siddiki, N.Z. Simplification of resilient modulus testing for subgrades. Jt. TRP 2006, 265, IN/JTRP-2005/23. Available online: https://docs.lib.purdue.edu/cgi/viewcontent.cgi?article=1736&context=jtrp (accessed on 1 February 2023).
- Witzack, M.; Qi, X.; Mirza, M.W. Use of Nonlinear Subgrade Modulus in AASHTO Design Procedures. J. Transp. Eng. 1995, 121, 273–282. [Google Scholar]
- Yau, A.; Von Quintus, H. Study of LTPP Laboratory Resilient Modulus Test Data and Response Characteristics; Report No. FHWA-RD-02-051; Federal Highway Administration: McLean, VA, USA, 2002.
- Zaman, M.; Chen, D.-H.; Laguros, J. Resilient Modulus of Granular Materials. J. Transp. Eng. 1994, 120, 967–988. [Google Scholar] [CrossRef]
- NCHRP-285. Laboratory Determination of Resilient Modulus for Flexible Pavement Design; Research Results Digest, Issue Number 14; Transportation Research Board: Washington, DC, USA, 2004; 486p. [Google Scholar]
- Fesearal Highway Administration (FHWA). Pavement Performance Measures and Forecasting and The Effects of Maintenance and Rehabilitation Strategy on Treatment Effectiveness, Chapter 3, 2015. Available online: https://www.fhwa.dot.gov/publications/research/infrastructure/pavements/ltpp/17095/004.cfm (accessed on 1 February 2023).
- Amirkhanian, S.N.; Corley, M. Characterization of Bases and Subbases for AASHTO ME Pavement Design (No. FHWA-SC-21-01); Tech Report; South Carolina. Dept. of Transportation. Office of Materials and Research, Tri-County Technical College: Pendleton, UC, USA, 2021. [Google Scholar]
- Hurley, C.D. Asphalt Pavement Evaluation to Support the Calibration of the AASHTO MEPDG for South Carolina Conditions. Master Thesis, Clemson University, Clemson, SC, USA, 2019. ProQuest LLC, Ann Arbor, MI 48106-1346. [Google Scholar]
- NCHRP-1-37; Guide for Mechanistic-Empirical Design of New and Rehabilitated Pavement Structures-Final Report. Transportation Research Board: Washington, DC, USA, 2004.
- Huang, Y.H. Pavement Analysis and Design; Prentice Hall, Inc.: Englewood Cliffs, NJ, USA, 1993. [Google Scholar]
Figure 1.
Study Flow Chart.

Figure 2.
Schematic Diagram Showing Coring and Sampling Locations with Depth.

Figure 3.
Photographs of Asphalt Cores from B278 (BH-1): (a) Hole B and (b) Hole A [41].
Figure 3.
Photographs of Asphalt Cores from B278 (BH-1): (a) Hole B and (b) Hole A [41].

Figure 4.
Schematic Pavement Profile for AC under Wheel Loading.

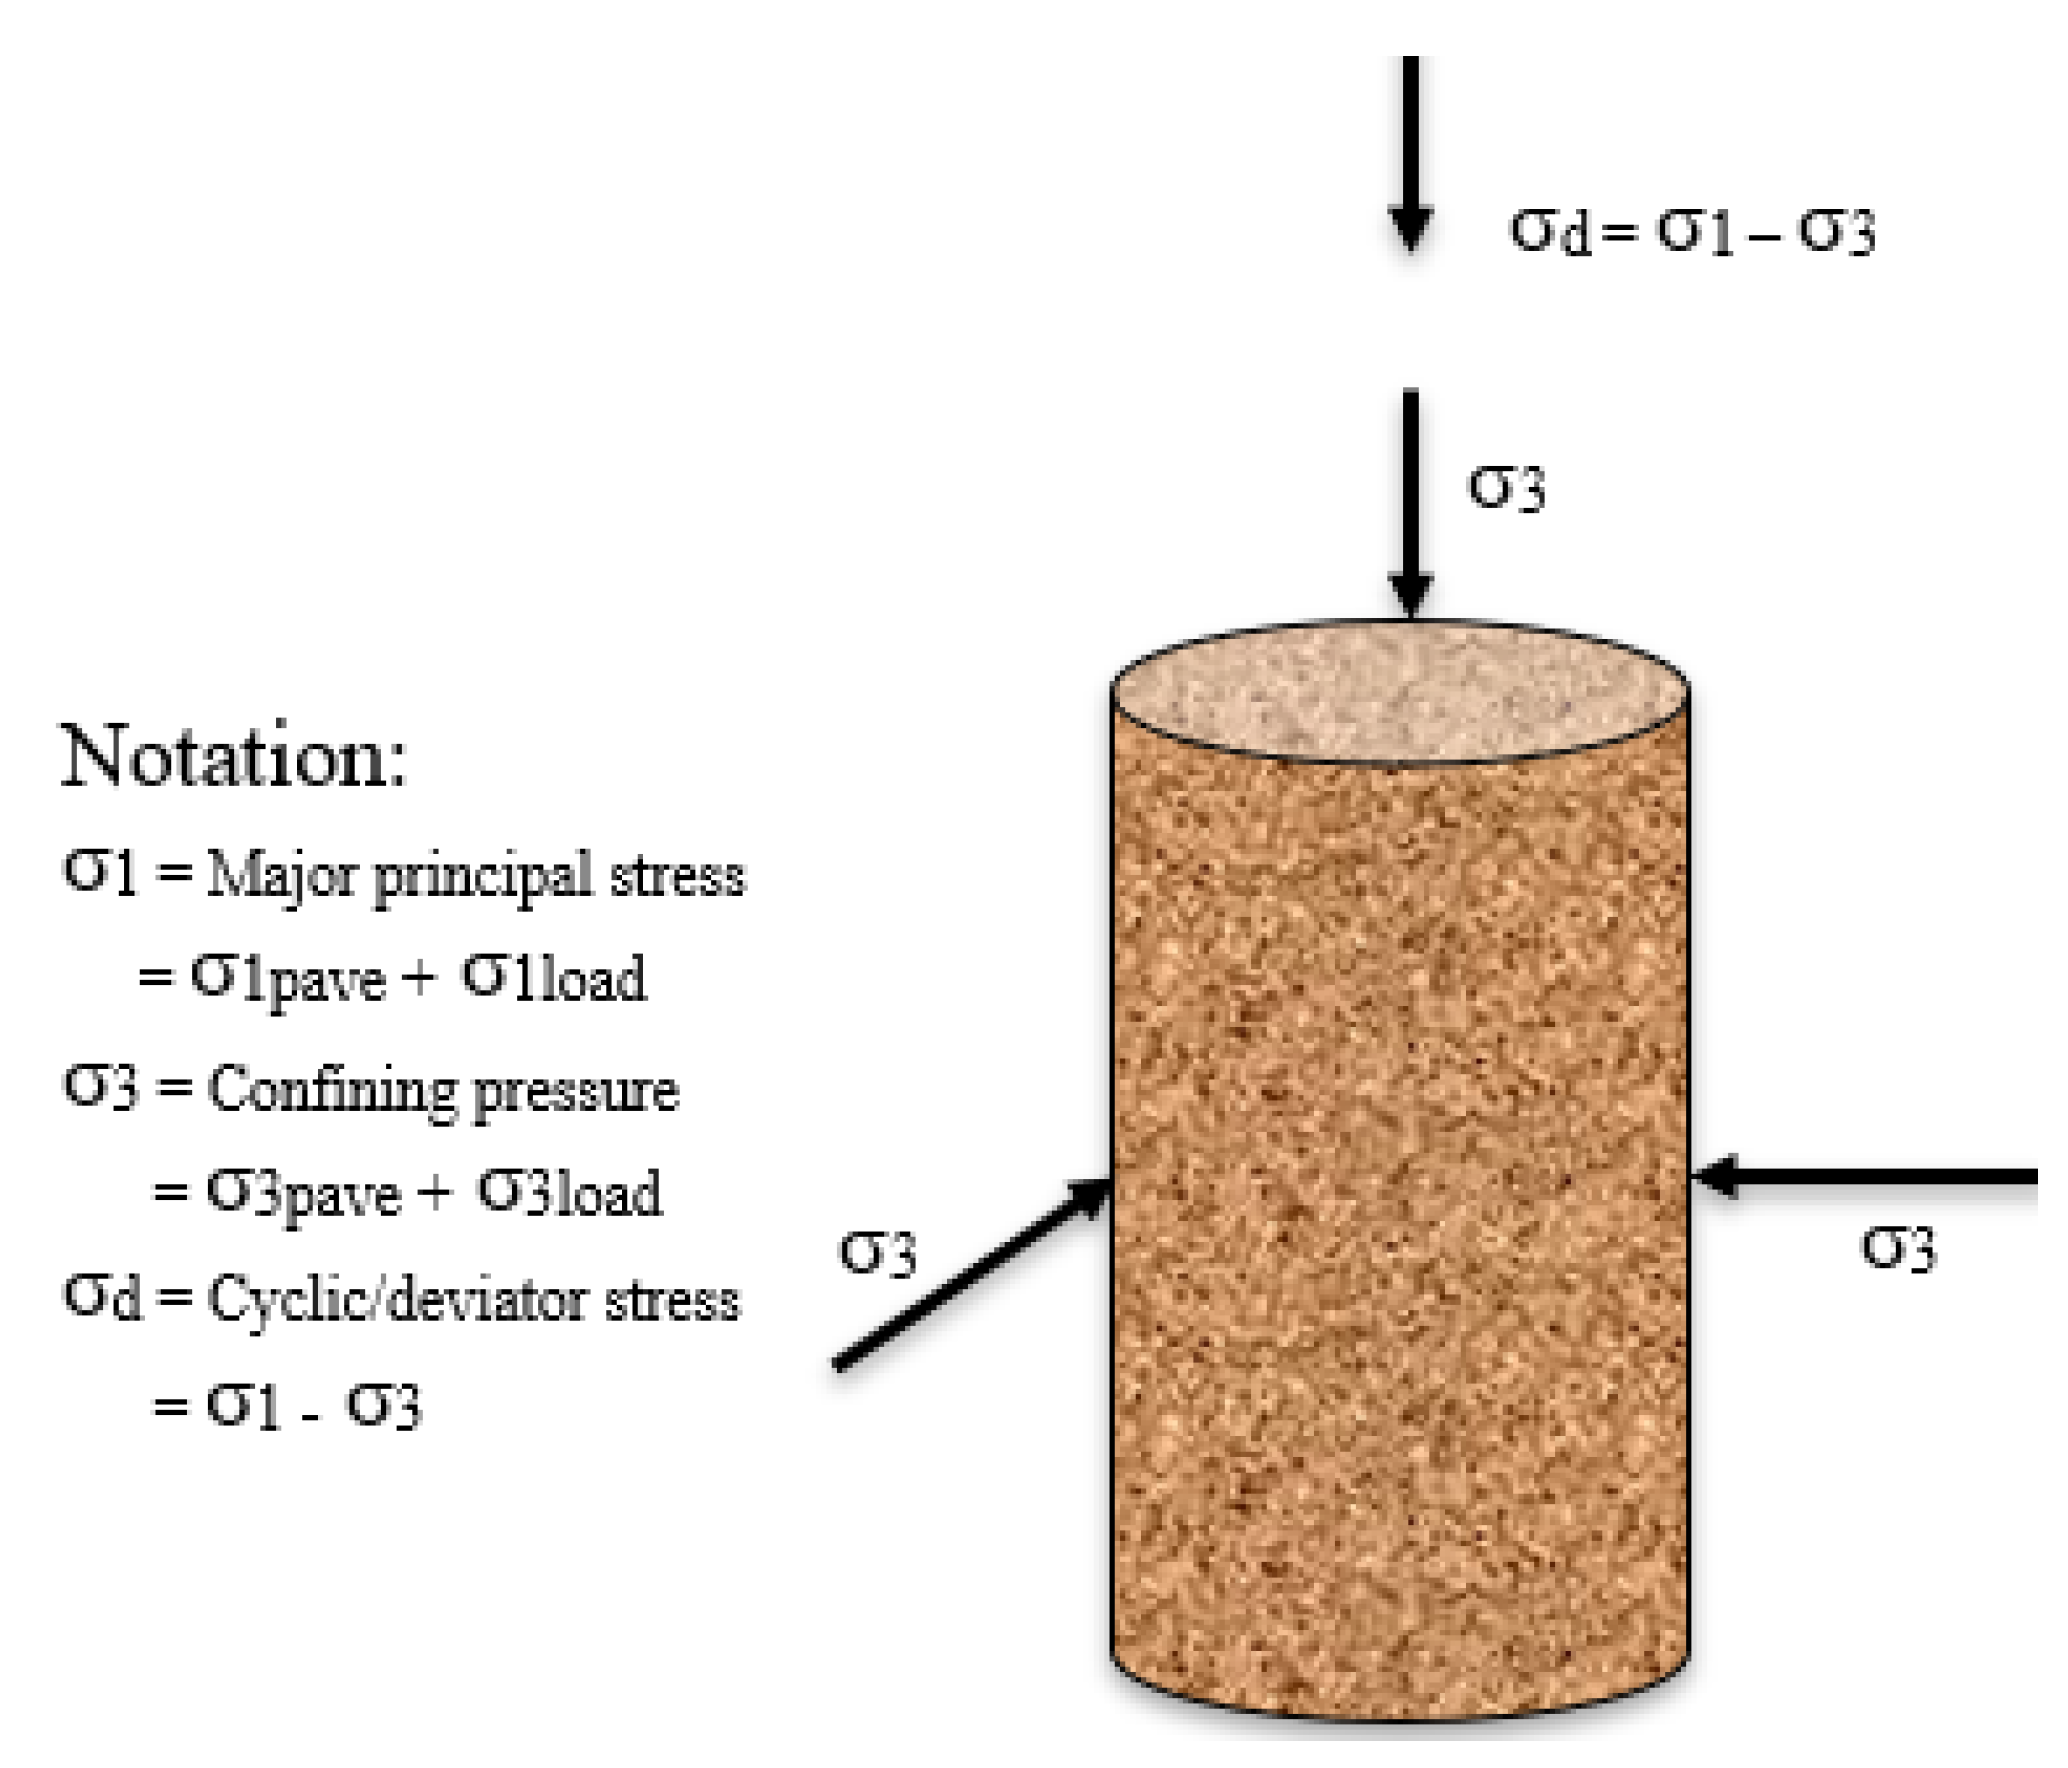
Figure 5.
Schematic Diagram for Resilient Modulus Stress State.

Figure 6.
Effect of In Situ Stress for Sections B278 and L72: (a) In-situ Confining Pressure for each Borehole, and (b) In-situ Deviator Stress for each Borehole.
Figure 6.
Effect of In Situ Stress for Sections B278 and L72: (a) In-situ Confining Pressure for each Borehole, and (b) In-situ Deviator Stress for each Borehole.


Figure 7.
Effect of Confining Stress and Cyclic Stress on Subgrade MR.

Figure 8.
Comparison of the Average Resilient Modulus calculated using NCHRP-285 and the In Situ Stress.
Figure 8.
Comparison of the Average Resilient Modulus calculated using NCHRP-285 and the In Situ Stress.

Figure 9.
Relation between MR(285) and MR (in situ) from all samples.

Figure 10.
Effect of Subgrade MR on Predicted Rutting (a) B278-1 and (b) L72-1. Note: 5.08 mm = “Good”, 5.08–10.16 mm = “Fair”, >10.16 mm = “Poor” FHWA (2015).
Figure 10.
Effect of Subgrade MR on Predicted Rutting (a) B278-1 and (b) L72-1. Note: 5.08 mm = “Good”, 5.08–10.16 mm = “Fair”, >10.16 mm = “Poor” FHWA (2015).

Figure 11.
Effect of Subgrade MR on Predicted IRI: (a) B278-1 and (b) L72-1. Note: 1500 mm/km = “Good”, 1500–2680 mm/km = “Fair”, >2680 mm/km = “Poor” FHWA (2015).
Figure 11.
Effect of Subgrade MR on Predicted IRI: (a) B278-1 and (b) L72-1. Note: 1500 mm/km = “Good”, 1500–2680 mm/km = “Fair”, >2680 mm/km = “Poor” FHWA (2015).

Table 1.
Summary of Pavement Sections.
| Site ID | Construction Finish Year | Length of Section (km) | Number of Coring Locations with Shelby Tube Samples |
|---|---|---|---|
| B278 | 1998 | 2.6 | 3 |
| C461 | 1996 | 4.0 | 3 |
| C9 | 1999 | 3.0 | 3 |
| C151 | 1999 | 8.7 | 10 |
| F327 | 1992 | 7.9 | 6 |
| G521 | 2003 | 4.8 | 7 |
| H22 | 2001 | 1.6 | 3 |
| H31 | 2005 | 6.4 | 9 |
| O321 | 2004 | 9.8 | 13 |
| L72 | 2002 | 9.8 | 11 |
| P93 | 2001 | 1.9 | 5 |
Note: B278 = Beaufort/US-278, C461 = Charleston/SC-461, C9 = Chester/SC-9, C151 = Chesterfield/SC-151, F327 = Florence/SC-327, G521 = Georgetown/US-521, H22 = Horry/SC-22, H31 = Horry/SC-31, O321 = Orangeburg/US-321, L72 = Laurens/SC-72, P93 = Pickens/SC-93.
Table 3.
Summary of In Situ Stress.
| Site ID | BH | Field Stress from Pavement (kPa) | Field Stress from Loading (kPa) | Total σ1 (kPa) | Total σ3 (kPa) | σd (kPa) | ϴ (kPa) | ||
|---|---|---|---|---|---|---|---|---|---|
| σ1pave | σ3pave | σ1load | σ3load | ||||||
| B278 | B278-1 | 7.6 | 3.8 | 123.3 | 3.8 | 130.9 | 7.6 | 123.3 | 146.0 |
| B278-2 | 7.7 | 3.8 | 110.1 | 3.9 | 117.8 | 7.7 | 110.1 | 133.2 | |
| B278-3 | 7.1 | 3.6 | 116.4 | 3.8 | 123.6 | 7.4 | 116.2 | 138.4 | |
| L72 | L72-1 | 5.8 | 2.9 | 173.2 | 2.2 | 178.9 | 5.1 | 173.8 | 189.2 |
| L72-2 | 6.4 | 3.2 | 150.4 | 3.2 | 156.8 | 6.4 | 150.4 | 169.6 | |
| L72-3 | 7.8 | 3.9 | 113.2 | 3.9 | 121.0 | 7.8 | 113.2 | 136.5 | |
| L72-4 | 6.6 | 3.3 | 143.2 | 3.4 | 149.8 | 6.7 | 143.1 | 163.2 | |
| L72-5 | 5.8 | 2.9 | 173.2 | 2.2 | 178.9 | 5.1 | 173.8 | 189.2 | |
| L72-6 | 6.1 | 3.0 | 162.3 | 2.8 | 168.4 | 5.8 | 162.6 | 180.0 | |
| L72-7 | 5.6 | 2.8 | 185.0 | 1.5 | 190.6 | 4.3 | 186.2 | 199.2 | |
| L72-8 | 5.6 | 2.8 | 185.0 | 1.5 | 190.6 | 4.3 | 186.2 | 199.2 | |
| L72-9 | 5.7 | 2.9 | 178.9 | 1.9 | 184.7 | 4.8 | 179.9 | 194.2 | |
| L72-10 | 5.6 | 2.8 | 185.0 | 1.5 | 190.6 | 4.3 | 186.2 | 199.2 | |
| L72-11 | 6.1 | 3.1 | 162.3 | 2.8 | 168.5 | 5.8 | 162.6 | 180.1 | |
Note: BH = borehole.
Table 4.
Summary of Materials Input.
| Site ID | BH | k1 | k2 | k3 | MR(285) (MPa) | MR (in-situ) (MPa) | Initial IRI (mm/km) |
|---|---|---|---|---|---|---|---|
| B278 | B278-1 | 520 | 0.923 | 1.281 | 55 | 132 | 1831 * |
| B278-2 | 530 | 0.899 | 1.582 | 59 | 132 | 1752 * | |
| B278-3 | 555 | 0.934 | 0.131 | 48 | 80 | 1484 | |
| L72 | L72-1 | 483 | 0.923 | 1.281 | 51 | 186 | 1121 |
| L72-2 | 413 | 1.154 | 0.769 | 38 | 114 | 963 | |
| L72-3 | 430 | 0.913 | 1.082 | 44 | 90 | 821 | |
| L72-4 | 470 | 0.933 | 1.230 | 49 | 139 | 616 * | |
| L72-5 | 871 | 0.440 | −1.815 | 59 | 40 | 1073 | |
| L72-6 | 690 | 0.228 | 1.010 | 80 | 141 | 1184 | |
| L72-7 | 455 | 0.228 | 1.010 | 53 | 101 | 1247 | |
| L72-8 | 445 | 0.219 | 1.052 | 52 | 101 | 1263 | |
| L72-9 | 405 | 0.789 | −0.714 | 31 | 44 | 1042 | |
| L72-10 | 427 | 0.792 | −1.100 | 31 | 37 | 1042 | |
| L72-11 | 438 | 0.821 | −1.210 | 31 | 36 | 1042 |
* PMED v2.6.2.2 limits the minimum initial IRI value to 789 mm/km and the maximum value to 1578 mm/km.
Disclaimer/Publisher’s Note: The statements, opinions and data contained in all publications are solely those of the individual author(s) and contributor(s) and not of MDPI and/or the editor(s). MDPI and/or the editor(s) disclaim responsibility for any injury to people or property resulting from any ideas, methods, instructions or products referred to in the content. |
© 2023 by the authors. Licensee MDPI, Basel, Switzerland. This article is an open access article distributed under the terms and conditions of the Creative Commons Attribution (CC BY) license (https://creativecommons.org/licenses/by/4.0/).
Share and Cite
MDPI and ACS Style
Islam, K.M.; Gassman, S.L. Effect of the Field-Stress State on the Subgrade Resilient Modulus for Pavement Rutting and IRI. Geotechnics 2023, 3, 360-374. https://doi.org/10.3390/geotechnics3020021
AMA Style
Islam KM, Gassman SL. Effect of the Field-Stress State on the Subgrade Resilient Modulus for Pavement Rutting and IRI. Geotechnics. 2023; 3(2):360-374. https://doi.org/10.3390/geotechnics3020021
Chicago/Turabian StyleIslam, Kazi Moinul, and Sarah L. Gassman. 2023. "Effect of the Field-Stress State on the Subgrade Resilient Modulus for Pavement Rutting and IRI" Geotechnics 3, no. 2: 360-374. https://doi.org/10.3390/geotechnics3020021