


Post-Wildfire Debris Flows in Montecito, California (USA): A Case Study and Empirically Based Debris Volume Estimation
Abstract
:1. Introduction
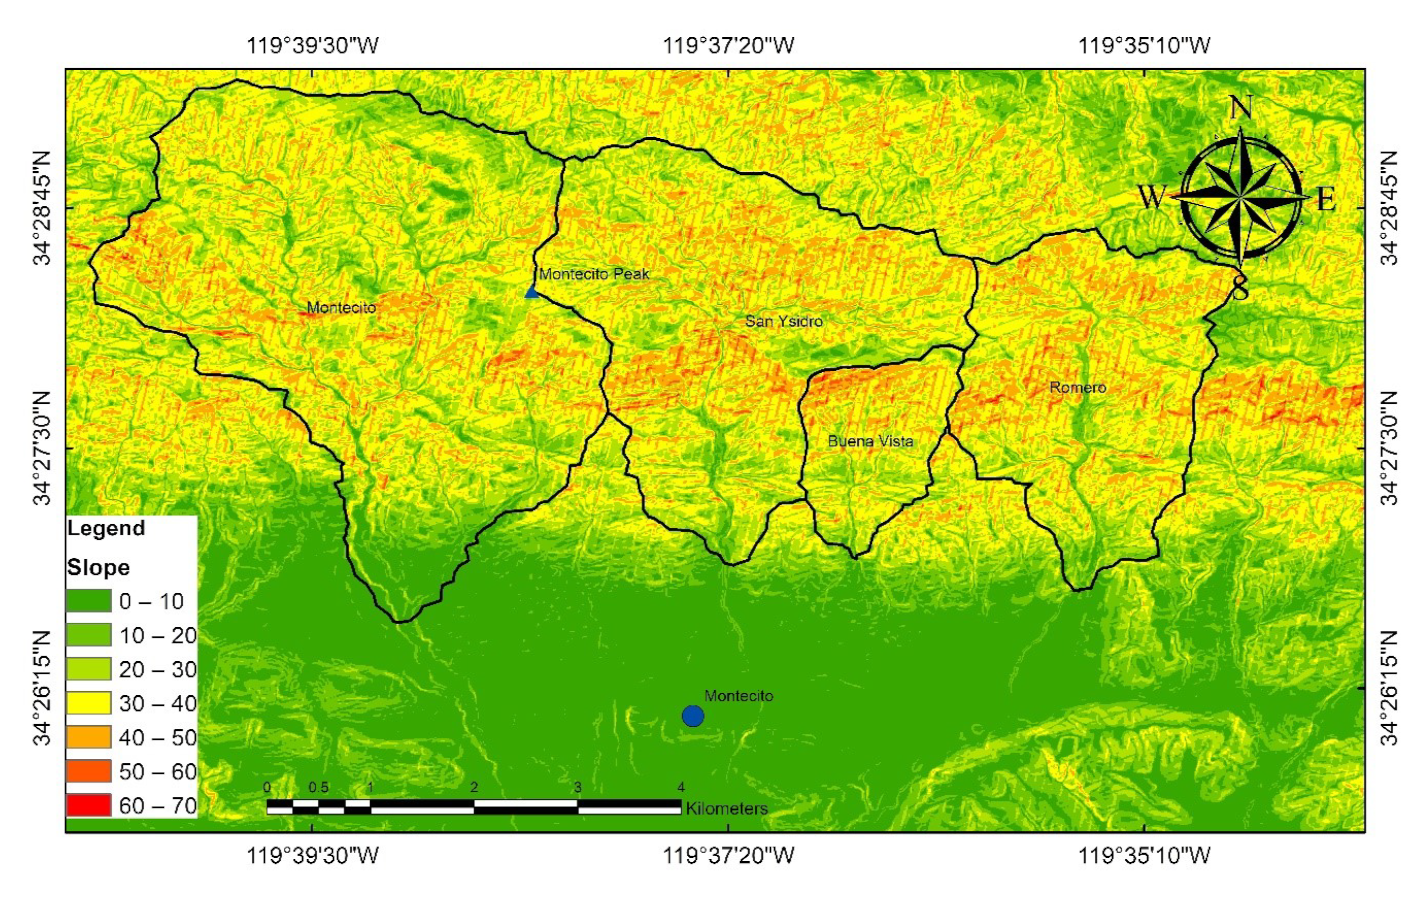
2. Study Area
3. The 2017 Wildfire and Subsequent 2018 Debris Flows
3.1. Wildfire-Affected Areas
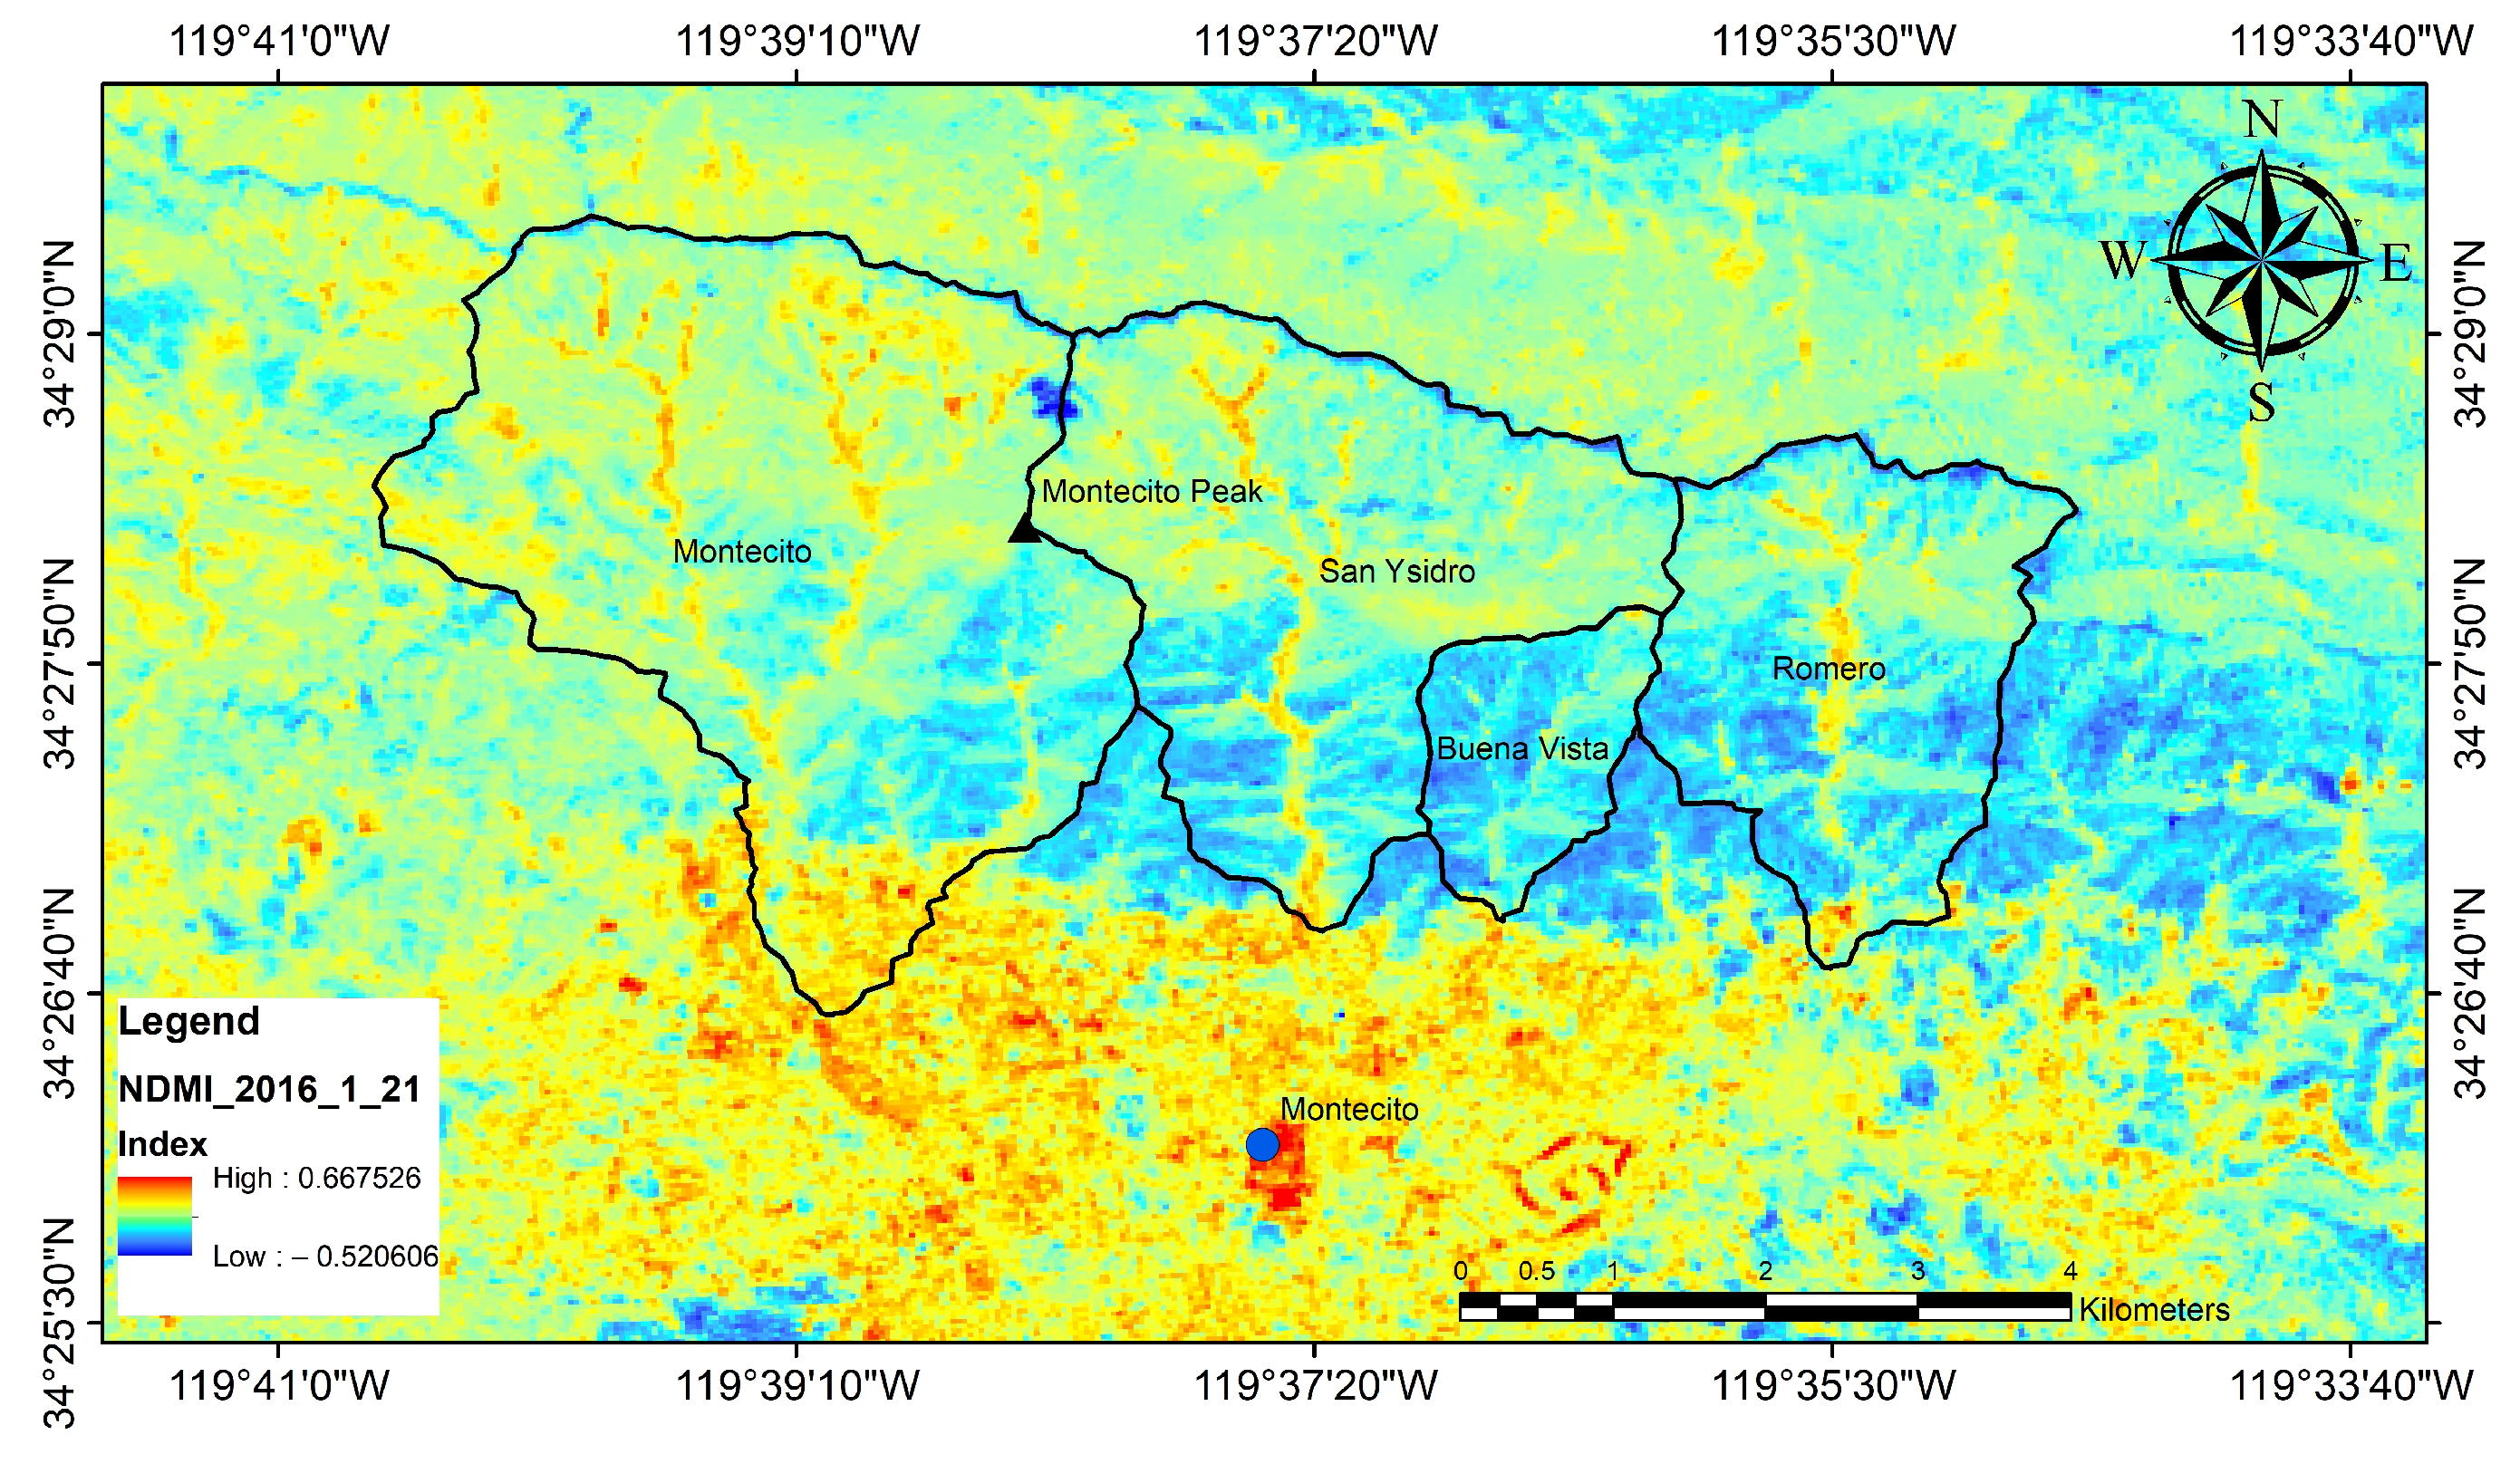
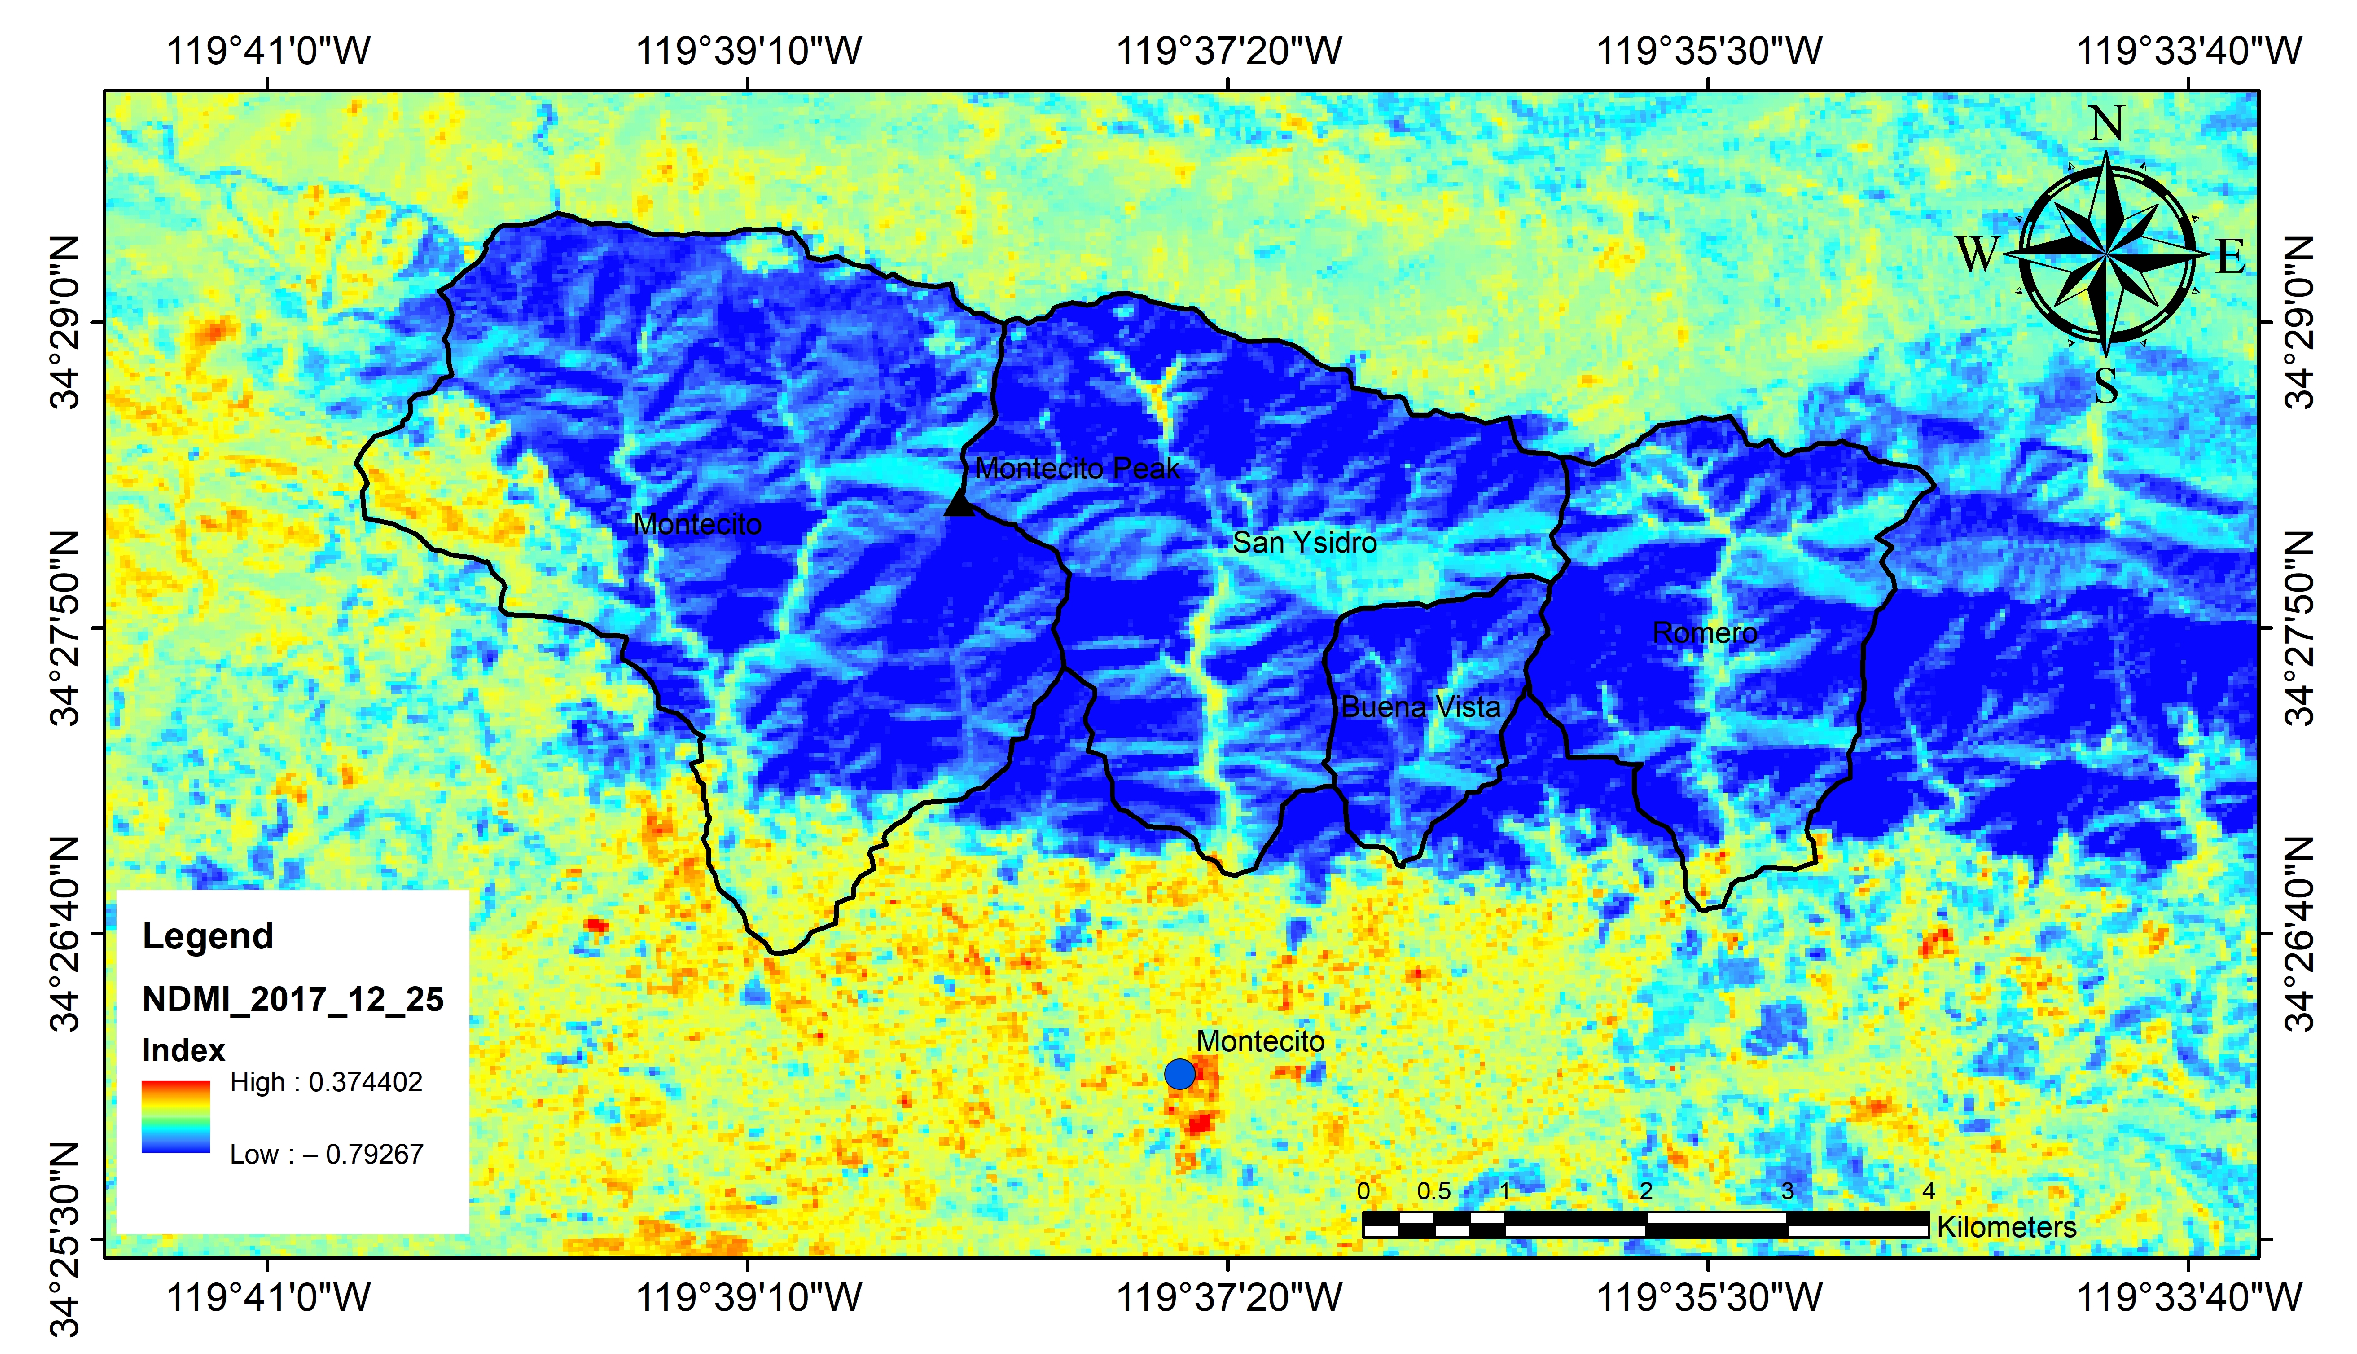
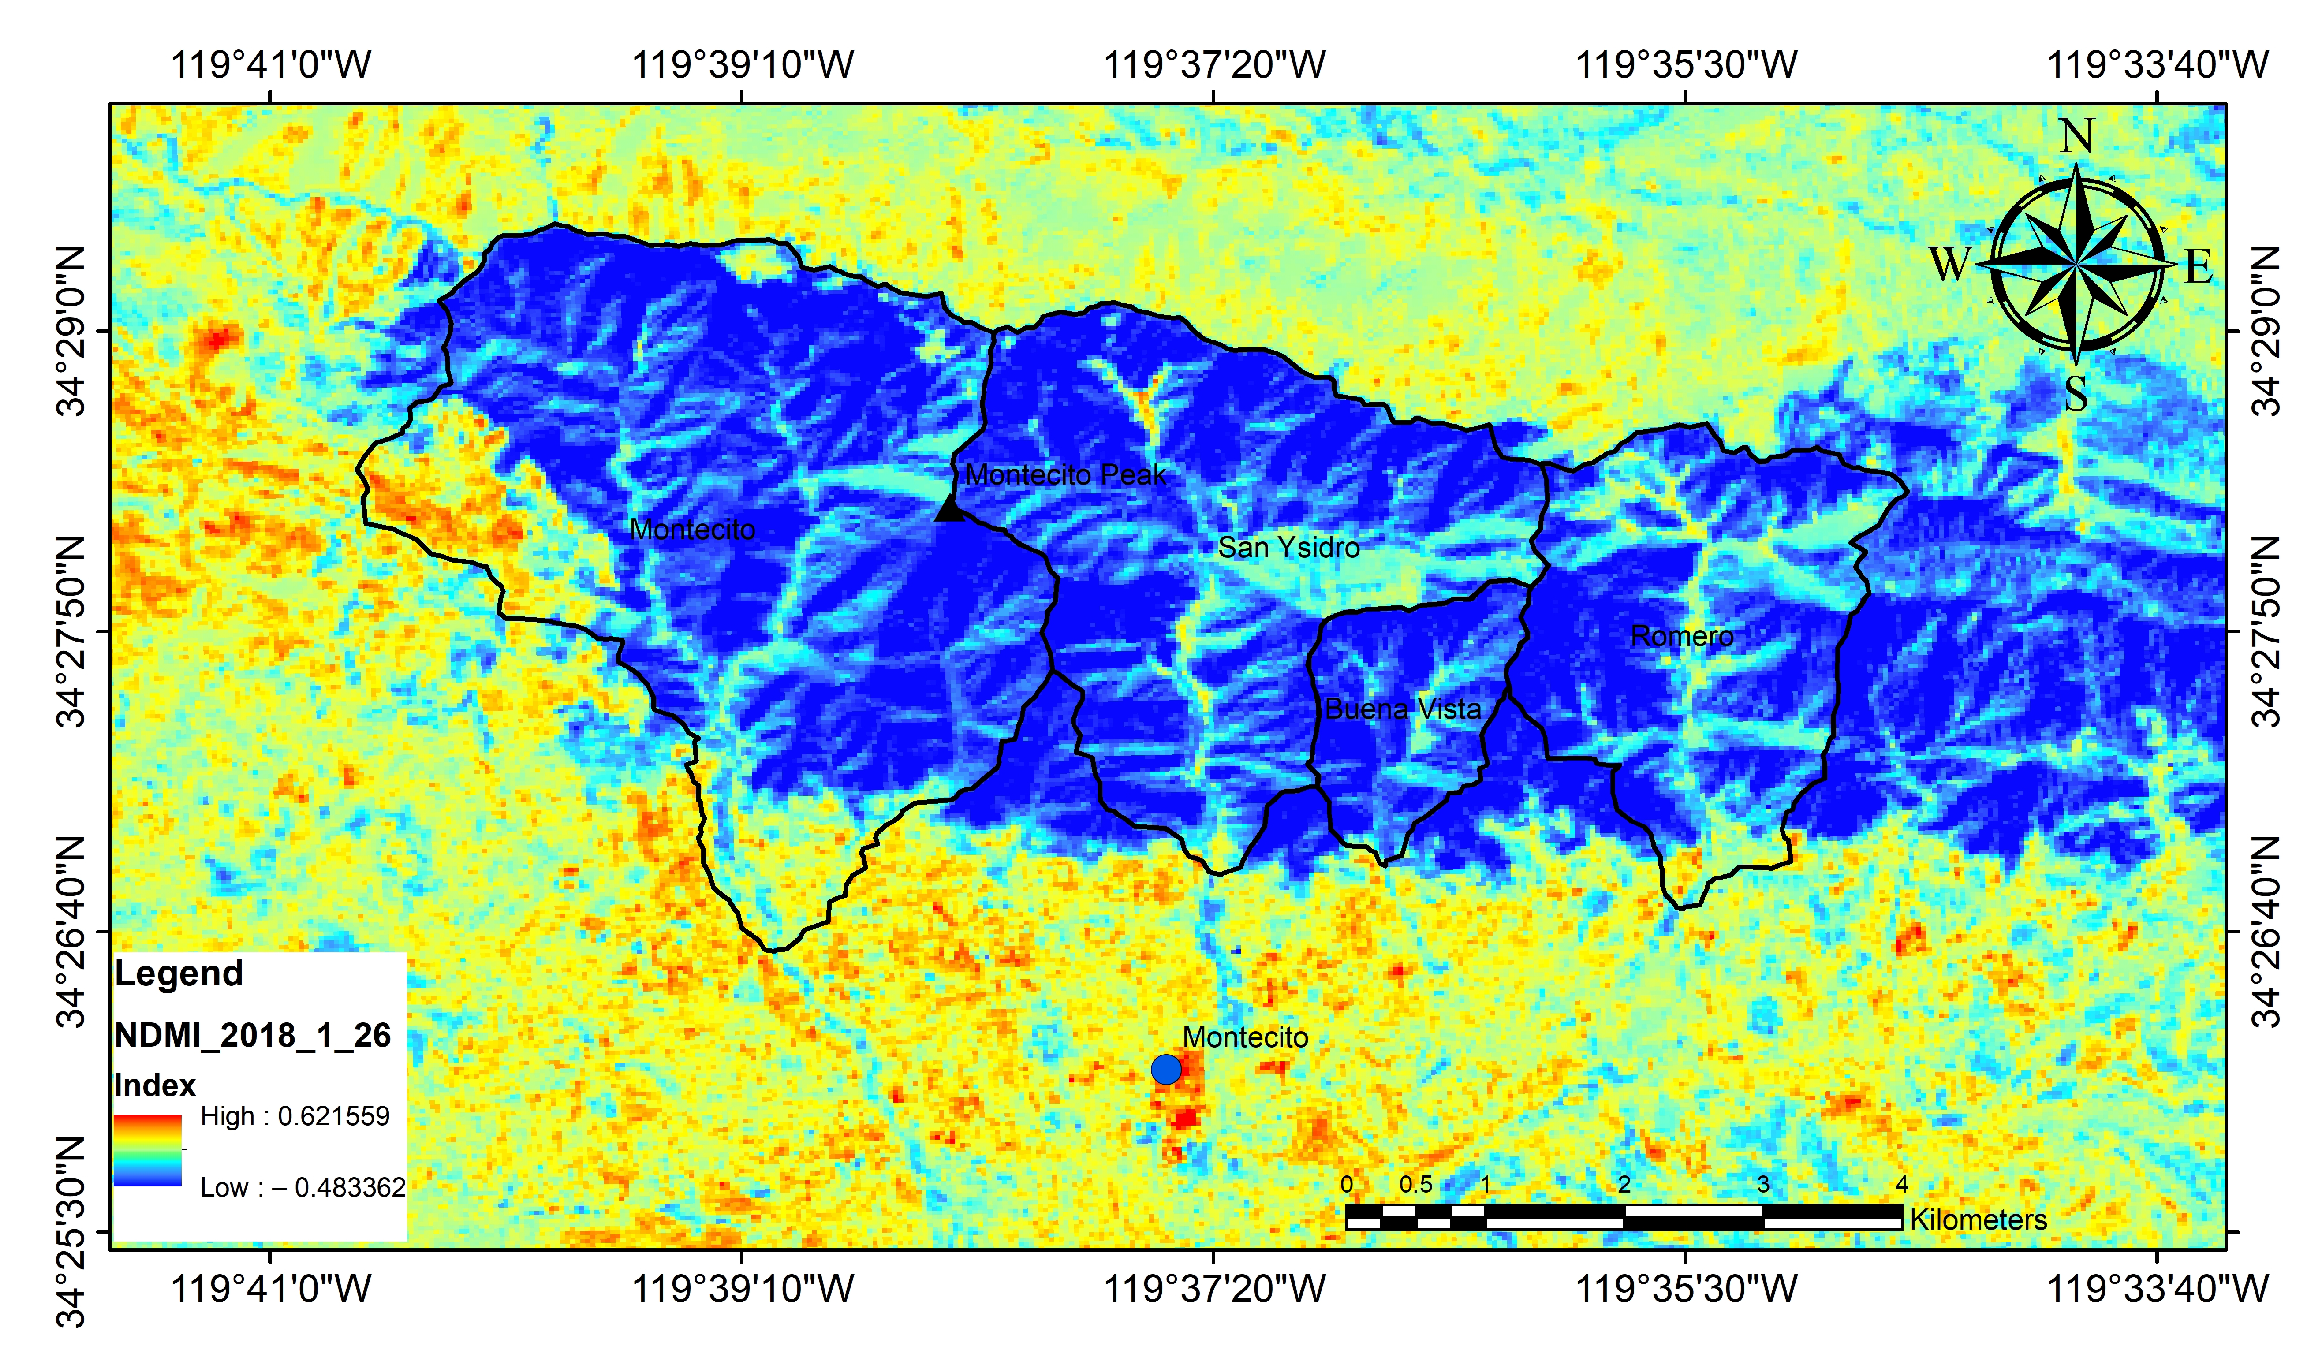
3.2. Vegetation Burned and Its Regrowth
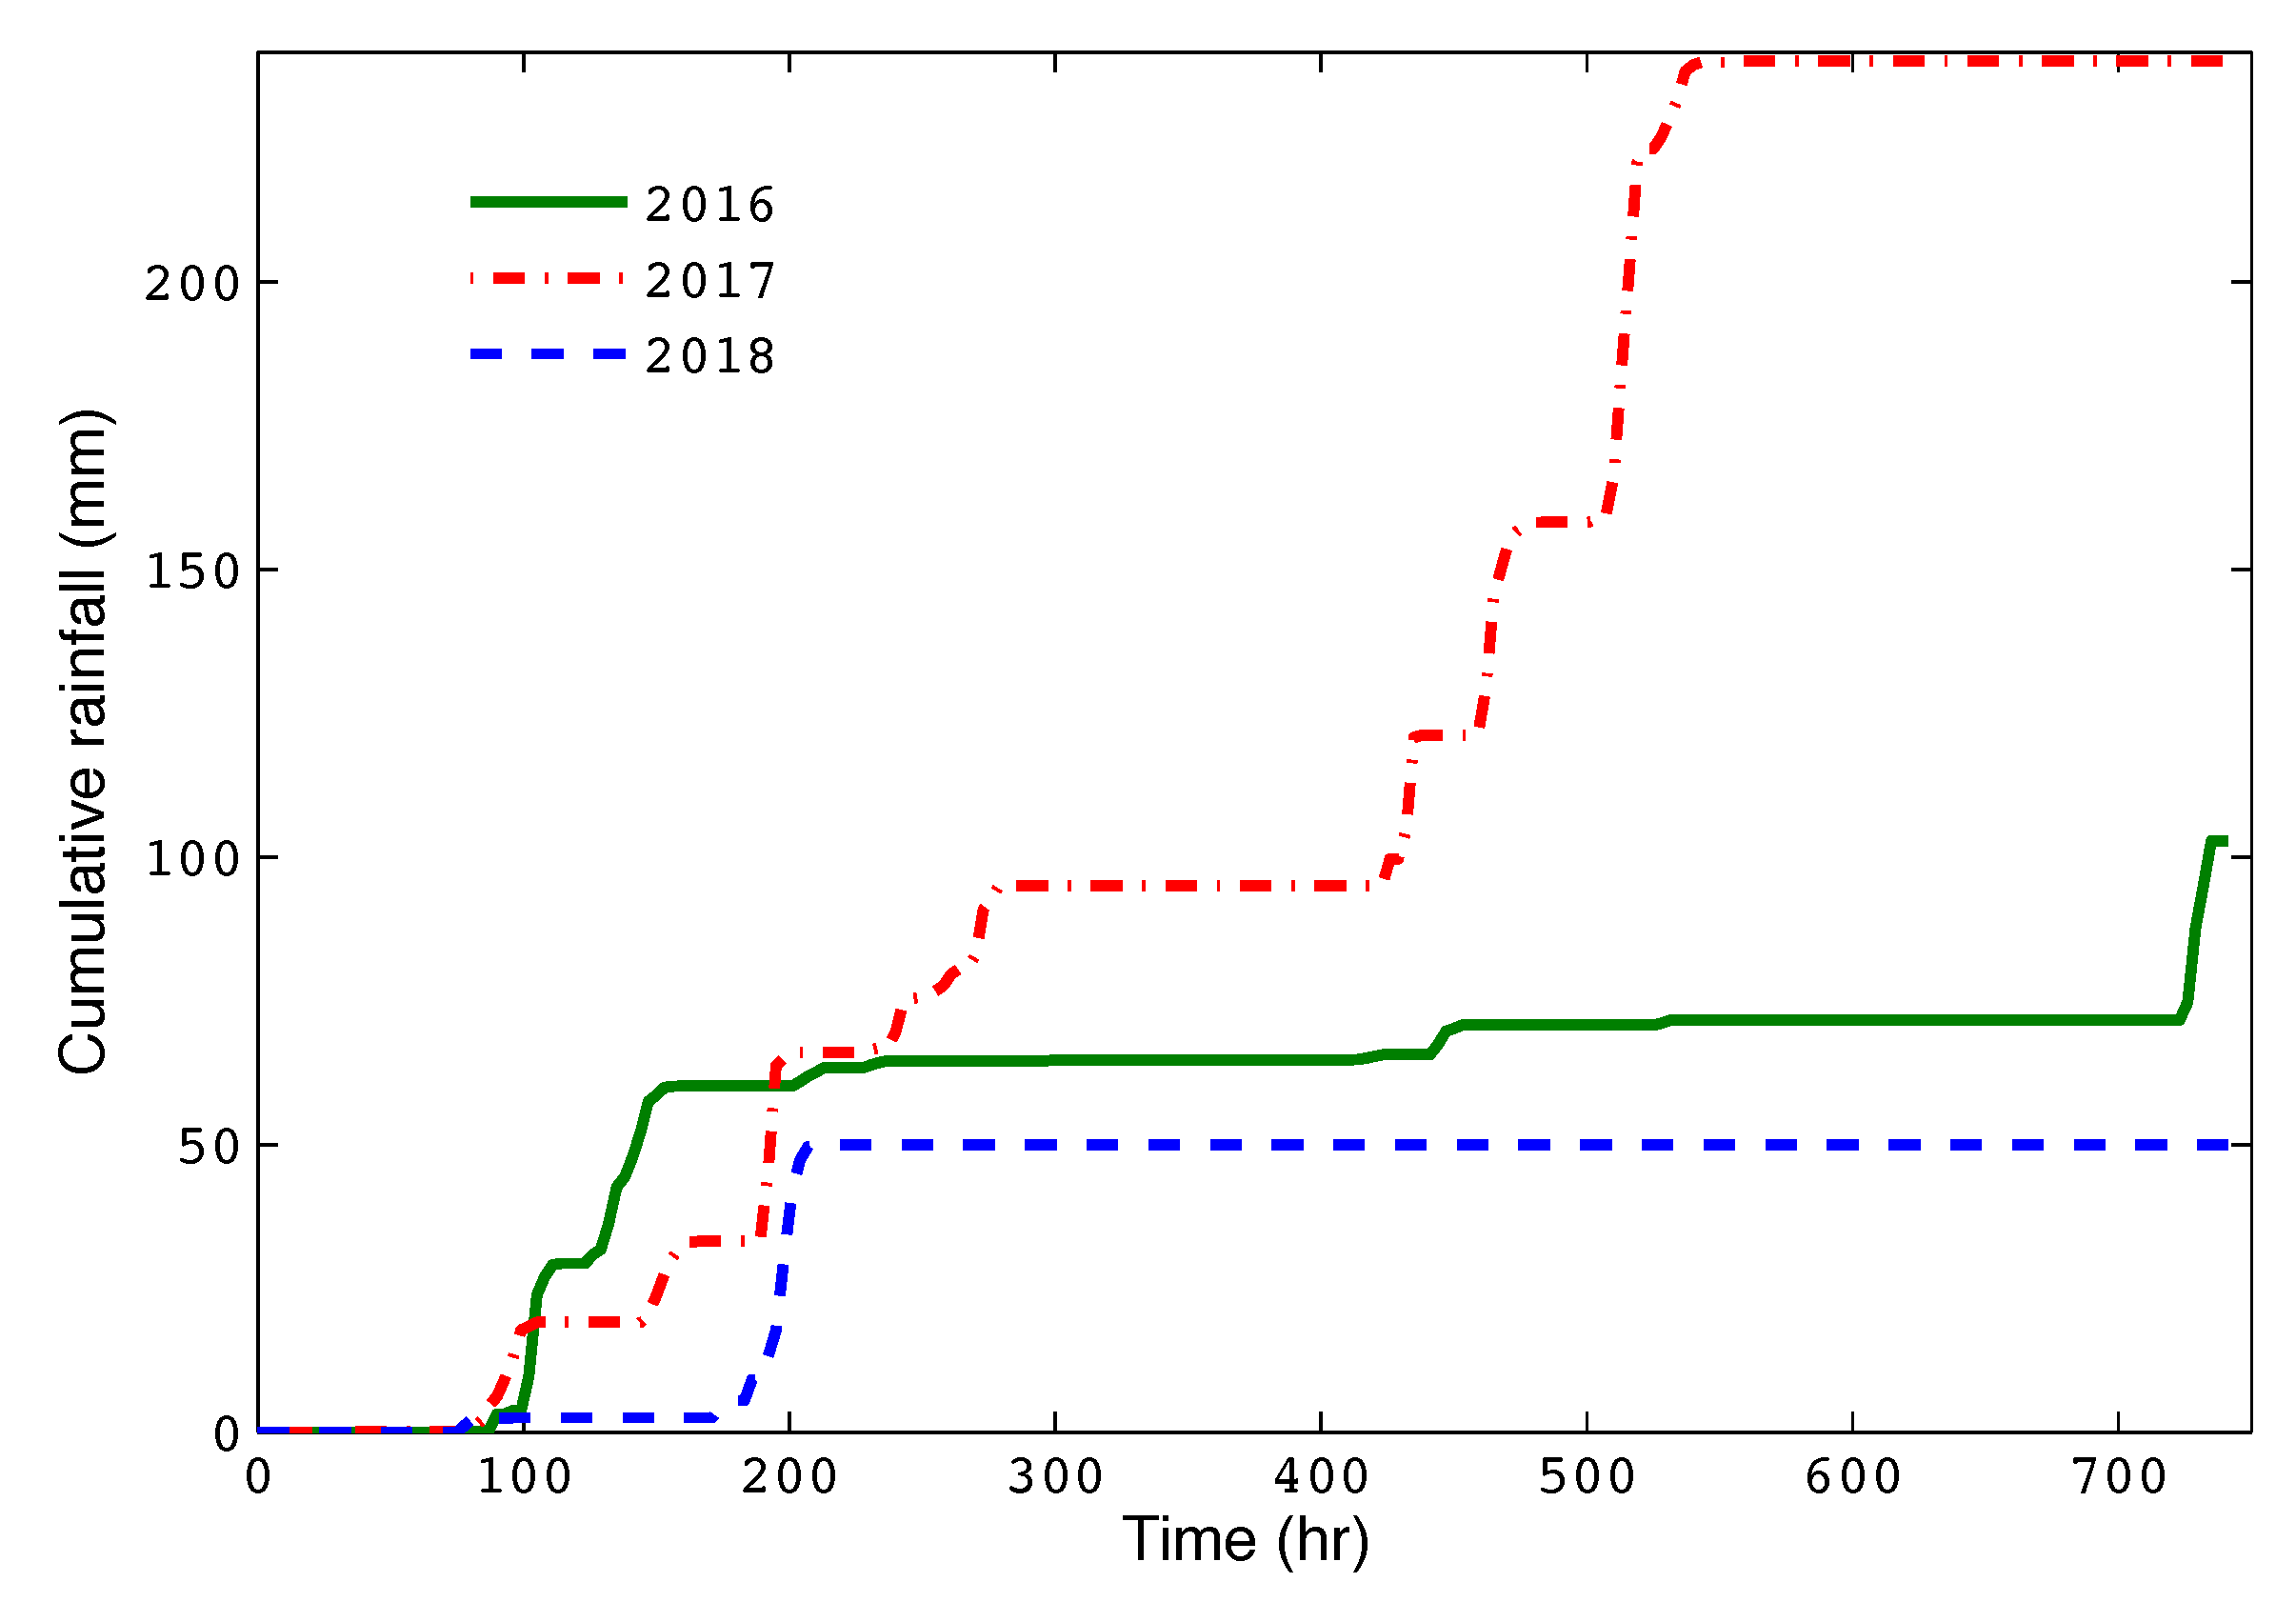
3.3. The 2018 Debris Flows and Rainfall

| Station | Elevation (m) | Rainfall (mm) | Latitude | Longitude |
|---|---|---|---|---|
| KTYD | 724 | 81 | ||
| Doulton Tunnel | 541 | 91 | ||
| Montecito | 41 | 54 | ||
| Summerland | 26 | 56 | ||
| Santa Barbara | 17 | 54 |
4. Debris Volume Estimation
4.1. Mathematical Models
| Source | Parameters Considered | Study Area |
|---|---|---|
| Gartner et al. [17] | Total storm rainfall, burned area, particle size distribution | Western US (Colorado, |
| rainfall intensity, catchment area with slopes ≥30% | Utah, California) | |
| Cannon et al. [33] | Total storm rainfall, burned area, | Colorado, Montana, |
| catchment area with slopes ≥30% | Idaho, Southern California | |
| Gartner et al. [34] | Peak 15 min rainfall intensity, burned area, relief ratio | Southern California |
| Rowe et al. [47] | Storm frequencies, peak discharge, erosion rates, | Southern California |
| fire correction factors, vegetation index, relief ratio | ||
| Gatwood et al. [48] | Peak 1 h precipitation, peak discharge, | Southern California |
| fire factor, catchment area, relief ratio | ||
| Pak and Lee [49] | Peak 1 h rainfall intensity, total storm rainfall, fire factor, | Southern California |
| time since burn, number of events causing erosion, | ||
| relief ratio, catchment area | ||
| Gartner et al. [50] | Peak 1 h rainfall intensity, burned area, average gradient, | Southern California |
| time since most recent fire, catchment area, relief ratio |
4.2. Input Parameters
4.3. Results
5. Conclusions
Author Contributions
Funding
Data Availability Statement
Acknowledgments
Conflicts of Interest
References
- National Centers for Environmental Information (NCEI). Wildfires—Annual 2021. Available online: https://www.ncdc.noaa.gov/sotc/fire/202113 (accessed on 13 January 2022).
- Keeley, J.E.; Syphard, A.D. Large California wildfires: 2020 fires in historical context. Fire Ecol. 2021, 17, 22. [Google Scholar] [CrossRef]
- Li, S.; Banerjee, T. Spatial and temporal pattern of wildfires in California from 2000 to 2019. Sci. Rep. 2021, 11, 8779. [Google Scholar] [CrossRef]
- Ice, G.G.; Neary, D.G.; Adams, P.W. Effects of wildfire on soils and watershed processes. J. For. 2004, 102, 16–20. [Google Scholar]
- Certini, G. Effects of fire on properties of forest soils: A review. Oecologia 2005, 143, 1–10. [Google Scholar] [CrossRef] [PubMed]
- Doerr, S.H.; Cerda, A. Fire effects on soil system functioning: New insights and future challenges. Int. J. Wildland Fire 2005, 14, 339–342. [Google Scholar] [CrossRef]
- Wittenberg, L. Post-fire soil ecology: Properties and erosion dynamics. Isr. J. Ecol. Evol. 2012, 58, 151–164. [Google Scholar]
- Scott, D.F.; VanWyk, D.B. The effects of wildfire on soil wettability and hydrological behaviour of an afforested catchment. J. Hydrol. 1990, 121, 239–256. [Google Scholar] [CrossRef]
- Noske, P.J.; Lane, P.N.; Nyman, P.; Van der Sant, R.E.; Sheridan, G.J. Predicting post wildfire overland flow using remotely sensed indicators of forest productivity. Hydrol. Process. 2022, 36, e14769. [Google Scholar] [CrossRef]
- Rulli, M.C.; Rosso, R. Modeling catchment erosion after wildfires in the San Gabriel Mountains of southern California. Geophys. Res. Lett. 2005, 32, L19401. [Google Scholar] [CrossRef]
- Smith, H.G.; Sheridan, G.J.; Lane, P.N.; Nyman, P.; Haydon, S. Wildfire effects on water quality in forest catchments: A review with implications for water supply. J. Hydrol. 2011, 396, 170–192. [Google Scholar] [CrossRef]
- Parise, M.; Cannon, S.H. Wildfire impacts on the processes that generate debris flows in burned watersheds. J. Hydrol. 2012, 61, 217–227. [Google Scholar] [CrossRef]
- DeGraff, J.V.; Cannon, S.H.; Gartner, J.E. The timing of susceptibility to post-fire debris flows in the Western United States. Environ. Eng. Geosci. 2015, 21, 277–292. [Google Scholar] [CrossRef]
- Staley, D.M.; Negri, J.A.; Kean, J.W.; Laber, J.L.; Tillery, A.C.; Youberg, A.M. Prediction of spatially explicit rainfall intensity-duration thresholds for post-fire debris-flow generation in the western United States. Geomorphology 2017, 278, 149–162. [Google Scholar] [CrossRef]
- Cannon, S.H.; Boldt, E.M.; Laber, J.L.; Kean, J.W.; Staley, D.M. Rainfall intensity-duration thresholds for postfire debris-flow emergency-response planning. Nat. Hazard. 2011, 59, 209–236. [Google Scholar] [CrossRef]
- Staley, D.M.; Kean, J.W.; Cannon, S.H.; Schmidt, K.M.; Laber, J.L. Objective definition of rainfall intensity-duration thresholds for the initiation of post-fire debris flows in southern California. Landslides 2013, 10, 547–562. [Google Scholar] [CrossRef]
- Gartner, J.E.; Cannon, S.H.; Santi, P.M.; Dewolfe, V.G. Empirical models to predict the volumes of debris flows generated by recently burned basins in the western US. Geomorphology 2008, 96, 339–354. [Google Scholar] [CrossRef]
- Staley, D.M.; Tillery, A.C.; Kean, J.W.; McGuire, L.A.; Pauling, H.E.; Rengers, F.K.; Smith, J.B. Estimating post-fire debris-flow hazards prior to wildfire using a statistical analysis of historical distributions of fire severity from remote sensing data. Int. J. Wildland Fire 2018, 27, 595–608. [Google Scholar] [CrossRef]
- Cheng, C. Generalized viscoplastic modeling of debris flow. J. Hydraul. Eng. 1988, 114, 237–258. [Google Scholar] [CrossRef]
- Savage, S.B.; Hutter, K. The motion of a finite mass of granular material down a rough incline. J. Fluid Mech. 1989, 199, 177–215. [Google Scholar] [CrossRef]
- Hungr, O. A model for the runout analysis of rapid flow slides, debris flows, and avalanches. Can. Geotech. J. 1995, 32, 610–623. [Google Scholar] [CrossRef]
- Iverson, R.M.; Denlinger, R.P. Flow of variably fluidized granular masses across three?dimensional terrain: 1. Coulomb mixture theory. J. Geophys. Res. B Solid Earth 2001, 106, 537–552. [Google Scholar] [CrossRef]
- Medina, V.; Hurlimann, M.; Bateman, A. Application of FLATModel, a 2D finite volume code, to debris flows in the northeastern part of the Iberian Peninsula. Landslides 2008, 5, 127–142. [Google Scholar] [CrossRef]
- Pudasaini, S.P. A general two-phase debris flow model. J. Geophys. Res. Earth Surf. 2012, 117, F03010. [Google Scholar] [CrossRef]
- Gregoretti, C.; Stancanelli, L.M.; Bernarda, M.; Boreggio, M.; Degetto, M.; Lanzoni, S. Relevance of erosion processes when modelling in-channel gravel debris flows for efficient hazard assessment. J. Hydrol. 2019, 568, 575–591. [Google Scholar] [CrossRef]
- Hungr, O.; Morgan, G.C.; Kellerhals, R. Quantitative analysis of debris torrent hazards for design of remedial measures. Can. Geotech. J. 1984, 21, 663–677. [Google Scholar] [CrossRef]
- Bovis, M.J.; Jakob, M. The role of debris supply conditions in predicting debris flow activity. Earth Surf. Process. Landforms 1999, 24, 1039–1054. [Google Scholar] [CrossRef]
- Donovan, I.P.; Santi, P.M. A probabilistic approach to post-wildfire debris-flow volume modeling. Landslides 2017, 14, 1345–1360. [Google Scholar] [CrossRef]
- Marchi, L.; Brunetti, M.T.; Cavalli, M.; Crema, S. Debris-flow volumes in Northeastern Italy: Relationship with drainage and size probability. Earth Surf. Process. Landforms 2019, 44, 933–943. [Google Scholar] [CrossRef]
- Cannon, S.H.; Gartner, J.E.; Rupert, M.G.; Michael, J.A.; Djokic, D.; Sreedhar, S. Emergency Assessment of Debris-flow Hazards from Basins Burned by the Grand Prix and Old Fires of 2003; OPEN-FILE REPORT OF-03-475; U.S. Geological Survey: Reston, VA, USA, 2003. [Google Scholar]
- Meyer, G.A.; Pierce, J.L.; Wood, S.H.; Jull, A.J.T. Fire, storms, and erosional events in the Idaho batholith. Hydrol. Processes 2001, 15, 3025–3038. [Google Scholar] [CrossRef]
- Gartner, J.E. Relations between Wildfire Related Debris-Flow Volumes and Basin Morphology, Burn Severity, Material Properties and Triggering Storm Rainfall. Master’s Thesis, University of Colorado, Denver, CO, USA, 2005. [Google Scholar]
- Cannon, S.H.; Gartner, J.E.; Rupert, M.G.; Michael, J.A.; Rea, A.H.; Parrett, C. Predicting the probability and volume of postwildfire debris flows in the intermountain western United States. Geol. Soc. Am. Bull. 2010, 122, 127–144. [Google Scholar] [CrossRef]
- Gartner, J.E.; Cannon, S.H.; Santi, P.M. Empirical models for predicting volumes of sediment deposited by debris flows and sediment-laden floods in the transverse ranges of southern California. Eng. Geol. 2014, 176, 45–56. [Google Scholar] [CrossRef]
- Sidman, G.; Guertin, D.P.; Goodrich, D.C.; Thoma, D.; Falk, D.; Burns, I.S. A coupled modelling approach to assess the effect of fuel treatments on post-wildfire runoff and erosion. Int. J. Wildland Fire 2015, 25, 351–362. [Google Scholar] [CrossRef]
- Cui, Y.; Cheng, D.; Chan, D. Investigation of post-fire debris flows in Montecito. ISPRS Int. J. Geo-Inf. 2018, 8, 5. [Google Scholar] [CrossRef]
- Kean, J.W.; Staley, D.M.; Lancaster, J.T.; Rengers, F.K.; Swanson, B.J.; Coe, J.A.; Hernandez, J.L.; Sigman, A.J.; Allstadt, K.E.; Lindsay, D.N. Inundation, flow dynamics, and damage in the 9 January 2018 Montecito debris-flow event, California, USA: Opportunities and challenges for post-wildfire risk assessment. Geosphere 2019, 15, 1140–1163. [Google Scholar] [CrossRef]
- Keller, E.; Adamaitis, C.; Alessio, P.; Goto, E.; Gray, S.; Heermance, R.V.; Schwartz, J.J. Montecito debris flows of 9 January 2018: Physical processes and social implications. In From the Islands to the Mountains: A 2020 View of Geologic Excursions in Southern California; Geological Society of America: Boulder, CO, USA, 2020; pp. 95–114. [Google Scholar]
- National Oceanic and Atmospheric Administration (NOAA). Available online: https://noaa.maps.arcgis.com/apps/MapJournal/index.html?appid=541c23aa483b48978d1bc9904a6fb14d (accessed on 20 February 2022).
- Alessio, P.; Dunne, T.; Morell, K. Post wildfire generation of debris flow slurry by rill erosion on colluvial hillslopes. J. Geophys. Res. Earth Surf. 2021, 126, e2021JF006108. [Google Scholar] [CrossRef]
- Ventura County Fire Department. VCFD Determines Cause of the Thomas Fire. Available online: https://vcfd.org/news/vcfd-determines-cause-of-the-thomas-fire (accessed on 27 May 2022).
- United States Geological Survey (USGS). Available online: https://earthexplorer.usgs.gov/ (accessed on 3 January 2022).
- Copernicus Open Access Hub (COAH). Available online: https://scihub.copernicus.eu/dhus/#/home (accessed on 5 January 2022).
- EOS Data Analytics. NDMI (Normalized Difference Moisture Index). Available online: https://eos.com/make-an-analysis/ndmi (accessed on 8 October 2022).
- Zoomash Ltd. World Weather Online (WWO). Available online: https://worldweatheronline.com/ (accessed on 14 January 2022).
- Berti, M.; Bernard, M.; Gregoretti, C.; Simoni, A. Physical interpretation of rainfall thresholds for runoff-generated debris flows. J. Geophys. Res. Earth Surf. 2020, 125, e2019JF005513. [Google Scholar] [CrossRef]
- Rowe, P.B.; Countryman, C.M.; Storey, H.C. Probable Peak Discharges and Erosion Rates from Southern California Watersheds as Influenced by Fire; U.S. Department of Agriculture, Forest Service, California Forest and Range Experiment Station: San Joaquin, CA, USA, 1949; p. 270. [Google Scholar]
- Gatwood, E.; Pederson, J.; Casey, K. Los Angeles District Method for Prediction of Debris Yields; U.S. Army Corps of Engineers: Los Angeles, CA, USA, 2000; p. 145. [Google Scholar]
- Pak, J.H.; Lee, J.J. A Statistical Sediment Yield Prediction Model Incorporating the Effect of Fires and Subsequent Storm Events 1. JAWRA J. Am. Water Resour. Assoc. 2008, 44, 689–699. [Google Scholar] [CrossRef]
- Gartner, J.E.; Cannon, S.H.; Helsel, D.R.; Bandurraga, M. Multivariate Statistical Models for Predicting Sediment Yields from Southern California Watersheds; United States Geological Survey: Reston, VA, USA, 2009. [Google Scholar]
- KC, D. Post Wildfire Debris Flows: Mechanisms of Enhanced Overland Flow and Erosion and Numerical Simulations. Ph.D. Thesis, University of Toledo, Toledo, OH, USA, 2023. [Google Scholar]


| Creek | A () | B () | T (mm) | (mm) | R (m) |
|---|---|---|---|---|---|
| Montecito | 10.62 | 11.5 | 24.13 | 74.16 | 716 |
| San Ysidro | 7.30 | 7.84 | 24.13 | 74.16 | 727 |
| Buena Vista | 1.64 | 1.74 | 24.13 | 74.16 | 277 |
| Romero | 4.76 | 5.15 | 24.13 | 74.16 | 627 |
| Creek | A () | B () | T (mm) | (mm) | R (m) |
|---|---|---|---|---|---|
| Montecito | 10.62 | 11.5 | 39.16 | 104.64 | 716 |
| San Ysidro | 7.30 | 7.84 | 39.16 | 104.64 | 727 |
| Buena Vista | 1.64 | 1.74 | 39.16 | 104.64 | 277 |
| Romero | 4.76 | 5.15 | 39.16 | 104.64 | 627 |
| Creek | Observed () | Model 1 () | Difference (%) | Model 2 () | Difference (%) |
|---|---|---|---|---|---|
| Montecito | 231,000 | 213,996 | −7.36 | 152,717 | −33.89 |
| San Ysidro | 297,000 | 113,012 | −61.95 | 136,638 | −54.00 |
| Buena Vista | 41,000 | 16,363 | −60.08 | 20,780 | −49.32 |
| Romero | 100,000 | 60,283 | −39.72 | 91,446 | −8.55 |
| Creek | Observed () | Model 1 () | Difference (%) | Model 2 () | Difference (%) |
|---|---|---|---|---|---|
| Montecito | 231,000 | 280,080 | +21.25 | 287,226 | +24.34 |
| San Ysidro | 297,000 | 147,910 | −50.20 | 256,987 | −13.47 |
| Buena Vista | 41,000 | 21,417 | −47.76 | 39,082 | −4.68 |
| Romero | 100,000 | 78,898 | −21.20 | 171,991 | +71.99 |
Disclaimer/Publisher’s Note: The statements, opinions and data contained in all publications are solely those of the individual author(s) and contributor(s) and not of MDPI and/or the editor(s). MDPI and/or the editor(s) disclaim responsibility for any injury to people or property resulting from any ideas, methods, instructions or products referred to in the content. |
© 2023 by the authors. Licensee MDPI, Basel, Switzerland. This article is an open access article distributed under the terms and conditions of the Creative Commons Attribution (CC BY) license (https://creativecommons.org/licenses/by/4.0/).
Share and Cite
KC, D.; Hu, L. Post-Wildfire Debris Flows in Montecito, California (USA): A Case Study and Empirically Based Debris Volume Estimation. Geotechnics 2023, 3, 347-359. https://doi.org/10.3390/geotechnics3020020
KC D, Hu L. Post-Wildfire Debris Flows in Montecito, California (USA): A Case Study and Empirically Based Debris Volume Estimation. Geotechnics. 2023; 3(2):347-359. https://doi.org/10.3390/geotechnics3020020
Chicago/Turabian StyleKC, Diwakar, and Liangbo Hu. 2023. "Post-Wildfire Debris Flows in Montecito, California (USA): A Case Study and Empirically Based Debris Volume Estimation" Geotechnics 3, no. 2: 347-359. https://doi.org/10.3390/geotechnics3020020