
Numerical Investigation of Inclined Piles under Liquefaction-Induced Lateral Spreading

Abstract
:1. Introduction
- (1)
- To construct a comprehensive 3D FEM model enabling the modeling of soil liquefaction and the seismic performance of the inclined pile groups with different configurations.
- (2)
- To conduct parametric analyzes to evaluate the effects of different factors on the performance of the soil–pile system, including the pile inclination, the ground slope, the soil profile, and the amplitude of the input motion.
- (3)
- Summarize the practical applications of inclined piles against liquefaction-induced lateral spreading.
2. Numerical Analysis Description
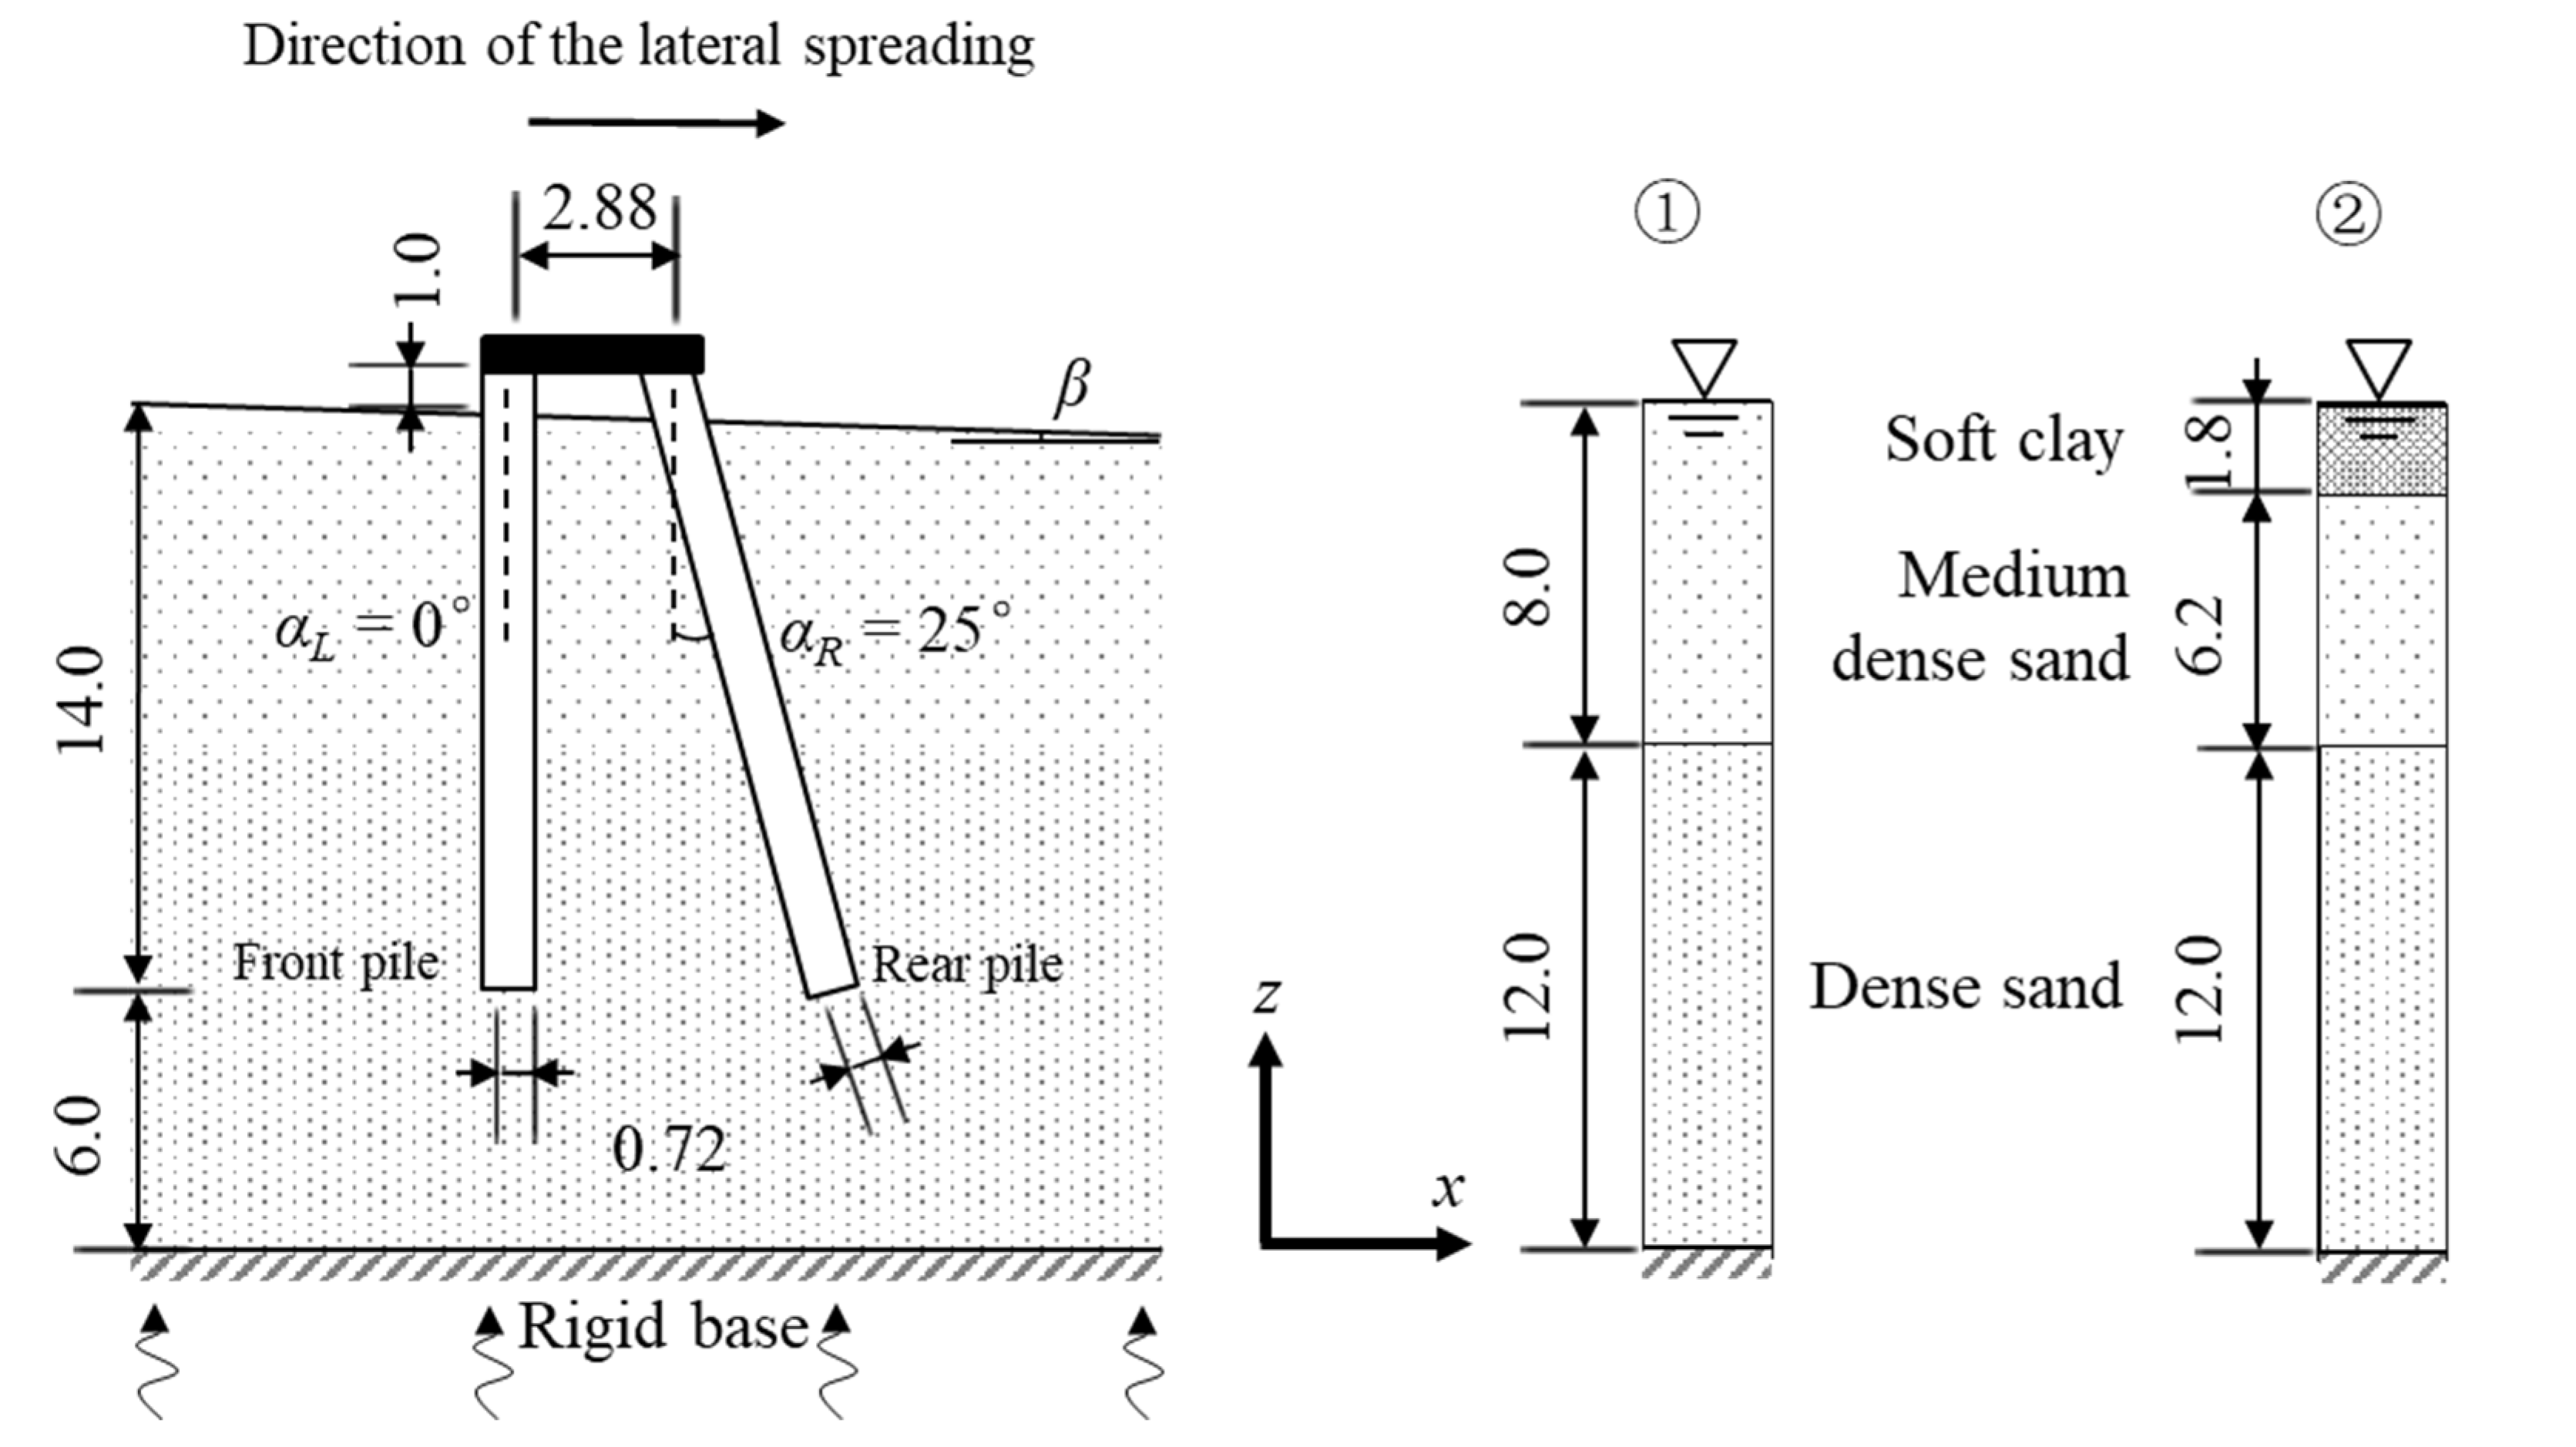
2.1. Problem Definition
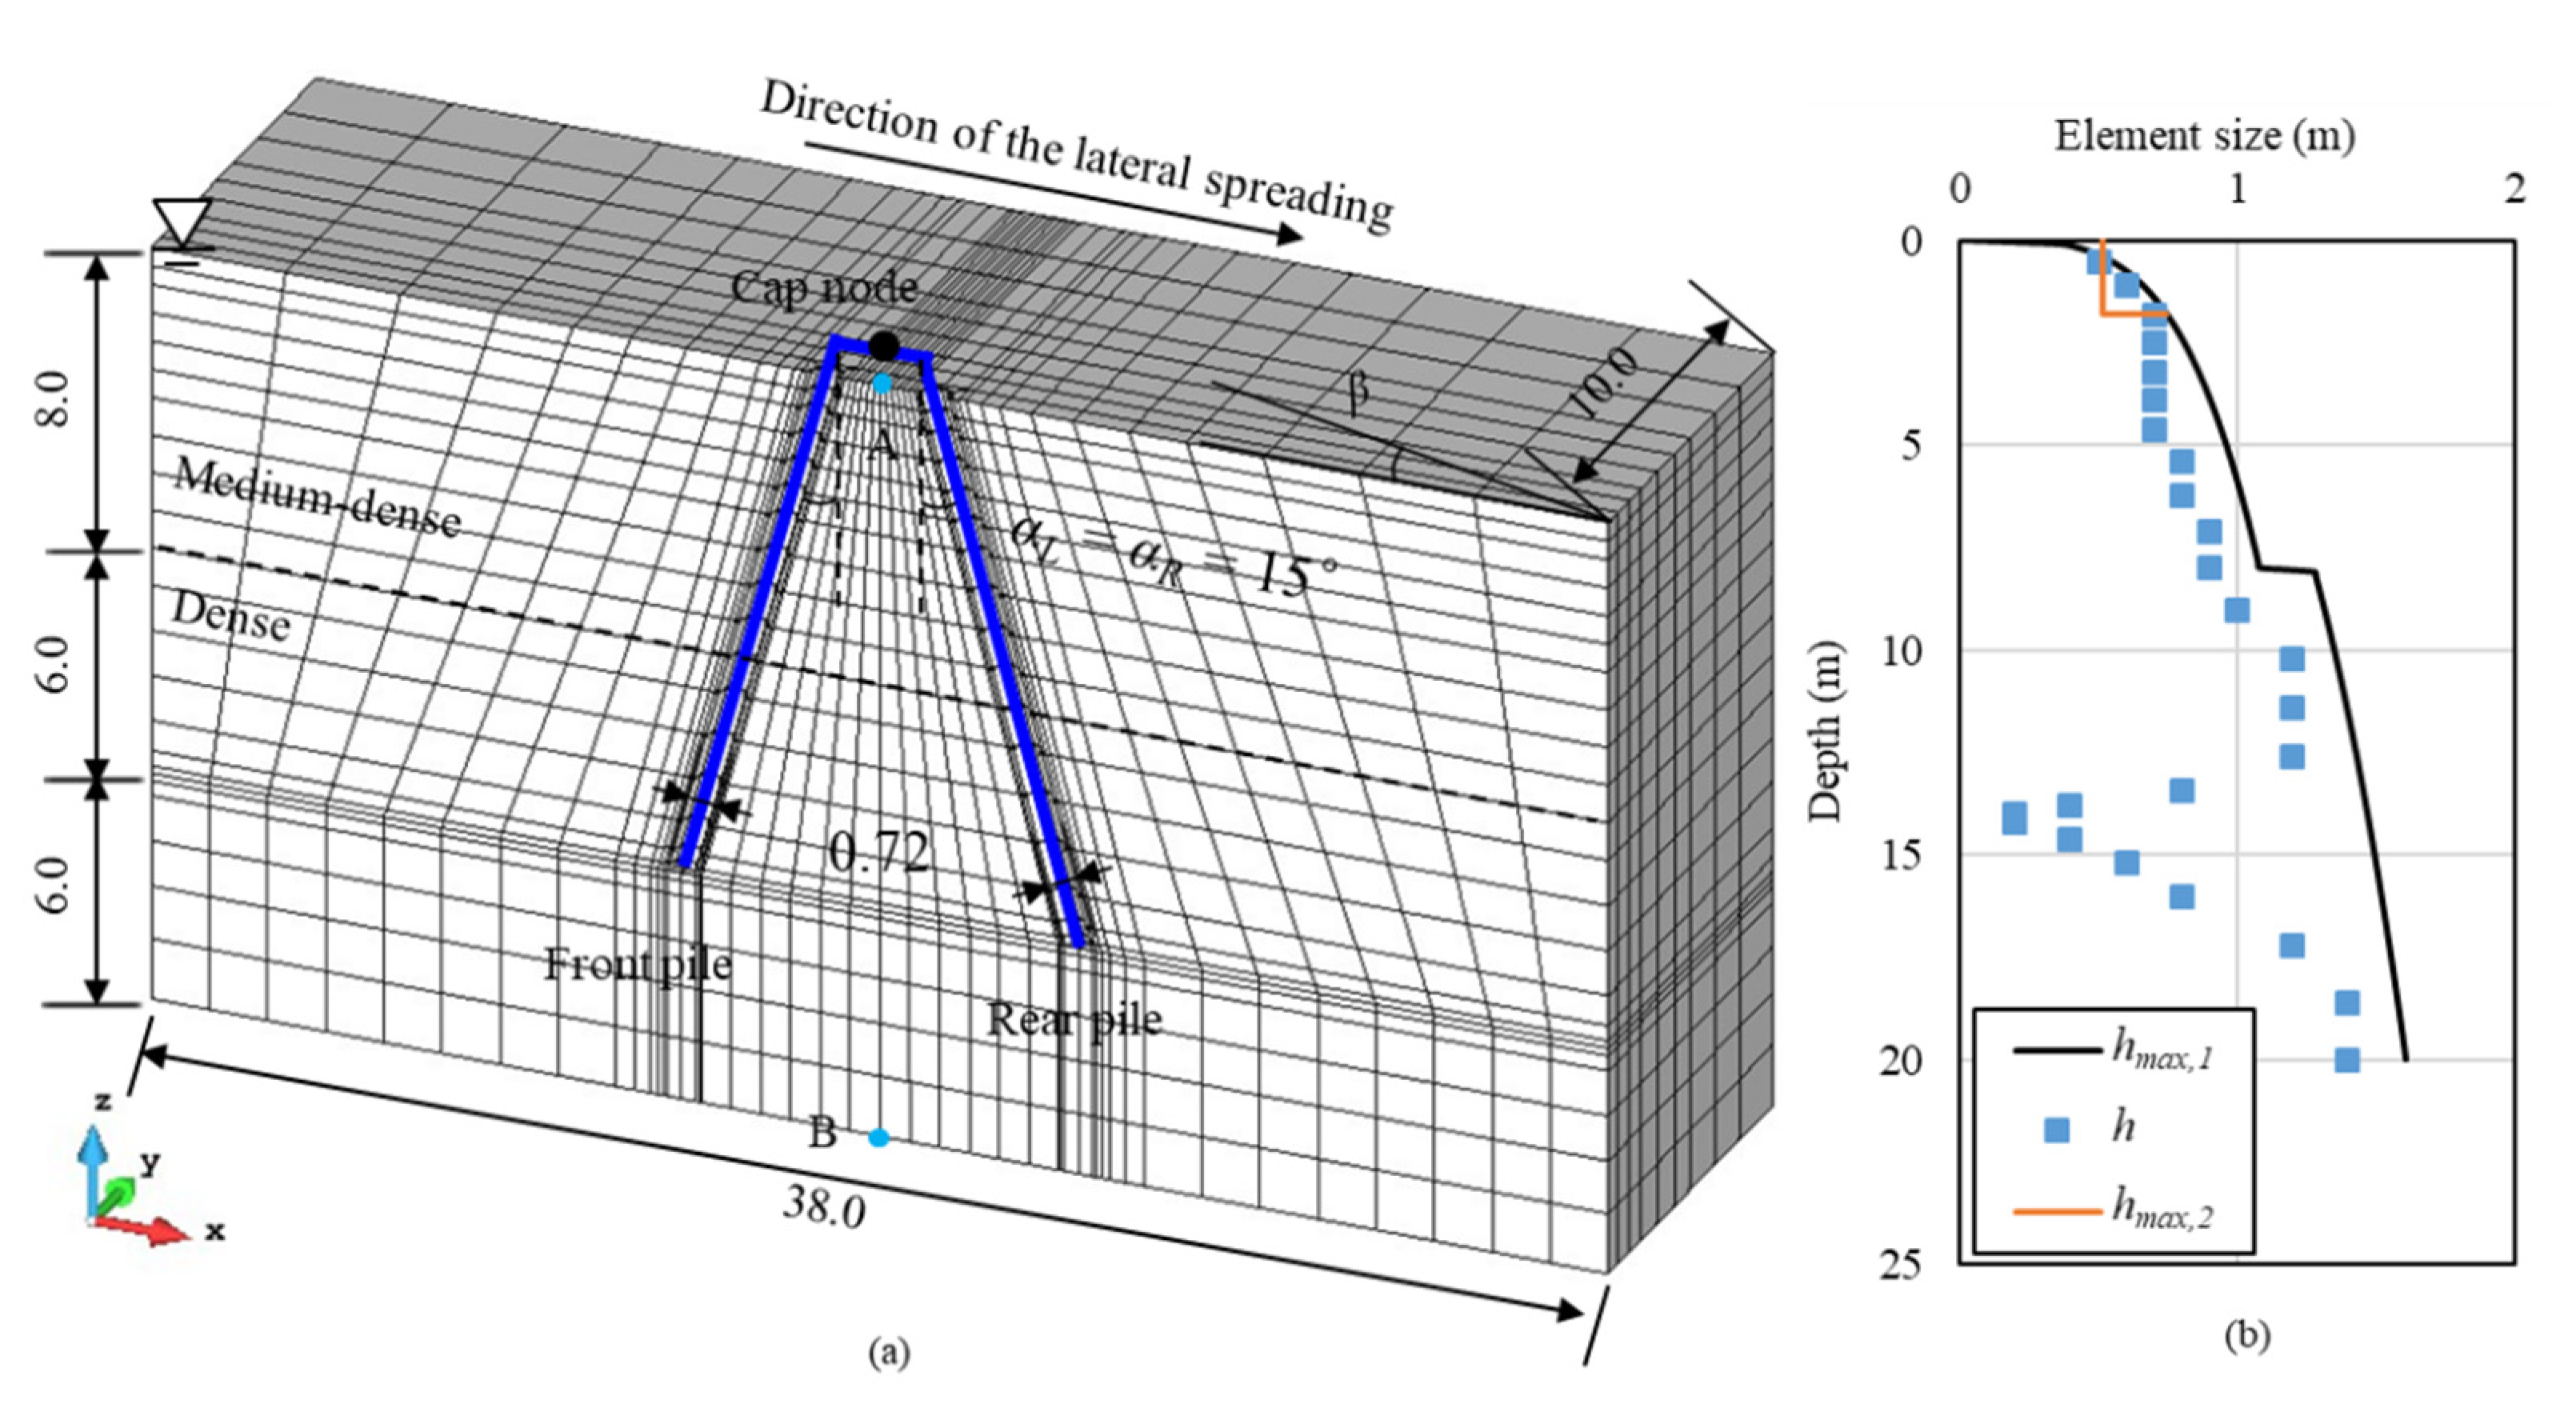
2.2. Numerical Model Layout, Meshing, Boundary Conditions, and Analysis Settings
2.3. Soil Constitutive Model
2.4. Soil–Pile Interface Modeling
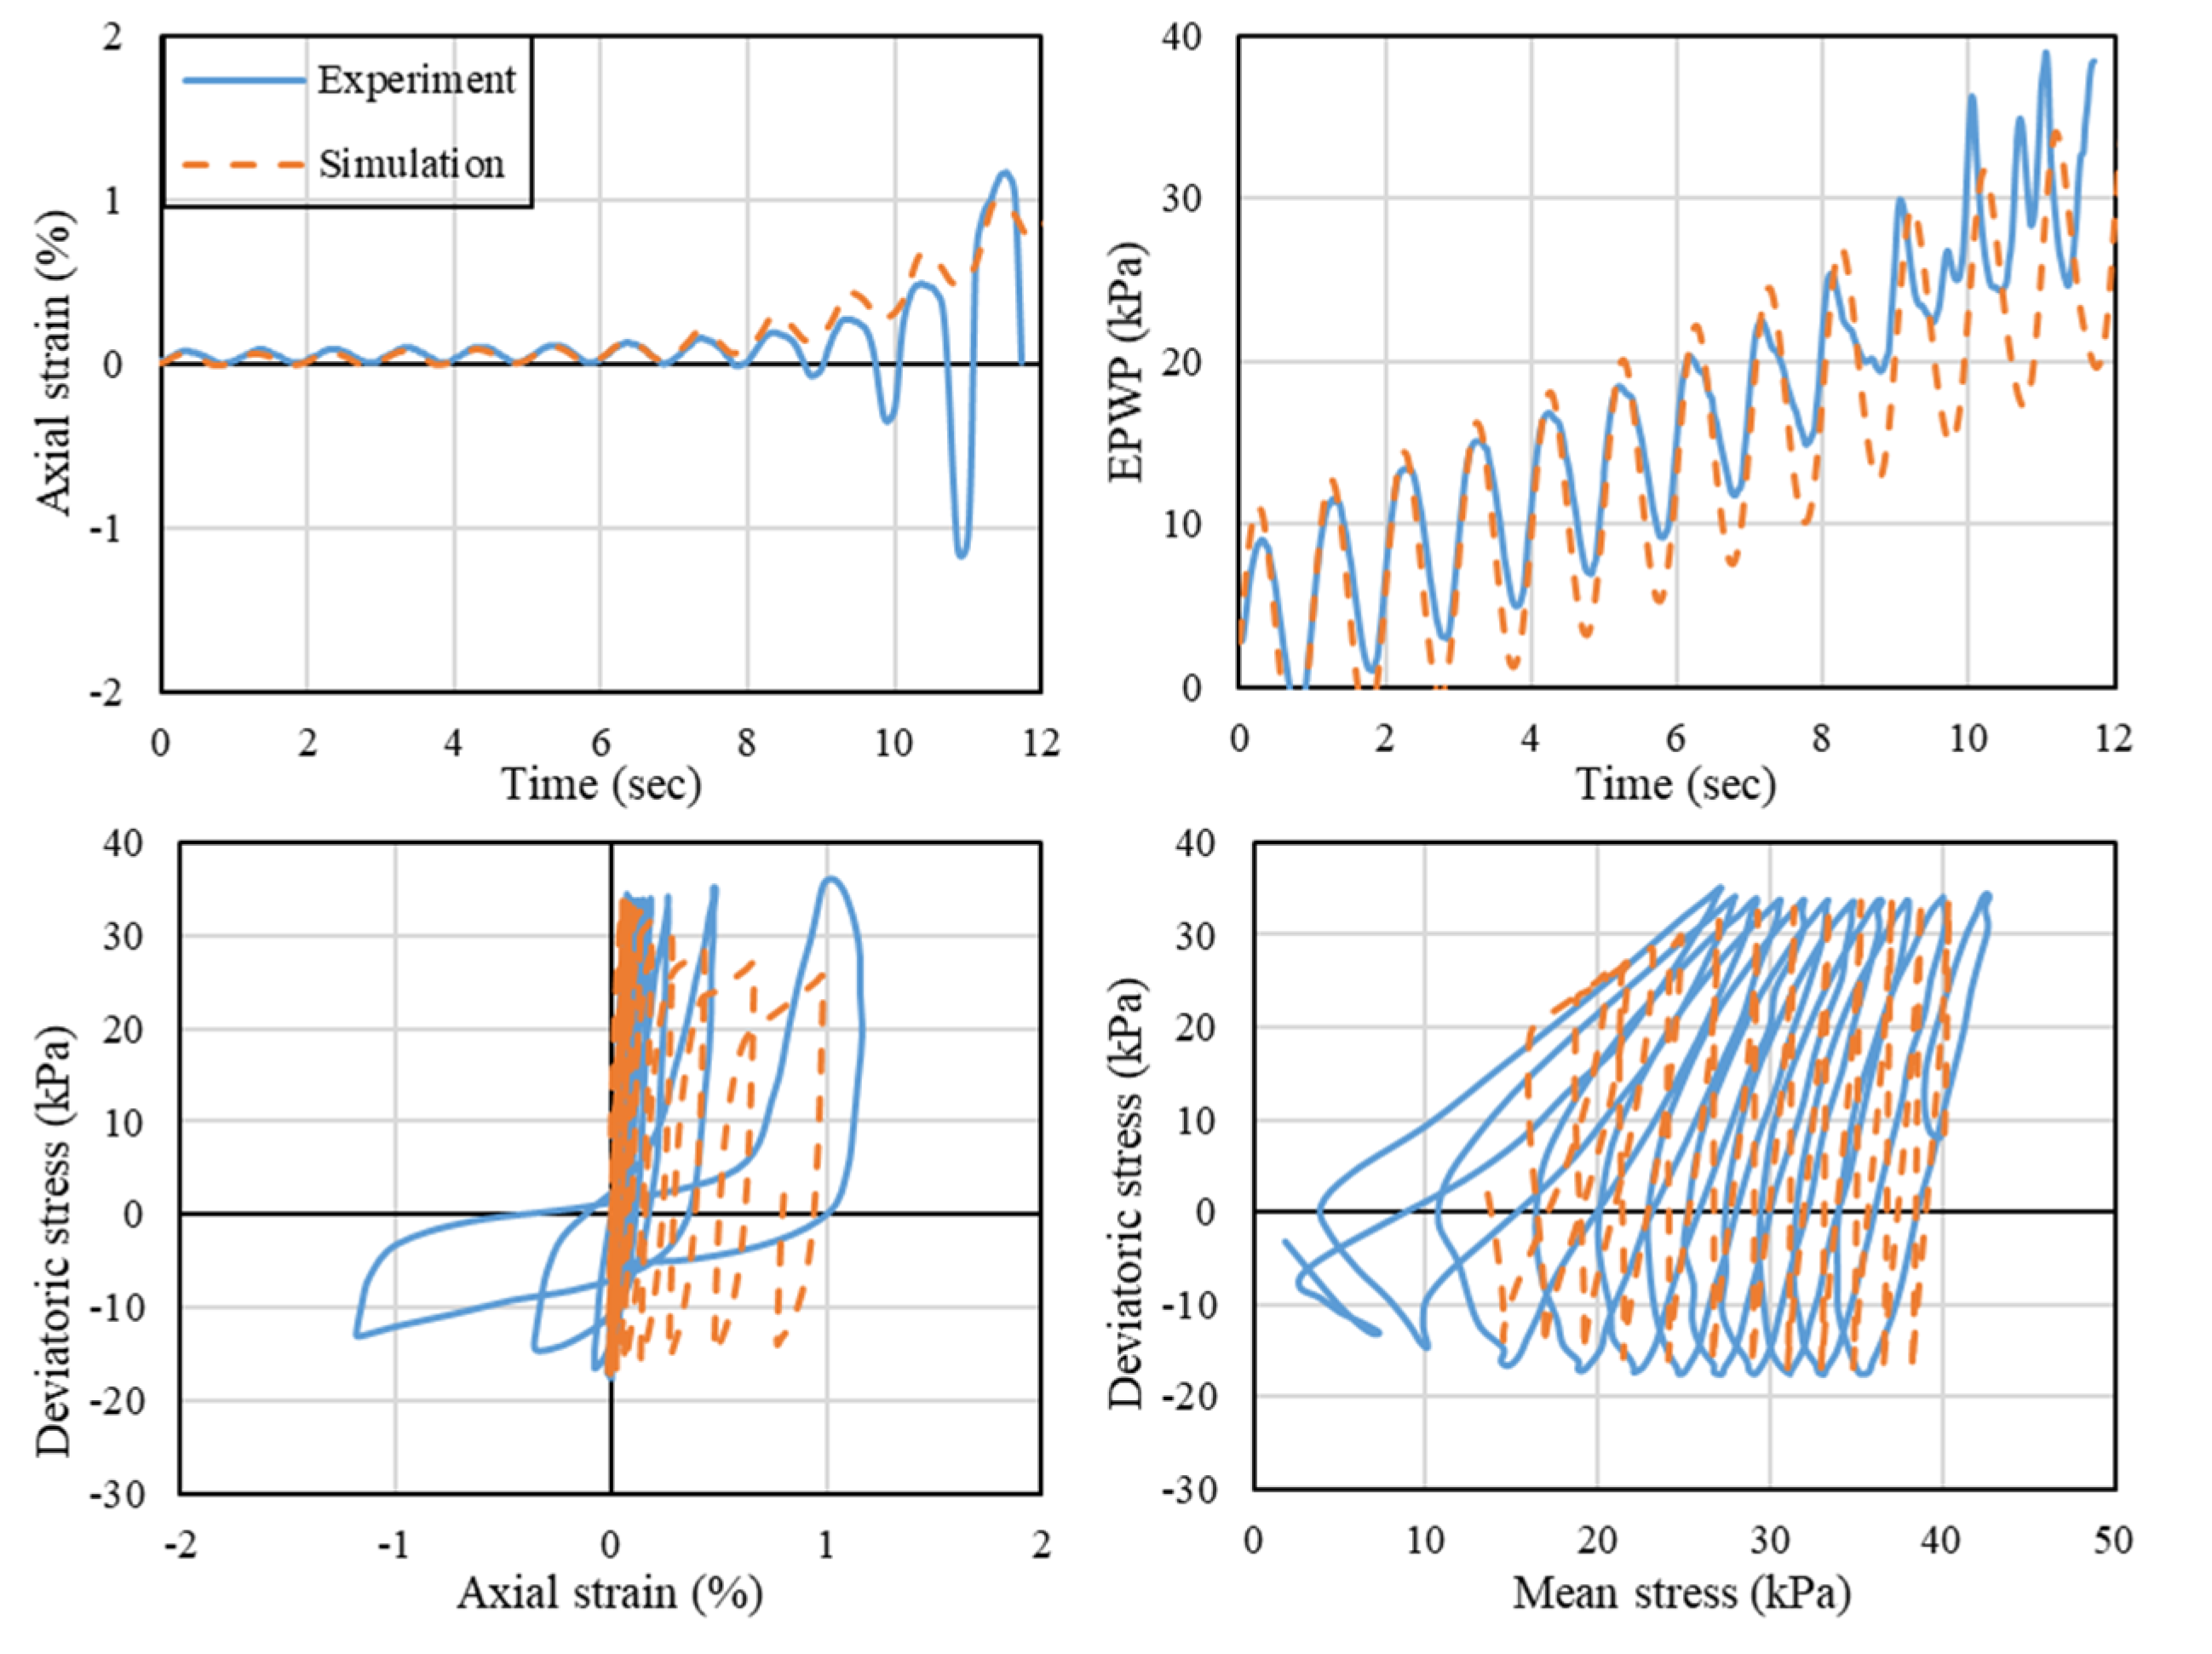
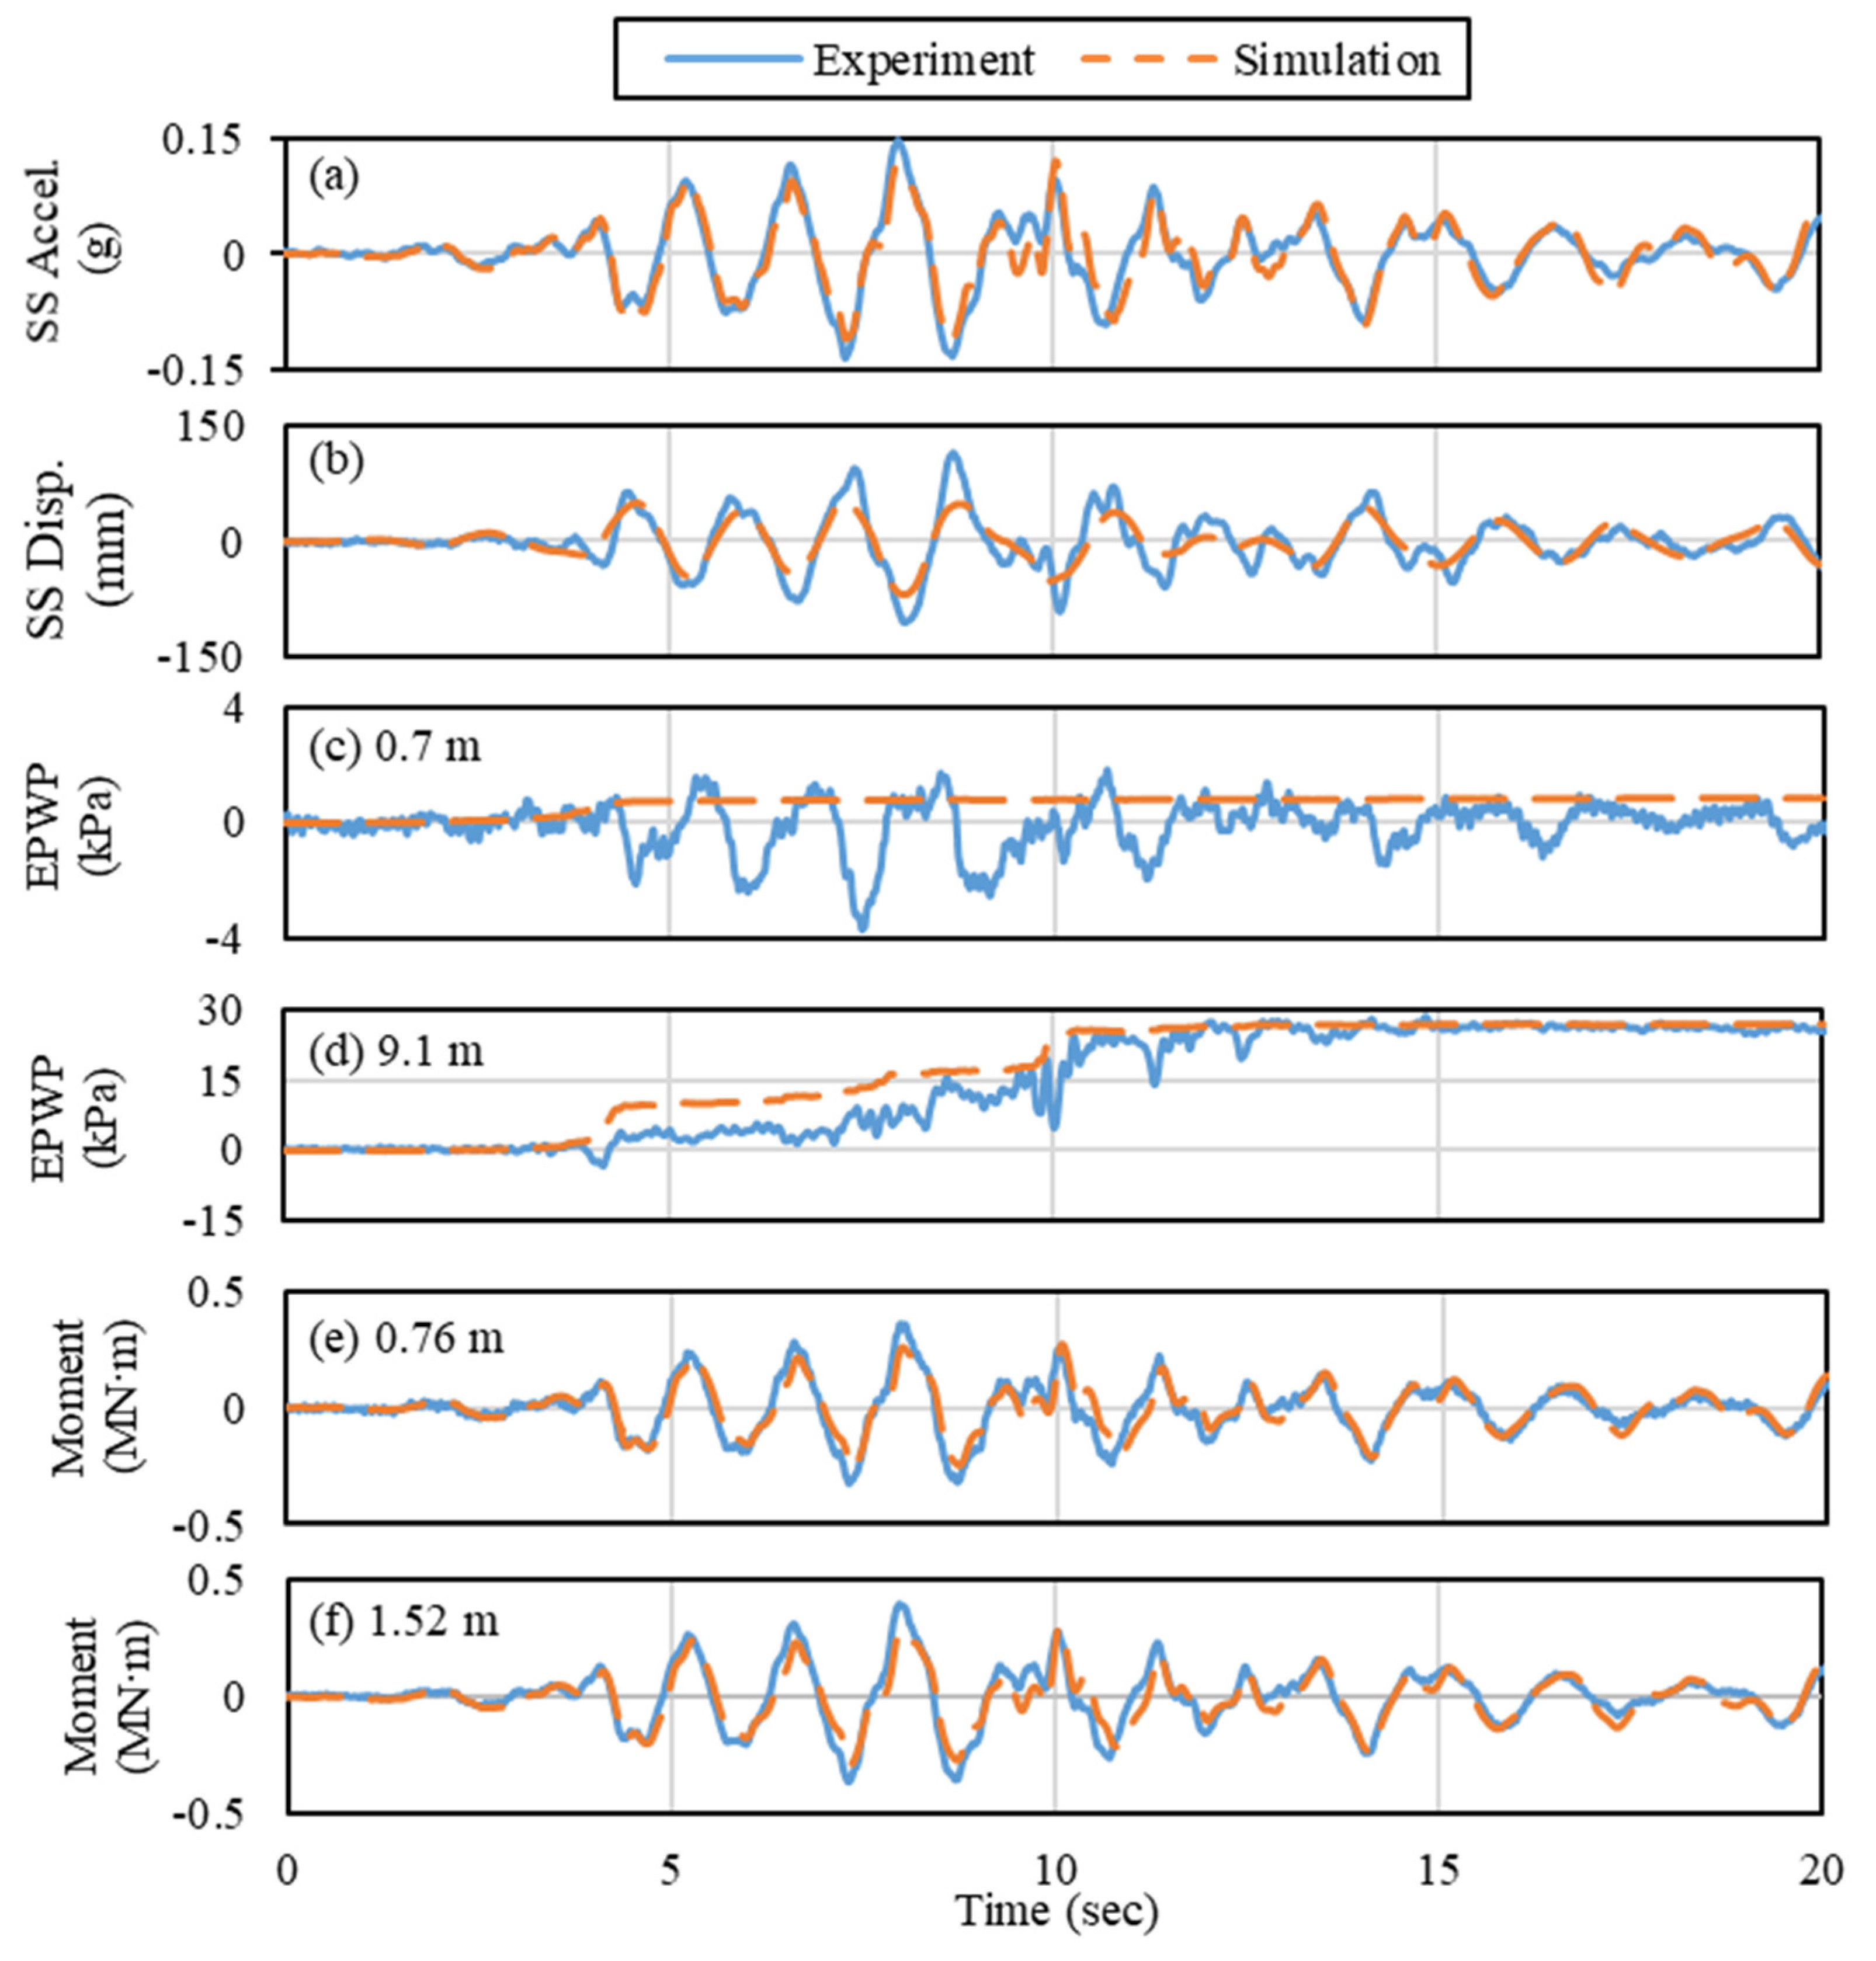
2.5. Model Validation
3. Analysis of the Results
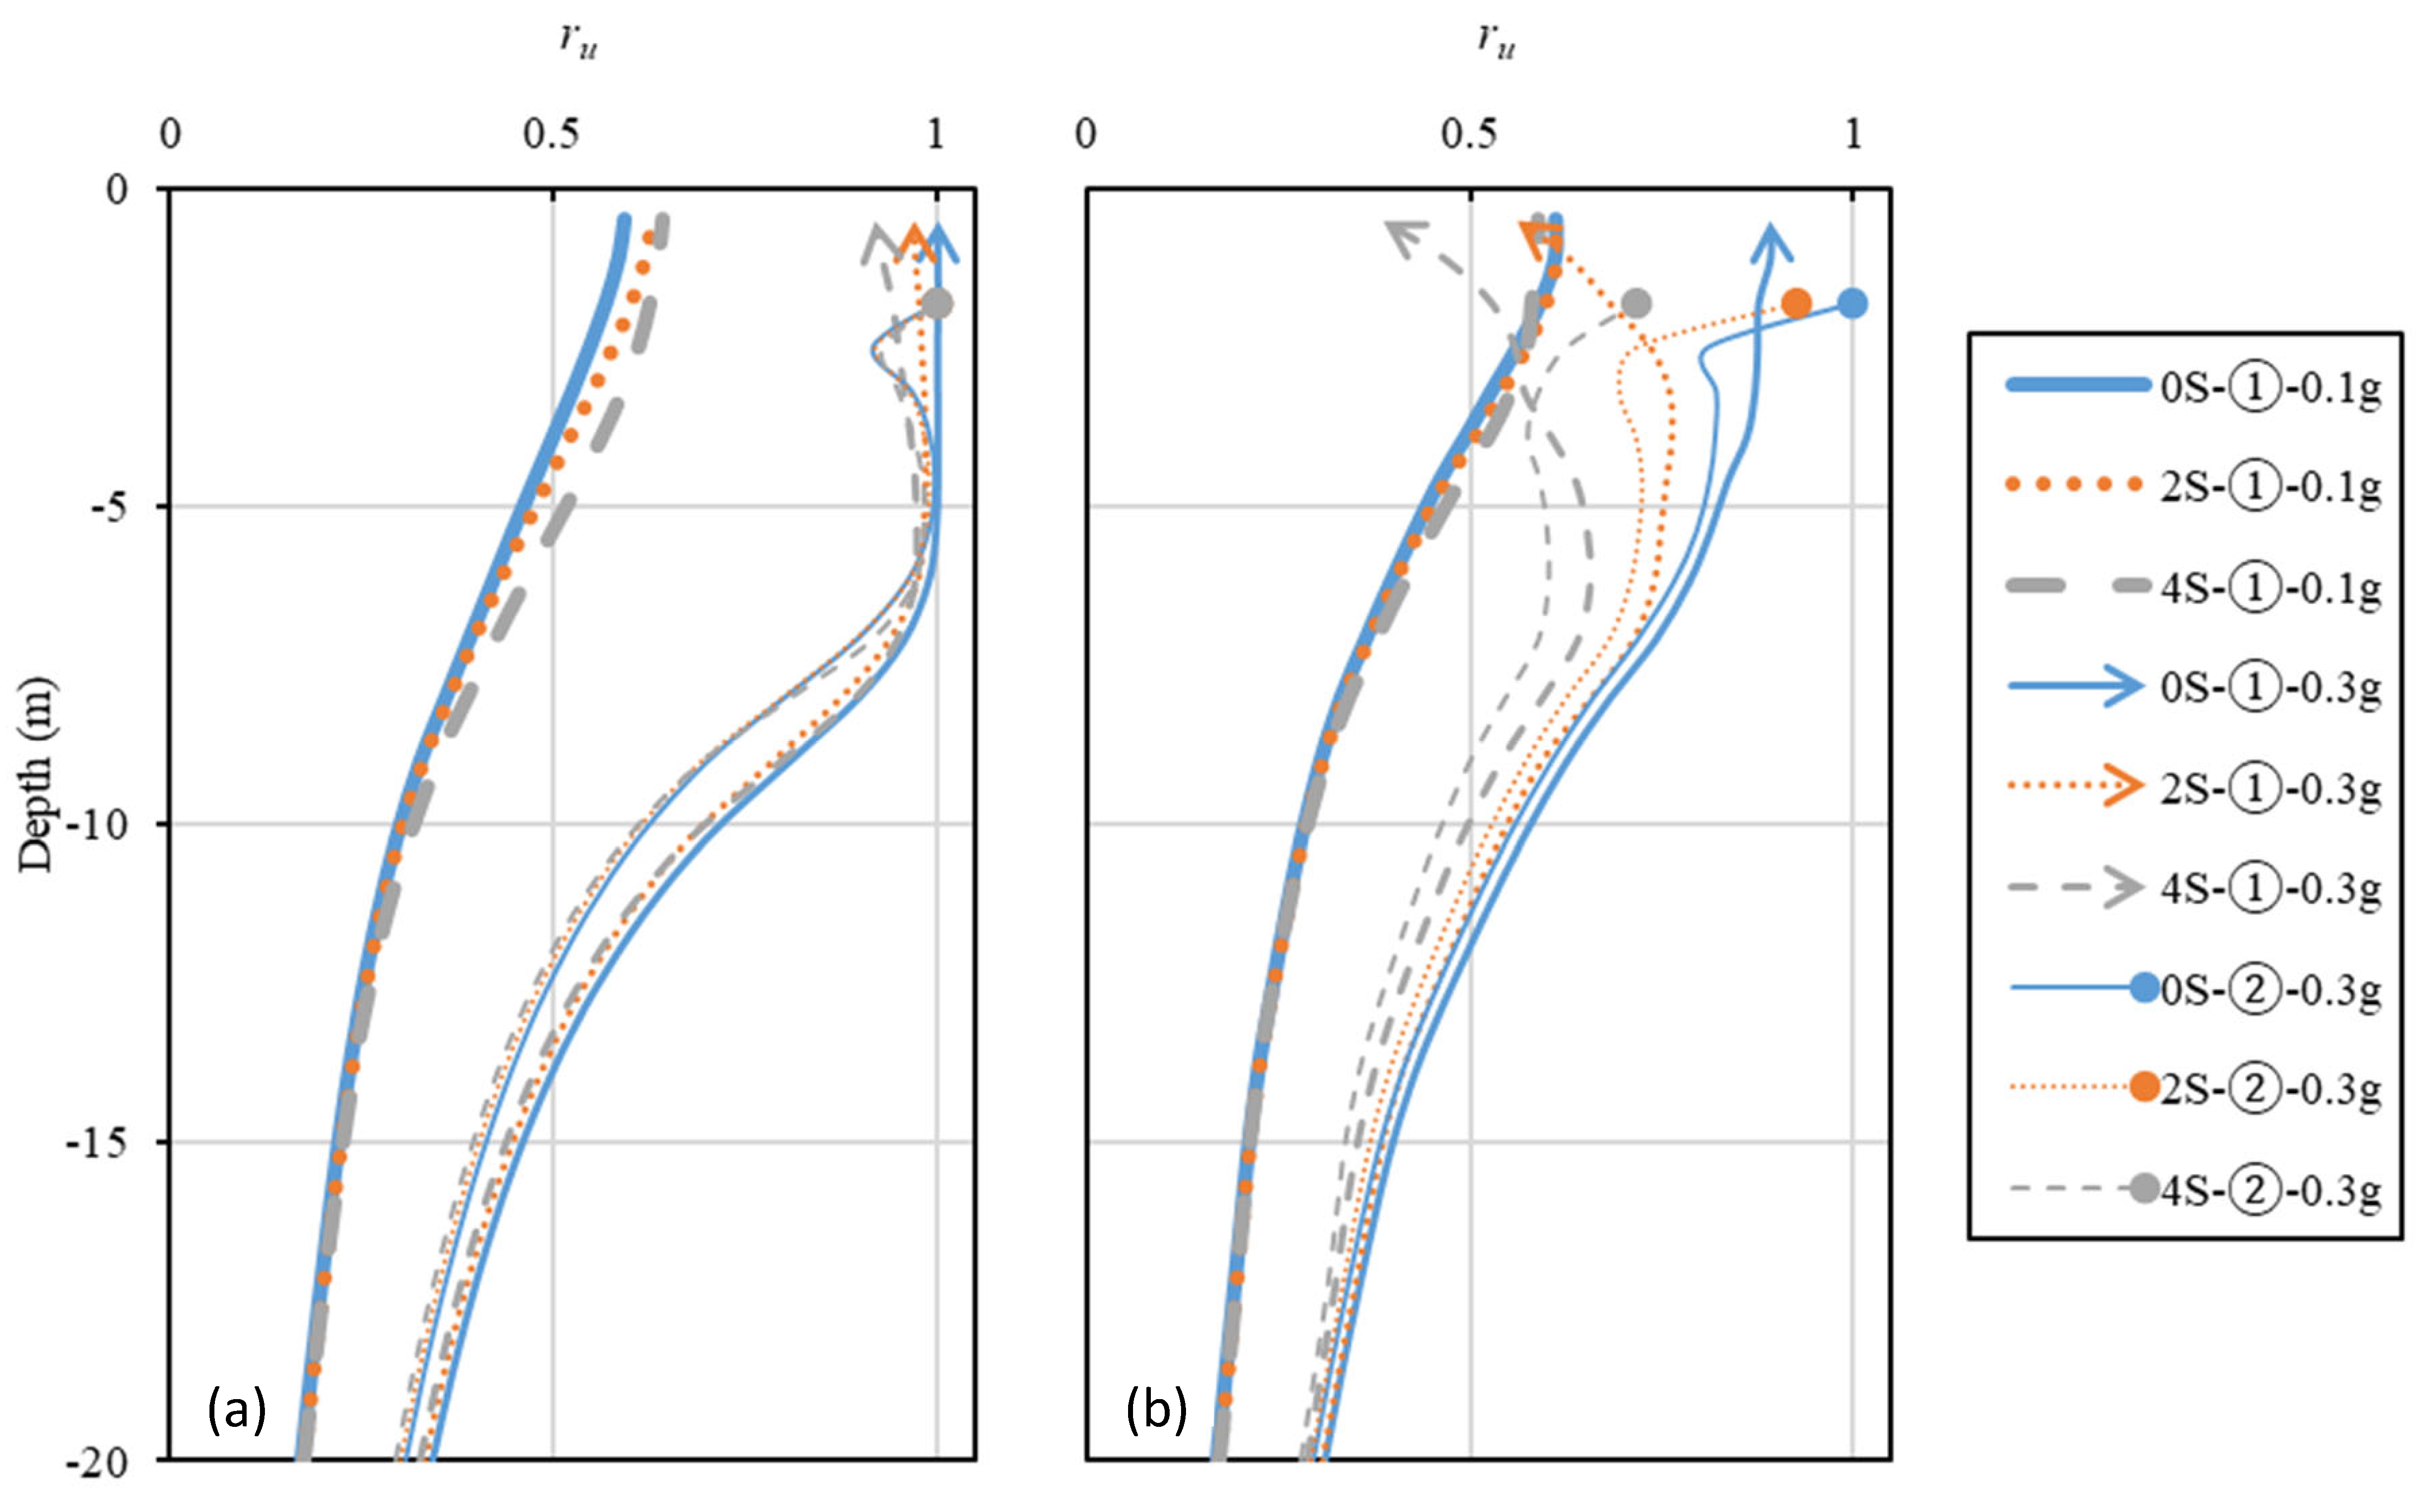
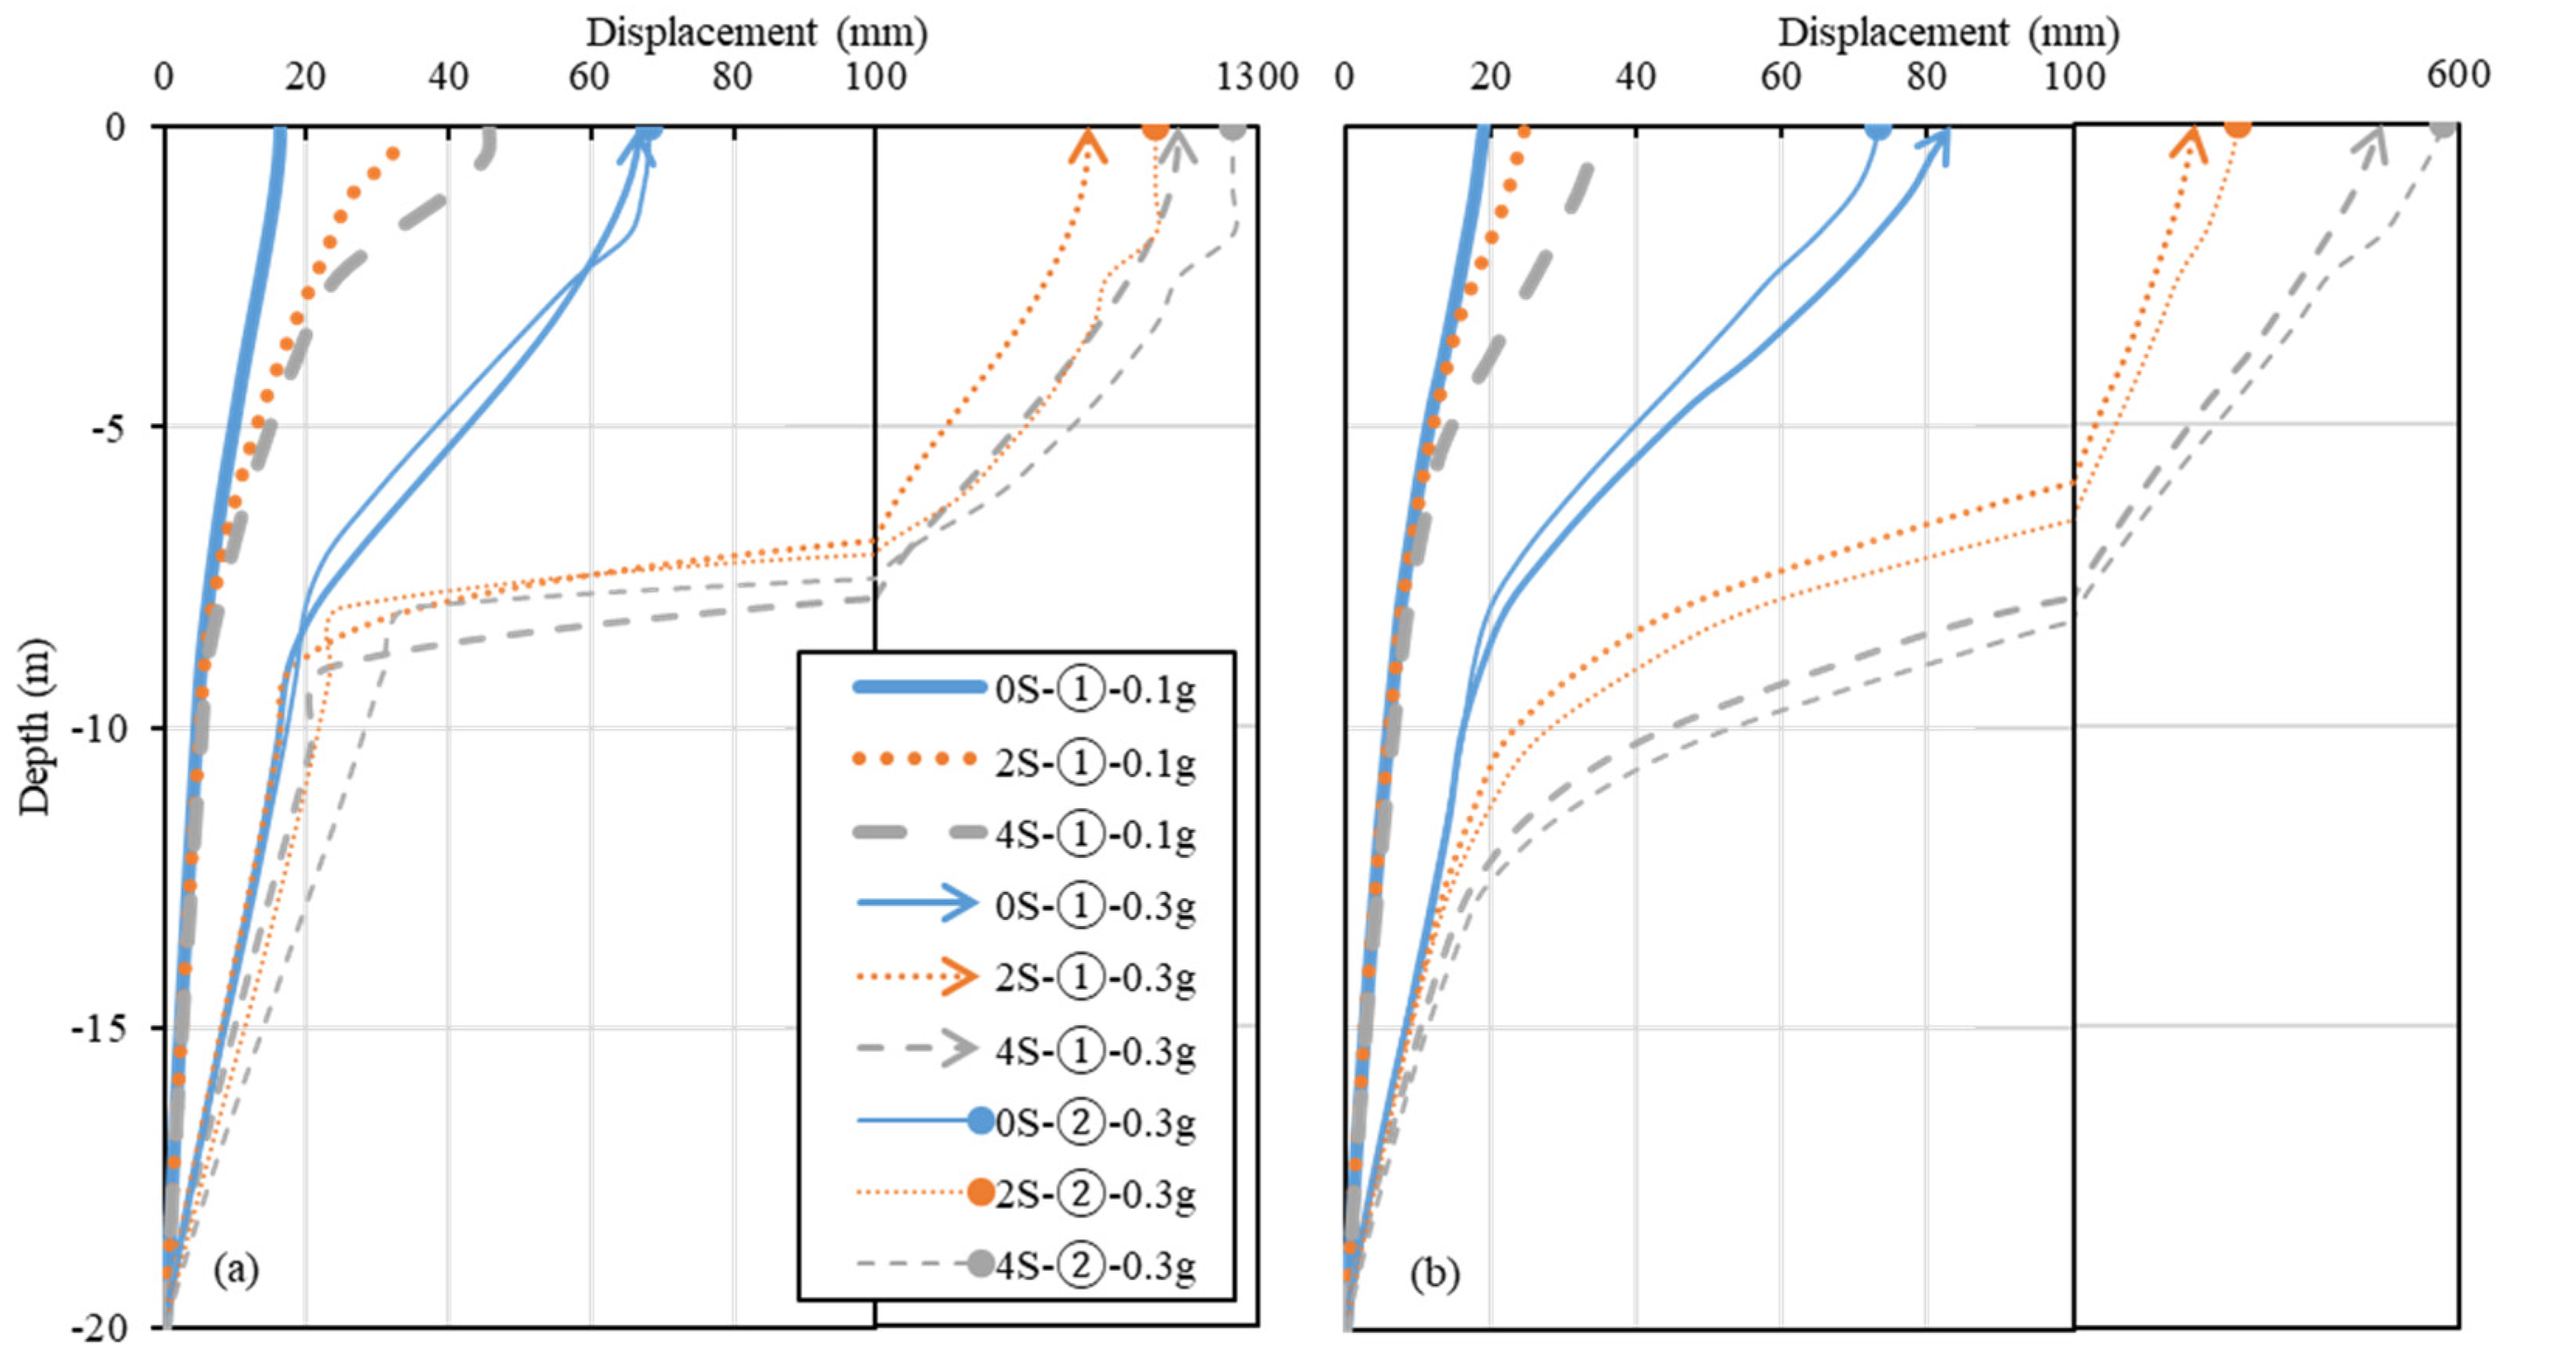
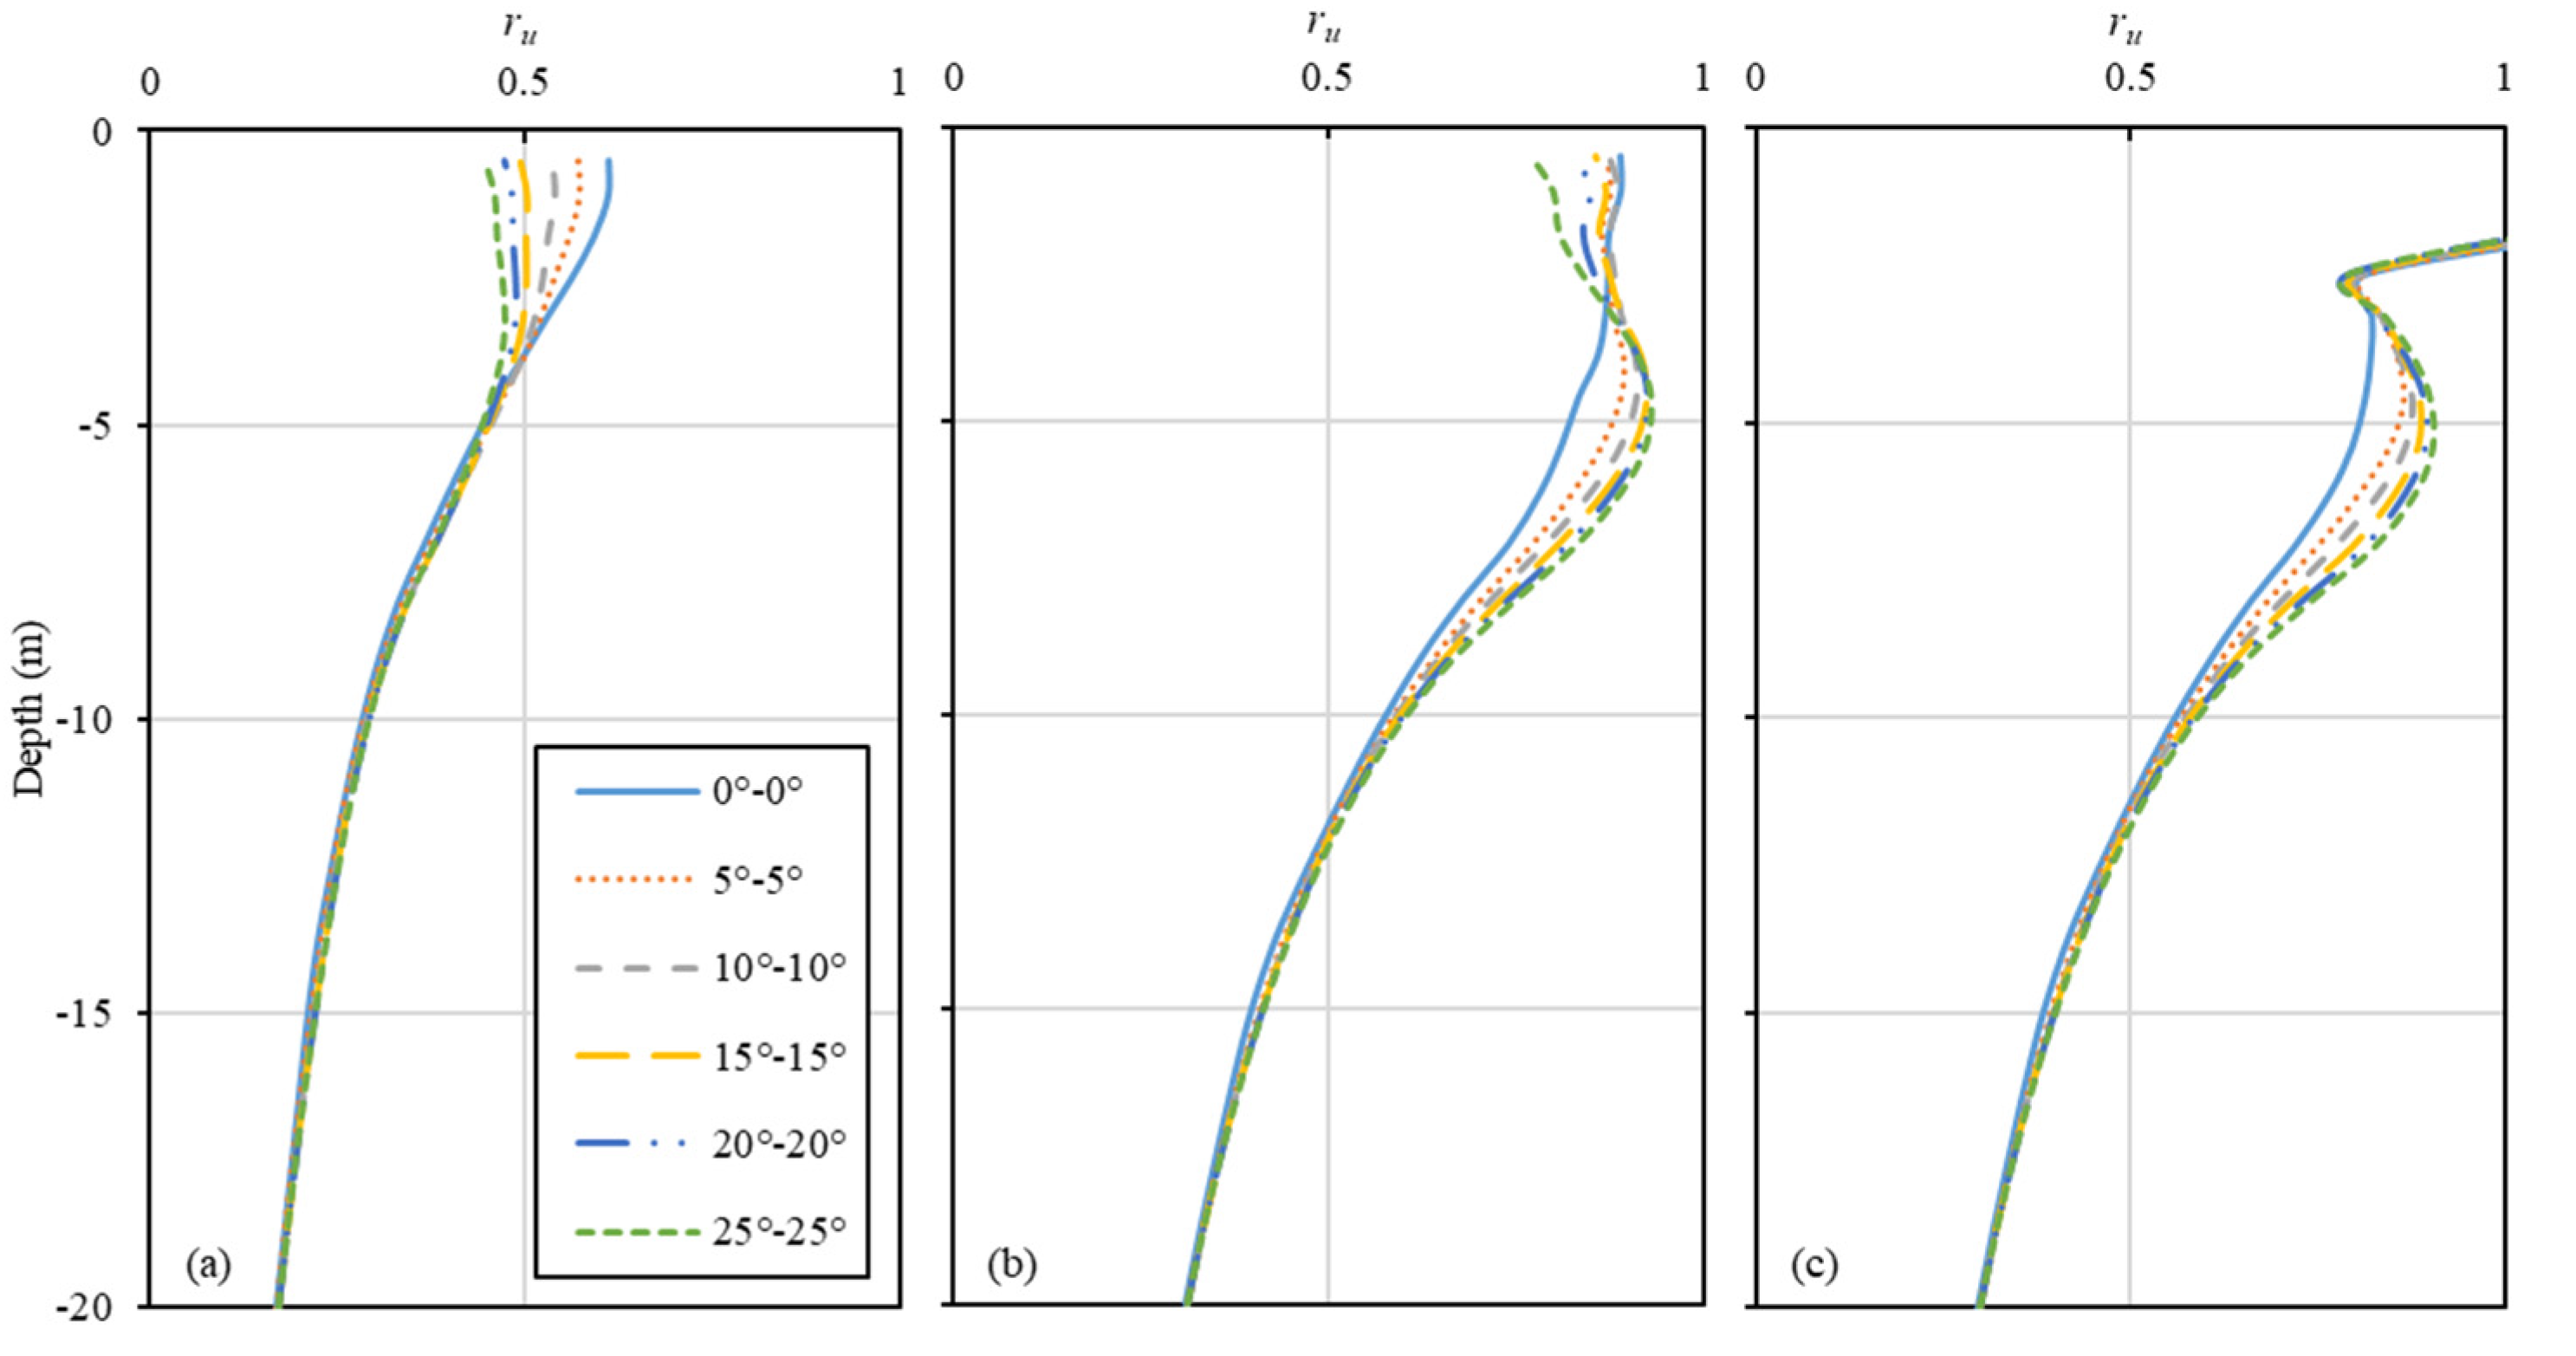
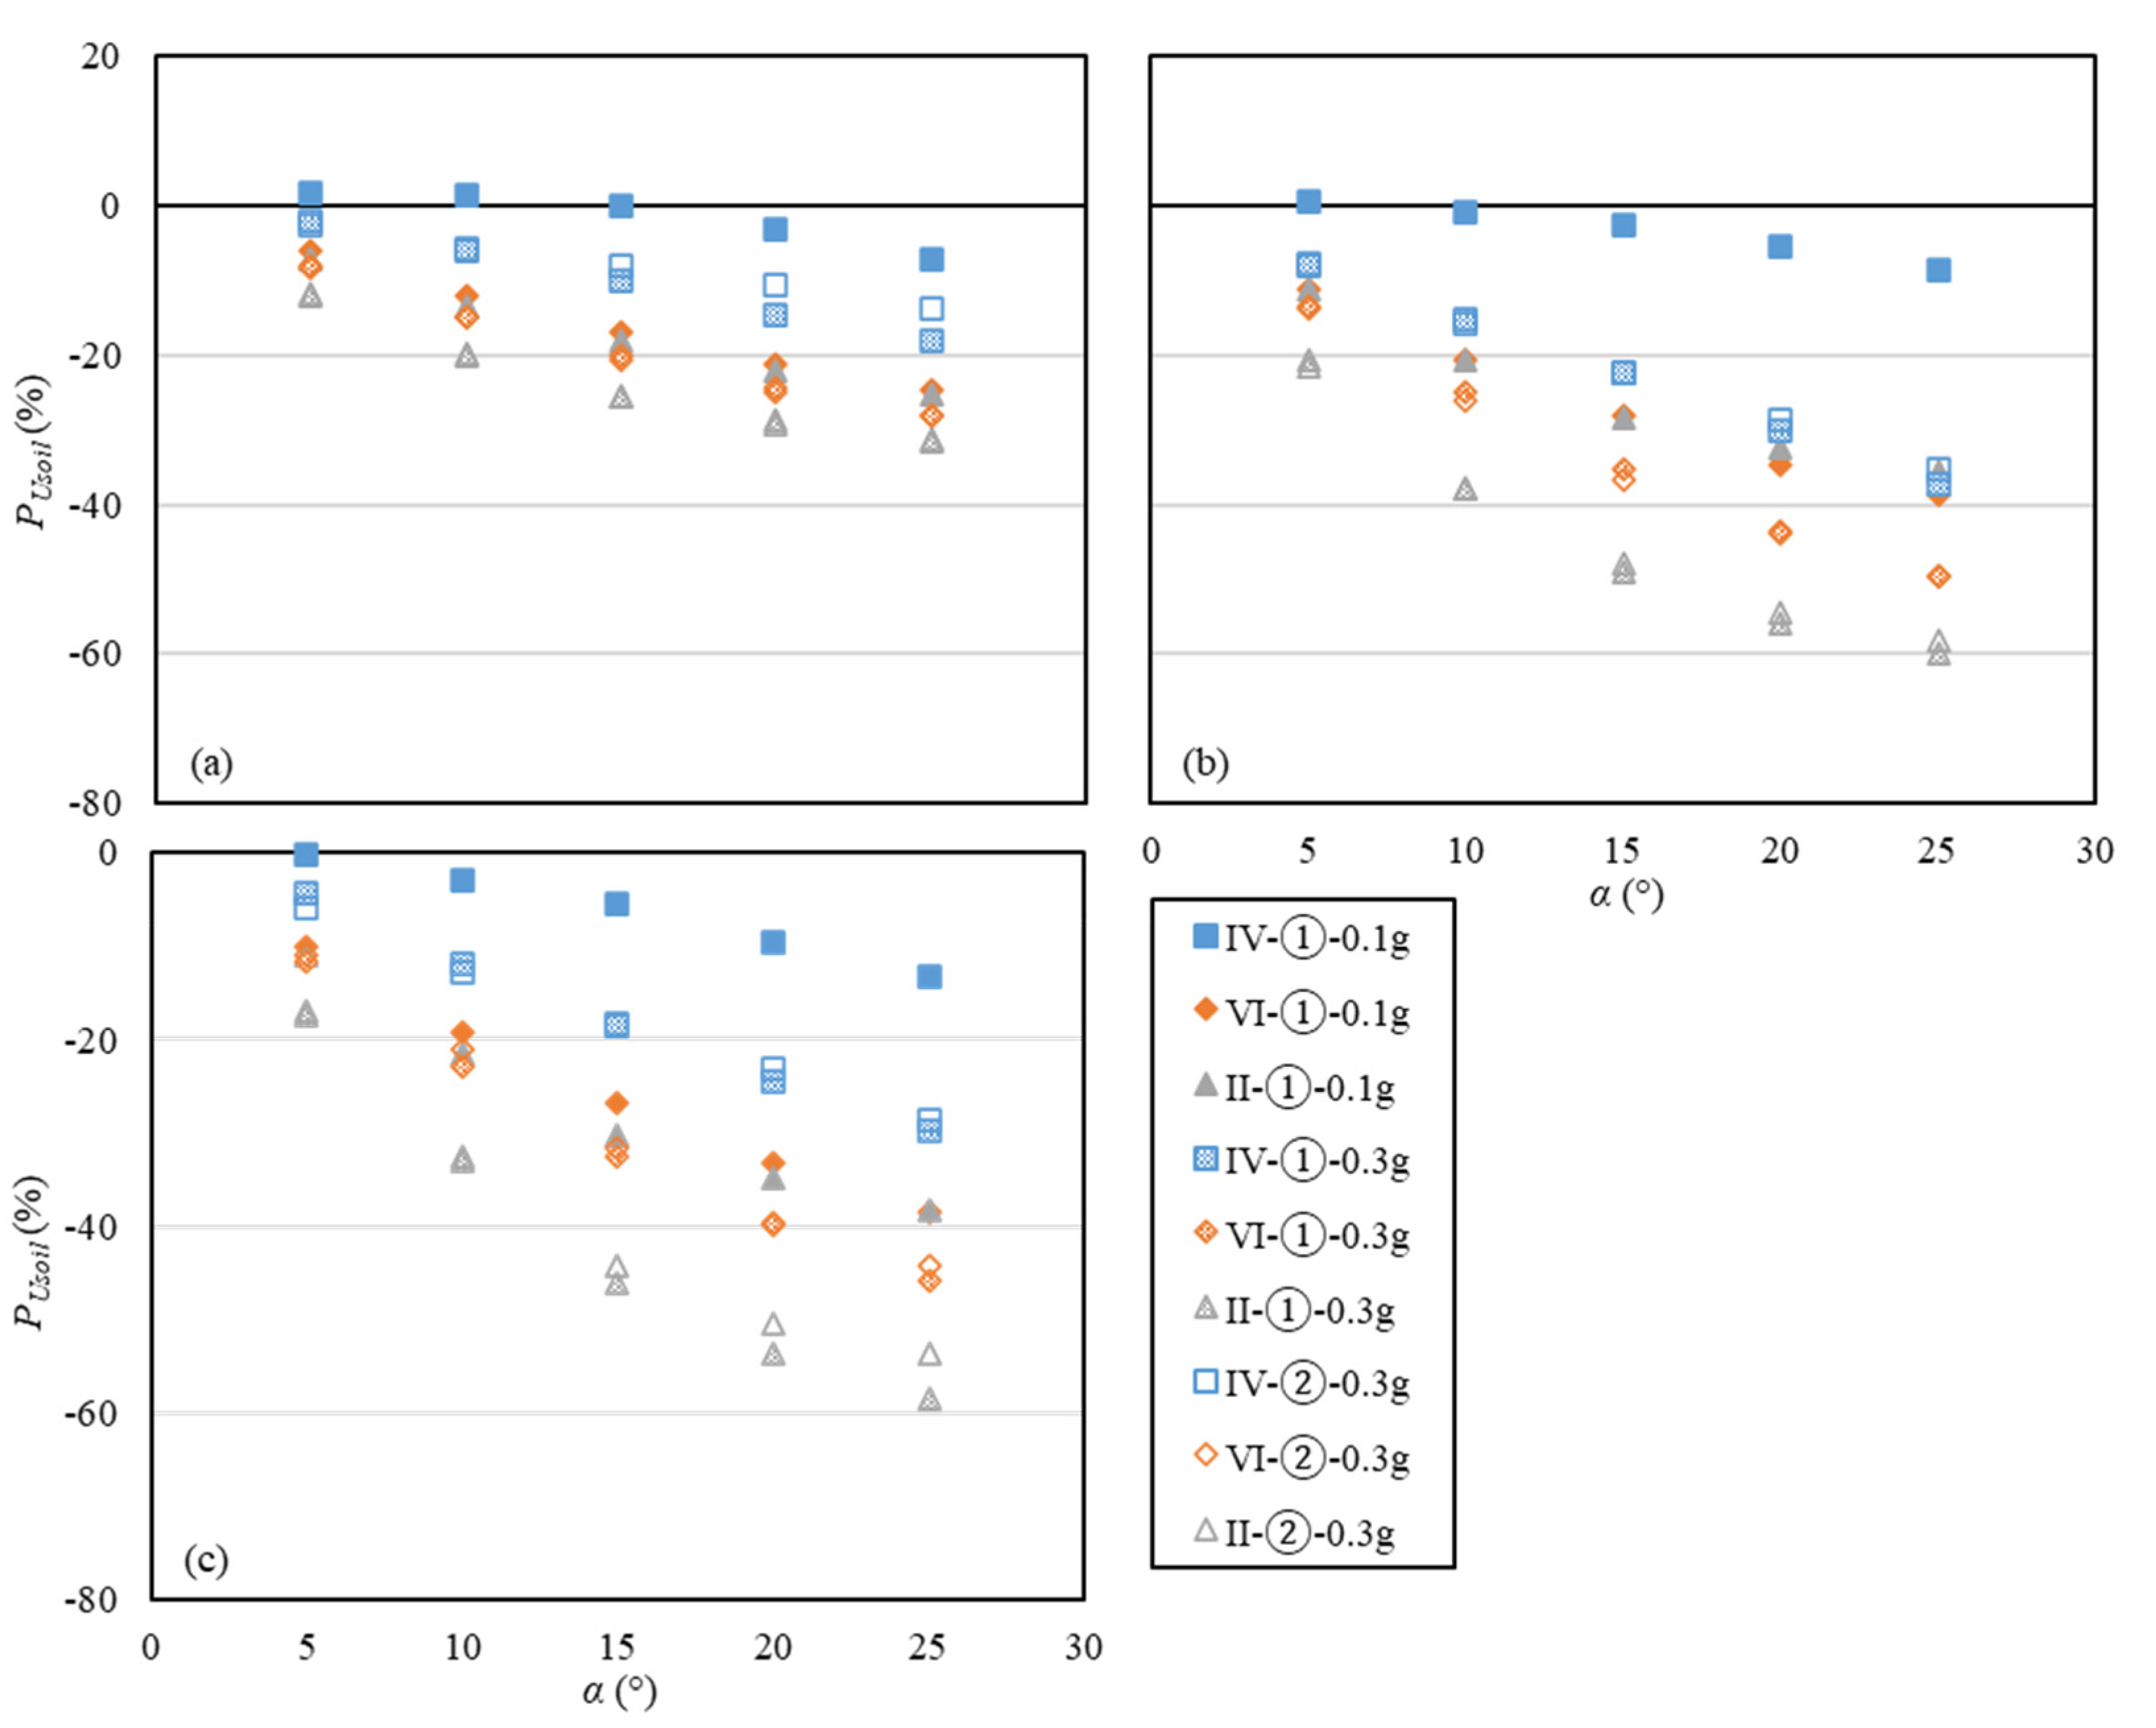
3.1. Soil Response
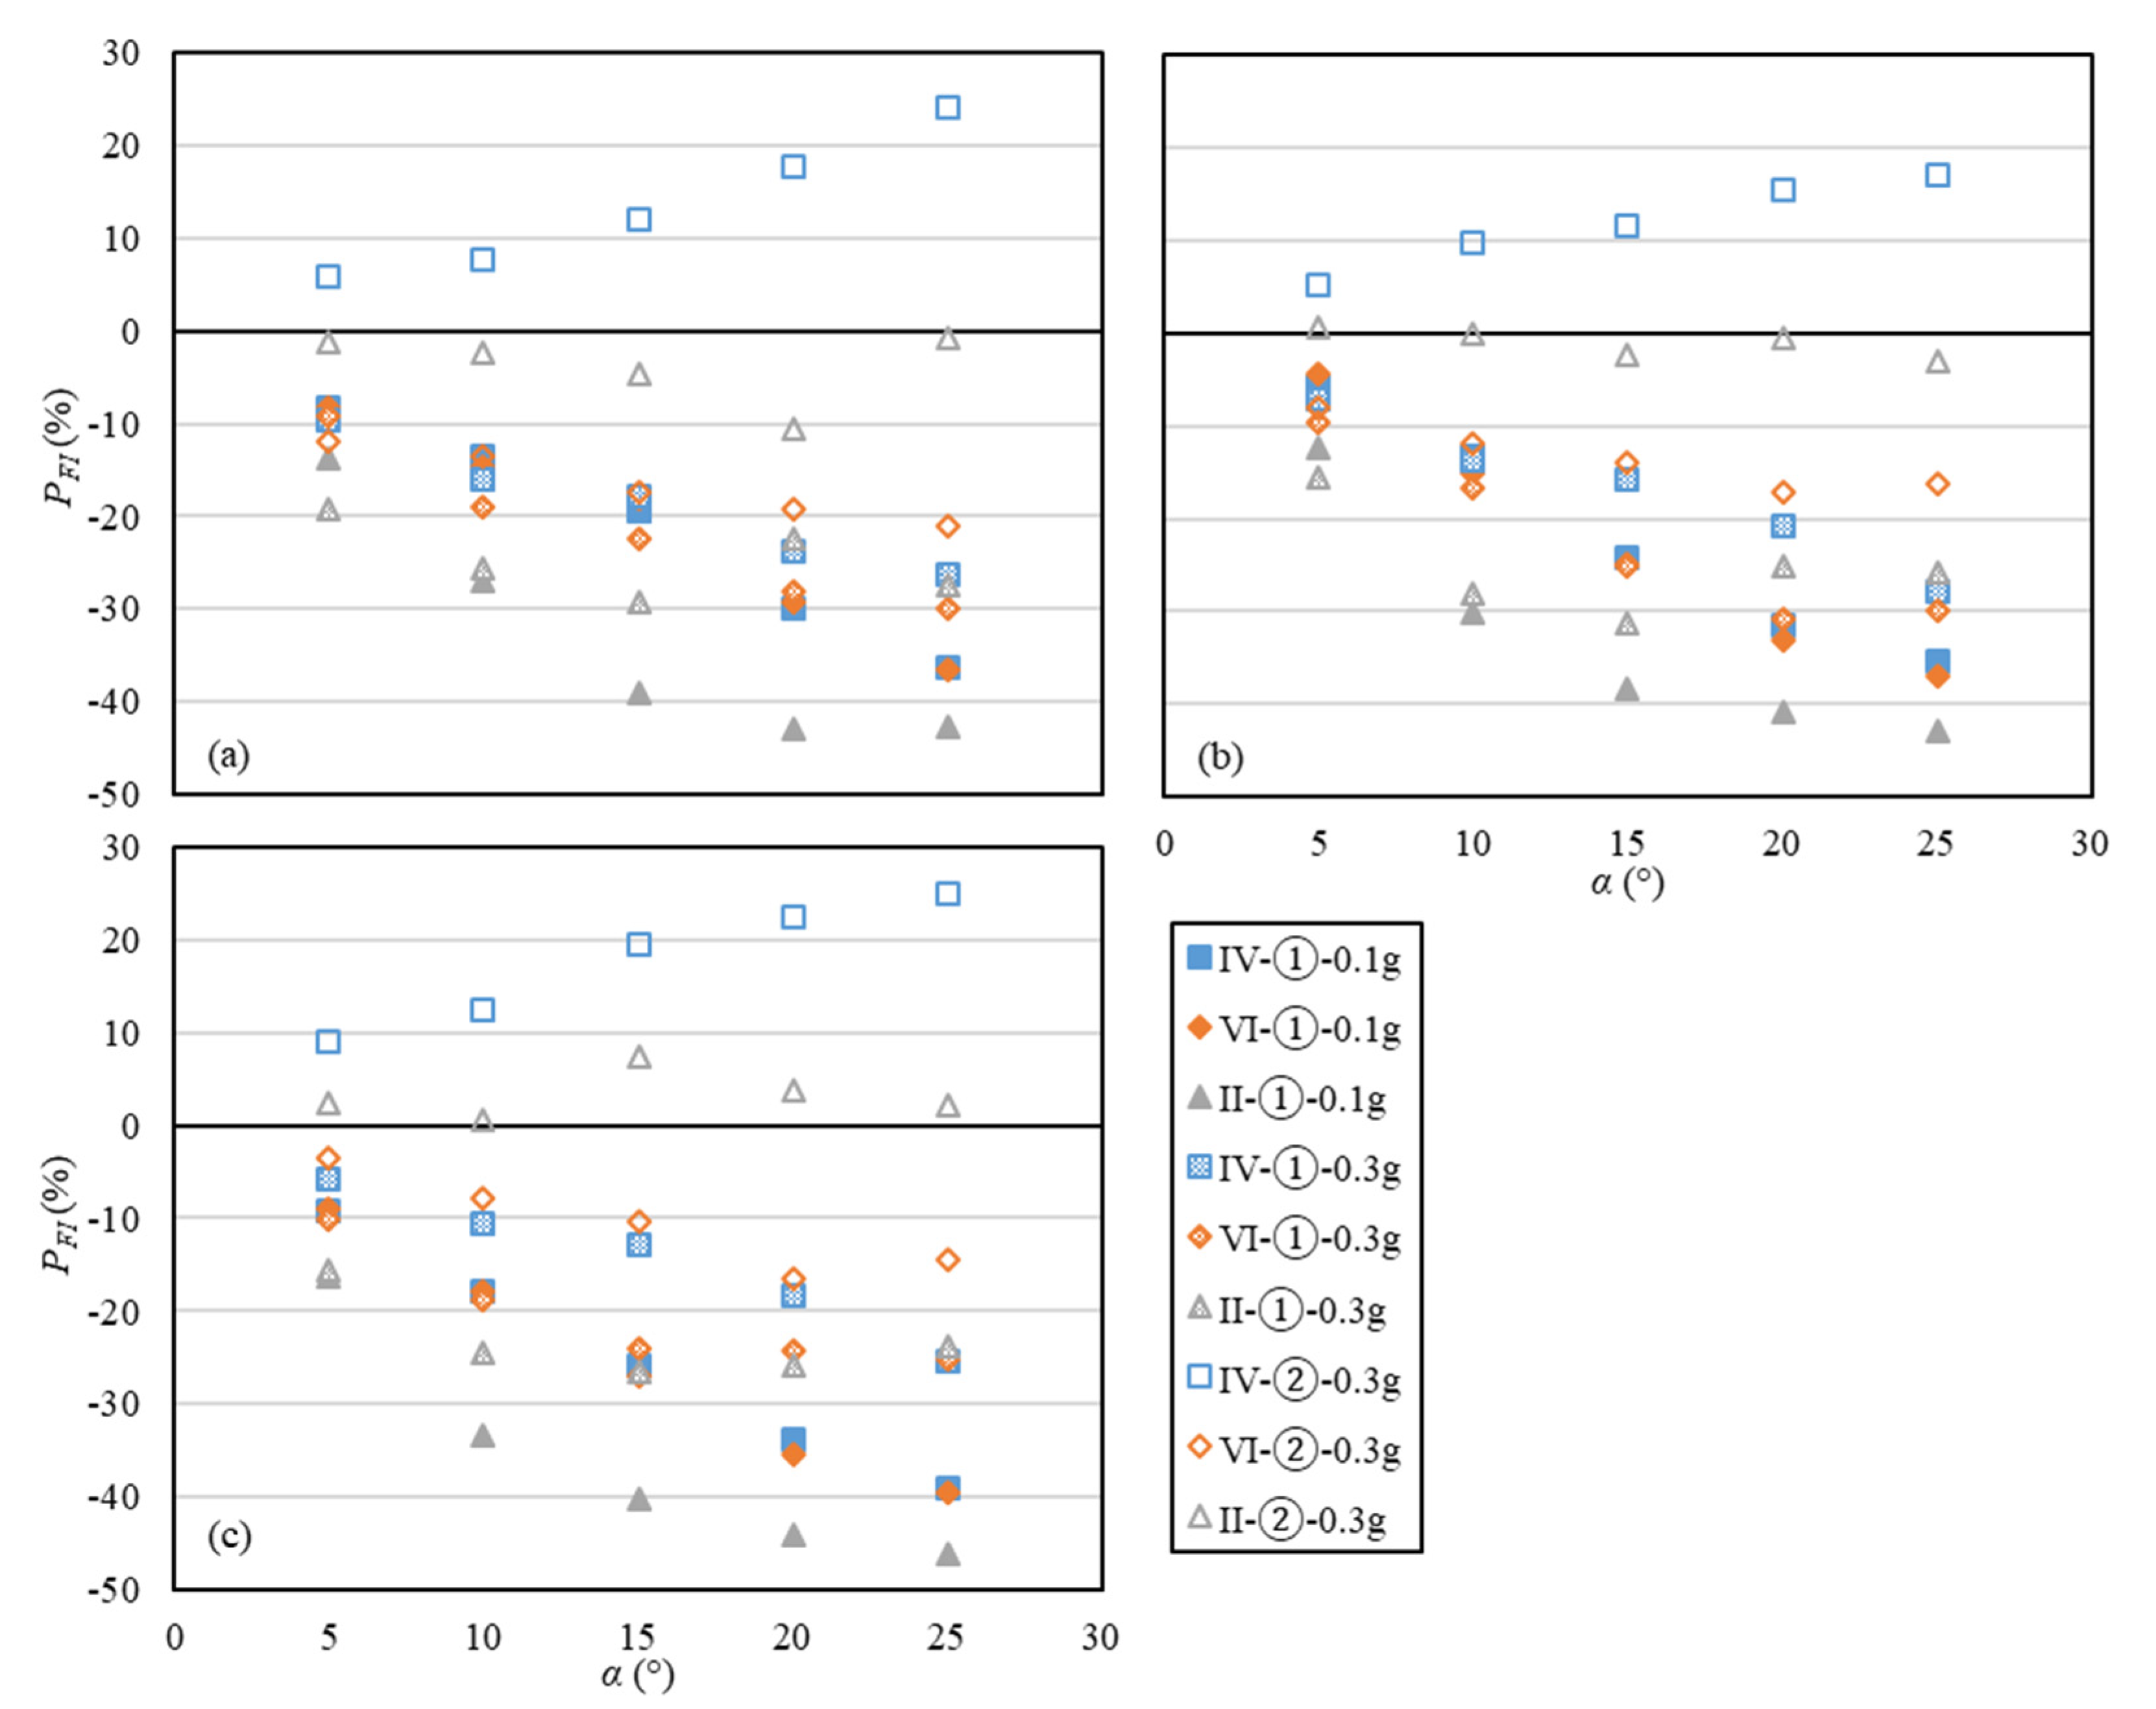
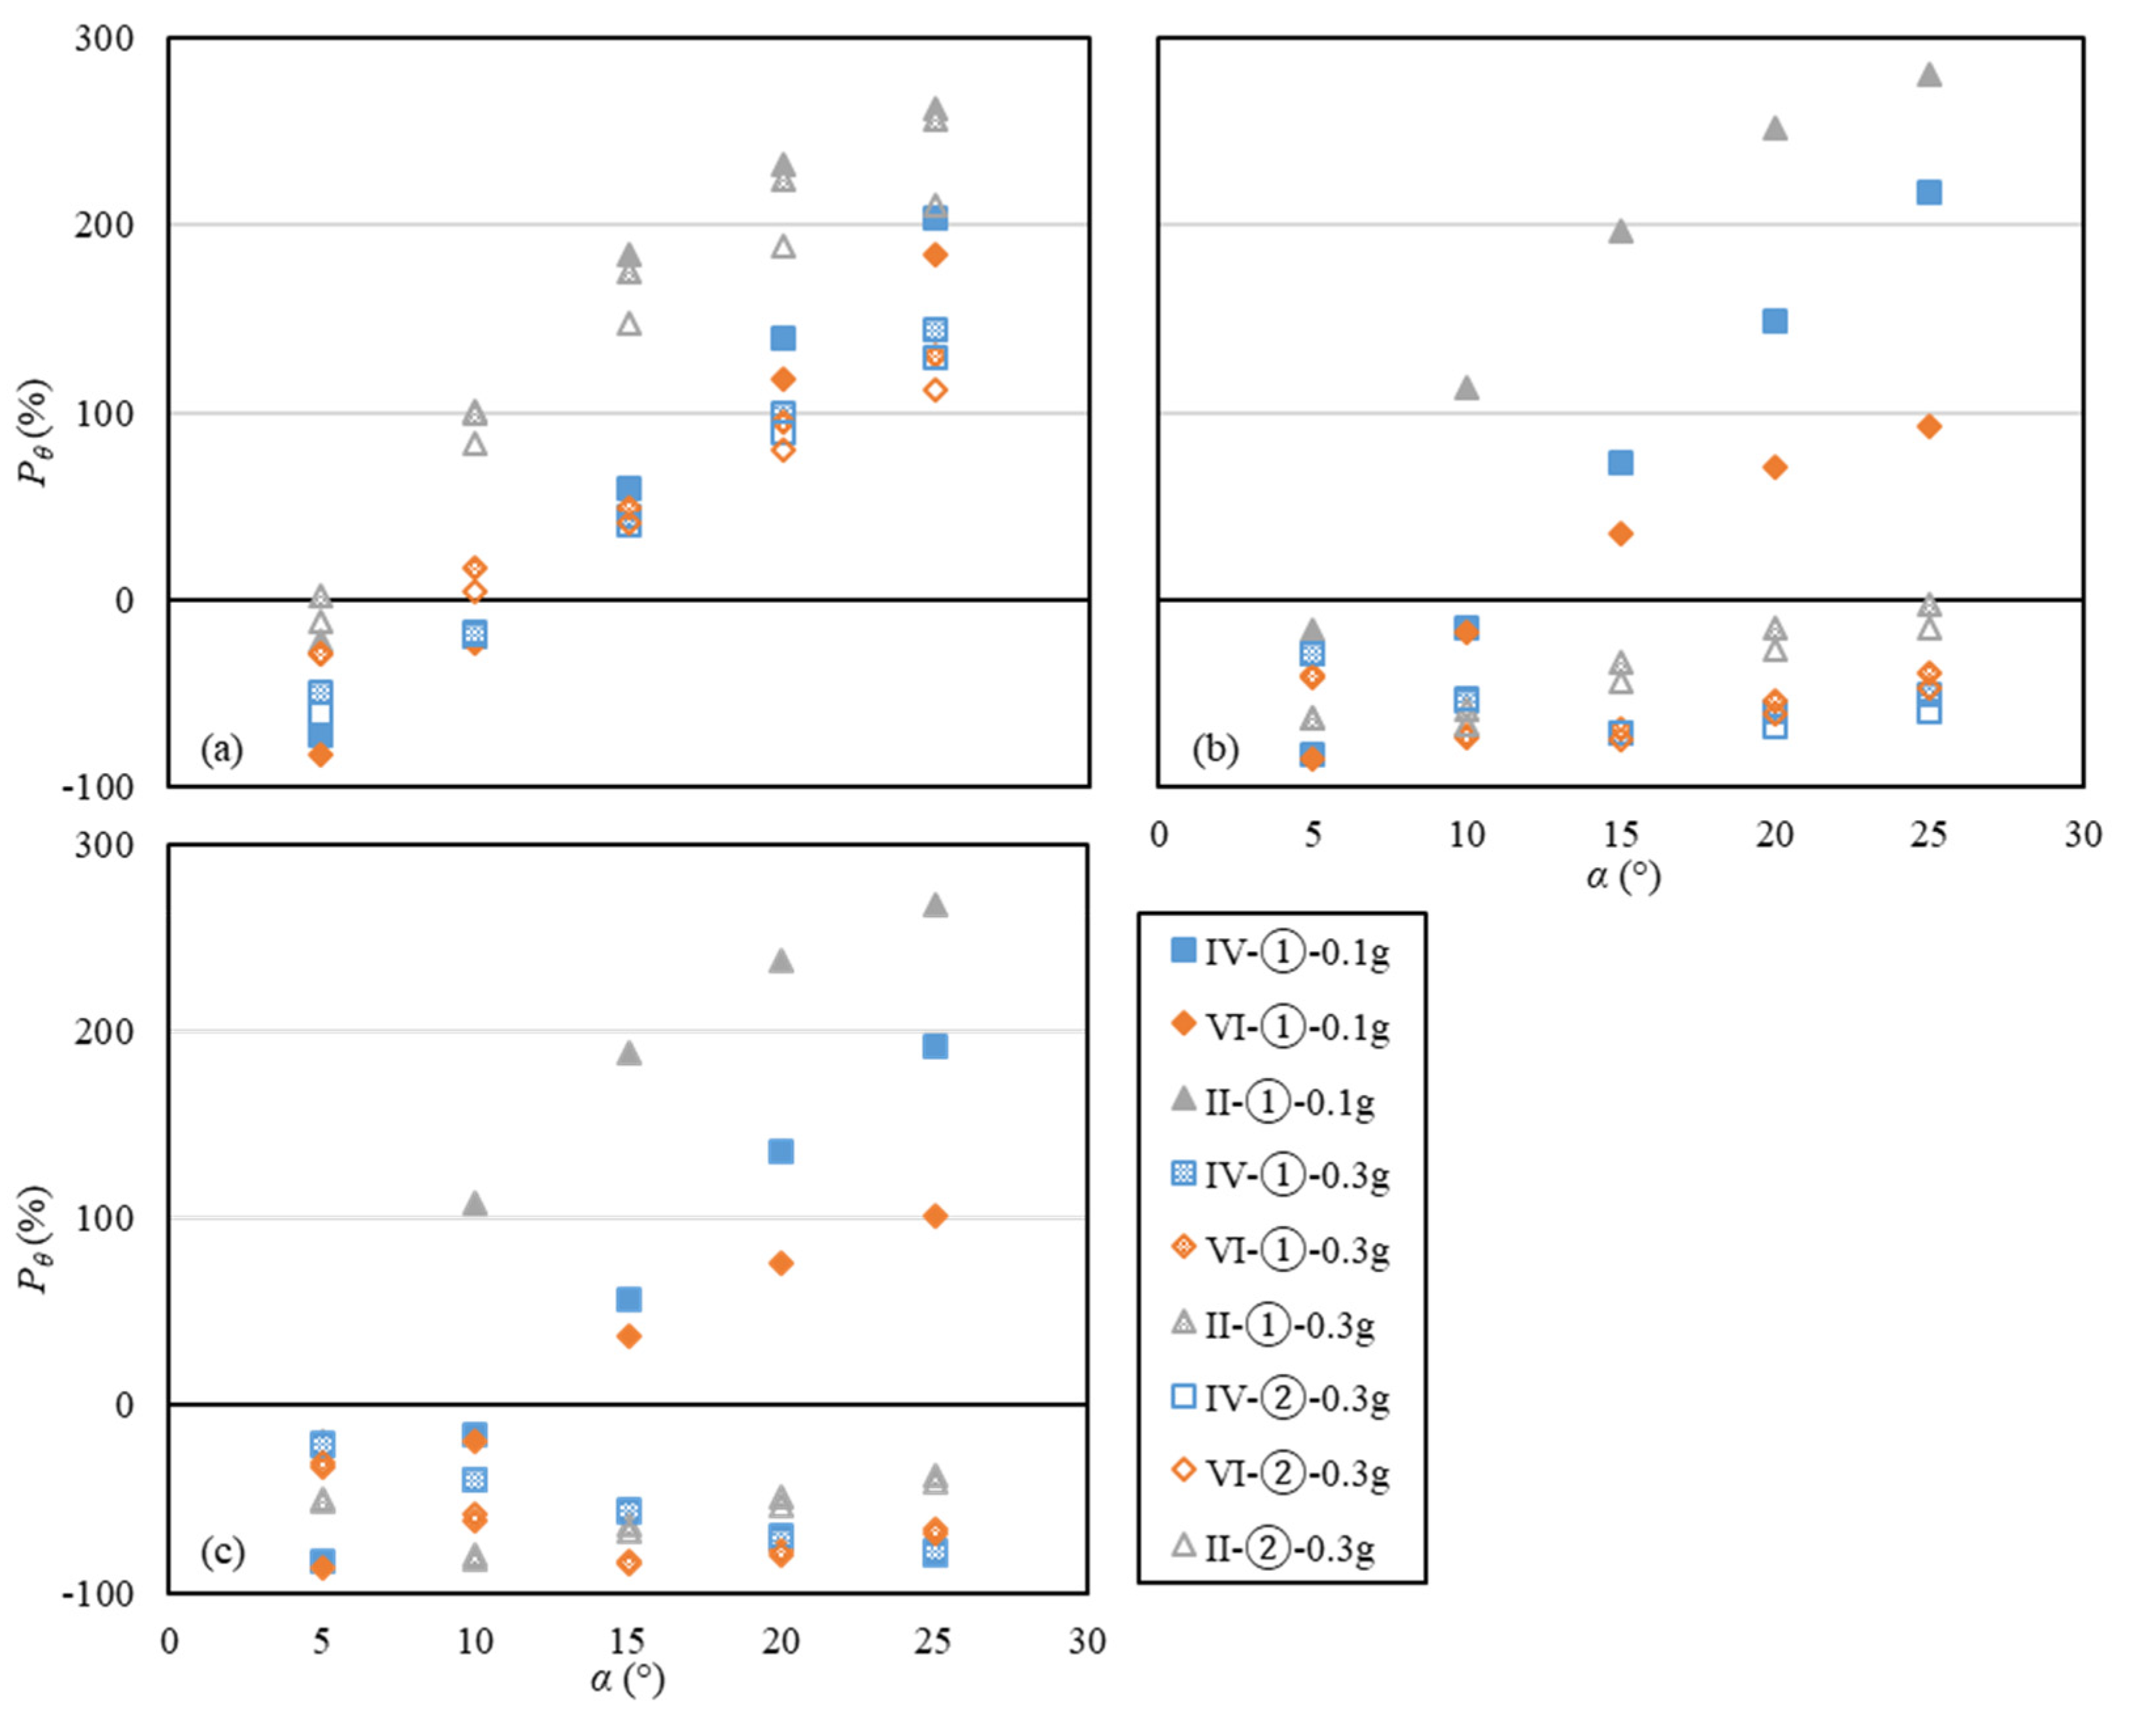
3.2. Cap Response
3.3. Pile Response
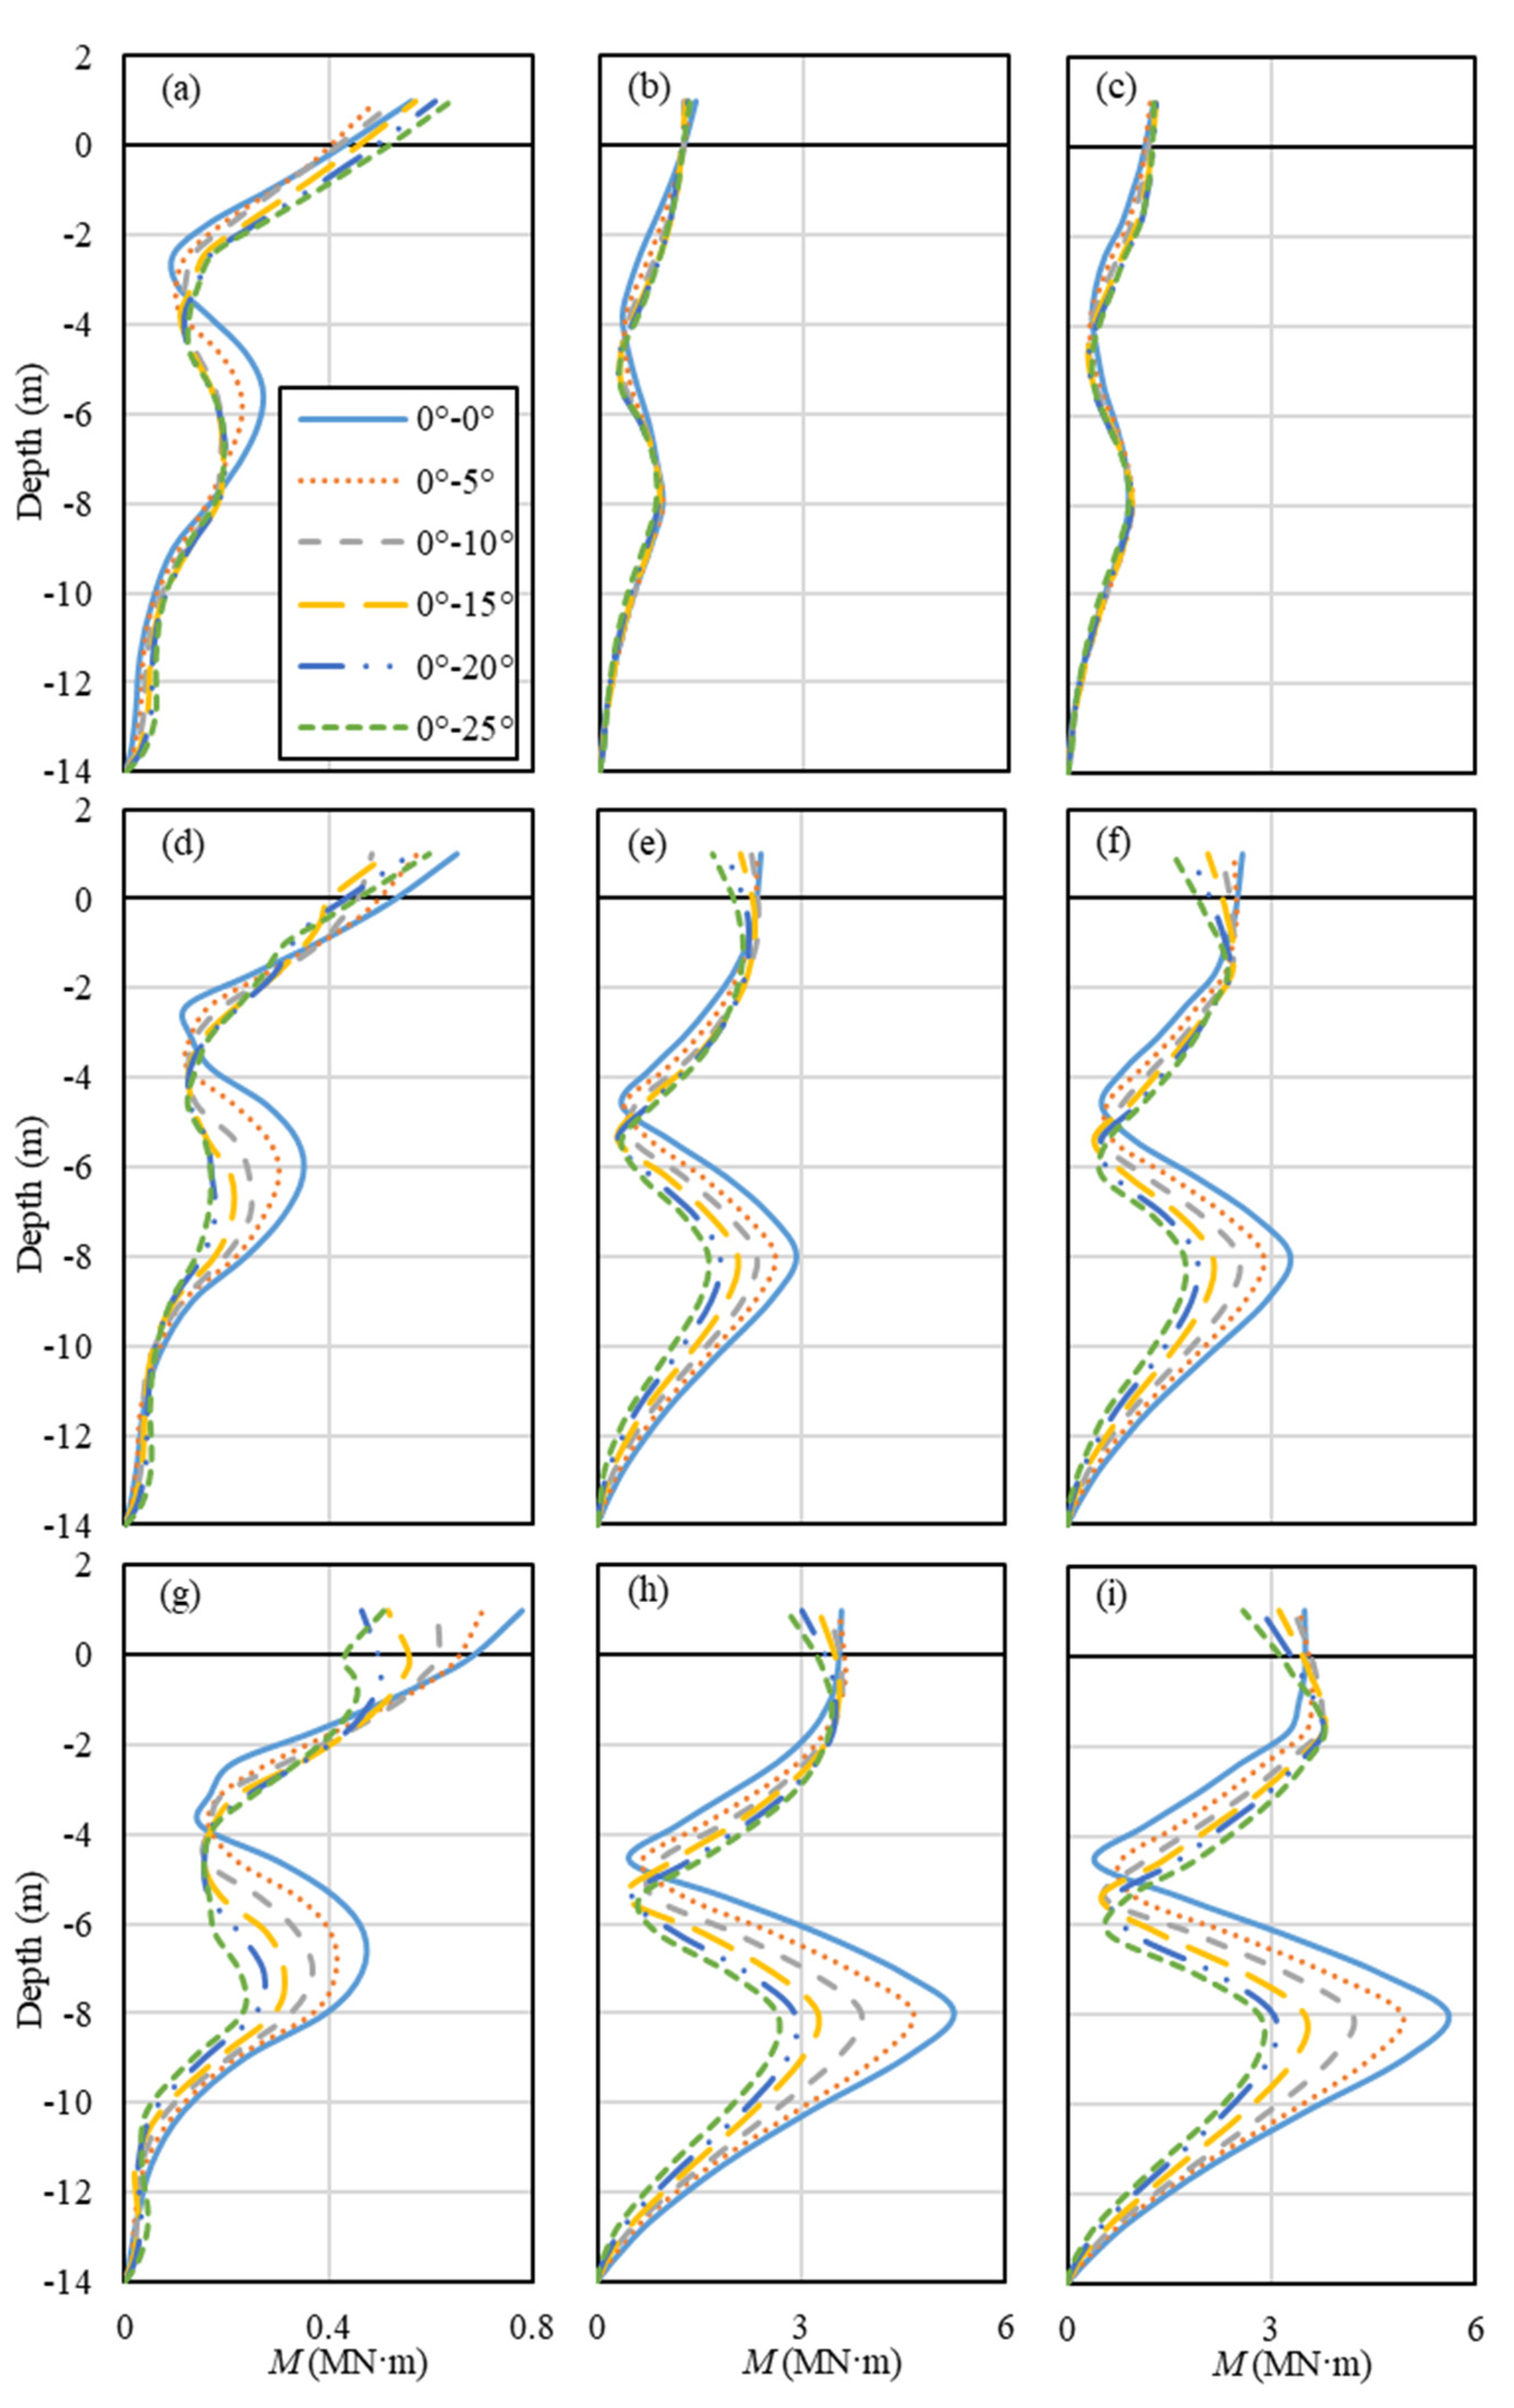
3.3.1. Maximum Bending Moment
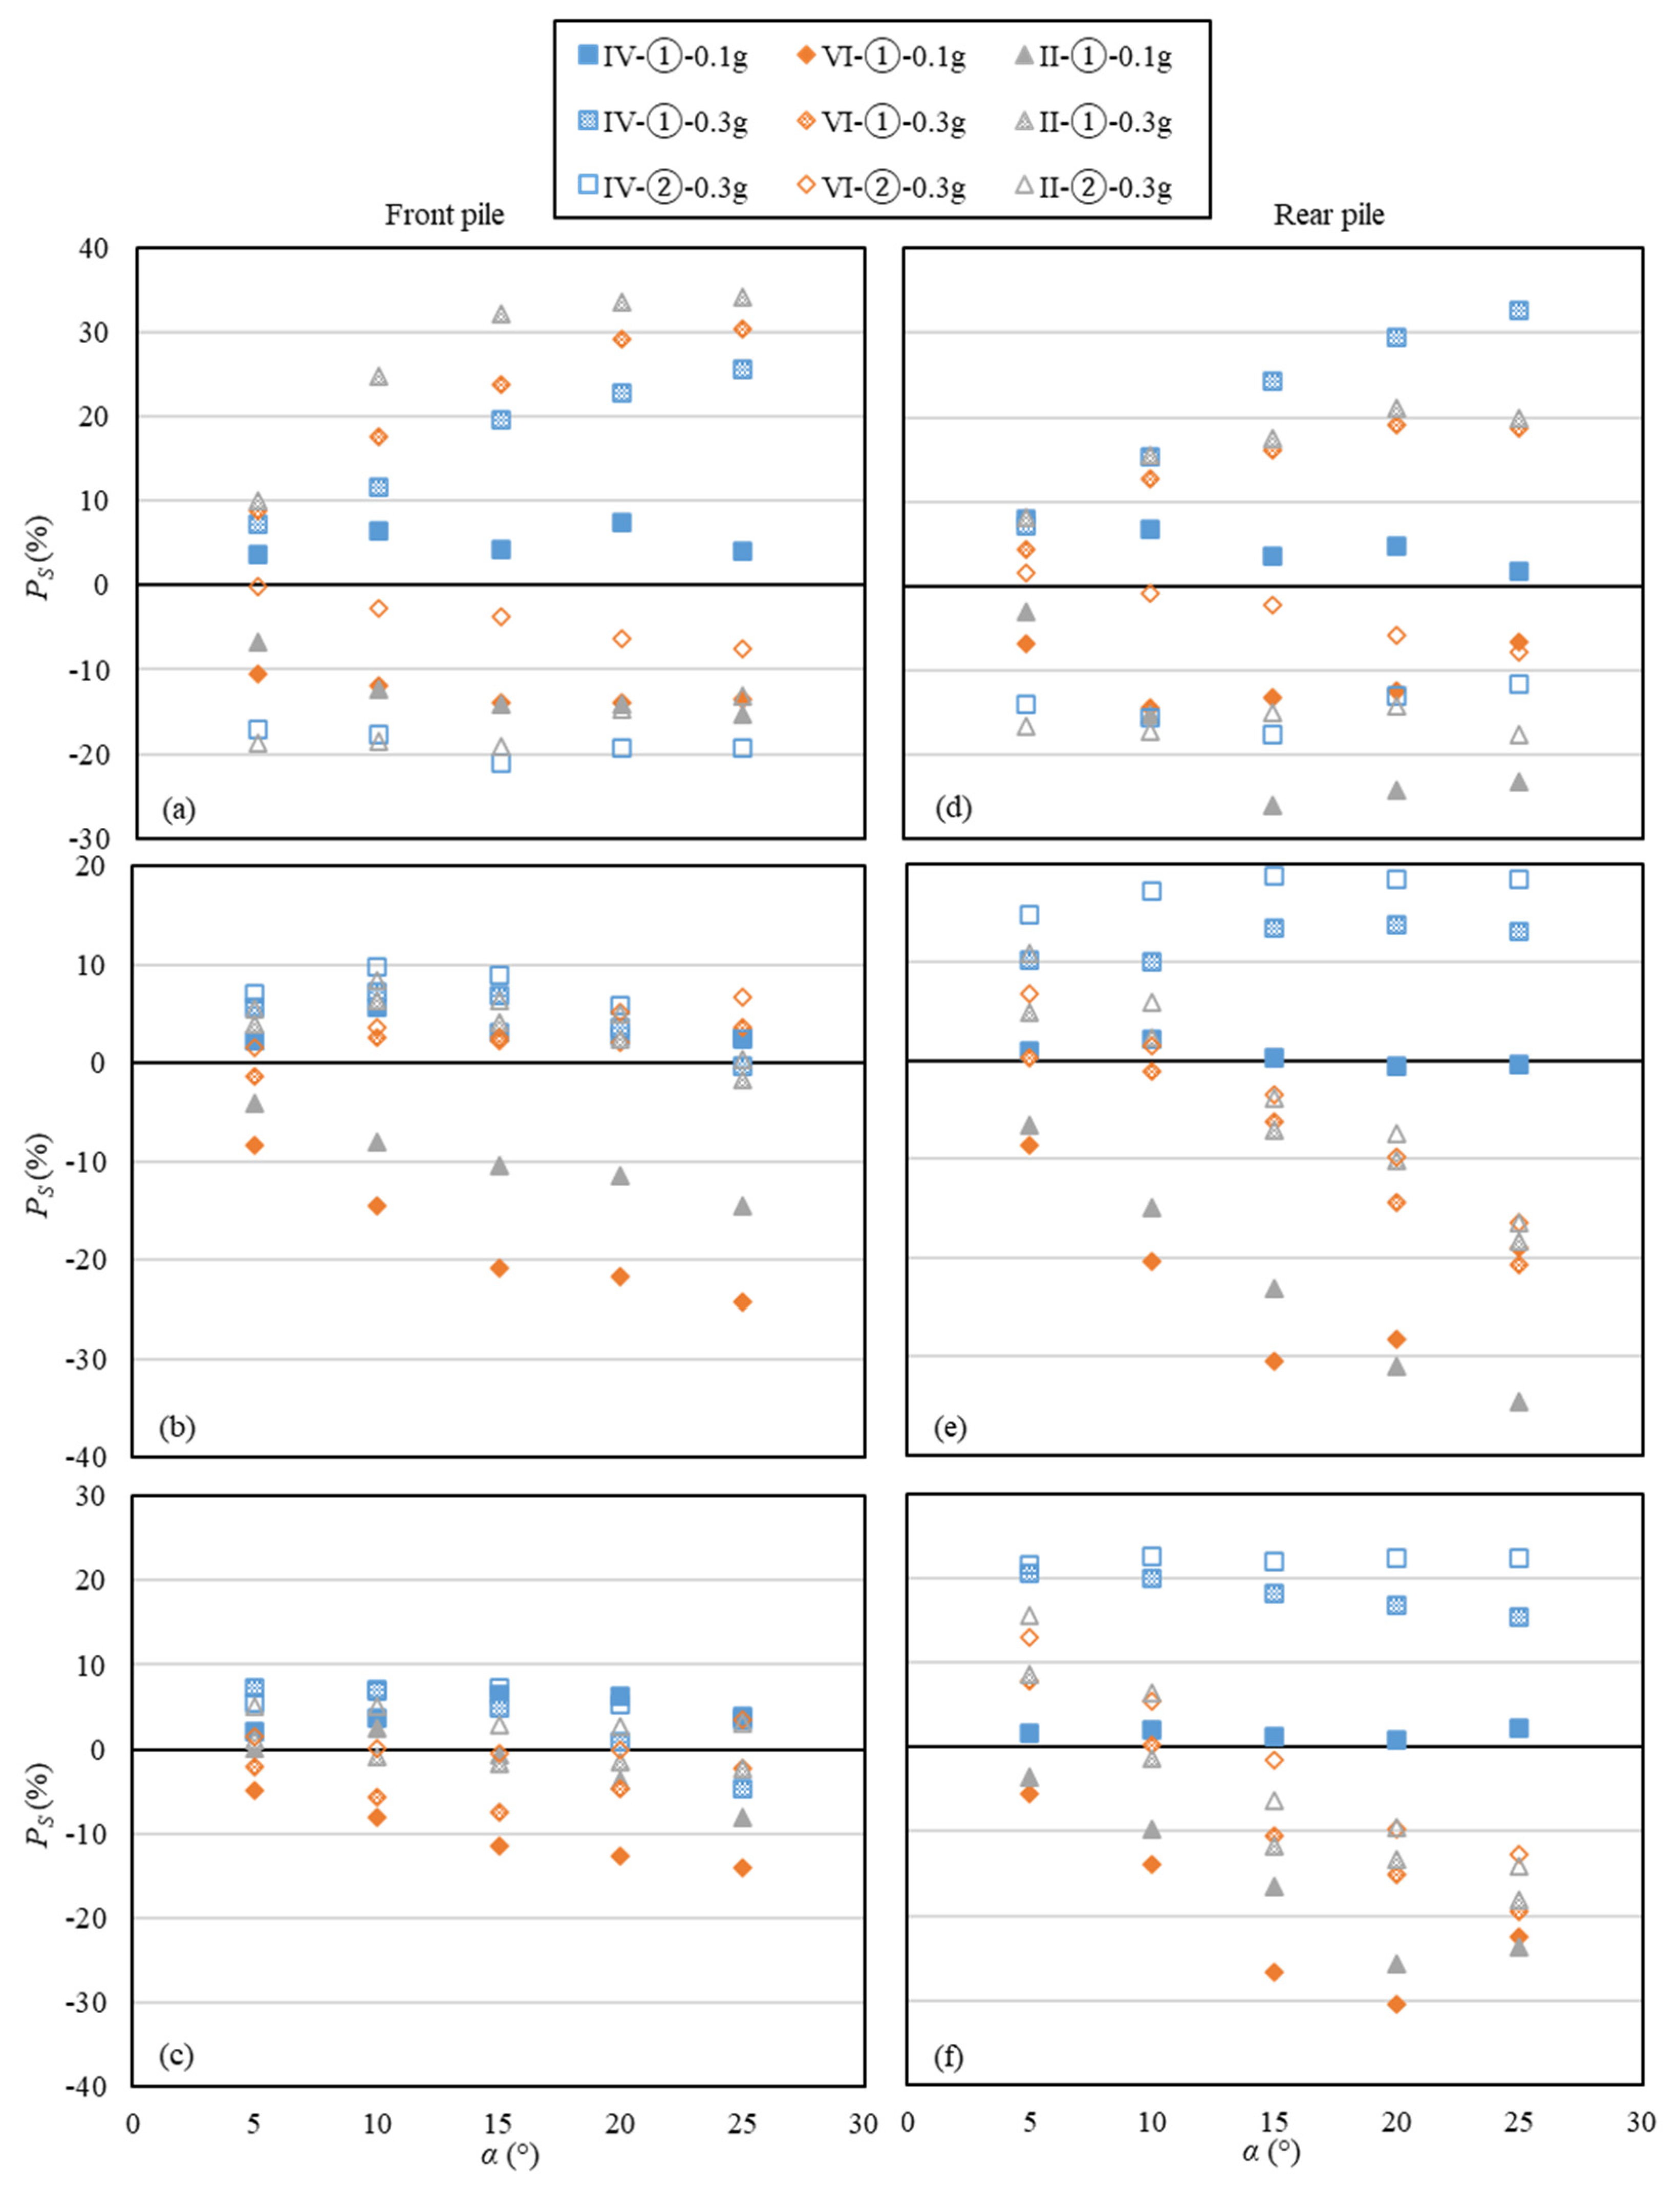
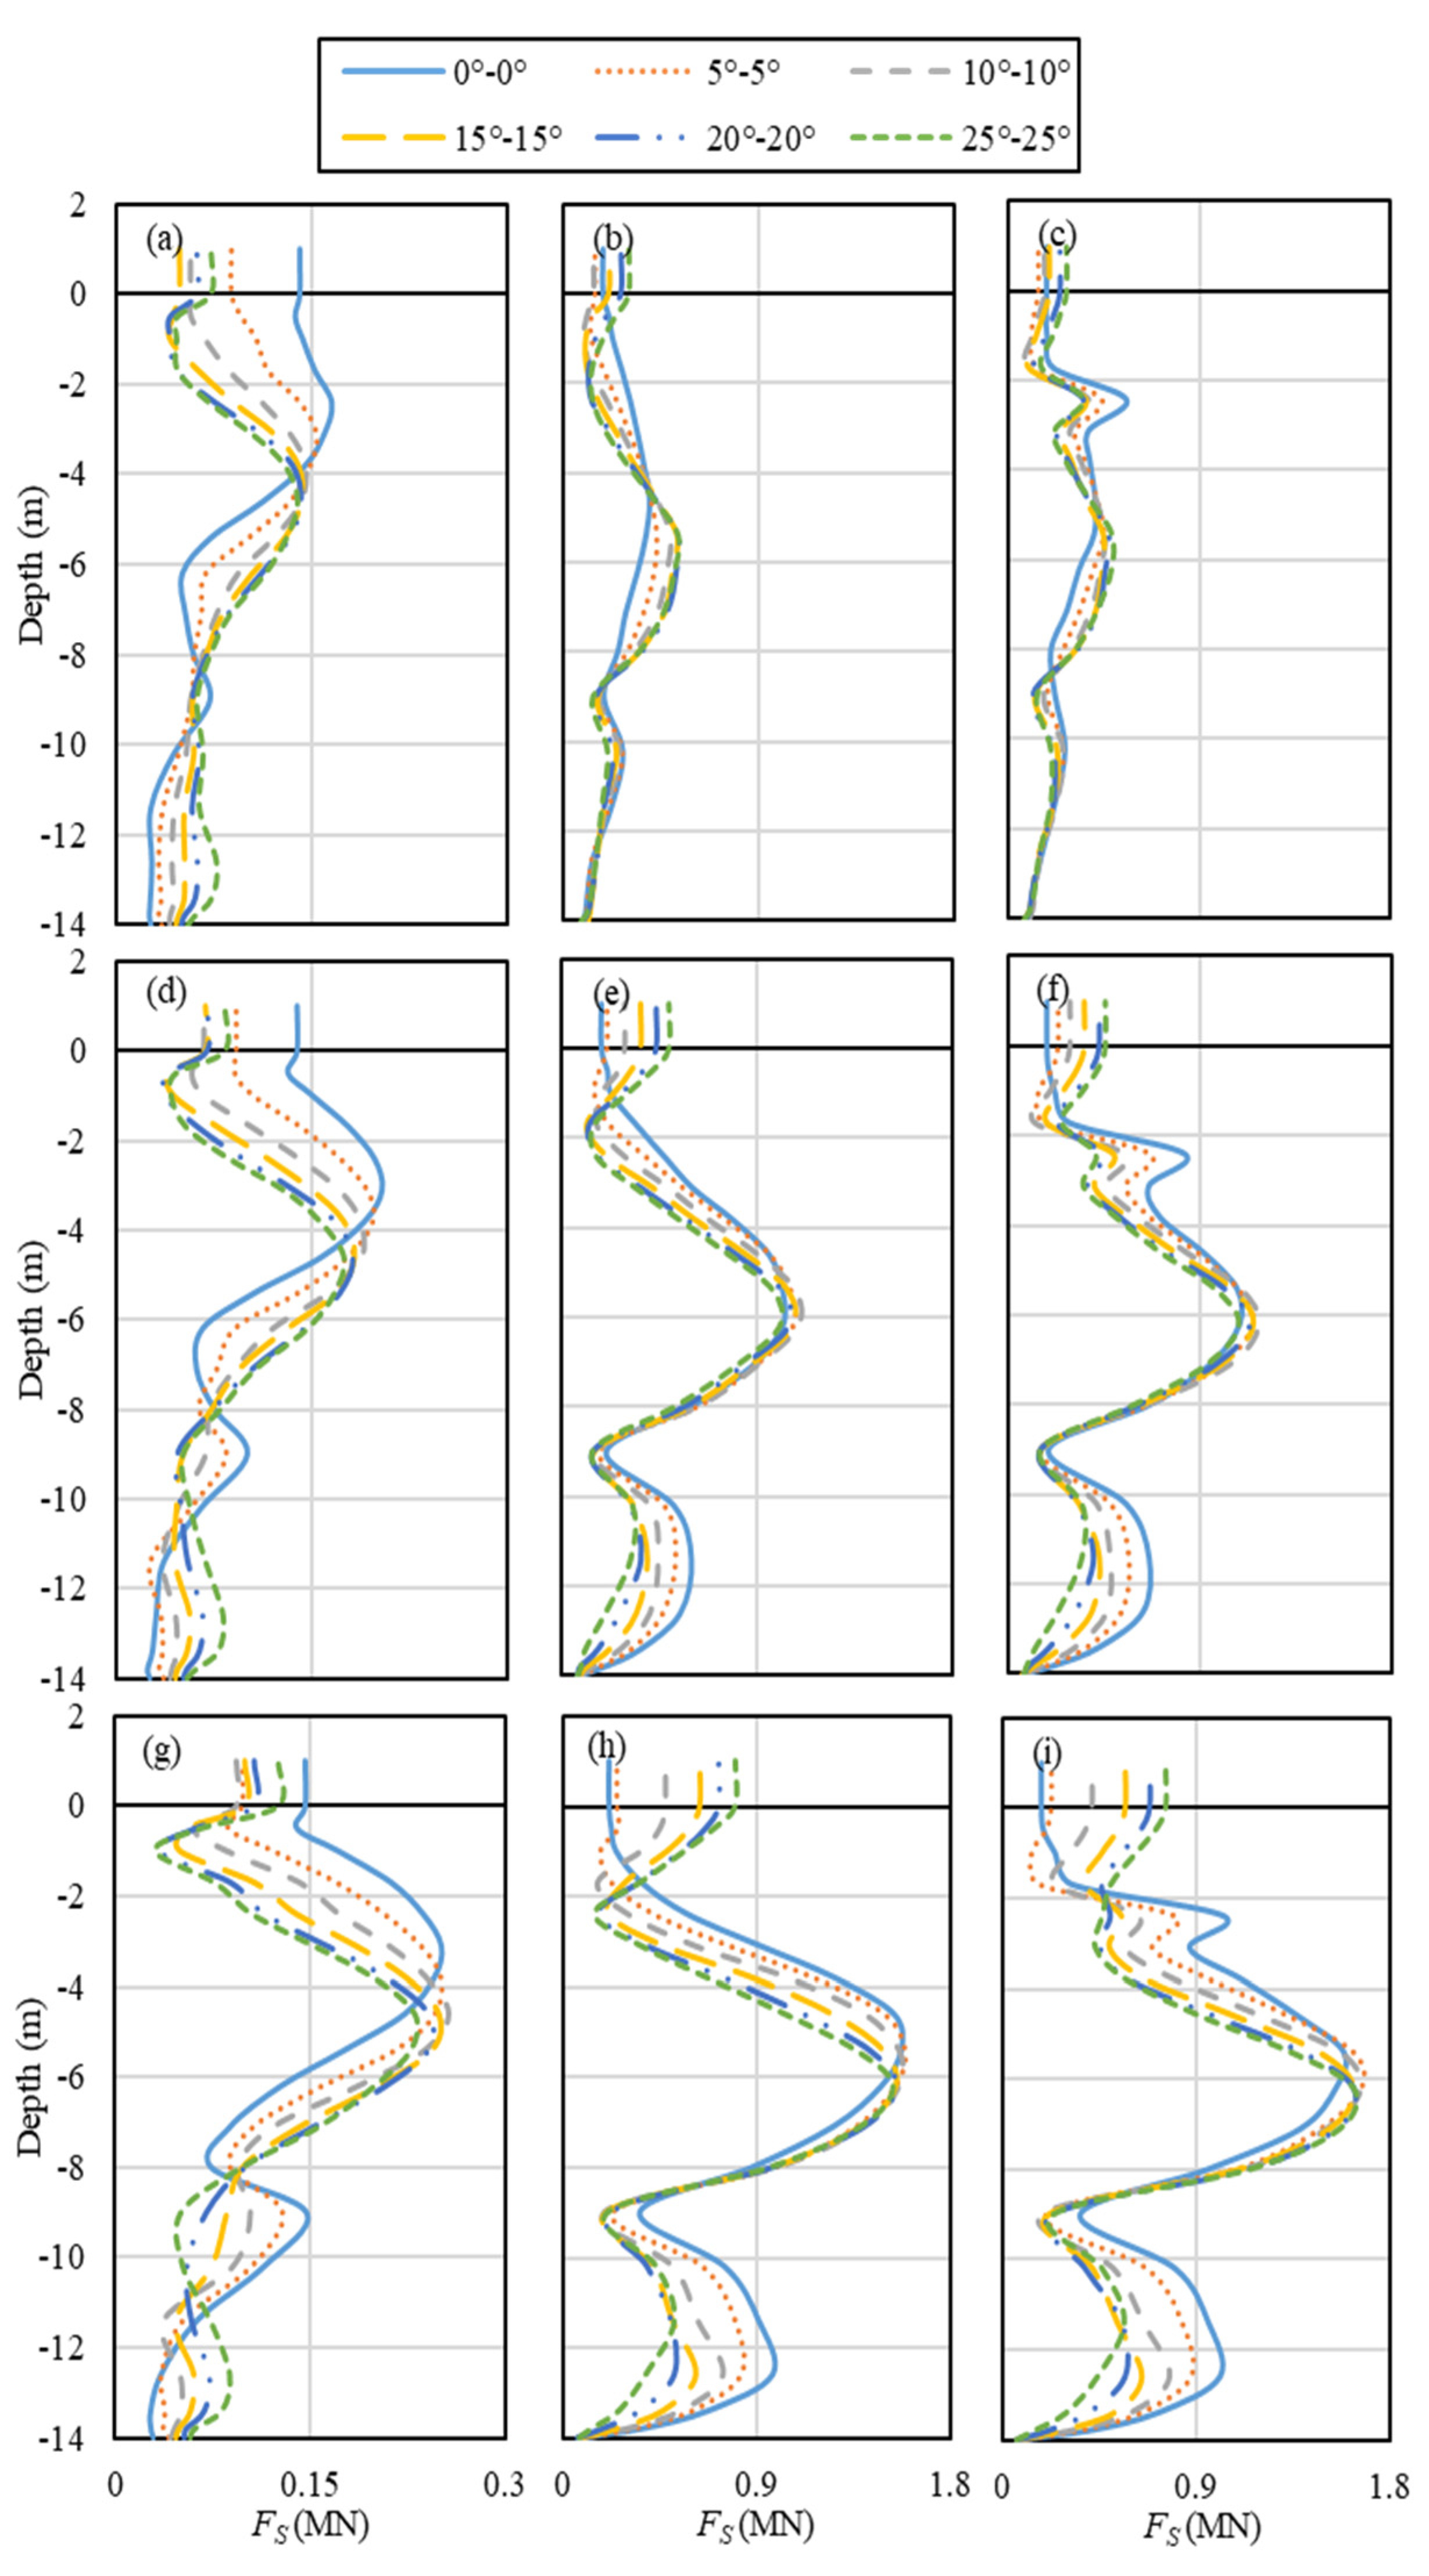
3.3.2. Maximum Shear Force
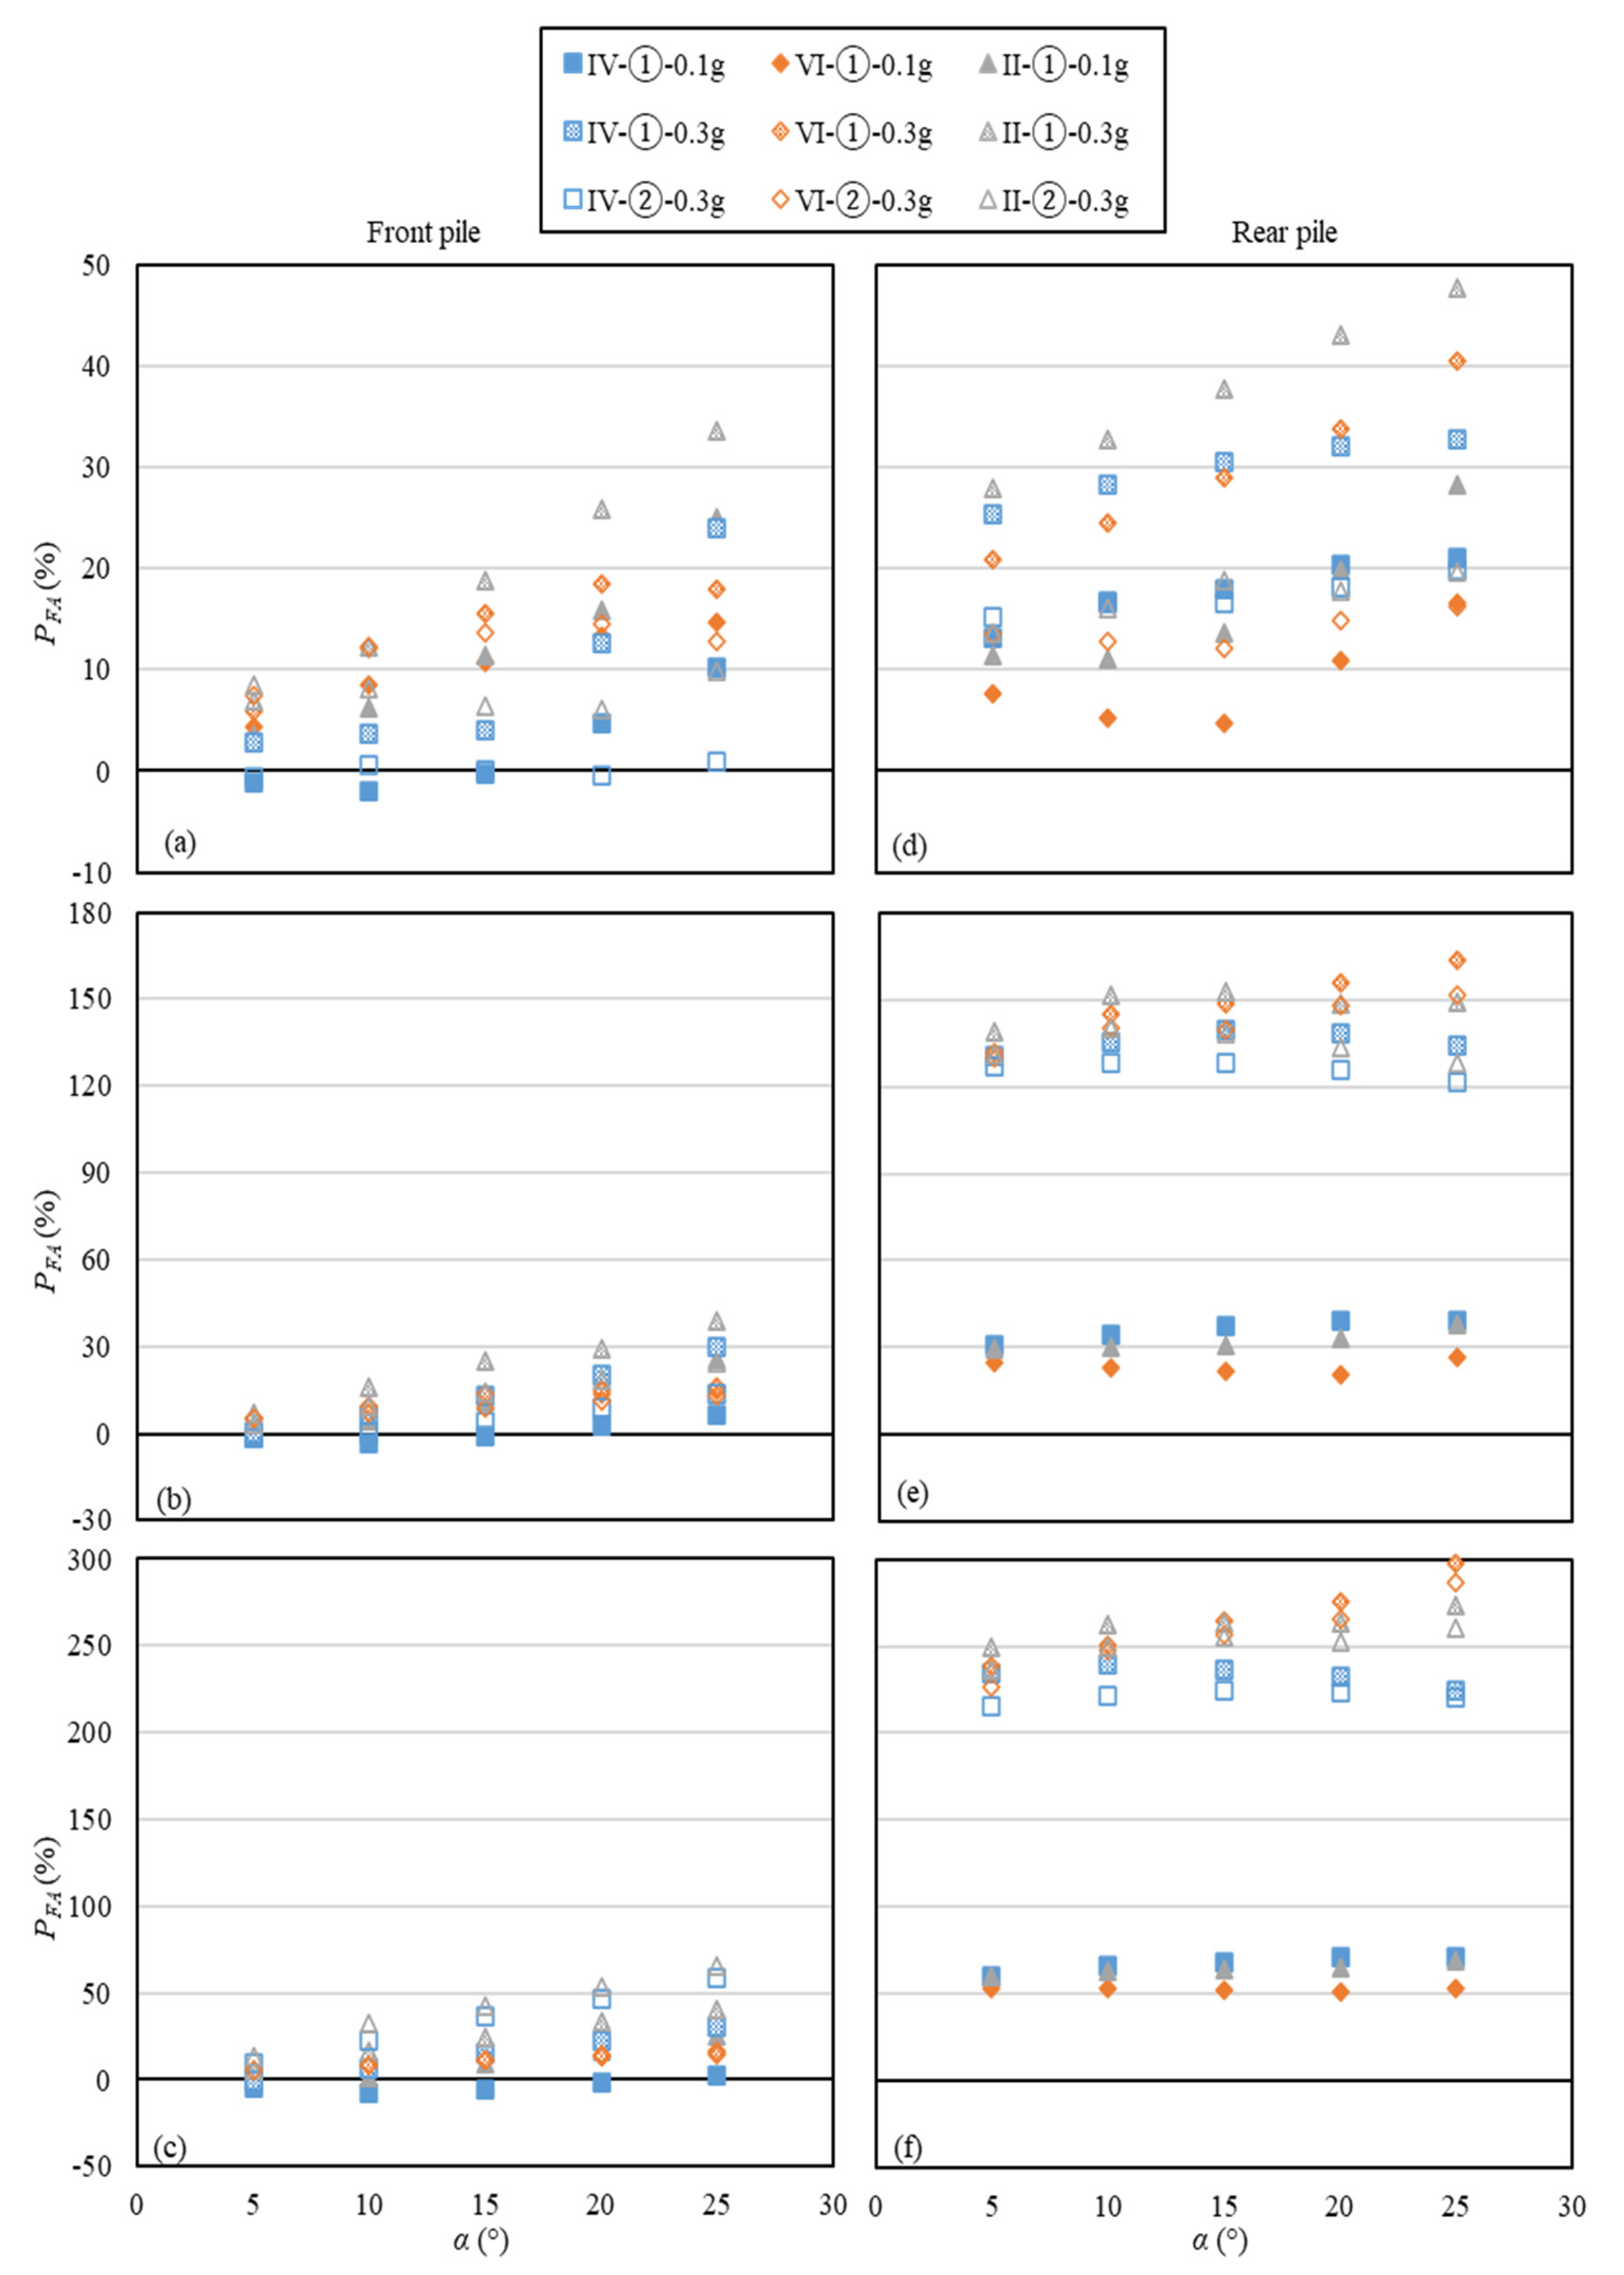
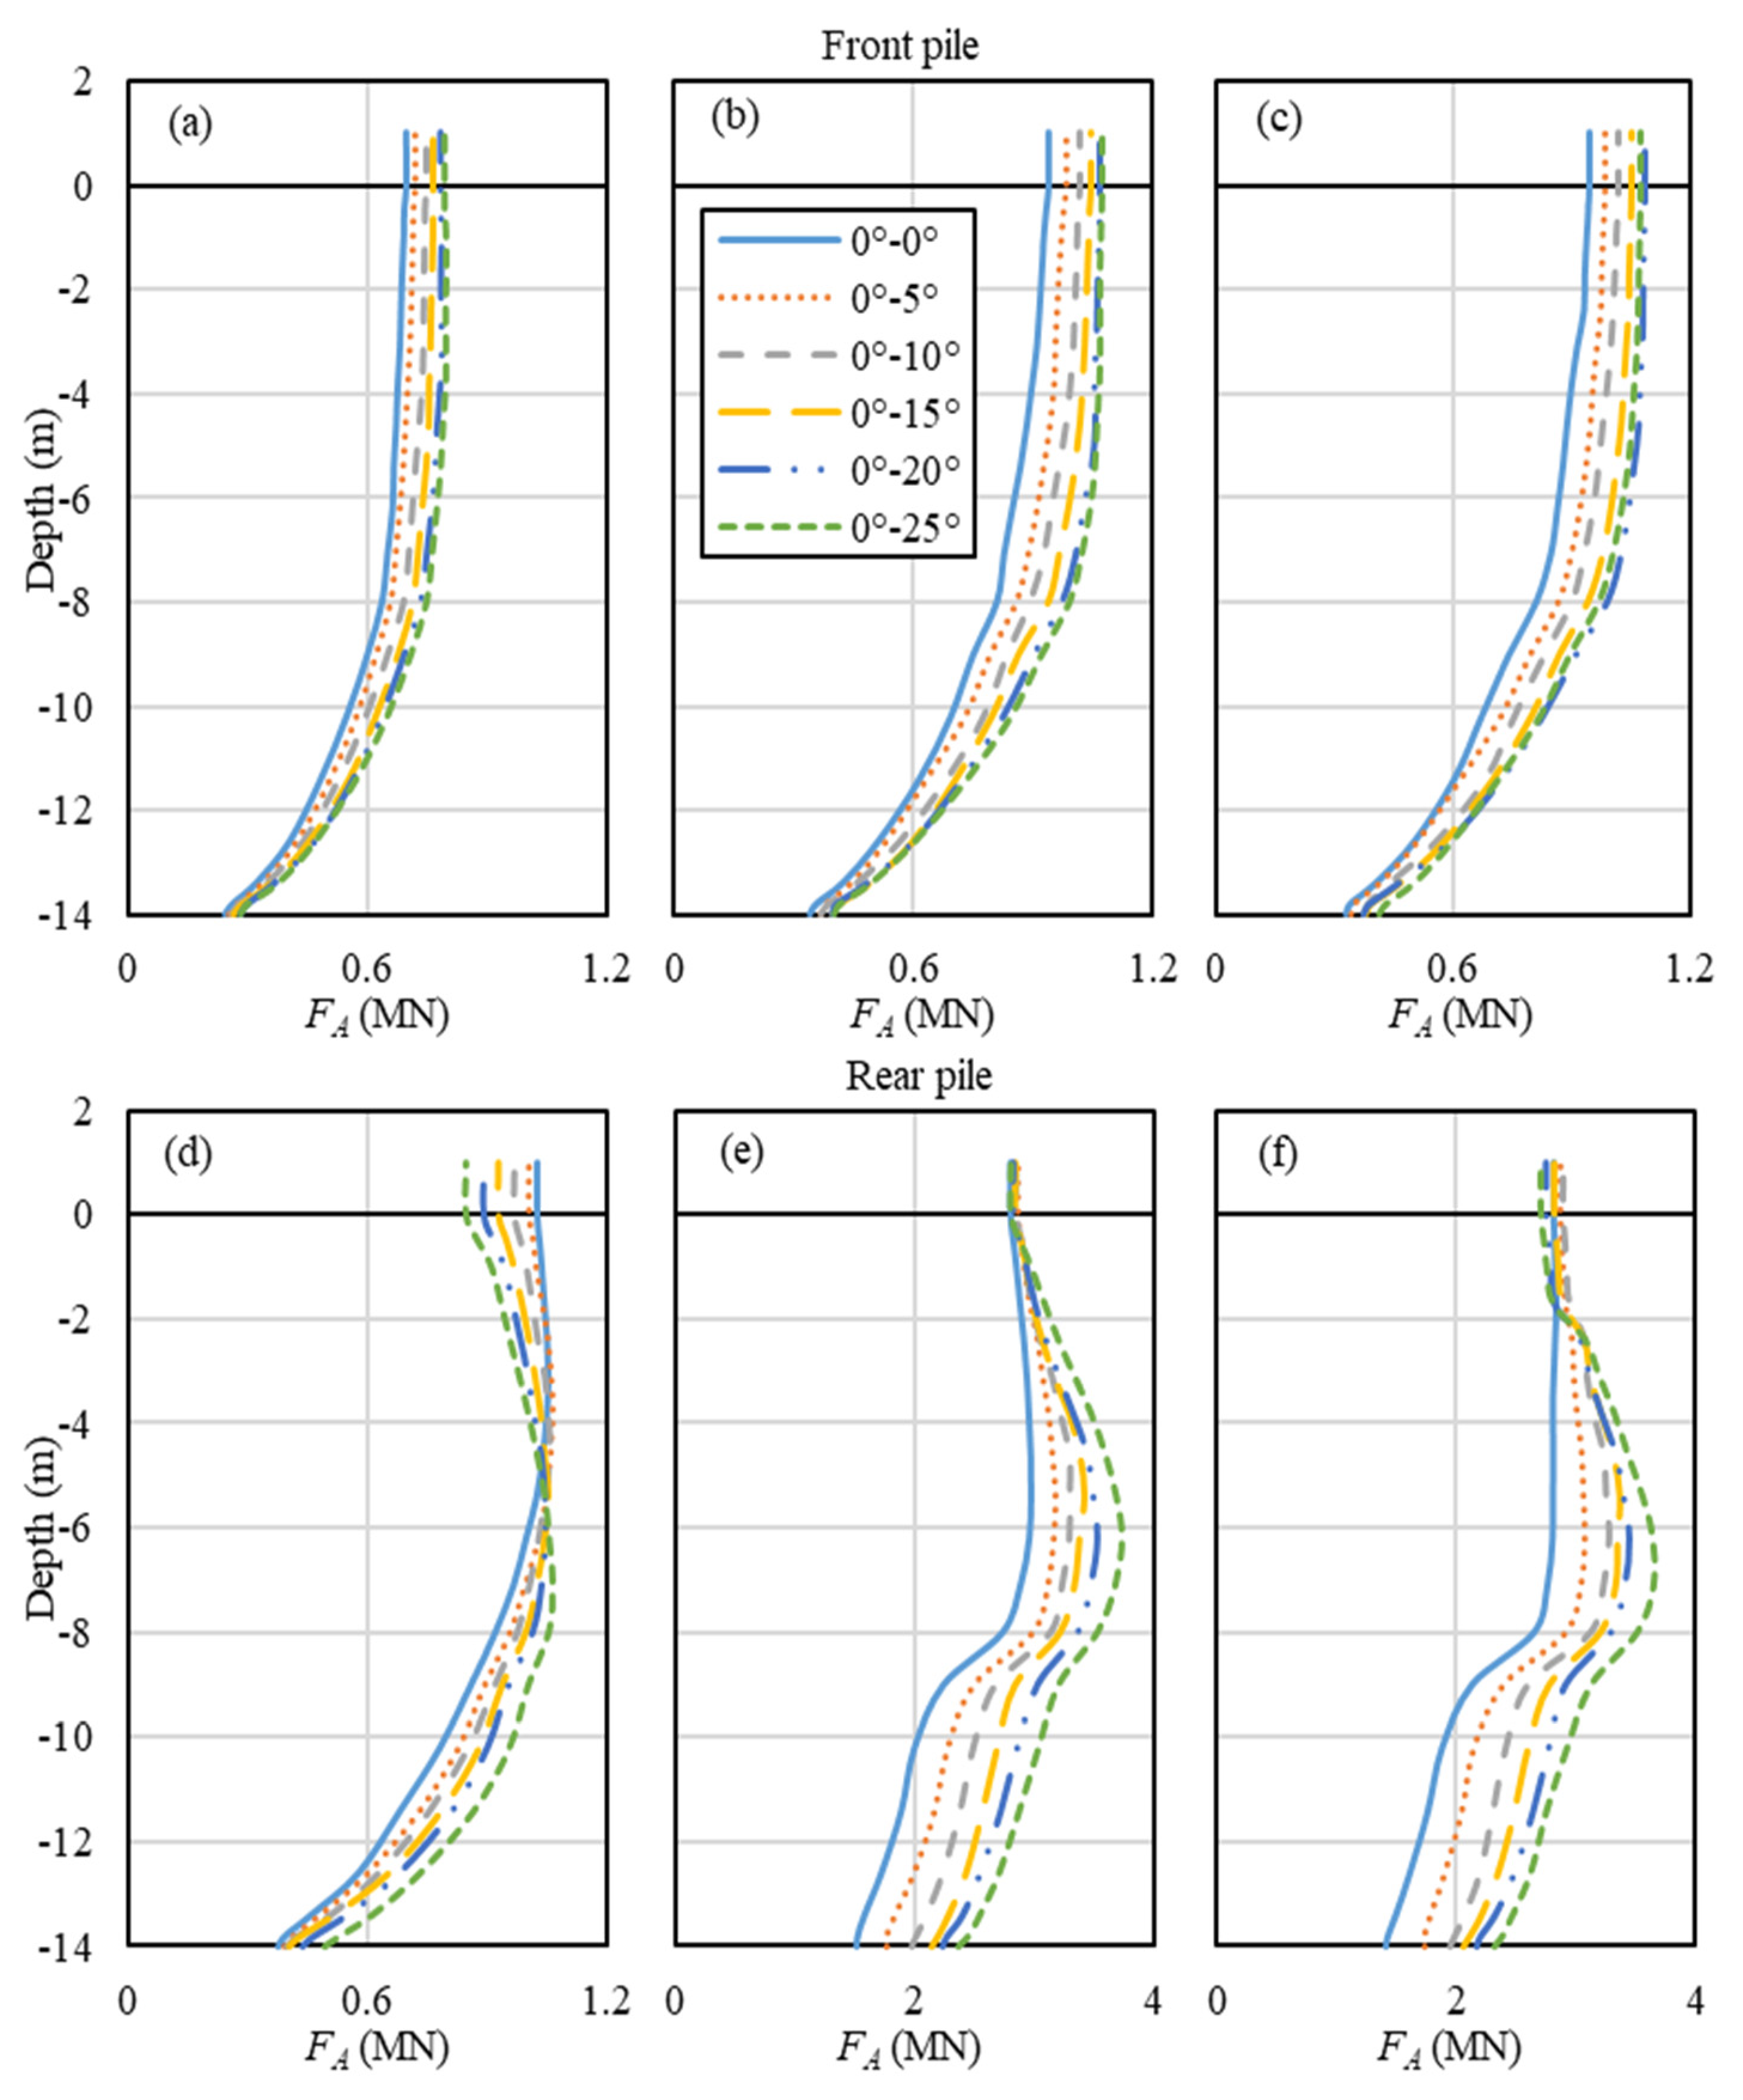
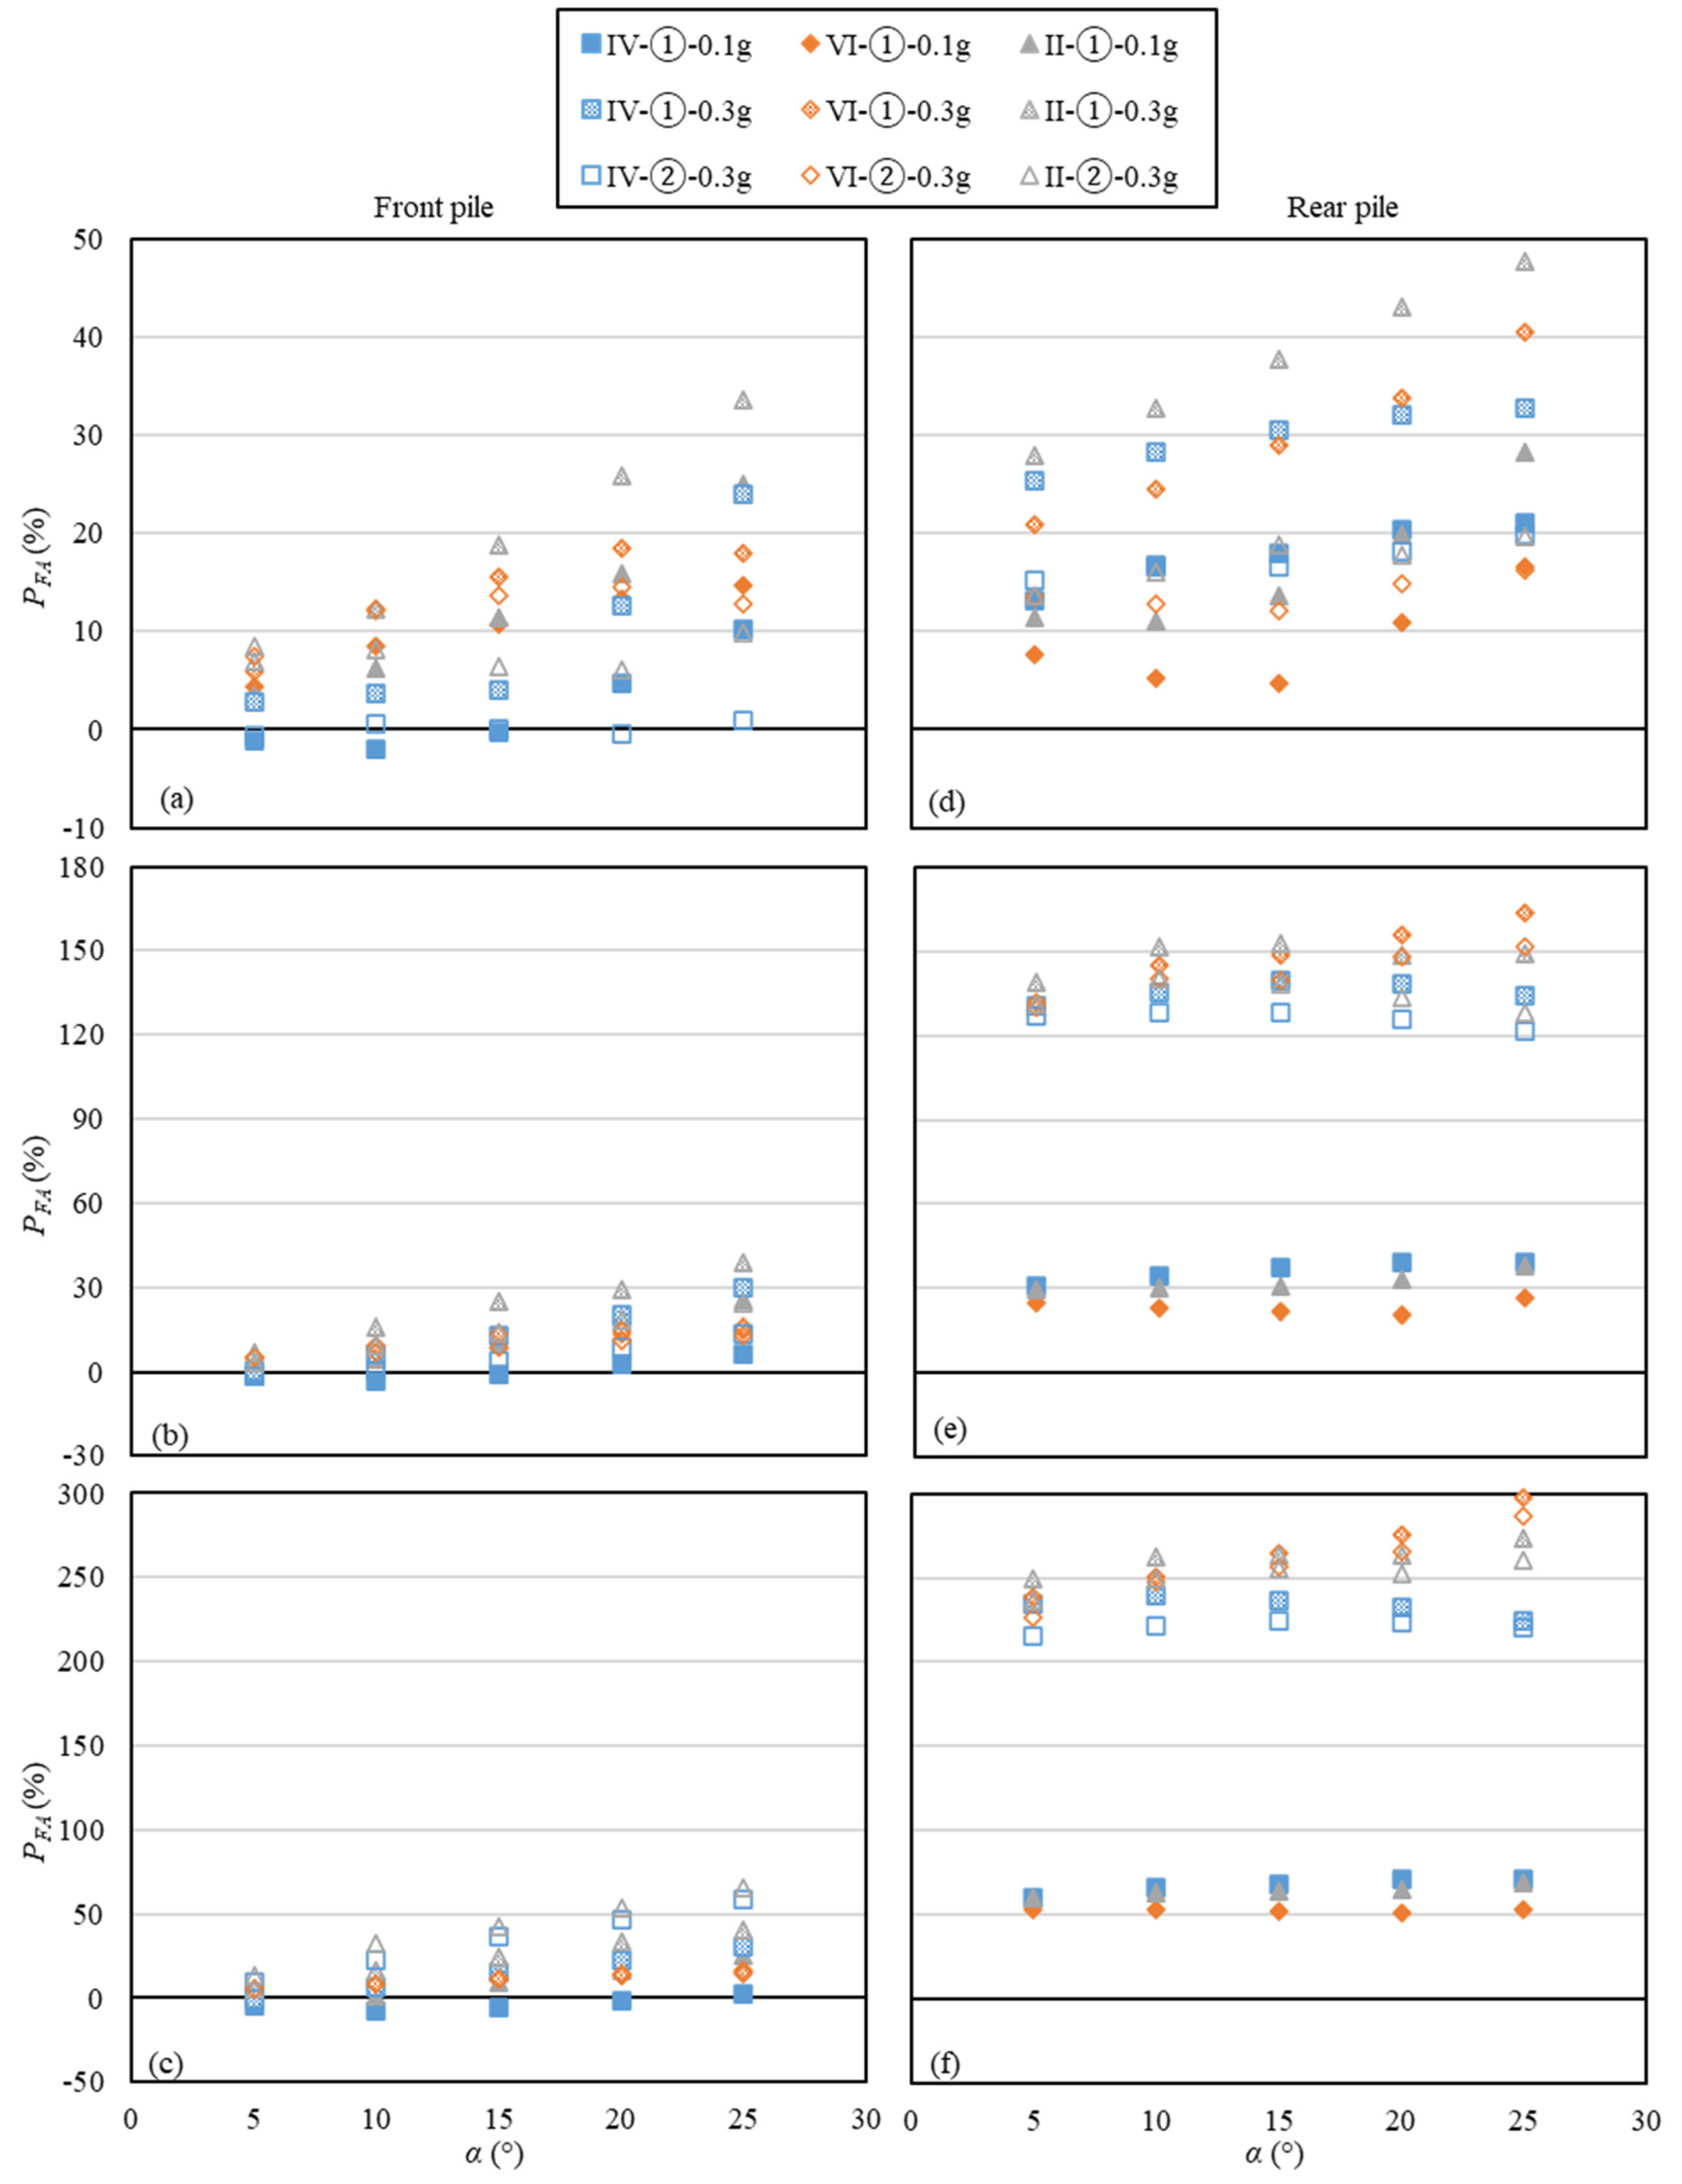
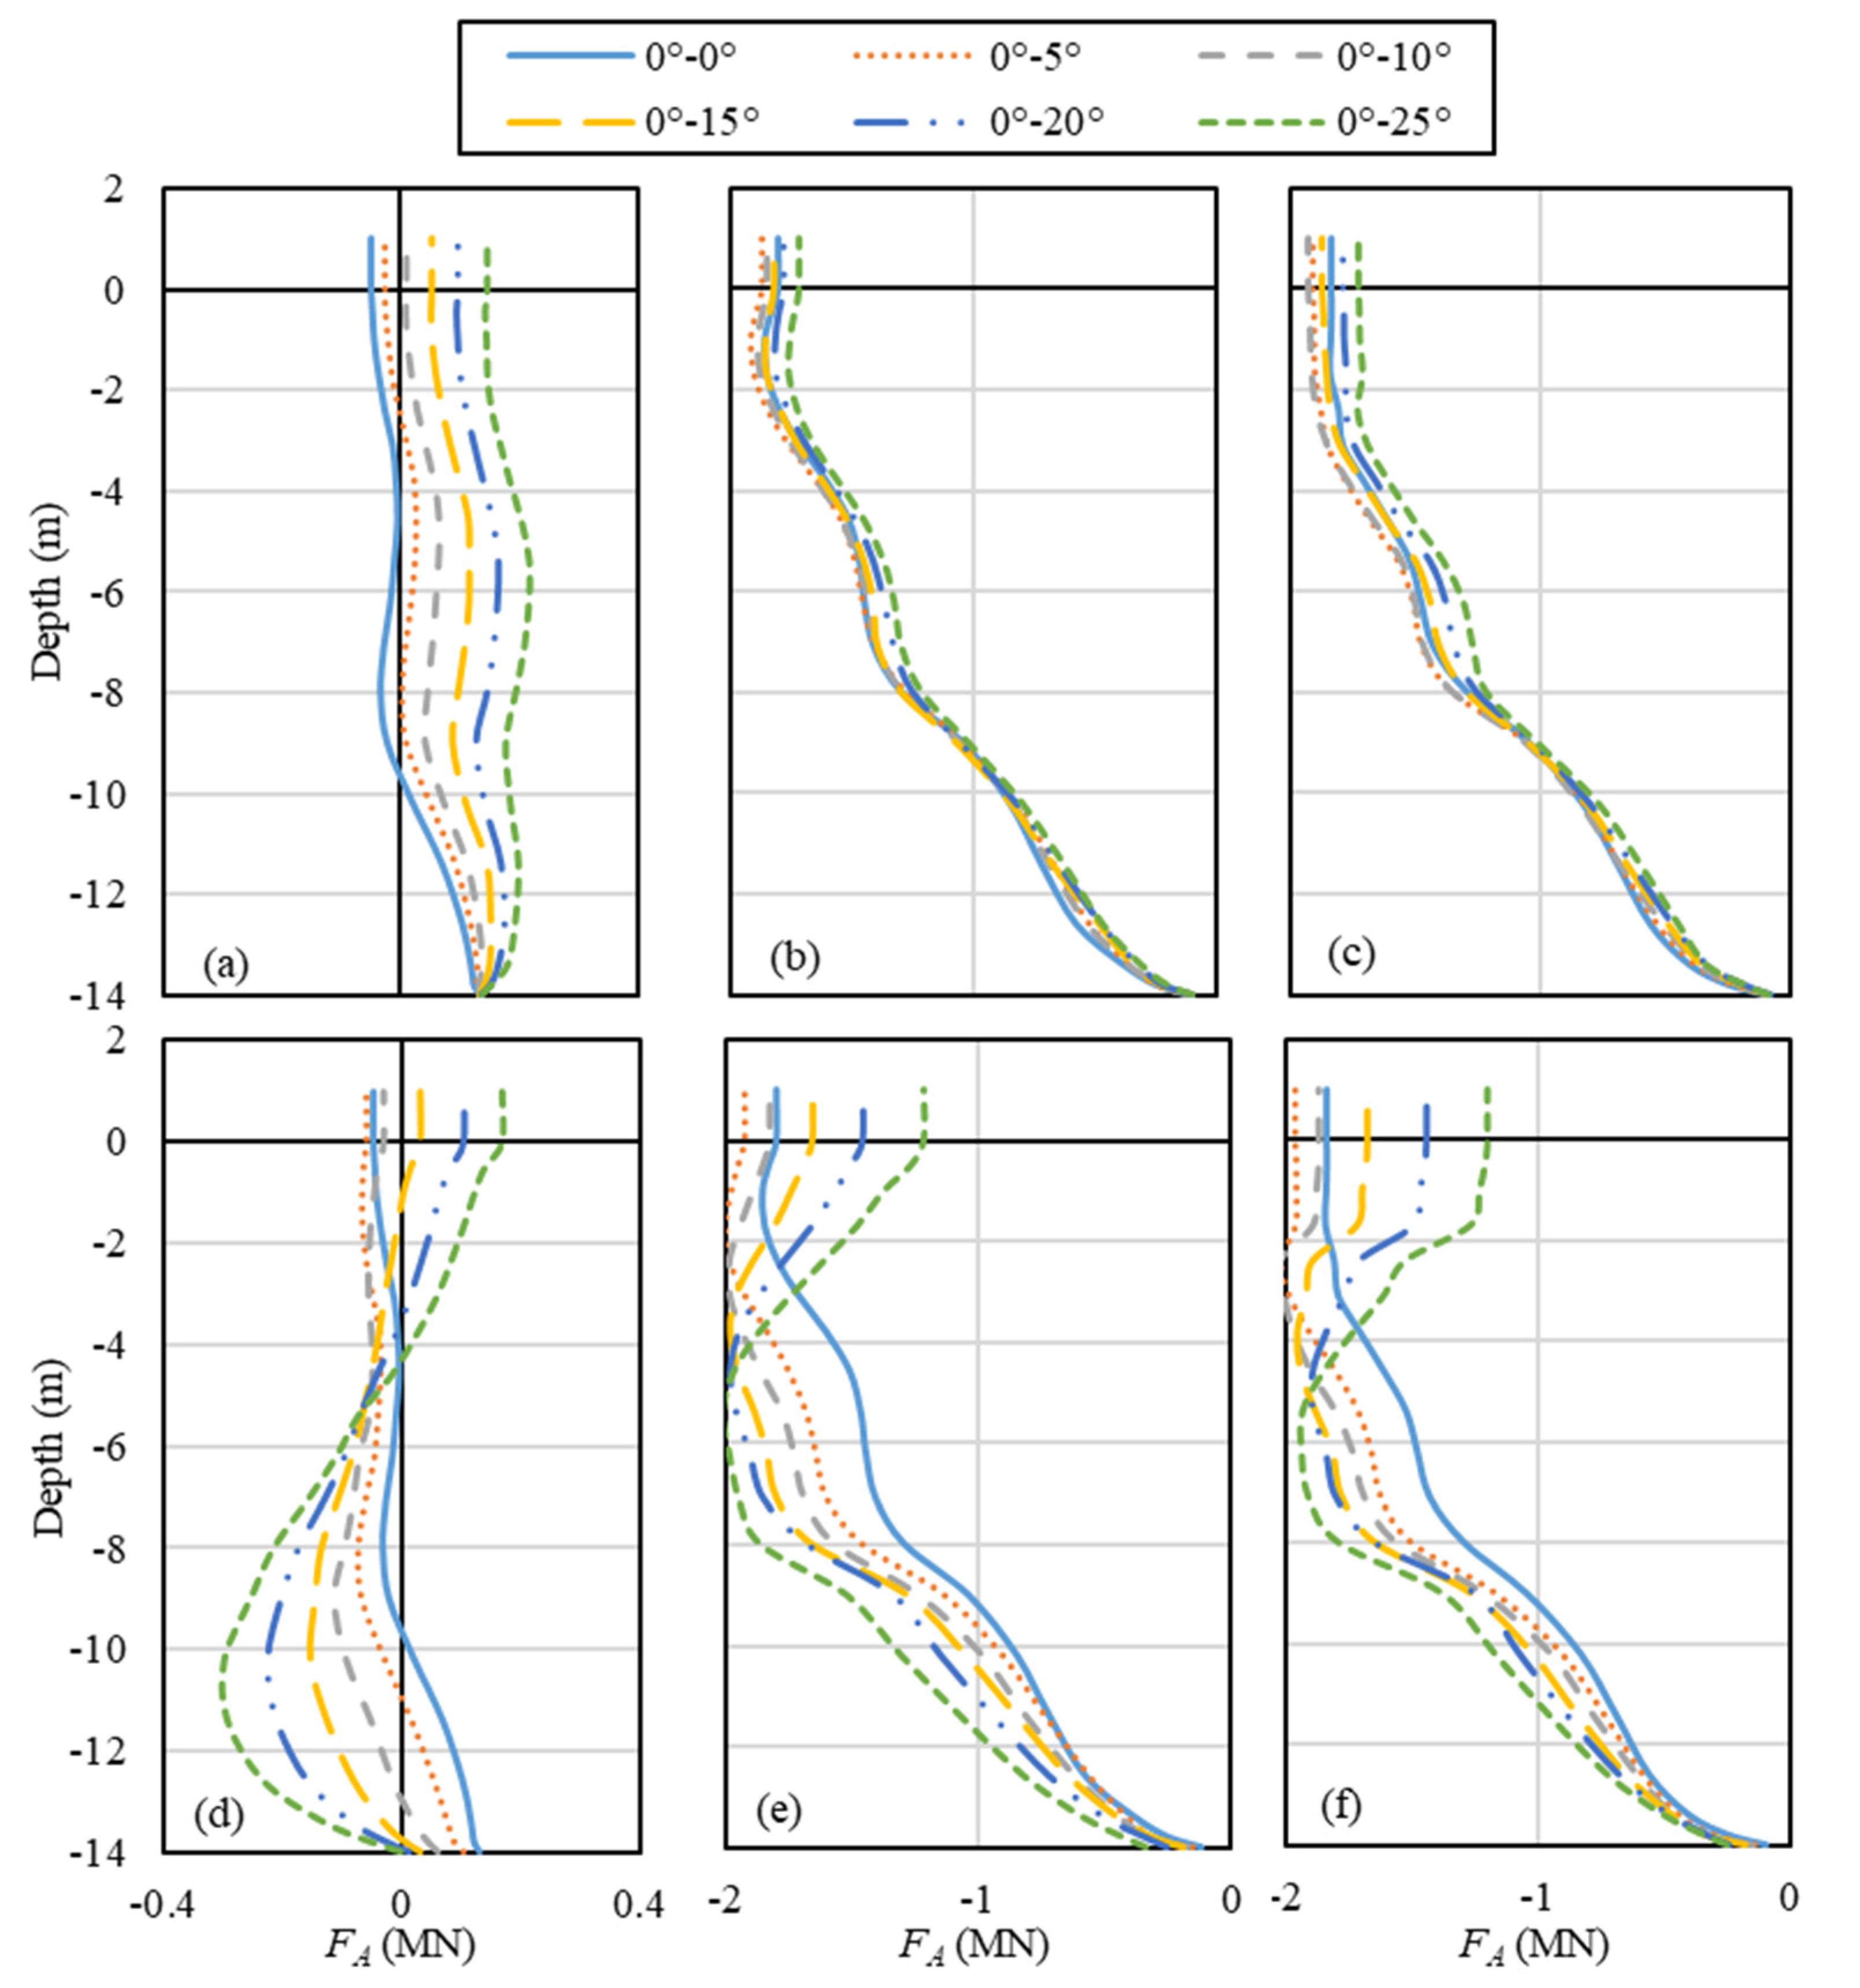
3.3.3. Maximum Axial Force
3.3.4. Minimum Axial Force
4. Discussion
5. Conclusions and Recommendations
- In the sloping ground case, better performance can be obtained with the use of two pile group configurations, “II” (two symmetrically inclined piles), and “VI” (the combination of a vertical front pile and an inclined rear pile).
- In the non-liquefied ground scenario, the utilization of inclined piles with appropriate configurations can be beneficial to most of the soil–pile system responses, except for the cap rotation and the axial force (either compression or tension) on the pile. Conversely, inclined piles with small inclinations can also be beneficial for cap rotation.
- In the liquefied level ground scenario, inclined piles were found to be detrimental to the maximum pore water pressure in the near-field soil, and in the cap rotation, shear force, and axial force (either compression or tension) on the pile.
- In the liquefied sloping ground scenario, in which a large lateral spreading has been induced, inclined piles become beneficial in reducing the rotation of the cap and the shear force on the pile. Moreover, pronounced beneficial effects were observed in the displacement of the soil and cap, bending moment, and cap rotation. As for the compressive and tensile axial forces, however, the detrimental effects were amplified significantly for the large ground inclinations.
- Compared with the non-liquefied scenario, inclined piles in the liquefied ground case could have more pronounced beneficial effects on the lateral displacement of the soil and cap, and less pronounced detrimental effects on the cap rotation. However, there were also more pronounced detrimental effects on the axial compression or tension on the pile, and less pronounced beneficial effects on the inertial force under the cap, as well as the bending moment and shear force on the pile.
Author Contributions
Funding
Data Availability Statement
Acknowledgments
Conflicts of Interest
Nomenclature
| (N1)60 | SPT value |
| acap | Horizontal acceleration of the cap |
| amax,base | Peak base acceleration |
| Br | Reference bulk modulus |
| c | Numerical constant |
| cu | Undrained shear strength |
| c1, c2, c3 | Contraction coefficients |
| d | Pressure dependency coefficient |
| D | Pile diameter |
| d1, d2, d3 | Dilation coefficients |
| Dr | Relative density |
| e | Void ratio |
| FA | Maximum axial force in pile |
| FI | Maximum inertial force on pile |
| fmax | Maximum frequency content of the excitation |
| FS | Maximum shear force in pile |
| Gr | Reference shear modulus |
| hmax | Element height |
| k | Permeability of soil |
| liq1, liq2 | Liquefaction constants |
| M | Maximum bending moment in pile |
| mcap | Mass of the cap |
| NYS | Number of yield surface |
| pr | Reference pressure |
| Pusoil, Pθ, PFI, Pucap, PM, PFA | Performance indices for different quantities |
| ru | Excess pore water pressure ratio |
| Usoil, Ucap | Horizontal displacements of soil and cap |
| Vs | Shear wave velocity |
| αL | Inclination of left/front pile |
| αR | Inclination of right/rear pile |
| β | Ground slope |
| γmax | Maximum shear strain |
| θ | Maximum rotation of the cap |
| ρ | Saturated soil density |
| φf | Friction angle at peak shear strength |
| φPT | Phase transformation angle |
References
- Seed, R.B.; Dickenson, S.E.; Idriss, I.M. Principal geotechnical aspects of the 1989 Loma Prieta earthquake. Soils Found. 1991, 31, 1–26. [Google Scholar] [CrossRef]
- Finn, W.D.L.; Fujita, N. Piles in liquefiable soils: Seismic analysis and design issues. Soil Dyn. Earthq. Eng. 2002, 22, 731–742. [Google Scholar] [CrossRef]
- AFPS (Association Française de Génie Parasismique). Association Francaise de Genie Parasismique Recommandations; Presses del Ponts at Chausseés: Paris, France, 1990. [Google Scholar]
- EN 1998-5:2004; Eurocode 8: Design of Structures for Earthquake Resistance Part 5: Foundations, Retaining Structures and Geotechnical Aspects. CEN (European Committee for Standardization): Brussels, Belgium, 2004.
- Haskell, J.; Madabhushi, S.; Cubrinovski, M.; Winkley, A. Lateral spreading-induced abutment rotation in the 2011 Christchurch earthquake: Observations and analysis. Géotechnique 2013, 63, 1310–1327. [Google Scholar] [CrossRef]
- Pender, M.J. Aseismic pile foundation design analysis. Bull. New Zealand Soc. Earthq. Eng. 1993, 26, 49–160. [Google Scholar] [CrossRef]
- Gerolymos, N.; Giannakou, A.; Anastasopoulos, I.; Gazetas, G. Evidence of beneficial role of inclined piles: Observations and summary of numerical analyses. Bull. Earthq. Eng. 2008, 6, 705–722. [Google Scholar] [CrossRef]
- Berrill, J.B.; Christensen, S.A.; Keenan, R.P.; Okada, W.; Pettinga, J.R. Case study of lateral spreading forces on a piled foundation. Géotechnique 2001, 51, 501–517. [Google Scholar] [CrossRef]
- Escoffier, S.; Chazelas, J.-L.; Garnier, J. Centrifuge modelling of raked piles. Bull. Earthq. Eng. 2008, 6, 689–704. [Google Scholar] [CrossRef]
- Li, Z.; Escoffier, S.; Kotronis, P. Centrifuge modeling of batter pile foundations under earthquake excitation. Soil Dyn. Earthq. Eng. 2016, 88, 176–190. [Google Scholar] [CrossRef]
- Li, Z.; Escoffier, S.; Kotronis, P. Centrifuge modeling of batter pile foundations under sinusoidal dynamic excitation. Bull. Earthq. Eng. 2015, 14, 673–697. [Google Scholar] [CrossRef]
- Tazoh, T.; Sato, M.; Jang, J.; Taji, Y.; Gazetas, G.; Anastasopoulos, I. Kinematic Response of Batter Pile foundation: Centrifuge tests. In Soil-Foundation-Structure Interaction; Orense, R., Chouw, N., Pender, M., Eds.; Taylor and Francis Group: London, UK, 2010; pp. 41–47. [Google Scholar] [CrossRef]
- McManus, K.; Turner, J.; Charton, G. Inclined reinforcement to prevent soil liquefaction. In Proceedings of the Annual NZSEE Technical Conference, Wairakei, New Zealand, 11–13 March 2005. [Google Scholar]
- Shahrour, I.; Juran, I. Seismic behaviour of micropile systems. Proc. Inst. Civ. Eng. Ground Improv. 2004, 8, 109–120. [Google Scholar] [CrossRef]
- Khosravifar, A.; Boulanger, R.W.; Kunnath, S.K. Effects of liquefaction on inelastic demands on extended pile shafts. Earthq. Spectra 2014, 30, 1749–1773. [Google Scholar] [CrossRef]
- Shafieezadeh, A.; Desroches, R.; Rix, G.J.; Werner, S.D. Seismic Performance of Pile-Supported Wharf Structures considering Soil-Structure Interaction in Liquefied Soil. Earthq. Spectra 2012, 28, 729–757. [Google Scholar] [CrossRef]
- Wang, S.; Orense, R.P. Modelling of raked pile foundations in liquefiable ground. Soil Dyn. Earthq. Eng. 2014, 64, 11–23. [Google Scholar] [CrossRef]
- McGann, C.R.; Arduino, P.; Mackenzie-Helnwein, P. Applicability of Conventional p-y Relations to the Analysis of Piles in Laterally Spreading Soil. J. Geotech. Geoenvironmental Eng. 2011, 137, 557–567. [Google Scholar] [CrossRef]
- Cubrinovski, M.; Uzuoka, R.; Sugita, H.; Tokimatsu, K.; Sato, M.; Ishihara, K.; Tsukamoto, Y.; Kamata, T. Prediction of pile response to lateral spreading by 3-D soil–water coupled dynamic analysis: Shaking in the direction of ground flow. Soil Dyn. Earthq. Eng. 2008, 28, 421–435. [Google Scholar] [CrossRef]
- Li, G.; Motamed, R. Finite element modeling of soil-pile response subjected to liquefaction-induced lateral spreading in a large-scale shake table experiment. Soil Dyn. Earthq. Eng. 2017, 92, 573–584. [Google Scholar] [CrossRef]
- Chang, D.; Boulanger, R.; Brandenberg, S.; Kutter, B. FEM Analysis of Dynamic Soil-Pile-Structure Interaction in Liquefied and Laterally Spreading Ground. Earthq. Spectra 2013, 29, 733–755. [Google Scholar] [CrossRef]
- Cheng, Z.; Jeremić, B. Numerical modeling and simulation of pile in liquefiable soil. Soil Dyn. Earthq. Eng. 2009, 29, 1405–1416. [Google Scholar] [CrossRef]
- Abu-Farsakh, M.; Souri, A.; Voyiadjis, G.; Rosti, F. Comparison of static lateral behavior of three pile group configurations using three-dimensional finite element modeling. Can. Geotech. J. 2018, 55, 107–118. [Google Scholar] [CrossRef]
- Hazzar, L.; Hussien, M.N.; Karray, M. Numerical investigation of the lateral response of battered pile foundations. Int. J. Geotech. Eng. 2017, 11, 376–392. [Google Scholar] [CrossRef]
- Xie, Y.; Huo, Y.; Zhang, J. Development and validation of p-y modeling approach for seismic response predictions of highway bridges. Earthq. Eng. Struct. Dyn. 2017, 46, 585–604. [Google Scholar] [CrossRef]
- Giannakou, A.; Gerolymos, N.; Gazetas, G.; Tazoh, T.; Anastasopoulos, I. Seismic Behavior of Batter Piles: Elastic Response. J. Geotech. Geoenvironmental Eng. 2010, 136, 1187–1199. [Google Scholar] [CrossRef]
- Sadek, M.; Shahrour, I. Influence of the head and tip connection on the seismic performance of micropiles. Soil Dyn. Earthq. Eng. 2006, 26, 461–468. [Google Scholar] [CrossRef]
- Sarkar, R.; Roy, N.; Serawat, A. A Three Dimensional Comparative Study of Seismic Behaviour of Vertical and Batter Pile Groups. Geotech. Geol. Eng. 2018, 36, 763–781. [Google Scholar] [CrossRef]
- Rajeswari, J.S.; Sarkar, R. Seismic response of batter piles in liquefiable soils. In Proceedings of the 7th International Conference on Earthquake Geotechnical Engineering, Rome, Italy, 17–20 June 2019. [Google Scholar]
- Wang, Y.; Orense, R.P. Numerical analysis of inclined pile group performance in liquefiable sands. In Proceedings of the 7th International Conference on Earthquake Geotechnical Engineering, Rome, Italy, 17–20 June 2019. [Google Scholar]
- Mazzoni, S.; McKenna, F.; Scott, M.H.; Fenves, G.L.; OpenSees Command Language Manual. Pacific Earthquake Engineering Research (PEER) Center. 2007. Available online: http://opensees.berkeley.edu/OpenSees/manuals/usermanual/OpenSeesCommandLanguageManual.pdf (accessed on 16 April 2021).
- Janalizadeh, A.; Zahmatkesh, A. Lateral response of pile foundations in liquefiable soils. J. Rock Mech. Geotech. Eng. 2015, 7, 532–539. [Google Scholar] [CrossRef]
- Zhang, S.; Wei, Y.; Cheng, X.; Chen, T.; Zhang, X.; Li, Z. Centrifuge modeling of batter pile foundations in laterally spreading soil. Soil Dyn. Earthq. Eng. 2020, 135, 106166. [Google Scholar] [CrossRef]
- Ramirez, J.; Barrero, A.R.; Chen, L.; Dashti, S.; Ghofrani, A.; Taiebat, M.; Arduino, P. Site Response in a Layered Liquefiable Deposit: Evaluation of Different Numerical Tools and Methodologies with Centrifuge Experimental Results. J. Geotech. Geoenvironmental Eng. 2018, 144, 04018073. [Google Scholar] [CrossRef]
- L'Heureux, J.S.; Long, M. Correlations between shear wave velocity and geotechnical parameters in Norwegian clays. In Proceedings of the 17th Nordic Geotechnical Meeting, Reykjavik, Iceland, 25–28 May 2016. [Google Scholar]
- Li, Z.; Kotronis, P.; Escoffier, S.; Tamagnini, C. A hypoplastic macroelement for single vertical piles in sand subject to three-dimensional loading conditions. Acta Geotech. 2016, 11, 373–390. [Google Scholar] [CrossRef]
- Yang, Z.; Elgamal, A.; Parra, E. Computational Model for Cyclic Mobility and Associated Shear Deformation. J. Geotech. Geoenvironmental Eng. 2003, 129, 1119–1127. [Google Scholar] [CrossRef]
- Yang, Z.; Lu, J.; Elgamal, A.; OpenSees Soil Models and Solid-Fluid Fully Coupled Elements: User’s Manual. San Diego. 2008. Available online: https://citeseerx.ist.psu.edu/viewdoc/download?doi=10.1.1.520.3689&rep=rep1&type=pdf (accessed on 29 August 2021).
- Kramer, S.L.; Arduino, P.; Shin, H. Using OpenSees for Performance-based Evaluation of Bridges on Liquefiable Soils; PEER Report 2008/07; Pacific Earthquake Engineering Research Center, University of California: Berkeley, CA, USA, 2008. [Google Scholar]
- Yang, Z. Numerical Modelling of Earthquake Site Response Including Dilation and Liquefaction. Ph.D. Dissertation, Columbia University, New York, NY, USA, 2000. [Google Scholar]
- Choobbasti, A.J.; Zahmatkesh, A. Computation of degradation factors of p-y curves in liquefiable soils for analysis of piles using three-dimensional finite-element model. Soil Dyn. Earthq. Eng. 2016, 89, 61–74. [Google Scholar] [CrossRef]
- Arulmoli, K.; Muraleetharan, K.K.; Hossain, M.M.; Fruth, L.S. VELACS (Verifications of Liquefaction Analyses by Centrifuge Studies) Laboratory Testing Program; Soil Data Report; The Earth Technology Corporation: Virginia Beach, VA, USA, 1992. [Google Scholar] [CrossRef]
- Rahmani, A. Three-dimensional Nonlinear Analysis of Dynamic Soil-Pile-Structure Interaction for Bridge Systems under Earthquake Shakings. Ph.D. Dissertation, The University of British Columbia, Victoria, BC, Canada, 2014. [Google Scholar]
- Wilson, D.W. Soil-Pile-Superstructure Interaction in Liquefying Sand and Soft Clay. Ph.D. Dissertation, University of California, Davis, Oakland, CA, USA, 1998. [Google Scholar]
- Wang, Y.; Orense, R.P. Numerical analysis of seismic performance of inclined piles in liquefiable sands. Soil Dyn. Earthq. Eng. 2020, 139, 106274. [Google Scholar] [CrossRef]
- Knodel, P.; Kutter, B.; Sathialingam, N.; Herrmann, L. Effects of Arching on Response Time of Miniature Pore Pressure Transducer in Clay. Geotech. Test. J. 1990, 13, 164. [Google Scholar] [CrossRef]
- Sadek, M.; Isam, S. Three-dimensional finite element analysis of the seismic behavior of inclined micropiles. Soil Dyn. Earthq. Eng. 2004, 24, 473–485. [Google Scholar] [CrossRef]


| Factor | Range |
|---|---|
| Peak base acceleration, amax,base | 0.1 g and 0.3 g |
| Inclination of left/front pile, αL | 0°, 5°, 10°, 15°, 20°, and 25° |
| Inclination of right/rear pile, αR | 0°, 5°, 10°, 15°, 20°, and 25° |
| Ground slope, β | 0°, 2°, and 4° |
| Soil profile | ➀ and ➁ |
| Model Parameters | Sand (PDMY02) | Clay (PIMY) | |||||
|---|---|---|---|---|---|---|---|
| 0.0–1.5 m | 1.5–3.0 m | 3.0–4.5 m | 4.5–6.1 m | ||||
| Dr (%) | 55 | 57 | 80 | - | - | - | - |
| ρ (ton/m3) | 1.98 | 1.99 | 2.03 | 1.53 | 1.53 | 1.53 | 1.53 |
| pr (kPa) | 100 | 100 | 100 | 100 | 100 | 100 | 100 |
| Gr (MPa) | 71.1 | 73.7 | 102.0 | 0.5 | 1.3 | 1.8 | 2.4 |
| Br (MPa) | 189.5 | 196.8 | 272.1 | 2.33 | 6.1 | 8.4 | 11.2 |
| cu (kPa) | - | - | - | 2.5 | 6.5 | 9.0 | 12.0 |
| φf (°) | 29.9 | 30.3 | 38.6 | 0.0 | 0.0 | 0.0 | 0.0 |
| d | 0.5 | 0.5 | 0.5 | 0.0 | 0.0 | 0.0 | 0.0 |
| φPT (°) | 24.9 | 25.3 | 31.8 | - | - | - | - |
| c1 | 0.022 | 0.019 | 0.003 | - | - | - | - |
| c2 | 3.2 | 3.2 | 1.0 | - | - | - | - |
| c3 | 0.2 | 0.2 | 0.2 | - | - | - | - |
| d1 | 0.15 | 0.15 | 0.27 | - | - | - | - |
| d2 | 3.0 | 3.0 | 3.0 | - | - | - | - |
| d3 | 0.0 | 0.0 | 0.0 | - | - | - | - |
| liq1 | 1.0 | 1.0 | 1.0 | - | - | - | - |
| liq2 | 0.0 | 0.0 | 0.0 | - | - | - | - |
| γmax | 0.1 | 0.1 | 0.1 | 0.1 | 0.1 | 0.1 | 0.1 |
| NYS | 20 | 20 | 20 | 20 | 20 | 20 | 20 |
| c | 0.1 | 0.1 | 0.1 | - | - | - | - |
| e | 0.67 | 0.67 | 0.60 | - | - | - | - |
Disclaimer/Publisher’s Note: The statements, opinions and data contained in all publications are solely those of the individual author(s) and contributor(s) and not of MDPI and/or the editor(s). MDPI and/or the editor(s) disclaim responsibility for any injury to people or property resulting from any ideas, methods, instructions or products referred to in the content. |
© 2023 by the authors. Licensee MDPI, Basel, Switzerland. This article is an open access article distributed under the terms and conditions of the Creative Commons Attribution (CC BY) license (https://creativecommons.org/licenses/by/4.0/).
Share and Cite
Wang, Y.; Orense, R.P. Numerical Investigation of Inclined Piles under Liquefaction-Induced Lateral Spreading. Geotechnics 2023, 3, 320-346. https://doi.org/10.3390/geotechnics3020019
Wang Y, Orense RP. Numerical Investigation of Inclined Piles under Liquefaction-Induced Lateral Spreading. Geotechnics. 2023; 3(2):320-346. https://doi.org/10.3390/geotechnics3020019
Chicago/Turabian StyleWang, Yu, and Rolando P. Orense. 2023. "Numerical Investigation of Inclined Piles under Liquefaction-Induced Lateral Spreading" Geotechnics 3, no. 2: 320-346. https://doi.org/10.3390/geotechnics3020019