

Geological Exploration, Landslide Characterization and Susceptibility Mapping at the Boundary between Two Crystalline Bodies in Jajarkot, Nepal

 ,
,  and
and
Abstract
:1. Introduction
- A detailed geological exploration is carried out to generate the precise geological map of the study area.
- A field survey on landslide occurrence patterns is carried out.
- The geological and geo-structural control on landslide occurrence are investigated.
- Landslide susceptibility modeling is conducted using two bivariate statistical approaches, Frequency Ratio (FR) and Weight of Evidence (WOE), to explore and predict the probability distribution of future landslides in the area.
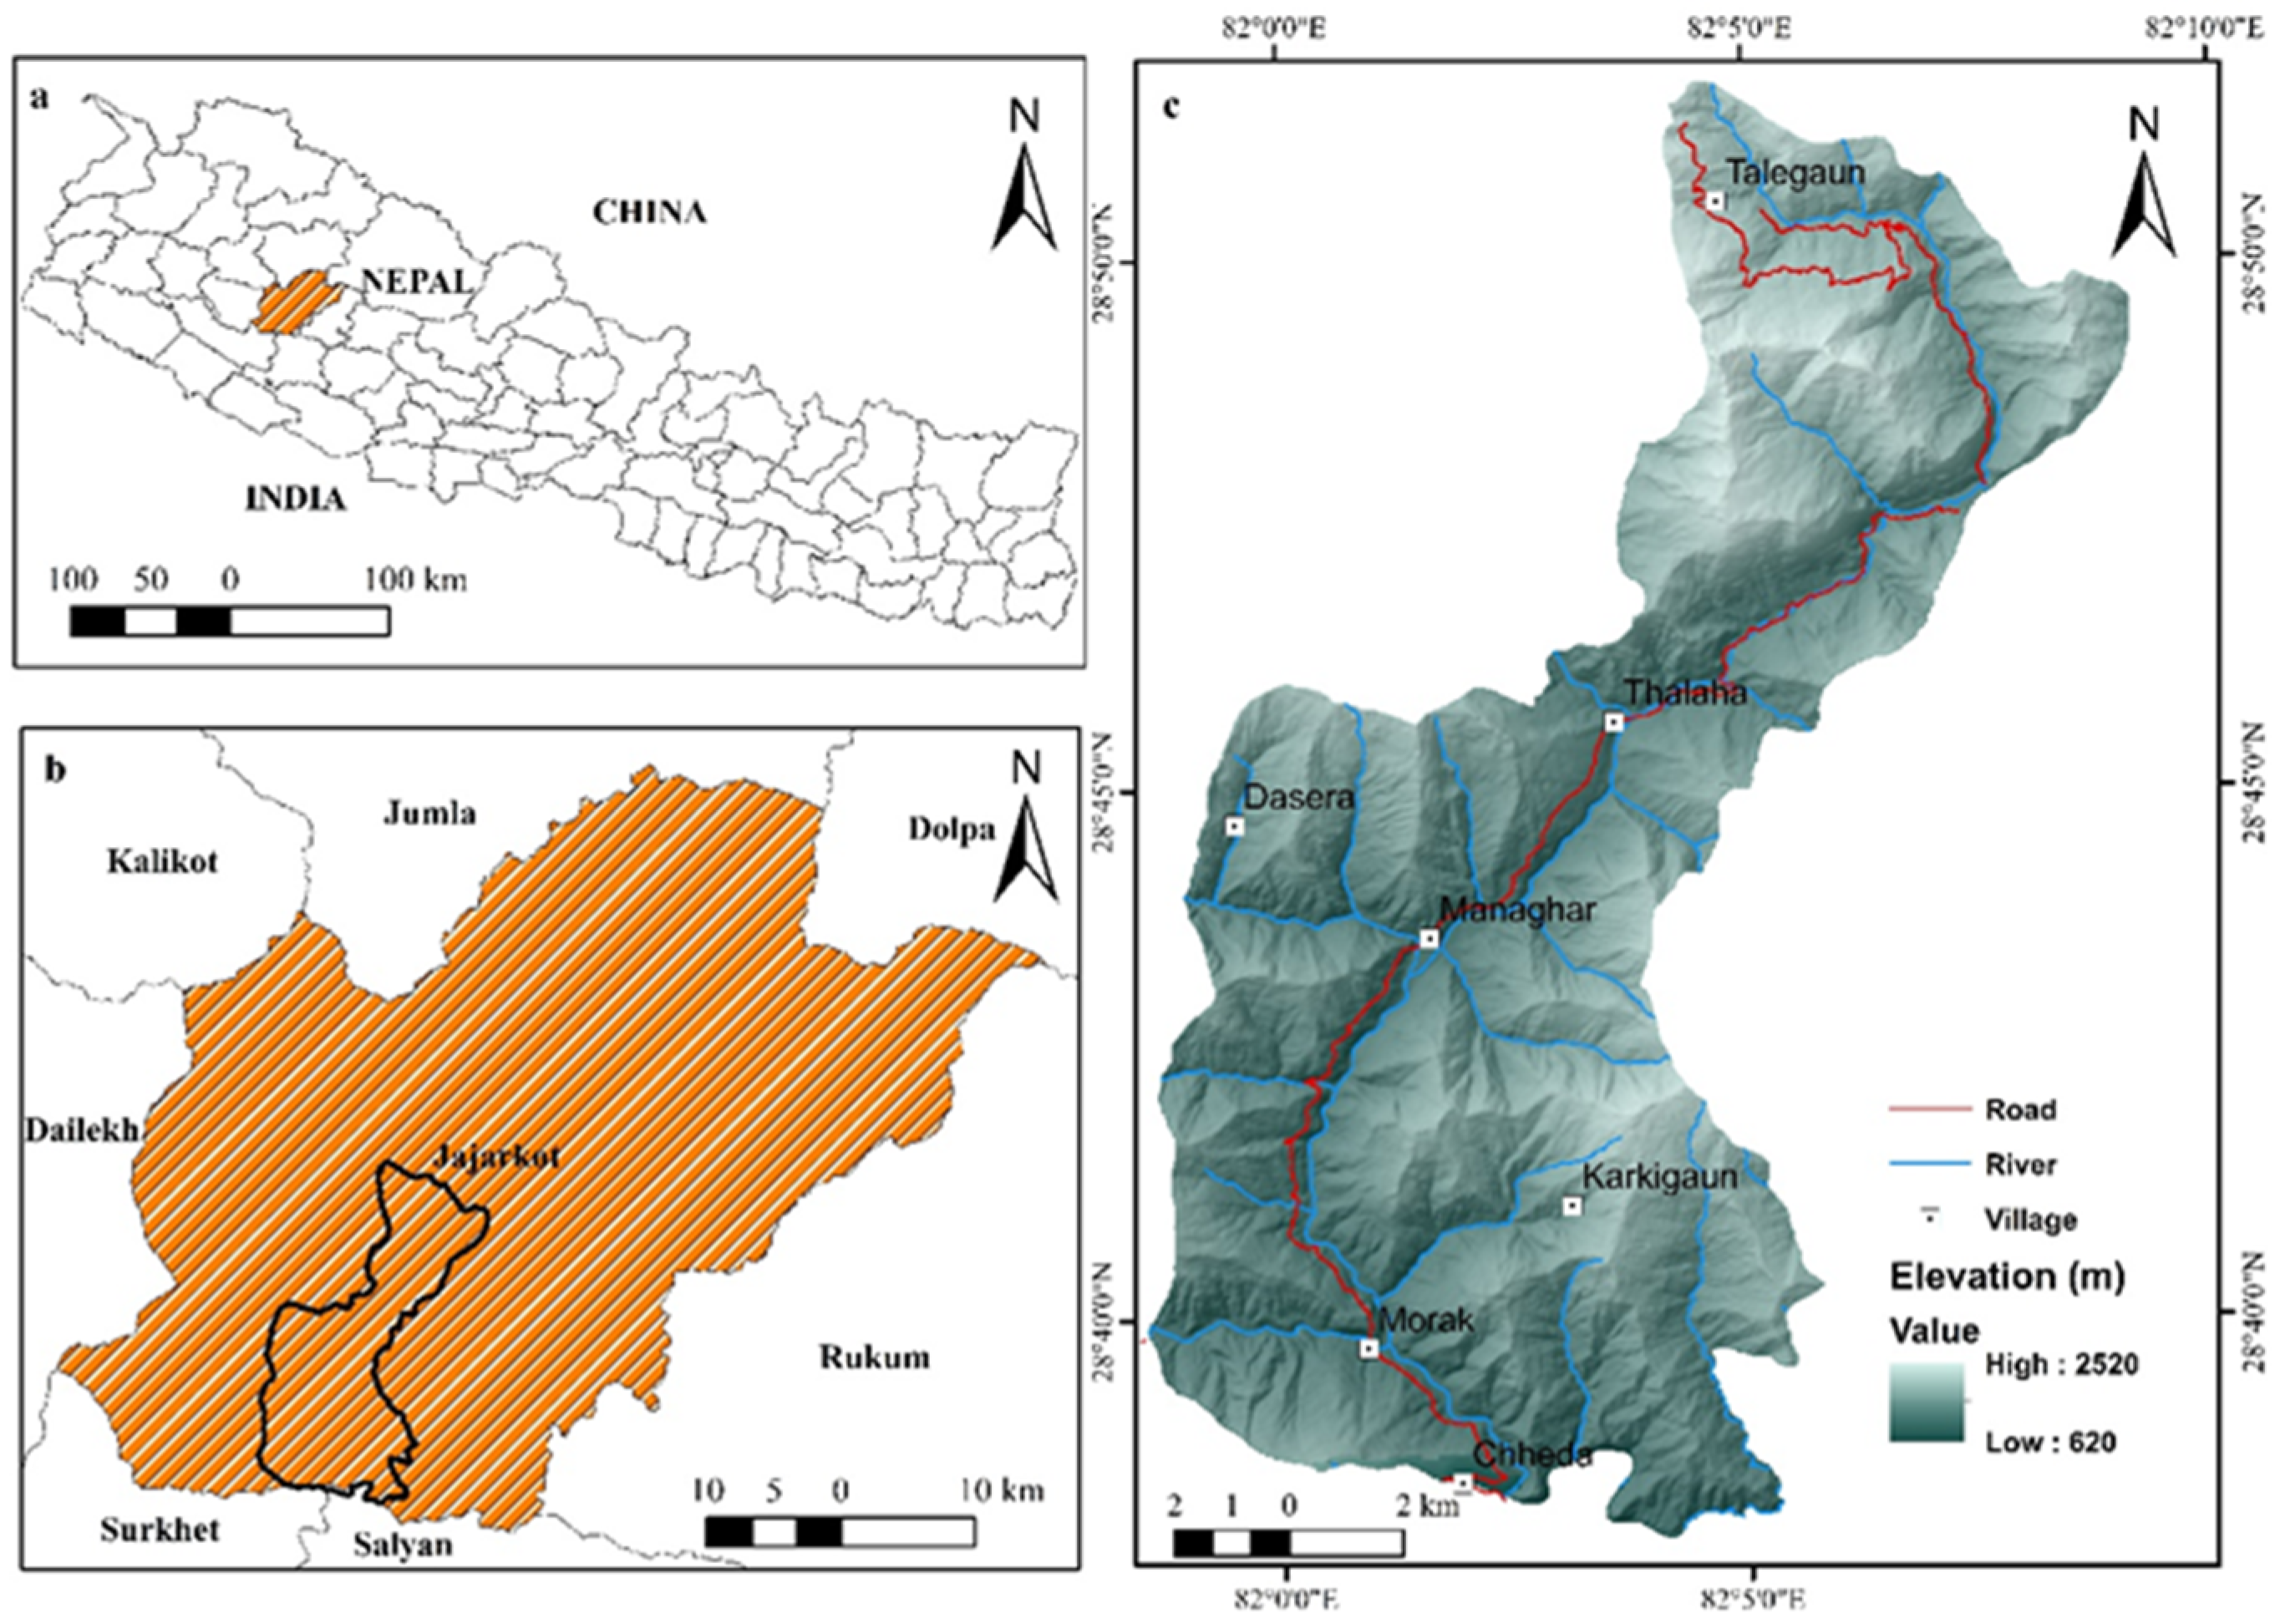
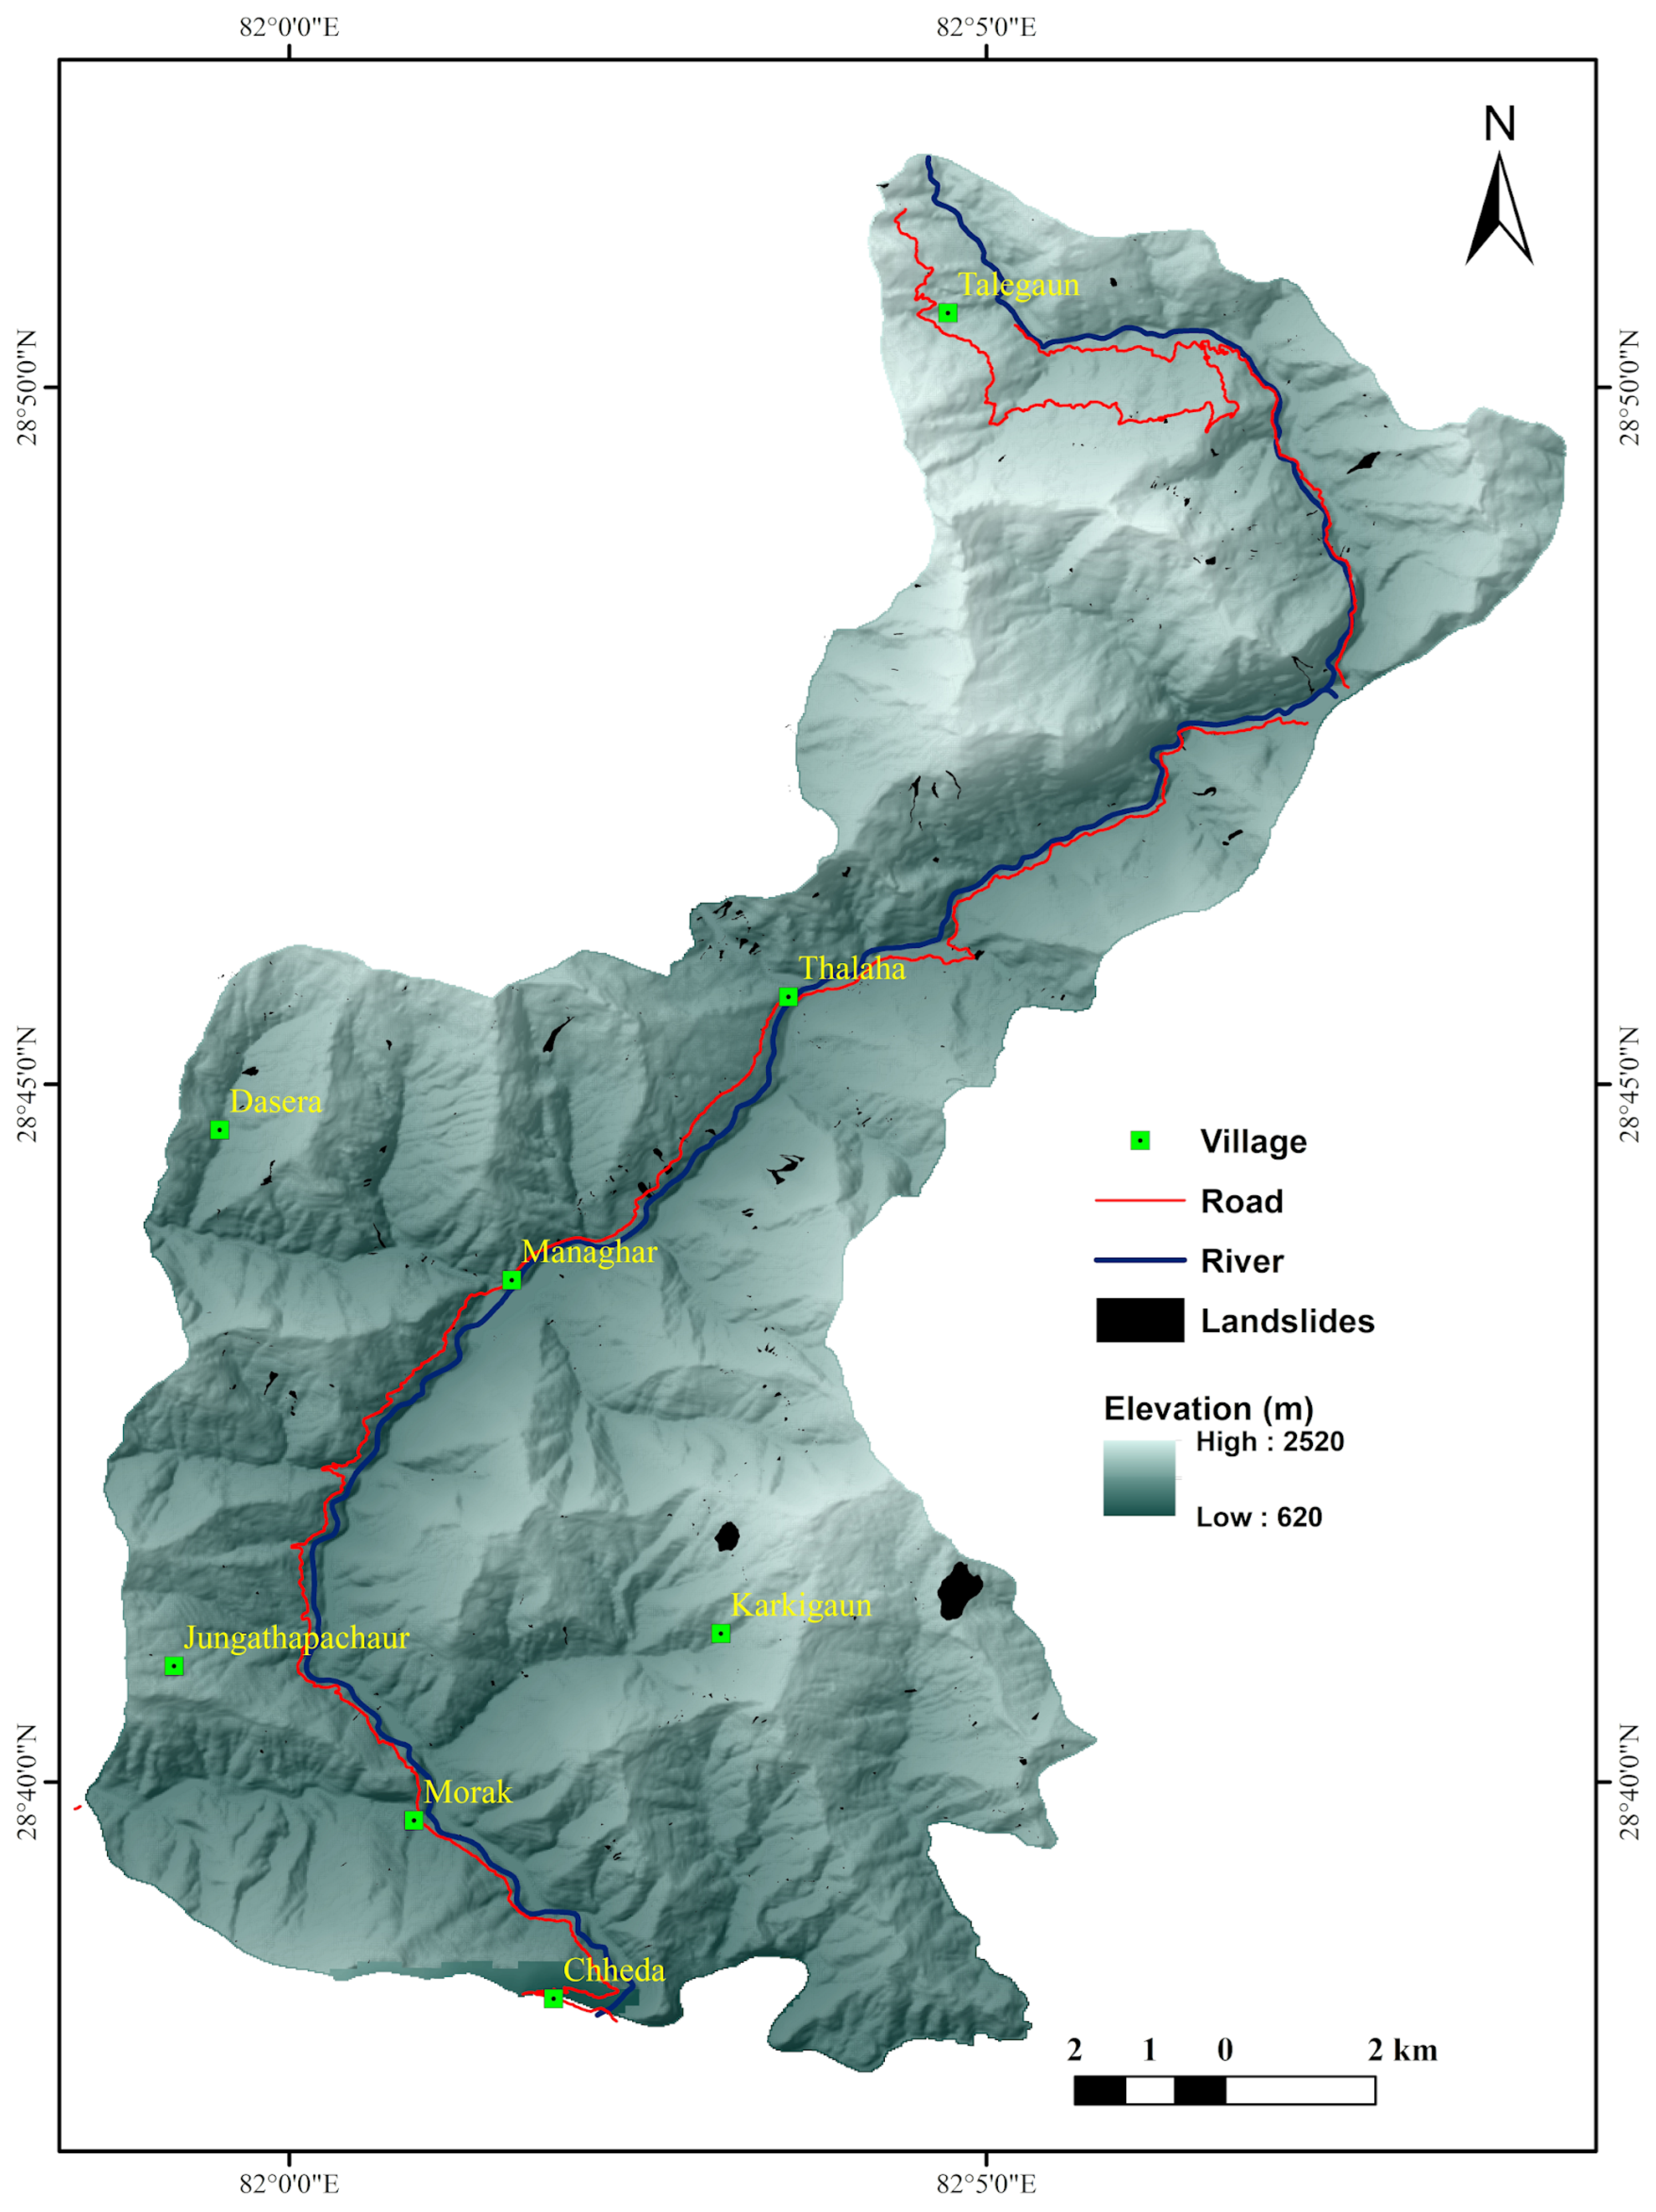
2. Study Area
3. Methodology
3.1. Data Acquisition and Data Processing
3.2. Landslide Susceptibility Modeling
4. Results
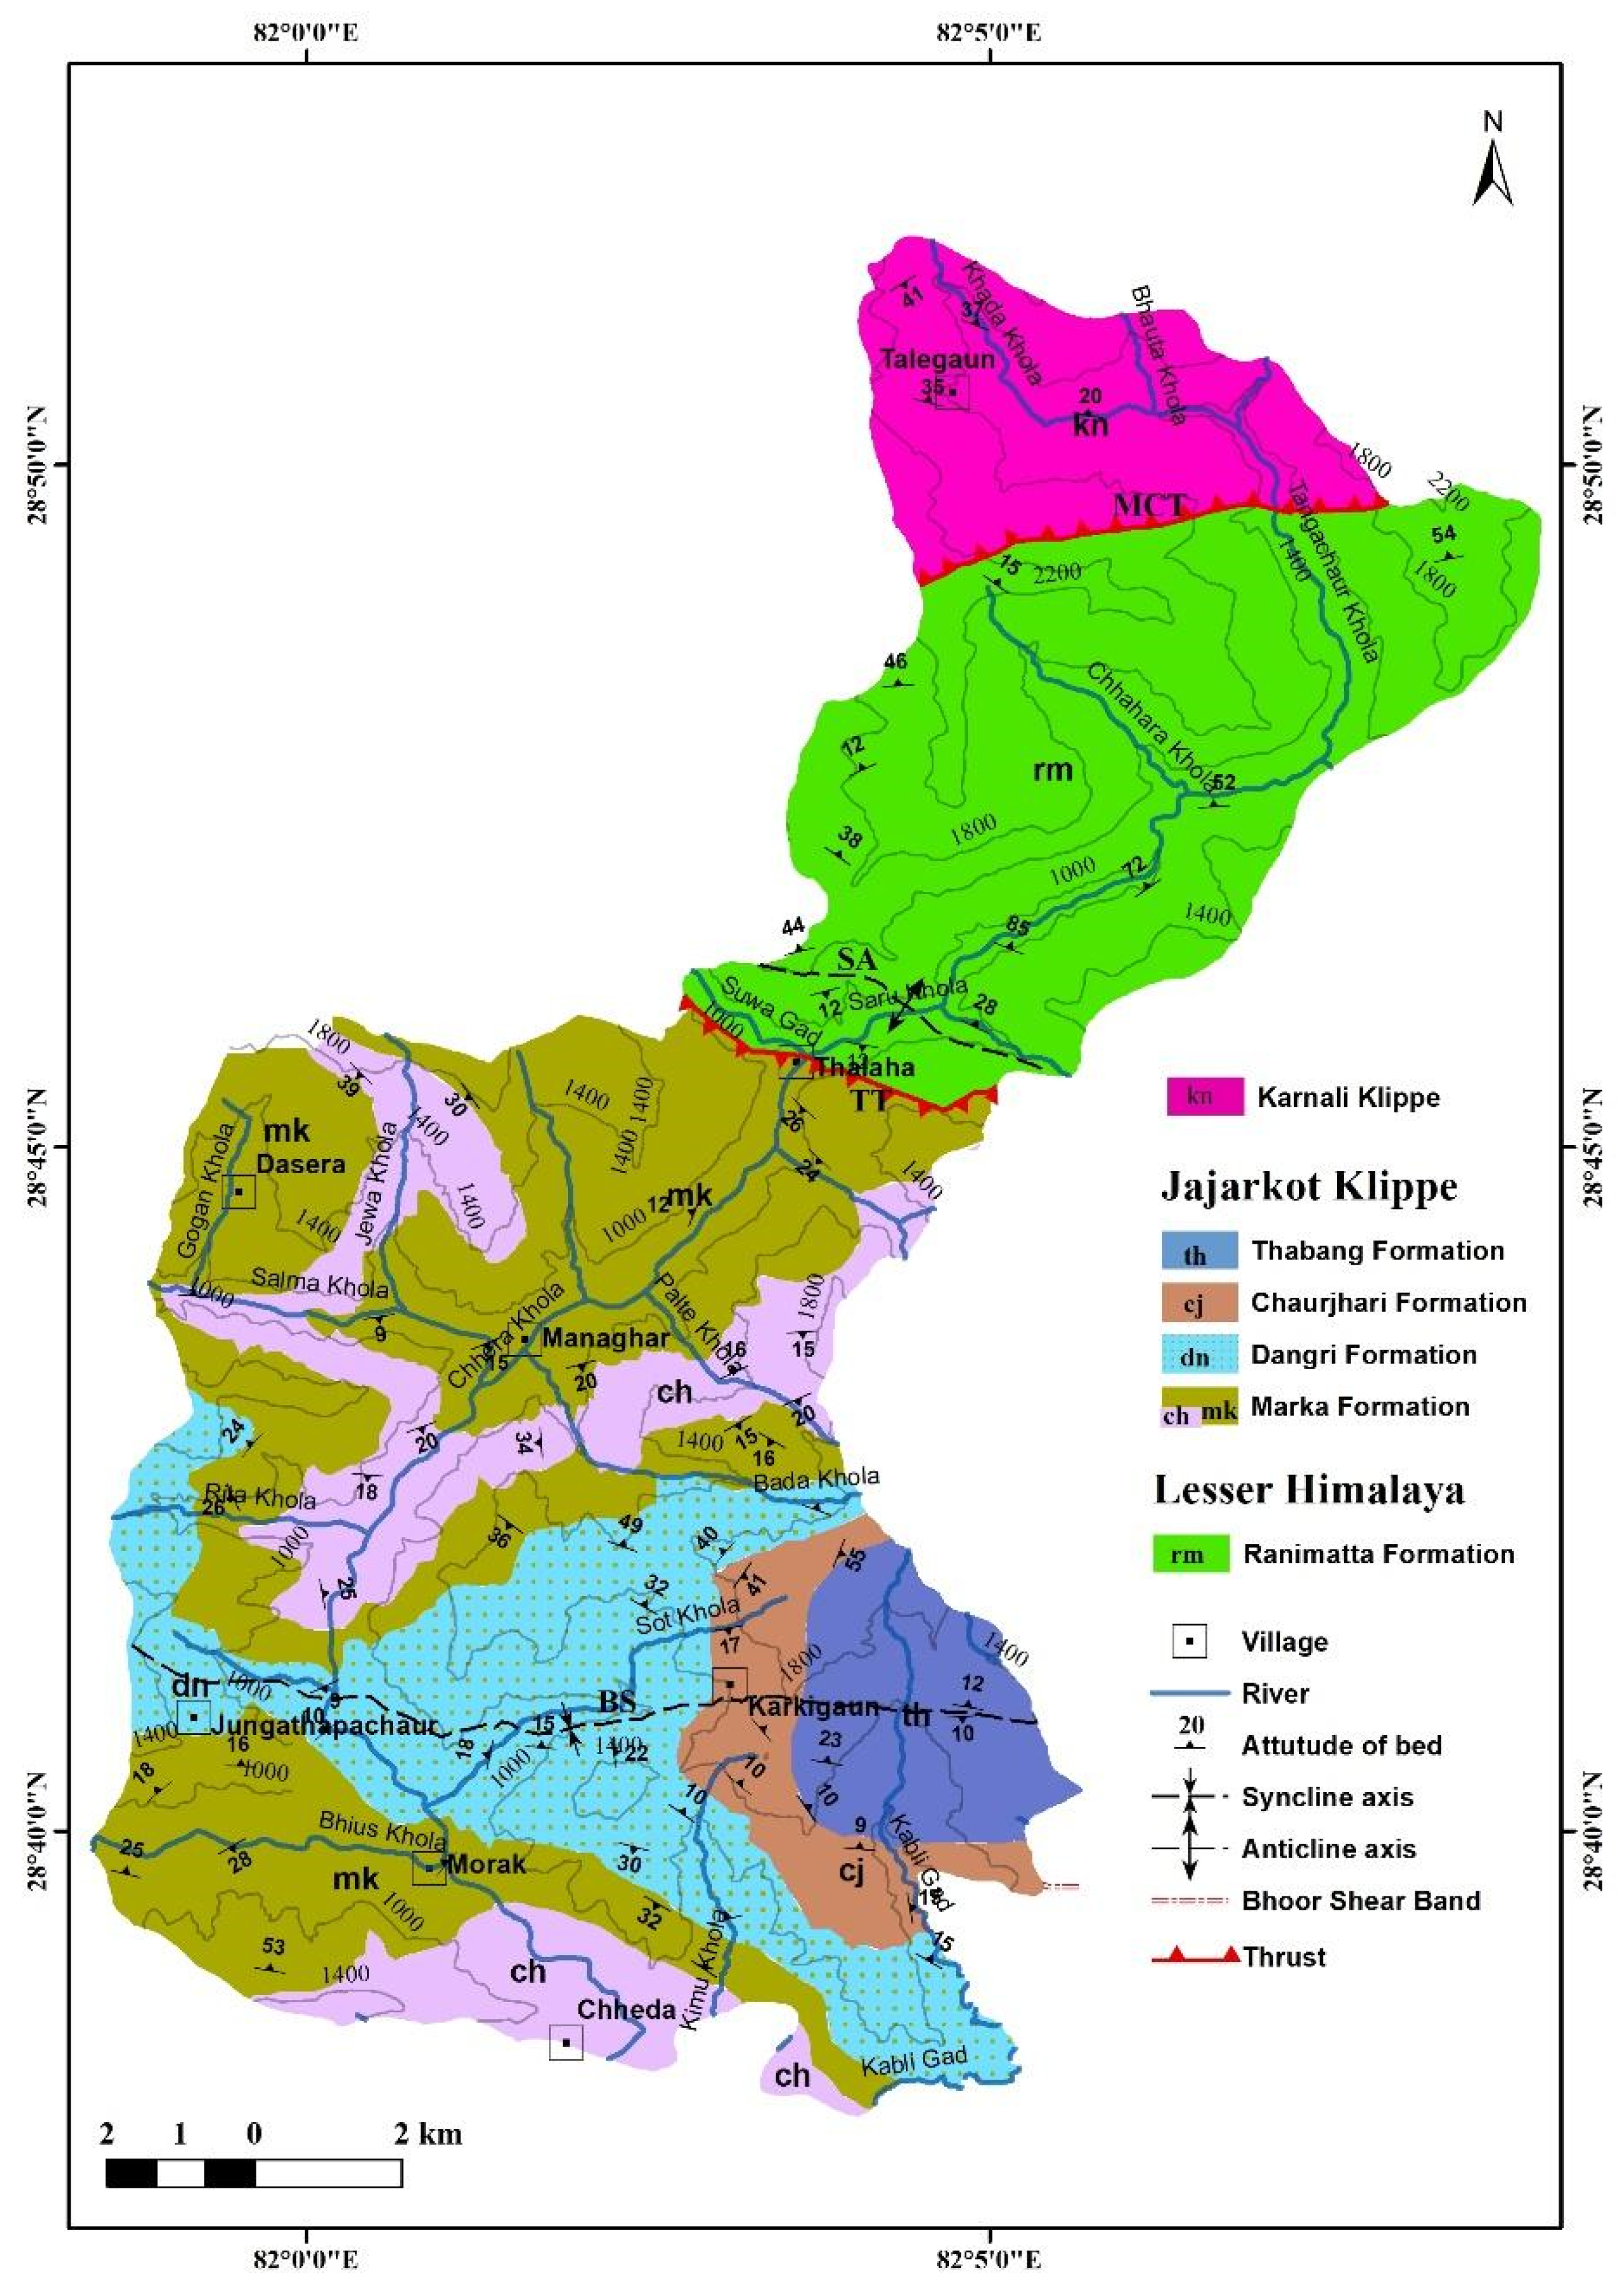
4.1. Geology
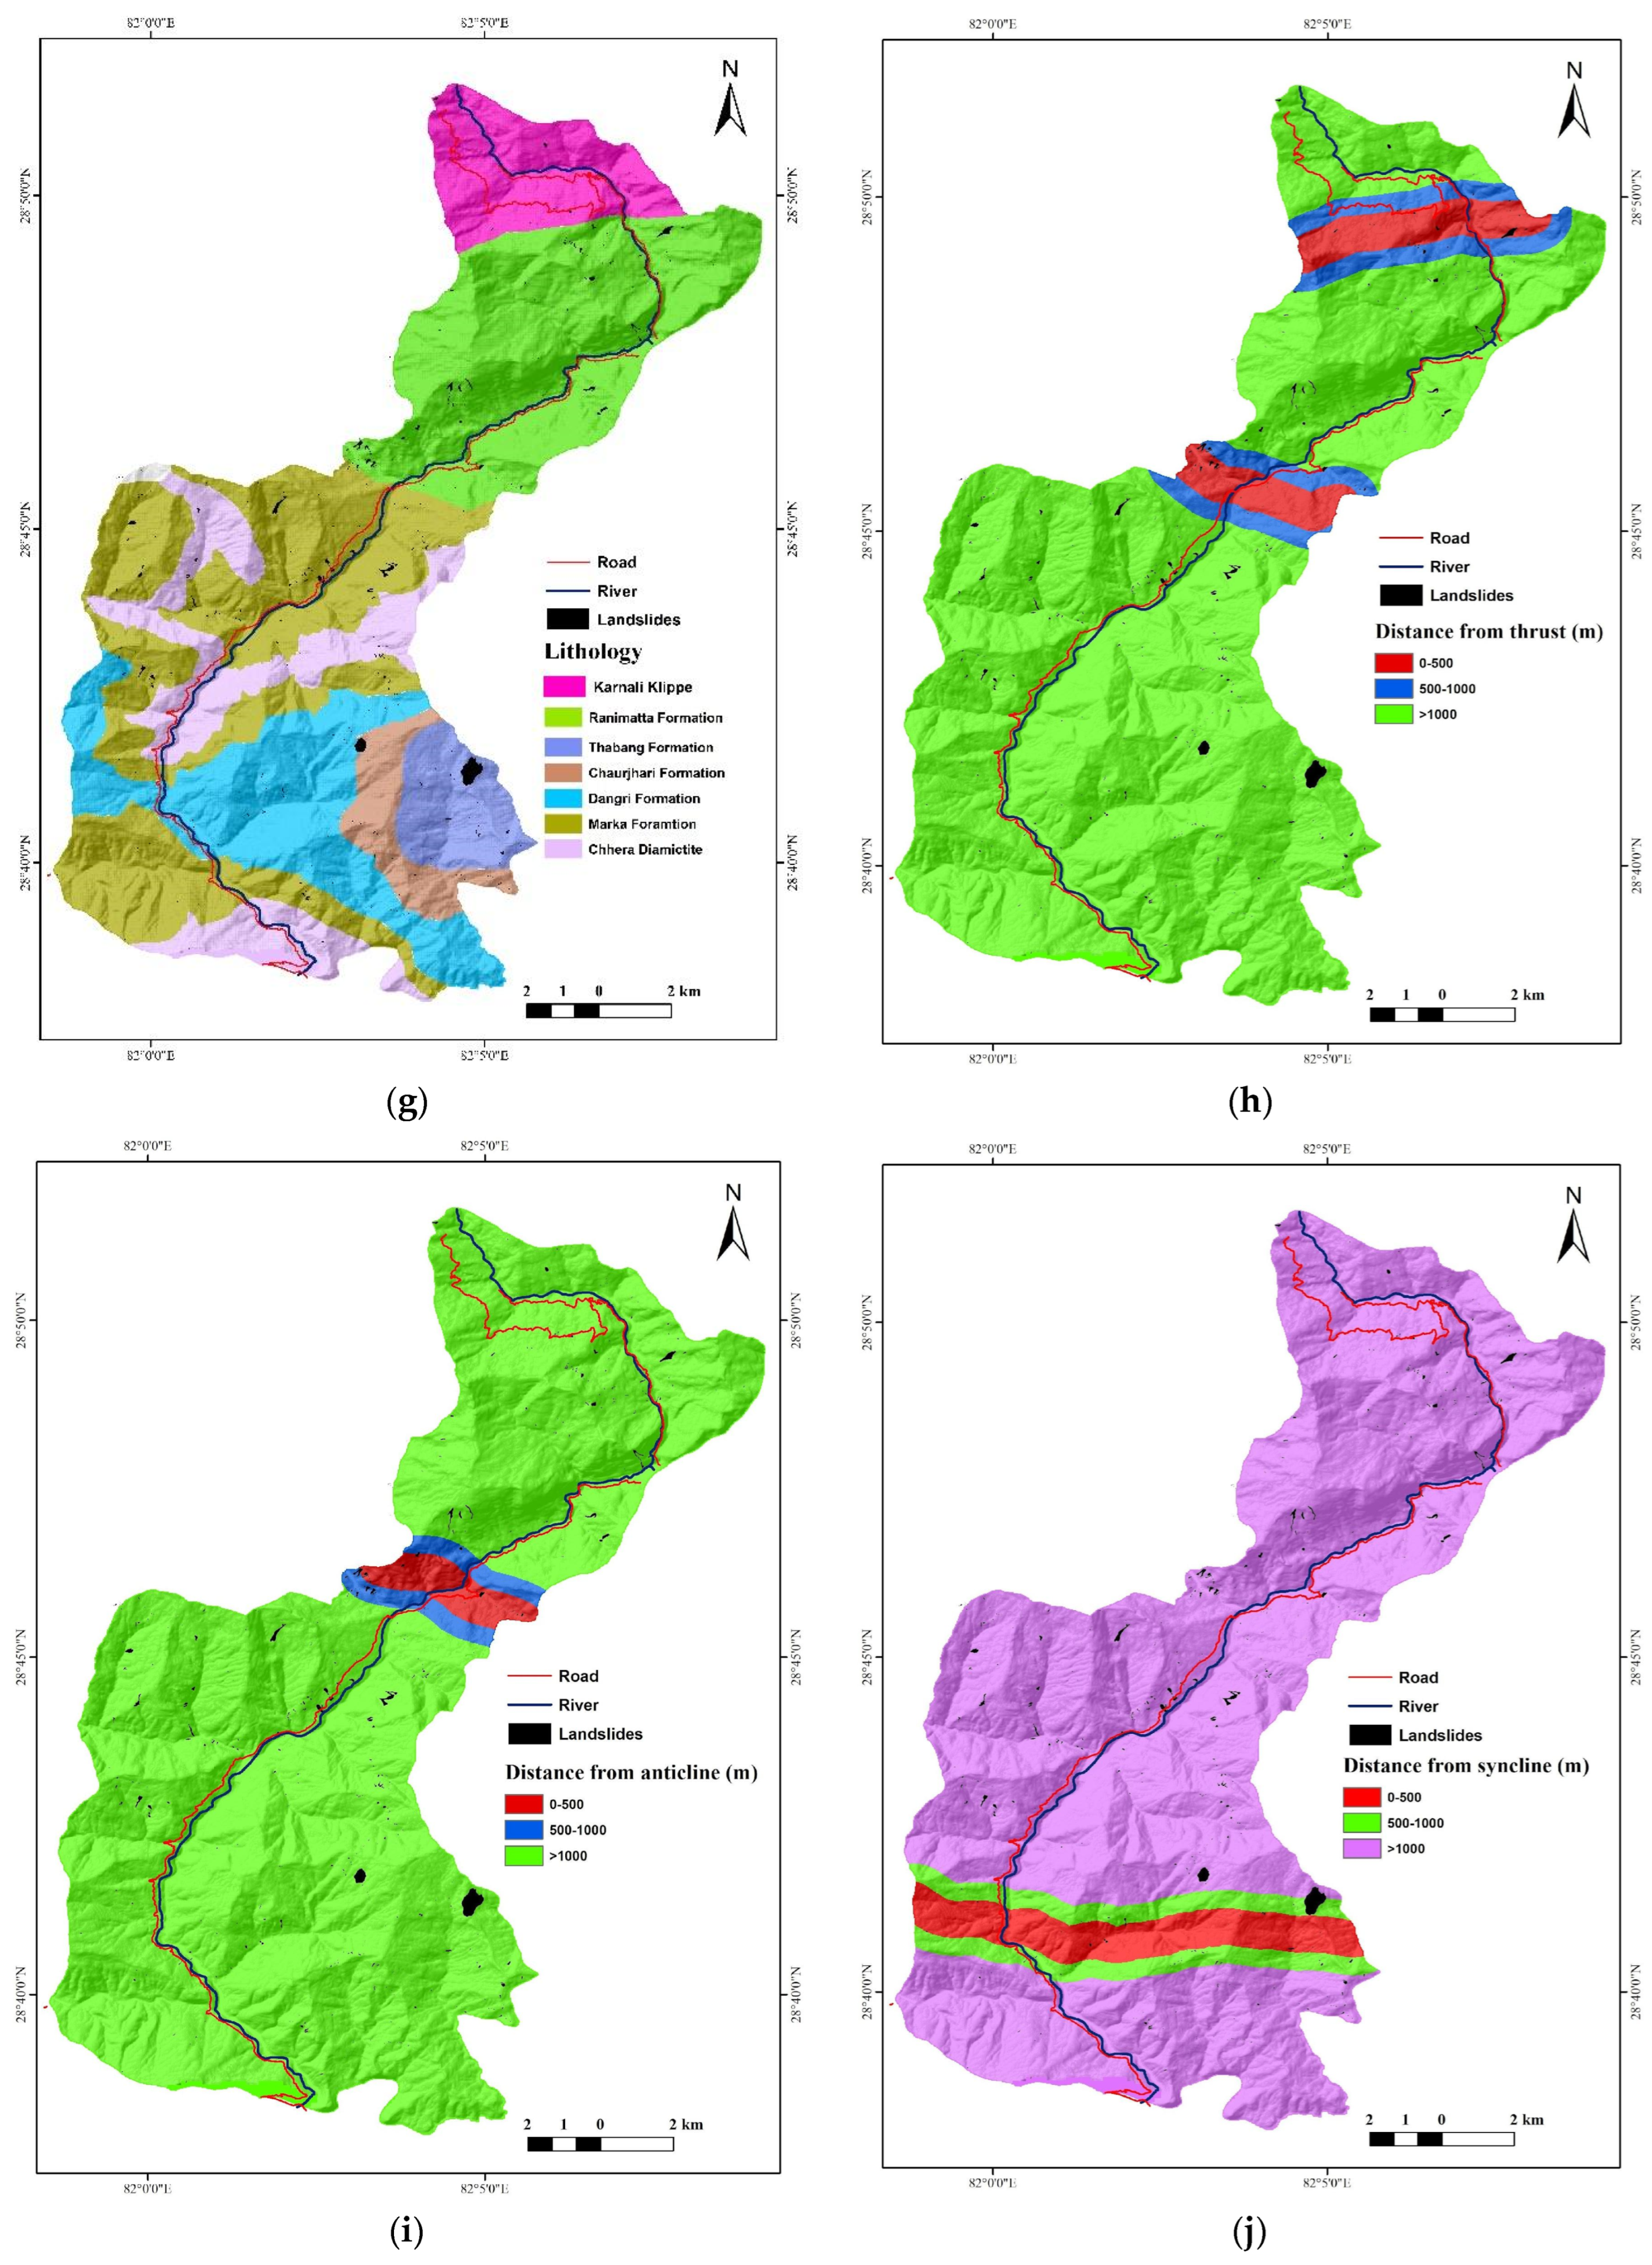
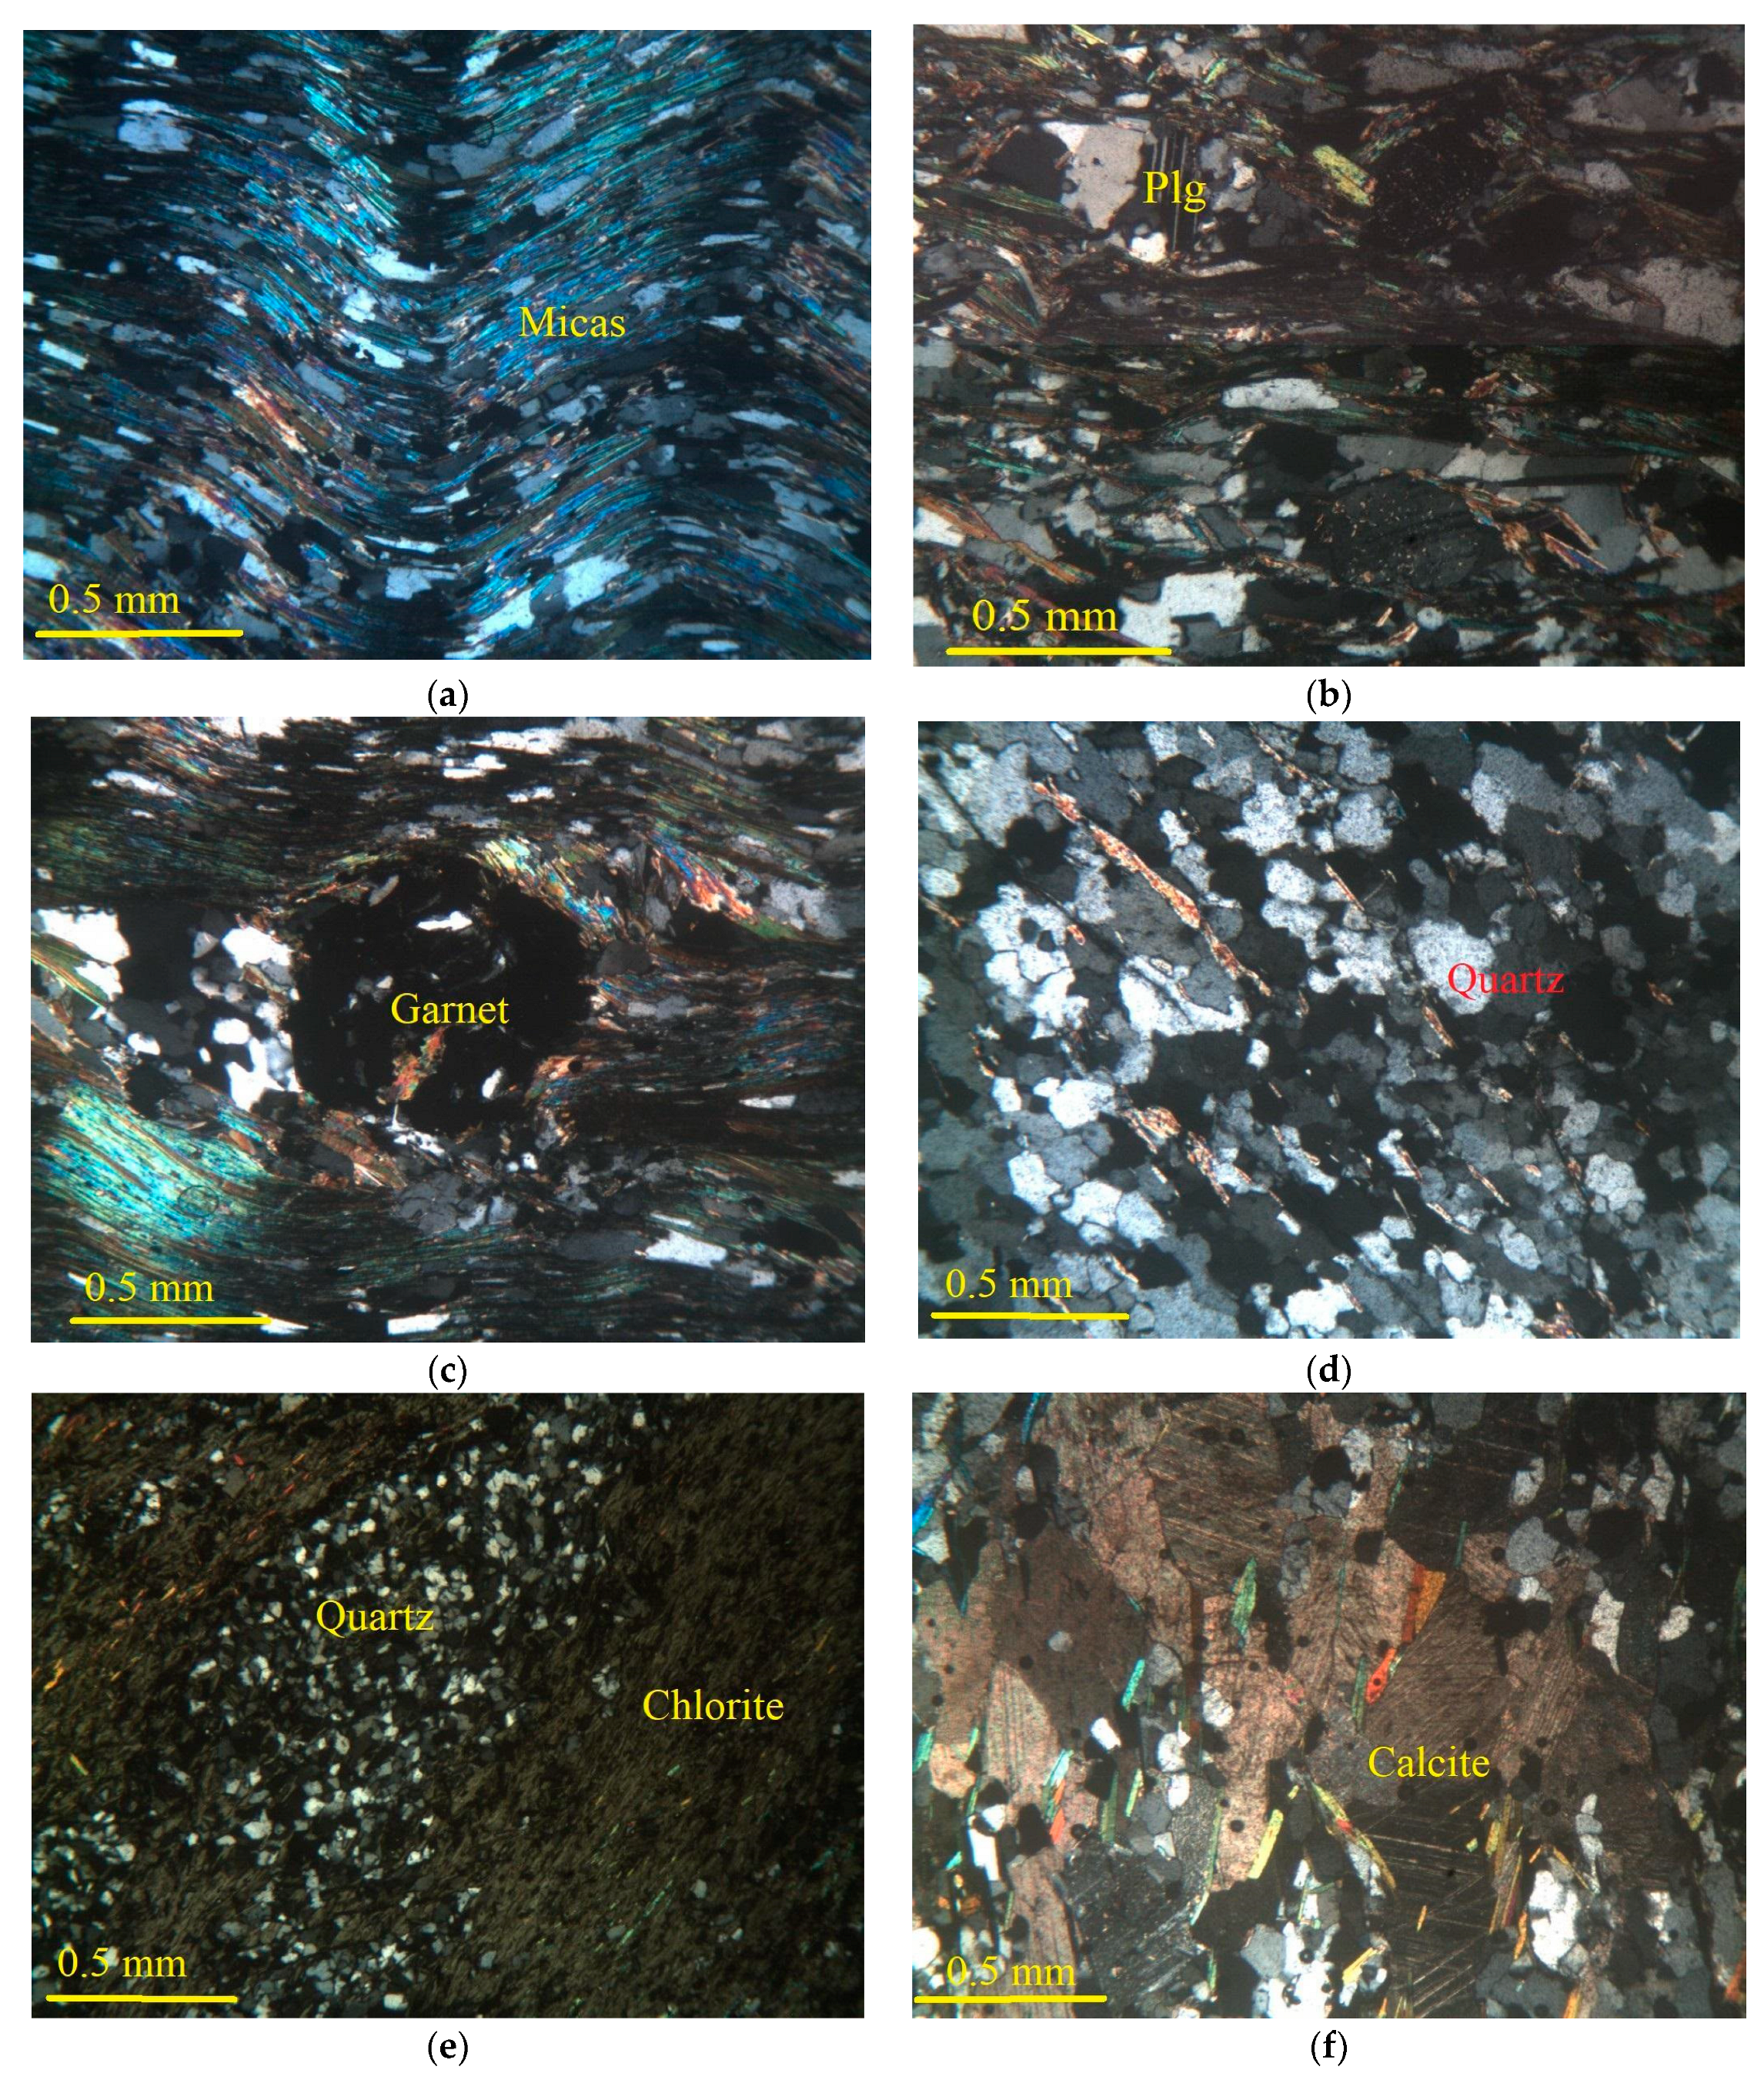
4.1.1. Lithostratigraphy
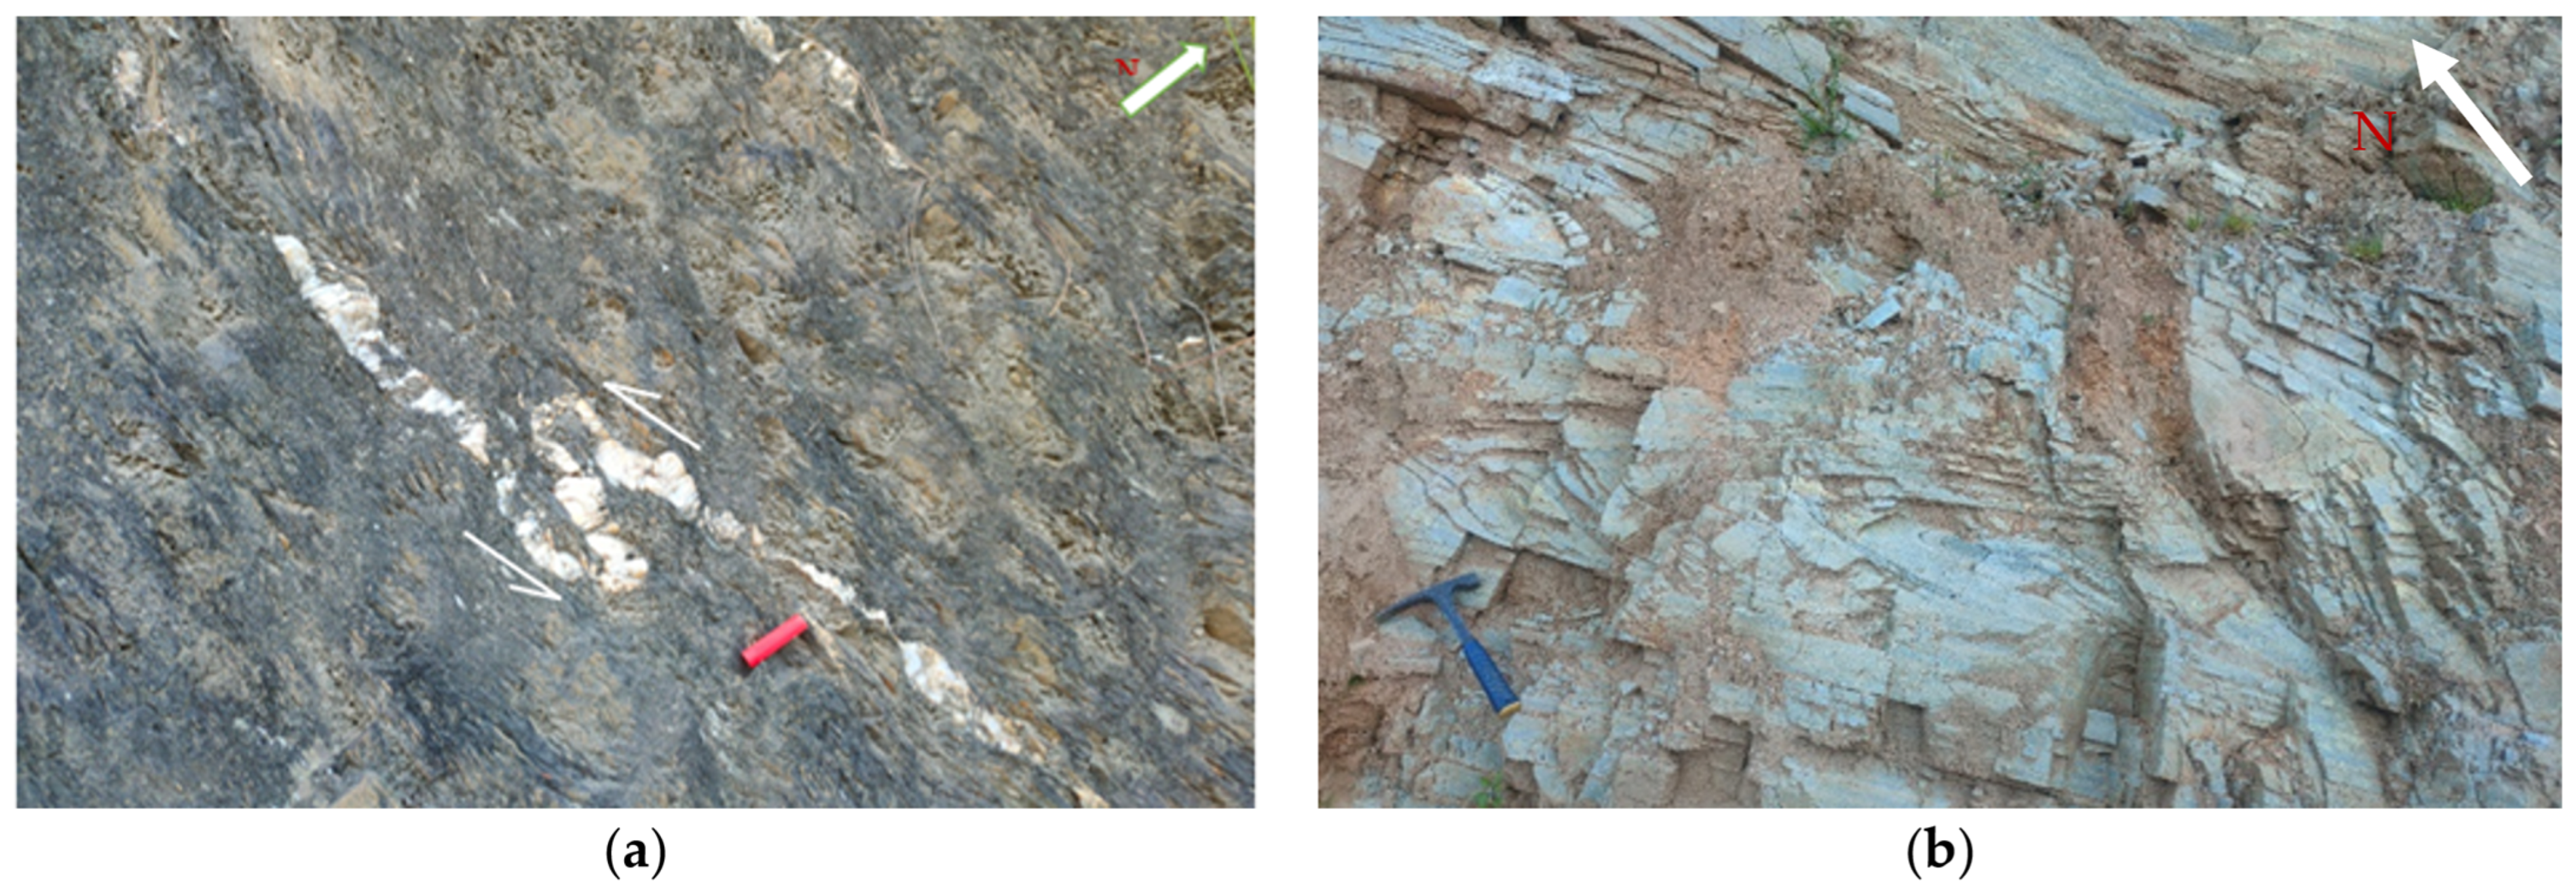
4.1.2. Structures
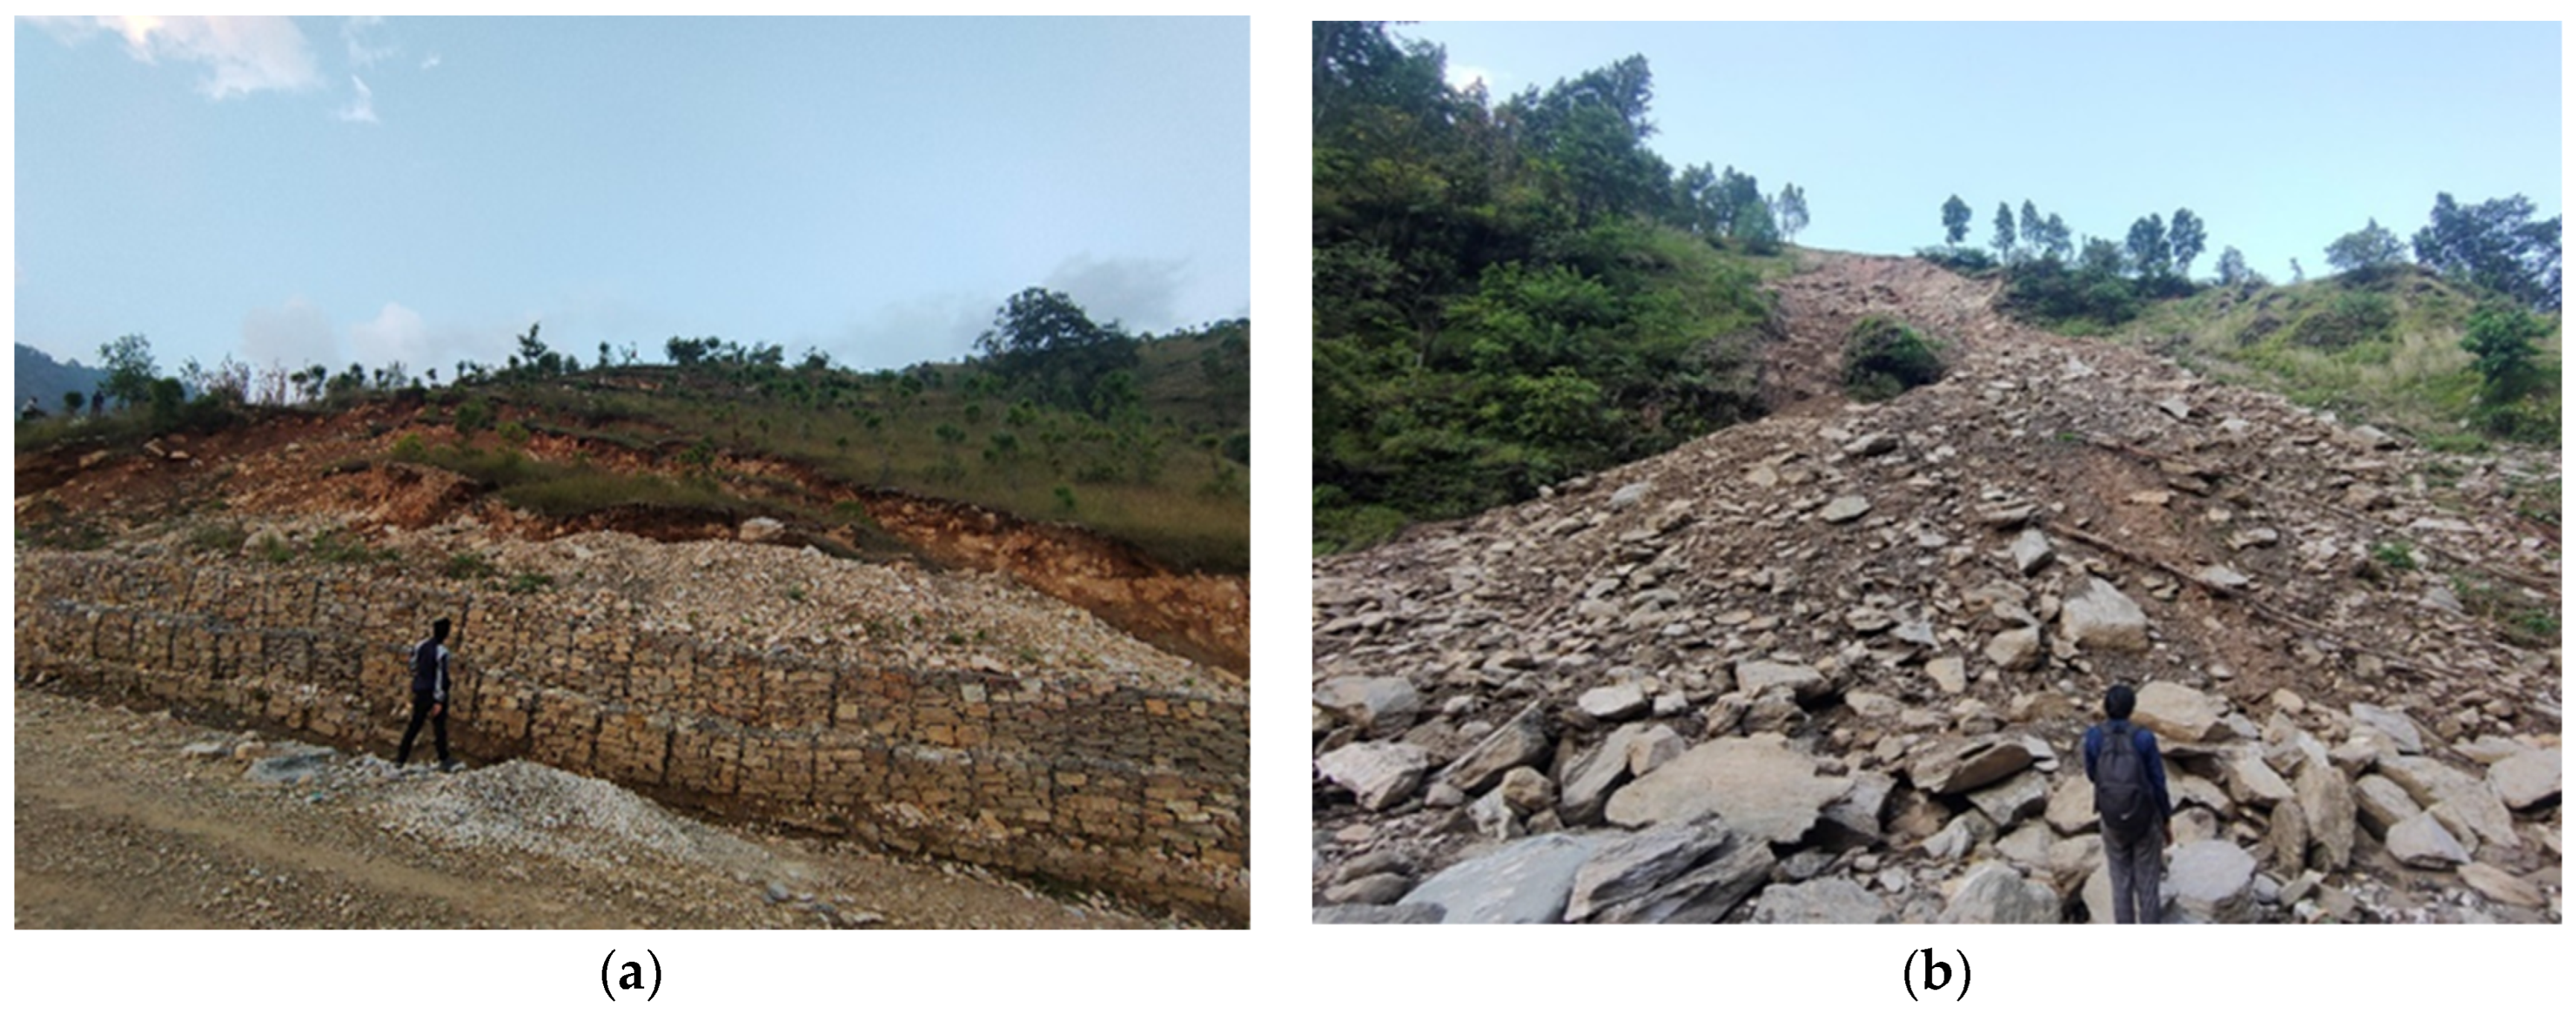
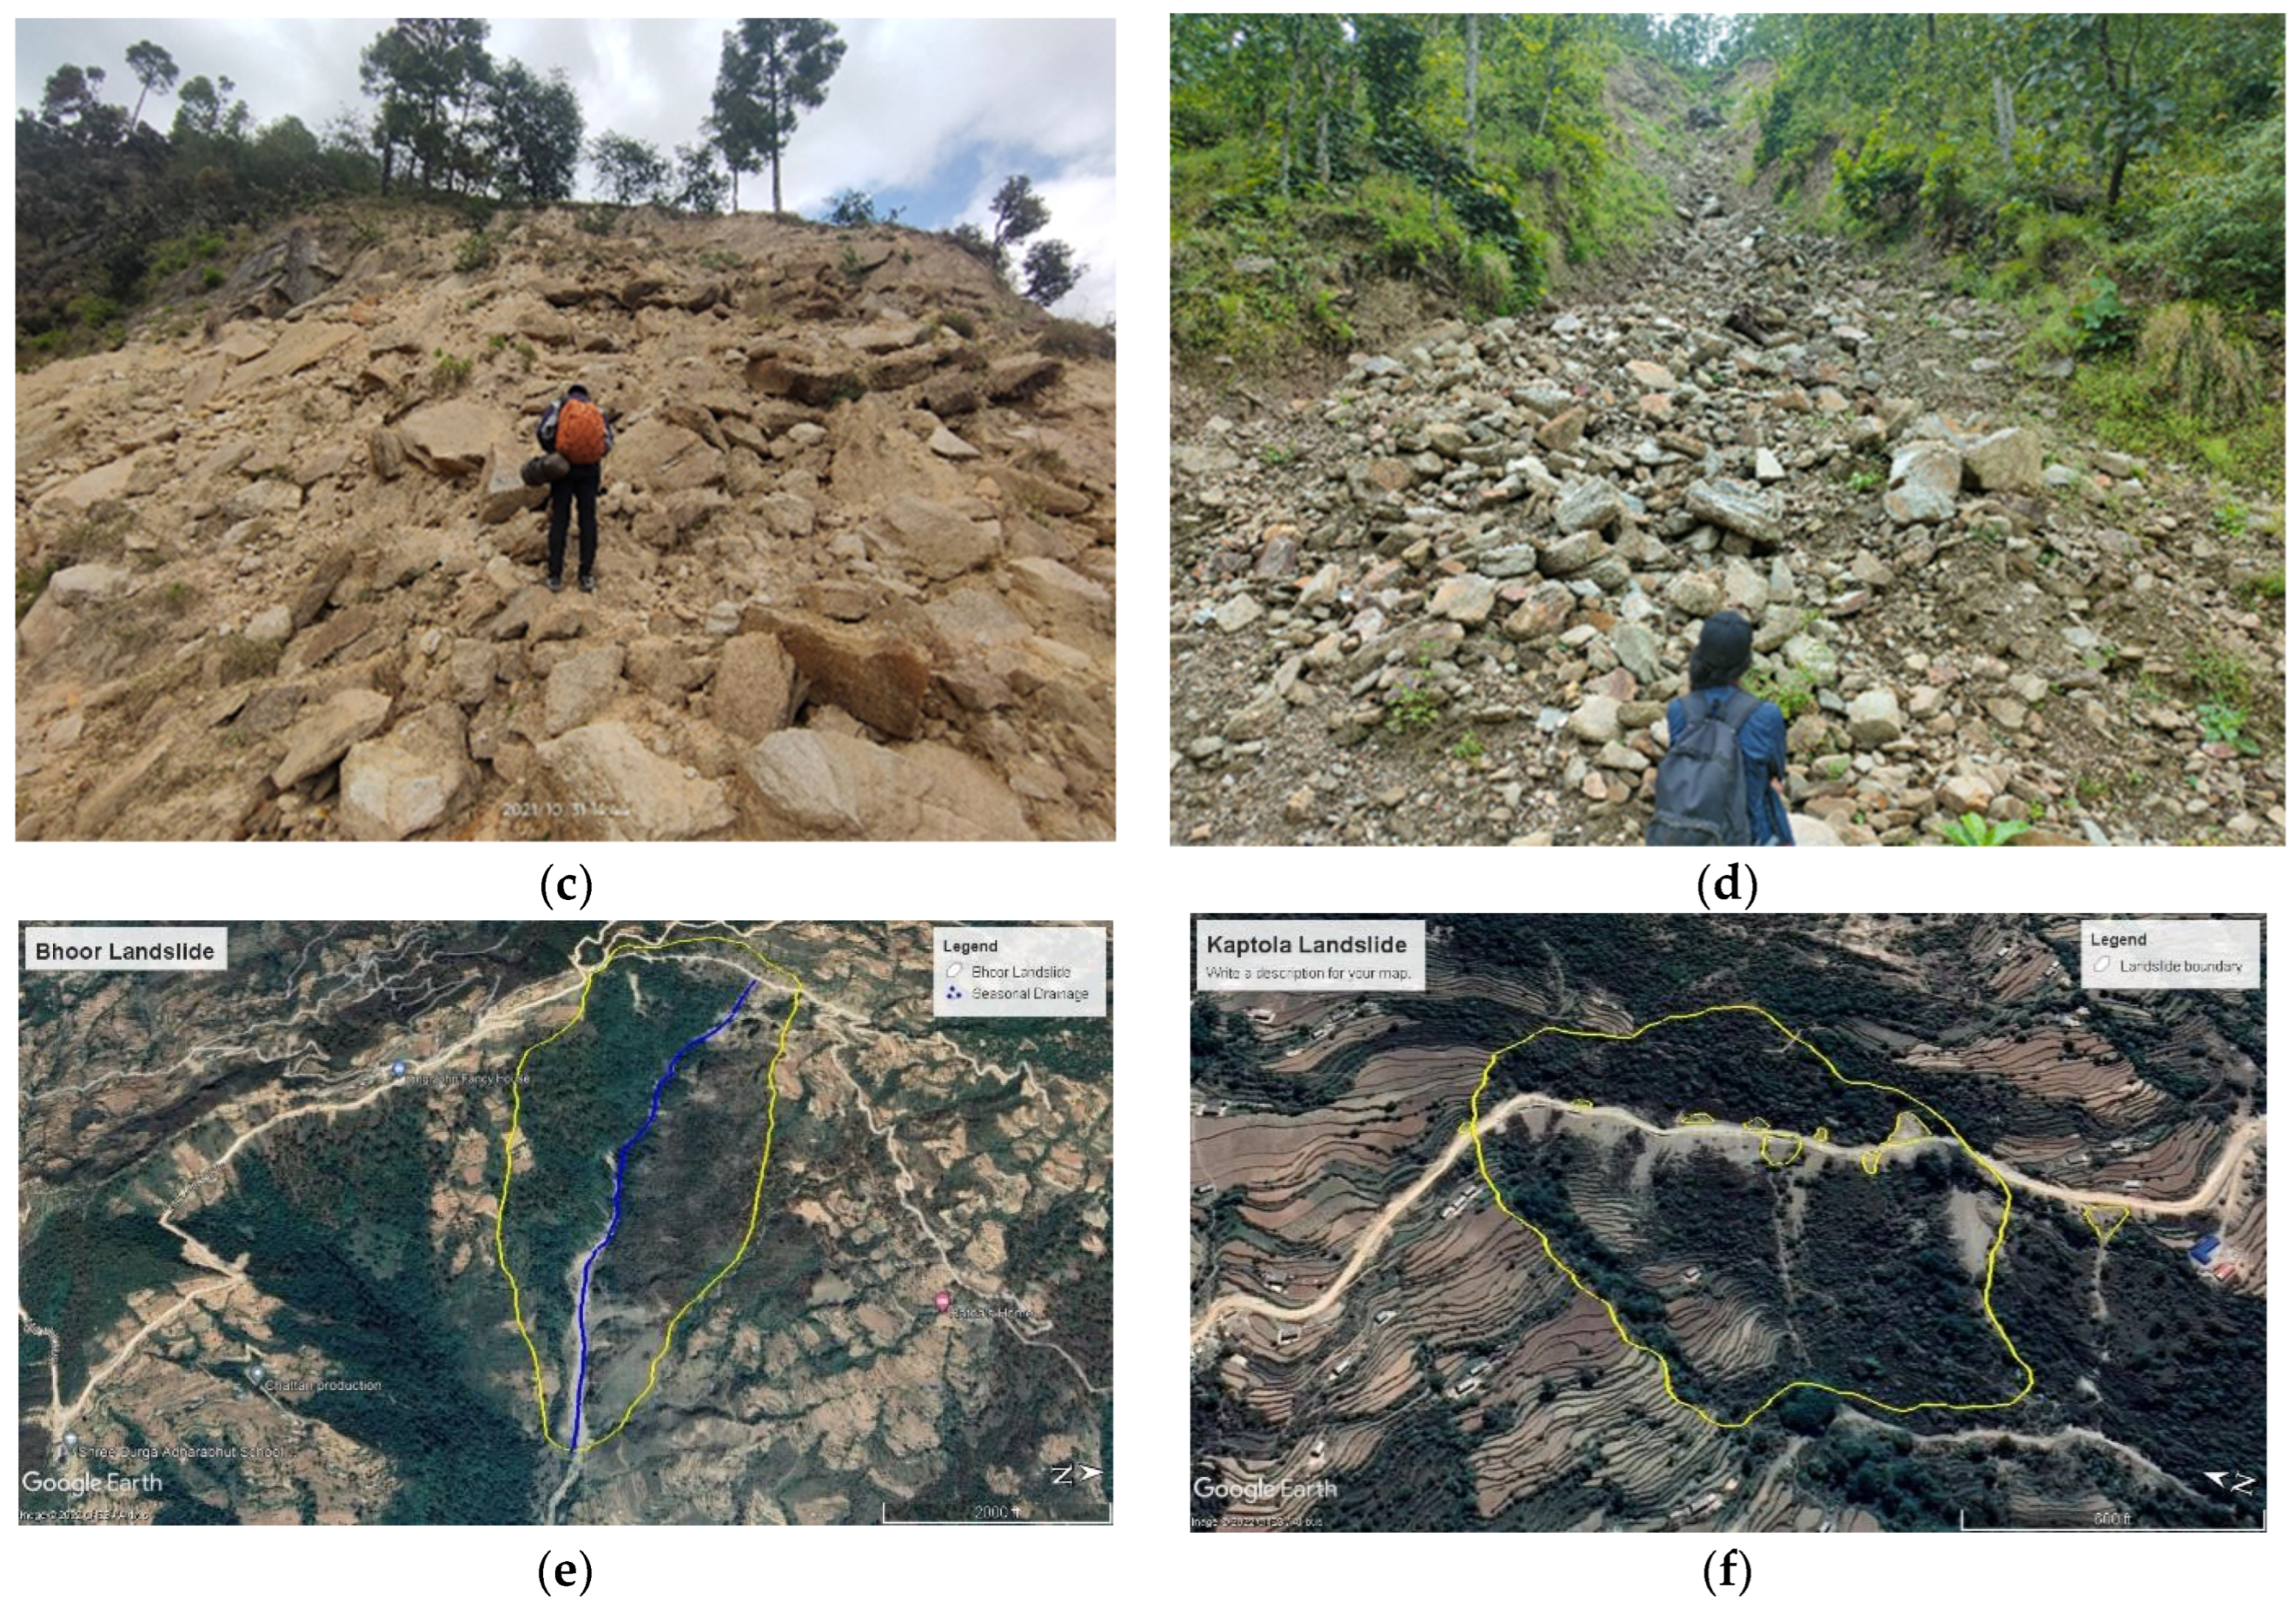
4.2. Landslide Occurrence Pattern and Landslide Inventory
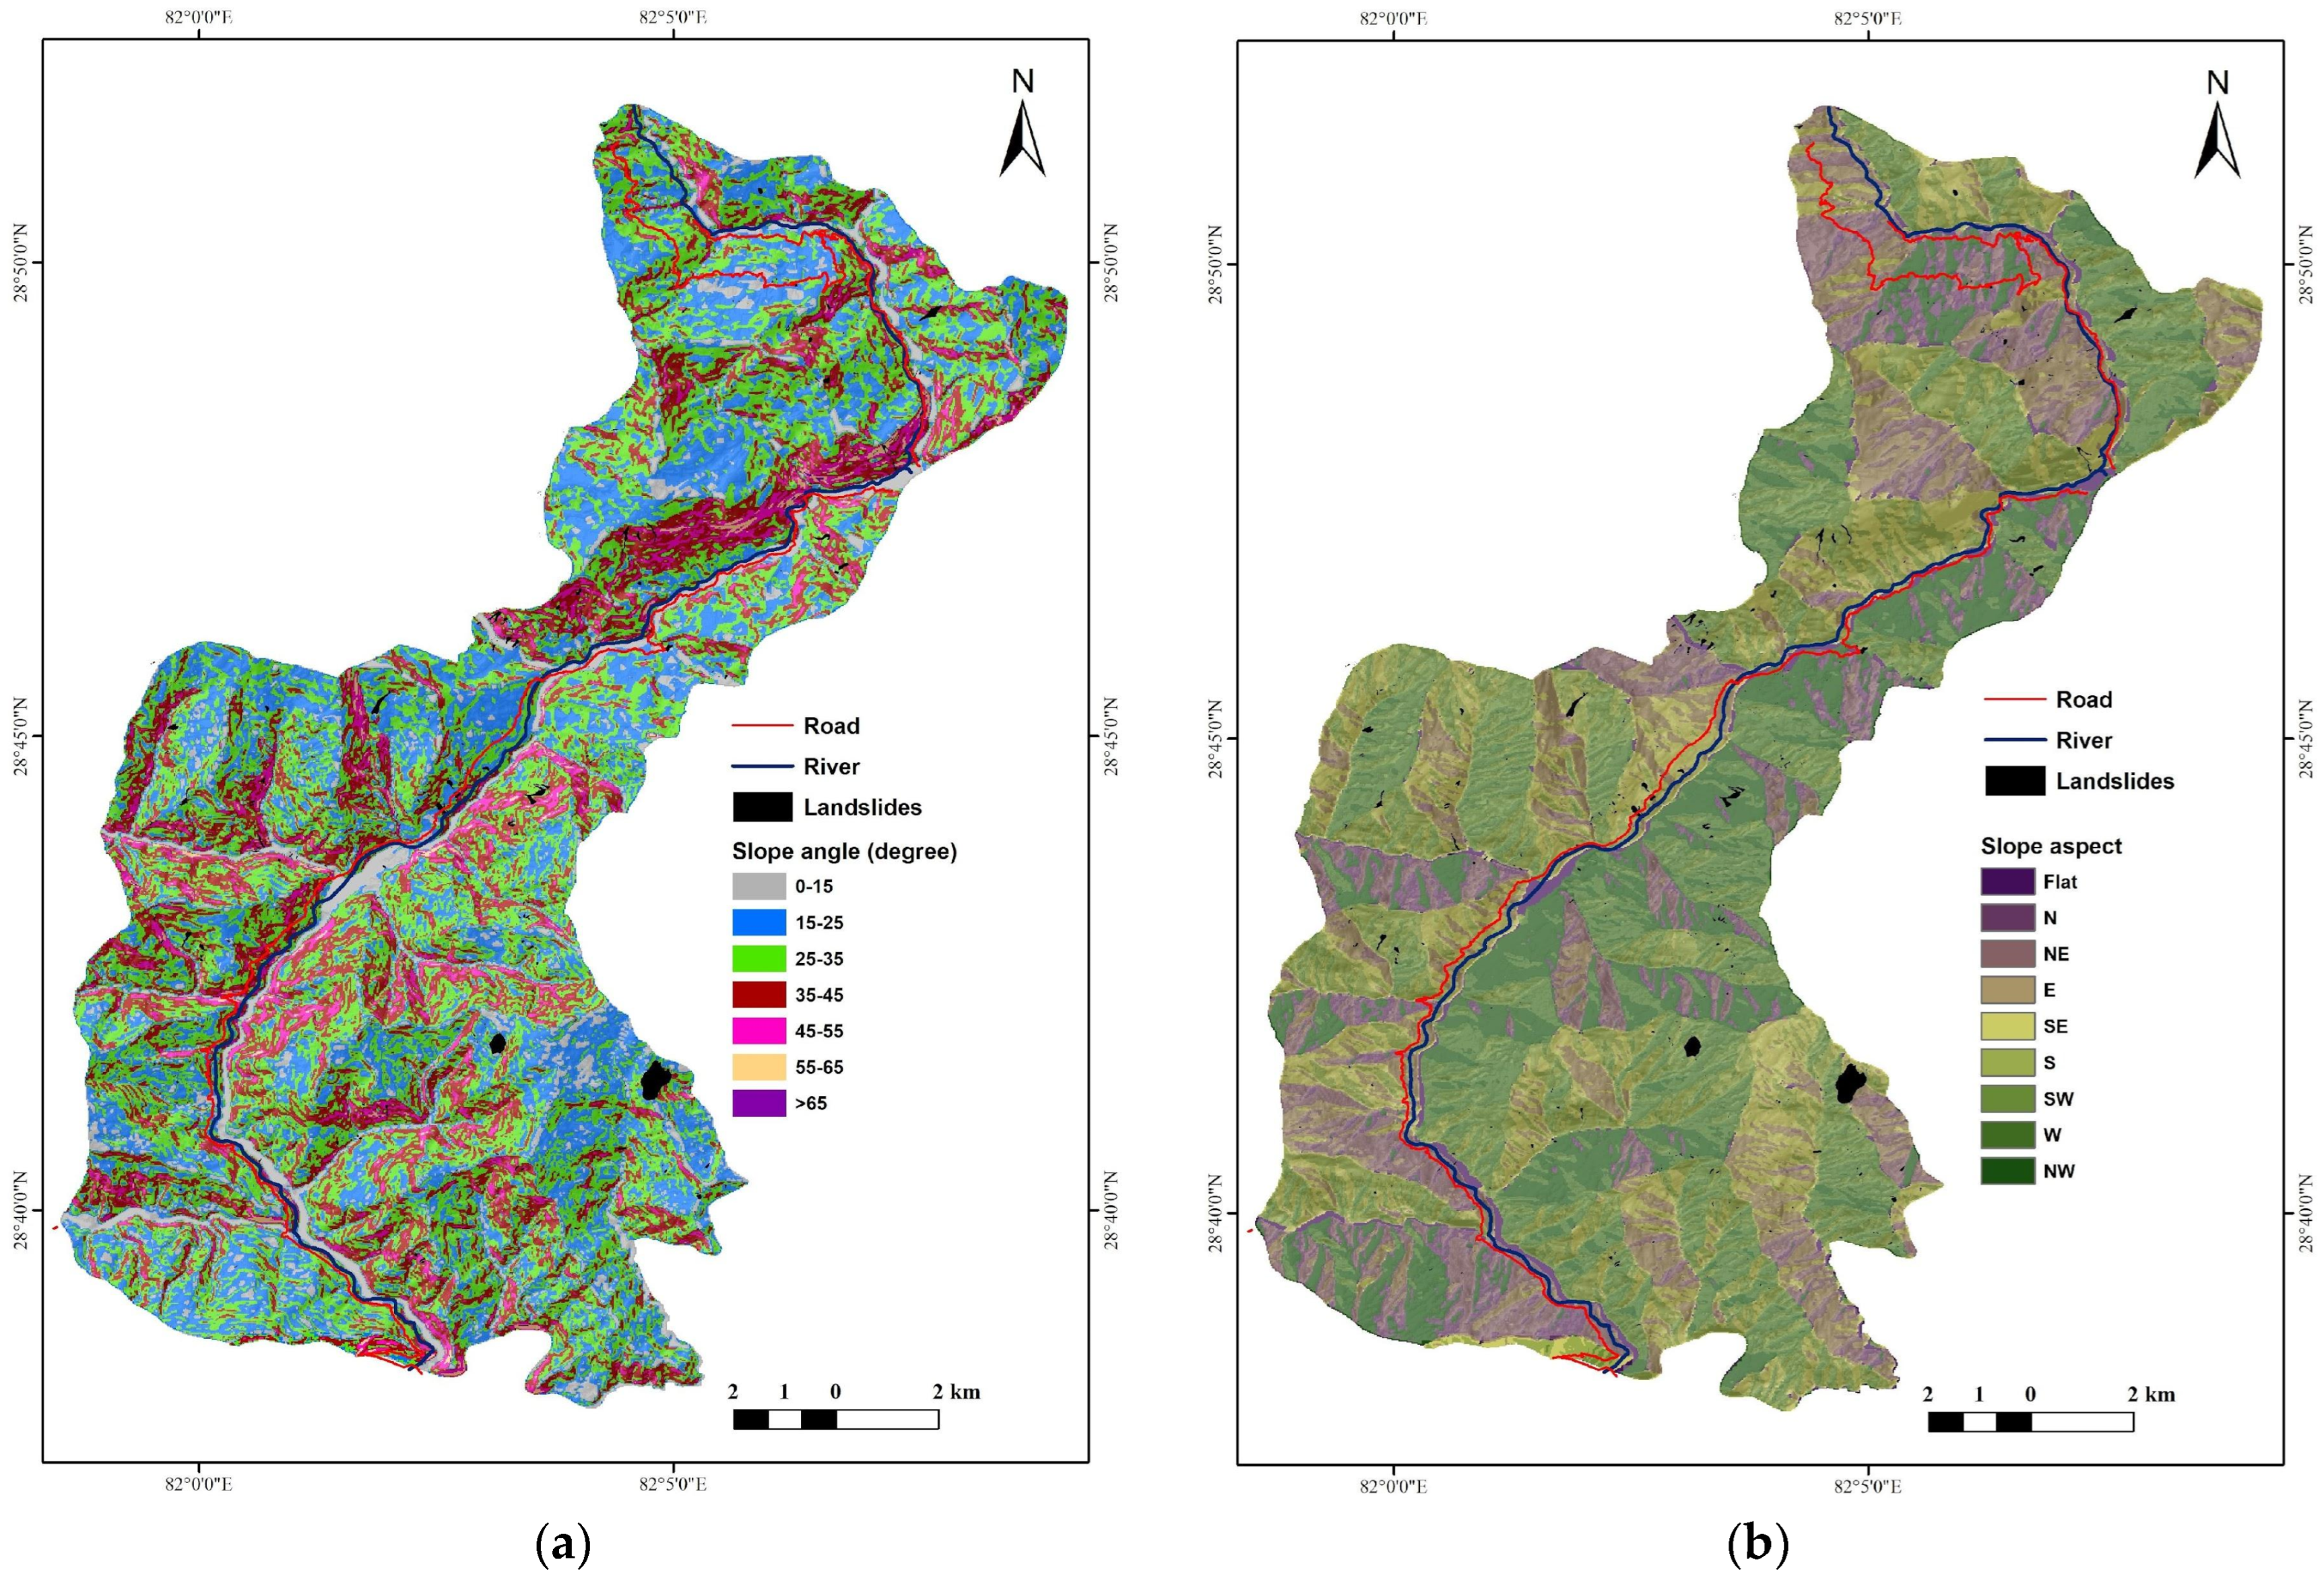
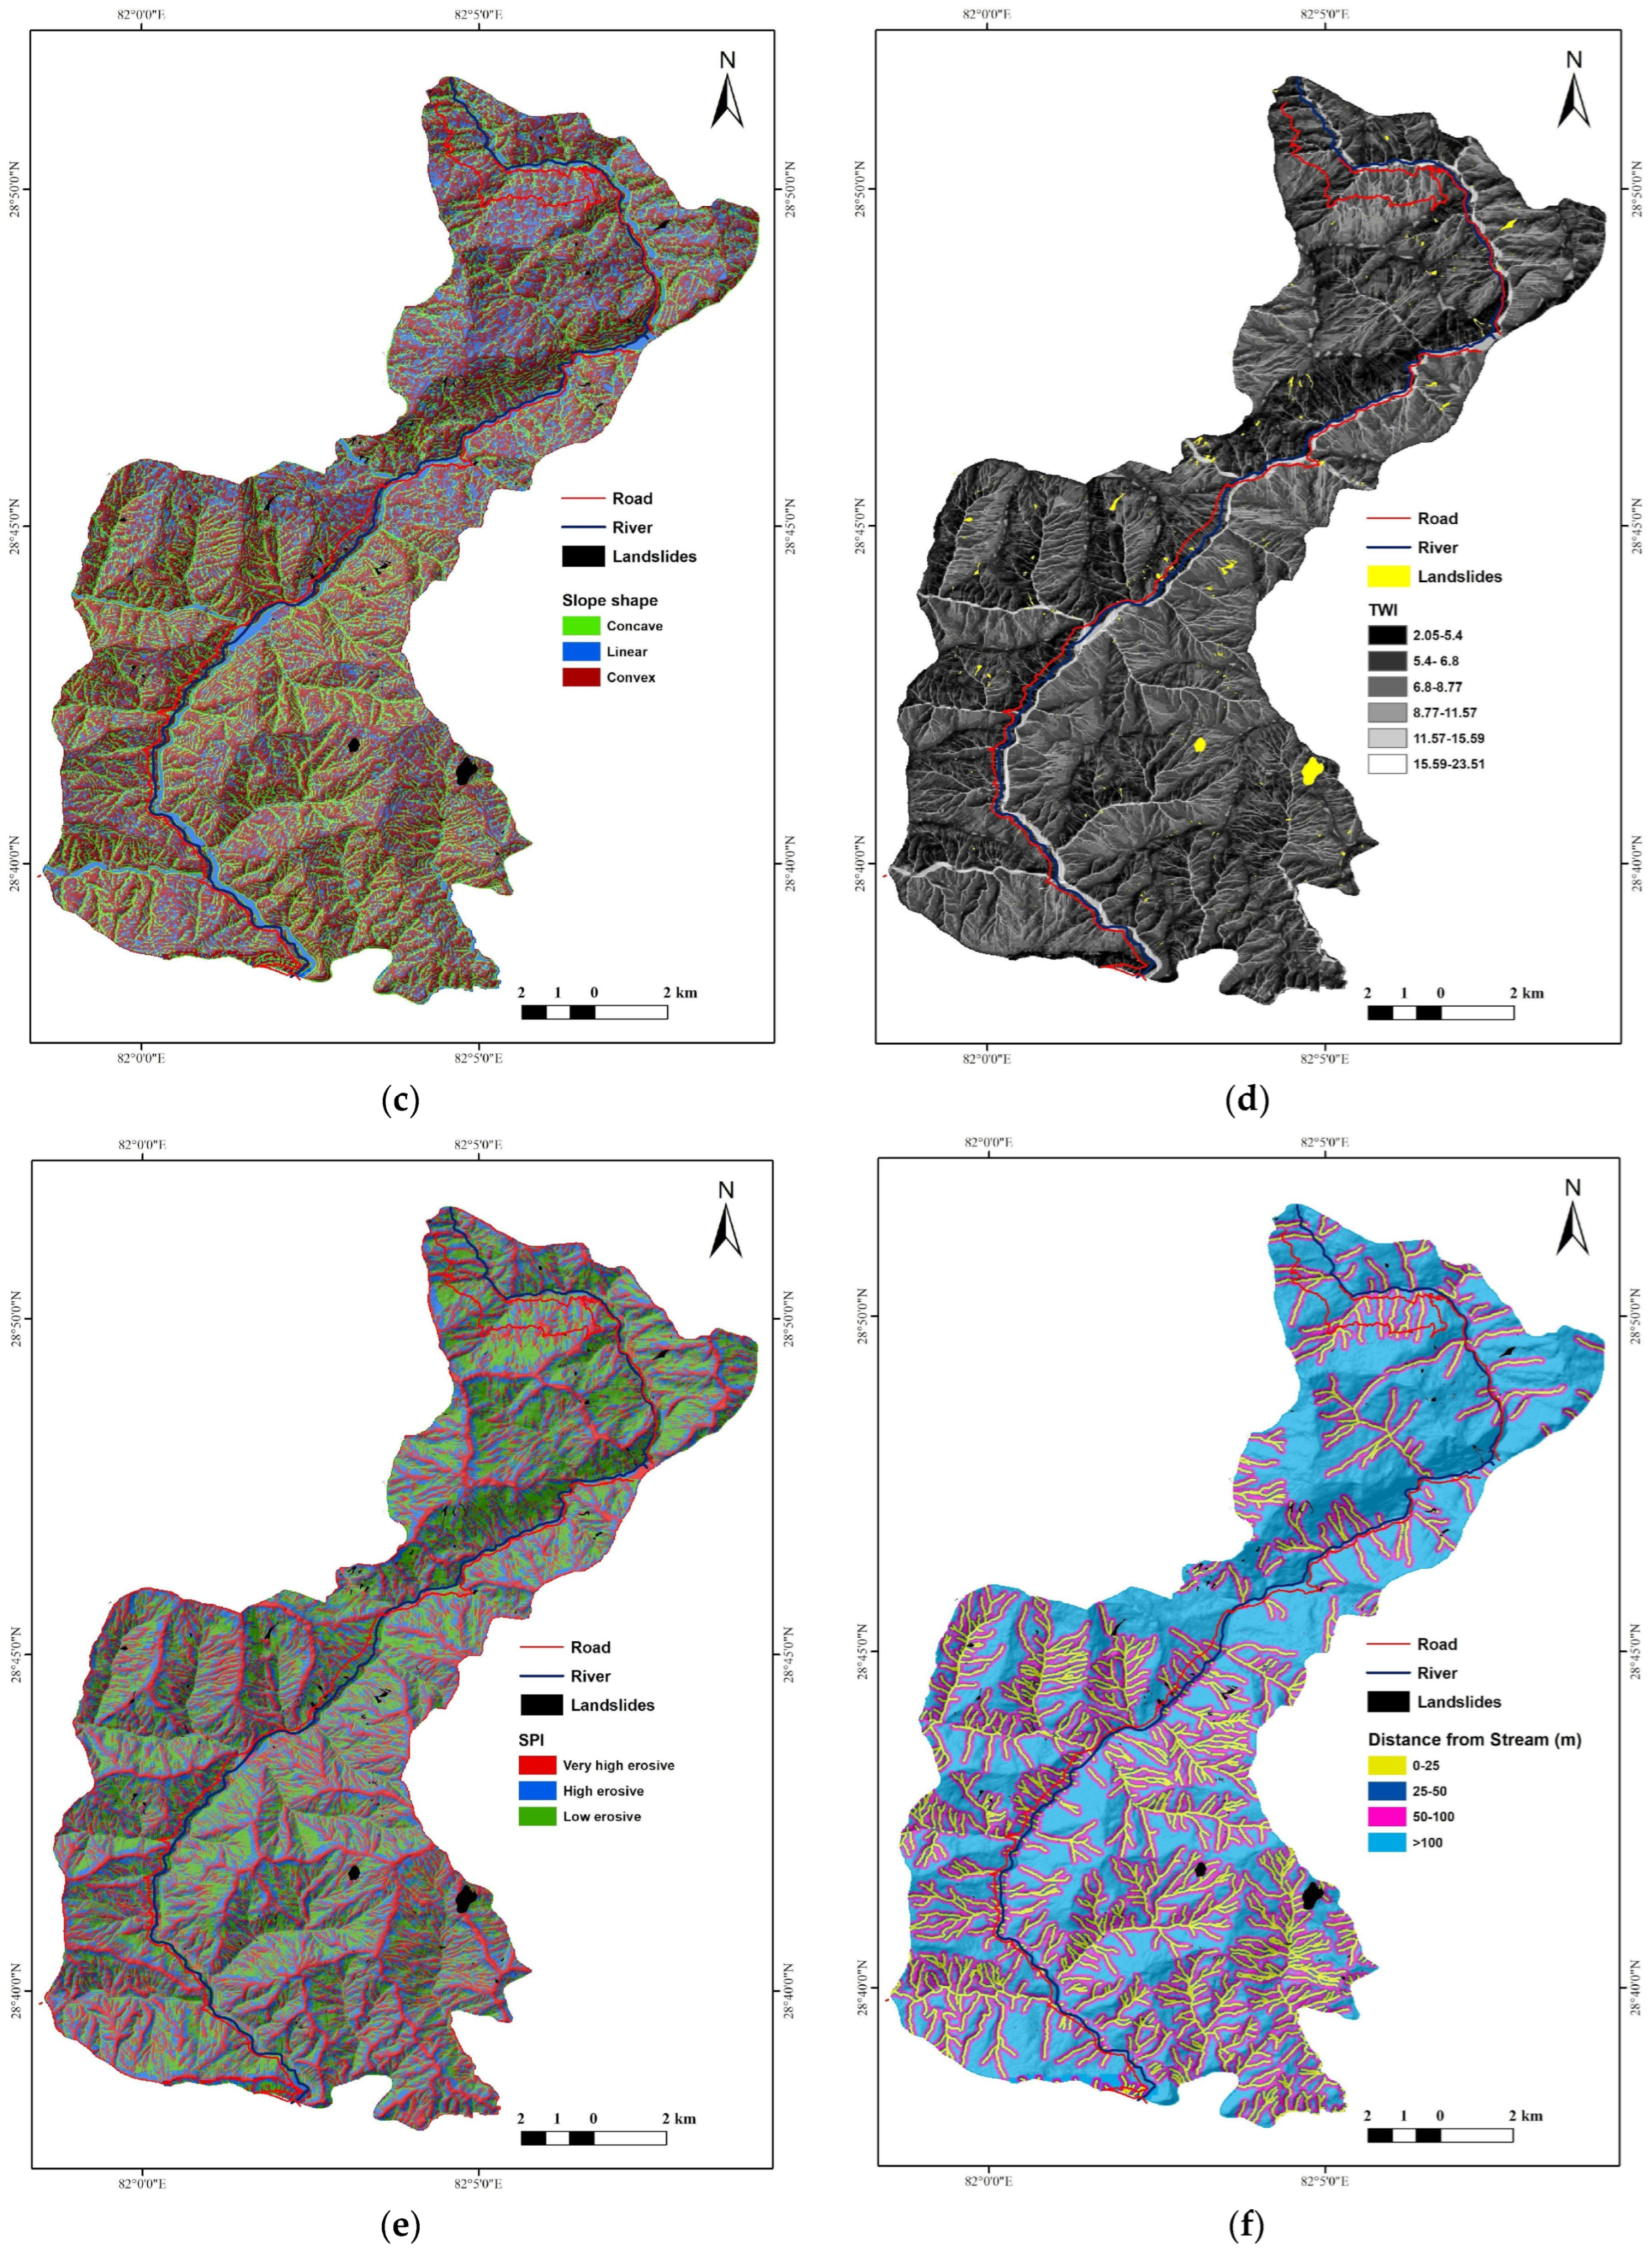
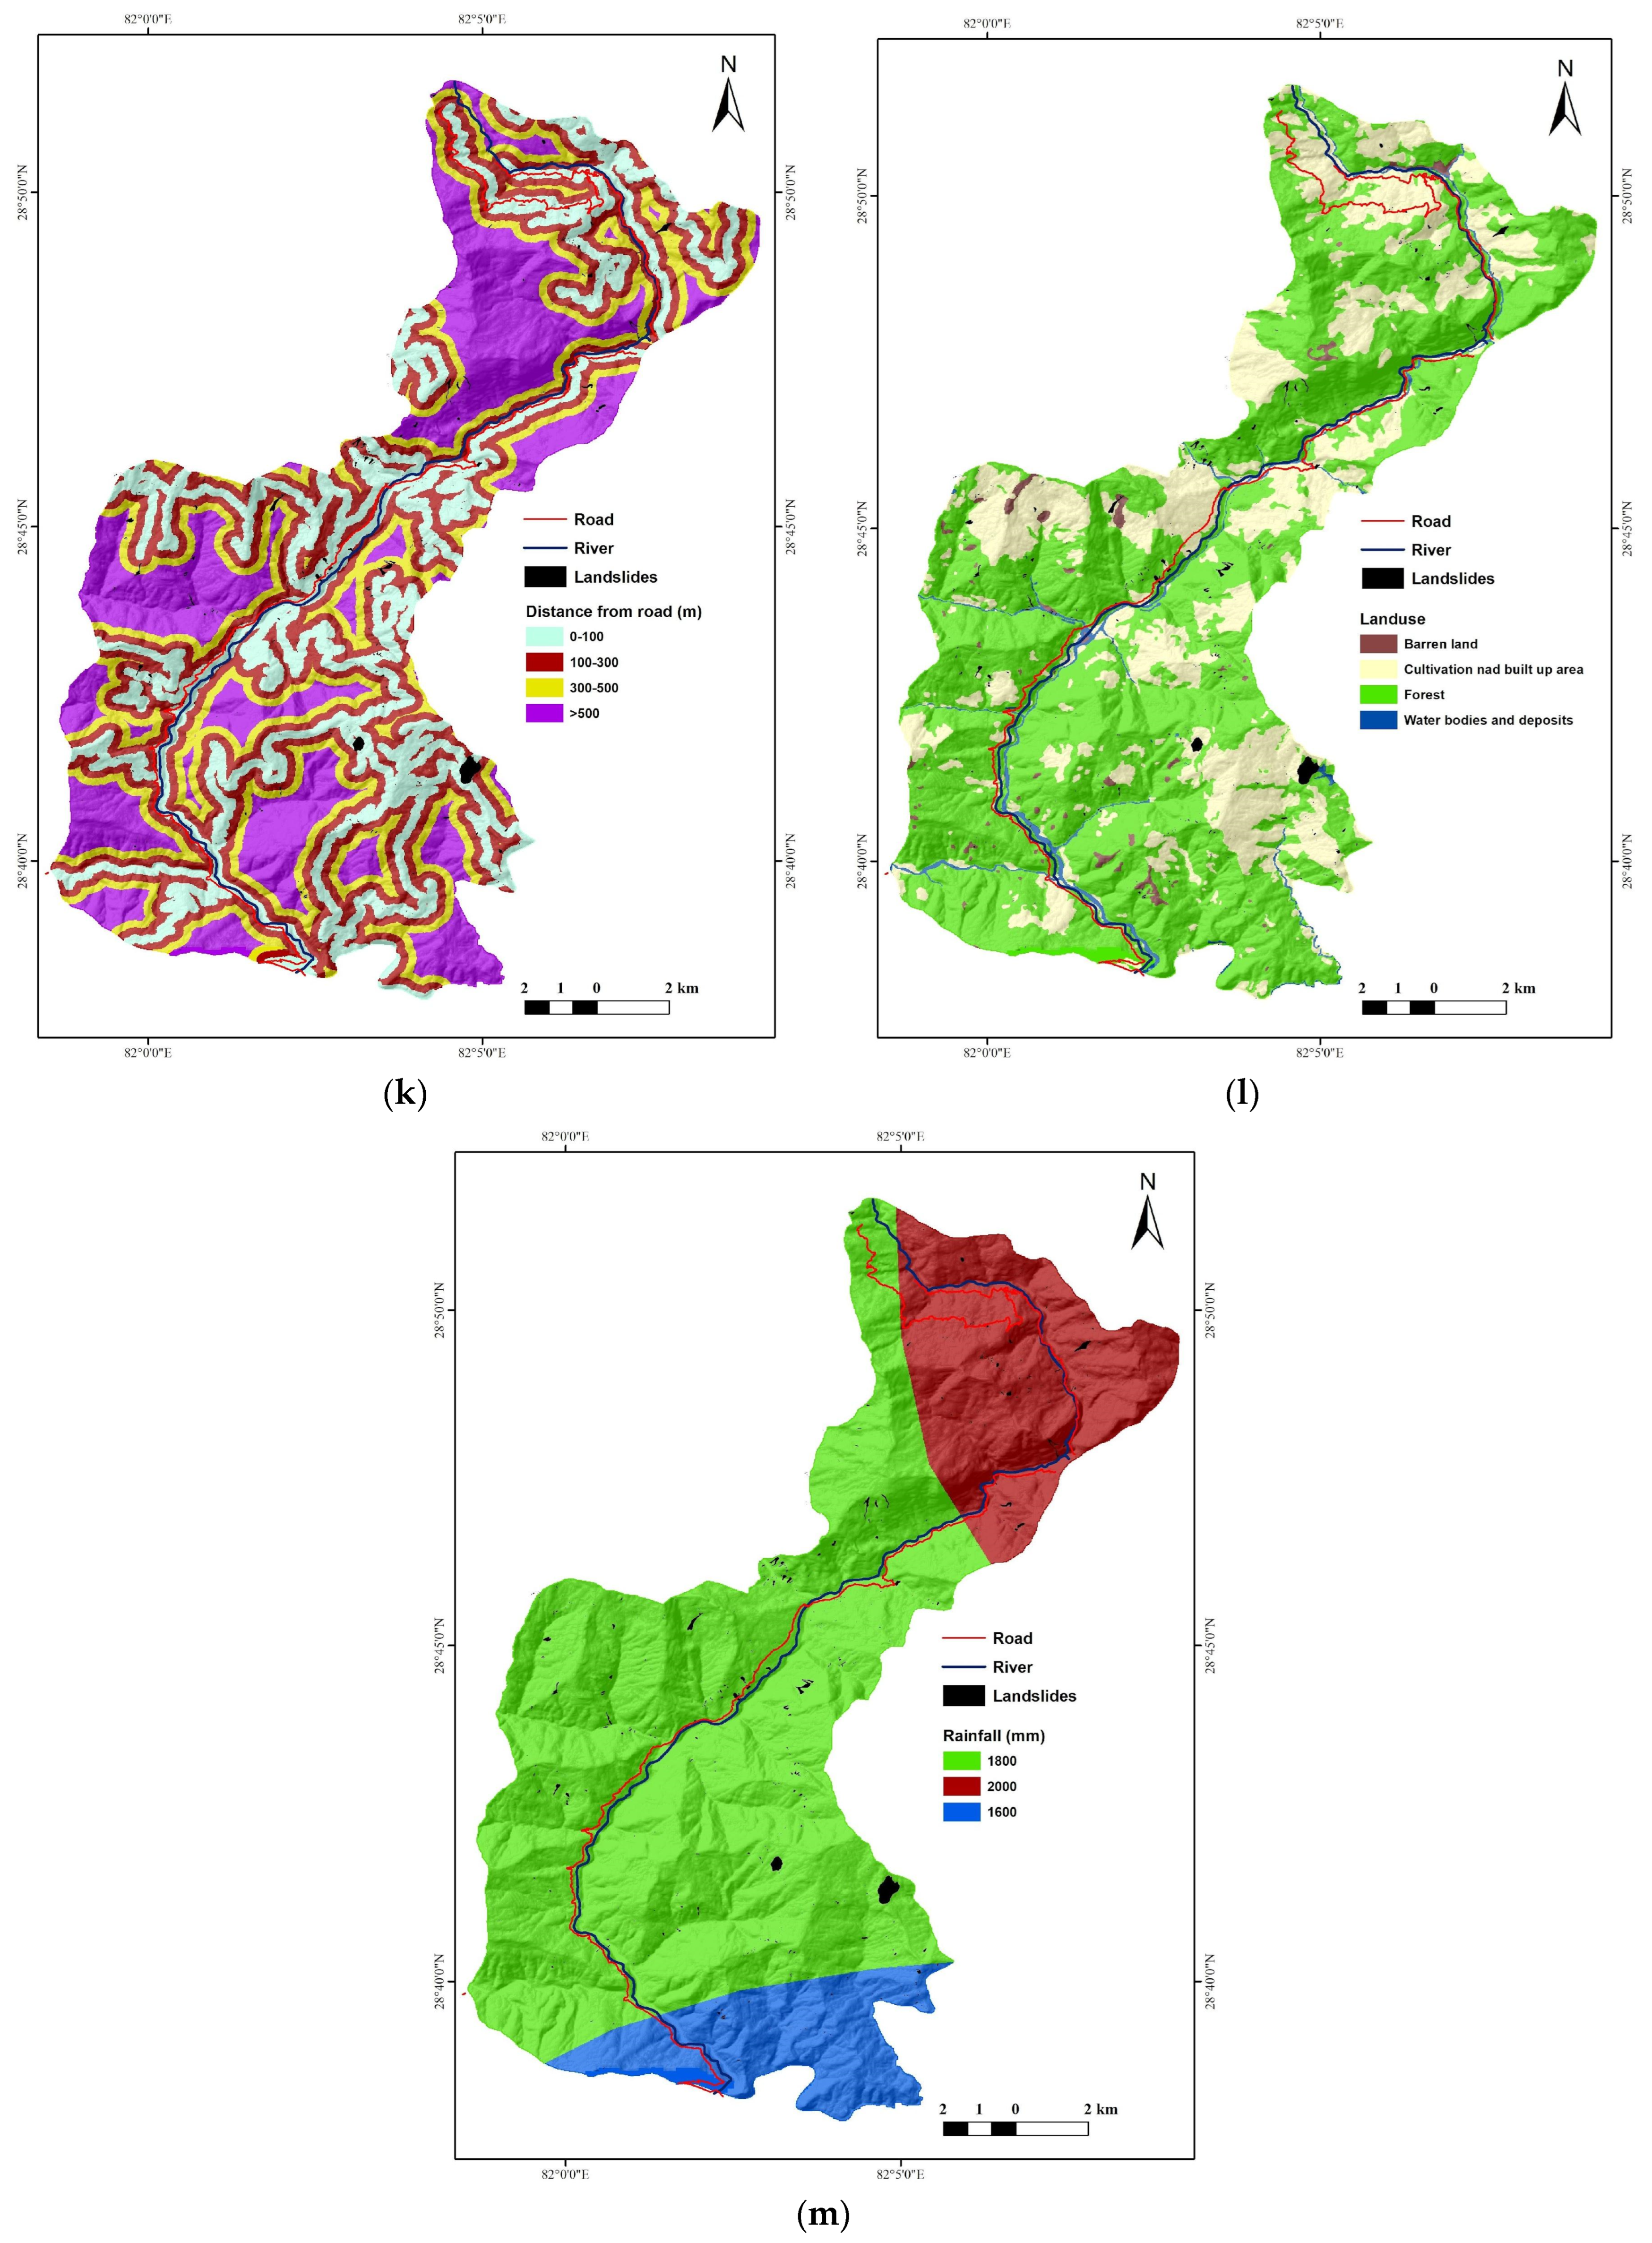
4.3. Landslide Conditioning Factors
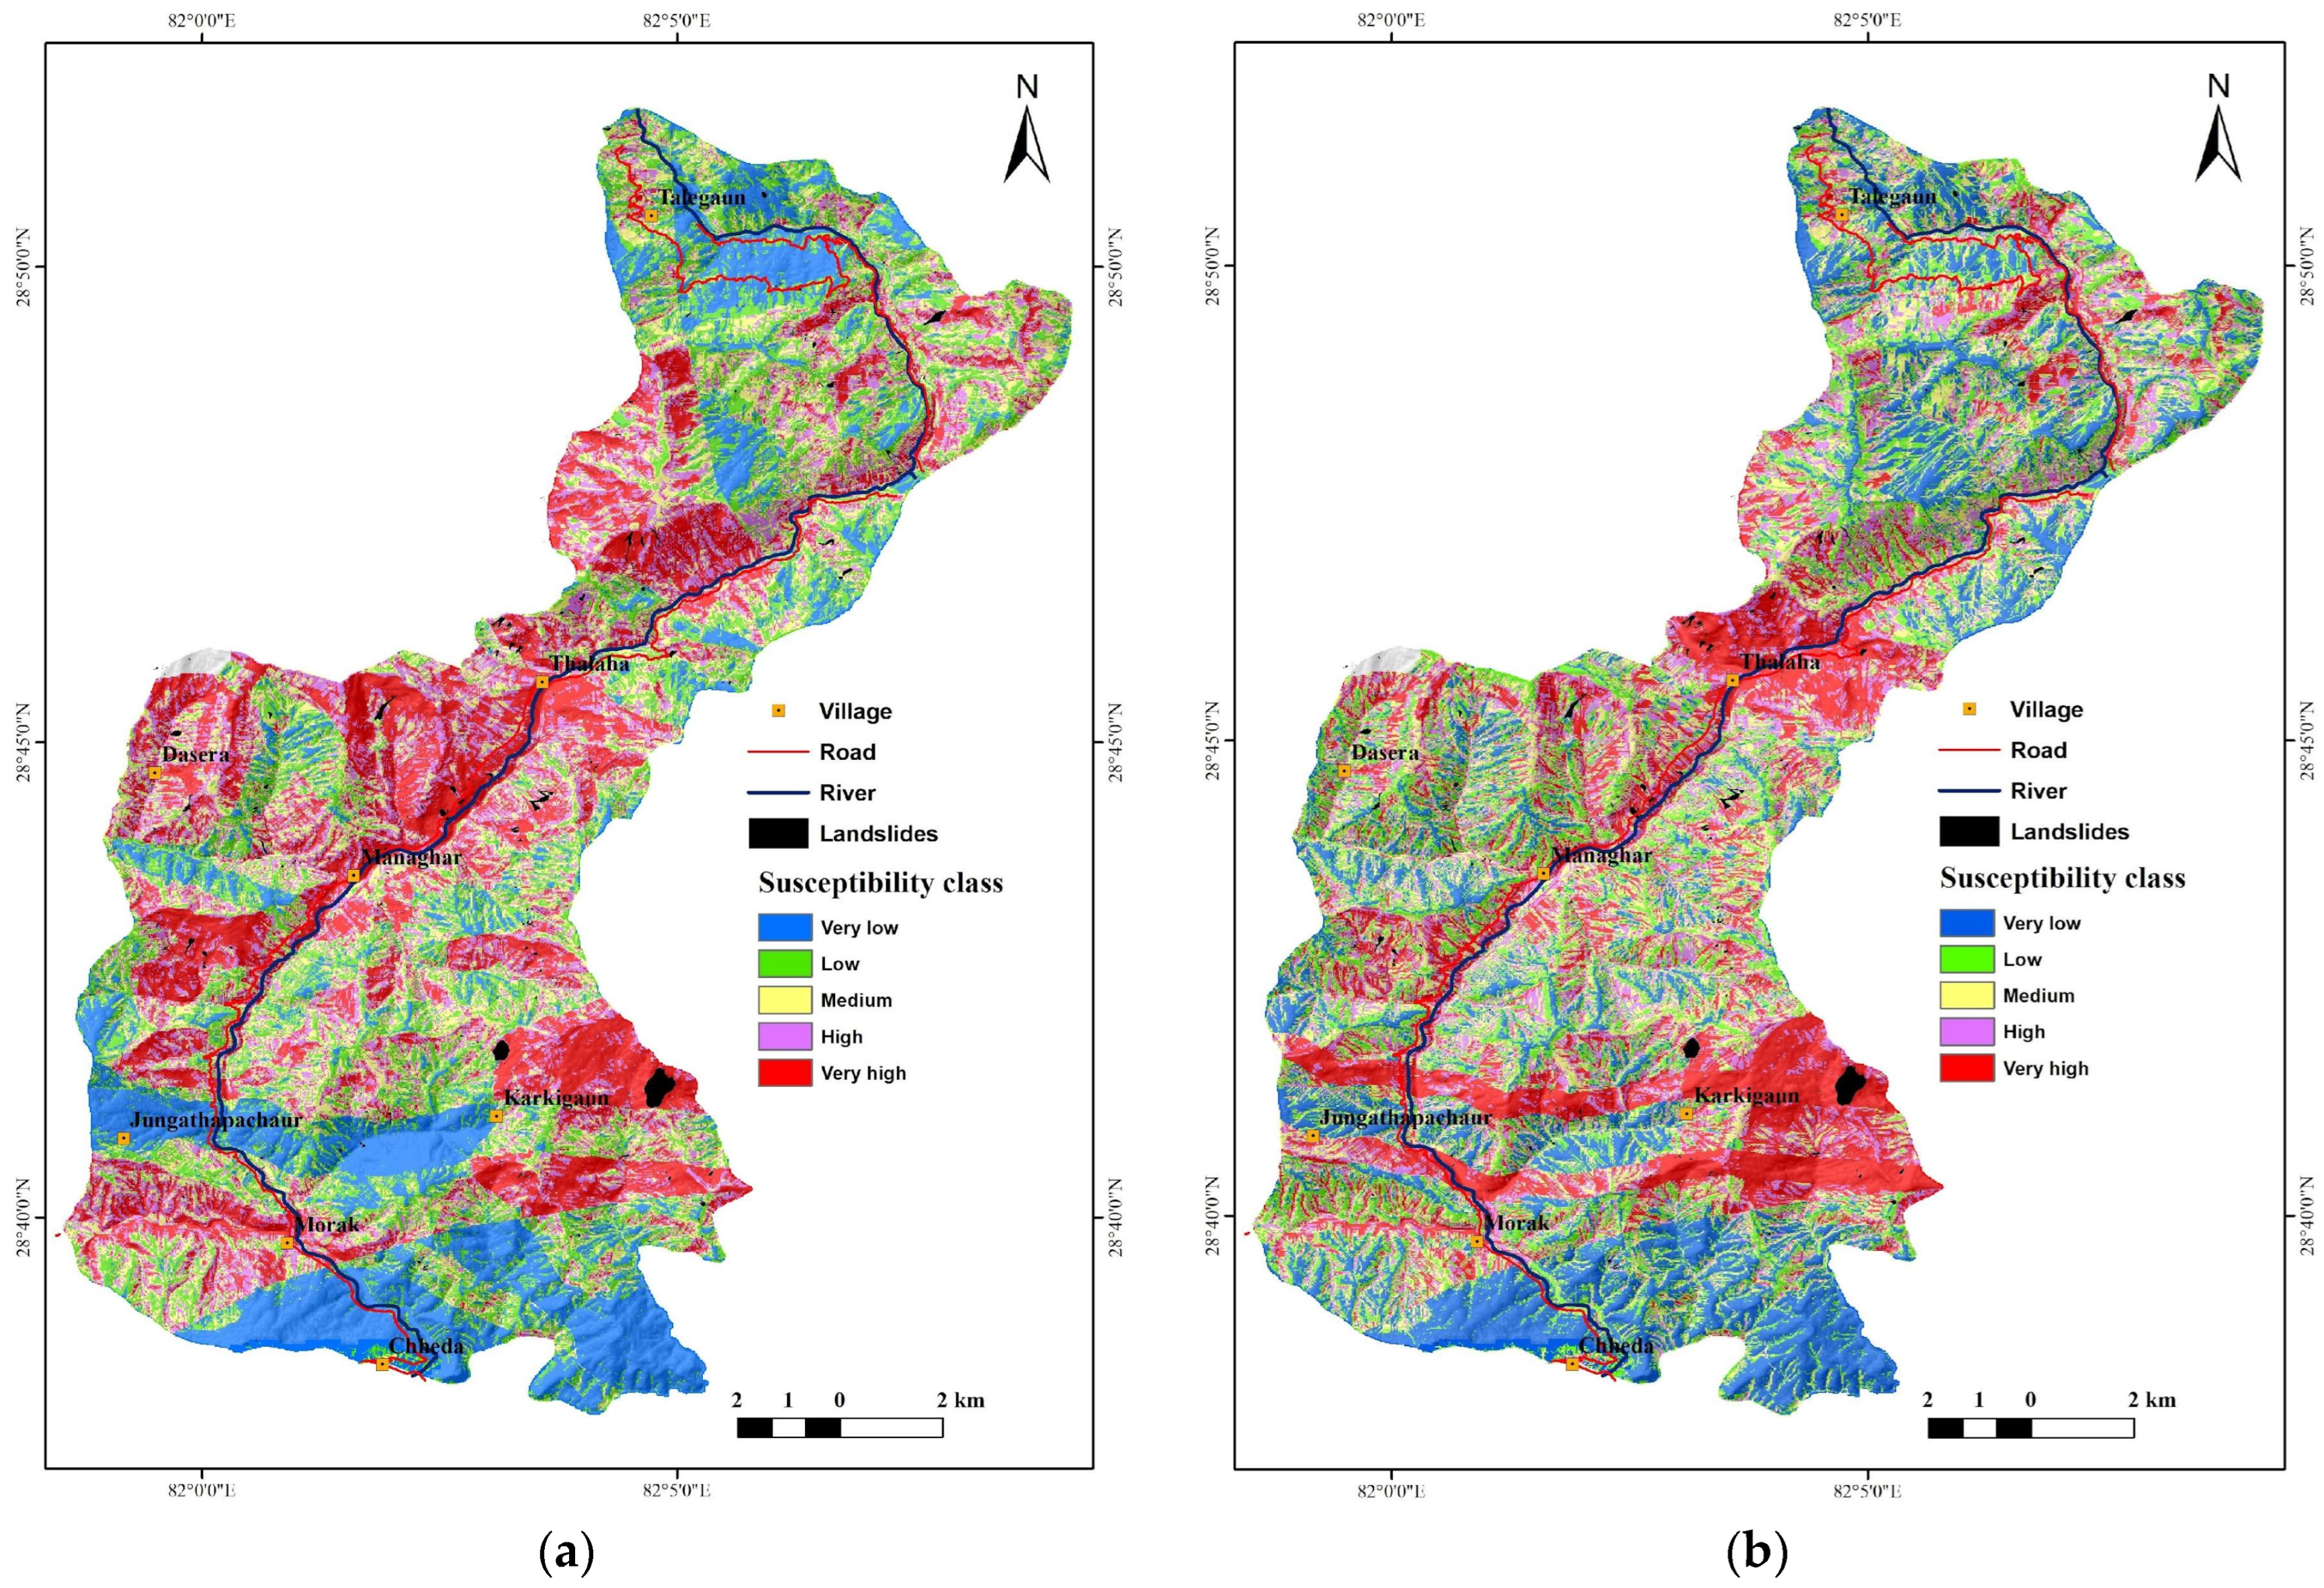
4.4. Landslide Susceptibility Modeling
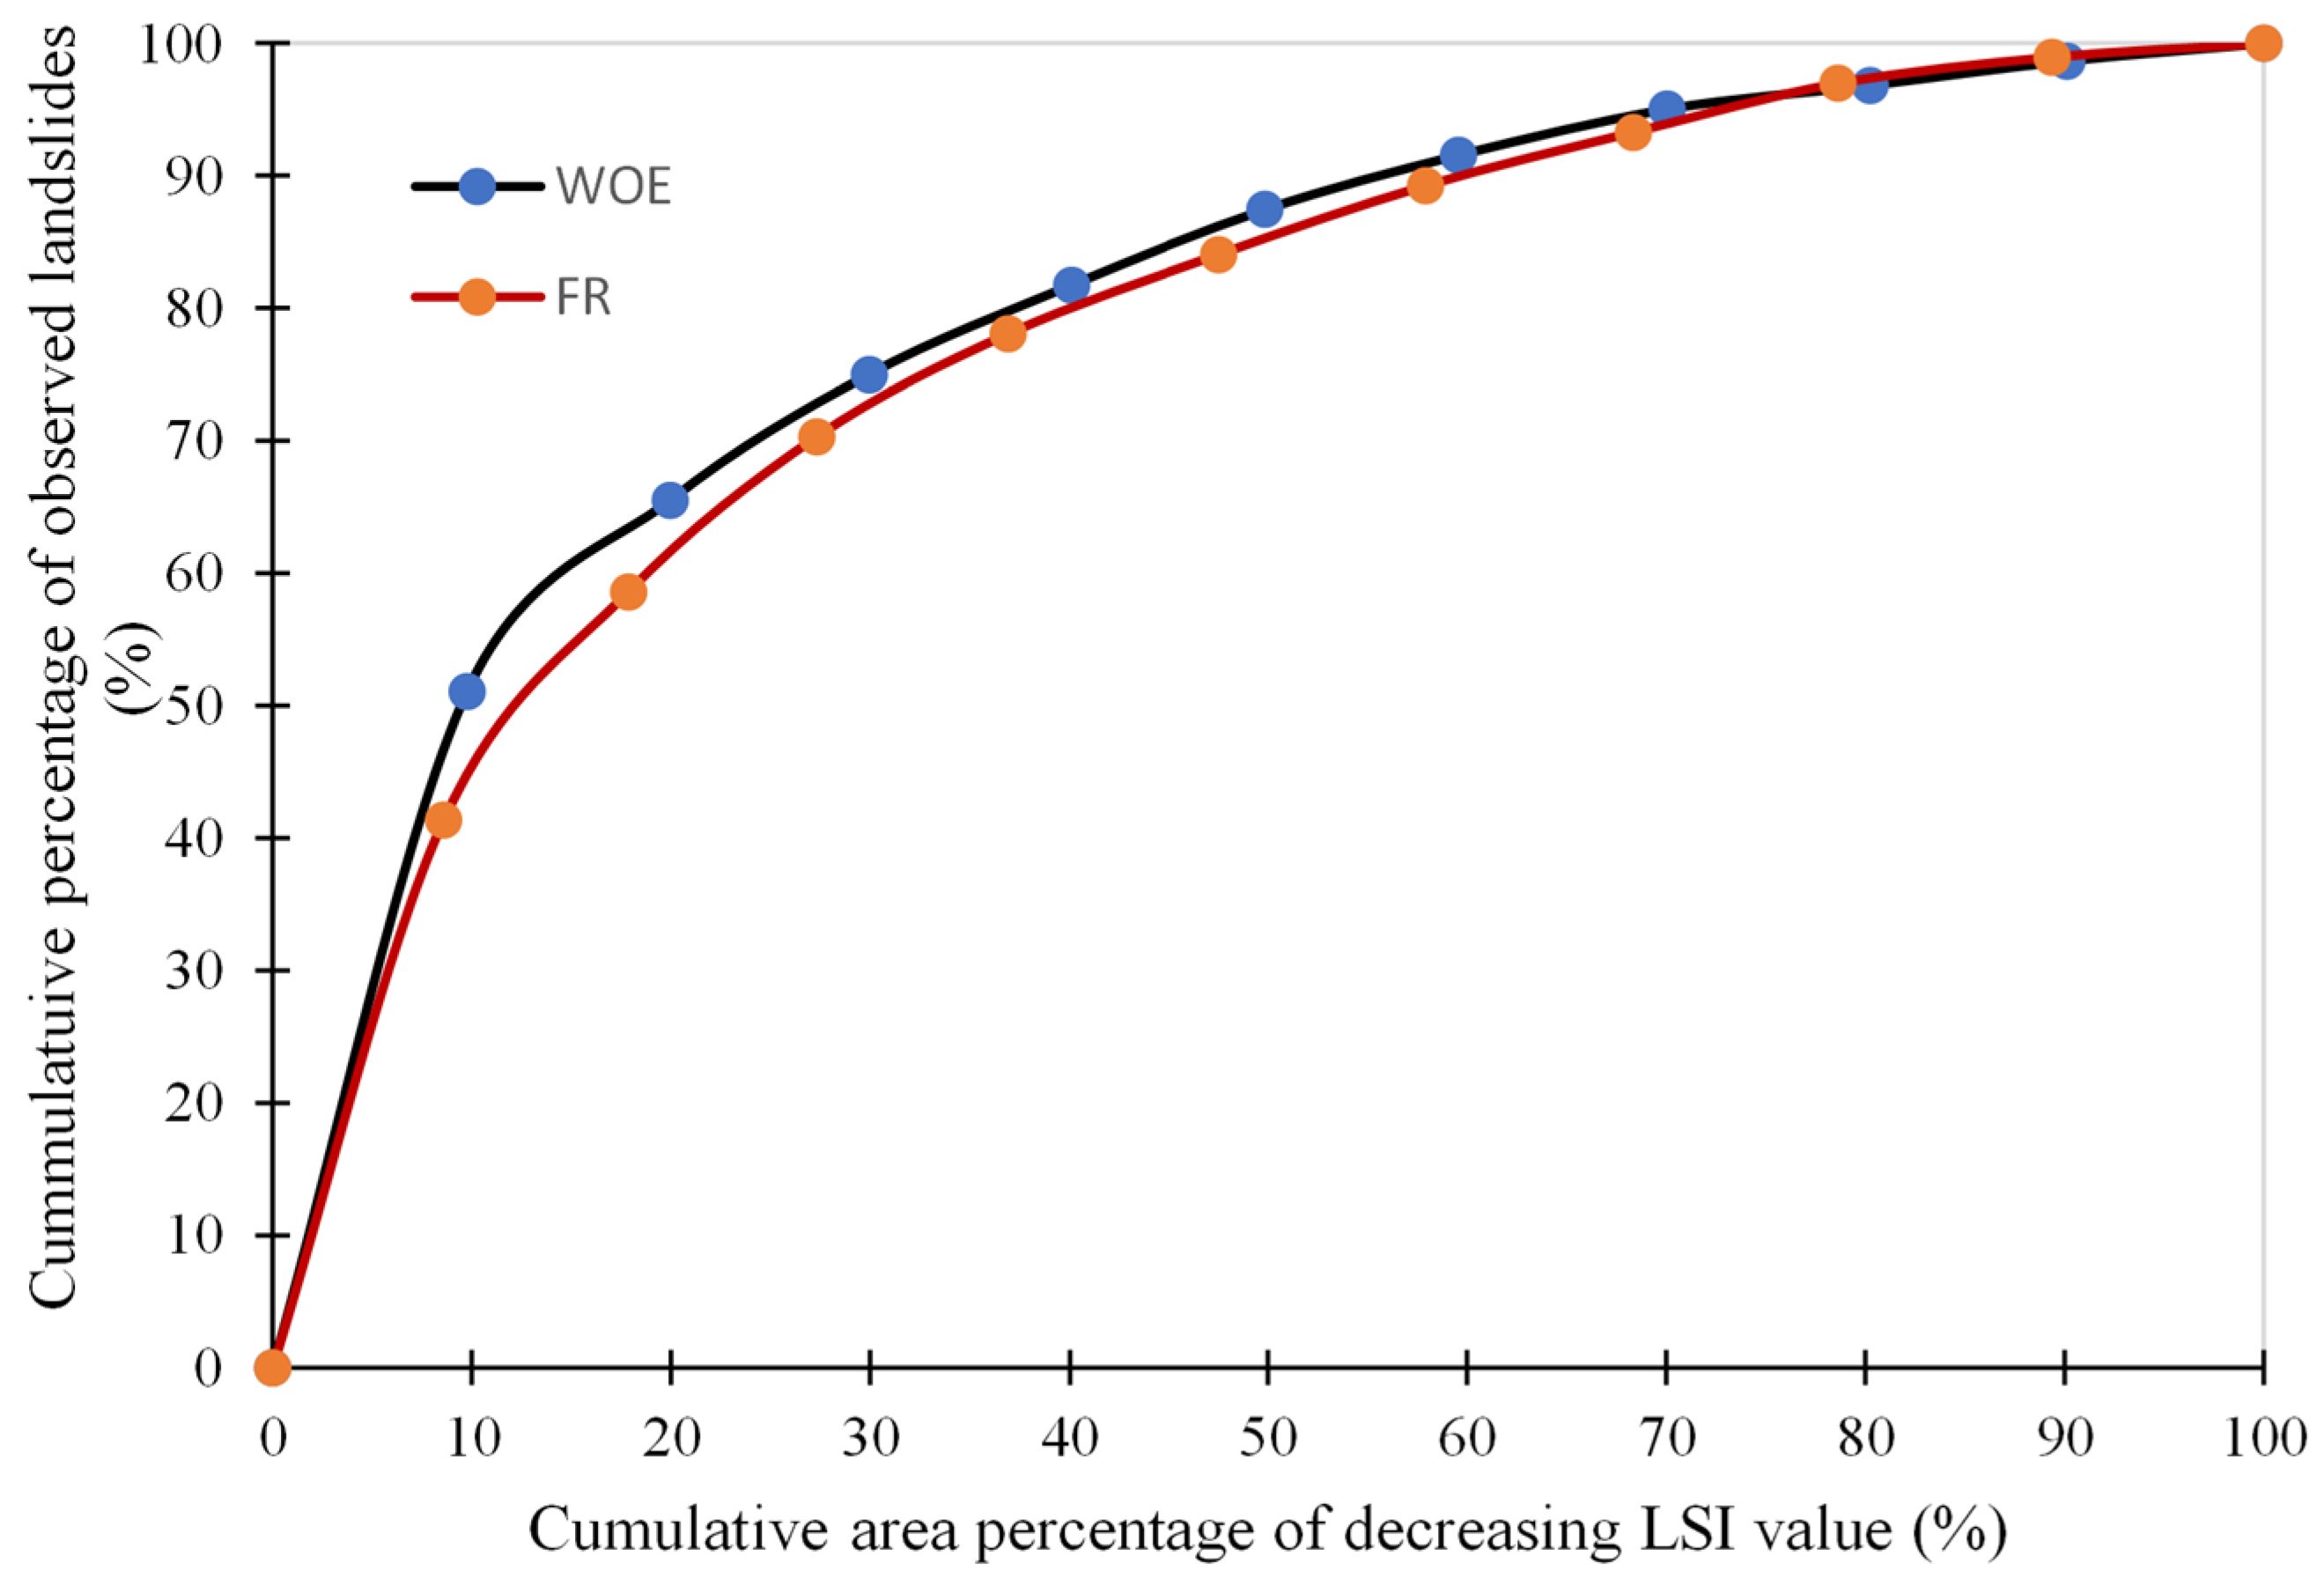
4.5. Validation
5. Discussion
6. Conclusions
- From detailed geological exploration, a new geological map of the study area is developed, which can be the reference for further research in this area. This map can be crucial for the planning of infrastructure development.
- This study supports the concept that the crystalline bodies i.e., Karnali Crystalline Zone and Jajarkot Crystalline Zone, located around the study area are klippen.
- The field survey shows that the haphazard road excavation without the consideration of geological and geotechnical features of the site has caused rampant shallow landslides.
- Susceptibility modeling using both the FR and the WOE methods shows that the lithology is the most important conditioning factor for landslide occurrence, while, land use, distance from geological structures, road, SPI, slope, aspect and TWI, have played a moderate role.
- The overall success rating of the FR and WOE method in the study area are 77.62% and 79.42%, respectively, with the 13 causative factors considered. The development of such susceptibility maps under similar geoenvironmental and topographical features, as in this study, and considering similar causative factors, can be useful for the mitigation of landslide hazards in other places of the world.
Author Contributions
Funding
Data Availability Statement
Acknowledgments
Conflicts of Interest
References
- Jaeger, J.; Courtillot, V.; Tapponnier, P. Paleontological view of the ages of the Deccan Traps, the Cretaceous/Tertiary boundary, and the India-Asia collision. Geology 1989, 17, 316–319. [Google Scholar] [CrossRef]
- Besse, J.; Courtillot, V.; Pozzi, J.P.; Westphal, M.; Zhou, Y.X. Palaeomagnetic estimates of crustal shortening in the Himalayan thrusts and Zangbo suture. Nature 1984, 311, 621–626. [Google Scholar] [CrossRef]
- Copley, A.; Avouac, J.-P.; Royer, J.-Y. India–Asia collision and the Cenozoic slowdown of the Indian plate: Implications for the forces driving plate motions. J. Geophys. Res. 2010, 115, 1–14. [Google Scholar] [CrossRef] [Green Version]
- Avouac, J.-P. Mountain building, erosion and the seismic cycle in the Nepal Himalaya. Adv. Geophys. 2003, 46, 1–80. [Google Scholar]
- Searle, M.P. Structural evolution and sequence of thrusting in the High Himalayan, Tibetan-Tethys and Indus suture zones of Zanskar and Ladakh, Western Himalaya. J. Struct. Geol. 1986, 8, 923–936. [Google Scholar] [CrossRef]
- Pratt-Sitaula, B.; Burbank, D.W.; Heimsath, A.; Ojha, T. Landscape disequilibrium on 1000–10,000 year scales Marsyandi River, Nepal, central Himalaya. Geomorphology 2004, 58, 223–241. [Google Scholar] [CrossRef]
- Guzzetti, F. Landslide Hazard and Risk Assessment. Ph.D. Thesis, Rheinischen Friedrich Wilhelms-University Bonn, Bonn, Germany, 2005. [Google Scholar]
- CRED. The Human Cost of Natural Disasters 2015—A Global Perspective; CRED; UNISDR: Brussels, Belgium, 2015; p. 55. [Google Scholar]
- Herath, S.; Wang, Y. Case studies and national experiences. In Landslides–Disaster Risk Reduction; Springer: Berlin/Heidelberg, Germany, 2009; pp. 475–497. [Google Scholar]
- Cruden, D.M. A simple definition of a landslide. Bull. Int. Assoc. Eng. Geol. 1991, 41, 27–29. [Google Scholar] [CrossRef]
- Crosta, G.B.; Frattini, P. Rainfall-induced landslides and debris flows. Hydrol. Process. 2008, 22, 473–477. [Google Scholar] [CrossRef]
- Cannon, S.H.; Bigio, E.R.; Mine, E. A process for fire-related debris flow initiation, Cerro Grande fire, New Mexico. Hydrol. Process. 2001, 15, 3011–3023. [Google Scholar] [CrossRef]
- Fannin, R.J.; Rollerson, T.P. Debris flows: Some physical characteristics and behaviour. Can. Geotech. J. 1993, 30, 71–81. [Google Scholar] [CrossRef]
- Iverson, R.M.; Reid, M.E.; LaHusen, R.G. Debris flow mobilization from landslides. Annu. Rev. Earth Planet Sci. 1997, 25, 85–138. [Google Scholar] [CrossRef]
- Dangi, H.; Bhattarai, T.N.; Thapa, P.B. An approach of preparing earthquake induced landslide hazard map: A case study of Nuwakot District, central Nepal. J. Nepal Geol. Soc. 2019, 58, 153–162. [Google Scholar] [CrossRef]
- Dahal, B.K.; Dahal, R.K. Landslide hazard map: Tool for optimization of low-cost mitigation. Geoenviron. Disasters 2017, 4, 8. [Google Scholar] [CrossRef] [Green Version]
- KC, D.; Dangi, H.; Naqvi, M.W.; Hu, L. Landslide Mobilized Debris Flow at Kalli Village in Achham, Nepal: A Case Study. In Proceedings of the 2021 ASEE North Central Section Conference, Toledo, OH, USA, 19 March 2021. [Google Scholar]
- Joshi, I.; Chaudhary, R.K.; Diwakar, K.C. Engineering Perspective of Melamchi Disaster and Mitigation Methods. Zenodo 2021, 1–4. [Google Scholar] [CrossRef]
- KC, D.; Gautam, K.; Dangi, H.; Kadel, S.; Hu, L. Challenges in Tunneling in the Himalayas: A Survey of Several Prominent Excavation Projects in the Himalayan Mountain Range of South Asia. Geotechnics 2022, 2, 802–824. [Google Scholar] [CrossRef]
- Devkota, K.C.; Regmi, A.D.; Pourghasemi, H.R.; Yoshida, K.; Pradhan, B.; Ryu, I.C.; Althuwaynee, O.F. Landslide susceptibility mapping using certainty factor, index of entropy and logistic regression models in GIS and their comparison at Mugling–Narayanghat road section in Nepal Himalaya. Nat. Hazards 2013, 65, 135–165. [Google Scholar] [CrossRef]
- Van Westen, C.J.; Van Asch, T.W.; Soeters, R. Landslide hazard and risk zonation—Why is it still so difficult? Bull. Eng. Geol. Environ. 2006, 65, 167–184. [Google Scholar] [CrossRef]
- Kayastha, P.; Dhital, M.R.; De Smedt, F. Landslide susceptibility mapping using the weight of evidence method in the Tinau watershed, Nepal. Nat. Hazards 2012, 63, 479–498. [Google Scholar] [CrossRef]
- Anbalagan, R. Landslide hazard evaluation and zonation mapping in mountainous terrain. Eng. Geol. 1992, 32, 269–277. [Google Scholar] [CrossRef]
- Fuchs, G.; Frank, W. The geology of west Nepal between the rivers Kali Gandakiand Thulo Bheri. Geol. Bundesanst. 1970, 18, 1–103. [Google Scholar]
- Arita, K.; Shiraishi, K.; Hayashi, D. Geology of western Nepal and a comparison with Kumaun, India. Bull. Fac. Sci. Hokkaido Univ. 1984, 21, 1–20. [Google Scholar]
- Dhital, M.R. Juxtaposition of Greater and Lesser Himalayan nappes in west Nepal: Implications for delineating Main Central Thrust. Himal. Geol. 2022, 43, 231–240. [Google Scholar]
- La Roche, R.S.; Godin, L.; Crowley, J.L. Reappraisal of emplacement models for Himalayan external crystalline nappes: The Jajarkot klippe, western Nepal. Bull. Geol. Soc. Am. 2018, 130, 1041–1056. [Google Scholar] [CrossRef]
- Yoneshiro, T.; Kizaki, K. Metamorphism and thermal structure of the Karnali Klippe, western Nepal Himalaya. Bull. Dep. Geol. 1996, 5, 1–20. [Google Scholar]
- Hayashi, D.; Fujii, Y.; Yoneshiro, T.; Kizaki, K. Observations on the geology of the Karnali region, west Nepal. J. Nepal Geol. Soc. 1984, 4, 29–40. [Google Scholar]
- Wang, H.B.; Sassa, K. Comparative evaluation of landslide susceptibility in Minamata area, Japan. Environ. Geol. 2005, 47, 956–966. [Google Scholar] [CrossRef]
- DOS. Topographic Maps of Nepal; Department of Survey: Kathmandu, Nepal, 1996. [Google Scholar]
- DHM. Precipitation Map of Nepal; Department of Hydrology and Meterology: Kathmandu, Nepal, 2021. [Google Scholar]
- Bonham-Carter, G.F.; Agterberg, F.P.; Wright, D.F. Integration of geological datasets for gold exploration in Nova Scotia. Photogramm. Eng. Remote Sens. 1988, 54, 1585–1592. [Google Scholar]
- Bonham-Carter, G.F. Weights of evidence modelling: A new approach to mapping mineral potential. In Statistical Applications in the Earth Sciences. Geol. Surv. Can. 1989, 8–9, 171–183. [Google Scholar]
- Lee, S.; Ryu, J.H.; Won, J.S.; Park, H.J. Determination and application of the weights for landslide susceptibility mapping using an artificial neural network. Eng. Geol. 2004, 71, 289–302. [Google Scholar] [CrossRef]
- Bonham-Carter, G.F. Geographic Information Systems for Geoscientists: Modeling with GIS; Pergamon Press: New York, NY, USA, 1994; p. 398. [Google Scholar]
- KC, D.; Dangi, H.; Hu, L. Assessing Landslide Susceptibility in the Northern Stretch of Arun Tectonic Window, Nepal. Civ. Eng. 2022, 3, 525–540. [Google Scholar] [CrossRef]
- Kansakar, D.R.; Chitrakar, G.R. Report on Geology of the Bheri River Section. Dep. Mines Geol. Kathmandu 1984. Unpublished. [Google Scholar]
- Hagen, T. Report on the Geological survey of Nepal, Vol. 1: Preliminary reconnaissance. Denkschriften der Schweizerischen Naturforschenden Gesellschaft Memoires de la Societe Helvetique des Sciences Naturelles. 1969; Volume 84, p. 185. [Google Scholar]
- Dhital, M.R. Geology of the Nepal Himalaya: Regional Perspective of the Classic Collidedorogen; Springer: Berlin/Heidelberg, Germany, 2015; p. 487. [Google Scholar]
- Dhital, M.R.; Kizaki, K. Lithology and Stratigraphy of the Northern Dang, Lesser Himalaya. Bull. Coll. Sci. Univ. Ryukyus Okinawa 1987, 45, 183–244. [Google Scholar]
- Adhikary, T.P.; Sharma, T. Geological Report of Marma, Chaurjhari, and Jajarkot Area (Far Western Nepal). Dep. Mines Geol. Kathmandu 1983. Unpublished. [Google Scholar]
- Stöcklin, J.; Bhattarai, K.D. Geology of the Kathmandu Area and Central Mahabharat Range, Nepal Himalaya. Dep. Mines Geol. UNDP 1977. Unpublished. [Google Scholar]
- Paudyal, K.R.; Paudel, L.P. Geological study and root zone interpretation of the Kahun Klippe, Tanahun, and central Nepal. Himal. Geol. 2013, 34, 93–106. [Google Scholar]
- Dai, F.C.; Lee, C.F.; Li, J.X.Z.W.; Xu, Z.W. Assessment of landslide susceptibility on the natural terrain of Lantau Island, Hong Kong. Environ. Geol. 2001, 40, 381–391. [Google Scholar]
- Ghimire, M. Landslide occurrence and its relation with terrain factors in the Siwalik Hills, Nepal: Case study of susceptibility assessment in three basins. Nat. Hazards 2011, 56, 299–320. [Google Scholar] [CrossRef]
- Nefeslioglu, H.A.; Sezer, E.B.R.U.; Gokceoglu, C.; Bozkir, A.S.; Duman, T.Y. Assessment of landslide susceptibility by decision trees in the metropolitan area of Istanbul, Turkey. Math. Probl. Eng. 2010, 2010, 901095. [Google Scholar] [CrossRef] [Green Version]
- Moore, I.D.; Grayson, R.B. Terrain-based catchment partitioning and runoff prediction using vector elevation data. Water Resour. Res. 1991, 27, 1177–1191. [Google Scholar] [CrossRef]
- Sörensen, R.; Zinko, U.; Seibert, J. On the calculation of the topographic wetness index: Evaluation of different methods based on field observations. Hydrol. Earth Syst. Sci. 2006, 10, 101–112. [Google Scholar] [CrossRef] [Green Version]
- Youssef, A.M.; Pourghasemi, H.R.; El-Haddad, B.A.; Dhahry, B.K. Landslide susceptibility maps using different probabilistic and bivariate statistical models and comparison of their performance at Wadi Itwad Basin, Asir Region, Saudi Arabia. Bull. Eng. Geol. Environ. 2015, 75, 63–87. [Google Scholar] [CrossRef]
- Hengl, T.; Gruber, S.; Shrestha, D.P. Digital Terrain Analysis in ILWIS; International Institute for Geo-Information Science and Earth Observation Enschede: Enschede, The Netherlands, 2003; p. 56. [Google Scholar]
- Duman, T.Y.; Çan, T.; Emre, O.; Keçer, M.; Doğan, A.; Ateş, Ş.; Durmaz, S. Landslide inventory of northwestern Anatolia, Turkey. Eng. Geol. 2005, 77, 99–114. [Google Scholar] [CrossRef]
- Yalcin, A. An Investigation on Ardesen (Rize) Region on the Basis of Landslide Susceptibility. Ph.D. Thesis, Karadeniz Technical University, Trabzon, Turkey, 2005. [Google Scholar]
- Leir, M.; Michell, A.; Ramsay, S. Regional landslide hazard susceptibility mapping for pipelines in British Columbia. Geo-engineering for the society and its environment. In Proceedings of the 57th Canadian Geotechnical Conference and the 5th Joint CGS-IAH Conference, Waterloo, ON, Canada, 24–27 October 2004; pp. 1–9. [Google Scholar]
- Chen, Y.; Yu, J.; Shahbaz, K.; Xevi, E. A GIS-based sensitivity analysis of multi-criteria weights. In Proceedings of the 18th World IMACS/MODSIM Congress, Cairns, Australia, 13–17 July 2009. [Google Scholar]
- Dahal, R.K.; Hasegawa, S. Representative rainfall thresholds for landslides in the Nepal Himalaya. Geomorphology 2008, 100, 429–443. [Google Scholar] [CrossRef]
- Pradhan, B. Landslide susceptibility mapping of a catchment area using frequency ratio, fuzzy logic and multivariate logistic regression approaches. J. Indian Soc. Remote Sens. 2010, 38, 301–320. [Google Scholar] [CrossRef]
- Ding, N.; Melloni, L.; Tian, X.; Poeppel, D. Rule-based and word-level statistics-based processing of language: Insights from neuroscience. Lang. Cogn. Neurosci. 2017, 32, 570–575. [Google Scholar] [CrossRef] [Green Version]
- Chung, C.J.F.; Fabbri, A.G. Probabilistic prediction models for landslide hazard mapping. Photogramm. Eng. Remote Sens. 1999, 65, 1389–1399. [Google Scholar]
- Lee, S.; Pradhan, B. Landslide hazard mapping at Selangor, Malaysia using frequency ratio and logistic regression models. Landslides 2007, 4, 33–41. [Google Scholar] [CrossRef]
- Sarkar, S.; Kanungo, D.P. An integrated approach for landslide susceptibility mapping using remote sensing and GIS. Photogramm. Eng. Remote Sens. 2004, 70, 617625. [Google Scholar] [CrossRef]
- Van Westen, C.J.; Rengers, N.; Soeters, R. Use of geomorphological information in indirect landslide susceptibility assessment. Nat. Hazards 2003, 30, 399–419. [Google Scholar] [CrossRef]
- Hashimoto, M. Plate tectonics and crustal deformation around the Japanese Islands. J. Geophys. Res. 1993, 98, 16149–16166. [Google Scholar] [CrossRef]
- Müller, M.D.; Geiger, A.; Kahle, H.G.; Veis, G.; Billiris, H.; Paradissis, D.; Felekis, S. Velocity and deformation fields in the North Aegean domain, Greece, and implications for fault kinematics, derived from GPS data 1993–2009. Tectonophysics 2013, 597, 34–49. [Google Scholar] [CrossRef]
- Wu, Y.; Li, L.; Chen, C.; Liang, H.; Guo, N.; Li, Y. GNSS deformation characteristics of North China in the past two decades. Geod. Geodyn. 2021, 12, 392–398. [Google Scholar] [CrossRef]
- Lazos, I.; Papanikolaou, I.; Sboras, S.; Foumelis, M.; Pikridas, C. Geodetic Upper Crust Deformation Based on Primary GNSS and INSAR Data in the Strymon Basin, Northern Greece—Correlation with Active Faults. Appl. Sci. 2022, 12, 9391. [Google Scholar] [CrossRef]
- Fuchs, G. On the geology of the Karnali and Dolpo regions, west Nepal. Mitt. Geol. Ges. Wien 1974, 66, 21–35. [Google Scholar]
- Sharma, T.; Kansakar, D.R.; Kizaki, K. Geology and tectonics of the region between Kali Gandaki and Bheri Rivers in central west Nepal. Bull. Coll. Sci. Univ. Ryukus 1984, 38, 57–102. [Google Scholar]
- Stöcklin, J. Geology of Nepal and its regional frame. J. Geol. Soc. 1980, 137, 1–34. [Google Scholar] [CrossRef]
- DMG. Geological Map of Karnali Province; Department of mines and Geology: Kathmandu, Nepal, 2021. [Google Scholar]
- Conforti, M.; Ietto, F. Modeling shallow landslide susceptibility and assessment of the relative importance of predisposing factors, through a GIS-based statistical analysis. Geosciences 2021, 11, 333. [Google Scholar] [CrossRef]
- Dahal, R.K.; Hasegawa, S.; Nonomura, A.; Yamanaka, M.; Dhakal, S. DEM-based deterministic landslide hazard analysis in the Lesser Himalaya of Nepal. Georisk 2008, 2, 161–178. [Google Scholar] [CrossRef]
- Bijukchhen, S.M.; Kayastha, P.; Dhital, M.R. A comparative evaluation of heuristic and bivariate statistical modelling for landslide susceptibility mappings in Ghurmi-Dhad Khola, east Nepal. Arab. J. Geosci. 2013, 6, 2727–2743. [Google Scholar] [CrossRef]
- Akgun, A. A comparison of landslide susceptibility maps produced by logistic regression, multi-criteria decision, and likelihood ratio methods: A case study at Izmir, Turkey. Landslides 2012, 9, 93–106. [Google Scholar] [CrossRef]
- Pradhan, B.; Youssef, A.M. Manifestation of remote sensing data and GIS on landslide hazard analysis using spatial-based statistical models. Arab. J. Geosci. 2010, 3, 319–326. [Google Scholar] [CrossRef]


| Factors | Weight of Evidence | Frequency Ratio | |||||||||||
|---|---|---|---|---|---|---|---|---|---|---|---|---|---|
| Total Pixel Count | Landslide Pixel Count | W+ | W− | C | S2 (W+) | S2 (W−) | SC | C/SC | % Class Pixel | % Landslide Pixel | FR | RF | |
| Slope | |||||||||||||
| 0–15 | 37,767 | 123 | −0.608 | 0.039 | −0.65 | 0.0081 | 0.00037 | 0.092 | −7.00 | 7.96 | 4.35 | 0.55 | 0.09 |
| 15–25 | 127,475 | 489 | −0.444 | 0.124 | −0.57 | 0.0020 | 0.00043 | 0.050 | −11.39 | 26.88 | 17.29 | 0.64 | 0.11 |
| 25–35 | 172,720 | 1002 | −0.028 | 0.016 | −0.04 | 0.0010 | 0.00055 | 0.039 | −1.11 | 36.42 | 35.42 | 0.97 | 0.16 |
| 35–45 | 103,765 | 959 | 0.441 | −0.168 | 0.61 | 0.0010 | 0.00053 | 0.040 | 15.28 | 21.88 | 33.90 | 1.55 | 0.26 |
| 45–55 | 28,795 | 240 | 0.337 | −0.026 | 0.36 | 0.0042 | 0.00038 | 0.068 | 5.36 | 6.07 | 8.48 | 1.40 | 0.23 |
| 55–65 | 3589 | 16 | −0.293 | 0.002 | −0.29 | 0.0627 | 0.00035 | 0.251 | −1.17 | 0.76 | 0.57 | 0.75 | 0.12 |
| >65 | 130 | 0 | - | 0.000 | - | - | 0.00035 | - | - | 0.03 | 0.00 | 0.00 | 0.00 |
| Aspect | |||||||||||||
| Flat | 9748 | 29 | −0.699 | 0.011 | −0.71 | 0.0345 | 0.00035 | 0.187 | −3.79 | 2.06 | 1.03 | 0.50 | 0.06 |
| N | 47,573 | 91 | −1.141 | 0.073 | −1.21 | 0.0110 | 0.00036 | 0.107 | −11.39 | 10.03 | 3.22 | 0.32 | 0.04 |
| NE | 54,616 | 144 | −0.820 | 0.0055 | −0.89 | 0.0069 | 0.00037 | 0.086 | −10.39 | 11.52 | 5.09 | 0.44 | 0.05 |
| E | 59,891 | 401 | 0.116 | −0.018 | 0.13 | 0.0025 | 0.00041 | 0.054 | 2.48 | 12.63 | 14.17 | 1.12 | 0.13 |
| SE | 63,489 | 510 | 0.300 | −0.055 | 0.36 | 0.0019 | 0.00043 | 0.049 | 7.23 | 13.39 | 18.03 | 1.35 | 0.16 |
| South | 62,671 | 549 | 0.387 | −0.074 | 0.46 | 0.0018 | 0.00044 | 0.048 | 9.67 | 13.22 | 19.41 | 1.46 | 0.16 |
| SW | 66,022 | 579 | 0.388 | −0.080 | 0.47 | 0.0017 | 0.00044 | 0.047 | 10.00 | 13.92 | 20.47 | 1.47 | 0.17 |
| W | 64,527 | 396 | 0.029 | −0.005 | 0.033 | 0.0025 | 0.00041 | 0.054 | 0.61 | 13.61 | 14.00 | 1.03 | 0.12 |
| NW | 45,704 | 130 | −0.744 | 0.055 | −0.80 | 0.0077 | 0.00037 | 0.090 | −8.88 | 9.64 | 4.60 | 0.48 | 0.06 |
| Curvature | |||||||||||||
| <0 | 118,957 | 921 | 0.263 | −0.106 | 0.37 | 0.0010 | 0.00052 | 0.040 | 9.14 | 25.08 | 32.56 | 1.30 | 0.43 |
| 0 | 119,461 | 721 | 0.012 | −0.004 | 0.02 | 0.0014 | 0.00047 | 0.043 | 0.36 | 25.19 | 25.49 | 1.01 | 0.34 |
| >0 | 235,823 | 1187 | −0.171 | 0.145 | −0.32 | 0.0008 | 0.00061 | 0.038 | −8.25 | 49.73 | 41.96 | 0.84 | 0.28 |
| SPI | |||||||||||||
| Low erosive | 152,140 | 583 | −0.439 | −0.226 | −0.21 | 0.0017 | 0.00044 | 0.047 | −4.57 | 32.08 | 20.61 | 0.64 | 0.21 |
| high erosive | 157,321 | 792 | −0.165 | −0.324 | 0.16 | 0.0012 | 0.00049 | 0.042 | 3.80 | 33.17 | 28.00 | 0.84 | 0.28 |
| very high erosive | 164,780 | 1454 | 0.400 | −0.719 | 1.12 | 0.0006 | 0.00072 | 0.038 | 29.66 | 34.75 | 51.40 | 1.48 | 0.49 |
| TWI | |||||||||||||
| 2.05–5.4 | 248,941 | 1214 | 0.822 | −0.557 | 1.38 | 0.0008 | 0.00062 | 0.038 | 36.22 | 52.49 | 42.91 | 0.82 | 0.15 |
| 5.4–6.8 | 139,798 | 999 | 1.207 | −0.432 | 1.64 | 0.0010 | 0.00054 | 0.039 | 41.52 | 29.48 | 35.31 | 1.20 | 0.22 |
| 6.8–8.77 | 55,691 | 456 | 1.384 | −0.171 | 1.55 | 0.0022 | 0.00042 | 0.051 | 30.30 | 11.74 | 16.12 | 1.37 | 0.25 |
| 8.77–11.57 | 21,471 | 128 | 1.005 | −0.041 | 1.05 | 0.0078 | 0.00037 | 0.091 | 11.53 | 4.53 | 4.52 | 1.00 | 0.18 |
| 11.57–15.59 | 6495 | 28 | 0.726 | −0.004 | 0.73 | 0.0358 | 0.00035 | 0.190 | 3.83 | 1.37 | 0.99 | 0.72 | 0.13 |
| 15.59–23.51 | 1845 | 4 | 0.364 | 0.005 | 0.36 | 0.2505 | 0.00035 | 0.50 | 0.72 | 0.39 | 0.14 | 0.36 | 0.07 |
| Lithology | |||||||||||||
| Badakada Formation | 72,664 | 104 | −1.427 | −0.032 | −1.40 | 0.0096 | 0.00037 | 0.100 | −13.95 | 15.38 | 3.69 | 0.24 | 0.02 |
| Baskot Marble | 23,743 | 717 | 1.651 | −0.289 | 1.94 | 0.0014 | 0.00047 | 0.044 | 44.33 | 5.02 | 25.41 | 5.06 | 0.50 |
| Batule Formation | 114,974 | 770 | 0.121 | −0.314 | 0.44 | 0.0013 | 0.00048 | 0.042 | 10.28 | 24.33 | 27.29 | 1.12 | 0.11 |
| Chhera Diamictite | 59,485 | 68 | −1.652 | −0.019 | −1.63 | 0.0147 | 0.00036 | 0.123 | −13.30 | 12.59 | 2.41 | 0.19 | 0.02 |
| Karkigaun Schist | 19,391 | 260 | 0.822 | −0.091 | 0.91 | 0.0039 | 0.00039 | 0.066 | 13.95 | 4.10 | 9.21 | 2.25 | 0.22 |
| Karnali Klippe | 41,794 | 83 | −1.099 | −0.024 | −1.07 | 0.0120 | 0.00036 | 0.112 | −9.64 | 8.84 | 2.94 | 0.33 | 0.03 |
| Marka Formation | 140,523 | 820 | −0.017 | −0.339 | 0.32 | 0.0012 | 0.00050 | 0.042 | 7.74 | 29.74 | 29.06 | 0.98 | 0.04 |
| Land Use | |||||||||||||
| Barren land | 5261 | 114 | 1.312 | −0.024 | 1.34 | 0.0089 | 0.00037 | 0.097 | 13.83 | 1.11 | 1.04 | 0.94 | 0.38 |
| Cultivation and Buildup | 136,610 | 546 | −0.396 | 0.132 | −0.53 | 0.0018 | 0.00044 | 0.048 | −11.07 | 28.81 | 5.01 | 0.17 | 0.07 |
| Forest | 323,200 | 2004 | 0.045 | −0.083 | 0.13 | 0.0005 | 0.00121 | 0.041 | 3.07 | 68.15 | 18.38 | 0.27 | 0.11 |
| Water Bodies | 9159 | 165 | 1.123 | −0.035 | 1.16 | 0.0061 | 0.00037 | 0.081 | 14.31 | 1.93 | 1.51 | 0.78 | 0.32 |
| Thrust (m) | |||||||||||||
| 0–500 | 26,231 | 245 | 0.456 | −0.034 | 0.49 | 0.0041 | 0.00038 | 0.067 | 7.29 | 5.51 | 8.86 | 1.57 | 0.52 |
| 500–1000 | 26,825 | 149 | −0.072 | 0.004 | −0.08 | 0.0067 | 0.00037 | 0.084 | −0.90 | 5.66 | 5.27 | 0.93 | 0.31 |
| >1000 | 421,285 | 2435 | −0.032 | 0.222 | −0.25 | 0.0004 | 0.00255 | 0.054 | −4.66 | 88.83 | 86.07 | 0.97 | 0.32 |
| Syncline | |||||||||||||
| Close | 28,999 | 57 | −1.106 | −1.014 | −1.09 | 0.0175 | 0.00036 | 0.134 | 8.15 | 6.10 | 2.01 | 0.33 | 0.07 |
| Nearby | 28,009 | 489 | 1.091 | −0.185 | 1.28 | 0.0020 | 0.00042 | 0.050 | −25.47 | 5.91 | 17.29 | 2.93 | 0.64 |
| Distant | 417,293 | 2283 | −0.081 | −1.644 | 1.56 | 0.0004 | 0.00183 | 0.048 | −32.77 | 87.99 | 80.70 | 0.92 | 0.20 |
| Anticline | |||||||||||||
| Close | 9781 | 137 | 0.868 | −0.044 | 0.91 | 0.0074 | 0.00037 | 0.088 | −10.36 | 2.06 | 4.84 | 2.35 | 0.54 |
| Nearby | 9729 | 96 | 0.513 | −0.029 | 0.54 | 0.0105 | 0.00036 | 0.104 | −5.19 | 2.05 | 3.39 | 1.65 | 0.38 |
| Distant | 454,731 | 2596 | −0.038 | −2.496 | 2.46 | 0.0003 | 0.00429 | 0.068 | −35.92 | 95.89 | 91.76 | 0.96 | 0.22 |
| Road (m) | |||||||||||||
| 0–100 | 122,891 | 1364 | 0.626 | −0.360 | 0.99 | 0.0007 | 0.00068 | 0.038 | 26.10 | 26.91 | 48.21 | 1.86 | 0.47 |
| 100–300 | 132,958 | 721 | −0.096 | 0.035 | −0.13 | 0.0013 | 0.00047 | 0.043 | −3.303 | 28.04 | 25.49 | 0.91 | 0.23 |
| 300–500 | 86,129 | 407 | −0.234 | 0.045 | −0.28 | 0.0024 | 0.00041 | 0.054 | −5.21 | 18.16 | 14.39 | 0.79 | 0.20 |
| >500 | 132,263 | 337 | −0.854 | 0.201 | −1.06 | 0.0029 | 0.00040 | 0.058 | −18.16 | 27.89 | 11.91 | 0.43 | 0.11 |
| Stream (m) | |||||||||||||
| 0–25 | 78,240 | 613 | 0.280 | −0.240 | 0.52 | 0.0016 | 0.00045 | 0.046 | 11.35 | 16.50 | 21.67 | 1.31 | 0.32 |
| 25–50 | 62,086 | 374 | 0.016 | −0.137 | 0.15 | 0.0026 | 0.00040 | 0.056 | 2.74 | 13.09 | 13.22 | 1.01 | 0.24 |
| 50–100 | 109,003 | 586 | −0.099 | −0.227 | 0.13 | 0.0017 | 0.00044 | 0.047 | 2.77 | 22.98 | 20.71 | 0.90 | 0.22 |
| >100 | 224,912 | 1256 | −0.060 | −0.584 | 0.52 | 0.0008 | 0.00063 | 0.038 | 13.80 | 47.43 | 44.40 | 0.94 | 0.23 |
| Precipitation (mm/yr) | |||||||||||||
| 1600 | 52,340 | 94 | −1.199 | −0.028 | −1.17 | 0.0106 | 0.00036 | 0.105 | −11.15 | 11.03 | 3.32 | 0.30 | 0.13 |
| 1800 | 328,437 | 2259 | 0.149 | −1.601 | 1.75 | 0.0004 | 0.00175 | 0.407 | 37.29 | 69.26 | 79.85 | 1.15 | 0.50 |
| 2000 | 93,464 | 476 | −1.153 | −1.079 | 0.03 | 0.0021 | 0.00042 | 0.050 | 0.52 | 19.70 | 16.83 | 0.85 | 0.37 |
| Method | Susceptibility Zones | Total Area (sq. km) | Total Area% | Landslide Area in Zones (sq. km) | Landslide Area% | Landslide Density | Degree of Fit (%) |
|---|---|---|---|---|---|---|---|
| FR | Very low | 38.51 | 20.37 | 0.03 | 2.80 | 0.14 | 2.70 |
| Low | 39.03 | 20.65 | 0.08 | 7.51 | 0.36 | 7.14 | |
| Medium | 37.30 | 19.73 | 0.11 | 10.10 | 0.51 | 10.05 | |
| High | 37.50 | 19.84 | 0.22 | 19.17 | 0.97 | 18.98 | |
| Very High | 36.68 | 19.41 | 0.68 | 60.42 | 3.11 | 61.13 | |
| WOE | Very low | 36.11 | 19.11 | 0.04 | 3.12 | 0.16 | 3.36 |
| Low | 38.32 | 20.28 | 0.06 | 5.07 | 0.25 | 5.14 | |
| Medium | 36.60 | 19.37 | 0.11 | 9.39 | 0.48 | 9.97 | |
| High | 38.48 | 20.36 | 0.18 | 15.80 | 0.78 | 15.96 | |
| Very High | 39.47 | 20.89 | 0.75 | 66.62 | 3.19 | 65.58 |
| Present Observation | Hagen (1969) [39] | Fuchs (1974) [67] | Sharma et al. (1984) [68] | Stocklin (1980) [69] | Dhital (2015) [40] | |||||
|---|---|---|---|---|---|---|---|---|---|---|
| Karnali Klippe | Higher Himalayan Rocks | Kathmandu Nappe | Upper Crystalline Nappe | |||||||
| MCT | --- | |||||||||
| Lesser Himalaya | Ranimatta Formation | Hiunchuli Zone | Chail Nappe | Ranimatta Formation | ||||||
| --Thalaha Thrust (TT)-- | ---- | |||||||||
| Jajarkot Klippe | Thabang Formation | Jajarkot Nappe 1 | Lower Crystalline Nappe | Chaurjhari Group | Thabang Formation | Bhimphedi Group | Bhainseddoban Marble | Higher Himalayan Crystallines | ||
| Chaurjhari Formation | Chaurjhari Formation | Raduwa Formation | ||||||||
| Dangri Formation | Hiunchuli Zone and Piuthan Zone (?) | Chail Nappe | -Marma Khola Thrust- Kuncha Group | ---Mahabharat Thrust--- | ----MCT--- | |||||
| Sharda Group | Dangri Formation | |||||||||
| ----Kapurkot Thrust---- | ||||||||||
| Marka Formation with Chhera Diamictite member | Dailekh Group | Marka Formation | ||||||||
| Chhera Diamictite | ||||||||||
| Ranimatta Formation | ||||||||||
Publisher’s Note: MDPI stays neutral with regard to jurisdictional claims in published maps and institutional affiliations. |
© 2022 by the authors. Licensee MDPI, Basel, Switzerland. This article is an open access article distributed under the terms and conditions of the Creative Commons Attribution (CC BY) license (https://creativecommons.org/licenses/by/4.0/).
Share and Cite
Shahi, Y.B.; Kadel, S.; Dangi, H.; Adhikari, G.; KC, D.; Paudyal, K.R. Geological Exploration, Landslide Characterization and Susceptibility Mapping at the Boundary between Two Crystalline Bodies in Jajarkot, Nepal. Geotechnics 2022, 2, 1059-1083. https://doi.org/10.3390/geotechnics2040050
Shahi YB, Kadel S, Dangi H, Adhikari G, KC D, Paudyal KR. Geological Exploration, Landslide Characterization and Susceptibility Mapping at the Boundary between Two Crystalline Bodies in Jajarkot, Nepal. Geotechnics. 2022; 2(4):1059-1083. https://doi.org/10.3390/geotechnics2040050
Chicago/Turabian StyleShahi, Yubraj Bikram, Sushma Kadel, Harish Dangi, Ganesh Adhikari, Diwakar KC, and Kabi Raj Paudyal. 2022. "Geological Exploration, Landslide Characterization and Susceptibility Mapping at the Boundary between Two Crystalline Bodies in Jajarkot, Nepal" Geotechnics 2, no. 4: 1059-1083. https://doi.org/10.3390/geotechnics2040050