
Review of Capillary Rise Experiments for Surface-Active Solutes in the Subsurface


Abstract
:1. Introduction
2. Surface-Active Solutes of Geo-Environmental Interest
2.1. Alcohols
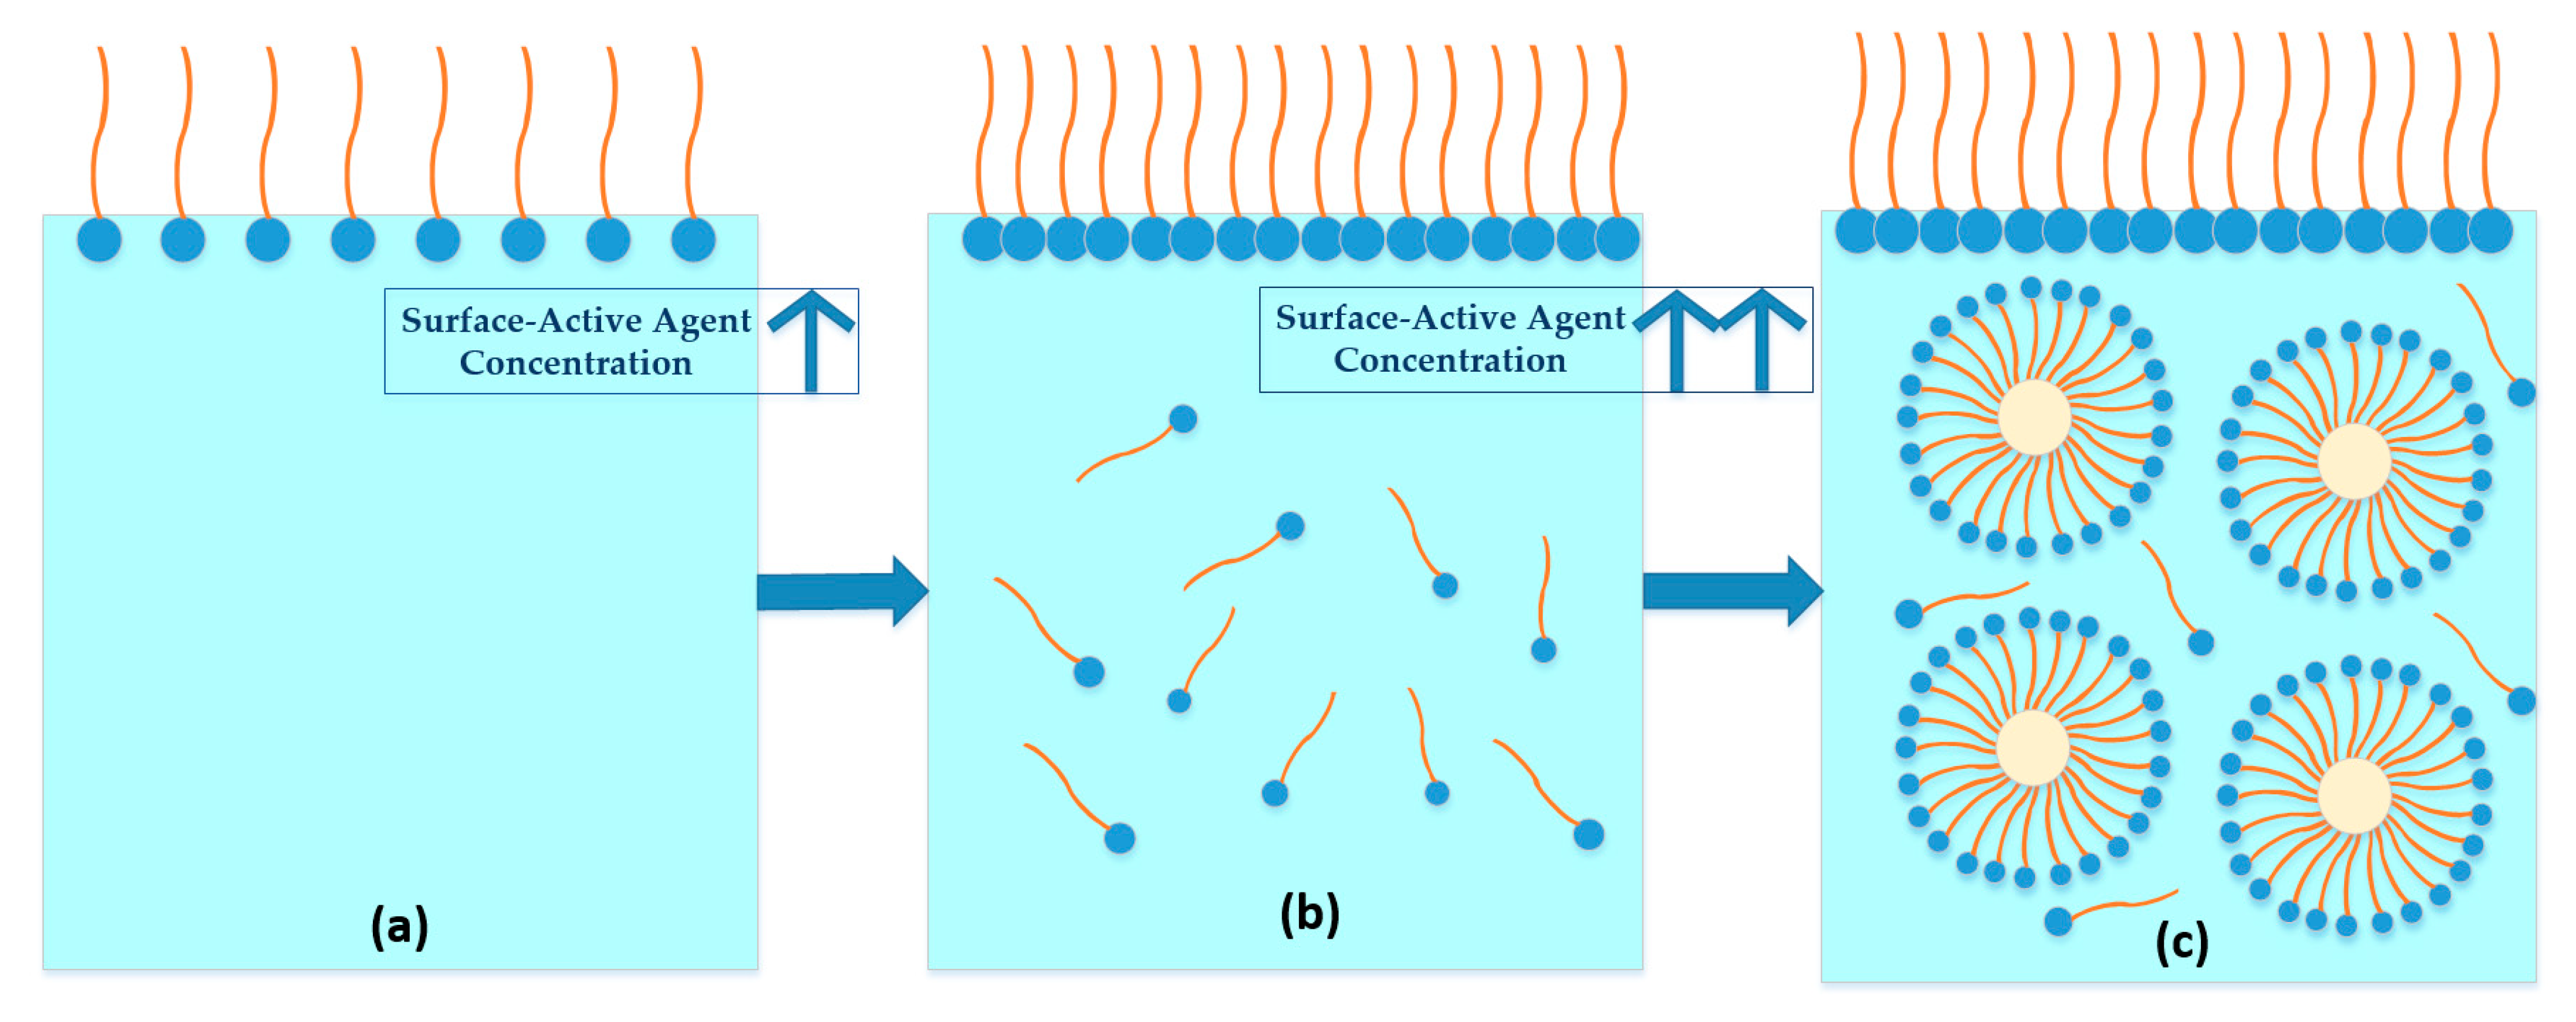
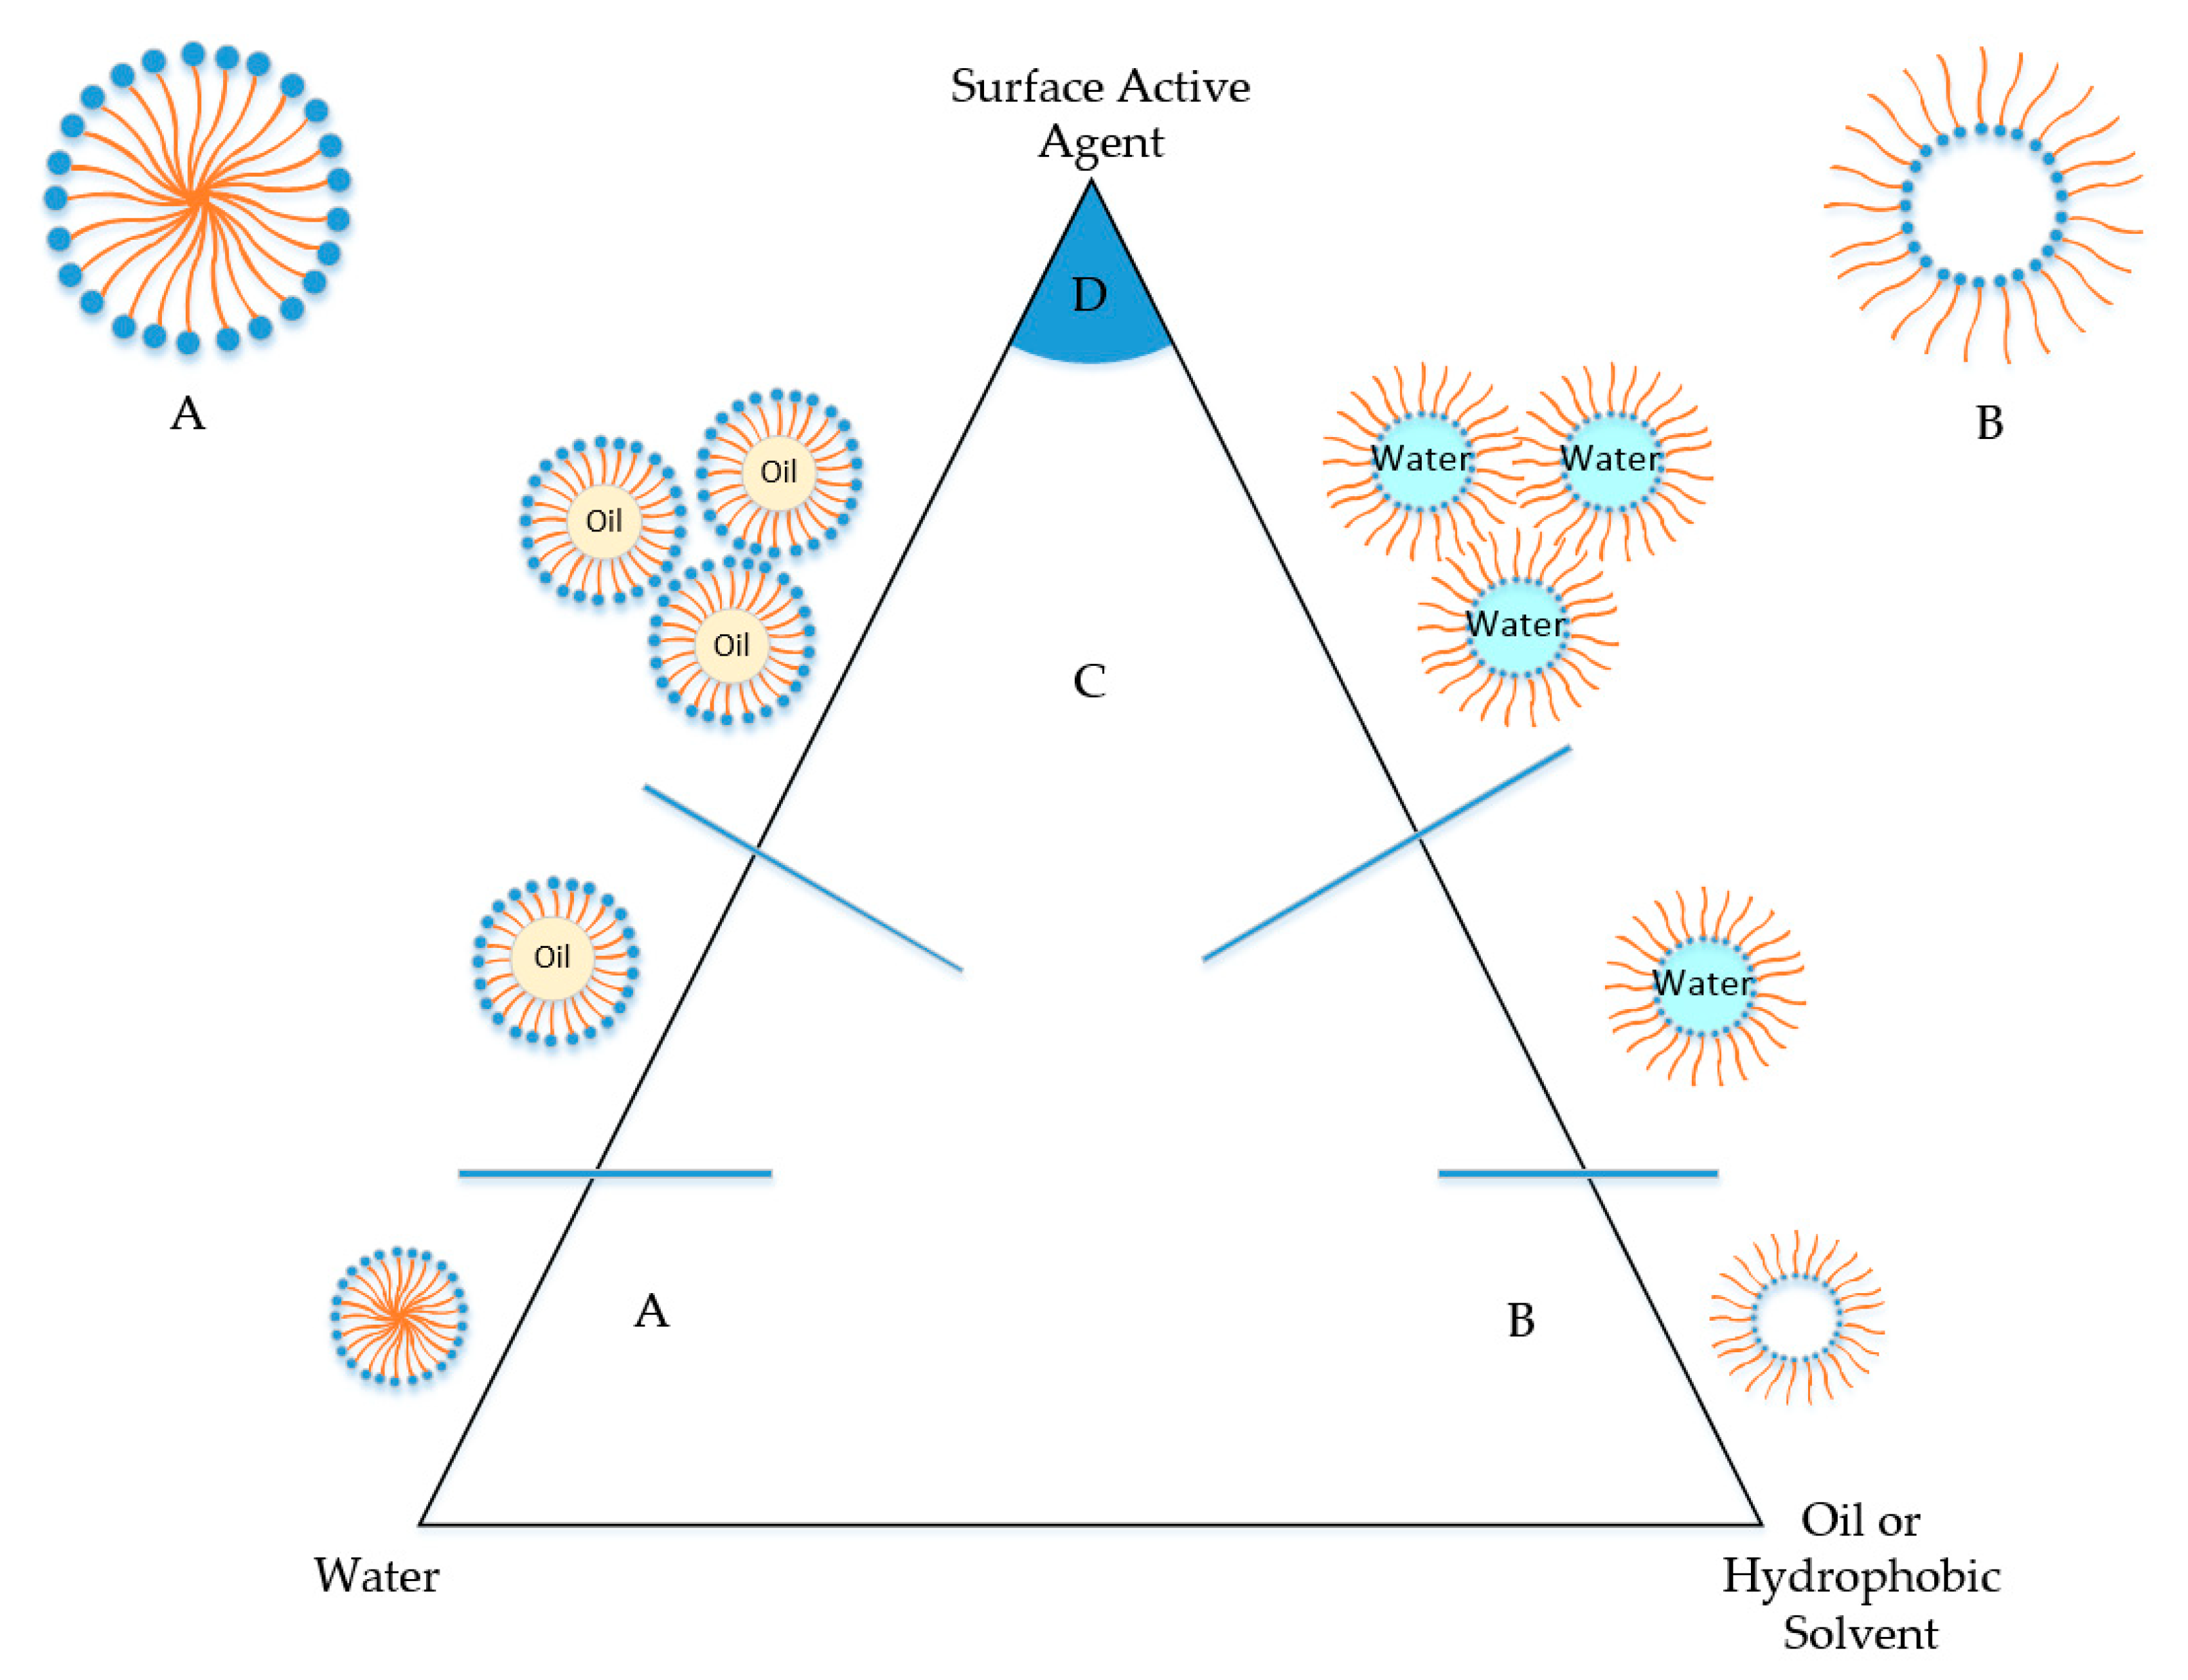
2.2. Surfactants

2.3. Perfluoroalkyl and Polyfluoroalkyl Substances (PFAS)

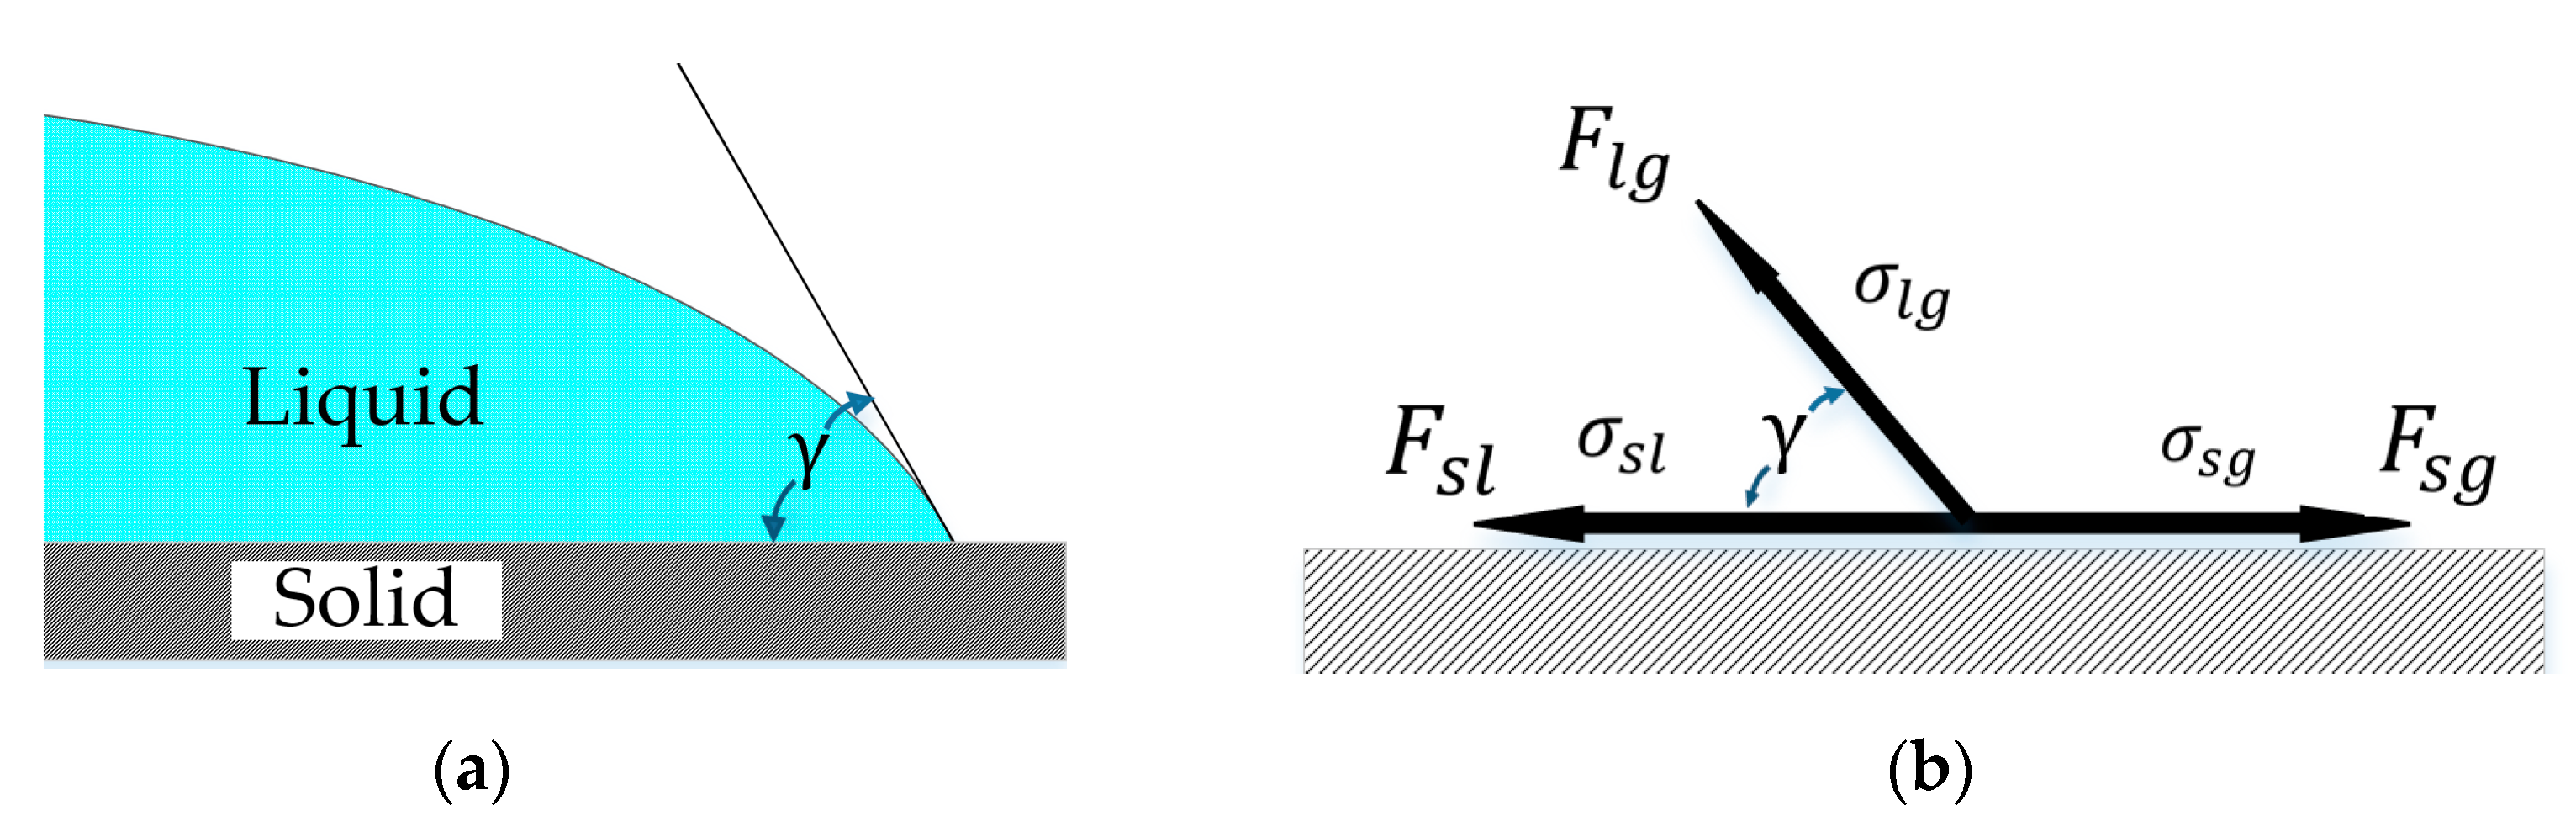
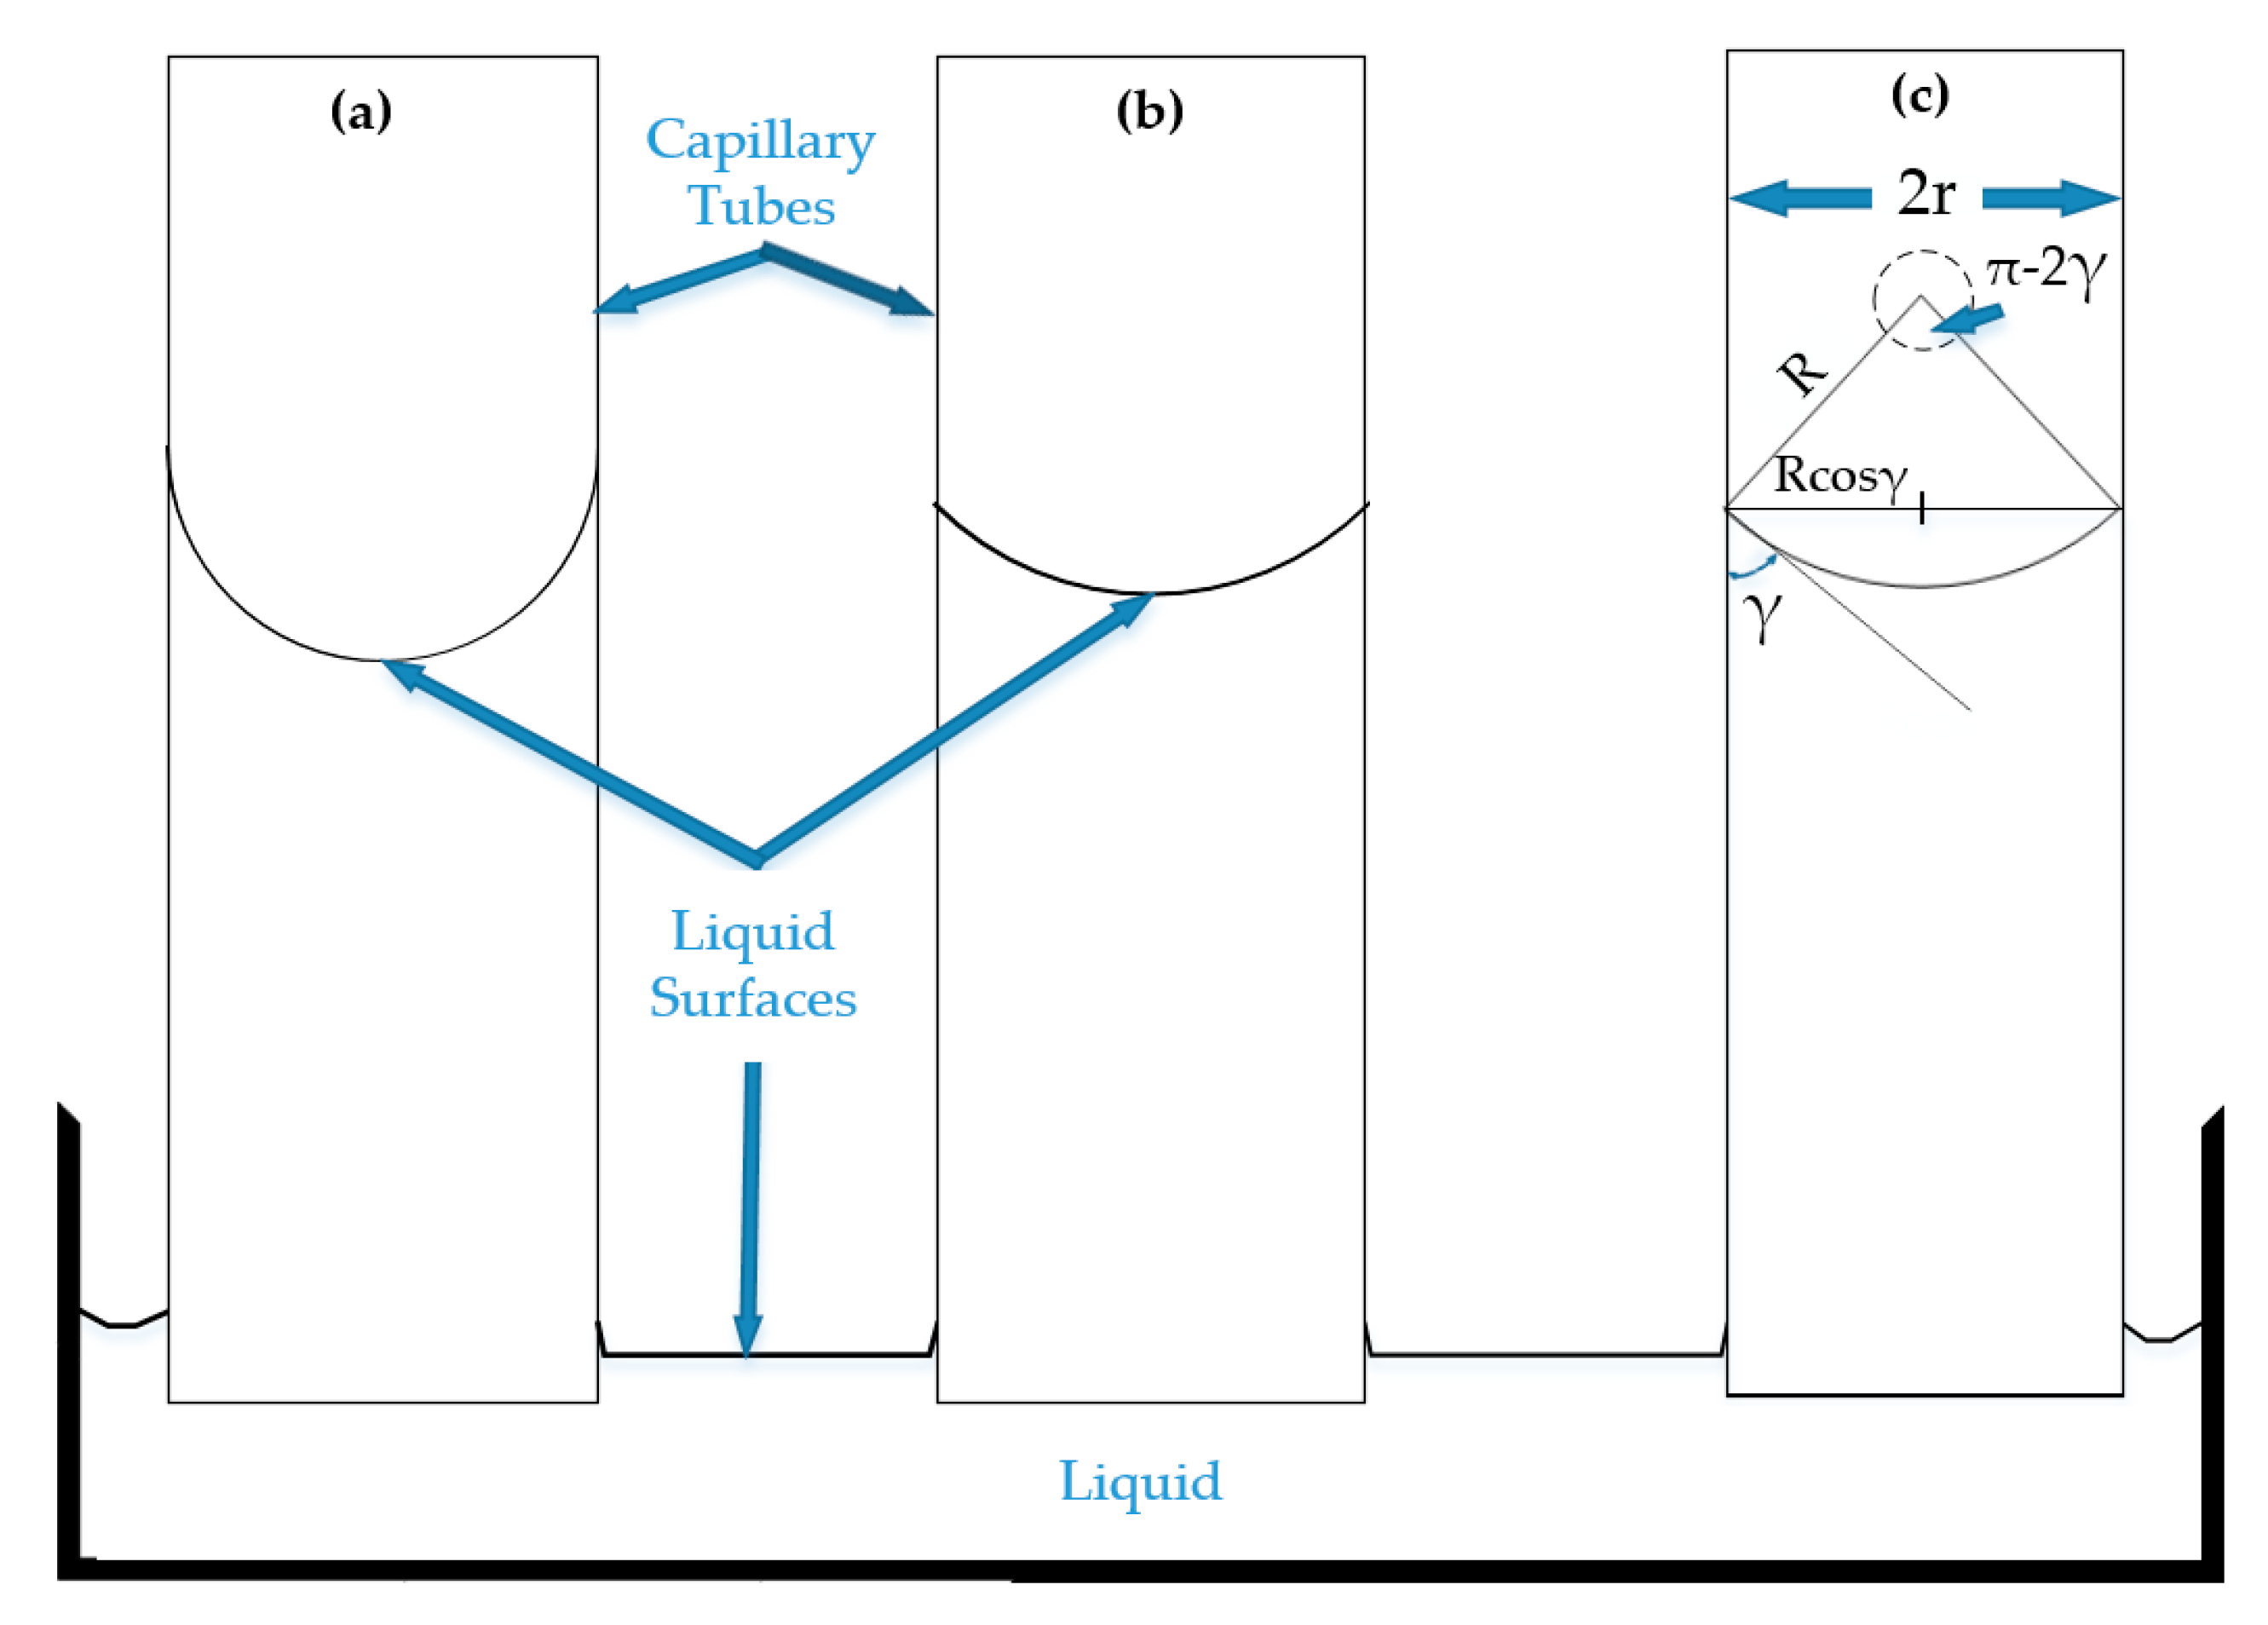
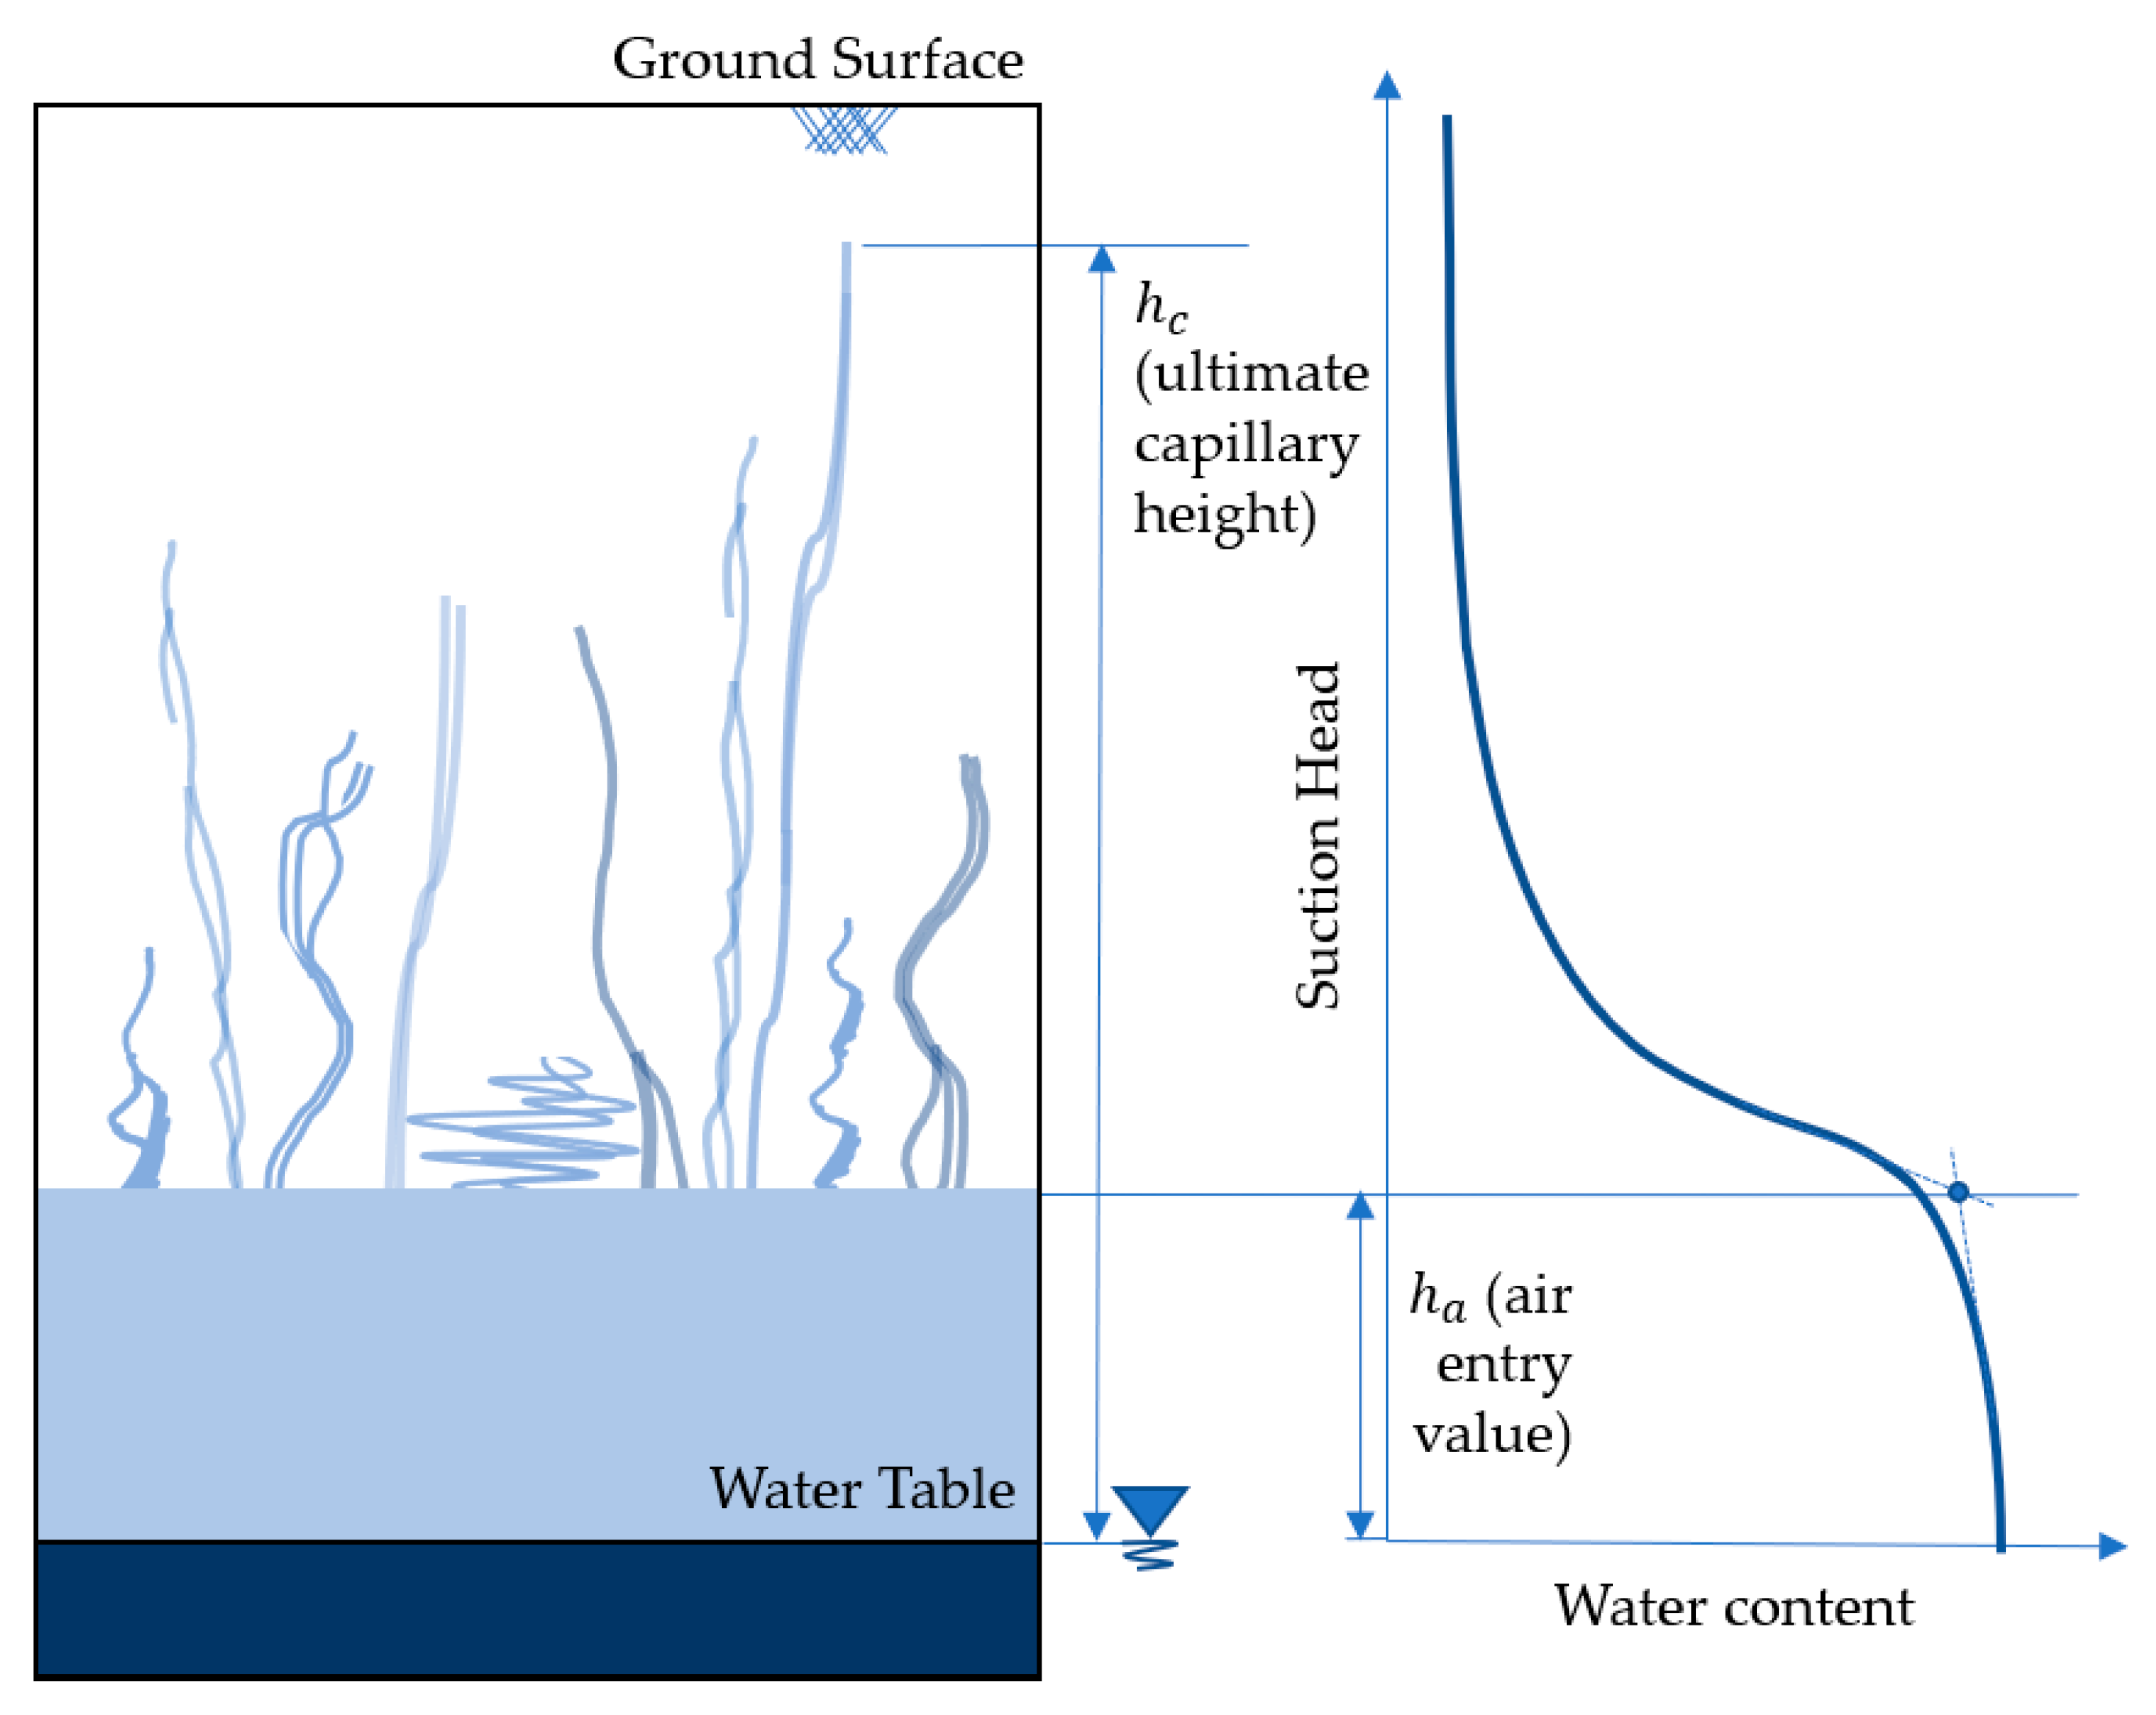
3. Basic Theory of Capillarity
4. Surface-Active Solutes’ Effects on Hydraulic Properties of Unsaturated Porous Media
4.1. Concentration-Dependent Surface-Active Solutes’ Effects on Capillarity
4.2. Concentration-Dependent Surface-Active Solutes’ Effects on Soil Matrix and Saturated/Unsaturated Hydraulic Conductivity
4.3. Concentration-Dependent Surface-Active Solutes’ Effects on Hydraulic Hysteresis
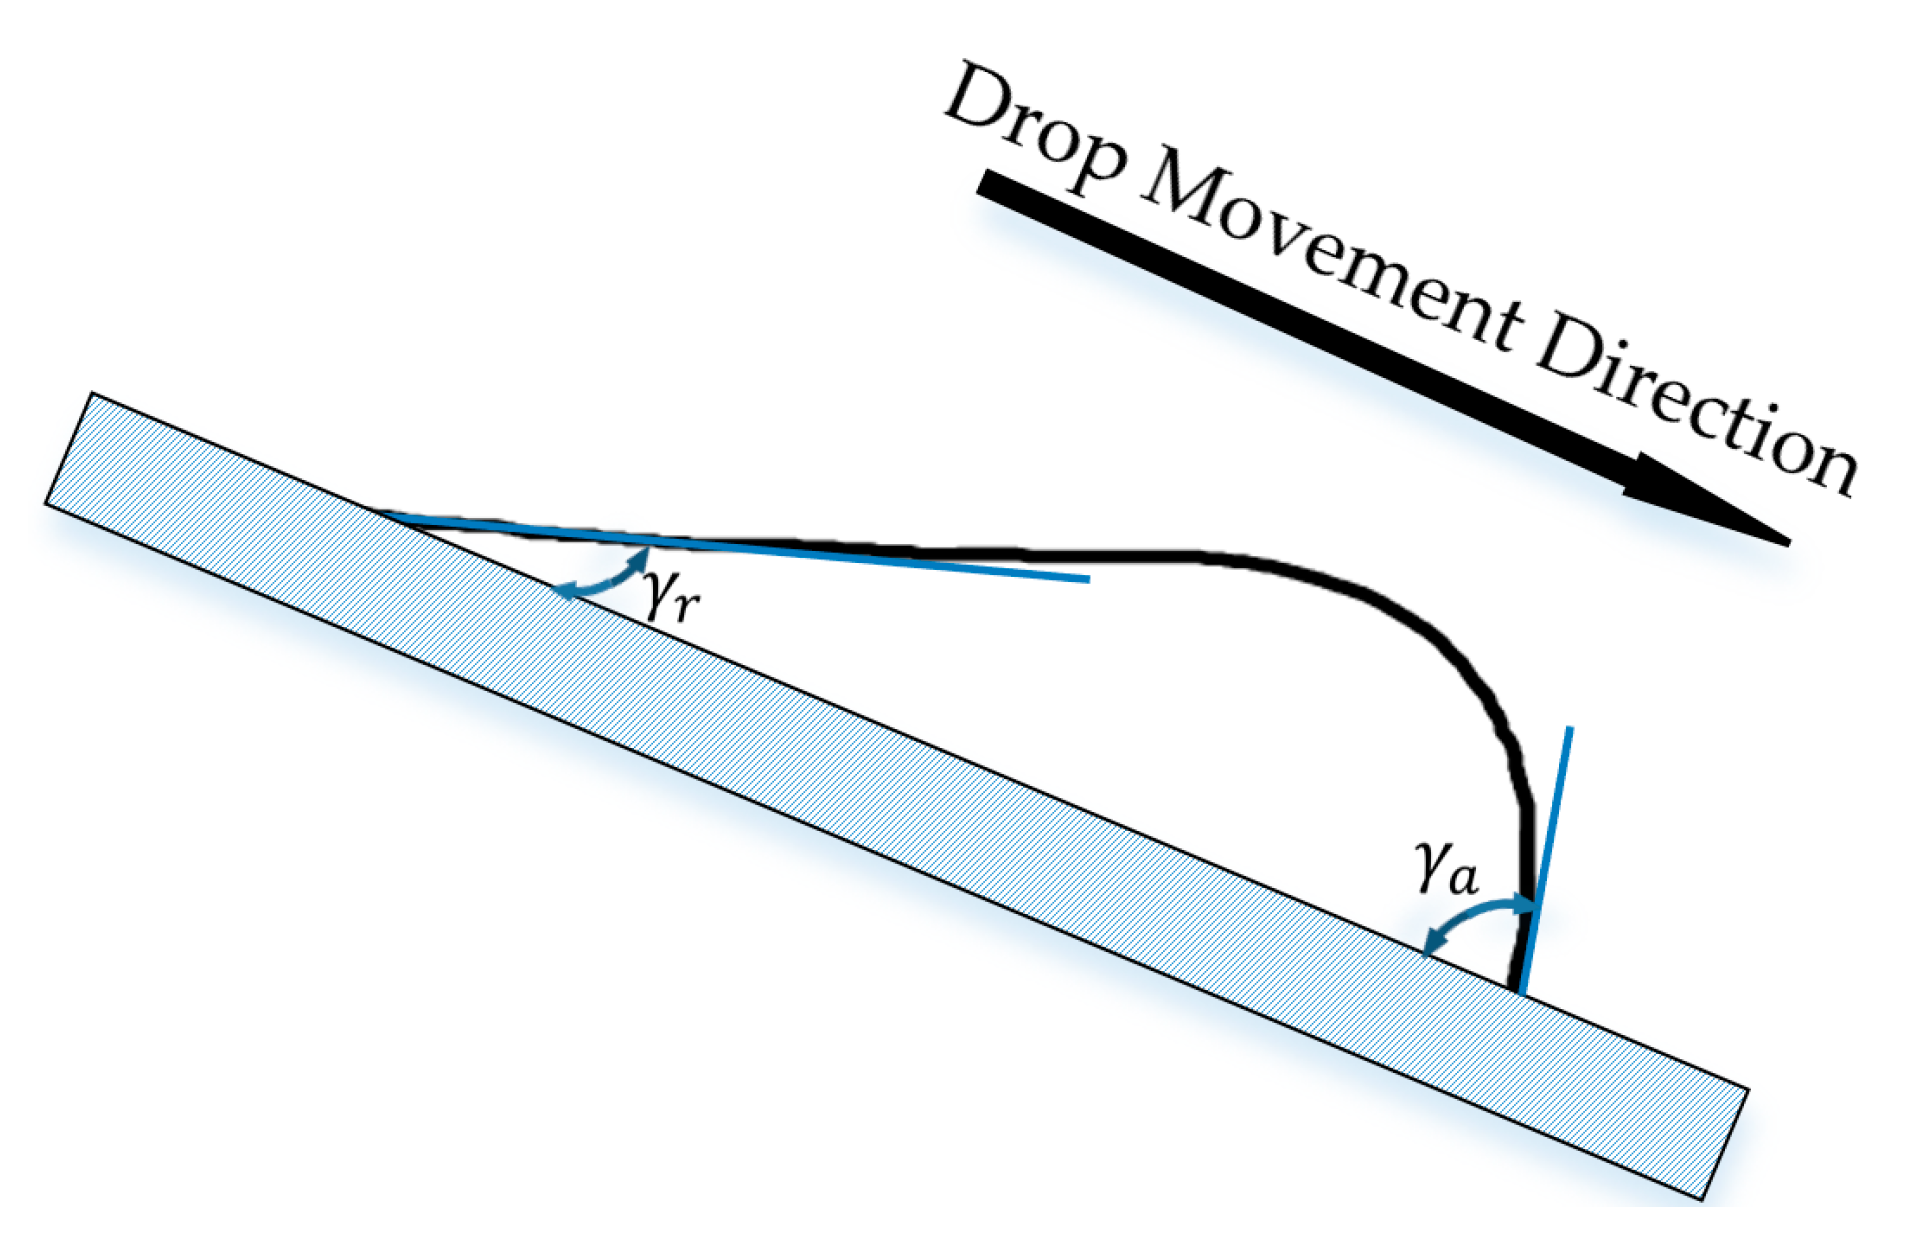
5. Determination of Contact Angle in Soils
6. Experimental Studies of Capillary Rise
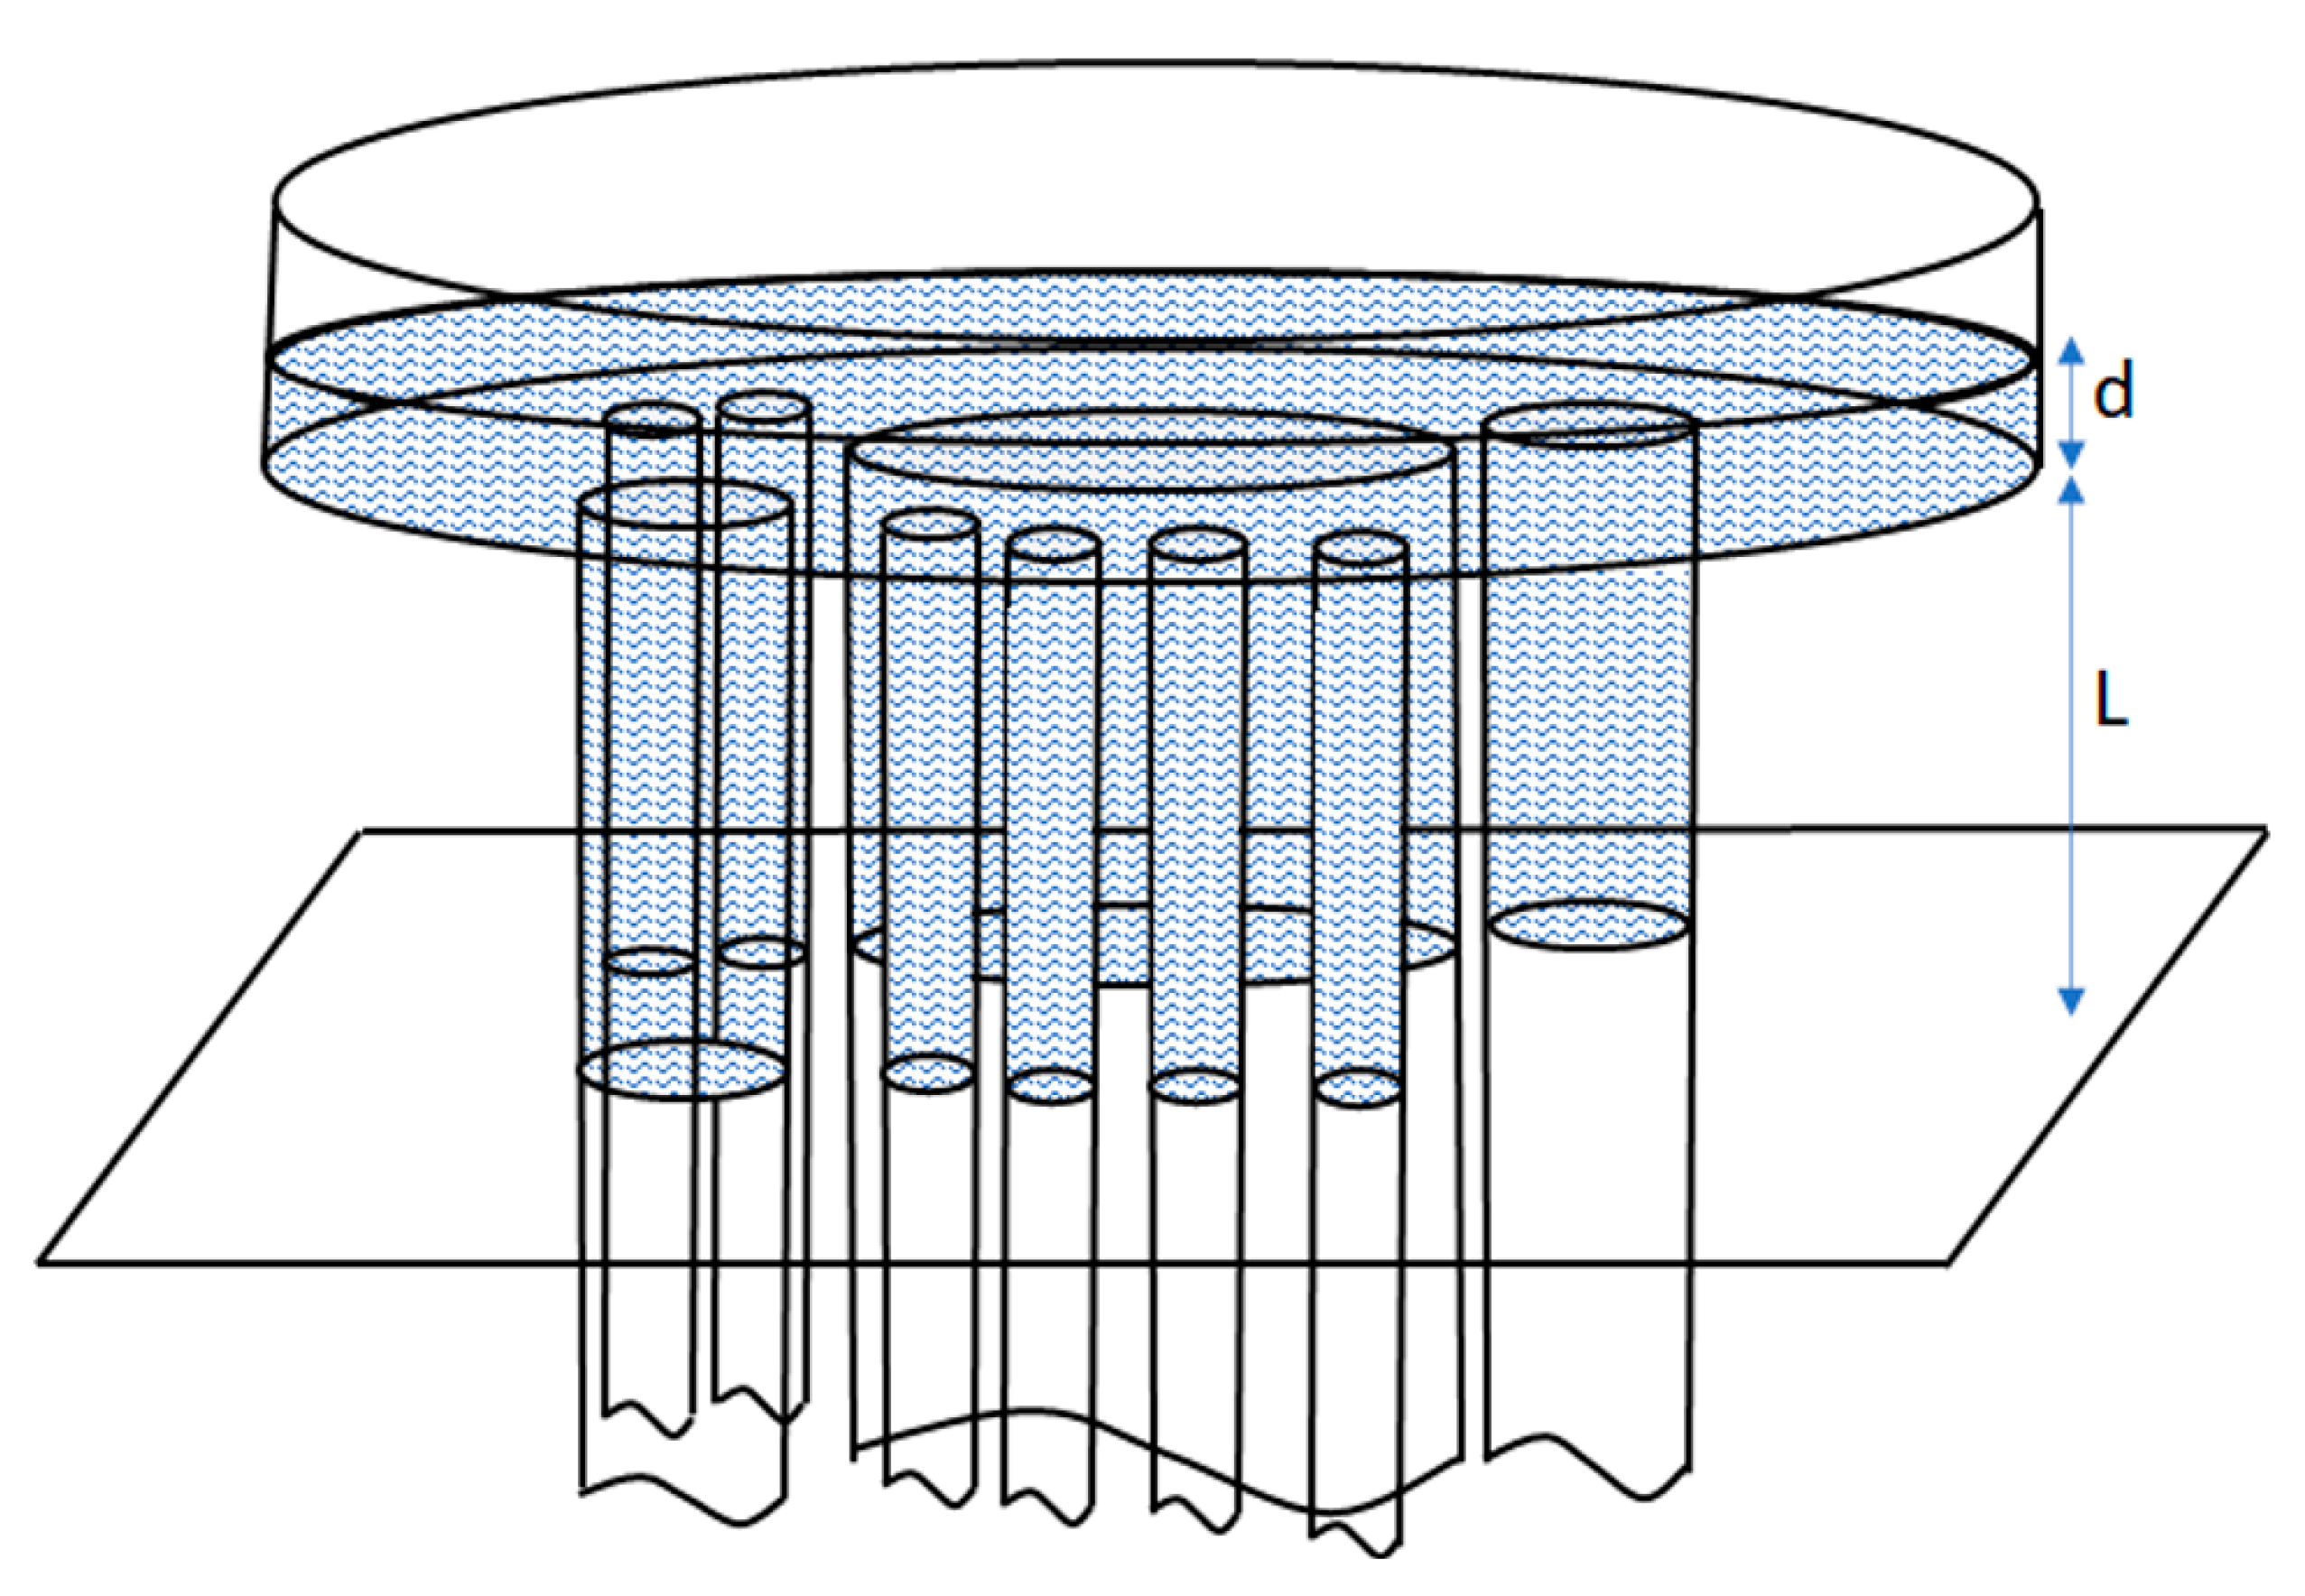
6.1. Estimations of Capillary Rise Height
6.2. Estimation of Contact Angle
6.2.1. Static Capillary Rise Experiments
6.2.2. Dynamic Capillary Rise Experiments
6.3. Capillary Rise Experiments for Surface-Active Solutes
7. Summary
Author Contributions
Funding
Conflicts of Interest
References
- Henry, E.J.; Smith, J.E. Surfactant-Induced Flow Phenomena in the Vadose Zone: A Review of Data and Numerical Modeling. Vadose Zo. J. 2003, 2, 154–167. [Google Scholar] [CrossRef]
- Karagunduz, A.; Pennell, K.D.; Young, M.H. Influence of a Nonionic Surfactant on the Water Retention Properties of Unsaturated Soils. Soil Sci. Soc. Am. J. 2001, 65, 1392–1399. [Google Scholar] [CrossRef] [Green Version]
- Karagunduz, A.; Young, M.H.; Pennell, K.D. Influence of Surfactants on Unsaturated Water Flow and Solute Transport. Water Resour. Res. 2015, 51, 1977–1988. [Google Scholar] [CrossRef]
- Bashir, R.; Smith, J.E.; Stolle, D.F.E. Surfactant Flow and Transport in the Vadose Zone: A Numerical Experiment. Environ. Geotech. 2018, 7, 361–372. [Google Scholar] [CrossRef]
- Henry, E.J.; Smith, J.E.; Warrick, A.W. Solubility Effects on Surfactant-Induced Unsaturated Flow through Porous Media. J. Hydrol. 1999, 223, 164–174. [Google Scholar] [CrossRef]
- Bashir, R.; Smith, J.E.; Stolle, D.F. Surfactant-Induced Unsaturated Flow: Instrumented Horizontal Flow Experiment and Hysteretic Modeling. Soil Sci. Soc. Am. J. 2008, 72, 1510–1519. [Google Scholar] [CrossRef]
- Henry, E.J.; Smith, J.E. The Effect of Surface-Active Solutes on Water Flow and Contaminant Transport in Variably Saturated Porous Media with Capillary Fringe Effects. J. Contam. Hydrol. 2002, 56, 247–270. [Google Scholar] [CrossRef]
- Smith, J.E.; Henry, E.J.; Bashir, R. Solute-Dependent Capillarity-Induced Focused Flow during Infiltration into Alcohol-Contaminated Soil. Vadose Zo. J. 2011, 10, 403–411. [Google Scholar] [CrossRef]
- Boduroglu, S.; Bashir, R. Numerical Experiments on Flow and Transport of Various Surfactant Solutions in the Vadose Zone. In Proceedings of the GeoEdmonton, Edmonton, AB, Canada, 23–26 September 2018; The Canadian Geotechnical Society: Edmonton, AB, Canada, 2018. [Google Scholar]
- Smith, J.E.; Gillham, R.W. Effects of Solute Concentration-Dependent Surface Tension on Unsaturated Flow: Laboratory Sand Column Experiments. Water Resour. Res. 1999, 35, 973–982. [Google Scholar] [CrossRef]
- Lu, N.; Likos, W.J. Rate of Capillary Rise in Soil. J. Geotech. Geoenviron. Eng. 2004, 130, 646–650. [Google Scholar] [CrossRef]
- Soleimani-Fard, H.; König, D.; Goudarzy, M. Experimental and Numerical Analyses of Uprising Moisture in Fine Grained Soils. J. Geoengin. 2021, 16, 001–014. [Google Scholar] [CrossRef]
- Li, Y.; Zhang, C.; Chen, C.; Chen, H. Calculation of Capillary Rise Height of Soils by SWCC Model. Adv. Civ. Eng. 2018, 2018, 5190354. [Google Scholar] [CrossRef] [Green Version]
- Heidar Barghi, M. Use of Capillary Action to Control Soil Moisture; University of Birmingham: Birmingham, UK, 2018. [Google Scholar]
- Letey, J.; Carrillo, M.L.K.; Pang, X.P. Approaches to Characterize the Degree of Water Repellency. J. Hydrol. 2000, 231–232, 61–65. [Google Scholar] [CrossRef]
- Selker, J.S.; Schroth, M.H. Evaluation of Hydrodynamic Scaling in Porous Media Using Finger Dimensions. Water Resour. Res. 1998, 34, 1935–1940. [Google Scholar] [CrossRef] [Green Version]
- Liu, Z.; Yu, X.; Wan, L. Capillary Rise Method for the Measurement of the Contact Angle of Soils. Acta Geotech. 2014, 11, 21–35. [Google Scholar] [CrossRef]
- Ishakoglu, A.; Baytas, A.F. The Influence of Contact Angle on Capillary Pressure–Saturation Relations in a Porous Medium Including Various Liquids. Int. J. Eng. Sci. 2005, 43, 744–755. [Google Scholar] [CrossRef]
- Tarchitzky, J.; Lerner, O.; Shani, U.; Arye, G.; Lowengart-Aycicegi, A.; Brener, A.; Chen, Y. Water Distribution Pattern in Treated Wastewater Irrigated Soils: Hydrophobicity Effect. Eur. J. Soil Sci. 2007, 58, 573–588. [Google Scholar] [CrossRef]
- Doerr, S.H.; Shakesby, R.A.; Walsh, R.P.D. Soil Water Repellency: Its Causes, Characteristics and Hydro-Geomorphological Significance. Earth-Science Rev. 2000, 51, 33–65. [Google Scholar] [CrossRef]
- Maimon, A.; Gross, A.; Arye, G. Greywater-Induced Soil Hydrophobicity. Chemosphere 2017, 184, 1012–1019. [Google Scholar] [CrossRef]
- Beatty, S.M.; Smith, J.E. Fractional Wettability and Contact Angle Dynamics in Burned Water Repellent Soils. J. Hydrol. 2010, 391, 97–108. [Google Scholar] [CrossRef]
- Ritsema, C.J.; Dekker, L.W. How Water Moves in a Water Repellent Sandy Soil: 2. Dynamics of Fingered Flow. Water Resour. Res. 1994, 30, 2519–2531. [Google Scholar] [CrossRef]
- Gross, A.; Mohamed, M.R.; Anda, M.; Ho, G. Effectiveness of Wetting Agents for Irrigating Sandy Soils. Water 2011, 38, 154–157. [Google Scholar]
- König, G.; Reetz, M.T.; Thiel, W. 1-Butanol as a Solvent for Efficient Extraction of Polar Compounds from Aqueous Medium: Theoretical and Practical Aspects. J. Phys. Chem. B 2018, 122, 6975–6988. [Google Scholar] [CrossRef] [PubMed]
- Jazwiec, A. Focused Flow During Water Infiltration into Ethanol Contaminated Unsaturated Porous Media; McMaster University: Hamilton, ON, Canada, 2018. [Google Scholar]
- Vuong, K.H. Modeling the Fate of Groundwater Contaminants Resulting from Leakage of Butanol-Blended Fuel. Master’s Thesis, Department of the Air Force, Air Force Institute of Technology, Air University, Wright-Patterson Air Force Base, Fairborn, OH, USA, 2010. [Google Scholar]
- Karimi, K.; Tabatabaei, M.; Sárvári Horváth, I.; Kumar, R. Recent Trends in Acetone, Butanol, and Ethanol (ABE) Production. Biofuel Res. J. 2015, 2, 301–308. [Google Scholar] [CrossRef]
- Olkowska, E.; Ruman, M.; Polkowska, Ż. Occurrence of Surface Active Agents in the Environment. J. Anal. Methods Chem. 2014, 2014, 769708. [Google Scholar] [CrossRef]
- Li, Q. Effect of Surfactants on the Sorption and Transport of Cu (II) in a Sandy Soil: Batch, Column Experiments and Modeling; Concordia University: Montreal, QC, Canada, 2000. [Google Scholar]
- Travis, M.J.; Wiel-Shafran, A.; Weisbrod, N.; Adar, E.; Gross, A. Greywater Reuse for Irrigation: Effect on Soil Properties. Sci. Total Environ. 2010, 408, 2501–2508. [Google Scholar] [CrossRef]
- Travis, M.J.; Weisbrod, N.; Gross, A. Accumulation of Oil and Grease in Soils Irrigated with Greywater and Their Potential Role in Soil Water Repellency. Sci. Total Environ. 2008, 394, 68–74. [Google Scholar] [CrossRef]
- Paria, S. Surfactant-Enhanced Remediation of Organic Contaminated Soil and Water. Adv. Colloid Interface Sci. 2008, 138, 24–58. [Google Scholar] [CrossRef]
- Khandoozi, S.; Sharifi, A.; Riazi, M. Chapter 3 - Enhanced Oil Recovery Using Surfactants. In Chemical Methods; Hemmati-Sarapardeh, A., Schaffie, M., Ranjbar, M., Dong, M., Li, Z., Eds.; Enhanced Oil Recovery Series; Gulf Professional Publishing: Oxford, UK, 2022; pp. 95–139. ISBN 978-0-12-821931-7. [Google Scholar]
- Gross, A.; Shmueli, O.; Ronen, Z.; Raveh, E. Recycled Vertical Flow Constructed Wetland (RVFCW)—a Novel Method of Recycling Greywater for Irrigation in Small Communities and Households. Chemosphere 2007, 66, 916–923. [Google Scholar] [CrossRef]
- Ghunmi, L.A.; Zeeman, G.; Fayyad, M.; Van Lier, J.B. Grey Water Treatment Systems: A Review. Crit. Rev. Environ. Sci. Technol. 2011, 41, 657–698. [Google Scholar] [CrossRef]
- Wiel-Shafran, A.; Ronen, Z.; Weisbrod, N.; Adar, E.; Gross, A. Potential Changes in Soil Properties Following Irrigation with Surfactant-Rich Greywater. Ecol. Eng. 2006, 26, 348–354. [Google Scholar] [CrossRef]
- Mohamed, R.M.S.R.; Kassim, A.H.M.; Anda, M.; Dallas, S. A Monitoring of Environmental Effects from Household Greywater Reuse for Garden Irrigation. Environ. Monit. Assess. 2013, 185, 8473–8488. [Google Scholar] [CrossRef] [PubMed]
- Morel, A.; Diener, S. Greywater Management in Low and Middle-Income Countries, Review of Different Treatment Systems for Households or Neighbourhoods; EAWAG: Duebendorf, Switzerland, 2006; ISBN 978-3-906484-37-2. [Google Scholar]
- Bajpai, D.; Tyagi, V.K. Laundry Detergents: An Overview. J. Oleo Sci. 2007, 56, 327–340. [Google Scholar] [CrossRef] [PubMed] [Green Version]
- Huang, Z. Fate and Transport of Surfactants in Graywater When Applied to Soil; Colorado State University: Fort Collins, CO, USA, 2013. [Google Scholar]
- Human and Environment Risk Assessment Agency (HERA). Human and Environment Risk Assessment Agency (HERA) Revised Linear Alkylbenzene Sulphonate Report (CAS No. 68411-30-3). Environ. Risk 2013, 101. [Google Scholar]
- Leuther, F.; Schlüter, S.; Wallach, R.; Vogel, H.-J. Structure and Hydraulic Properties in Soils under Long-Term Irrigation with Treated Wastewater. Geoderma 2019, 333, 90–98. [Google Scholar] [CrossRef]
- Dantas, T.; Santanna, V.; Souza, T.; Lucas, C.; Dantas Neto, A.; Aum, P. Microemulsions and Nanoemulsions Applied to Well Stimulation and Enhanced Oil Recovery (EOR). Brazilian J. Pet. Gas 2019, 12, 251–265. [Google Scholar] [CrossRef]
- Yang, K.; Zhu, L.; Xing, B. Enhanced Soil Washing of Phenanthrene by Mixed Solutions of TX100 and SDBS. Environ. Sci. Technol. 2006, 40, 4274–4280. [Google Scholar] [CrossRef]
- Harendra, S.; Vipulanandan, C. Sorption and Transport Studies of Cetyl Trimethylammonium Bromide (CTAB) and Triton X-100 in Clayey Soil. J. Environ. Sci. 2013, 25, 576–584. [Google Scholar] [CrossRef]
- Park, J.; Vipulanandan, C.; Kim, J.W.; Oh, M.H. Effects of Surfactants and Electrolyte Solutions on the Properties of Soil. Environ. Geol. 2006, 49, 977–989. [Google Scholar] [CrossRef]
- Befkadu, A.A.; Chen, Q. Surfactant-Enhanced Soil Washing for Removal of Petroleum Hydrocarbons from Contaminated Soils: A Review. Pedosphere 2018, 28, 383–410. [Google Scholar] [CrossRef]
- Mulligan, C.N.; Yong, R.N.; Gibbs, B.F. Surfactant-Enhanced Remediation of Contaminated Soil: A Review. Eng. Geol. 2001, 60, 371–380. [Google Scholar] [CrossRef]
- Mao, X.; Jiang, R.; Xiao, W.; Yu, J. Use of Surfactants for the Remediation of Contaminated Soils: A Review. J. Hazard. Mater. 2015, 285, 419–435. [Google Scholar] [CrossRef] [PubMed]
- Organisation for Economic Co-operation and Development (OECD). Water Resources Allocation; OECD Studies on Water; OECD: Paris, France, 2015; ISBN 9789264229624.
- Mousavi, S.A.; Khodadoost, F. Effects of Detergents on Natural Ecosystems and Wastewater Treatment Processes: A Review. Environ. Sci. Pollut. Res. 2019, 26, 26439–26448. [Google Scholar] [CrossRef] [PubMed]
- Ying, G.-G. Fate, Behavior and Effects of Surfactants and Their Degradation Products in the Environment. Environ. Int. 2006, 32, 417–431. [Google Scholar] [CrossRef] [PubMed]
- Jindal, P.; Sharma, J.; Bashir, R. Effect of Pore-Water Surface Tension on Tensile Strength of Unsaturated Sand. Indian Geotech. J. 2016, 46, 276–290. [Google Scholar] [CrossRef] [Green Version]
- Buck, R.C.; Franklin, J.; Berger, U.; Conder, J.M.; Cousins, I.T.; De Voogt, P.; Jensen, A.A.; Kannan, K.; Mabury, S.A.; van Leeuwen, S.P.J. Perfluoroalkyl and Polyfluoroalkyl Substances in the Environment: Terminology, Classification, and Origins. Integr. Environ. Assess. Manag. 2011, 7, 513–541. [Google Scholar] [CrossRef]
- Bouazza, A. Interaction between PFASs and Geosynthetic Liners: Current Status and the Way Forward. Geosynth. Int. 2021, 28, 214–223. [Google Scholar] [CrossRef]
- Glüge, J.; Scheringer, M.; Cousins, I.T.; DeWitt, J.C.; Goldenman, G.; Herzke, D.; Lohmann, R.; Ng, C.A.; Trier, X.; Wang, Z. An Overview of the Uses of Per- and Polyfluoroalkyl Substances (PFAS). Environ. Sci. Process. Impacts 2020, 22, 2345–2373. [Google Scholar] [CrossRef]
- Brusseau, M.L.; Yan, N.; Van Glubt, S.; Wang, Y.; Chen, W.; Lyu, Y.; Dungan, B.; Carroll, K.C.; Holguin, F.O. Comprehensive Retention Model for PFAS Transport in Subsurface Systems. Water Res. 2019, 148, 41–50. [Google Scholar] [CrossRef]
- Organisation for Economic Cooperation and Development (OECD). Toward a New Comprehensive Global Database of Per- and Polyfluoroalkyl Substances (PFASs); OECD: Paris, France, 2018; Volume 39.
- Brendel, S.; Fetter, É.; Staude, C.; Vierke, L.; Biegel-Engler, A. Short-Chain Perfluoroalkyl Acids: Environmental Concerns and a Regulatory Strategy under REACH. Environ. Sci. Eur. 2018, 30, 1–11. [Google Scholar] [CrossRef]
- United States Environmental Protection Agency (EPA). PFAS Strategic Roadmap: EPA’s Commitments to Action (2021–2024) EPA-100-K-21-002; EPA: Washington, DC, USA, 2021; Volume 26.
- United States Department of Health and Human Services Agency. United States Department of Health and Human Services Agency for Toxic Substances and Disease Registry Toxicological Profile for Perfluoroalkyls CS274127-A; United States Department of Health and Human Services Agency: Washington, DC, USA, 2021; Volume 676.
- Stahl, T.; Heyn, J.; Thiele, H.; Hüther, J.; Failing, K.; Georgii, S.; Brunn, H. Carryover of Perfluorooctanoic Acid (PFOA) and Perfluorooctane Sulfonate (PFOS) from Soil to Plants. Arch. Environ. Contam. Toxicol. 2009, 57, 289–298. [Google Scholar] [CrossRef] [PubMed]
- Death, C.; Bell, C.; Champness, D.; Milne, C.; Reichman, S.; Hagen, T. Per- and Polyfluoroalkyl Substances (PFAS) in Livestock and Game Species: A Review. Sci. Total Environ. 2021, 774, 144795. [Google Scholar] [CrossRef] [PubMed]
- Kim, Y.R.; White, N.; Bräunig, J.; Vijayasarathy, S.; Mueller, J.F.; Knox, C.L.; Harden, F.A.; Pacella, R.; Toms, L.-M.L. Per- and Poly-Fluoroalkyl Substances (PFASs) in Follicular Fluid from Women Experiencing Infertility in Australia. Environ. Res. 2020, 190, 109963. [Google Scholar] [CrossRef] [PubMed]
- The White House Briefing Room Fact Sheet: Biden-Harris Administration Combatting PFAS Pollution to Safeguard Clean Drinking Water for All Americans. Available online: https://www.whitehouse.gov/briefing-room/statements-releases/2022/06/15/fact-sheet-biden-harris-administration-combatting-pfas-pollution-to-safeguard-clean-drinking-water-for-all-americans/ (accessed on 1 August 2022).
- Kislik, V.S. Advances in Development of Solvents for Liquid–Liquid Extraction. In Solvent Extraction: Classical and Novel Approaches; Elsevier: Oxford, UK, 2012; pp. 451–481. ISBN 978-0-444-53778-2. [Google Scholar]
- Pomeau, Y.; Villermaux, E. Two Hundred Years of Capillarity Research. Phys. Today 2006, 59, 39–44. [Google Scholar] [CrossRef] [Green Version]
- Jurin, J., II. An Account of Some Experiments Shown before the Royal Society; with an Enquiry into the Cause of the Ascent and Suspension of Water in Capillary Tubes. Philos. Trans. R. Soc. London 1719, 30, 739–747. [Google Scholar] [CrossRef]
- Laplace, P.S. Traité de Mécanique Céleste; A Paris: De L’Imprimerie de Crapelet: Paris, France, 1805; pp. 1–2. [Google Scholar]
- Young, T., III. An Essay on the Cohesion of Fluids. Philos. Trans. R. Soc. London 1805, 95, 65–87. [Google Scholar] [CrossRef]
- Selker, J.S.; Keller, C.K.; McCord, J.T. Vadose Zone Processes; CRC Press, LLC.: Boca Raton, FL, USA, 1999; pp. 22–56, 111–117. ISBN 9780873719537. [Google Scholar]
- McGinnis, T.L. Determining Contact Angle of Solutions with Varying Surface Tension on Dry and Pre-Wetted Sands; Oregon State University: Corvallis, OR, USA, 2001. [Google Scholar]
- Bashir, R.; Smith, J.E.; Stolle, D.E. The Effect of Ionic Strength on Surfactant-Induced Unsaturated Flow. Can. Geotech. J. 2011, 48, 644–654. [Google Scholar] [CrossRef]
- Allred, B.; Brown, G.O. Surfactant-Induced Reductions of Saturated Hydraulic Conductivity and Unsaturated Diffusivity. In Surfactant-Enhanced Subsurface Remediation; ACS Symposium Series; American Chemical Society: Washington, DC, USA, 1995; Volume 594, pp. 16–216. ISBN 9780841232259. [Google Scholar]
- Tumeo, M.A. A Survey of the Causes of Surfactant-Induced Changes in Hydraulic Conductivity. Groundw. Monit. Remediat. 1997, 17, 138–144. [Google Scholar] [CrossRef]
- Pham, H.Q.; Fredlund, D.G.; Barbour, S.L. A Study of Hysteresis Models for Soil-Water Characteristic Curves. Can. Geotech. J. 2005, 42, 1548–1568. [Google Scholar] [CrossRef]
- Bashir, R.; Sharma, J.; Stefaniak, H. Effect of Hysteresis of Soil-Water Characteristic Curves on Infiltration under Different Climatic Conditions. Can. Geotech. J. 2016, 53, 273–284. [Google Scholar] [CrossRef] [Green Version]
- Klausner, Y. Fundamentals of Continuum Mechanics of Soils. In Fundamentals of Continuum Mechanics of Soils; Springer: London, UK, 1991; p. 209. ISBN 978-1-4471-1679-0. [Google Scholar]
- Haines, W.B. Studies in the Physical Properties of Soil. V. The Hysteresis Effect in Capillary Properties, and the Modes of Moisture Distribution Associated Therewith. J. Agric. Sci. 1930, 20, 97–116. [Google Scholar] [CrossRef]
- Bashir, R. Quantification of Surfactant-Induced Unsaturated Flow in the Vadose Zone; McMaster University: Hamilton, ON, Canada, 2007. [Google Scholar]
- Yan, G.; Li, Z.; Galindo Torres, S.A.; Scheuermann, A.; Li, L. Transient Two-Phase Flow in Porous Media: A Literature Review and Engineering Application in Geotechnics. Geotechnics 2022, 2, 32–90. [Google Scholar] [CrossRef]
- Bashir, R.; Smith, J.E.; Henry, E.J.; Stolle, D. On the Importance of Hysteresis in Numerical Modeling of Surfactant-Induced Unsaturated Flow. Soil Sediment Contam. 2009, 18, 264–283. [Google Scholar] [CrossRef]
- Russo, D.; Jury, W.A.; Butters, G.L. Numerical Analysis of Solute Transport during Transient Irrigation: 1. The Effect of Hysteresis and Profile Heterogeneity. Water Resour. Res. 1989, 25, 2109–2118. [Google Scholar] [CrossRef]
- Weisbrod, N.; McGinnis, T.; Rockhold, M.L.; Niemet, M.R.; Selker, J.S. Effective Darcy-Scale Contact Angles in Porous Media Imbibing Solutions of Various Surface Tensions. Water Resour. Res. 2009, 45, W00D39. [Google Scholar] [CrossRef] [Green Version]
- Ishiguro, M.; Fujii, T. Upward Infiltration into Porous Media as Affected by Wettability and Anionic Surfactants. Soil Sci. Soc. Am. J. 2008, 72, 741–749. [Google Scholar] [CrossRef]
- Wallach, R.; Margolis, M.; Graber, E.R. The Role of Contact Angle on Unstable Flow Formation during Infiltration and Drainage in Wettable Porous Media. Water Resour. Res. 2013, 49, 6508–6521. [Google Scholar] [CrossRef]
- Butt, H.-J.; Graf, K.; Kappl, M. Section 7: Contact Angle Phenomena and Wetting. In Physics and Chemistry of Interfaces; Wiley-VCH Verlag GmbH & Co. KGaA: Weinheim, Germany, 2003; pp. 126–129. ISBN 3-527-40413-9. [Google Scholar]
- Liu, Q.; Yasufuku, N.; Miao, J.; Ren, J. An Approach for Quick Estimation of Maximum Height of Capillary Rise. Soils Found. 2014, 54, 1241–1245. [Google Scholar] [CrossRef] [Green Version]
- Al-Yaqout, A.F.; Hamoda, M.F. Evaluation of Landfill Leachate in Arid Climate—A Case Study. Environ. Int. 2003, 29, 593–600. [Google Scholar] [CrossRef]
- Faybishenko, B.A. Hydraulic Behavior of Quasi-Saturated Soils in the Presence of Entrapped Air: Laboratory Experiments. Water Resour. Res. 1995, 31, 2421–2435. [Google Scholar] [CrossRef]
- Hird, R.; Bolton, M.D. Clarification of Capillary Rise in Dry Sand. Eng. Geol. 2017, 230, 77–83. [Google Scholar] [CrossRef]
- Lane, K.S.; Washburn, S.E. Capillarity Tests by Capillarimeter and by Soil Filled Tubes. In Proceedings of the Twenty-Sixth Annual Meeting of the Highway Research Board, Washington, DC, USA, 5–8 December 1946; Volume 26, pp. 460–473. [Google Scholar]
- Peck, R.B.; Hanson, W.E.; Thornburn, T.H. Foundation Engineering; Wiley: New York, NY, USA, 1974; ISBN 0471675857. [Google Scholar]
- Kumar, S.; Malik, R.S. Verification of Quick Capillary Rise Approach for Determining Pore Geometrical Characteristics in Soils of Varying Texture. Soil Sci. 1990, 150, 883–888. [Google Scholar] [CrossRef]
- Letey, J.; Osborn, J.; Pelishek, R.E. Measurement of Liquid-Solid Contact Angles in Soil and Sand. Soil Sci. 1962, 93, 149–153. [Google Scholar] [CrossRef]
- Myers, D. Surfaces, Interfaces, and Colloids: Principles and Applications, 2nd ed.; John Wiley & Sons, Inc.: Hoboken, NJ, USA, 1999; ISBN 0-471-23499-0. [Google Scholar]
- Blake, T.D. The Physics of Moving Wetting Lines. J. Colloid Interface Sci. 2006, 299, 1–13. [Google Scholar] [CrossRef]
- Rapp, B.E. Fluid Surface Effects. In Microfluidics: Modeling, Mechanics and Mathematics; Elsevier: Oxford, UK, 2017; pp. 419–443. [Google Scholar]
- Washburn, E.W. The Dynamics of Capillary Flow. Phys. Rev. 1921, 17, 273–283. [Google Scholar] [CrossRef]
- Heber Green, W.; Ampt, G.A. Studies on Soil Phyics. J. Agric. Sci. 1911, 4, 1. [Google Scholar] [CrossRef] [Green Version]
- McBride, J.F.; Simmons, C.S.; Cary, J.W. Interfacial Spreading Effects on One-Dimensional Organic Liquid Imbibition in Water-Wetted Porous Media. J. Contam. Hydrol. 1992, 11, 1–25. [Google Scholar] [CrossRef]
- Brooks, R.H.; Corey, A.T. Hydraulic Properties of Porous Media. Hydrol. Pap. 1964, 3, 27. [Google Scholar]
- Shafran, A.W.; Gross, A.; Ronen, Z.; Weisbrod, N.; Adar, E. Effects of Surfactants Originating from Reuse of Greywater on Capillary Rise in the Soil. Water Sci. Technol. 2005, 52, 157–166. [Google Scholar] [CrossRef]
- George, A.L.; White, G.F. Optimization of the Methylene Blue Assay for Anionic Surfactants Added to Estuarine and Marine Water. Environ. Toxicol. Chem. 2009, 18, 2232–2236. [Google Scholar] [CrossRef] [PubMed]
- Malik, R.S.; Laroussi, C.H.; de Backer, I.W. Penetration Coefficient in Porous Media. Soil Sci. 1981, 132, 394–401. [Google Scholar] [CrossRef]
- Marmur, A. Kinetics of Penetration into Uniform Porous Media: Testing the Equivalent-Capillary Concept. Langmuir 2003, 19, 5956–5959. [Google Scholar] [CrossRef]


| Reference | Relationship (*) | Details |
|---|---|---|
| Lane et al. (1946) [93] | (**) | |
| Peck et al. (1974) [94] | 10 mm2 < < 50 mm2 (***) | |
| Kumar and Malik (1990) [95] | (cm), (cm) and (effective pore radius in micrometers). (****) | |
| Liu et al. (2014) [89] | (surface tension), (porosity), (advancing contact angle), (saturated hydraulic conductivity) |
| Reference | Aim of Research | Experimental Details | Methodology and Notes |
|---|---|---|---|
| Wiel-Shafran et al. (2005, 2006) [37,104] |
|
|
|
| Ishiguro and Fujii (2008) [86] |
|
|
|
| McGinnis (2001)and Weisbrod et al. (2009) [73,85] |
|
|
|
| Liu et al. (2014) [17] |
|
|
|
Publisher’s Note: MDPI stays neutral with regard to jurisdictional claims in published maps and institutional affiliations. |
© 2022 by the authors. Licensee MDPI, Basel, Switzerland. This article is an open access article distributed under the terms and conditions of the Creative Commons Attribution (CC BY) license (https://creativecommons.org/licenses/by/4.0/).
Share and Cite
Boduroglu, S.; Bashir, R. Review of Capillary Rise Experiments for Surface-Active Solutes in the Subsurface. Geotechnics 2022, 2, 706-730. https://doi.org/10.3390/geotechnics2030034
Boduroglu S, Bashir R. Review of Capillary Rise Experiments for Surface-Active Solutes in the Subsurface. Geotechnics. 2022; 2(3):706-730. https://doi.org/10.3390/geotechnics2030034
Chicago/Turabian StyleBoduroglu, Sebnem, and Rashid Bashir. 2022. "Review of Capillary Rise Experiments for Surface-Active Solutes in the Subsurface" Geotechnics 2, no. 3: 706-730. https://doi.org/10.3390/geotechnics2030034