1. Introduction
Participation within running has increased substantially over the last 20 years [
1]. For example, the Boston marathon alone has increased its entrants from 17,813 in 2000 to 30,234 in 2019 [
2]. In that same timeframe, qualifying times have also been reduced an entire 10 min [
3]. As both the number of competitors and the entry qualifications have increased, experienced runners are actively seeking the use of innovative equipment to maintain/gain a competitive advantage. One such piece of equipment is the compression garment. Currently, compression garments are widely used among athletes despite a lack of literature to support their overall effectiveness [
4,
5,
6]. While preliminary research has highlighted some benefits of compression garments, additional work needs to explore their potential impact on performance and the underlying mechanisms.
Pertaining to performance, compression garments have been associated with some physiological benefits. Specifically, they have been shown to help athletes maintain power and force over a series of maximal effort tasks [
7,
8,
9]. Further, wearing compression stockings reduced lactate levels up to 15 min after exhaustive exercise, suggesting a faster recovery to baseline values [
10]. Goto et al. [
11] reported not only a reduction in strength loss during strenuous resistance exercises, but participants also reported lower muscle soreness and subjective fatigue scores while wearing compression garments. These studies have shown that compression garments are effective in maintaining objective measures of strength and helping reduce subjective measures of discomfort and fatigue [
12]. Taken together, this preliminary research adds merit to the use of compression garments and warrants further investigation.
It has been speculated that the functionality behind compression garments comes from their ability to reduce muscle oscillation [
8,
13]. Muscle oscillation following ground impact during running has been observed to be directly related to the time and amplitude of pre-activation in lower extremity muscles [
14,
15,
16]. It has been hypothesized that the external dampening of muscle oscillations and soft tissue vibrations can reduce muscle pre-activation times, which lessens overall muscle activity during a given task [
17]. However, this early work was based on controlled laboratory experiments/models and needs to be field tested to ascertain the true impact for athletes. Additionally, researchers have investigated dampening the tissue vibrations of impact through the use of lower body compression garments and have reported reduced muscle oscillation [
8,
12,
13,
18,
19].
When it comes to compression garments there is no clear consensus as to their effect on EMG. Nevertheless, two studies have reported a reduction in EMG during running while wearing full-leg compression pants [
20,
21]. Similarly, there is no clear agreement if compression garments influence oxygen consumption (
O
2) during exercise [
22,
23,
24,
25,
26]. It has been established that as running workload increases, so does
O
2 [
27,
28]. Previous authors also report that a positive relationship between muscle activity assessed via electromyography (EMG) and
O
2 exists [
29,
30]. Specifically, Bearden and Moffatt [
29] reported a simultaneous increase in EMG and
O
2 during submaximal exercise and concluded that an increase in muscle fiber recruitment resulted in a higher demand for aerobic energy. Therefore, it is reasonable to hypothesize that if compression garments reduce muscle oscillation and muscle activation time, then the muscle will have a lower demand for aerobic energy and oxygen. Previous studies evaluating muscle activity with compression garments have only reported the EMG amplitude; alternatively, it may be useful to assess muscle activation time instead. However, to the author’s knowledge, no previous research has evaluated the influence of full-leg compression pants on muscle activation time and oscillation concurrently. To evaluate muscle activation time, there must be a threshold determined to evaluate when a muscle is active and when it is not. Many different techniques have been used to set this threshold and separate muscle activation from signal noise [
31,
32]. Two commonly used techniques are using some standard deviation away from a baseline or using a percentage of the maximal amplitude within the gait cycle [
32]. This study will utilize the latter as using the standard deviation of a baseline can be drastically affected by system noise during baseline measurements. With all these variables potentially influenced by compression garments, more research that evaluates oxygen consumption, muscle oscillation, and EMG simultaneously while running with and without compression garments is needed.
Another variable that may affect the changes in outcomes influenced by full-leg compression pants is the participant’s perception of their efficacy. Enhanced expectancies have been observed to positively influence various performance measures during exercise [
33,
34,
35]. Specifically, two studies have reported a positive influence of belief in the efficacy of compression pants on time-trial performance and a reduction in
O
2 [
26,
36]. However, more research is needed to explore the relationship between the participant perception of compression garments and their physiological and biomechanical parameters.
The purpose of this study was to compare muscle oscillation, muscle activation time, and oxygen consumption while wearing full-leg compression pants relative to a control garment during running. A secondary purpose was to determine if the participant’s belief in compression efficacy influences the subjective measured outcomes. It is hypothesized that muscle oscillation, oxygen consumption, and muscle activation time will be significantly reduced while wearing full-leg compression pants during running. It is also hypothesized that there will be a significant positive relationship between the participant’s belief in full-leg compression pants and the reduction in muscle oscillation, oxygen consumption, and muscle activation time.
2. Materials and Methods
2.1. Participants
All participants (n = 11; 1.74 ± 0.05 m; 74.30 ± 12.58 kg; 26.73 ± 12.74 years; 5 female) were injury-free and were comfortable running for at least 60 min at a time. The inclusion criteria for subjects were that they needed to be active runners at the time of testing. We operationally defined an active runner as running at least five miles per week for six weeks consecutively. Of the subjects that did participate in the study, they reported running between 6 and 30 miles per week with an average of 14.9 miles per week. All participants completed and signed an informed consent form that was approved by the University Biomedical Institutional Review Board.
2.2. Measures
The full-leg compression pants were from the brand 2XU, made with 72% nylon and 28% lycra, and had a pressure level of 20–25 mmHg. The EMG was collected using a telemetry system (Cometa systems, Milano, Italy, 2000 Hz). Acceleration (ACC) of soft tissue was measured at 143 Hz using the same system since the sensors consist of EMG leads connected to a transmitting unit that includes tri-axial accelerometers. Oxygen consumption (
O
2) was measured breath-by-breath using the Parvo Medics TrueOne metabolic system (Parvo Medics, Salt Lake City, UT, USA). The metabolic cart was calibrated in accordance with the manufacturer’s instructions prior to every use. Heart rate (HR) was measured via the use of a Polar RS800CX telemetry system (Polar Electro Inc, Bethpage, NY, USA) and was integrated into the TrueOne metabolic software version 4.3.4. The rating of perceived exertion (RPE) was recorded using the Borg’s 6–20 point RPE Scale [
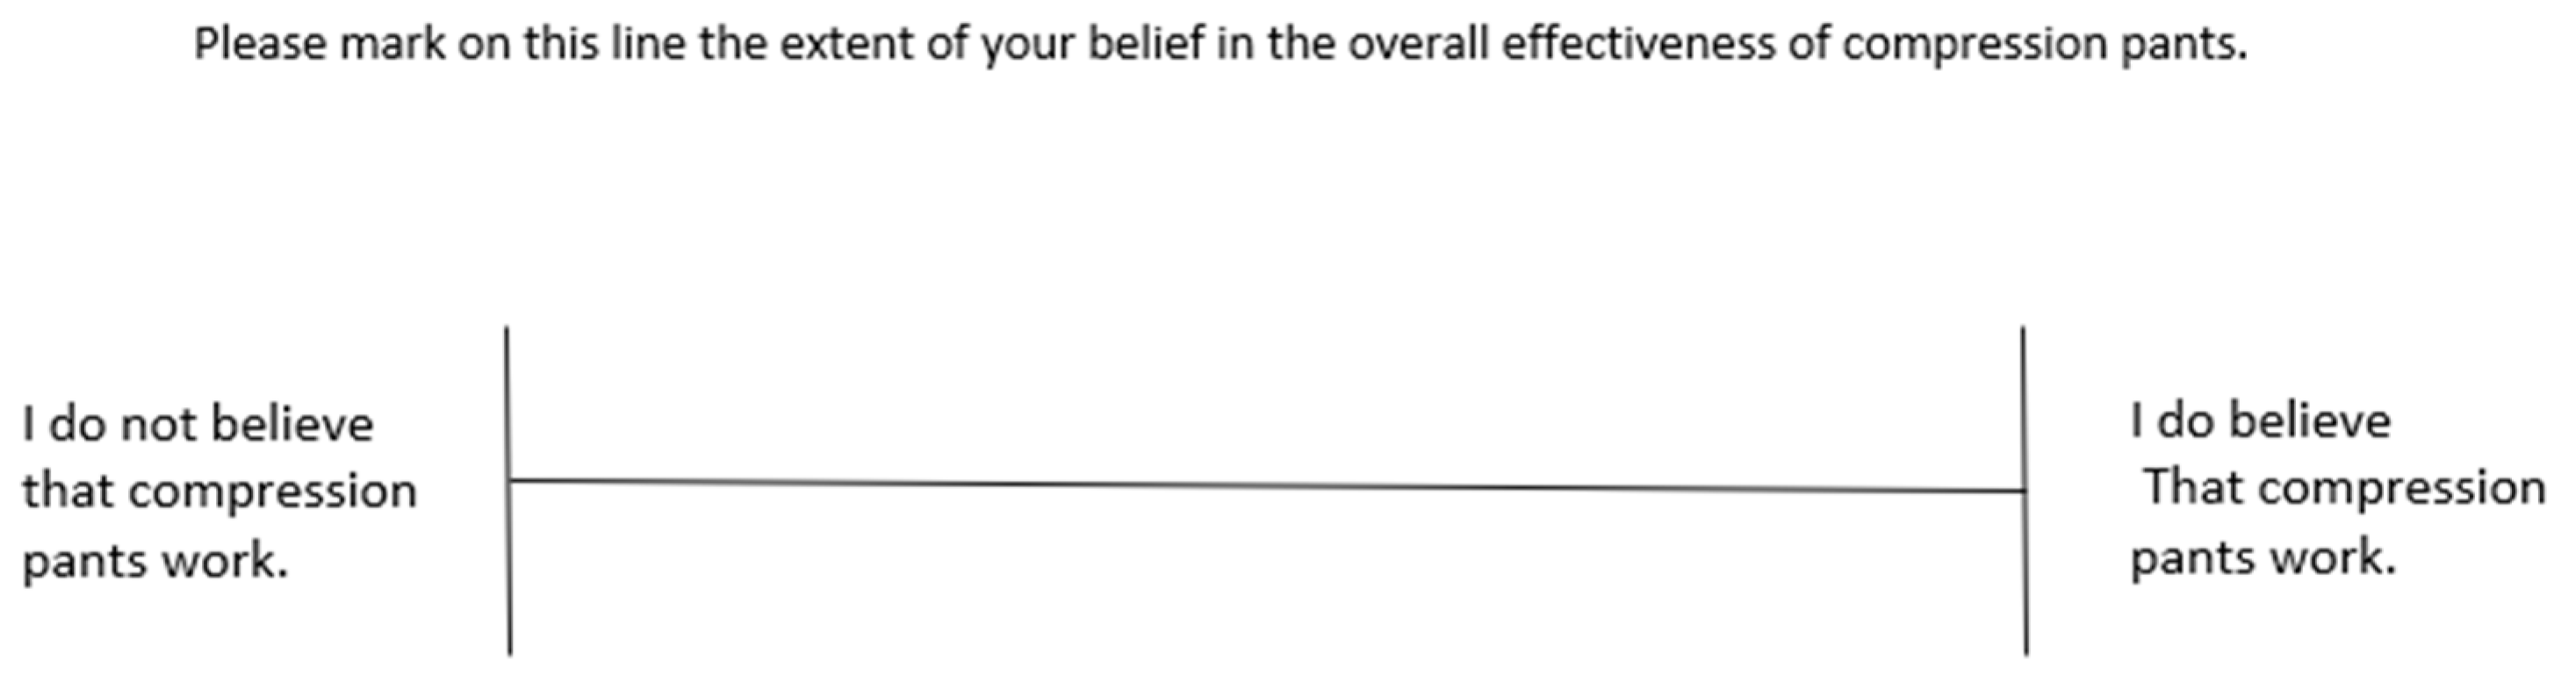
37]. Participant’s belief in the efficacy of the compression pants was measured using a visual-analog scale for one question. This question asks the participant to draw a single vertical line on a continuous scale which read “I do not believe compression pants work” and “I do believe compression pants work” at either end of the scale (
Figure 1). This scale was a total of 10 cm long and each participant mark was measured for distance away from 0 (“I do not believe” end of the scale) to mm accuracy. This distance was used as a measurement of the participant’s belief in the product (belief score). A visual-analog scale was used as it is a simple yet valid and reliable technique to measure subjective experience [
38].
2.3. Procedures
After participants completed the initial questionnaire and anthropometrics, participants’ preferred speed (PS) was determined. The PS was operationally defined as the self-selected speed at which participants felt comfortable running for a 30 min period. To determine this, the investigator set the treadmill speed to just below 1.3 m/s and blocked all speed readings. Participants were then instructed to increase the treadmill speed (i.e., blinded) until they reached their PS. This was performed three times consecutively, and the final PS was calculated as the average of these speeds. Using this average, PS − 10% and PS + 10% were calculated by subtracting 10% and adding 10%, respectively.
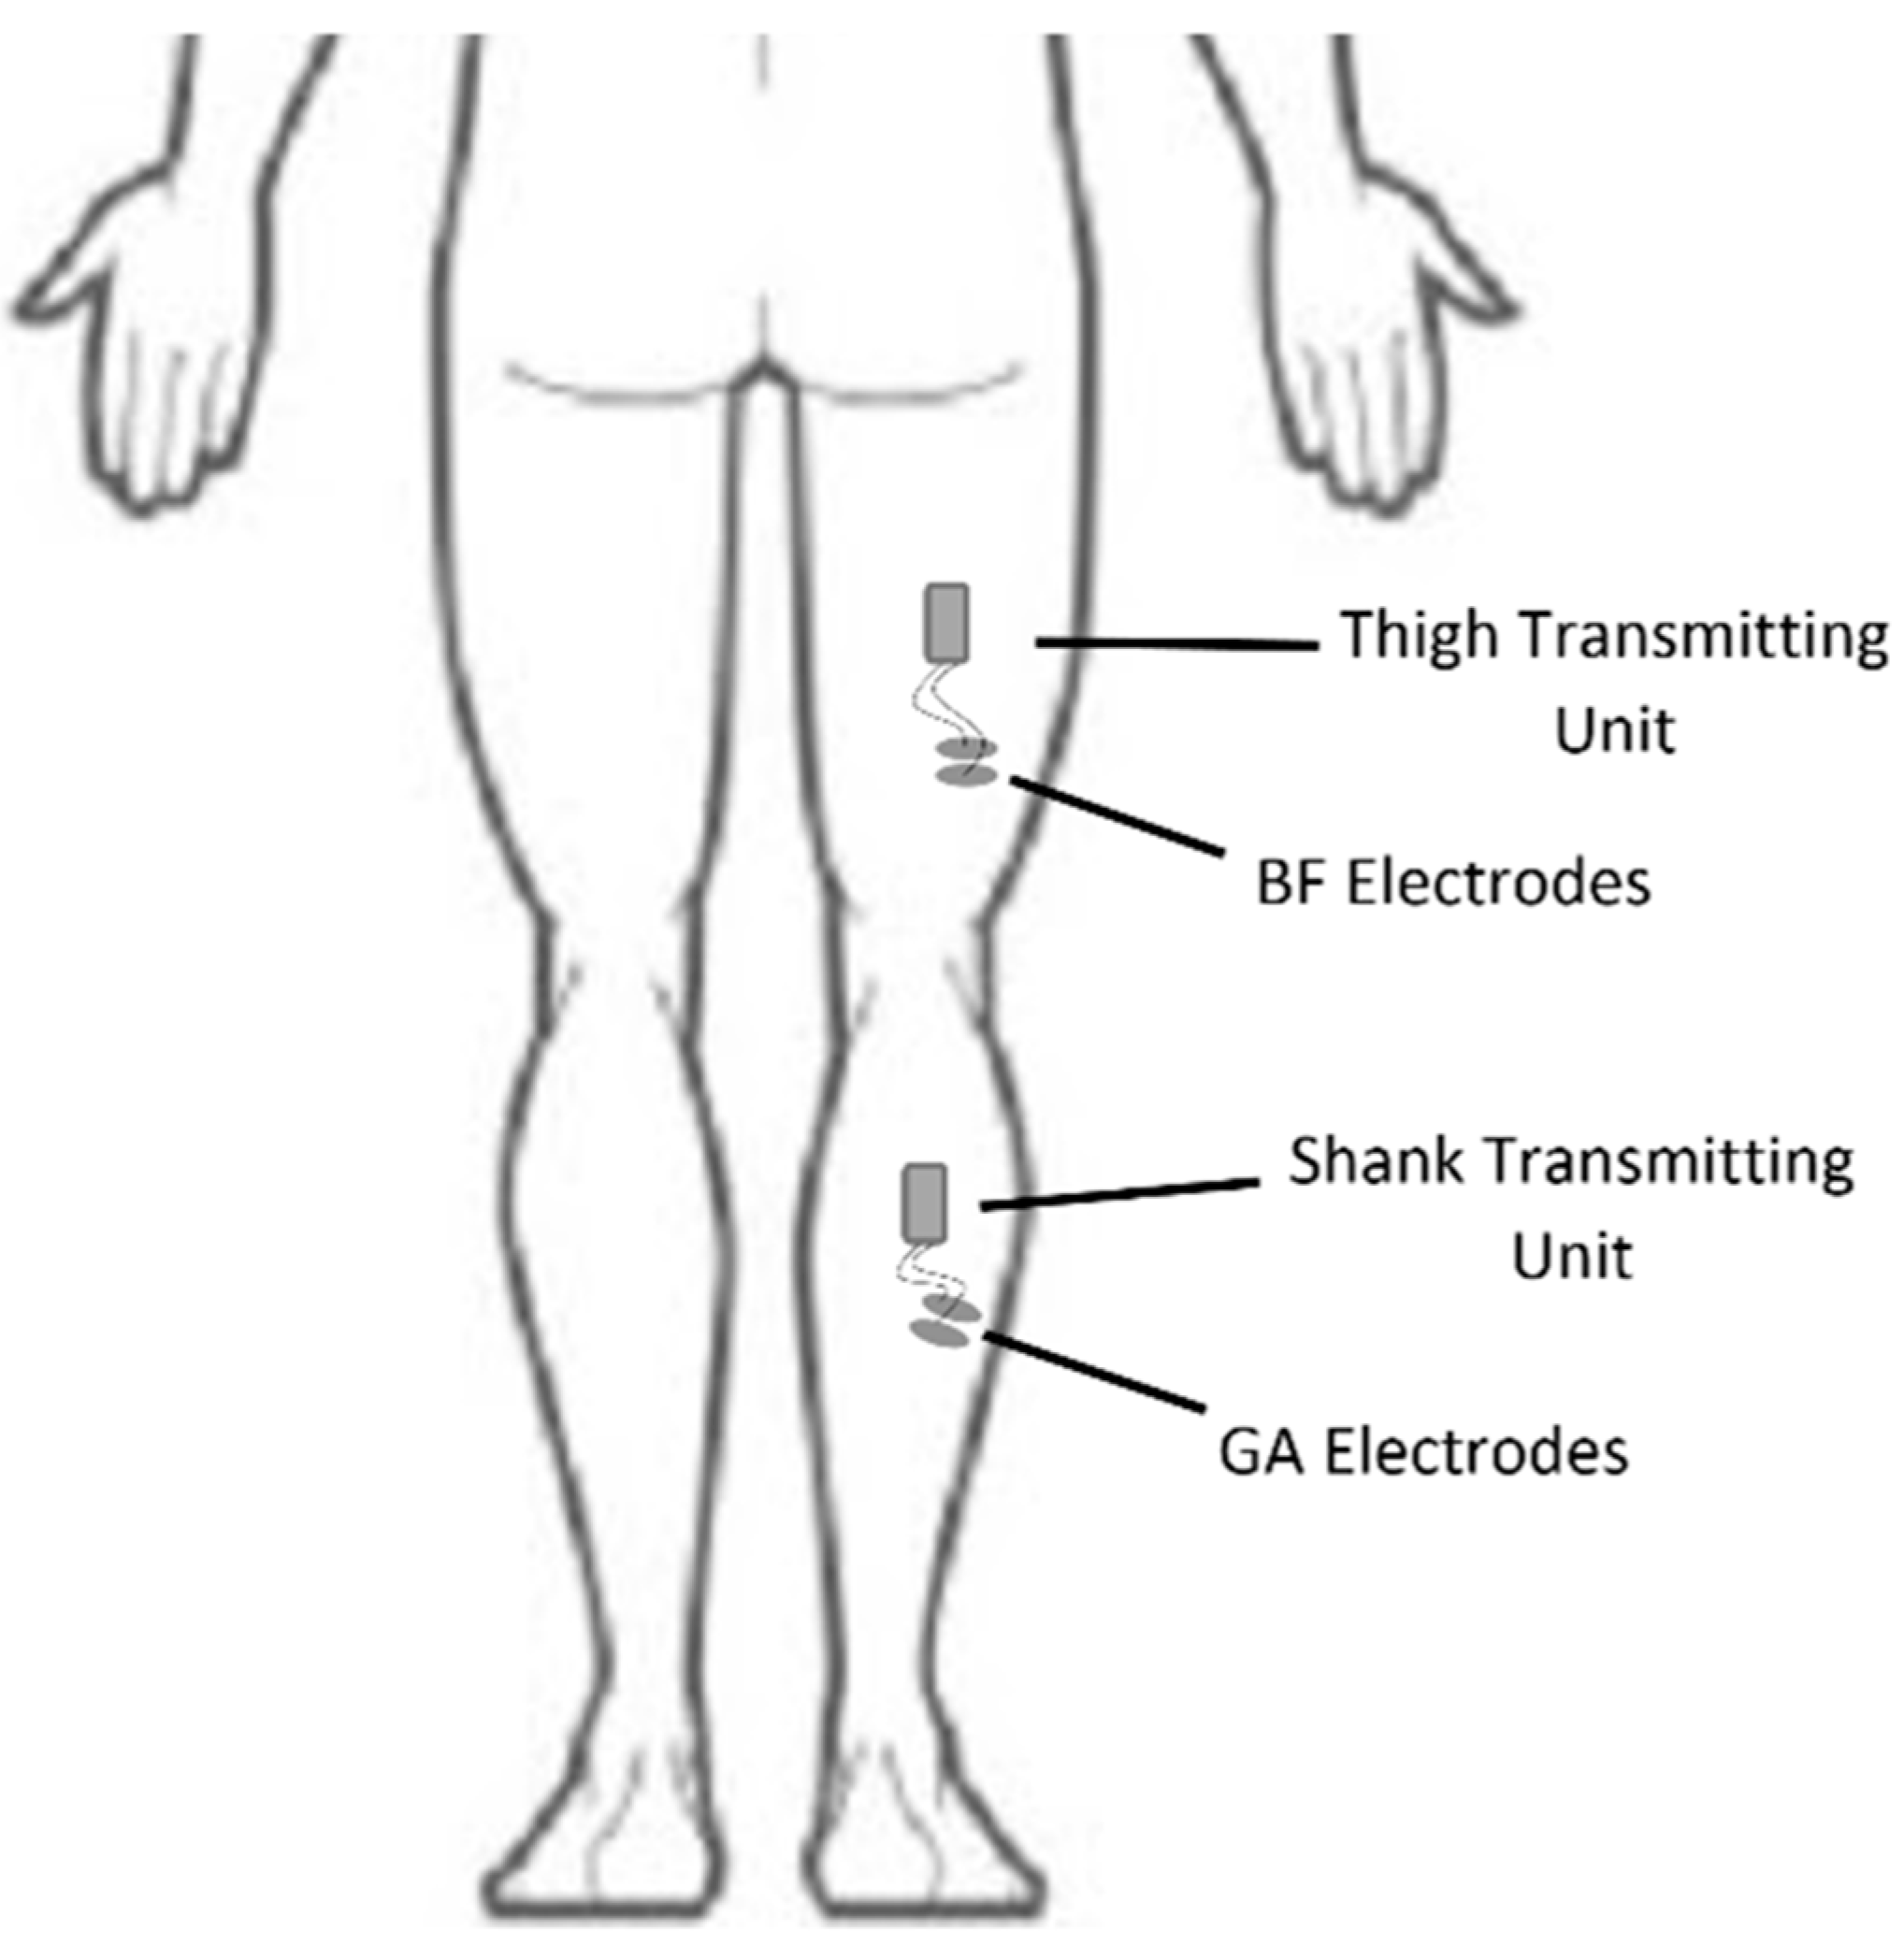
Participants were then instrumented with EMG/ACC sensors using single-use surface electrodes. Electrodes were placed in pairs upon the surface of the four muscle bellies of interest in line with the direction of the muscle fibers. All measurements were taken from the right side of the body. The muscles of interest were the rectus femoris (RF), biceps femoris (BF), tibialis anterior (TA), and the lateral gastrocnemius (GA). Each electrode site was prepared through shaving the hair, abrading the skin using a SkinPure preparation gel (Nihon Kohden Co. Ltd., Tokyo, Japan), and additionally wiping with alcohol pads. EMG electrodes were placed on the four muscle sites in accordance with SENIAM guidelines [
39]. Each EMG lead was connected to a local transmitting unit (which housed the accelerometers) and the transmitting unit was placed over the midline of the corresponding muscle (
Figure 2). Immediately following instrumentation of the EMG/ACC sensors, participants completed single 5 s maximal voluntary isometric contractions (MVIC) for each muscle being tested [
40,
41].
Following MVIC collection, participants were instructed to sit for three minutes to collect resting baseline data. During these three minutes, participants relaxed and minimized movement as much as possible. Their O2 and HR were recorded, and the final minute of HR measurement was averaged and designated as their resting heart rate (RHR). Between conditions, participants were required to return within 10 bpm of their RHR before the next condition could begin. Participants then ran a total of six 6 min conditions. Conditions included wearing full-leg compression pants (COMP) and running at PS − 10%, PS, and PS + 10%, as well as wearing loose-fitting shorts for the control condition (CON) and again running at PS − 10%, PS, and PS + 10%. Participants either started with the COMP conditions (three speeds) or the CON conditions (three speeds). The order of the conditions was partially counter balanced with six participants starting with the COMPs and five starting with the CONs. The order in which each participant ran the three speeds was randomized. Participants were fitted for the correct size COMP immediately prior to the three COMP conditions. All six 6 min conditions were completed on the same day.
During each condition, the O2 and HR were measured throughout the entire six minutes. The EMG (2000 Hz) and ACC (143 Hz) were measured for the last minute of each condition. Within the last minute of each condition, RPE and stride frequency (SF) were gathered manually by one of the investigators. SF data were recorded manually by measuring the time it takes to complete 20 strides. Lastly, after completing all conditions, each participant was given the belief in efficacy questionnaire and asked to complete the question to the best of their ability without further instruction.
2.4. Analysis
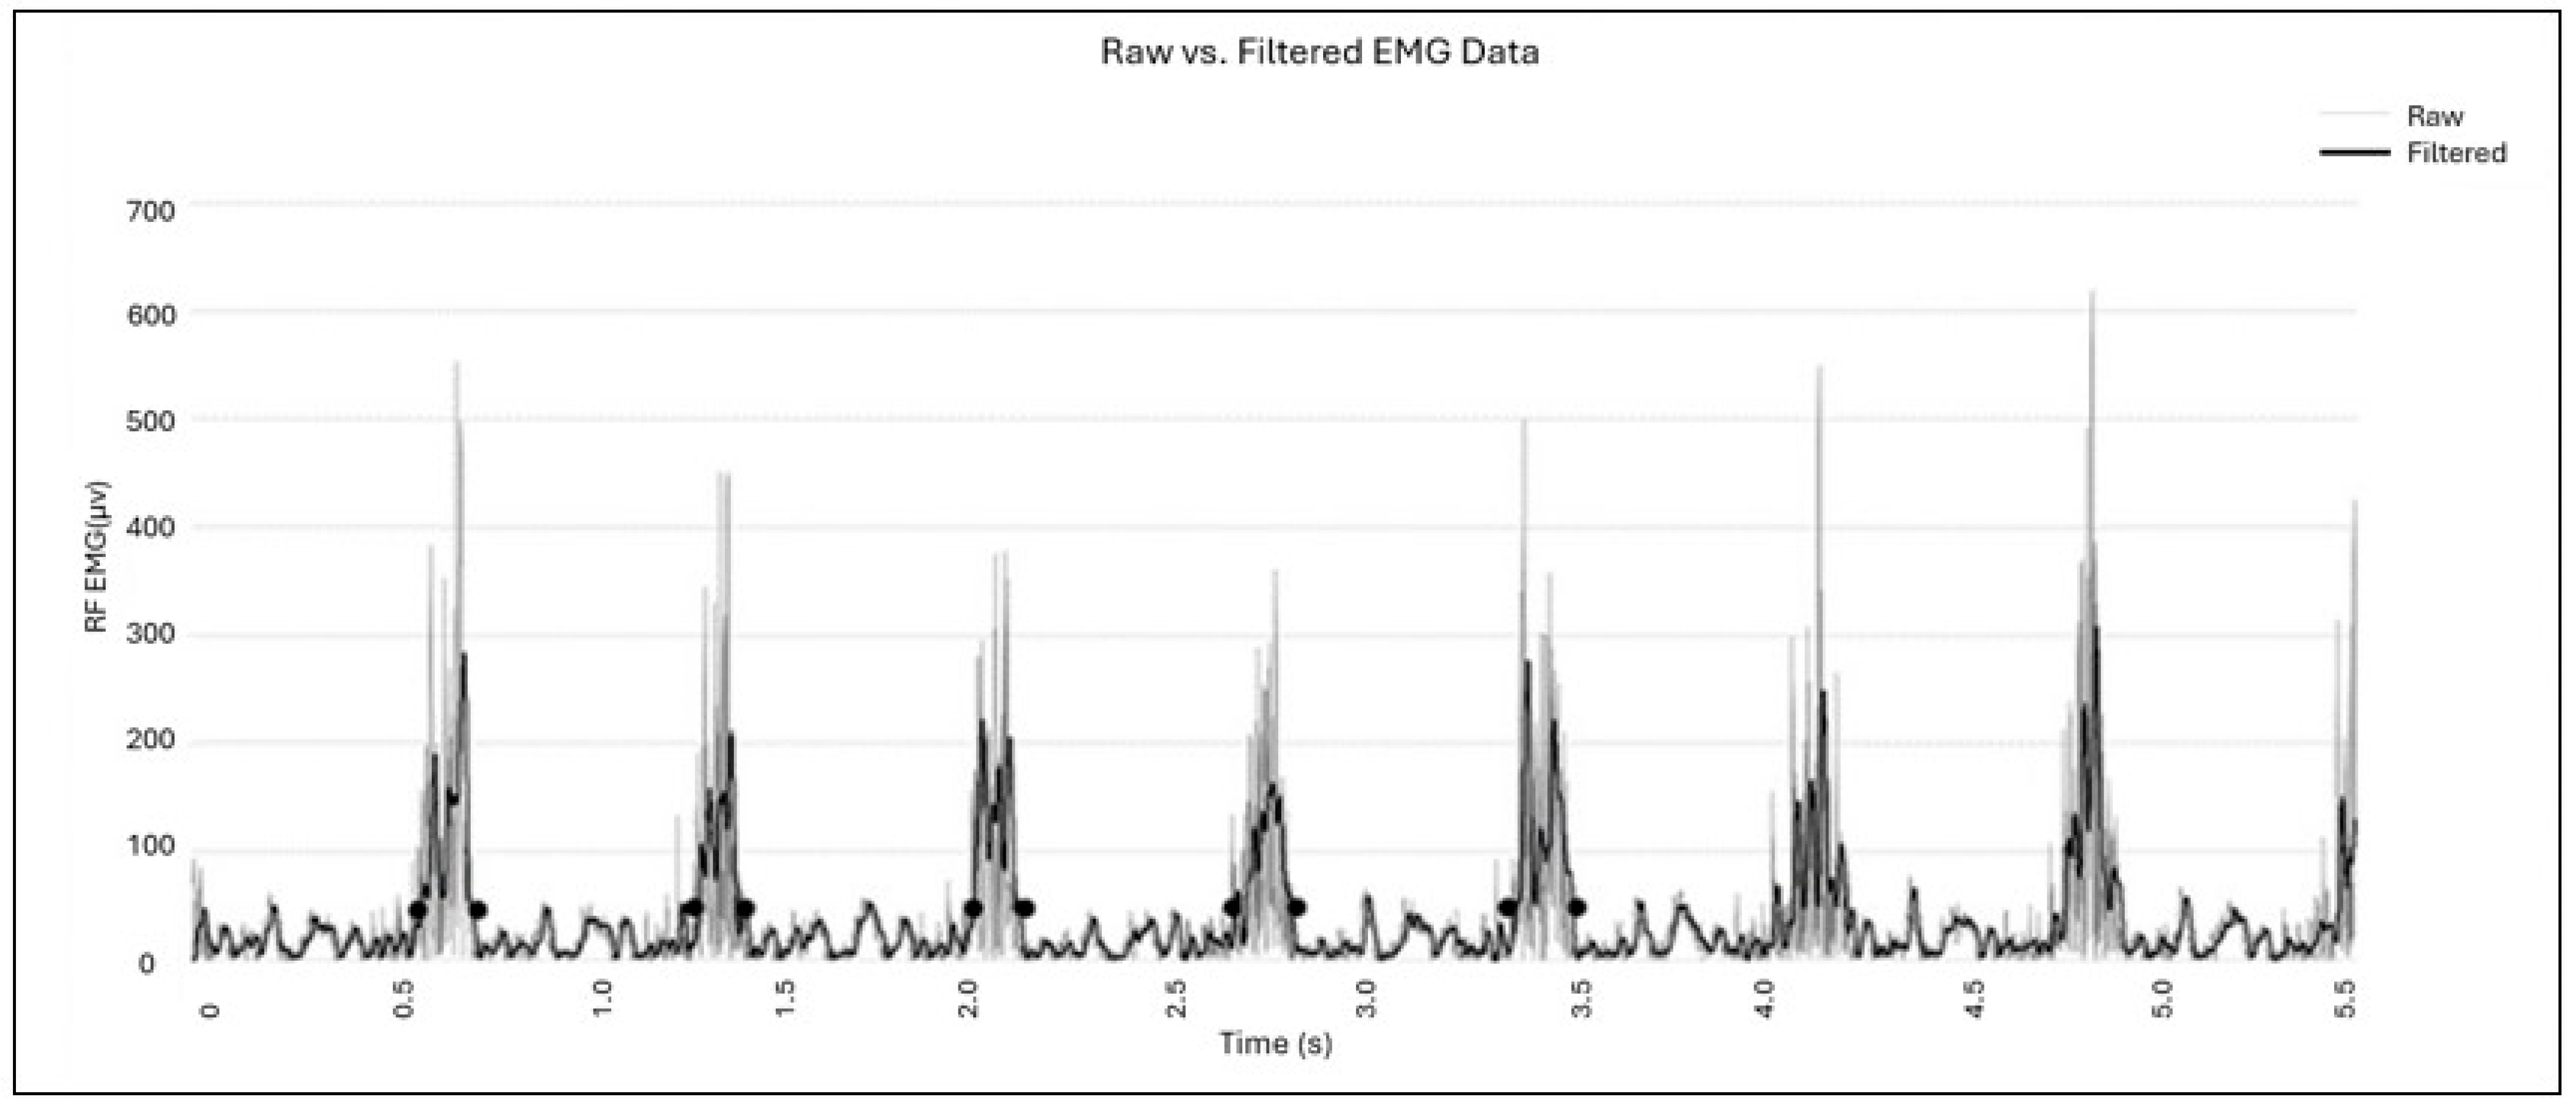
Custom programs were written to process all variables independently and prepare data for analysis (Matlab version R2018a, mathworks, Natick, MA, USA). An initial window of eight consecutive strides was extracted from the 60 s of EMG data. These eight strides were identified through the RF-ACC data, five of which would be used for further processing. Specifically, a resultant ACC was calculated, and eight strides were identified through the local maximum of ACC that corresponded with foot strike. Any zero-offset was removed from the EMG signal and data were full-wave rectified. A fourth-order Butterworth low-pass filter set at 40 Hz was used to filter noise from the data. A threshold for onset and offset times was calculated as 10% of the maximal amplitude within the eight strides selected. When the signal surpassed this threshold, the muscle was determined to be ‘on’ and the following time it receded below this threshold the muscle was then ‘off’. Five consecutive strides were extracted from the original eight and used to process burst lengths. Within each stride a muscle burst was identified, and ‘on’/‘off’ times were identified via objective criteria and visually inspected to confirm they represented the muscle activity bursts (
Figure 3). The time from ‘on’ to ‘off’ per burst was calculated and all five bursts’ lengths were averaged to create one measurement of average burst length per muscle per condition for data analysis. This procedure was repeated for all muscles tested. However, the TA was dropped from analysis because of the difficulty in distinguishing ‘on’ from ‘off’ during running. More specifically, the TA was almost continuously active by standards of our threshold, and no clear bursts were present. This activation pattern has also been reported in previous work that estimated the TA to be active for up to 80% of the gait cycle during running [
42]. For
Section 3, muscle activation times are reported as a percentage of the gait cycle to serve as a real-life reference. For each subject and each condition, the average muscle activation time per muscle was calculated as a percentage of the average stride frequency of the five strides in which the data were extracted. These percent gait cycle figures were averaged across subjects and reported in
Figure 4.
Muscle oscillation was identified using the ACC data of the BF sensor (thigh) and the GA sensor (shank). These sensors were used as the investigators felt they best represented each segment’s soft tissue out of the four sensors available. The resultant ACC was calculated using the three orthogonal acceleration signals recorded by the sensor. Five strides were identified using the maximal amplitude per stride. These data were then transformed to the frequency domain using a Fast-Fourier Transform (FFT) and separated into bins of 0.137 Hz. The average amplitudes within bins of 0–10 Hz, 10–20 Hz, 20–30 Hz, 30–40 Hz, 40–50 Hz, and 50–60 Hz were calculated. This was carried out for the shank and thigh segments.
The rate of oxygen consumption was calculated using the final three minutes of each condition and averaging the relative O2 (mL/kg/min). The HR was also averaged across the final three minutes of each condition. The O2 and HR data were visually inspected to ensure the steady state had been reached prior to the three minutes before the conclusion of each condition. The RPE was recorded by participants manually pointing to the RPE scale and the investigator reading the measurement back for confirmation. The SF was calculated by dividing 20 strides by the time recorded.
The percent change in the dependent variables between the garments were computed and averaged across speeds for each condition so that a decrease while wearing the COMP compared to the CON was a positive change. Additionally for muscle oscillation, the percentage change was also averaged across all 10 Hz bins so that one measurement in percentage change is representative of the total change per leg segment. These percentage changes were then used to calculate correlations with the belief score, shank size, and thigh size.
The dependent variables were the muscle activation time for the RF, BF, TA and GA; the muscle oscillation for 0–10 Hz, 10–20 Hz, 20–30 Hz, 30–40 Hz, 40–50 Hz, and 50–60 Hz; and the O2, HR, SF, and RPE. The independent variables were the type of garment (COMP or CON) and the speed (PS − 10%, PS, PS + 10%). The muscle oscillation was not compared between the 10 Hz frequency bins as the purpose of this study was to examine differences in garment type. Each dependent variable was compared between conditions by using a two-way repeated-measures ANOVA [garment (COMP, CON) x speed (PS − 10%, PS, PS + 10%)] with the alpha level set at 0.05. If a significant interaction was observed, pairwise comparisons were used to detect differences between compression conditions or time (α = 0.05). Effect sizes were also given by the partial eta squared (η2).
Additionally, the percentage change in each dependent variable (CON to COMP) was correlated with the segment circumference (shank and thigh) as well as the belief score using Pearson’s product moment correlations. All statistics were performed using SPSS Version 24 (IBM, Chicago, IL, USA).
Due to equipment failure, one subject was unable to complete one condition (CON, PS + 10%), so all data that was unable to be collected during that condition was excluded pairwise from all data analysis in SPSS.
3. Results
It was determined that SF was not influenced by the interaction between garment and speed (F(2, 18) = 0.511,
p = 0.609, η
2 = 0.054). SF was not different between the garments (F(1, 9) = 2.452,
p = 0.152, η
2 = 0.214) but SF was different between speeds regardless of the garment (F(2, 18) = 23.591,
p < 0.01, η
2 = 0.724). It was determined that the SF was different between all three speeds, with SF increasing as speed increased (
p < 0.05). The average SF and speed are reported in
Table 1.
Heart Rate was not influenced by the interaction between the garment and speed (F(2, 20) = 1.062,
p = 0.364, η
2 = 0.096). The HR was not different between garments regardless of speed (F(1, 10) = 0.736,
p = 0.411, η
2 = 0.069); however, the HR was different between speeds regardless of garment (F(2, 20) = 19.874,
p < 0.01, η
2 = 0.655). A post hoc analysis revealed that the HR during PS + 10% was different compared to during PS and PS − 10%, and HRs for all conditions are presented in
Table 1. Additionally, it was determined that the RPE was not influenced by the interaction between garment and speed (F(2, 18) = 2.11,
p = 0.15, η
2 = 0.190). Similarly, the RPE was not different between garments (F(1, 9) = 0.119,
p = 0.738, η
2 = 0.013) but was different between speeds regardless of garment (F(2, 18) = 34.488,
p < 0.01, η
2 = 0.793). Pairwise comparisons revealed the RPE significantly increased as speed increased; the RPEs for all conditions are reported in
Table 1.
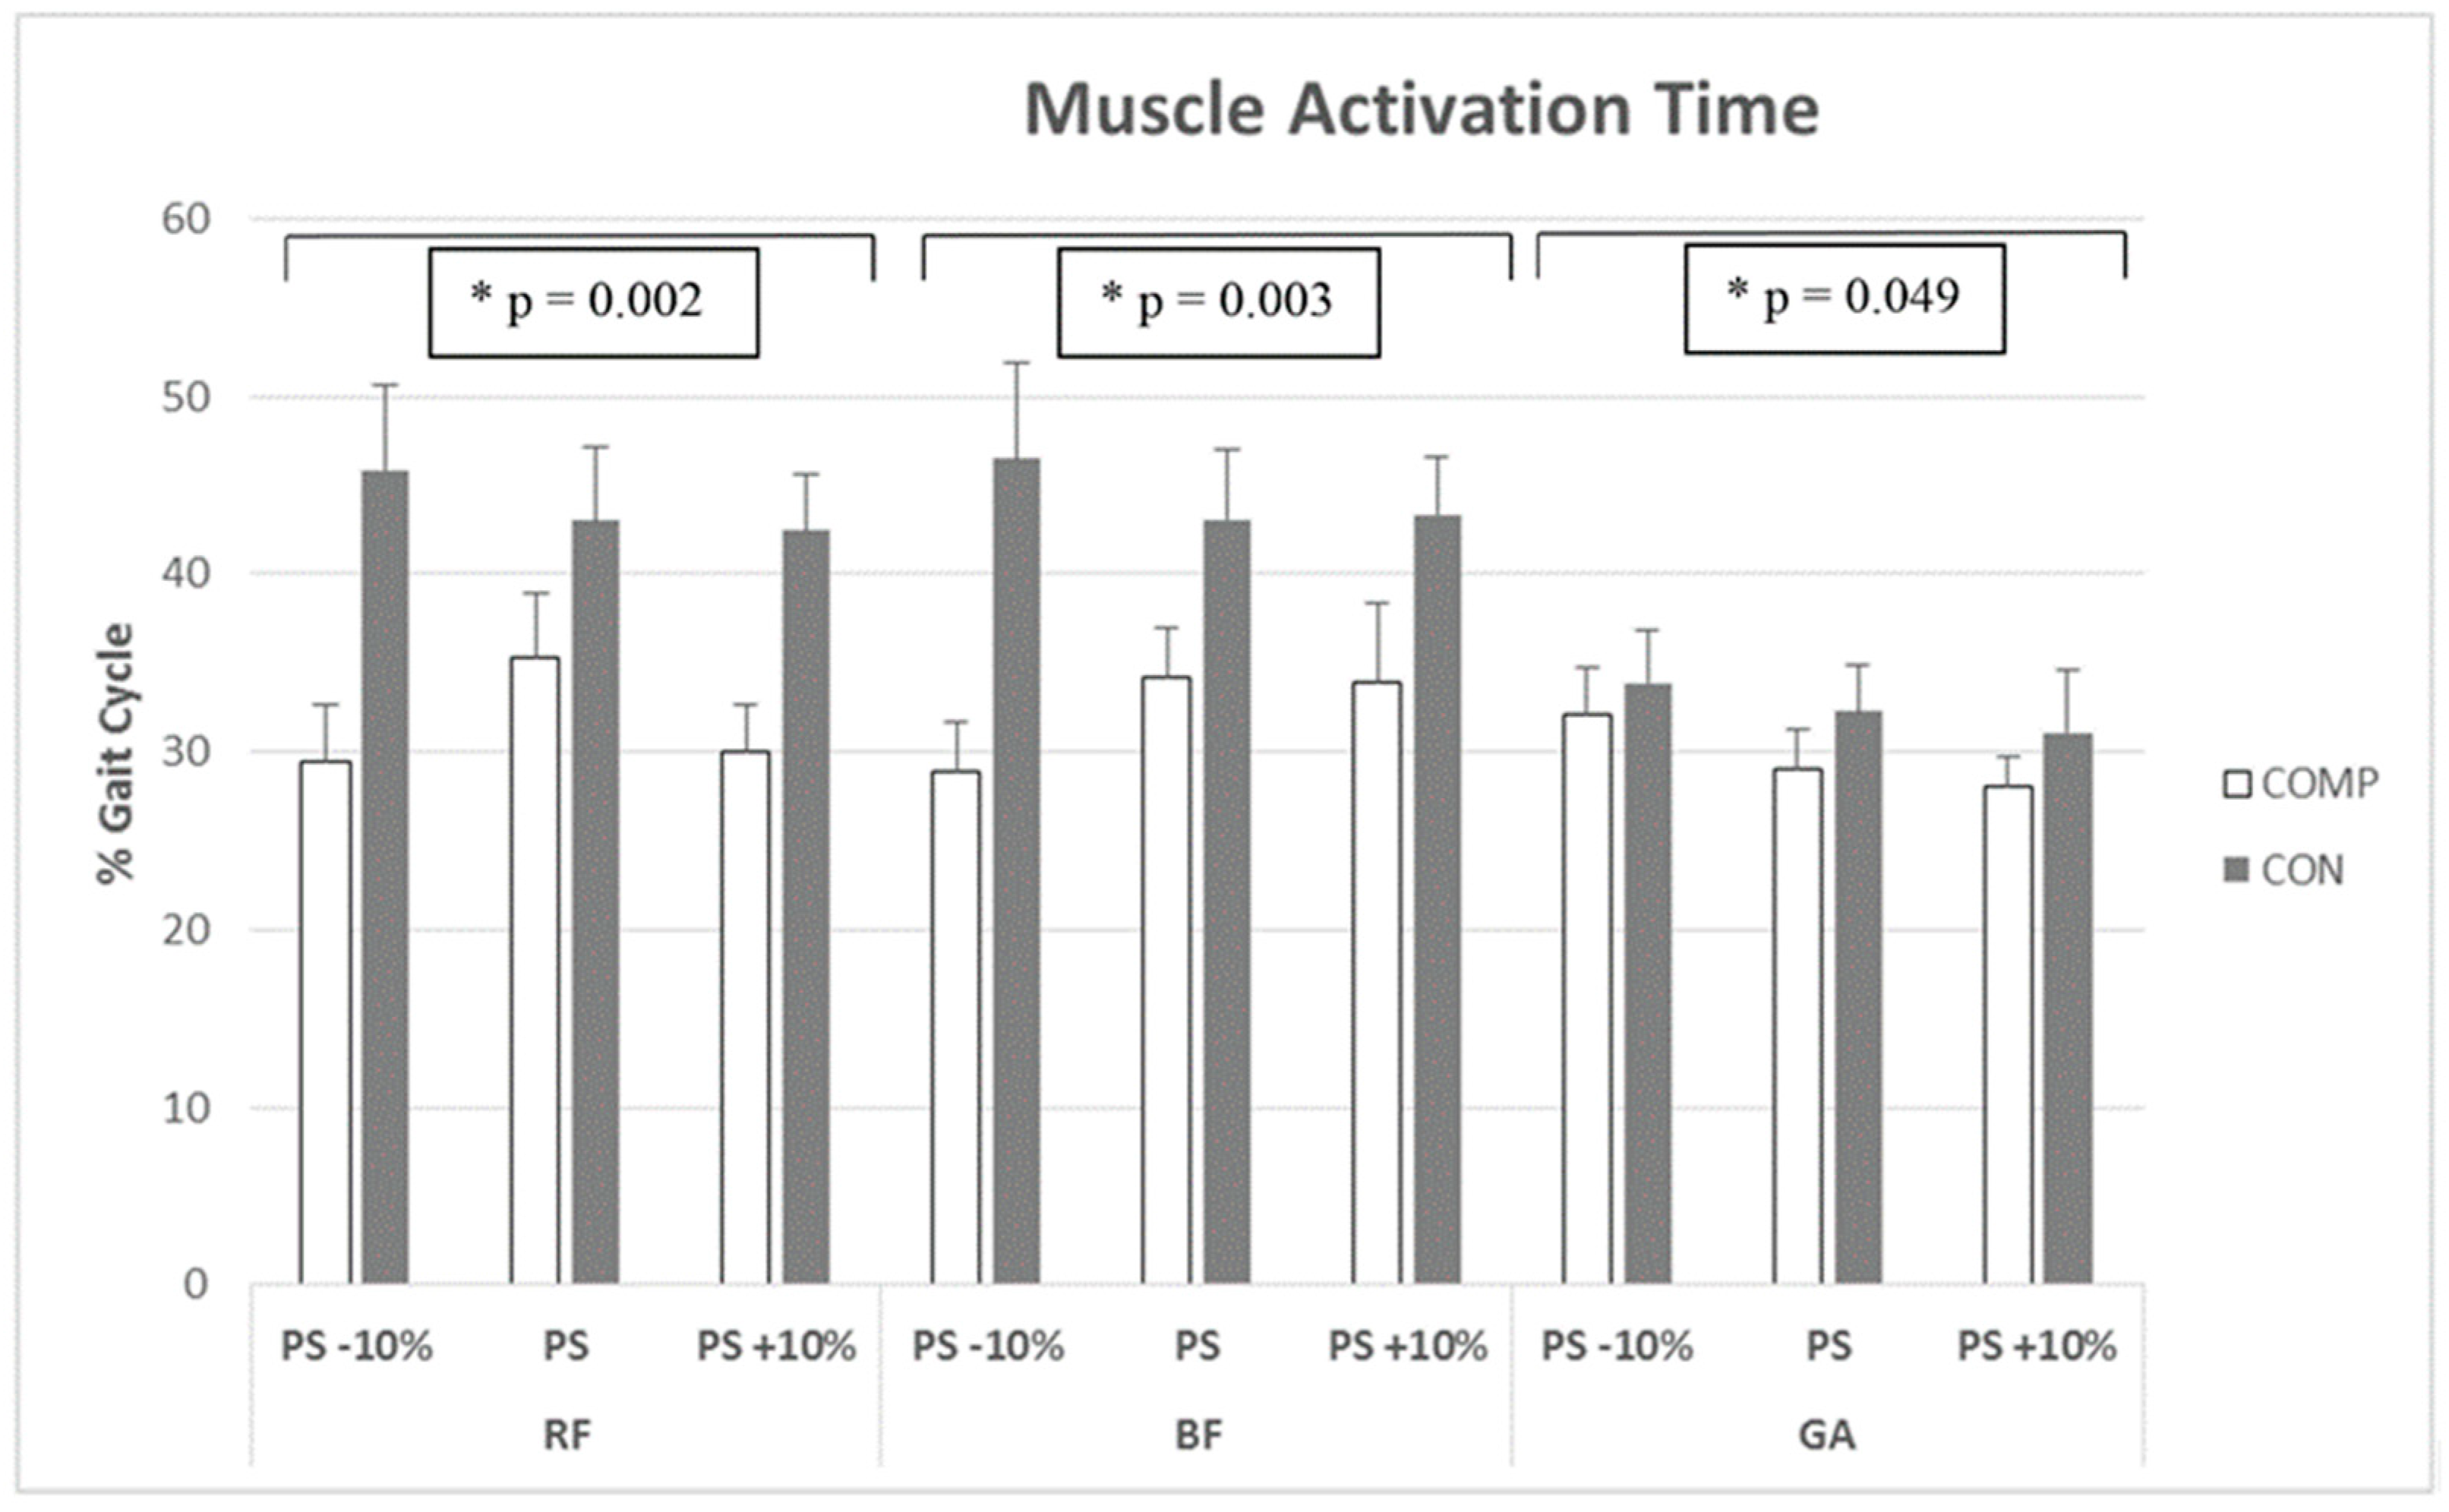
The muscle activation times of all muscles tested were not influenced by the interaction of garment and speed (
p > 0.05). The RF (F(1, 10) = 18.167,
p = 0.002, η
2 = 0.645), BF (F(1, 10) = 15.375,
p = 0.003, η
2 = 0.793), and GA (F(1, 10) = 34.488,
p = 0.049, η
2 = 0.333) were all different between garments regardless of speed. However, the muscle activation time for any of these muscles was not influenced by speed (
p > 0.05). Average muscle activation times as a percentage of the gait cycle for each muscle are presented in
Figure 4.
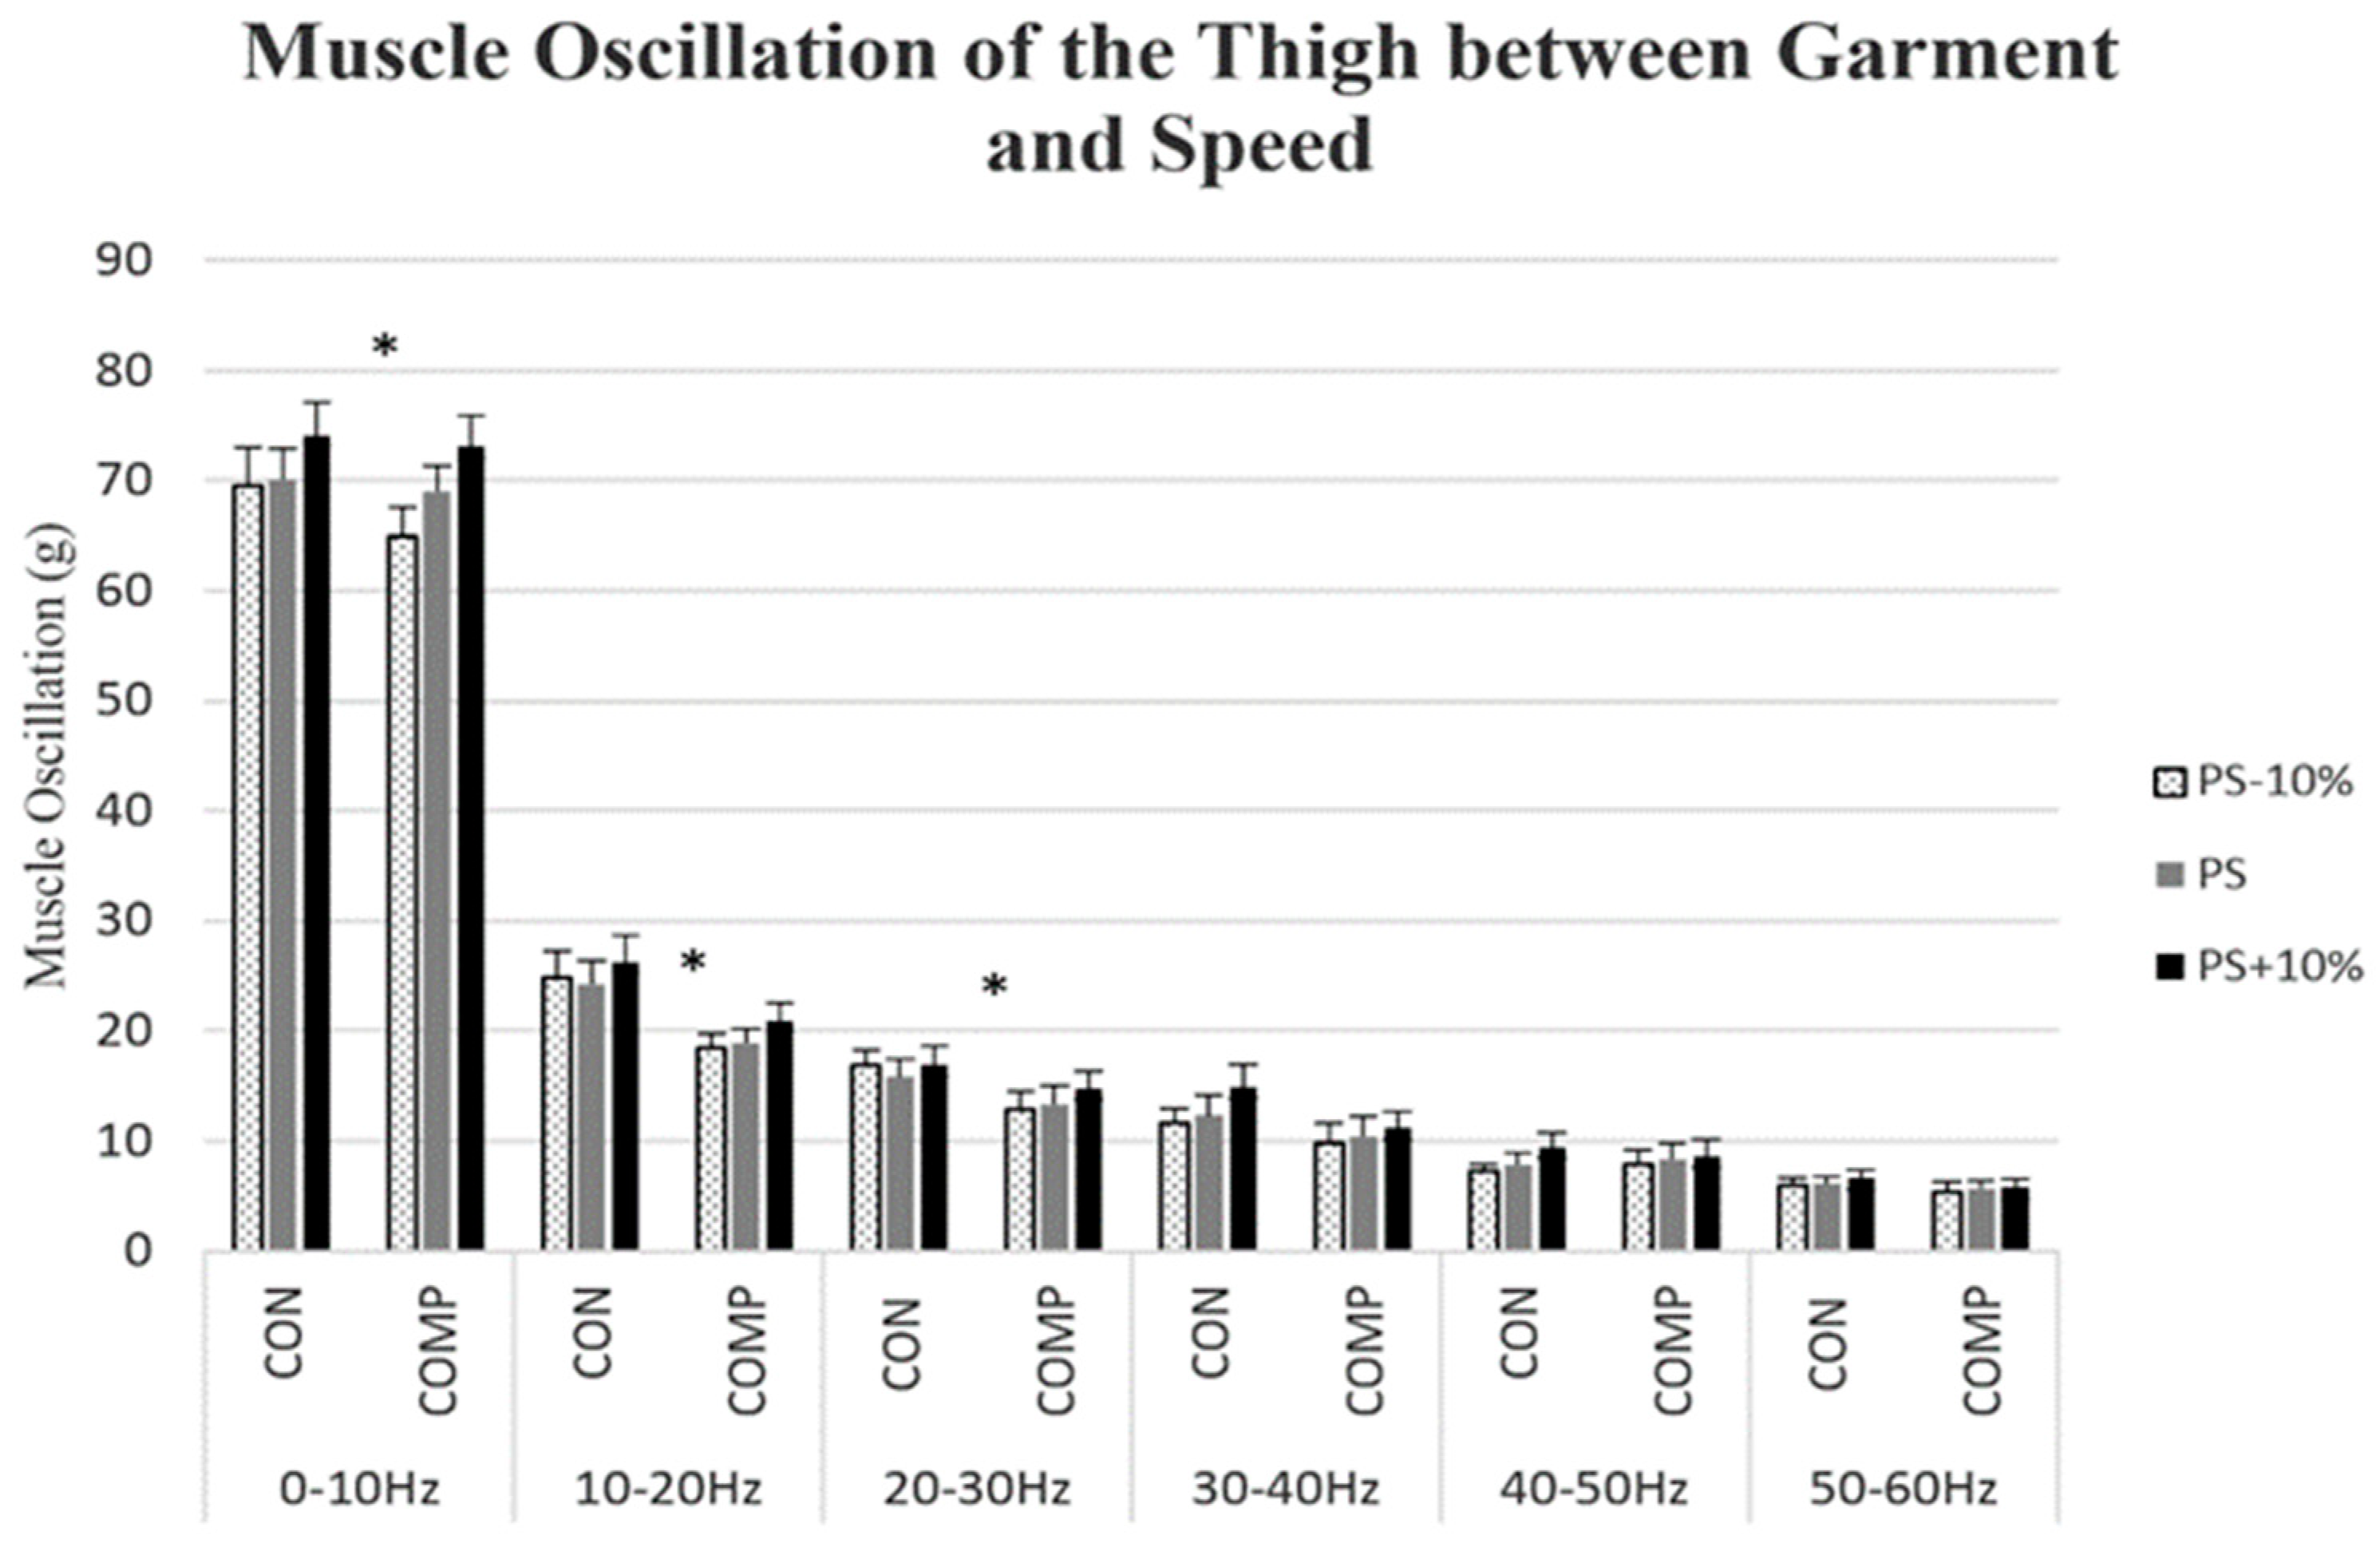
The muscle oscillation of the thigh was not influenced by the interaction between compression conditions for any of the 10 Hz bins tested (
p > 0.05, η
2 < 0.20). For the thigh muscle oscillation, the 0–10 Hz (F(1, 9) = 5.440,
p = 0.045, η
2 = 0.377), 10–20 Hz (F(1, 9) = 14.242,
p = 0.004, η
2 = 0.613), and 20–30 Hz (F(1, 9) = 5.299,
p = 0.047, η
2 = 0.371) average muscle oscillation were significantly lower while wearing the COMP compared to the CON, regardless of speed. However, the 30–40 Hz (F(1, 9) = 4.559,
p = 0.061, η
2 = 0.336), 40–50 Hz (F(1, 9) = 0.537,
p = 0.482, η
2 = 0.056), and 50–60 Hz (F(1, 9) = 0.581,
p = 0.465, η
2 = 0.061) were not significantly different between garments. Additionally, the muscle oscillation of the thigh from 0 to 10 Hz was greater when running at PS + 10% compared to PS and PS − 10% (F(2, 18) = 10.684,
p = 0.001, η
2 = 0.543). Average muscle oscillations for the thigh between garments and at all speeds are presented in
Figure 5.
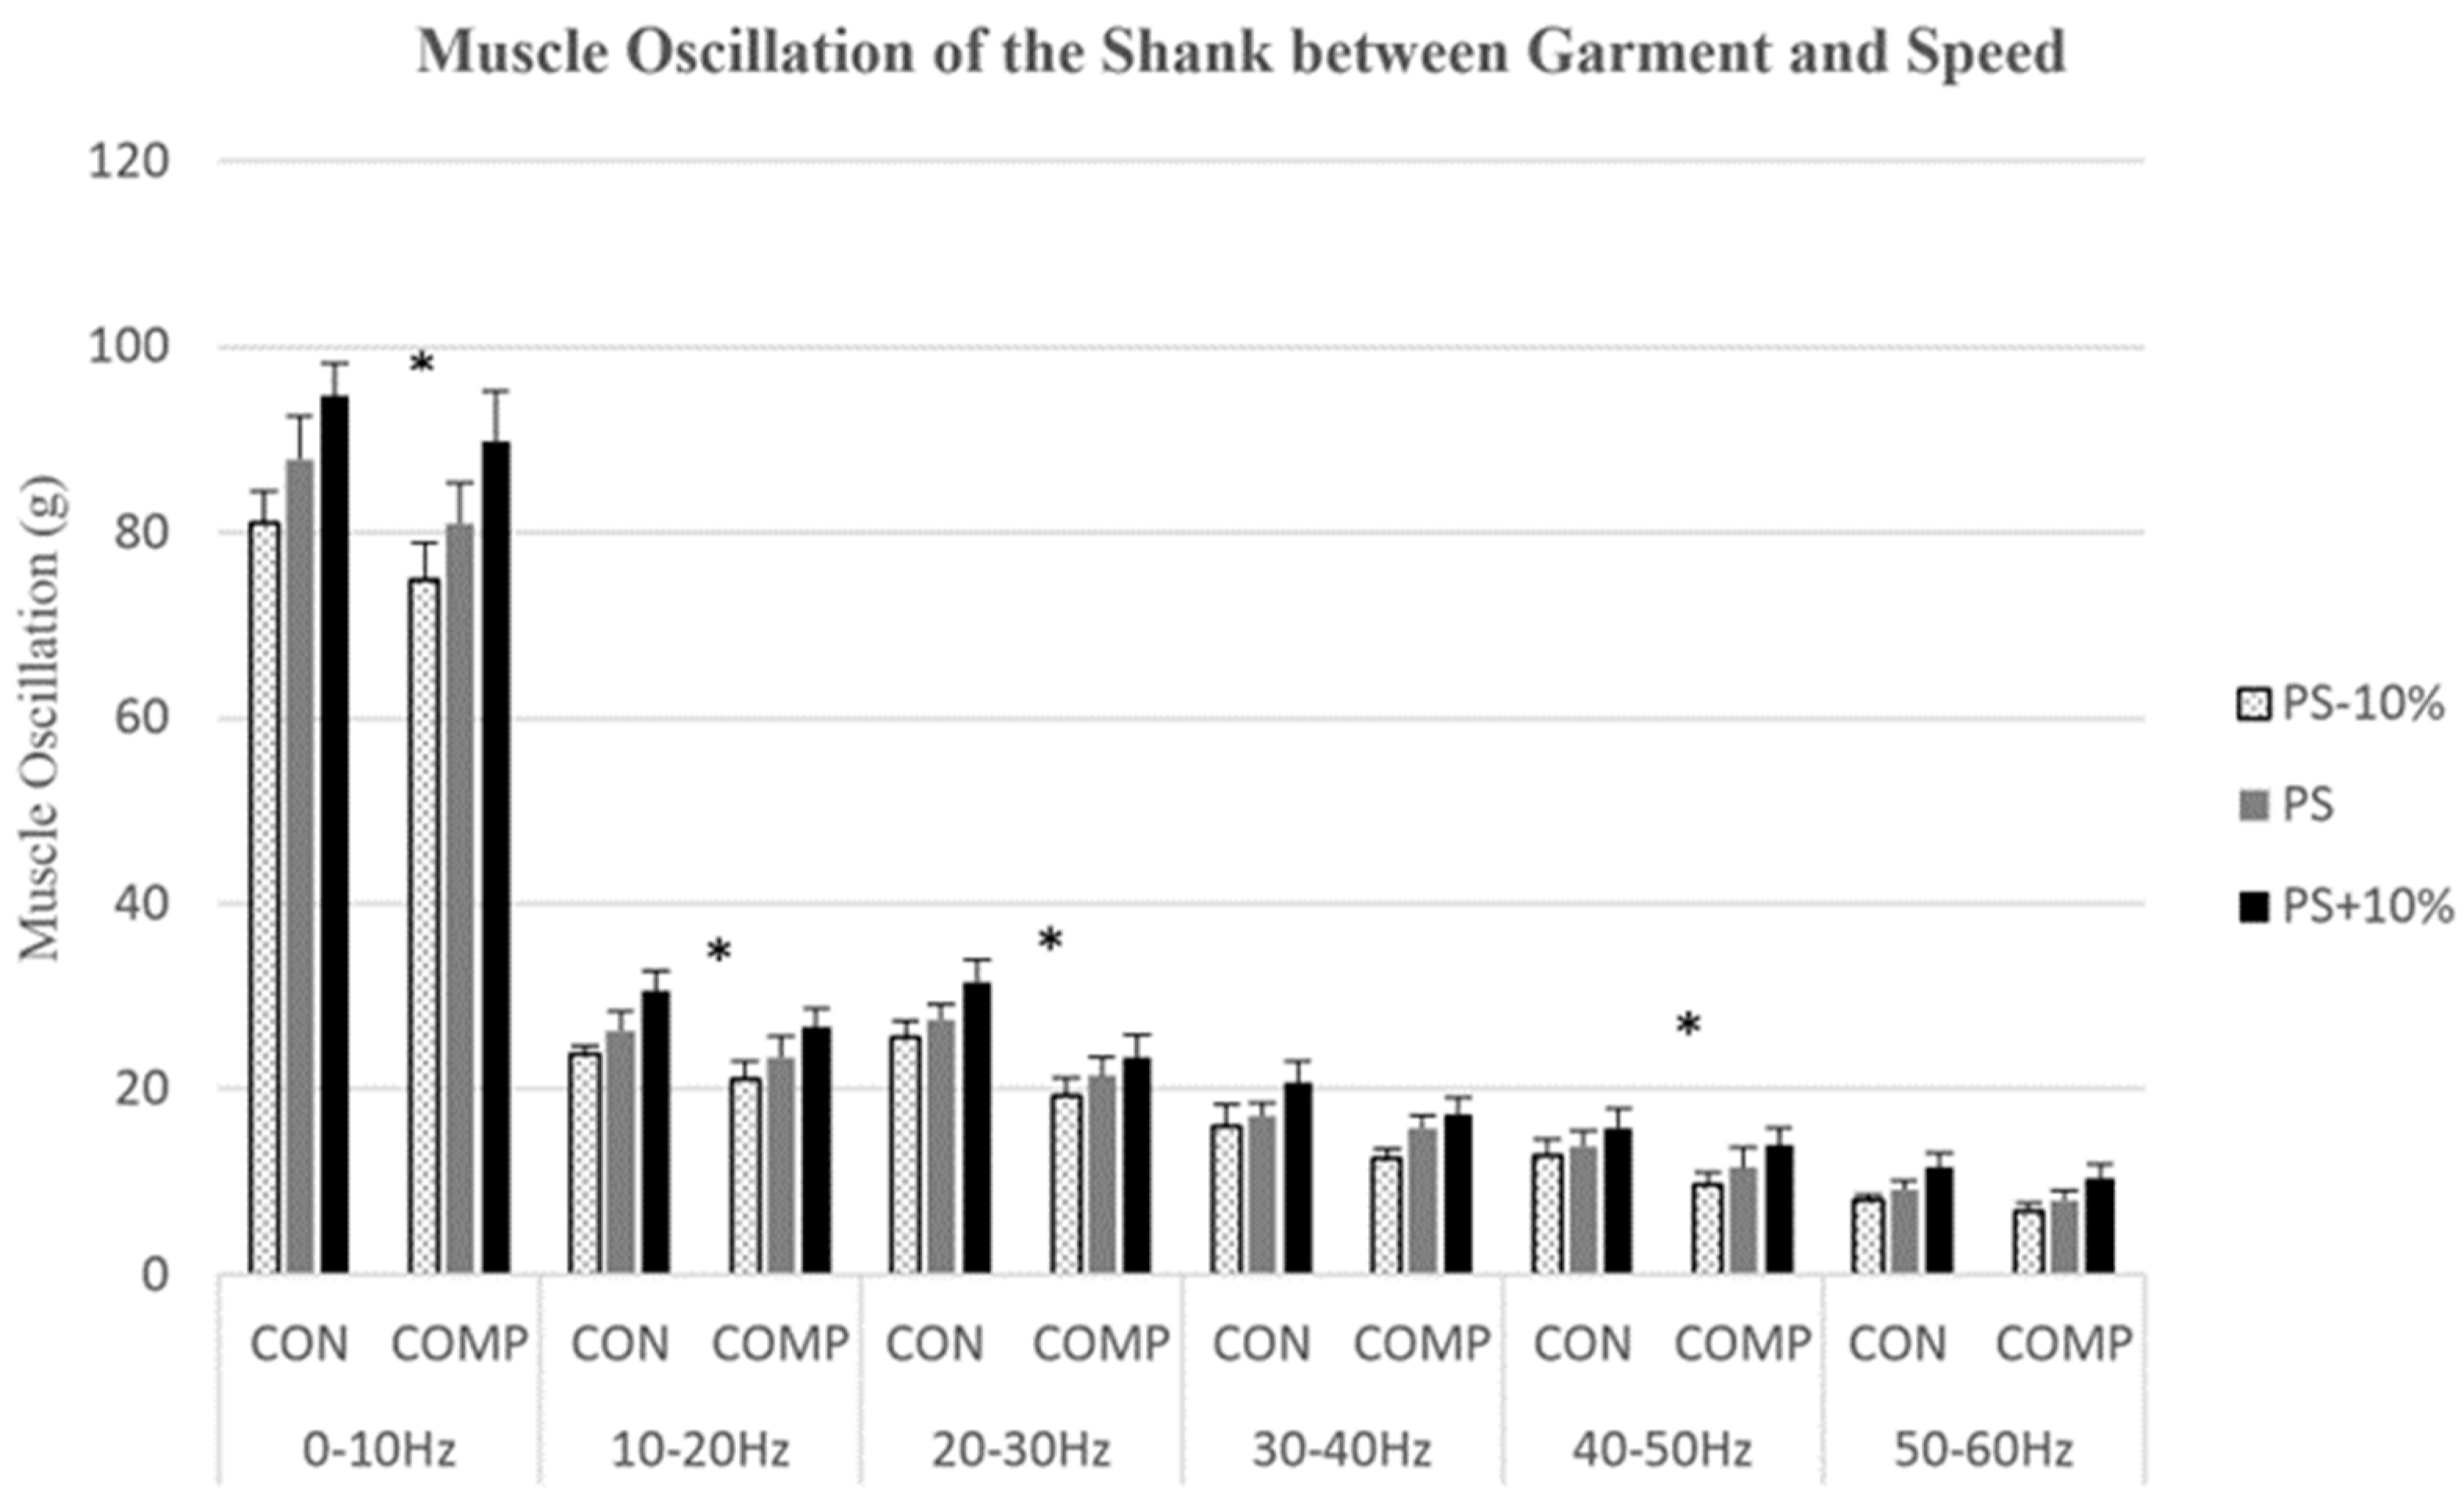
The muscle oscillation of the shank was not influenced by the interaction between the compression conditions for any of the 10 Hz bins tested (
p > 0.05, η
2 < 0.20). For the shank muscle oscillation, the 0–10 Hz (F(1, 9) = 15.413,
p = 0.003, η
2 = 0.631), 10–20 Hz (F(1, 9) = 9.585,
p = 0.013, η
2 = 0.516), 20–30 Hz (F(1, 9) = 28.557,
p < 0.001, η
2 = 0.760), and 40–50 Hz (F(1, 9) = 5.150,
p = 0.049, η
2 = 0.364) muscle oscillation was significantly lower while wearing the COMP compared to the CON, regardless of speed. However, 30–40 Hz (F(1, 9) = 2.898,
p = 0.123, η
2 = 0.244) and 50–60 Hz (F(1, 9) = 0.3.834,
p = 0.082, η
2 = 0.299) were not significantly different between garments. Additionally, the 0–10 Hz muscle oscillation of the shank was different between all speeds tested, and the muscle oscillation increased as speed increased (F(2, 18) = 32.079,
p < 0.001, η
2 = 0.781). Furthermore, there was a significant increase for the muscle oscillation of the shank at 10–20 Hz, 20–30 Hz, 30–40 Hz, and 40–50 Hz, from running at PS − 10% to PS + 10% (
p < 0.05, η
2 > 0.350). The muscle oscillations for the shank between garments and at all speeds are presented in
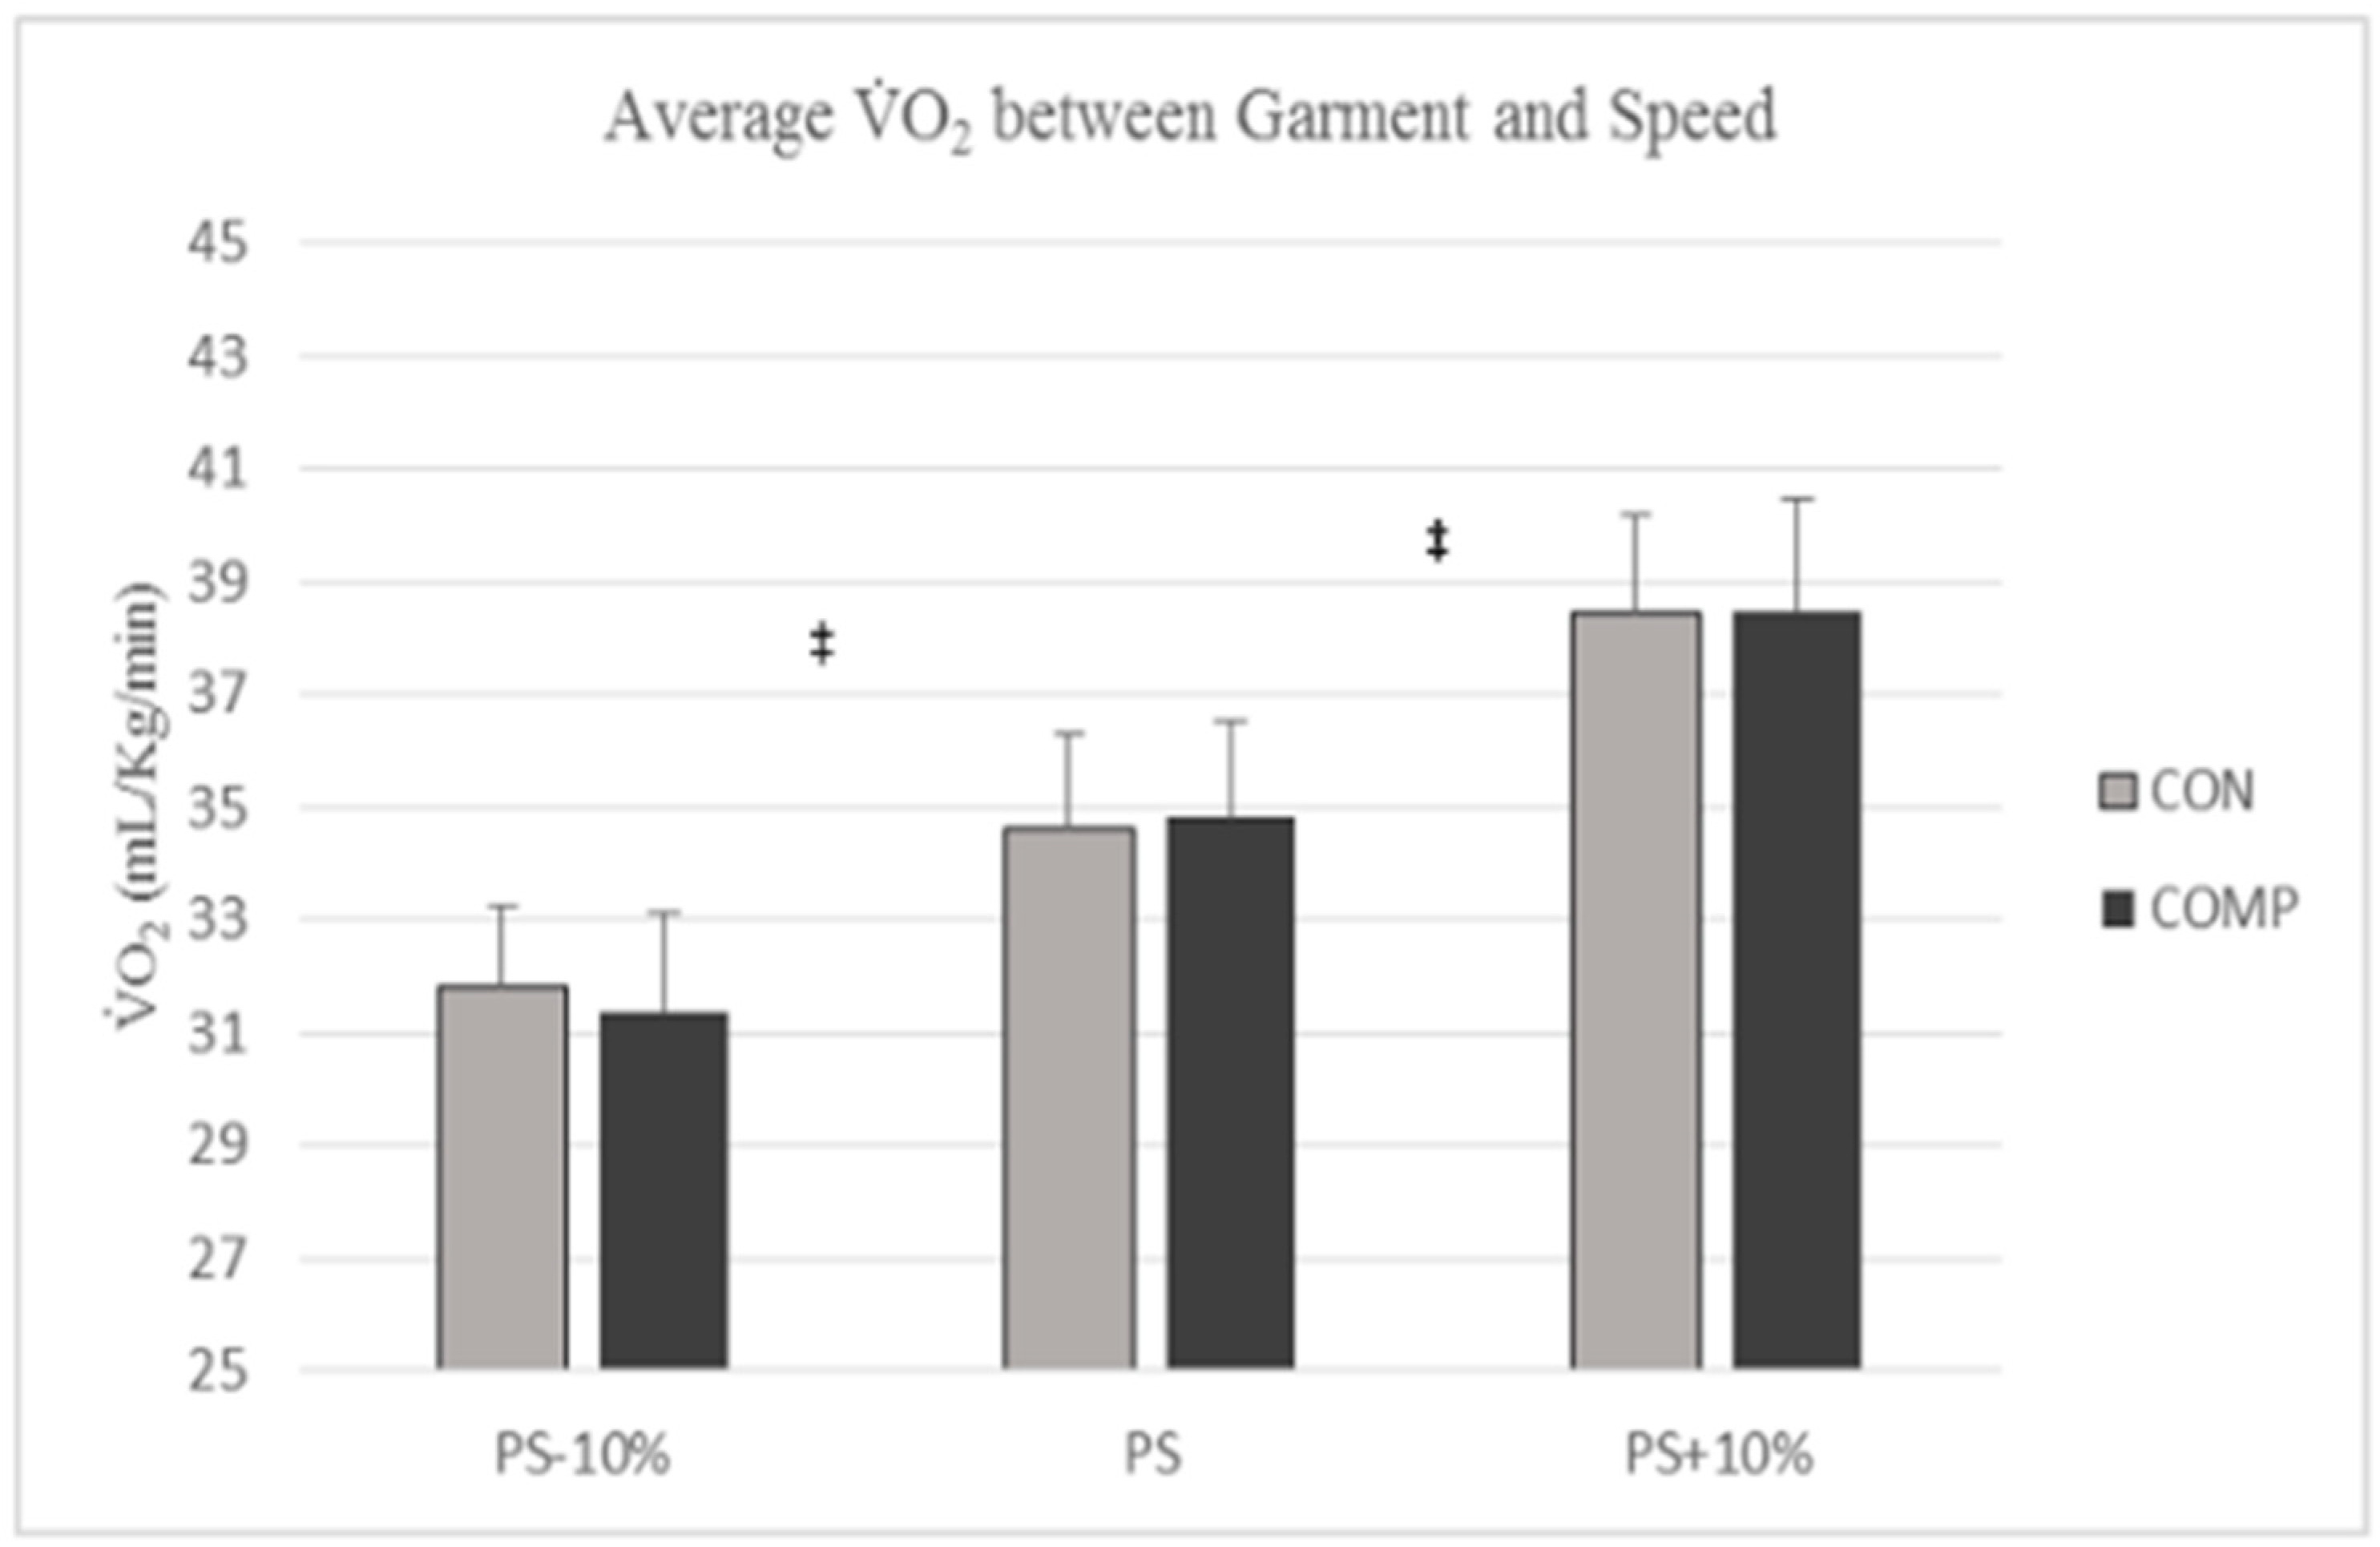
Figure 6. The
O
2 was not influenced by the interaction between garment and speed (F(2, 20) = 0.440,
p = 0.650, η
2 = 0.042). The
O
2 was not different between garments (F(1, 10) = 0.038,
p = 0.848, η
2 = 0.004); however, the
O
2 significantly increased as speed increased (F(2, 20) = 86.220,
p < 0.001, η
2 = 0.896). The
O
2 are presented for both garments at all speeds in
Figure 7.
There were no significant correlations between the belief score or shank circumference and the percentage change in muscle activation time, muscle oscillation, HR, or RPE (
Table 2).
4. Discussion
The main findings of this study were that the muscle oscillation and activation time decreased with the COMP compared to a CON. Additionally, there was no interaction between the garment and the speed of running for any of the variables tested. These findings support the first hypothesis that the muscle oscillation and activation time would be significantly reduced with the use of the COMP. However, the results of this study refute the second hypothesis that the O2 would also be reduced while wearing the COMP and that the extent of all effects observed would be dependent on the participant’s belief in the efficacy of compression. Specifically, it was observed that the O2 was not affected by the garment type and the participant’s belief score had no correlation with the percentage change between garments of any variable tested.
The temporal muscle activity data observed for running wearing both garments at all speeds are consistent with the previous literature. The previous literature reported muscle activation times of the same muscles tested in this study to be anywhere from 25 to 55% of the gait cycle [
42,
43]. Using the stride frequency data obtained, the muscle activation time of the RF, BF, TA, and GA were calculated to range from 27.9% to 46.8% of the total gait cycle. This also makes observing no change in the
O
2 between garments sensible as one previous study reported that where in the gait cycle the activation shortening occurs will affect positive or negative changes in the
O
2 [
43]. In detail, Heise et al. [
43] were not concerned with muscle activity amplitude but only recording activation patterns, and a longer co-activation during stance actually related to lower oxygen consumption. The observed decrease in muscle oscillation also agrees with previous research. Specifically, previous studies have reported a decrease in muscle oscillation from 8 to 9% during running and up to 33% during maximal effort jumping [
12,
13]. The data of this study were on average an 11% reduction in the muscle oscillation for the thigh and a 12% reduction for the shank. Additionally, the reported measures of RPE, SF, and PS were all similar to previous studies that evaluated running at a PS pace [
44,
45,
46].
The observation of a reduction in muscle oscillation while wearing the compression compared to the control is supported in the literature. Specifically, Borras et al. [
13] had runners wear compression on one leg but not the other while the mean muscular displacement of the rectus femoris (superior and anterior), vastus medialis, and vastus lateralis were measured. For all muscles, the mean muscular displacement was reduced in all three axes. Doan et al. [
12] reported a similar result of wearing compression garments during countermovement jumping while looking at the average maximal displacement of the muscle. In the study conducted by Broatch et al. [
18], muscle activation was reduced while wearing compression garments during treadmill running. These previous reports combined with the results of this study suggest that compression garments are responsible for a reduction in muscle oscillation. Furthermore, as a reduction in accelerations up to 40 Hz was observed in this study, it can also be inferred that COMP reduces the soft tissue vibrations of at least the lower extremity during running.
According to Nigg and Wakeling [
16], muscles activate prior to ground contact to aide in dampening the soft tissue vibrations caused by ground reaction forces during running. Wakeling and Nigg [
17] also reported that as vibrations increased so did the pre-activation related muscles, resulting in longer activation periods. Data reported in the present study support these hypotheses in that the soft tissue vibration and muscle oscillation decreased, as did the muscle activation time for three of the four muscles tested. Previous studies that reported EMG with and without compression clothing have focused on the average amplitude of muscle activity [
20,
21,
47]. This will be the first study to date to report the effects of compression on muscle burst length and the relationship to muscle oscillation in the same subjects.
The relationship between COMP and
O
2 is not as well understood. Specifically, numerous studies have reported no significant effects on
O
2 [
22,
25,
26,
48], while other studies have identified a reduction in the
O
2 and muscle oxygenation with the use of compression [
23,
24]. One possible explanation for these conflicting results is that a reduction in muscle activation time alone is not sufficient to elicit changes in the
O
2. As compression has helped maintain performance levels in repeated maximal effort tasks, it has been linked to a reduction in fatigue [
7,
8,
9]. Further, individuals may need to experience significant levels of exercise-induced fatigue to see changes in
O
2. This follows as the slow component of
O
2 has been attributed to fatigue [
49], and compression has led to a reduction in the slow component of
O
2 [
23].
The observation that the belief score had no relationship with the effect of COMP on any of the variables tested is in contrast with past results. Stickford et al. [
26] reported a moderate relationship between a participant’s belief that compression clothing is effective and the extent to which
O
2 was reduced by wearing compression. Another study also reported better time-trial performance during 2 × 5 km timed trials on a second test after using compression pants in the short recovery period [
36]. In a secondary analysis of the data, they reported that those who believed in the compression garments efficacy maintained performance outcomes better in the repeated task. Although the data from the present study does not support the previous literature, it may be because there is just not enough research published yet to make a firm decision on the role in which perception plays. The two aforementioned studies are the only two published studies the authors discovered reporting positive or negative results. As the literature expands, it may be necessary to validate and standardize scales for a participant’s perception and beliefs.
A potential confounding factor was fatigue during testing due to participants having to perform maximal voluntary isometric contractions and then run for at least 36 min. Participants were required to return to within 10 bpm of their resting HR before starting the subsequent condition. This requirement was set to minimize the influence of fatigue on the results of this study. With a visual plateau in the
O
2 on all running conditions performed, it was evident that all participants were running at a submaximal level. The HR and RPE were also typical of submaximal exercise to support this claim [
50,
51]. To account for order bias, we counterbalanced the order of garments between participants and randomized the orders in which they ran the three different speeds. It is possible that a participant’s perception of the efficacy of compression garments was affected by simply participating in the research study. To minimize the influence the investigators had on this, all instructions were read from a script and investigators were conscious of answering all questions during collections as neutrally as possible in terms of the efficacy of compression.
The procedure in which the PS was collected may have limited this study. The PS was collected without COMP and may not be the same with the COMP. However, past unpublished data collected indicated preferred speed does not change between the use of compression socks and control socks. A limitation of this study was that the compression of legs with COMP was not directly measured. We followed all manufacturer sizing guidelines, but it is possible we had some participants fit tightly into a size that another participant felt was loose. Further, the relatively small sample size was a limitation of the present study. However, this is less of a concern as significant differences in both the muscle activation time and muscle oscillation were still achieved. Future work would benefit from a larger sample to examine these differences on a greater scale. A difficulty in obtaining the muscle activation times was the lack of standardized methods within the previous literature. One possible reason for this may be that the optimal process is dependent on individual data sets [
32]. Based upon the EMG background noise in our data, a 10% maximal amplitude was selected and burst times were extracted after data had already been smoothed. This was carried out to prevent falsely identifying on/off times due to background noise being larger than the cutoff amplitude. It is possible that filtering the data first may slightly shift the on/off identification in time. To account for the low frequency movement artifact in the EMG data, all data were reprocessed using a 20–100 Hz bandpass fourth-order Butterworth filter and on/off times were identified again. The reprocessed data were analyzed for differences using a two-way repeated-measures ANOVA [garment (COMP, CON) × speed (PS − 10%, PS, PS + 10%)] (α = 0.05). It was determined that data analysis and interpretation was the same regardless of filtering process used. All burst on/off times were visually identified within the data, and it was determined visually that all extracted data truly represented accurate burst lengths. Additional research may be necessary to identify if different compression garments affect muscle activation time to different extents.


 ,
, 


