Article

Two Repetitions May Be Enough! Reliability of Movement Timing in Physical Fitness Exercises Performed by Young, Trained Adults Using Inertial Sensors

by
Analina Emmanouil
*,
Elissavet Rousanoglou
and
Konstantinos Boudolos
School of Physical Education and Sport Science, National and Kapodistrian University of Athens, 172 37 Daphne, Greece
*
Author to whom correspondence should be addressed.
Biomechanics 2024, 4(1), 84-108; https://doi.org/10.3390/biomechanics4010006
Submission received: 29 November 2023 / Revised: 31 January 2024 / Accepted: 4 February 2024 / Published: 19 February 2024
(This article belongs to the Section Gait and Posture Biomechanics)

Abstract

:
This study aimed to determine the minimum number of repetitions for a high reliability of movement timing in fundamental physical fitness exercises using inertial sensors. Fifteen young men and fifteen women performed eight exercises (two-leg hop, forward lunge, squat, sit-up, shoulder abduction, hip abduction, back extension, and push-up) (preferred tempo, 3 trials, 20 repetitions per trial). The movement timing (cycle of movement in seconds and its phases in seconds and %tcycle) was tested for intra- and inter-trial reliability (SPSS 28.0, p ≤ 0.05). Just two repetitions were adequate for excellent intra- and inter-trial relative reliability (ICCs ≥ 0.75, isolated exceptions only for durations expressed as %tcycle, in only three out of the eight exercises: hip abduction, back extension, and push-up), as well as for high absolute intra- and inter-trial reliability (average SEM% at 5.9%, respectively, and 6.8% and average MDC95% at 13.7% and 15.9%, respectively, which was consistently higher than the upper boundary limit of SEM%, and a rather low CV% ranging from 1.5% to 4.9% and averaging at 3.1%). A total of four repetitions, excluding the initial and the final one, appears adequate for high overall reliability of movement timing in the eight physical fitness exercises examined.

1. Introduction

The temporal analysis of rhythmic movement patterns provides a valuable insight into timing, coordination, and neuromuscular control during movement execution [1,2,3,4,5,6,7]. In the context of exercise and sports, understanding the temporal dimensions of repetitive exercise movement patterns is crucial for optimizing performance, ensuring participant safety, and maximizing training benefits. Temporal analysis aims at the movement timing using variables such as the duration of the whole cycle of movement and the duration of the movement phases (the latter is expressed in seconds as well as by a percentage of the cycle of movement duration). Force plates [8,9,10,11], and motion capture systems [11,12] have traditionally been used in laboratory testing, whereas wearable inertial sensors have emerged as a portable and affordable tool for assessing human movement patterns in a field setting [1,2,3,4,5,6,13].
Inertial sensors typically contain three-axis accelerometers, gyroscopes, and magnetometers. The acceleration, velocities, and displacements of rhythmic movement patterns comprise periodic signals that are suitable for detecting movement events as well as for defining the temporal pattern of the acting body segments [1,2,3,4,5,6,7]. Their small size and weight enable unencumbered movement; these features, coupled with their ease of use and their capacity to capture data from numerous subsequent movement cycles, make them a promising, affordable, and friendly tool for assessing everyday activities, exercise, or sports routines.
There has been a growing body of research concerning the validity and reliability of inertial sensors in movement analysis [3,5,7,14,15]. Regarding reliability, the findings suggest that inertial sensors can be reliably employed for repeated measurements of movements across various contexts. However, it is essential to recognize that their reliability depends on the specific movement being evaluated [2,14]. Thus, the movement-specific reliability of the inertial sensing is crucial for consolidating its use in field settings, such as for exercises that are fundamental in fitness modalities or sports routines, where a repetitive movement execution is typically applied. In the temporal analysis of rhythmic movements, the number of repetitions significantly influences the accuracy and reliability of the results [9,10,11,12,15,16,17].
The repetitions within a single trial or within the trials in the same session constitute measures applied at different time points to the same subjects, and their stability over time defines their temporal reliability [18]. The equivalence of items from the same test (i.e., the different temporal measures used to evaluate the timing of a movement when a motor task is evaluated) represents the internal consistency of the temporal reliability [18].
Both a small and a large number of repetitions can lead to variations in the temporal movement patterns corresponding to external or internal factors. External factors introduce measurement errors, while internal factors reflect inherent variability due to repetition-to-repetition differences or individual disparities [16]. Collecting data from multiple movement repetitions typically overcomes these variations. However, many repetitions can be impractical in real-world fitness settings as they can potentially induce a learning or fatigue effect as well as result in a progressive decrease or increase in natural behavior variability [16,17]. It is worth noting that the existing literature on this topic is restricted to movement patterns such as walking [9], running [11], swimming [12], continuous countermovement jumping [10], and repetitive squatting [17], and it does not specifically address the temporal features of movement through inertial sensing. To the best of our knowledge, there appears to be a lack of information about the reliability of the inertially sensed movement timing during fundamental physical fitness and sports exercises, highlighting a gap in the inertial sensors’ applicability across various functional movement patterns in the fitness field.
Therefore, this study aimed to assess the minimum number of repetitions that allows high temporal reliability of the movement timing in a variety of fundamental physical fitness exercises using inertial sensors.

2. Materials and Methods

2.1. Participants

Thirty active men (n = 15) and women (n = 15) (age: 24.8 ± 3.3 and 28.9 ± 6.6 yrs; body height: 1.8 ± 0.1 and 1.7 ± 0.04 m; body mass: 80.2 ± 8.5 and 59.3 ± 6.3 kg; BMI: 24.3 ± 2.1 and 21.8 ± 2.0 kg/m2, for the men and the women, respectively) with various sports backgrounds (i.e., basketball, football, gymnastics, and weightlifting) and at least two years of strength training experience (all right-handed and right-footed) participated in the study. All the participants were physically active (at least two times per week over the last six months and at least 60 min per fitness session). During a familiarization session, they were evaluated by an experienced examiner with regard to their ability to perform ten consecutive repetitions in each movement pattern with the correct technique (Appendix AFigure A1). The inclusion criteria also required that there was no history of vestibular, orthopedic, and neurological disorders within the previous 12 months, as these may have potentially negatively affected their movement patterns.

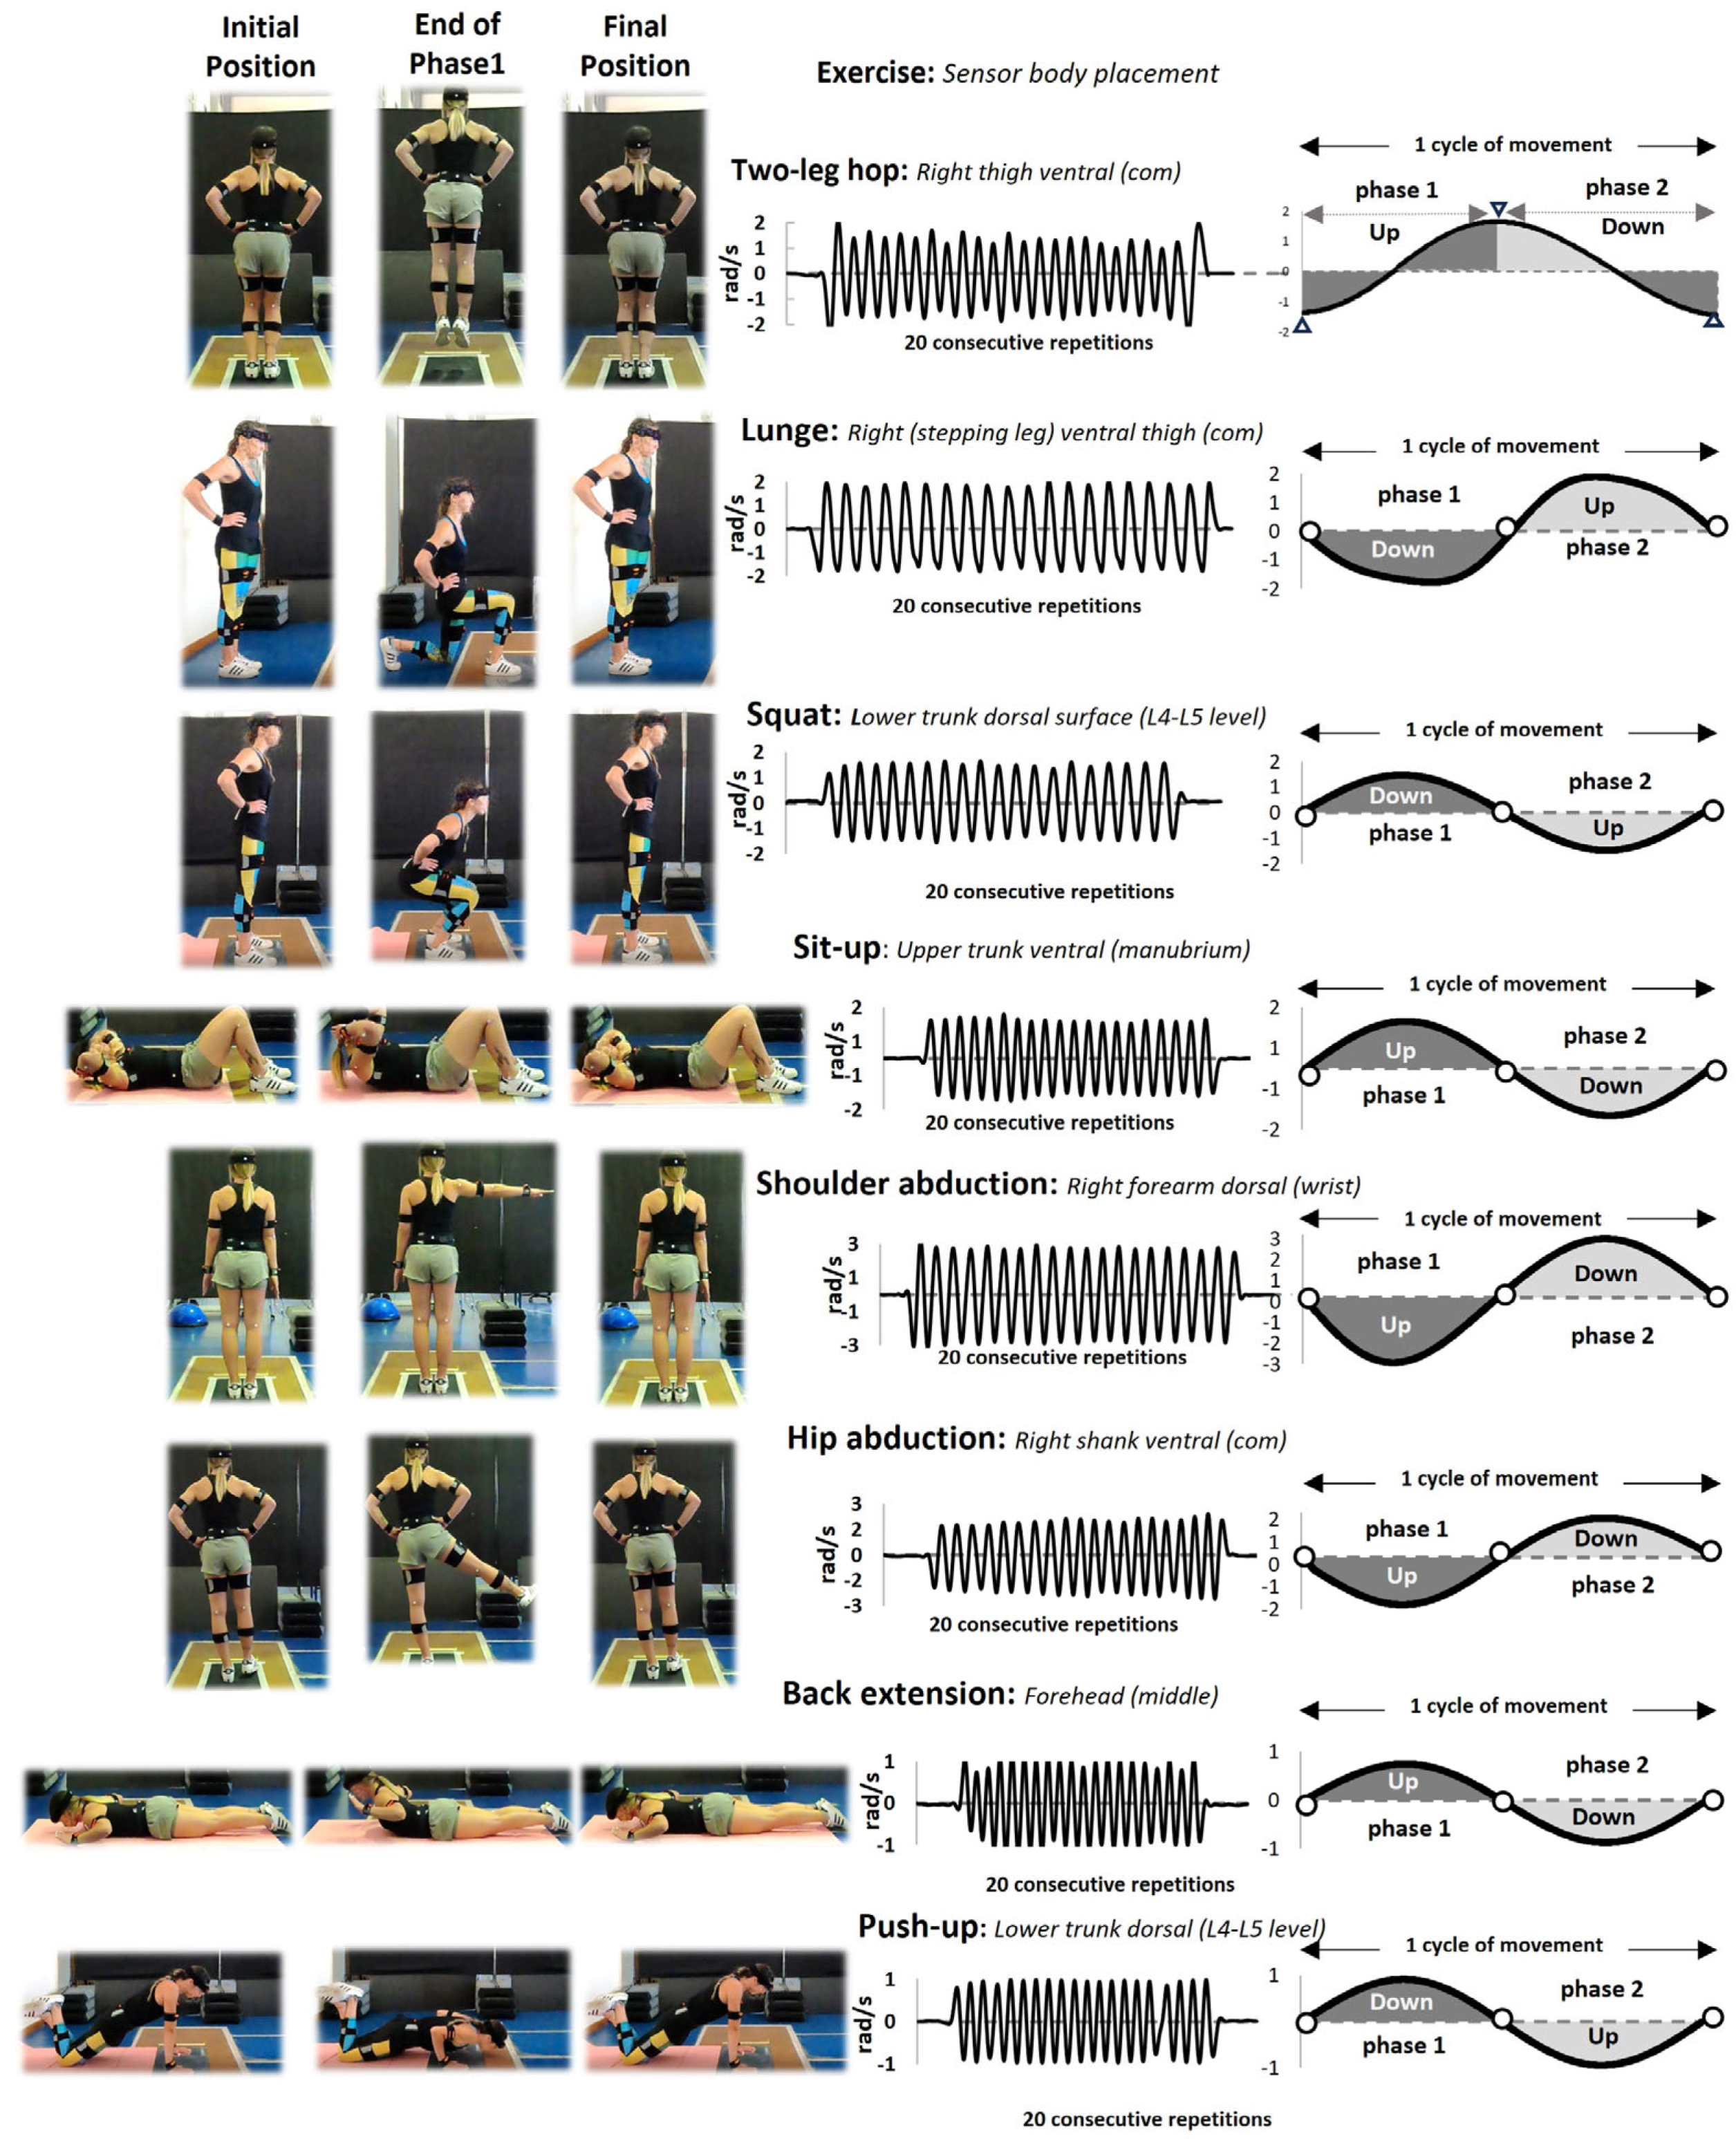
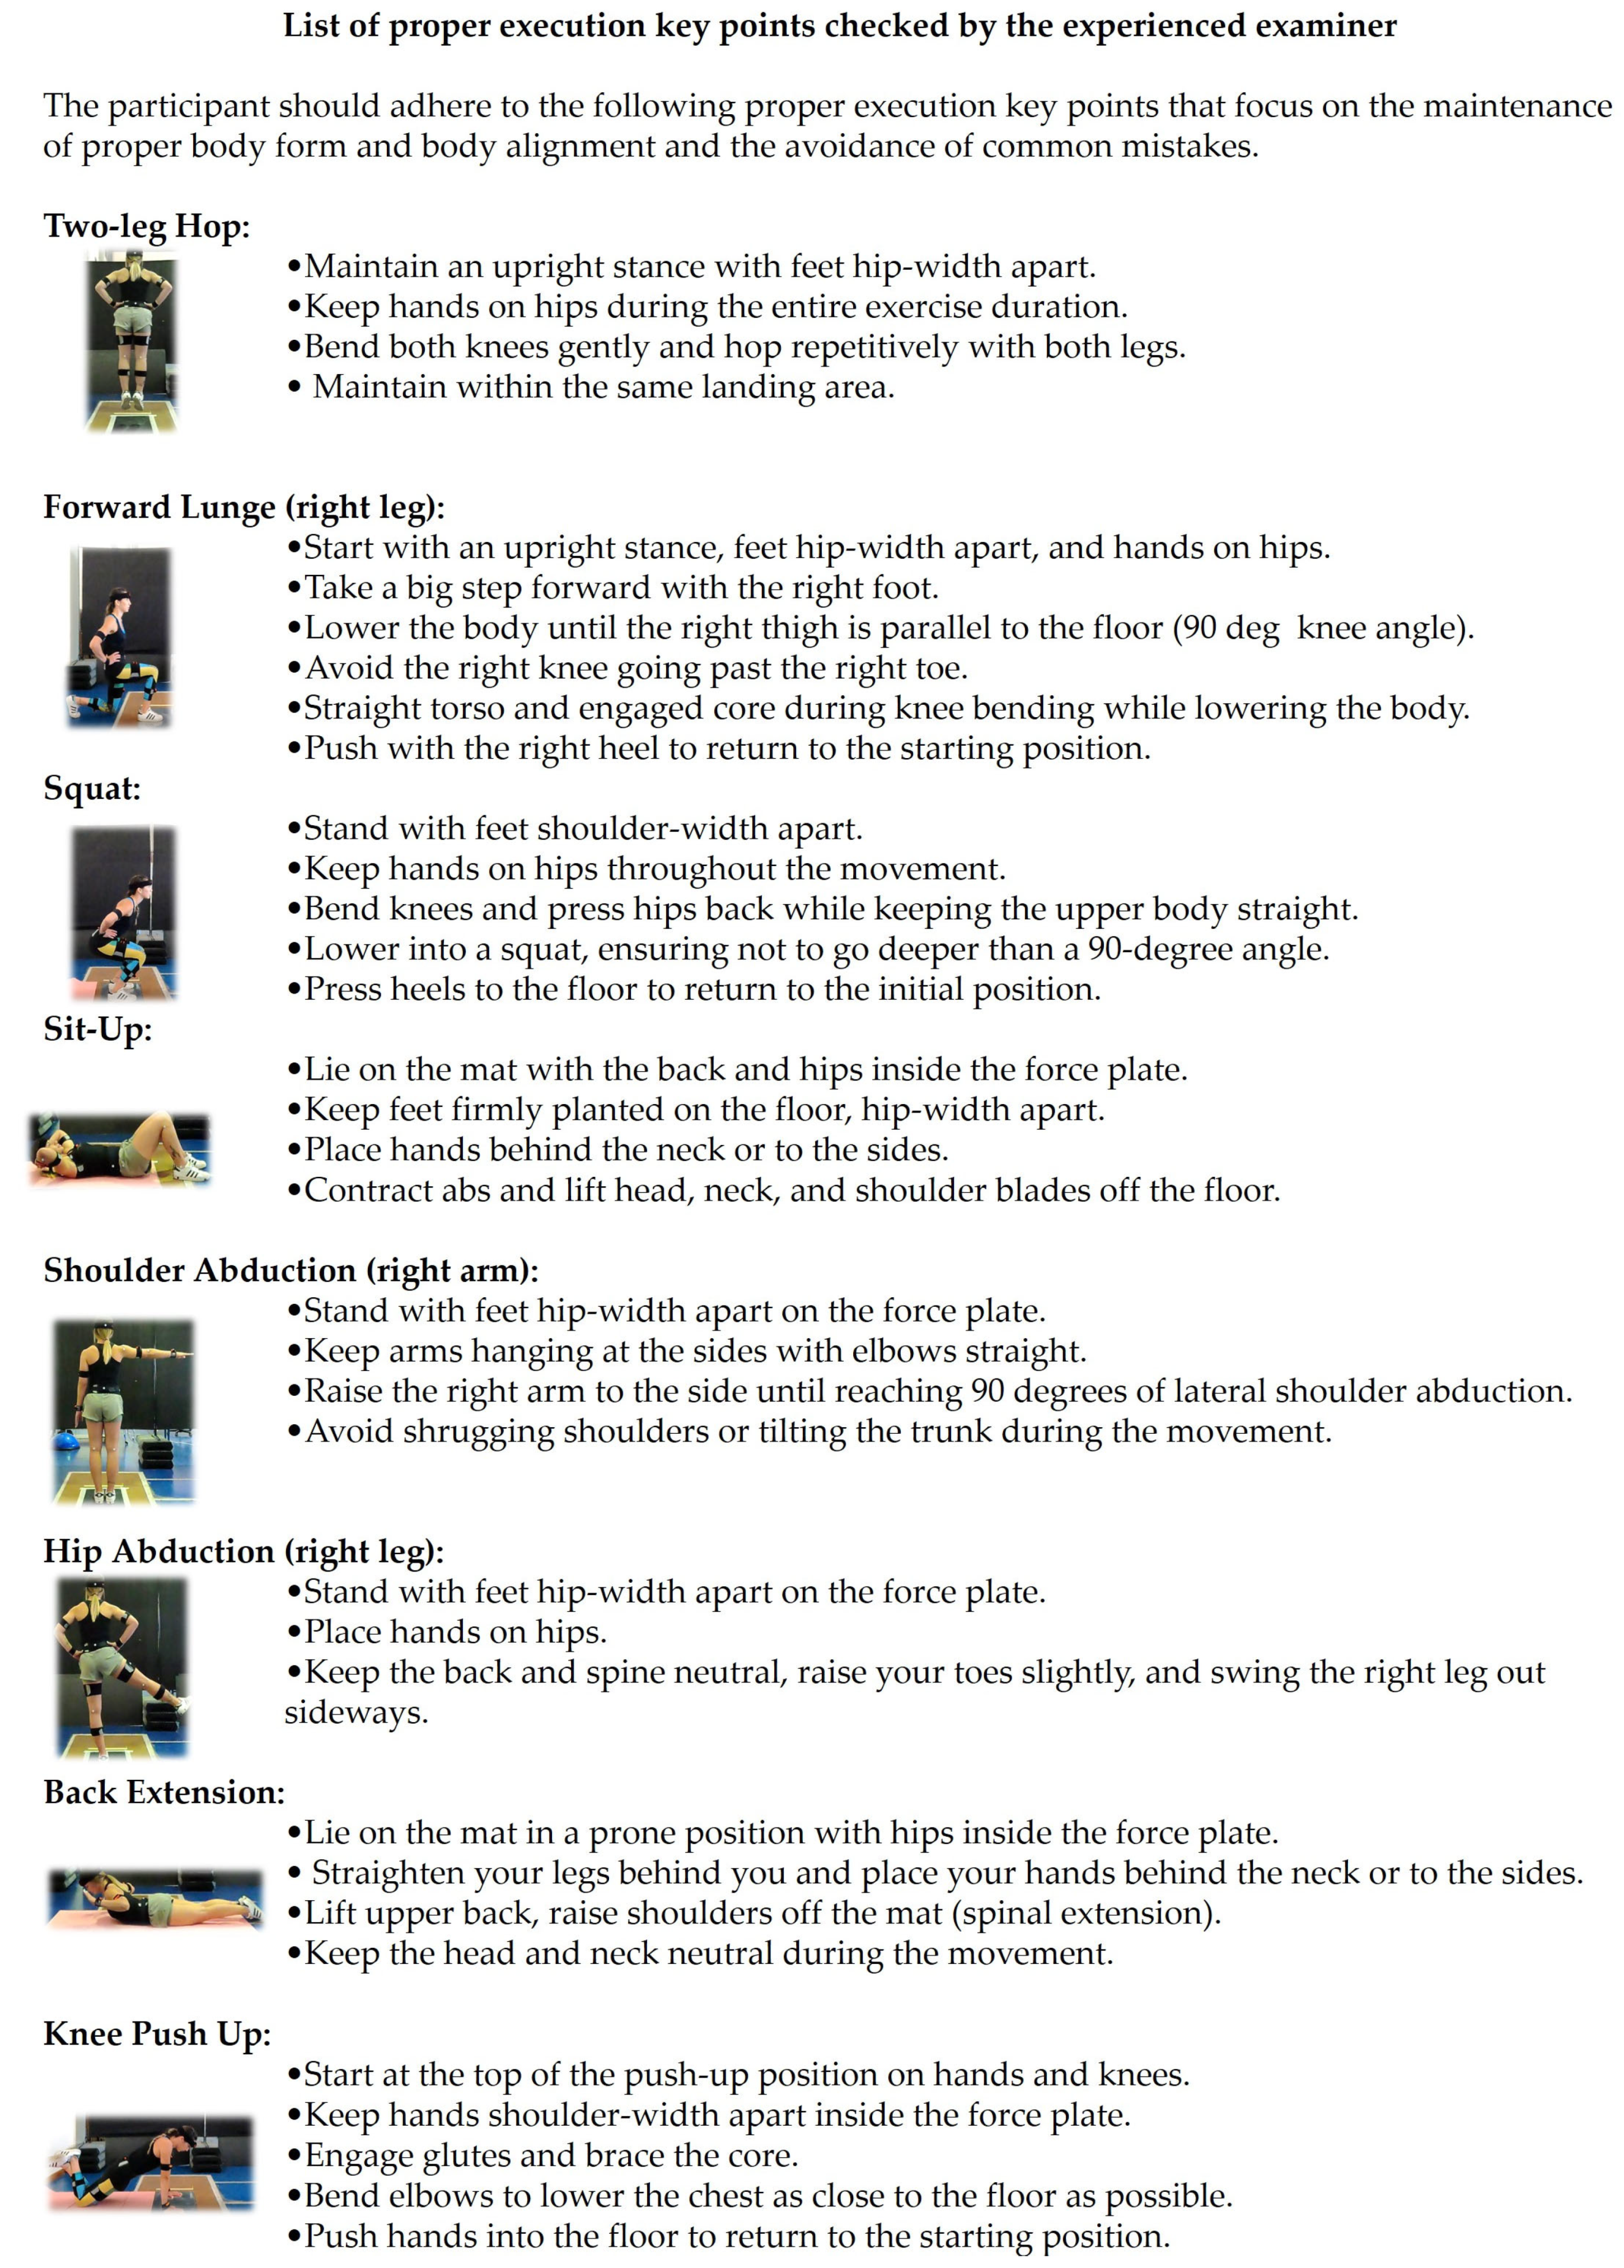
2.2. Experimental Procedure

The participants were required to perform eight different exercise movement patterns at their preferred, most comfortable tempo. The eight movement patterns were: two-leg hop in place, forward lunge (right-foot forward stepping by all participants), squat, sit-up, shoulder abduction (right arm), hip abduction (right leg), back extension, and push-up (Figure 1). The participants completed 3 trials of 20 consecutive repetitions for each movement per trial, with a 2 min rest between trials of the same movement to avoid the inducing of fatigue [19]. A rotation order was applied to randomize the movements across the participants, i.e., the sequence of movements was kept the same, and each participant started with the movement following the initial one of the preceding participant. Before data collection, the instructions for movement execution were provided both verbally and visually to ensure proper technique. During each trial, all the participants were visually monitored for their technique by the same examiner who had evaluated them in the familiarization session.

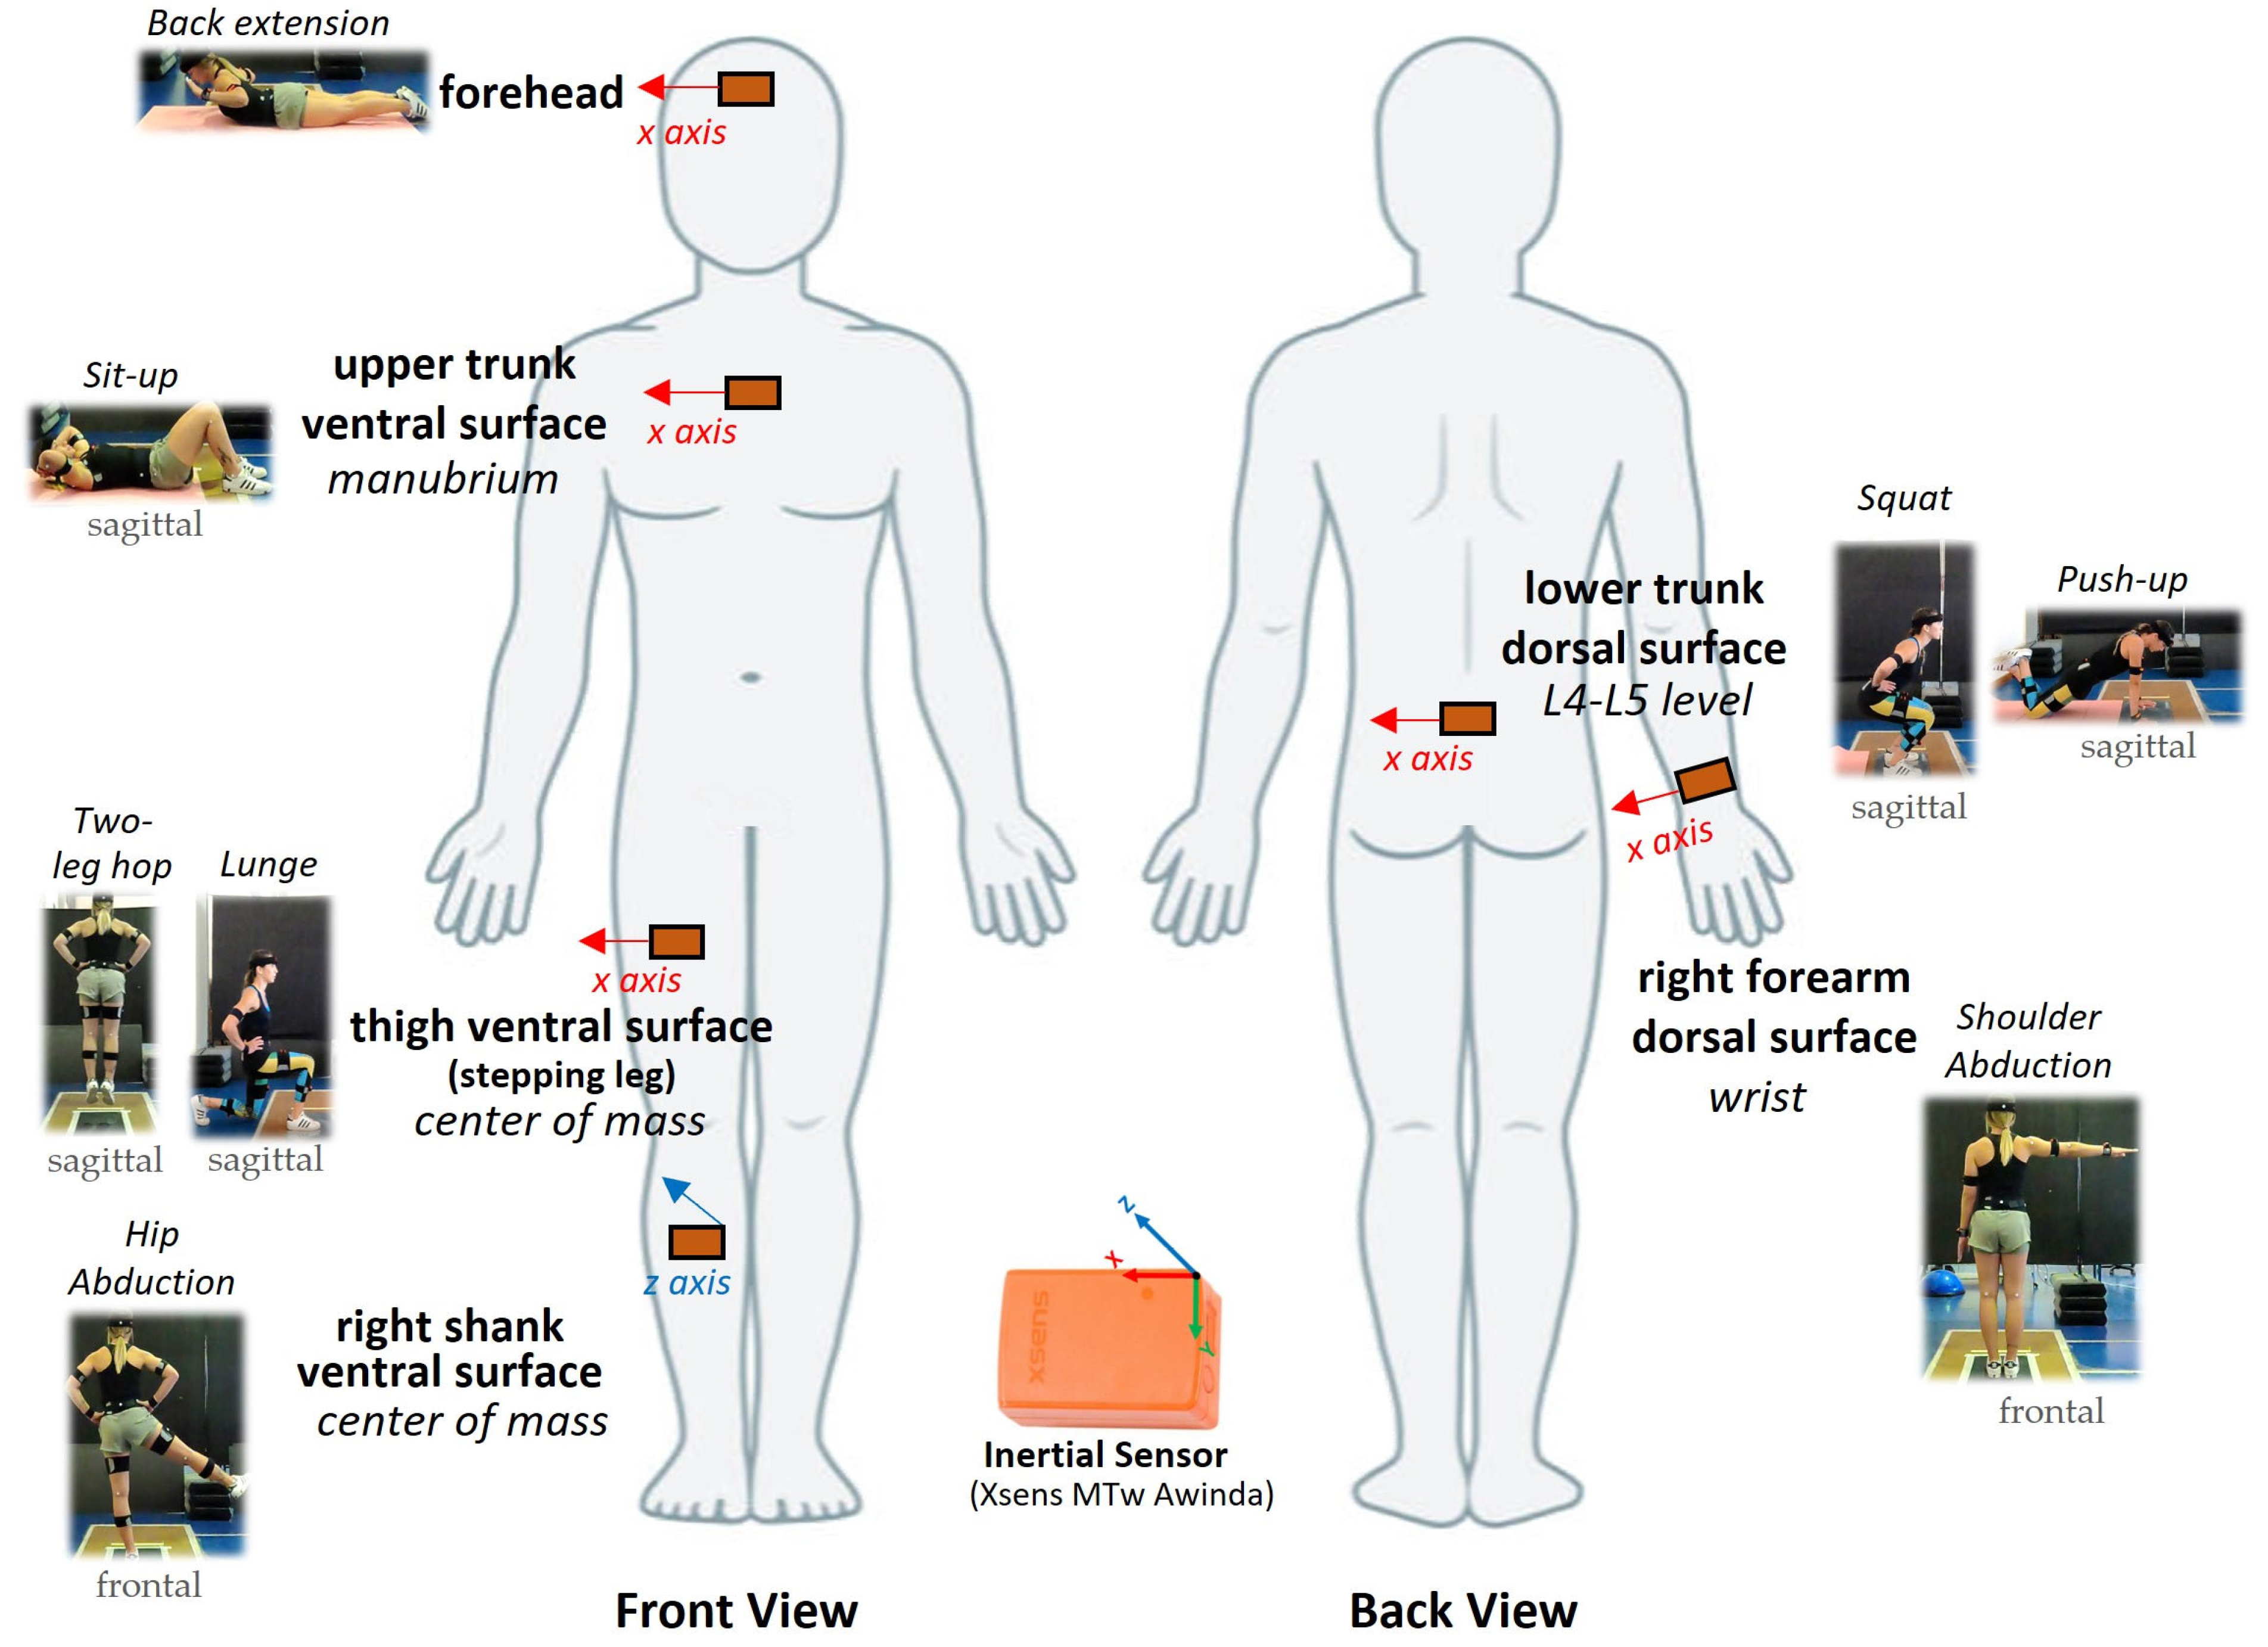
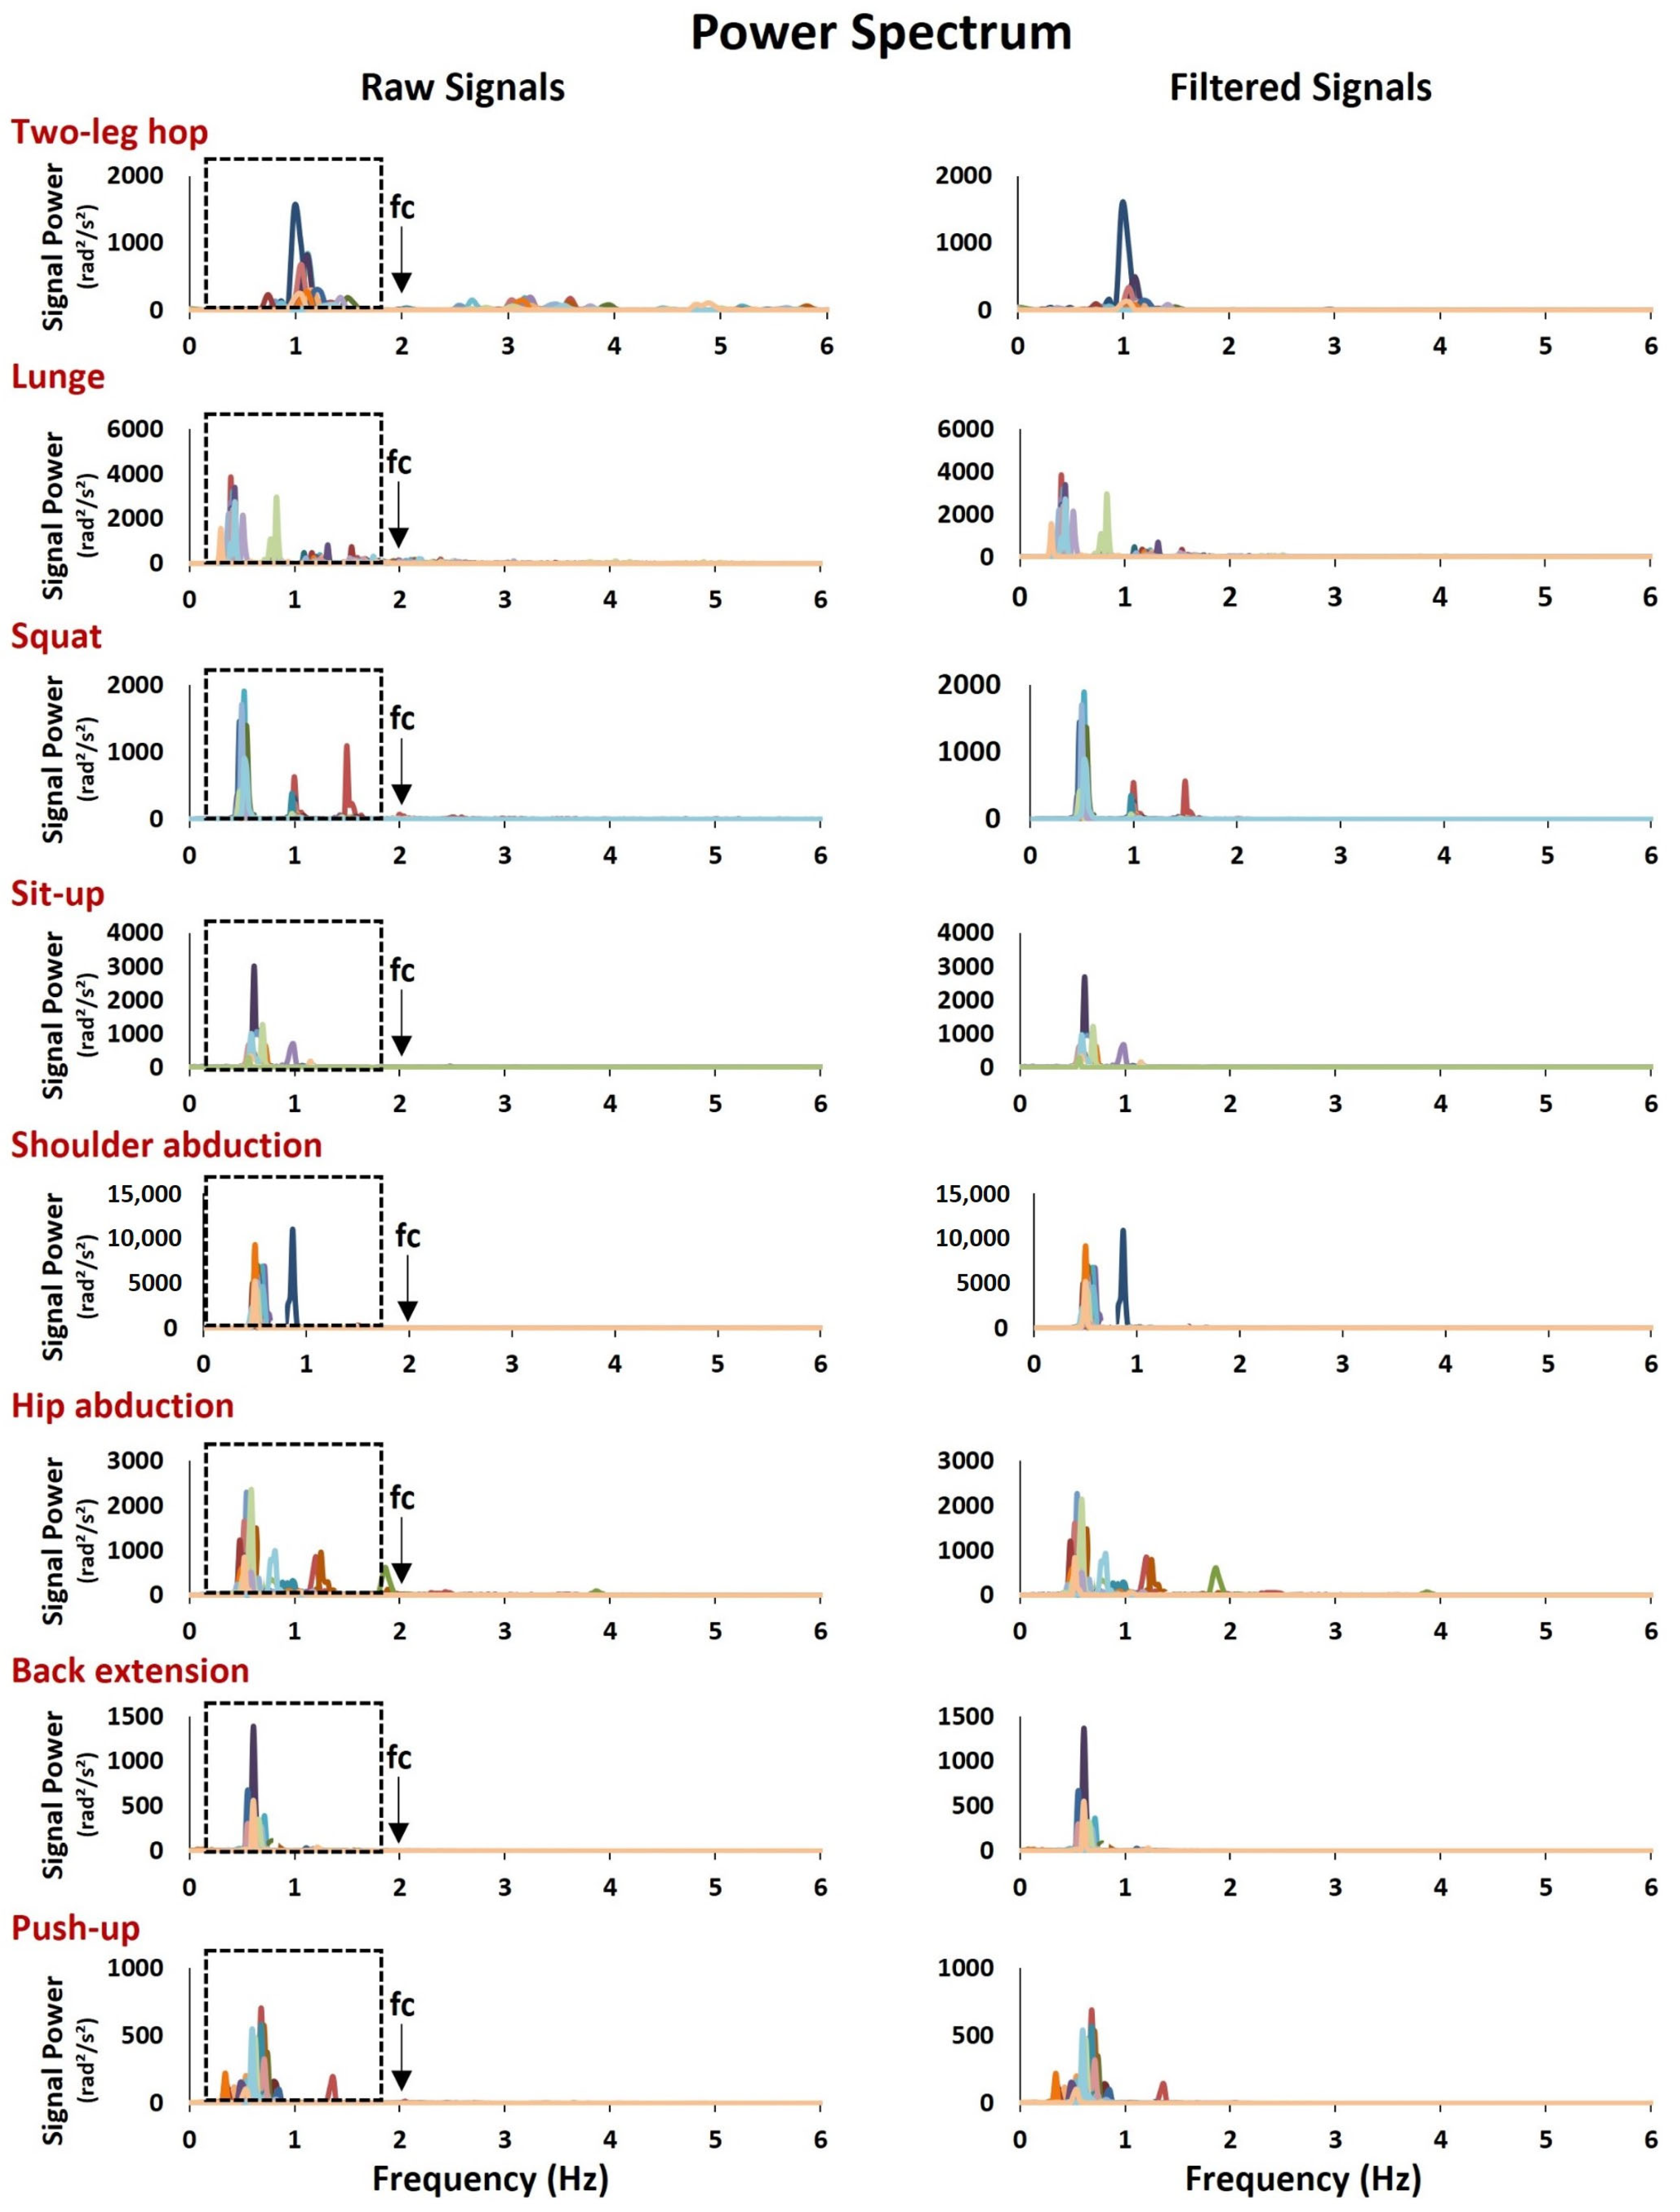
2.2.1. Data Collection and Analysis

Inertial sensors (Xsens MTw Awinda (Movella, Henderson, NV, USA), sampling at 100 Hz, including triaxial accelerometer, gyroscope, and magnetometer) placed on the participant’s body segments were used to record the angular velocity trajectories. The inertial sensors were secured tightly to the body segments with elastic straps. A total of 6 sensors were placed on the participant’s body; however, only 1 sensor was used for each movement evaluation (Appendix AFigure A2). Specifically, for each exercise, the segment associated with the greatest range of motion at the movement’s plane of motion was selected for further analysis as it provided the most representative angular velocity trajectory (Figure 1). These angular velocity trajectories demonstrated a clear periodic waveform (sine wave) consisting of two regions, one of positive and one of negative angular velocity, corresponding to the two basic phases of each motion pattern. Figure 1 illustrates the angular velocity for a representative participant in each movement. The zero-crossing points, the peaks, and the dips indicate critical movement events (initiation, termination, and direction changes). Prior to the extraction of the variables, all the angular velocity trajectories were filtered (4th-order Butterworth low-pass filter; cut-off frequency 2 Hz, MATLAB R2022b, MathWorks, Inc., Natick, MA, USA, https://www.mathworks.com/help/matlab/math/basic-spectral-analysis.htm, accessed on 1 October 2023). The 2 Hz cut-off frequency was chosen after examining the frequency power spectrum of all the signals (Appendix AFigure A3) that indicated the highest signal intensity below 2 Hz in all the exercises and across all the participants.

2.2.2. Temporal Variables

For all the movements, in each one of the trials, the 1st and 20th repetitions were excluded to eliminate the effects of the trial initiation and termination. Thus, 18 repetitions were retained for further analysis (except for the push-up exercise, where 10 repetitions were retained as, in all three trials, the participants completed only 10 repetitions). In all the movements, the whole cycle of movement (cycle) and its two phases (phase1, phase2) (Figure 1) were defined using the zero-crossing points of the angular velocity trajectory (a total of three zero-crossing points were used to define each cycle of movement and its two phases). The cycle duration (tcycle) was defined as the time interval between two consecutive zero-crossing points in the same direction, either positive to negative (forward lunge, shoulder abduction, and hip abduction) or negative to positive (squat, sit-up, back extension, and push-up), depending on the sensor’s orientation) (Appendix AFigure A3). Only for the two-leg hop was tcycle defined as the interval between two consecutive dips (Figure 1). The duration of phase1 was determined as the time interval between the zero-crossing point indicating the initiation of tcycle (1st point) and the consecutive one, where angular velocity transitioned the zero baseline towards the opposite direction (2nd point) (Figure 1). Thus, phase2 was defined as the time interval between the 2nd zero-crossing point and the one indicating the termination of the cycle of movement (3rd point) (Figure 1). In the continuance, in each trial, and for each one of the 18 retained repetitions (10 repetitions for the push-up trials), 5 temporal variables were calculated: the absolute movement durations expressed in seconds (tcycle, tphase1, tphase2) and the relative movement durations expressed as a percentage of tcycle (%phase1, %phase2). The zero-crossing points of the angular velocity signals were detected using the zero-crossing detection MATLAB techniques (https://www.mathworks.com/help/dsp/ref/dsp.zerocrossingdetector-system-object.html#d126e359250, accessed on 1 October 2023), while, for the two-leg hop peaks and dips, the peak detection (https://www.mathworks.com/help/signal/ref/findpeaks.html, accessed on 1 October 2023) MATLAB techniques were used (MATLAB R2022b software, MathWorks, Inc., Natick, MA, USA). For the intra-trial reliability (that is, the agreement of the subsequent repetitions within the same trial), the value of each repetition was inserted into the statistical analysis, for each one of the five defined temporal variables (tcycle, tphase1, tphase2, %tphase1, and %tphase2). For the inter-trial reliability (that is, the agreement between trials), the repetition average (for each subsequent accumulation of the 18 retained repetitions in each trial) was inserted into the statistical analysis, for each one of the five defined temporal variables (tcycle, tphase1, tphase2, %tphase1, and %tphase2).

2.3. Statistical Analysis

The statistical analysis aimed at relative (intraclass correlation coefficient—ICC) as well as absolute (standard error of measurement—SEM, minimal detectable change—MDC, and coefficient of variation—CV) reliability measures [20,21], as described in the continuance. The recommended number of repetitions was determined based on a combination of a high ICC coefficient (≥0.75) [22], an acceptable SEM% value (≤15%) [14,23], an MDC95% above the upper boundary limit of SEM% [14,23], and a CV% below 10% [20,21]. All the statistical analyses were carried out using IBM SPSS Statistics (v. 28.0), with the significance level set at alpha ≤ 0.05. Initially, all the analyses were conducted separately for the male and female groups. However, following the observation of a consistently similar behavior of all the reliability indices in both genders, the results were presented with the men and women combined into a single group.

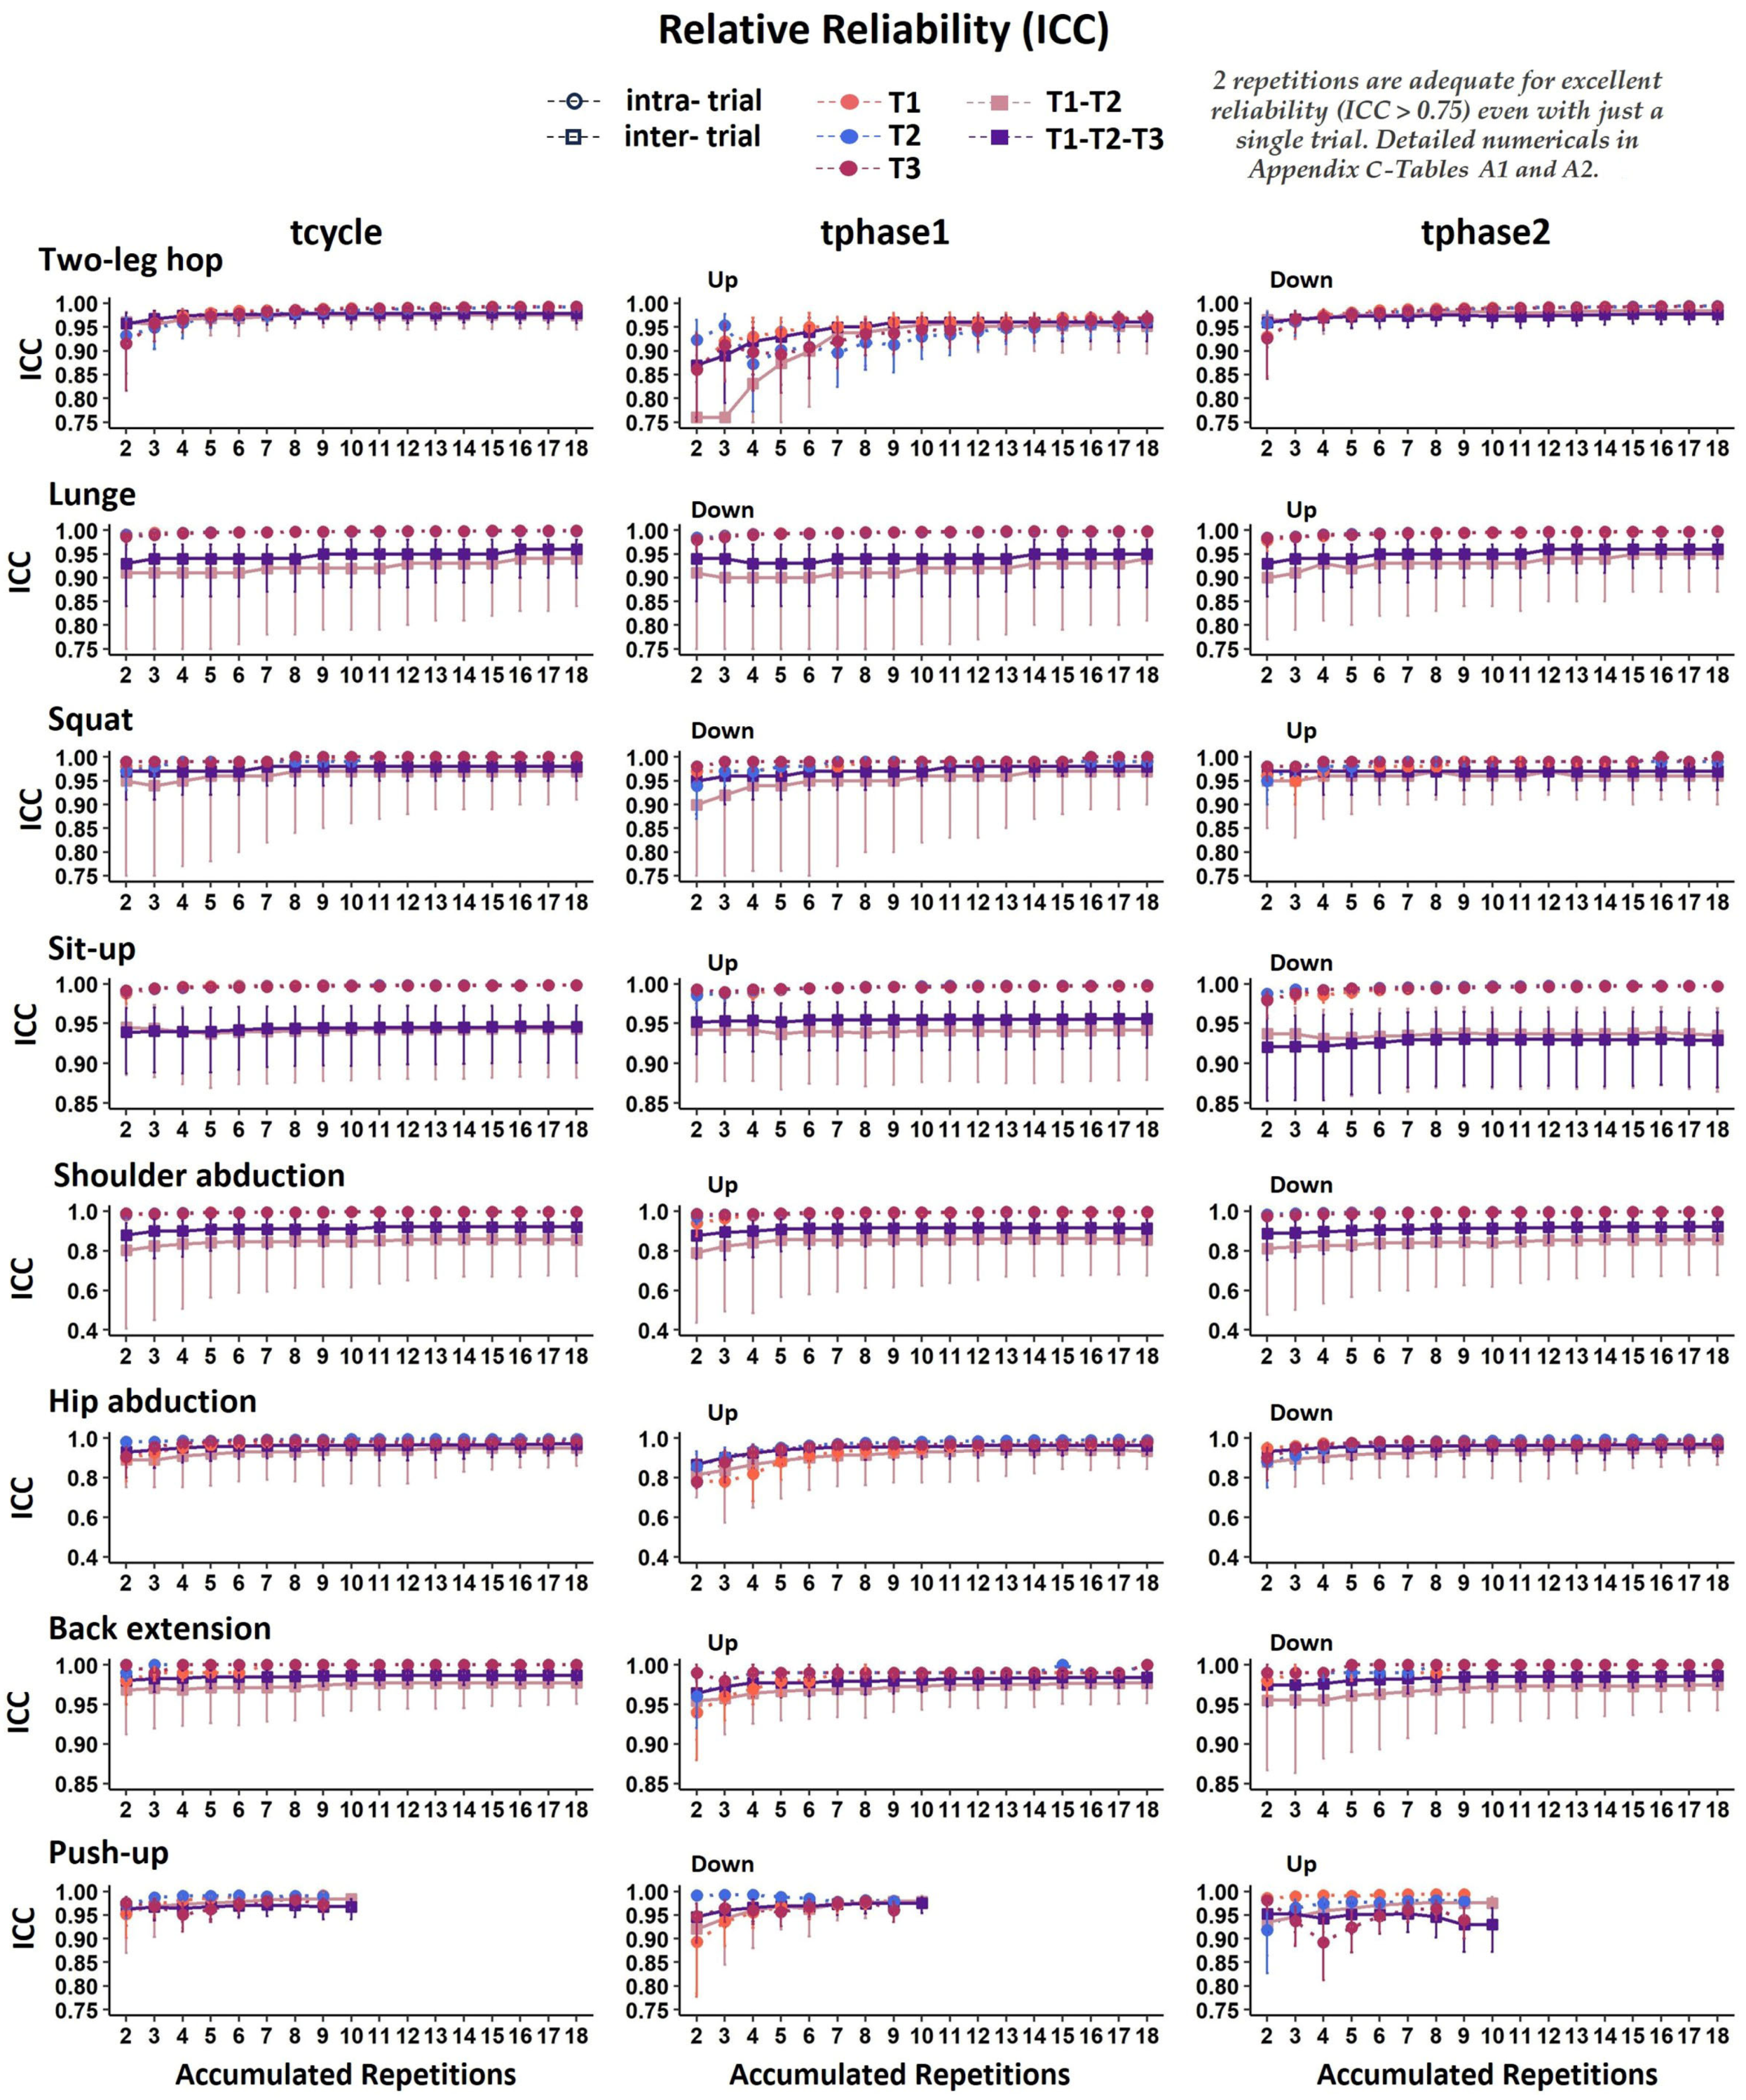
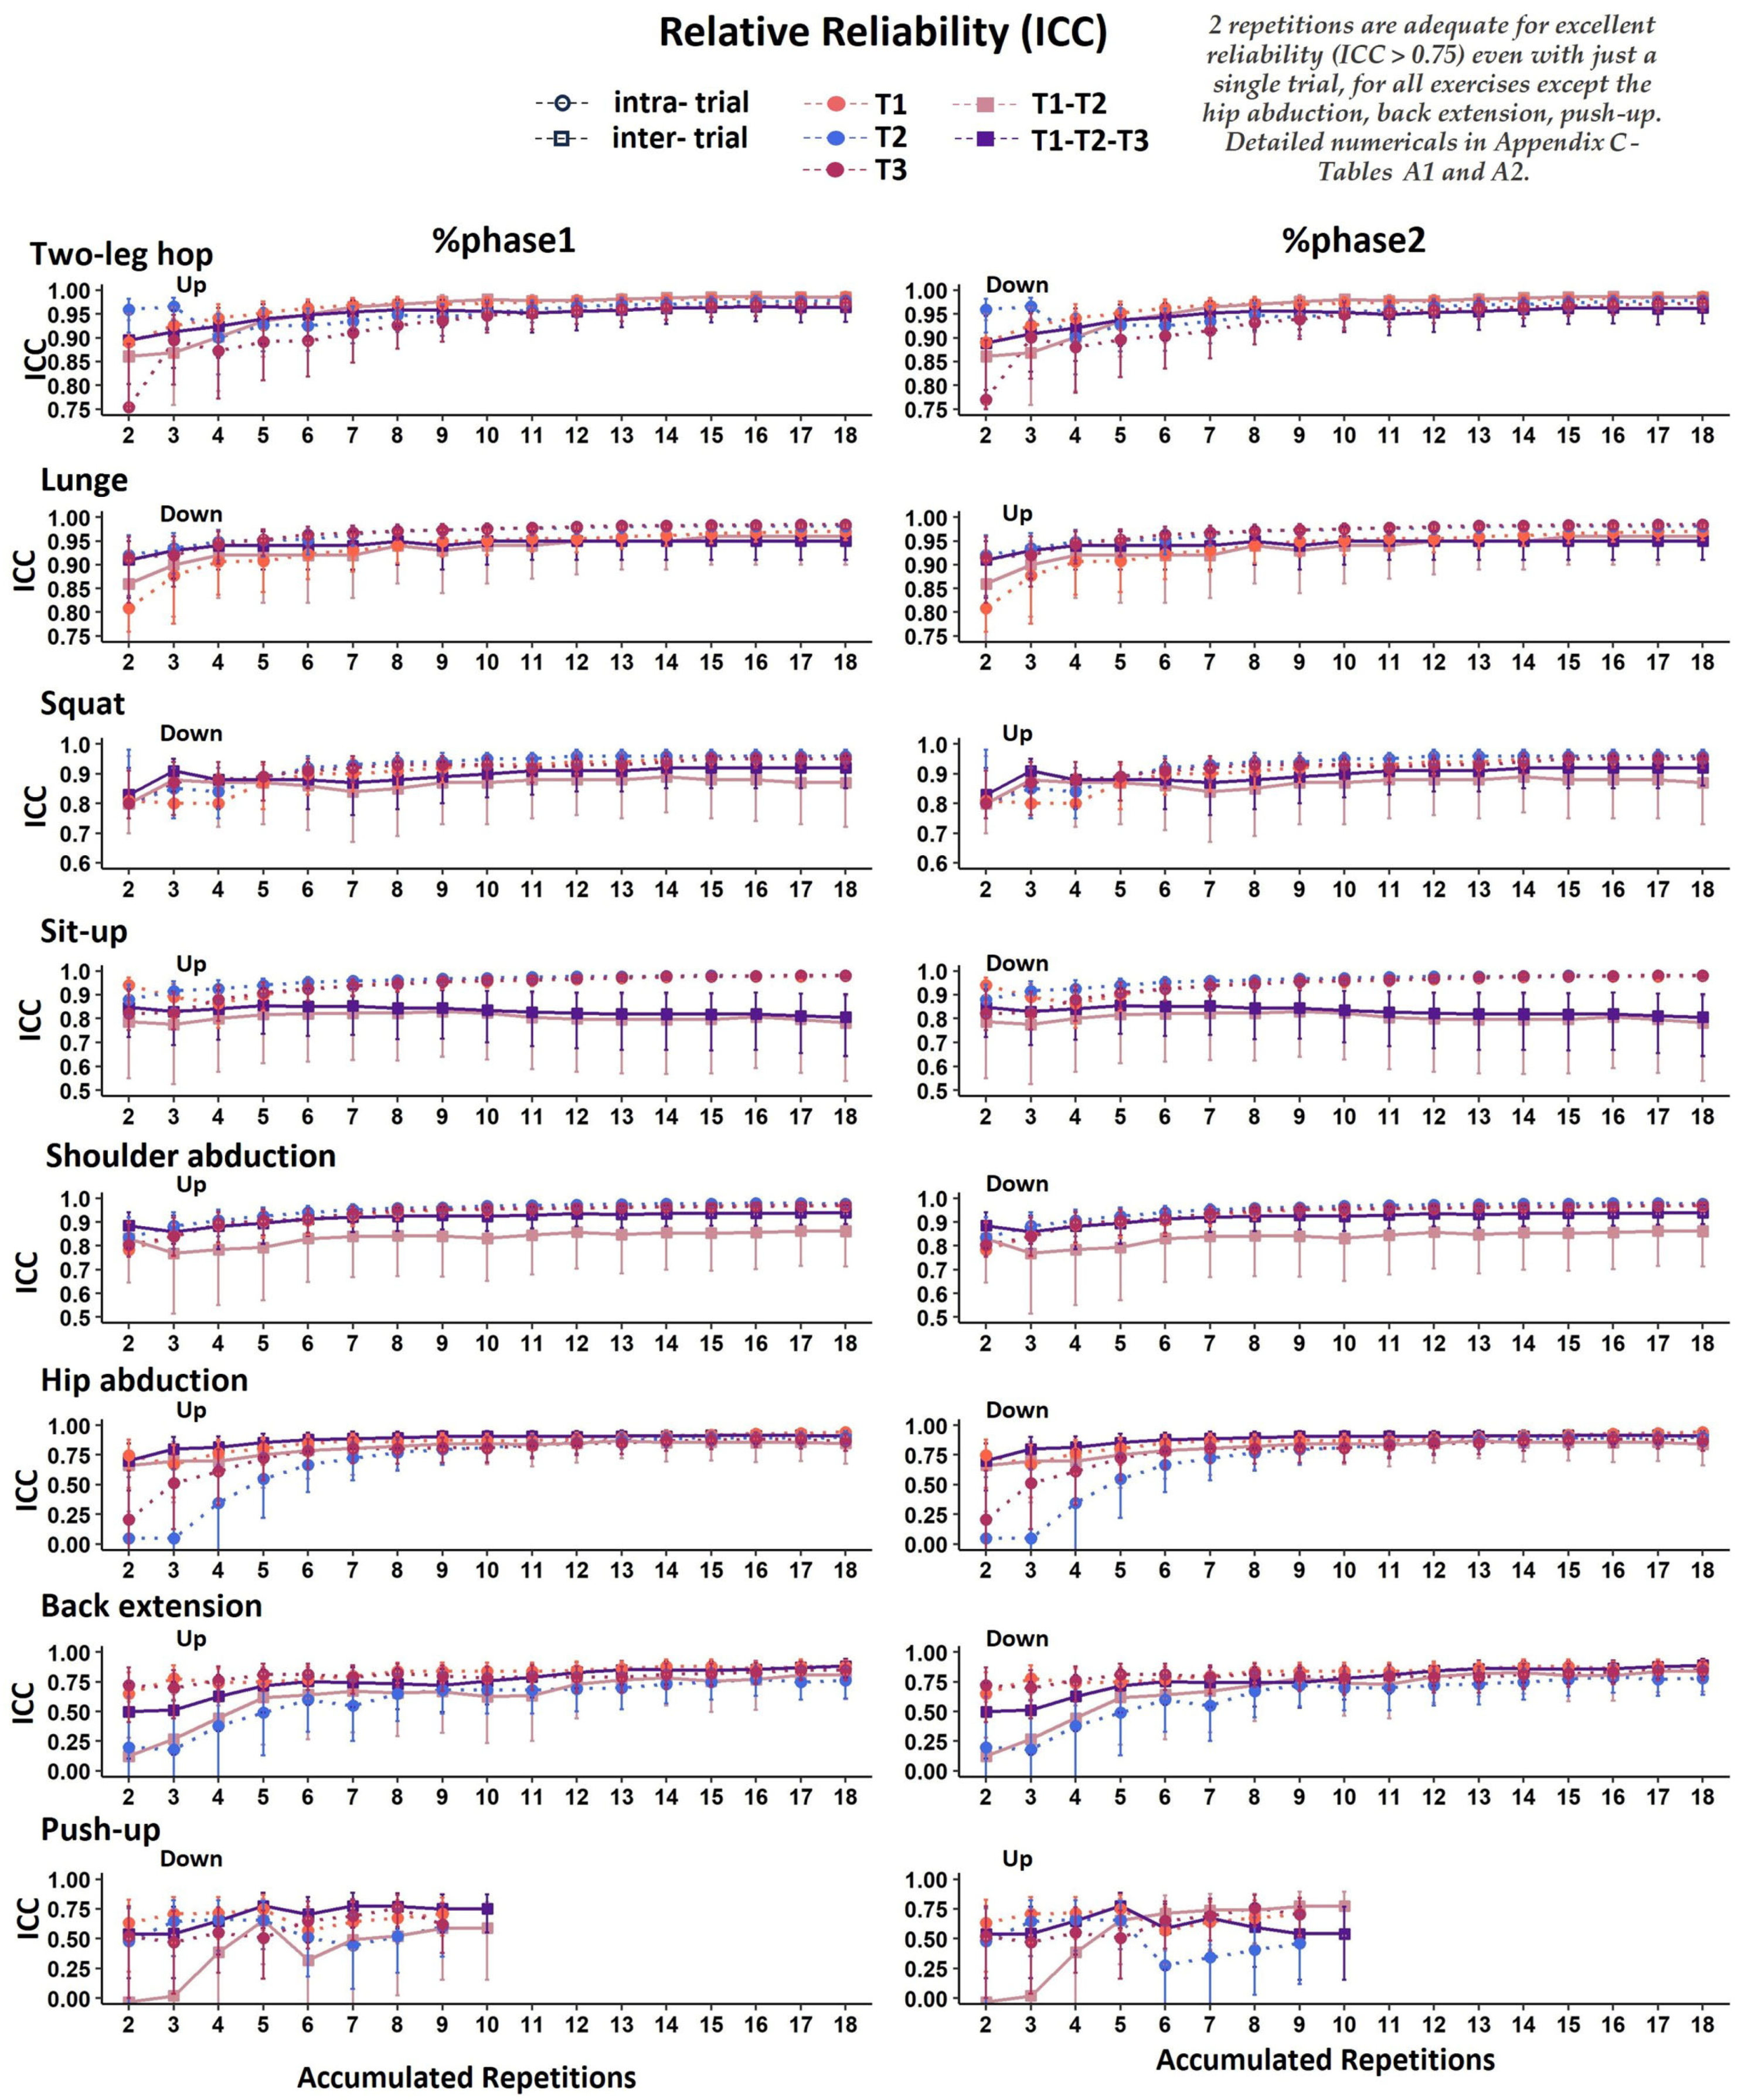
2.3.1. Relative Reliability

Relative reliability was evaluated using the ICC with a 95% confidence interval (95% CI). Relative reliability refers to the magnitude of the association of the repeated measurements, which is derived by quantifying the correlation among them. It forms the ratio of total variability (between subjects) and individual variability (within subjects), which produces the ICC [20,21]. Various forms of ICC exist [24], but as this study focused on assessing the agreement of the average measures across repetitions and trials in a random sample of individuals, the two-way random effects, absolute agreement, and average measures models were deemed the most appropriate. The interpretation of ICC was by Fleiss [22] (ICC ≥ 0.75: excellent; ICC between 0.40 and 0.75: moderate to good; ICC < 0.40: poor).

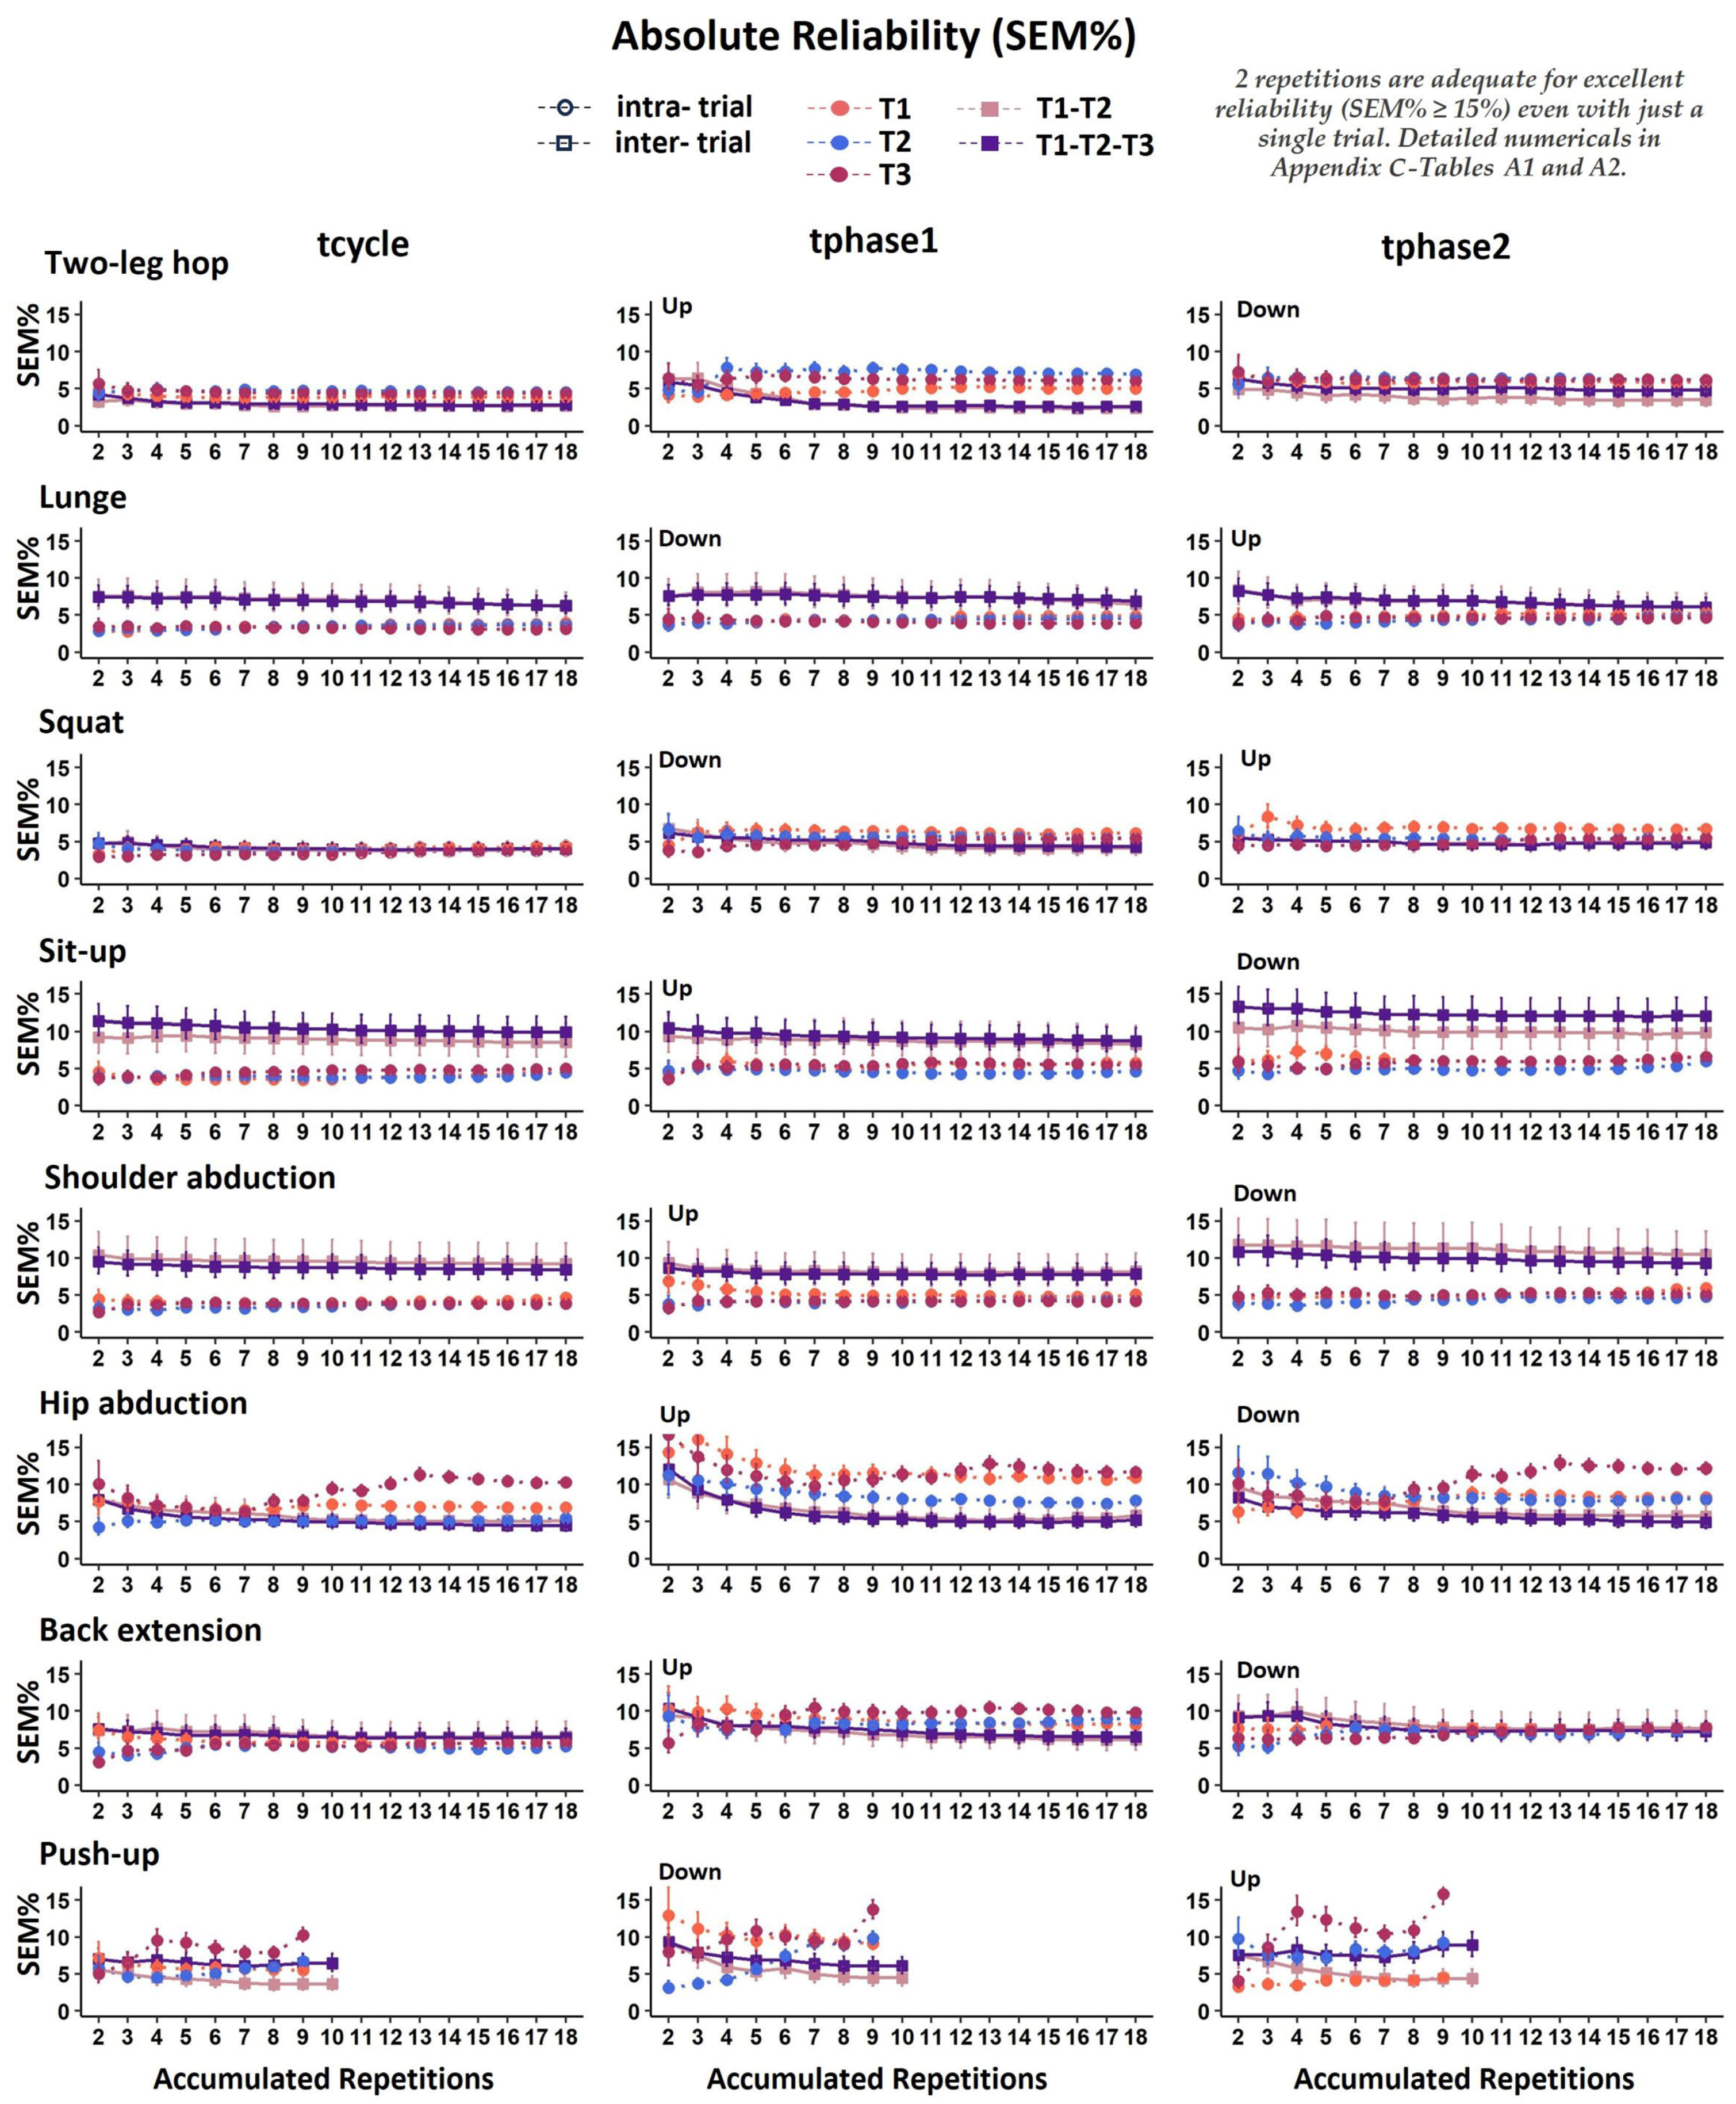
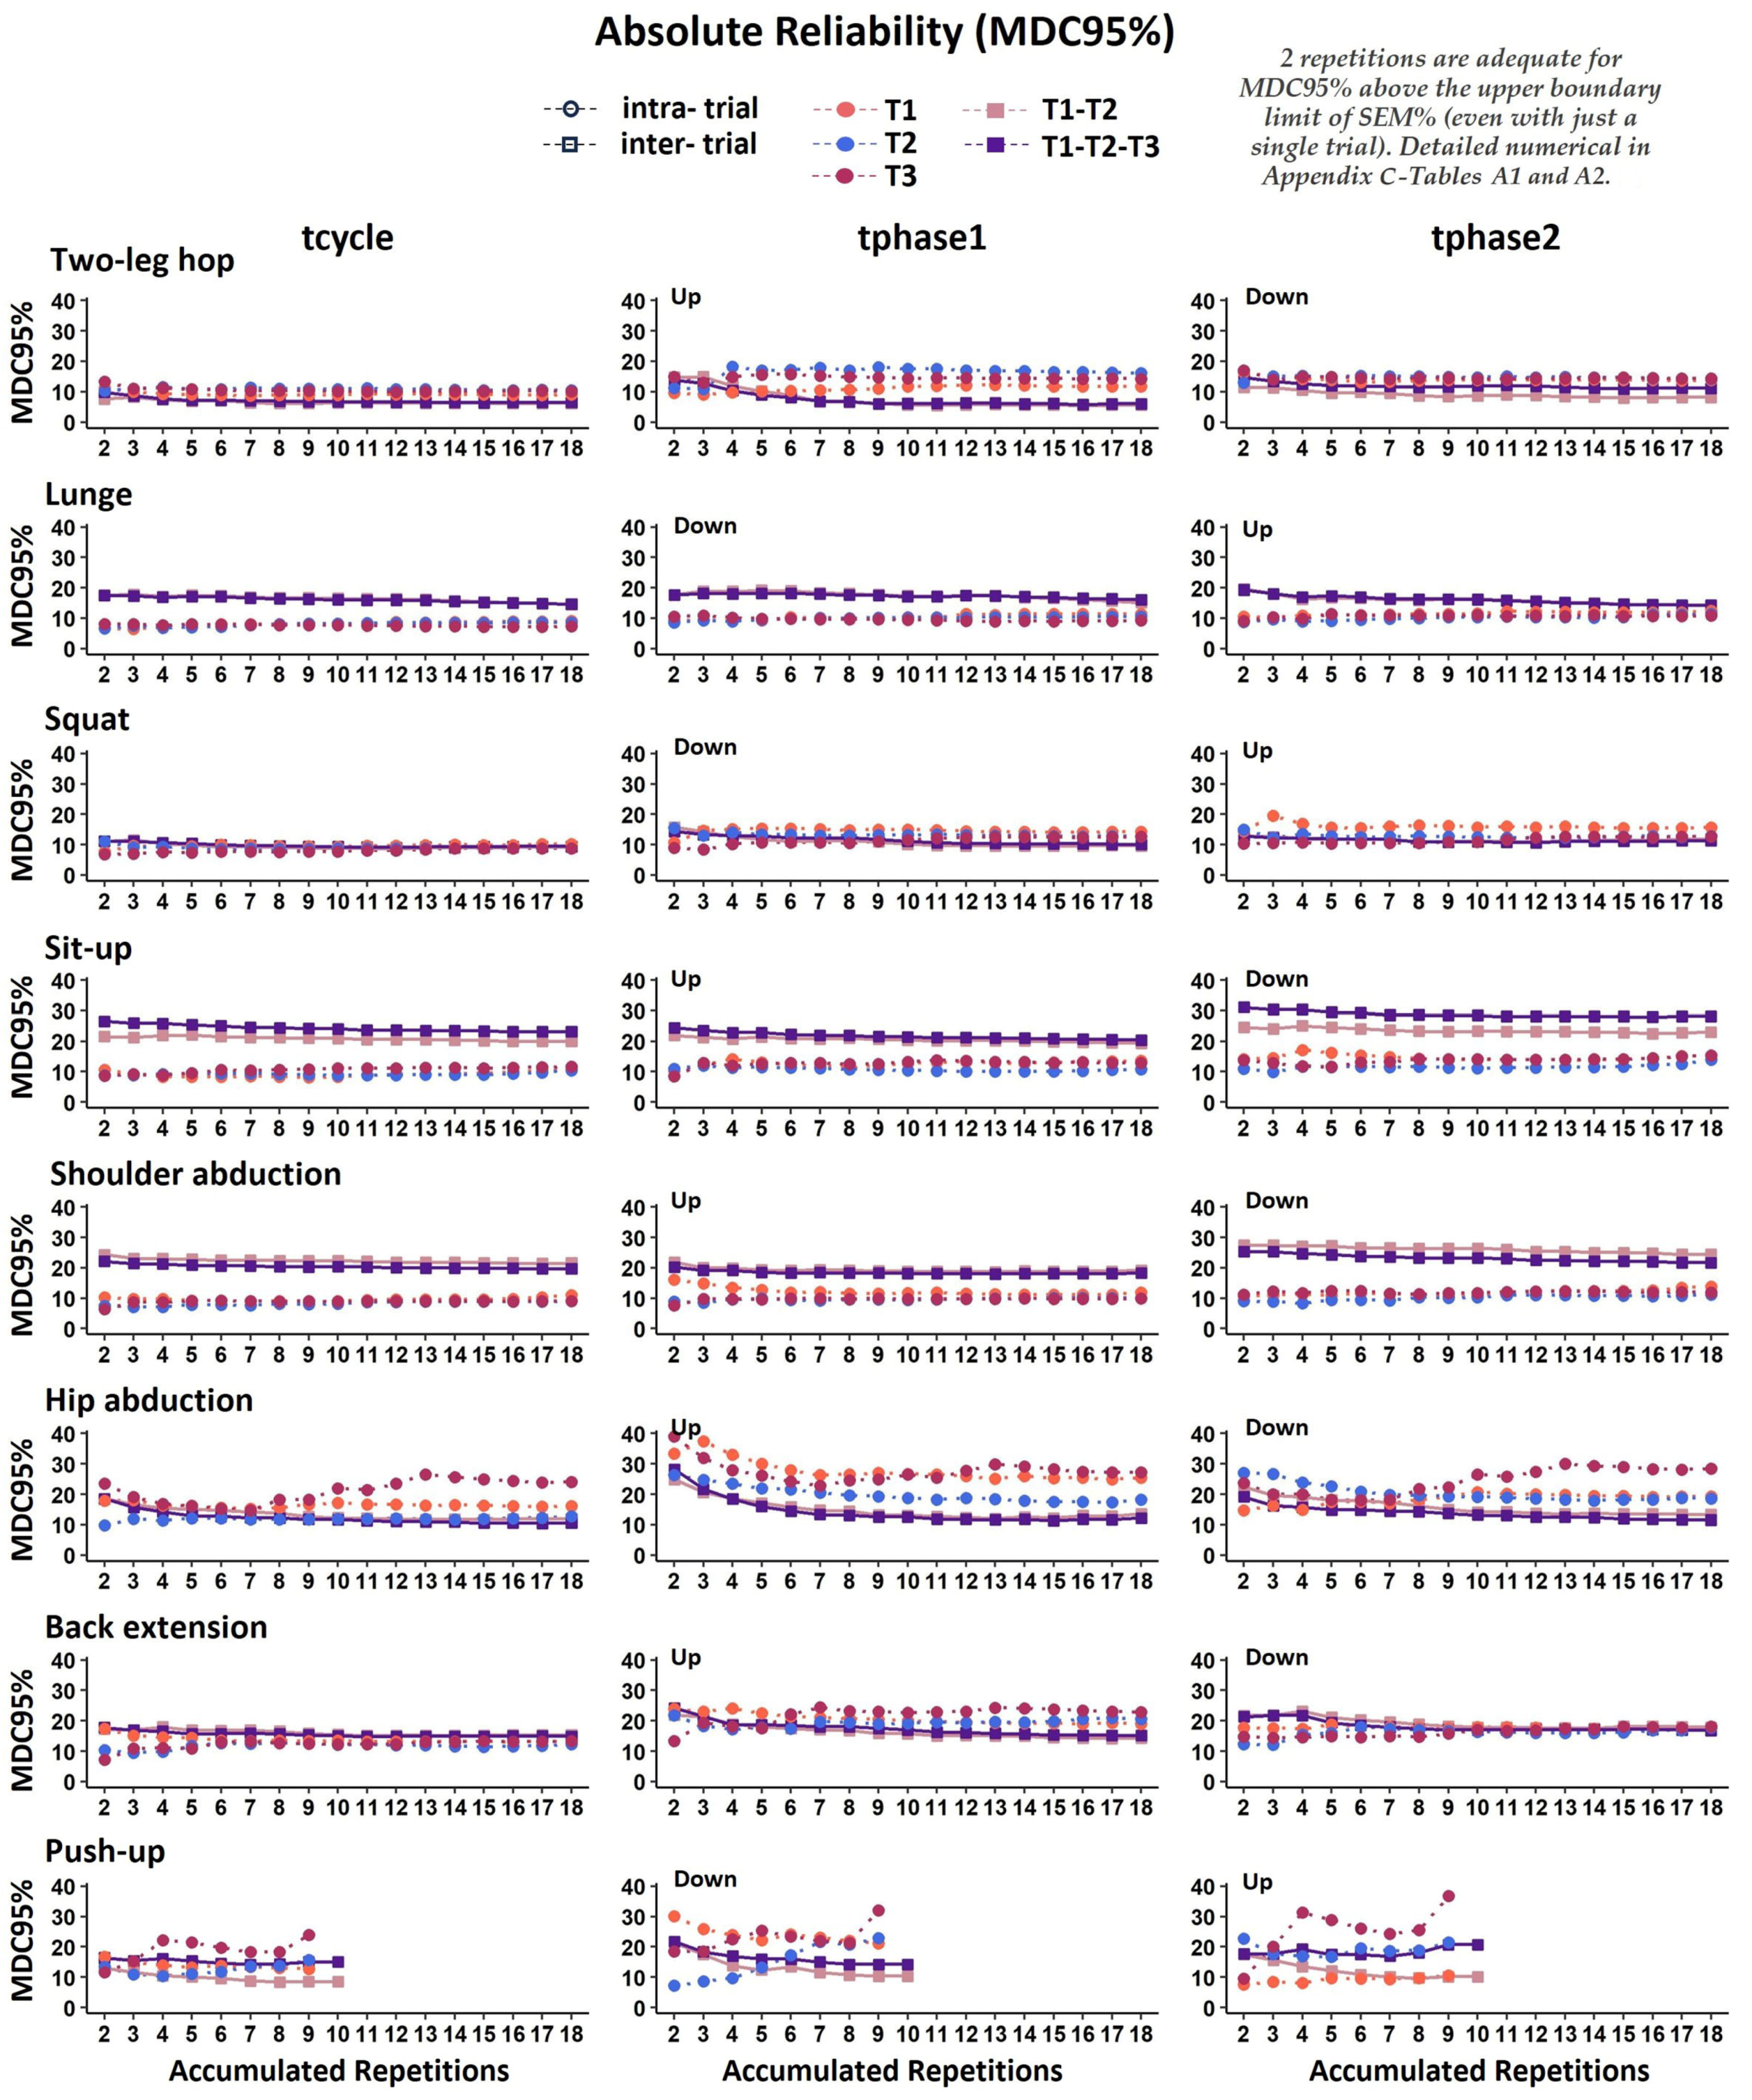
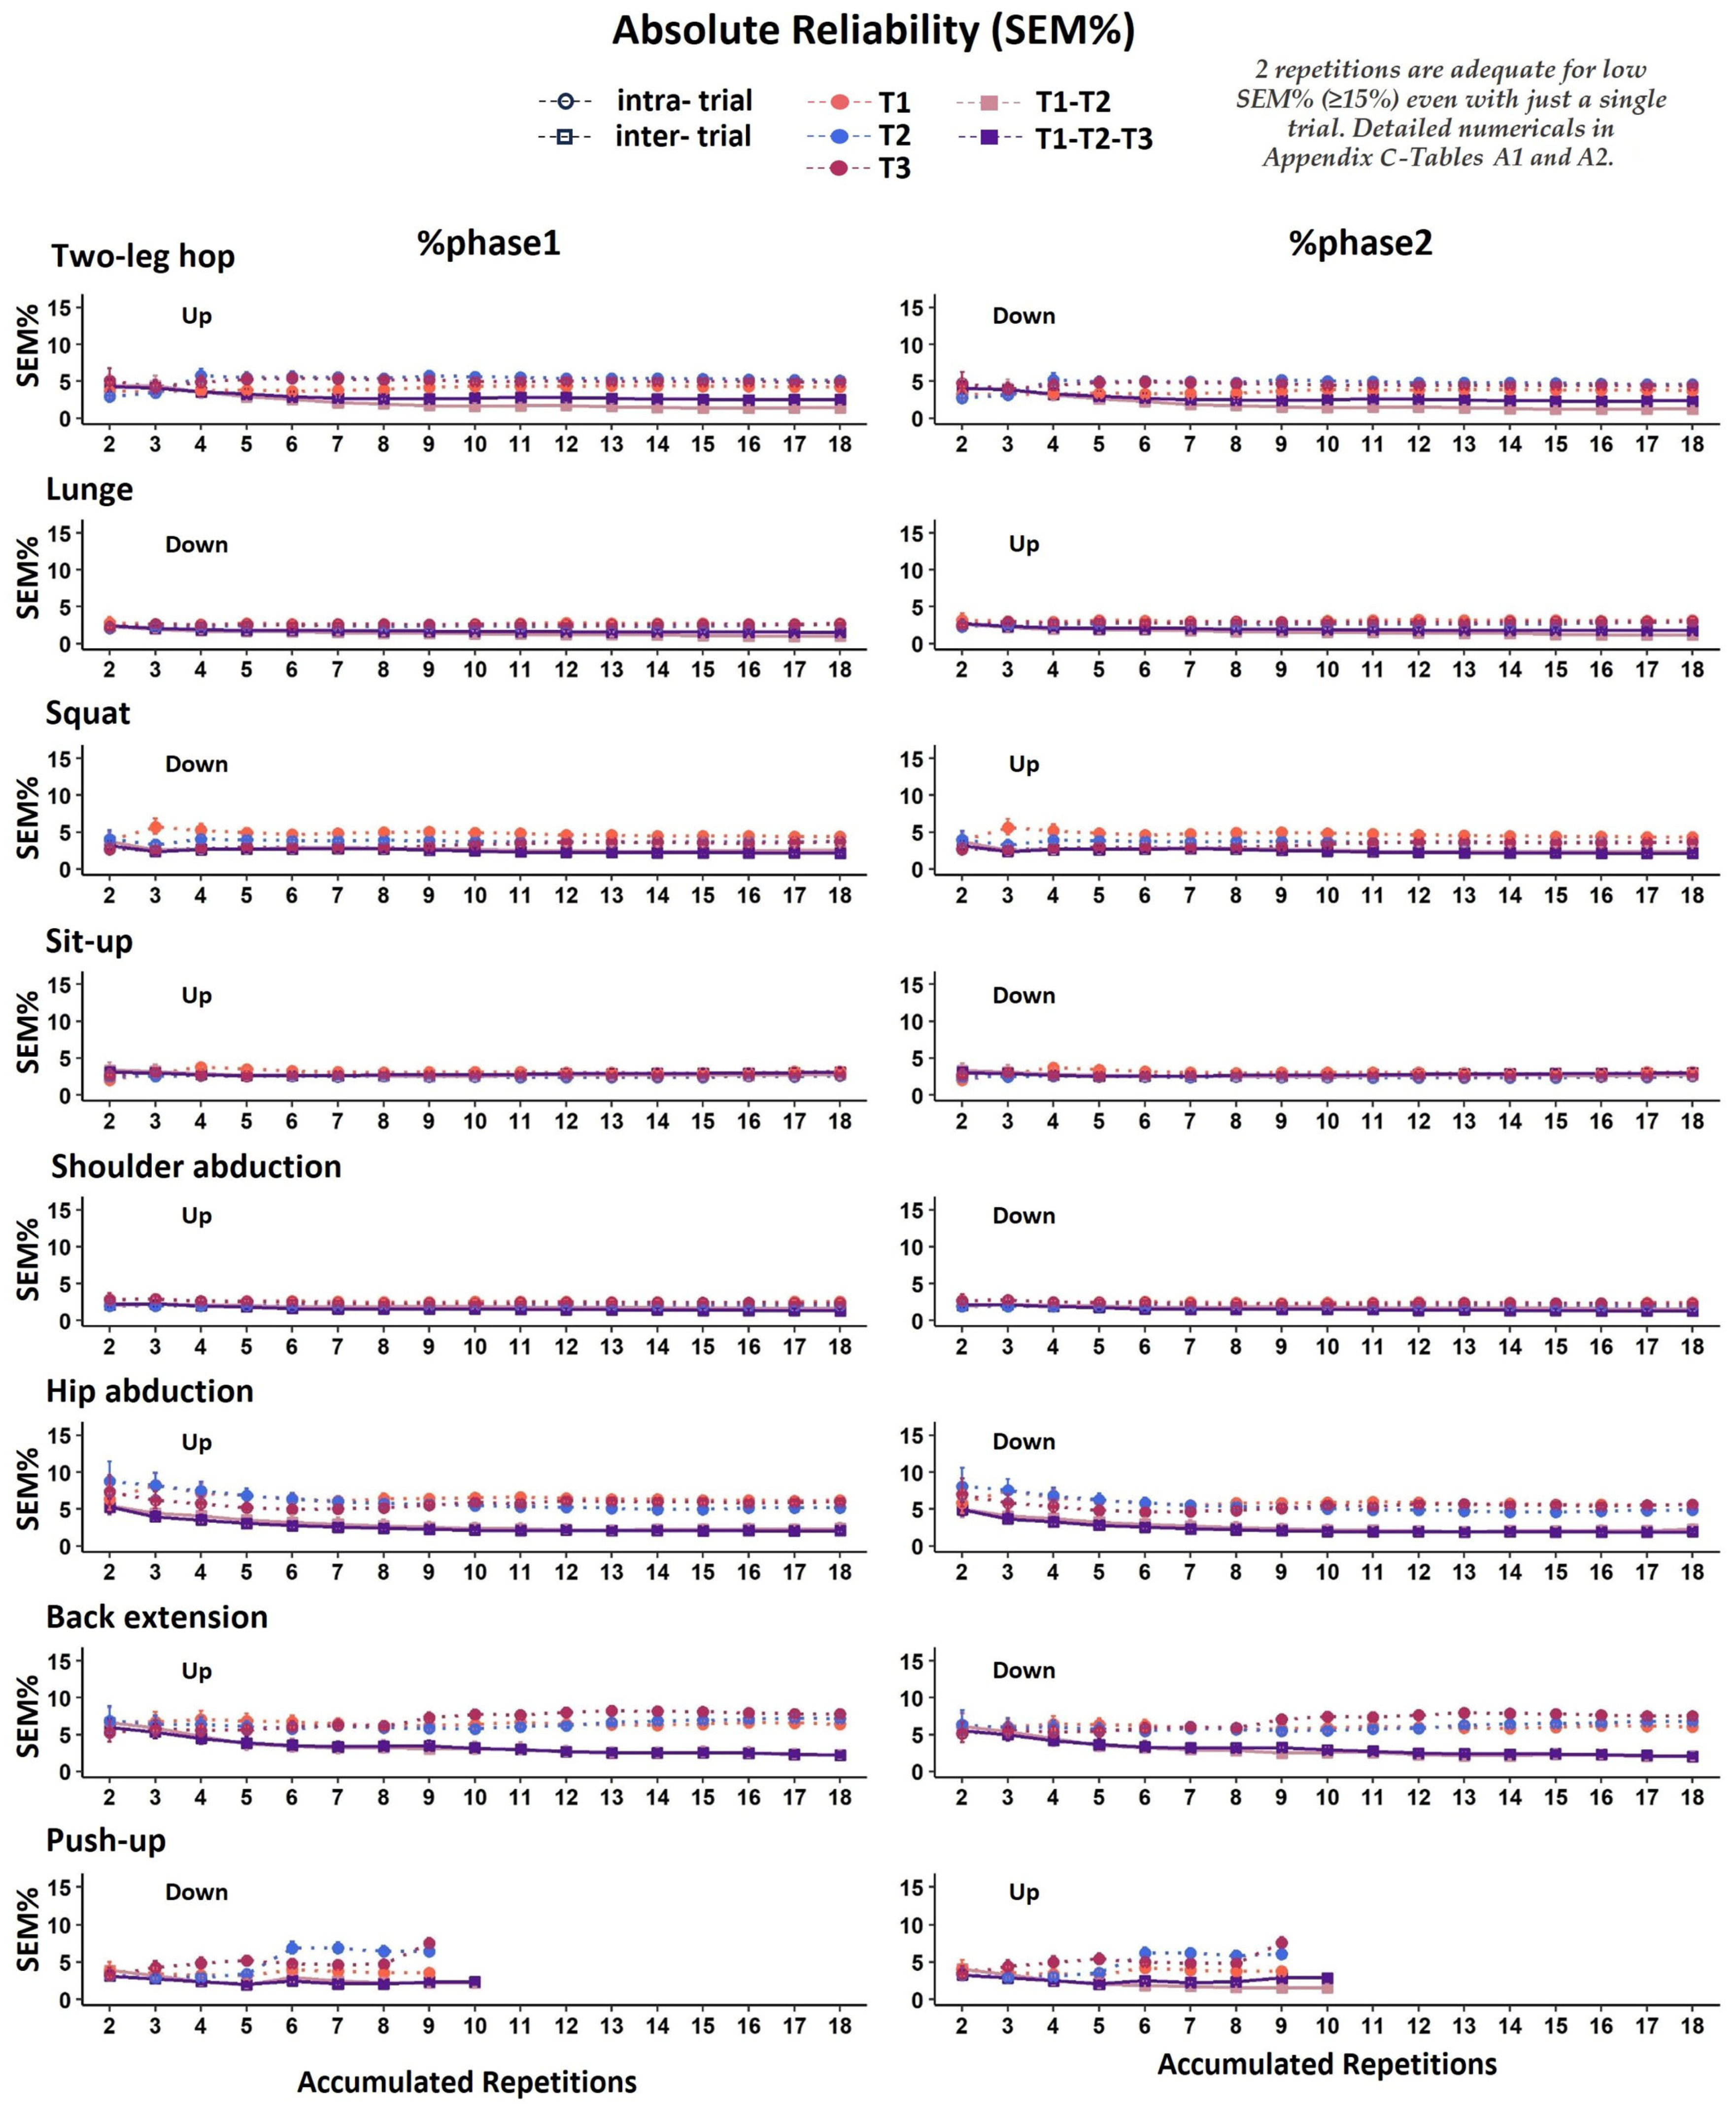
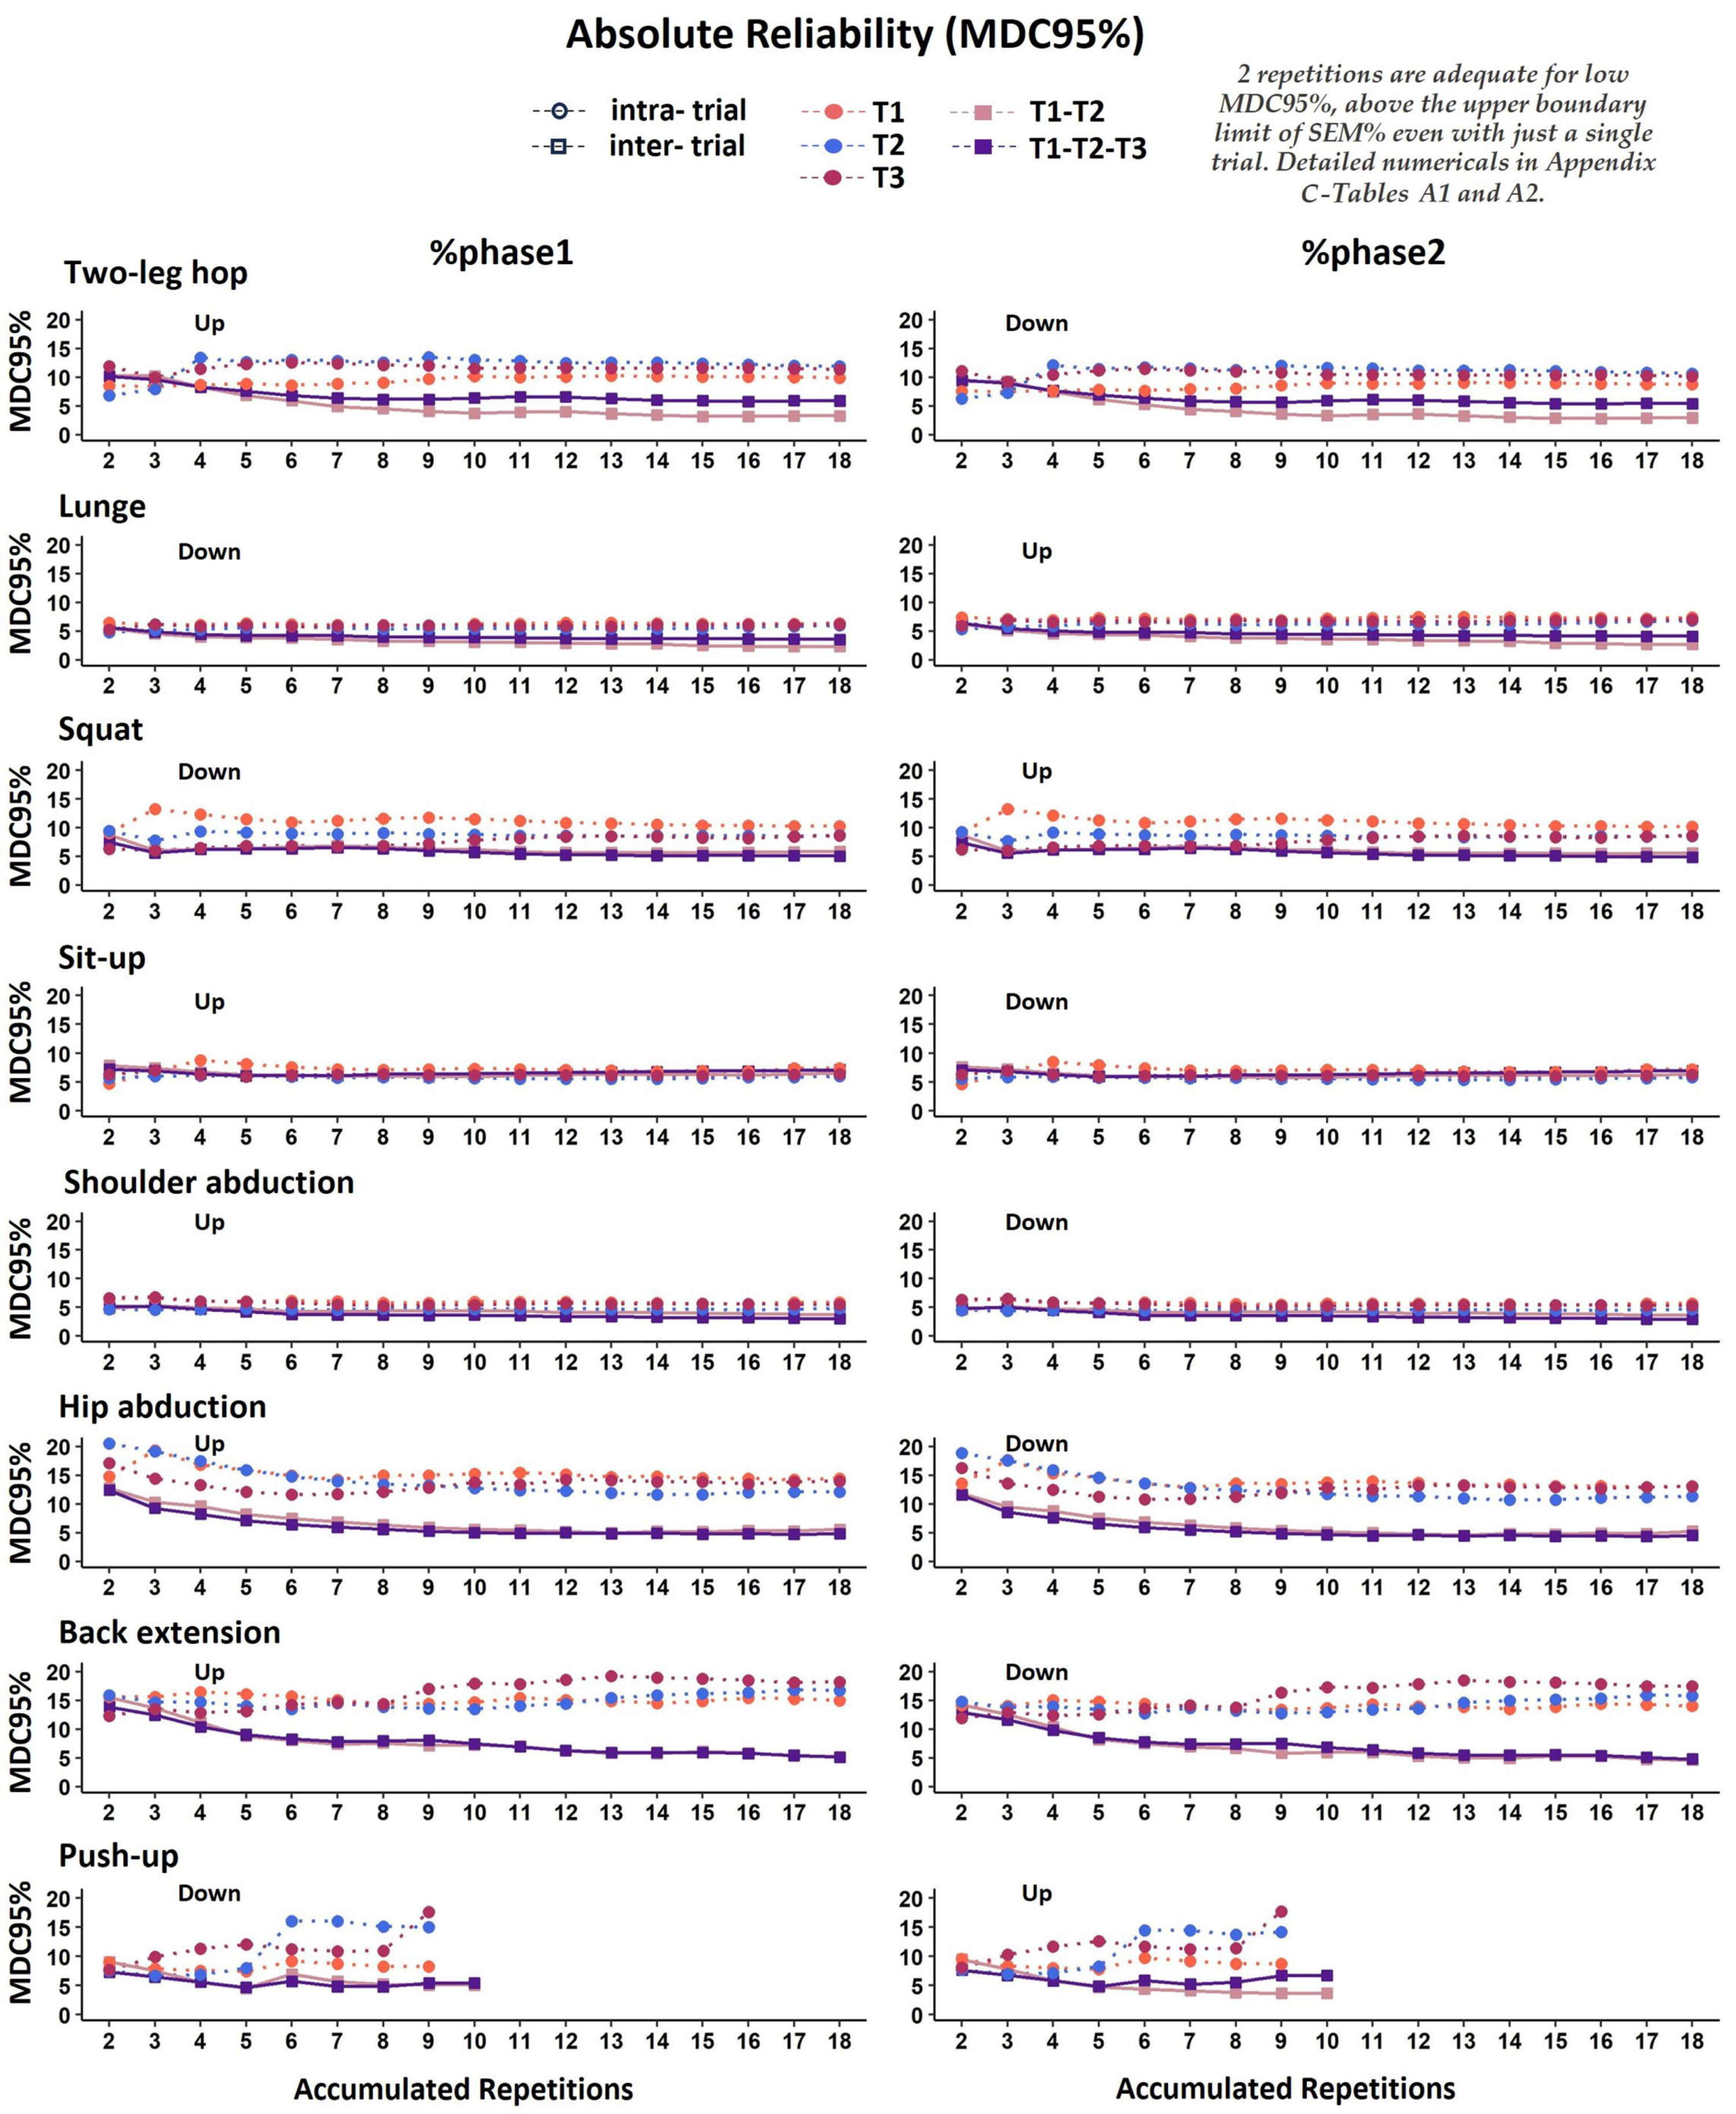
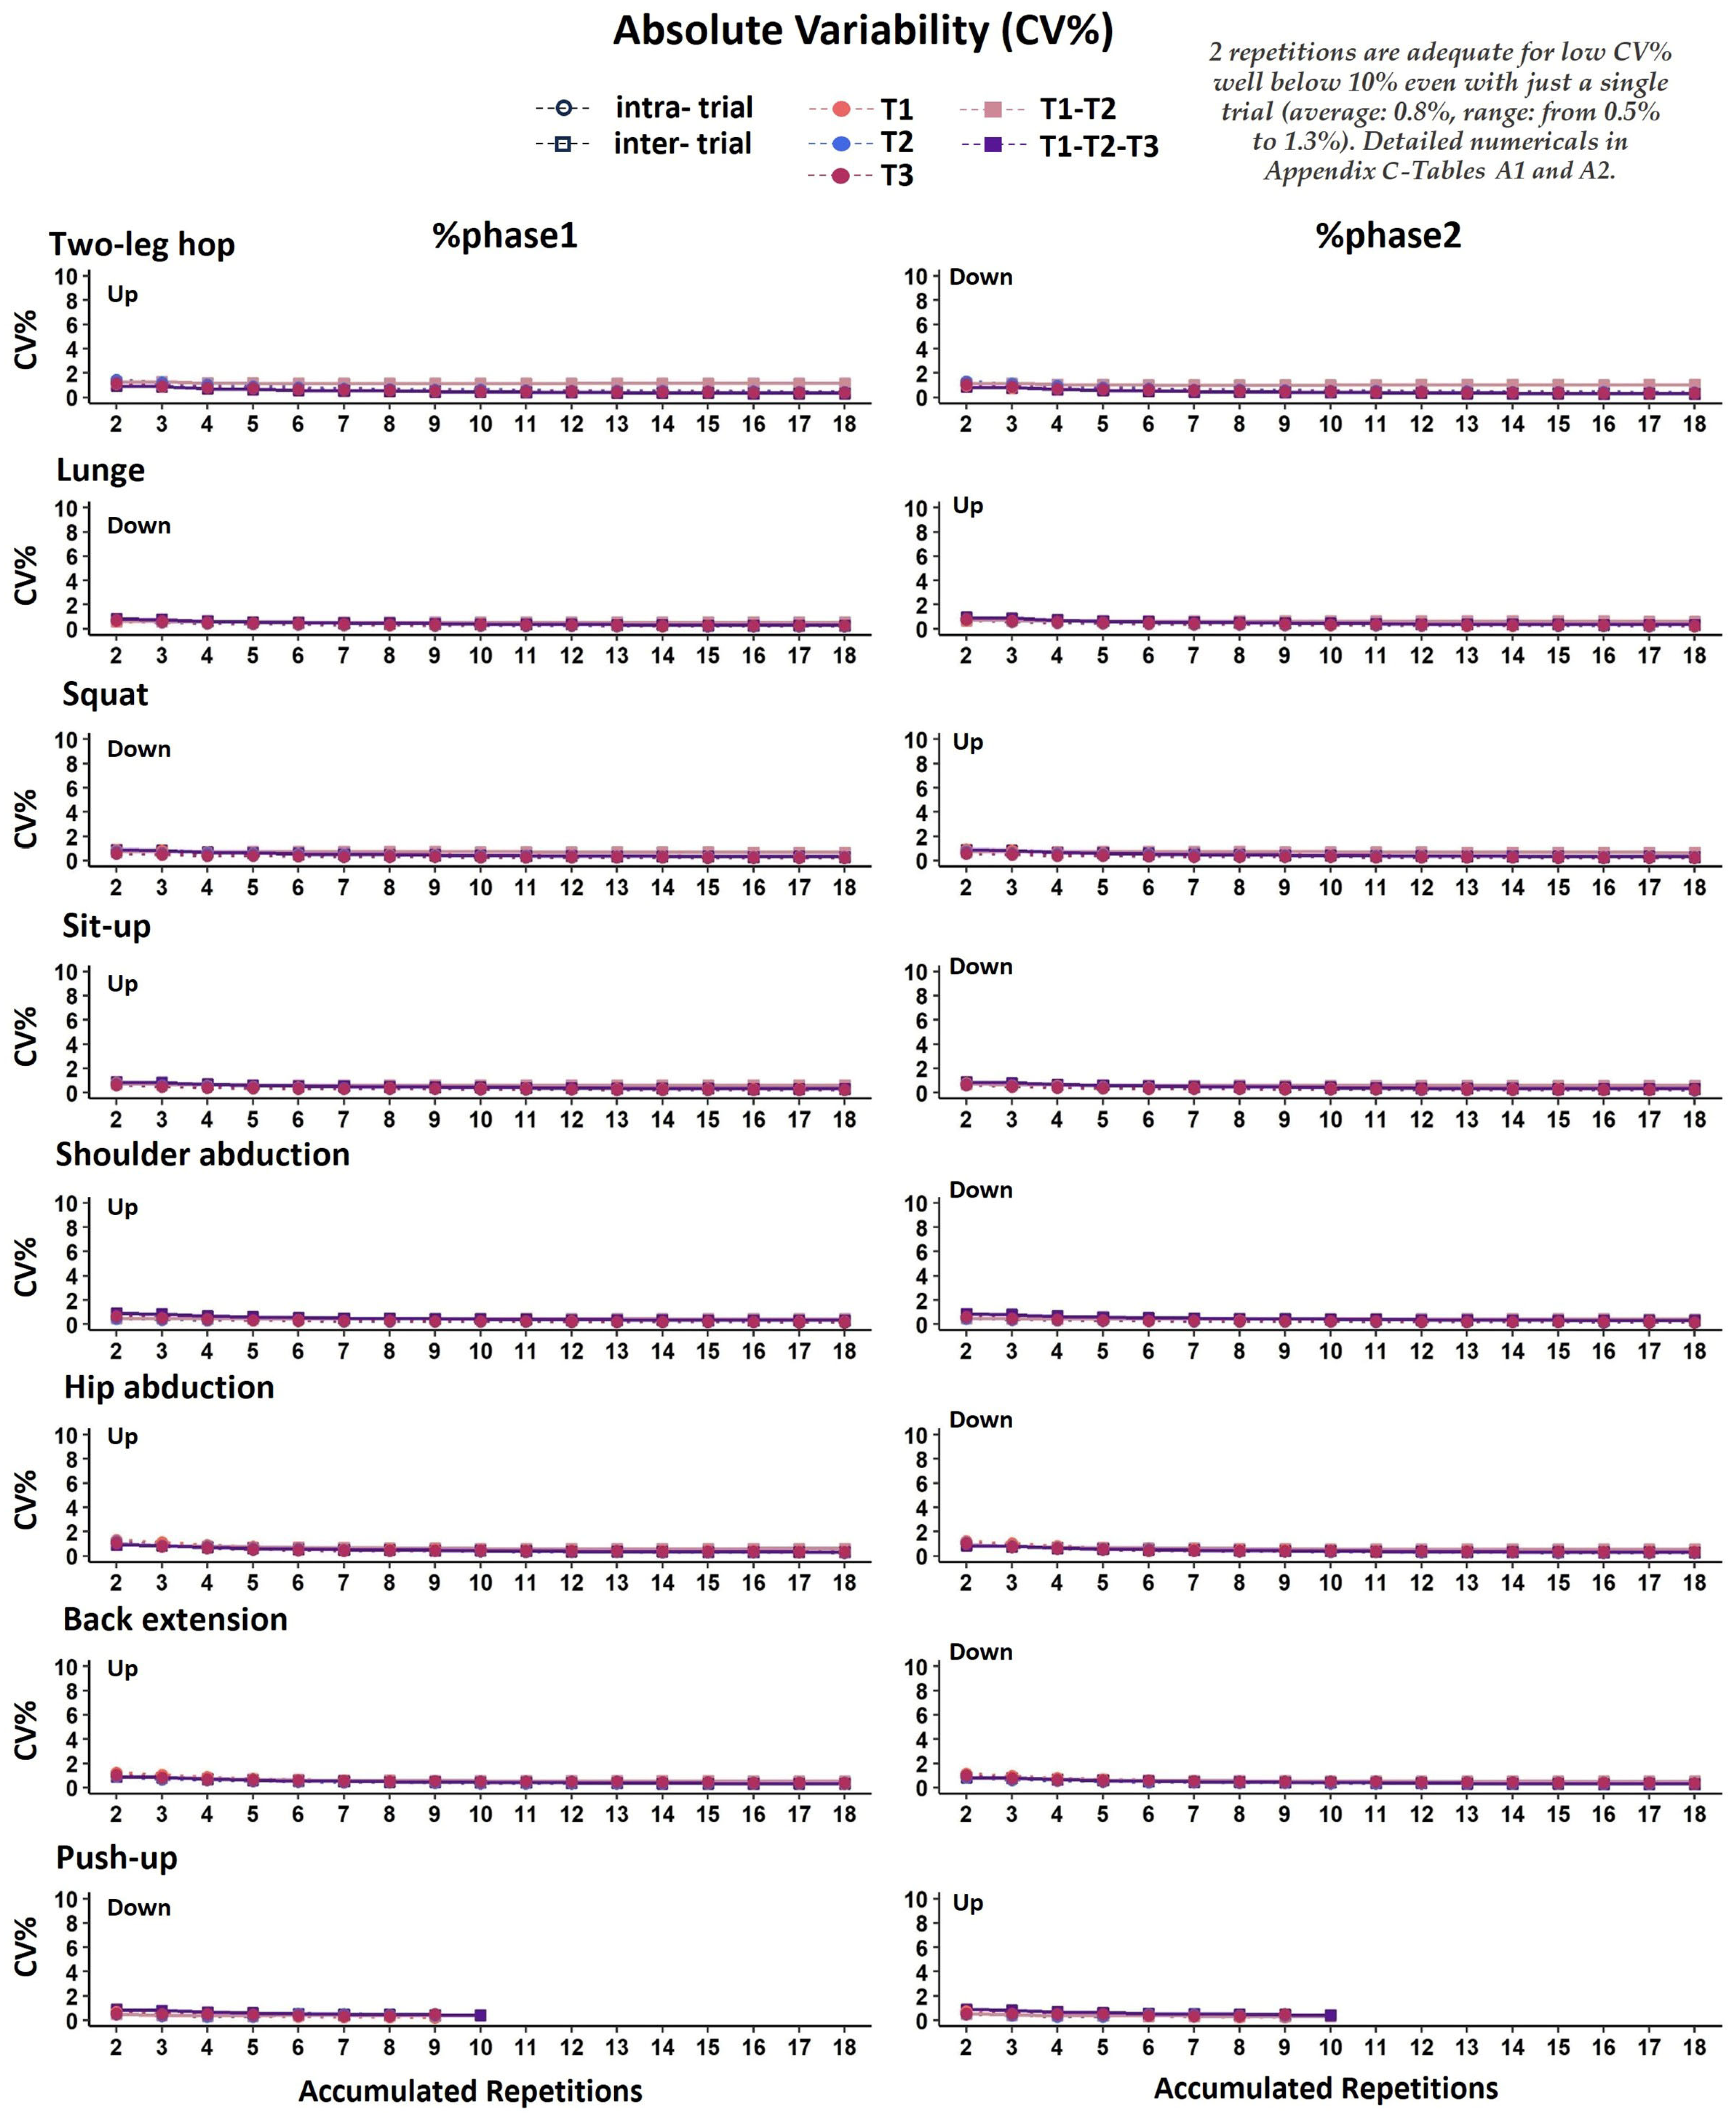
2.3.2. Absolute Reliability

Absolute reliability refers to the within-subject variability, and it is not sample-dependent because the range of individual scores is not accounted for [20,21].
SEM%. To avoid the influence of the same factors also influencing the ICC (e.g., the model and the variability of scores) [20,21], the SEM was calculated from the square root of the mean square error term (Serror) in ANOVA. For the SEM to be independent of the units of measurement [25], it was expressed as a percentage (SEM%), according to Equation (1), where S E M = S 2 error and x ¯ is the mean for all the observations.
S E M % = S E M x ¯ × 100
The SEM% values were categorized as low (≤10%), acceptable (between 10% and 15%), or high (>15%) and corresponded to the interpretations of absolute reliability as good, acceptable, or poor, respectively.
MDC95%. The statistical index of MDC95% denotes the smallest change that can be 95% confidently attributed to a real change beyond random measurement error [15,23]. An MDC95% value above the upper boundary limit of the SEM% suggests that the changes or differences in the measured parameter are greater than what could be attributed to random measurement error. The MDC95% was estimated using the SEM, and to make it independent of the units of measurement, it was calculated using Equation (2), where x ¯ is the mean value of all observations and M D C = S E M ( 1.96   ×   2 ) .
M D C 95 % = M D C / x ¯ × 100
CV%. The coefficient of variation (CV) is an estimate of the amount of variation in the data that is attributed to differences between the participants, reflecting how much each individual’s data points deviate from the overall grand mean [20,21]. In the context of reliability analysis, understanding this between-subject variability helps assess the consistency of measurements within individuals compared to the overall variability across different subjects [20,21]. For a unitless estimate, CV was expressed as a percentage (CV%) using Equation (3), which defines the “between-subject” or “inter-individual” variability [20,21], where SD is the total standard deviation and x ¯ is the total mean (total refers to all the individual data points across the conditions),
C V % = S D x ¯ ×   100 ,   where   C V = S D x ¯
Two estimates of CV were used in the study, the single trial CV and the average trial CV. In the estimation of the single trial CV%, total refers to the subsequent number of repetitions used in each step of the analysis, for the particular trial. In the estimation of the average trial CV%, total refers to the number of trials used in each step of the analysis, for the specific number of repetitions concerning each subsequent accumulation of the 18 repetitions.

3. Results

Overall, for the eight physical fitness exercises, the reliability indices (relative and absolute) indicate that a minimum of two repetitions is adequate for achieving excellent temporal reliability, either within the same single trial (intra-trial) or among multiple trials (inter-trial). The adequacy of just two repetitions to provide excellent temporal reliability concerns both the movement measures expressed in seconds (tcycle, tphase1, tphase2) and those expressed as a percentage of tcycle (%tphase1 and %tphase). Isolated exceptions concerning the ICC limits for excellent relative reliability are noted for the phases of movement only when these are expressed as a percentage of tcycle and only for three out of the eight physical fitness exercises examined in the study. The results for each specific reliability index (ICC, SEM%, MDC95%, and CV%) are presented in the continuance and are accompanied by additional tables (see Appendix C) and figures (see Appendix B).

3.1. Relative Temporal Reliability

ICC. Figure 2 presents the intra- and inter-trial relative reliability with the ICC (95% CI) values concerning the movement durations expressed in seconds (tcycle, tphase1, and tphase2). Overall, across all the exercises, the results highlight two repetitions as adequate for excellent intra- and inter-trial temporal reliability (ICC > 0.75, p < 0.001), with ICCs ranging from 0.78 to 1.00 for the intra-trial reliability (ICC = 0.98 averaged across all eight exercises and all repetition accumulations) and from 0.76 to 0.99 (ICC = 0.94, averaged across all eight exercises and all repetition accumulations) for the inter-trial reliability. Detailed ICC numerical statistics for tcycle, tphase1, and tphase2 are provided in Appendix CTable A1 on the intra-trial reliability and in Appendix CTable A2 on the inter-trial reliability.
As with tphase1 and tphase2, %tphase1 and %tphase2 also revealed that two repetitions were adequate for excellent intra- and inter-trial relative reliability (ICC > 0.75, p < 0.001), except for the hip abduction, the back extension and the push-up exercises, where more repetitions were required to reach an ICC of excellent intra-trial (Appendix BFigure A4, Appendix CTable A1) as well as inter-trial (Appendix BFigure A4, Appendix CTable A2) reliability.

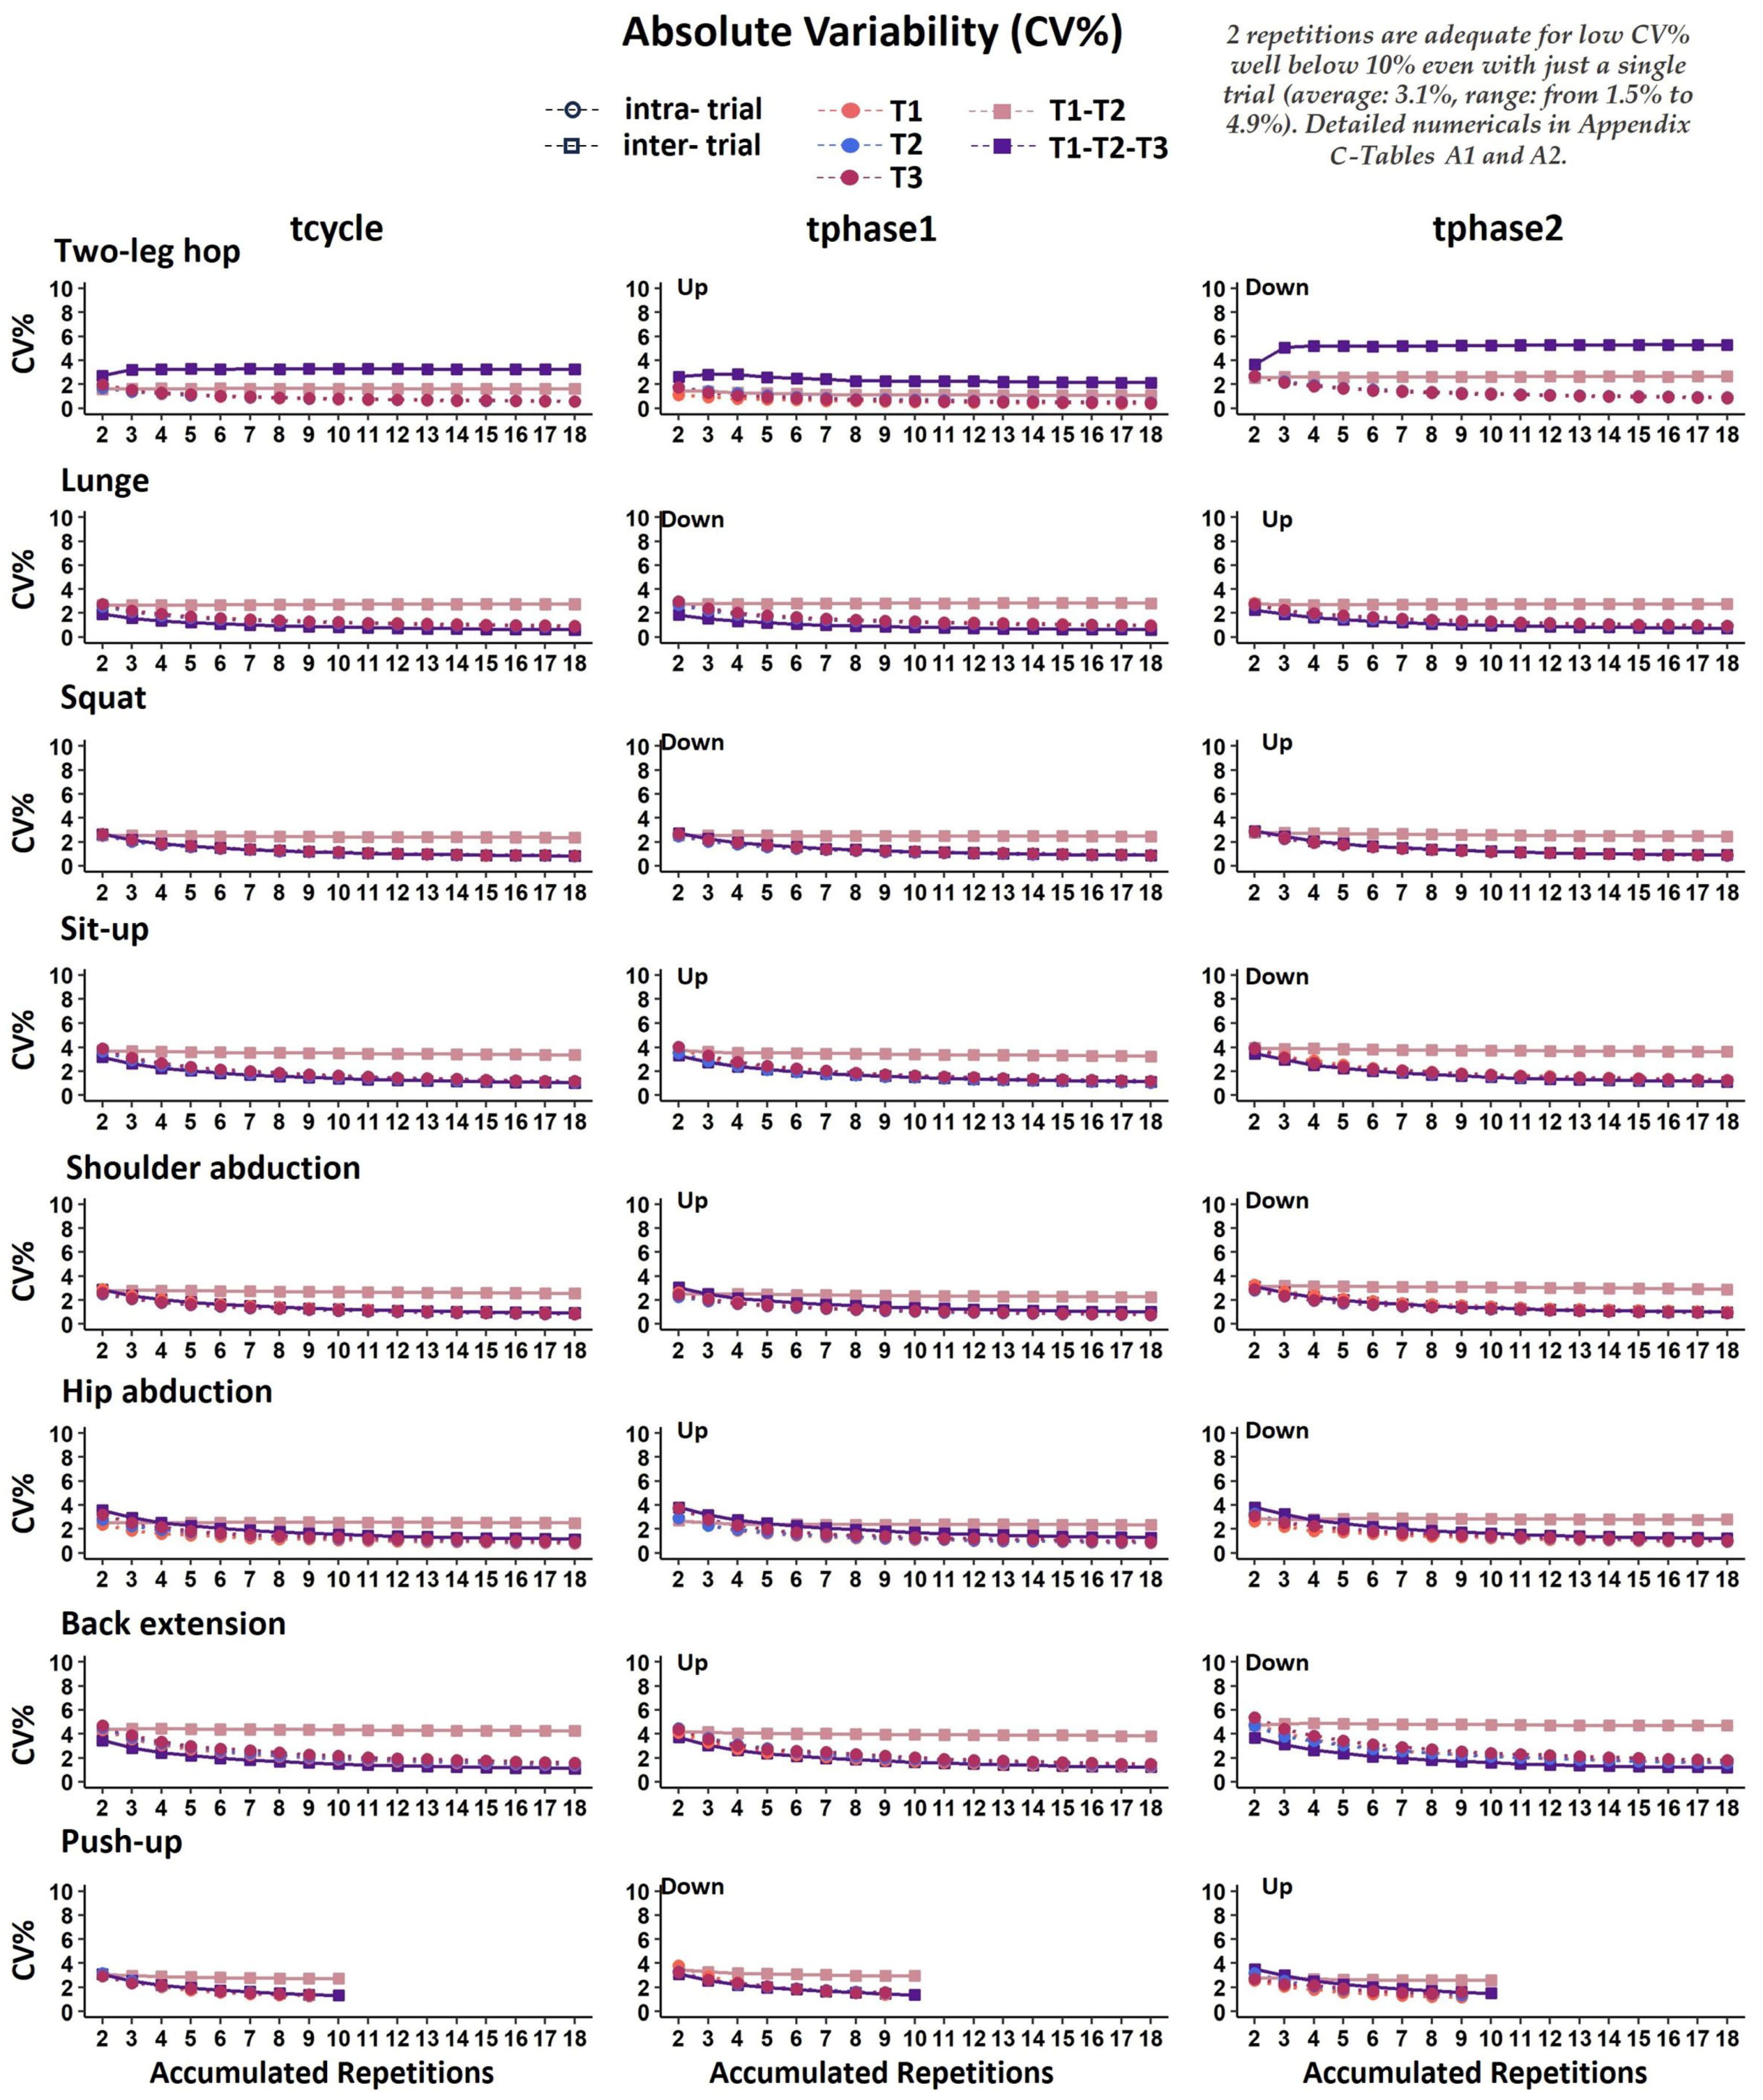
3.2. Absolute Temporal Reliability

SEM%. Figure 3 presents the intra- and inter-trial SEM% indices concerning the temporal absolute reliability of the movement durations expressed in seconds (tcycle, tphase1, and tphase2). Overall, consistently across the exercises (Figure 3), the SEM% values were within the acceptable SEM% limit (<15%, and in most cases within the range of a low SEM%, that is, ≤10%), which also highlights the fact that two repetitions are adequate for good intra- and inter-trial reliability and absolute temporal reliability (across all exercises and all repetitions, average SEM%: 5.9 and 6.8%, respectively). Detailed SEM% numerical results for tcycle, tphase1, and tphase2 are provided in Appendix CTable A1 on the intra-trial reliability and in Appendix CTable A2 on the inter-trial reliability.
As with tphase1 and tphase, %tphase1 and %tphase2 also revealed that two repetitions were adequate for good intra- and inter-trial absolute temporal reliability, consistently across all the exercises, with rather low SEM% values (average at 4% and 2.5%, respectively, for intra- and inter-trial SEM%) (Appendix BFigure A5, Appendix CTable A1 and Table A2).
MDC95%. Figure 4 presents the intra- and inter-trial MDC95% indices concerning the temporal absolute reliability of the movement durations expressed in seconds (tcycle, tphase1, and tphase2). The MDC95% had an average of 13.7% (range: 6.4-39%) for the intra-trial observed values and an average of 15.9% (range: 5.4-31%) for the inter-trial values. Overall, consistently across all the exercises, the intra- and inter-trial MDC95% was well above the upper boundary limit of the SEM% (Figure 5). Detailed MDC95% numerical results for tcycle, tphase1, and tphase2 are provided in Appendix CTable A1 on the intra-trial reliability and in Appendix CTable A2 on the inter-trial reliability.
As with tphase1 and tphase, %tphase1 and %tphase2 indicated that two repetitions were adequate for MDC95% and well above the upper boundary limit of SEM% (Figure 6), consistently across all the exercises, with an average MDC95% at 9.5% (range: 4.4-20.5%) for the intra-trial reliability (Appendix BFigure A6, Appendix CTable A1) and at 5.7% (range: 2.3-15.5%) for the inter-trial reliability, respectively (Appendix BFigure A6, Appendix CTable A2).
CV%. Figure 6 presents the intra- and inter-trial CV% concerning the movement durations expressed in seconds (tcycle, tphase1, and tphase2). Overall, consistently across the exercises (Figure 5), the low CV% values indicate that two repetitions were adequate for excellent absolute temporal reliability (averaged at 1.3% and 2.2%, for the intra- and the inter-trial CV%, respectively) (Appendix CTable A1 and Table A2).
As with tphase1 and tphase, %tphase1 and %tphase2 also revealed that two repetitions were adequate for good intra- and inter-trial absolute temporal reliability, consistently across all exercises, with rather low CV% values (averaged at 0.4% and 0.6%, respectively, for intra- and inter-trial CV%) (Appendix BFigure A7, Appendix CTable A1 and Table A2).

4. Discussion

This study aimed to assess the minimum number of repetitions that allow a high reliability of inertially sensed movement timing in a variety of fundamental movement patterns used in physical fitness modalities. Eight fundamental and commonly used physical fitness exercises (two-leg hop, lunge, squat, sit-up, shoulder abduction, hip abduction, back extension, and push-up), and five temporal variables were used (movement durations expressed in seconds: tcycle, tphase1, tphase2, and movement durations expressed as tcycle percentage: %tphase1, %tphase2)). For repetition accumulation and separately for each exercise, the reliability assessment was conducted within each single trial (intra-trial) and among multiple trials (inter-trial).
Across the eight physical fitness exercises, the overall reliability indices highlight the fact that a minimum of two repetitions is adequate and sufficient for achieving excellent temporal reliability, either within the same single trial (intra-trial) or among multiple trials (inter-trial). This is shown by the ICC values ≥0.75, alongside the SEM% values within the low (<10%) or the acceptable (≤15%) SEM% limits, the rather low CV% (well below the widely accepted CV% limit of 10%) [20,21], and the even lower CV% criterion of ≤5% for defining motor stability [26], as well as an MDC95% that consistently exceeded the upper boundary limit of SEM.

4.1. Relative Temporal Reliability

The relative temporal reliability consistently demonstrated a high level for the movement durations, both when expressed in seconds (tcycle, tphase1, and tphase2) and as a percentage of tcycle (%tphase1 and %tphase2), with the movement measures expressed in seconds emerging as the most reliable temporal variables in terms of relative reliability (higher ICC values). The adequacy of just two repetitions to provide excellent relative temporal reliability applies to both the movement measures expressed in seconds (tcycle, tphase1, tphase2) and those expressed as a percentage of tcycle (%tphase1 and %tphase2). Isolated exceptions regarding the ICC limits for excellent relative reliability are noted for the phases of movement only when these are expressed as a percentage of tcycle, and this is observed for only three out of the eight physical fitness exercises examined in the study. Specifically, the movement durations expressed as a percentage of tcycle exhibited slightly lower ICC values only in the hip abduction, back extension, and push-up, where achieving excellent reliability required more than two repetitions. However, the number of required repetitions was not consistent across the single trials or among the multiple trials.
The different optimum repetition numbers concerning the above-mentioned exercises may be attributed to specific demands inherent in these movement patterns, such as the increased need for postural stability in hip abduction [27] or varying muscle mass engagement and strength requirements in the back extension and push-up exercises [28]. These factors may contribute to a less stable temporal pattern across the repetitions and trials. The nuanced interpretation of reliability within the context of specific exercises emphasizes the importance of considering factors like subtle execution variations, individual biomechanics, and participant-specific characteristics influencing reliability. However, it is crucial to recognize that this variability in performance over time reflects the natural inherent challenges in these movements [29], such as those of postural stability and muscular strength, that may undermine proper technique. Considering the increased demands of postural stability and strength in the abovementioned exercises, it is important to note that achieving consistently excellent reliability (ICC > 0.75) may be challenging even with increased repetition numbers. Furthermore, we caution against using excessive repetitions as they may compromise the correct execution of movements, particularly in exercises demanding significant postural stability and strength. In the present study, an example of this was the push-up exercise, where, despite being well-trained, almost 2/3 of the participants completed only 10 repetitions in each trial, in contrast to the 20 repetitions in all the other exercises.
Comparison with the previous literature on inertial sensor reliability is challenging due to methodological differences between studies, especially in the assessed movement patterns and variables. The study by Cudejko and collaborators [2], which focused on accelerations and orientations of body segments in multiple functional activities, provided initial insights into the potential use of inertial sensors in the fitness field; however, it did not specifically address movement timing, which is the focus in the present study. The present findings align with studies assessing inertial sensor data in gait patterns [5,6,7,15]. The ICC values observed in this study were similar to those observed in gait assessments using body-worn inertial sensors (ICC > 0.75) [5,6,7]. One question that arises when using the ICC for reliability assessment (an index that inherently reckons on the variability among individuals) is whether this index reflects the degree of agreement between repetitive measurements [25,30]. High ICC values may result from sample variability rather than real agreement between measurements if the variance between individuals is sufficiently high [30]. However, the inter-individual variability across all the accumulated repetitions, trials, and exercises was below 10%, which was well below the 35% limit value for homogeneity [21]. Therefore, it can be safely concluded that the data presented excellent relative reliability.

4.2. Absolute Temporal Reliability

An additional factor that can influence the reliability is the measurement error, as any observed change represents a combination of true change and error. When a measurement test is repeatedly applied, the responses are likely to exhibit slight variations from repetition to repetition, or trial to trial, which are attributed to measurement error [30]. Human movement that is repeated over time inherently displays natural behavior variability [29]. Thus, a certain amount of variability is natural and will be reflected in the measurement error. Regarding reliability, the less the error varies around the mean, the more reliable the measurement will be. The standard error of measurement (SEM and SEM%) serves as an indicator of the reliability of the test response and measures absolute reliability, independently of the between-individual variability compared to ICC. However, SEM is not consistently reported in reliability studies, and to the best of our knowledge, there are no standardized criteria specifically outlining SEM classifications. According to Atkinson and Nevill [20], the lower the SEM%, the higher the absolute reliability and the higher the precision of the obtained results.
In our study, the consistently low SEM% values, across all the variables for intra- and inter-trial assessments, underscored the good absolute reliability for inertial sensor-based movement timing in the variety of examined fitness exercises. Occasionally, the non-consistent exceptions, which fell within acceptable limits (10–15%) [15,23], affirmed the overall robustness of the measurements, indicating the stability and reproducibility of the temporal variables over time and the precision of the individual temporal measurements using inertial sensors [20]. The phase durations expressed as a percentage of tcycle (%tphase1, %tphase2) consistently exhibited lower SEM% values in the intra- and inter-trial assessments, with SEM% being approximately one-third lower than the durations expressed in seconds, across all eight exercises and all repetition accumulations. This result suggests better absolute reliability for the phases of movement when these are expressed as a percentage of tcycle, in contrast to the opposite observation in relative reliability. This observation may be attributed to the increased variation in the duration values expressed in seconds, which may not be solely due to measurement error but also to the between-subject variability. On the other hand, the rather low variation when the phase durations are expressed as %tcycle, allows the assumption that, although the movement durations when expressed in seconds vary among individuals due to different preferred tempos, the timing of the movement does not vary between individuals.
Another indicator of measurement error and variability is the minimal detectable change. MDC95% is used to estimate the smallest change required to exceed the measurement error of an assessment; it acts as a threshold for determining whether an observed change is likely to be meaningful as a “real” one or whether it falls within the expected range of measurement error [7,15,20]. The consistently low MDC95% values for the absolute (average: 13.7% for intra-trial and 15.9% for inter-trial) and relative durations (average: 9.5% for intra-trial and 5.7% for inter-trial) provided valuable insights into the interpretation of meaningful changes in temporal measures across a spectrum of physical fitness exercises (MDC95% was consistently above the upper bound limit of SEM%). MDC95% is crucial for distinguishing the changes that surpass inherent natural variability and are influenced by significant external factors [7,15,20,29]. The consistently low overall MDC95% values underscore the reliability of the measurements obtained through inertial sensors across a diverse range of fitness exercises. In the hip abduction, back extension, and push-up exercise, the MDC95% was higher than that of the other exercises, which most likely implies that one should be more careful when interpreting minor changes in these movement patterns.

4.3. Required Repetitions for Reliable Temporal Measures

The study emphasizes the pivotal role of repetition numbers in analyzing rhythmic movements, in alignment with prior research [9,10,11,12,16,17].
Both too few or too many repetitions and trials can introduce variations in temporal movement patterns. These variations are attributed to external factors causing measurement errors and internal factors reflecting inherent variability arising from repetition-to-repetition differences or individual disparities [16]. While collecting data from multiple repetitions during precise measurements has been advocated to overcome variations, the practicality of many repetitions in real-world fitness settings presents challenges due to potential learning or fatigue effects and progressive changes in natural variability over time [16,17]. The existing literature has primarily focused on movement patterns like walking (10 cycles recommended [9], 25 cycles recommended [26]), running (25 cycles recommended [11]), swimming (6 cycles recommended [11], continuous jumping (4 to 11 cycles recommended [10]), and repetitive squatting (9 cycles recommended [17]). Importantly, these studies have not addressed the temporal analysis of movement using inertial sensors, making the current study’s contribution novel. It provides valuable insights into optimal repetition numbers for reliable temporal data in fitness-related movements.
The findings indicate that a minimum of two repetitions is adequate and sufficient for achieving excellent temporal reliability across all exercises, either within the same single trial (intra-trial) or within multiple trials (inter-trial). This finding contrasts with the gait studies that suggest that a higher number of movement cycles is necessary for reliable temporal data (10 cycles [9] or >25 cycles recommended [11,26]). However, it is essential to note that these studies do not use inertial sensors for temporal analysis. Hammil and McNiver [9] used running ground reaction force data recorded with a force plate, while Oliveira and Pirscoveanu [11] also used running ground reaction forces recorded with a force plate as well as optical motion data recorded with an eight-camera system. Kribus-Shmiel and coworkers [26] recorded their gait data with a motion capture system as well as with an inertial sensor-based system whose purpose was to detect the heel strike event. Our results align with the findings of Ader and colleagues [5,6], who demonstrated excellent reliability in temporal variables during gait using inertial sensors, with only three repetitions for healthy older individuals [6] and people with multiple sclerosis [5].

4.4. Practical Application

The study’s outcomes have practical implications for fitness professionals, trainers, and athletes. The data collected from wearable inertial sensors provide a portable and cost-effective solution compared to large or fixed equipment such as force plates and motion capture systems. The periodic signals observed from the measured accelerations, velocities, and displacements during the rhythmic movement patterns are suitable for detecting events and defining the temporal pattern of the body segments involved in and constituting those movements. [1,2,3,5,6]. Understanding the minimum number of repetitions required for reliable analysis of the movement timing may streamline data collection and analysis processes, making it more feasible to integrate temporal assessment into fitness routines and training programs.

4.5. Limitations

While this study offers valuable insights into inertial sensor-based temporal analysis in fitness modalities, several limitations should be acknowledged. Firstly, the study primarily focused on healthy, physically active participants, which may restrict the generalizability of the findings to individuals with varying fitness levels or clinical populations. Additionally, the study specifically examined a set of movement patterns, and it is essential to recognize that optimal repetition numbers may vary for other exercises or activities, as shown by the higher number of movement cycles necessitated in gait studies (23–25 strides, [26]).

5. Conclusions

In conclusion, this study provides comprehensive insights into the temporal reliability of inertially sensed movement timing across a variety of fundamental fitness exercises performed by young, trained adults. The findings suggest that inertial sensors offer a reliable and practical tool for capturing temporal data in various exercises, with a minimum of two repetitions proving adequate for the achievement of excellent reliability. Notably, a single inertial sensor, strategically placed on a segment indicative of the particular movement pattern, effectively yielded reliable temporal parameters, which were derived from angular velocity trajectories. The outcomes affirm that inertial sensors provide a feasible and practical tool for assessing movement timing in physical fitness exercises, particularly within the context of young, trained adults. Finally, the study establishes a foundation concerning the evaluation of the temporal aspects of human movement using inertial sensors and thus encourages further exploration and refinement of methodologies that may be applied not only in the laboratory but also in field settings.

Author Contributions

Conceptualization, A.E. and E.R.; methodology, A.E. and E.R.; formal analysis, A.E. and E.R.; investigation, A.E. and E.R.; data curation, A.E. and E.R.; writing—original draft preparation, A.E. and E.R.; writing—review and editing, A.E., K.B. and E.R.; visualization, A.E. and E.R.; supervision, E.R. and K.B.; project administration, K.B. and E.R. All authors have read and agreed to the published version of the manuscript.

Funding

This research received no external funding.

Institutional Review Board Statement

The study was conducted in accordance with the Declaration of Helsinki and was approved by the Institutional Ethics Committee on Research Ethics-Bioethics of the School of Physical Education and Sport Science, National and Kapodistrian University of Athens (approval ref. No. 1354/03/03/2022).

Informed Consent Statement

Informed consent was obtained from all subjects involved in the study.

Data Availability Statement

The data are not publicly available due to ethical restrictions.

Conflicts of Interest

The authors declare no conflicts of interest.

Appendix A

Figure A1. List of proper execution key points observed by the experienced examiner who ensured that participants fulfilled the inclusion criteria for the study and monitored proper technique during data collection trials.
Biomechanics 04 00006 g0a1
Figure A2. The body position where each one of the 6 inertial sensors used in the study was placed, as well as the exercise that is associated with each sensor (the plane of motion of each exercise is noted). The Xsens inertial sensor and its fixed coordinate system (x, y, and z axes) are also shown.
Biomechanics 04 00006 g0a2
Figure A3. Frequency spectrum of the raw (left) and the filtered (right) angular velocity signal of each one of the participants (each colored line indicates one participant) in a single trial (1st trial), in the eight physical fitness exercises. The frequency spectrum of the raw signal clearly indicates the intensity of the signal below 2 Hz, the latter defined as cut-off frequency for the applied 4th-order Butterworth low-pass filter (MATLAB R2022b, MathWorks, Inc., Natick, MA, USA).
Biomechanics 04 00006 g0a3

Appendix B

Figure A4. Graphical representation of intraclass correlation coefficient (ICC) for the phases of movement expressed as %tcycle (%tphase1 and %tphase2) in all accumulated repetitions for intra-trial reliability (each trial separately: T1, T2, T3) and inter-trial reliability (averages of 2 and 3 trials: T1–T2, T1–T2–T3, respectively). The error bars indicate the lower and upper bound of the 95% confidence intervals (95% CI).
Biomechanics 04 00006 g0a4
Figure A5. Graphical representation of standard error of measurement (SEM%) for the phases of movement expressed as %tcycle (%tphase1%tphase2) in all accumulated repetitions for intra-trial reliability (each trial separately: T1, T2, T3) and inter-trial (averages of 2 and 3 trials: T1–T2, T1–T2–T3, respectively).
Biomechanics 04 00006 g0a5
Figure A6. Graphical representation of the minimal detectable change (MDC95%) for the phases of movement expressed as %tcycle (%tphase1%tphase2) in all accumulated repetitions for intra-trial reliability (each trial separately: T1, T2, T3) and inter-trial reliability (averages of 2 and 3 trials: T1–T2, T1–T2–T3, respectively).
Biomechanics 04 00006 g0a6
Figure A7. Graphical representation of the coefficient of variability (CV%) for the phases of movement expressed as %tcycle (%tphase1%tphase2) in all accumulated repetitions for intra-trial reliability (each trial separately: T1, T2, T3) and inter-trial reliability (averages of 2 and 3 trials: T1–T2, T1–T2–T3, respectively).
Biomechanics 04 00006 g0a7

Appendix C

Table A1. INTRA-Trial Temporal Reliability Indices. Required number of repetitions for the repetition subsequent accumulation within the same single trial (T), separately for each one of the three trials (T1,T2,T3) to achieve an intraclass correlation coefficient (ICC) ≥ 0.75, a standard error of measurement (SEM%) ≤ 15%, a minimal detectable change (MDC95%) above the SEM% upper boundary limit, and the 2-repetition coefficient of variation CV% for the movement measures expressed in seconds (tcycle, tphase1, tphase2) (top part of the table) and the movement measures expressed as a percentage of tcycle (%tphase1, %tphase2) (bottom part of the table).
Intra-Trial
Measures
Number of
Repetitions
(ICC/SEM%/MDC95%/CV%)
ICC (95% CI)SEM%MDC95%CV%
T1T2T3T1T2T3T1T2T3T1T2T3T1T2T3
Movement Measures Expressed in Seconds (tcycle, tphase1, tphase2)
Two-leg
hop
tcycle2/2/2/22/2/2/22/2/2/20.92 (0.82 0.96)0.93 (0.85 0.97)0.92 (0.82 0.96)4.84.55.711.210.413.31.61.72.0
tphase12/2/2/22/2/2/22/2/2/20.86 (0.75 0.93)0.92 (0.83 0.96)0.86 (0.75 0.94)4.14.86.49.611.214.91.11.71.7
tphase22/2/2/22/2/2/22/2/2/20.93 (0.85 0.97)0.96 (0.91 0.98)0.93 (0.84 0.97)7.05.67.316.313.017.02.62.62.7
Lungetcycle2/2/2/22/2/2/22/2/2/20.99 (0.98 1.00)0.99 (0.98 1.00)0.99 (0.97 0.99)2.92.93.56.76.78.12.72.62.7
tphase12/2/2/22/2/2/22/2/2/20.98 (0.96 0.99)0.98 (0.97 0.99)0.98 (0.96 0.99)4.03.74.59.48.610.52.82.73.0
tphase22/2/2/22/2/2/22/2/2/20.98 (0.96 0.99)0.98 (0.97 0.99)0.98 (0.96 0.99)4.53.73.910.68.79.22.82.72.7
Squattcycle2/2/2/22/2/2/22/2/2/20.98 (0.97 0.99)0.97 (0.93 0.99)0.99 (0.96 0.99)3.44.73.07.811.06.92.52.62.7
tphase12/2/2/22/2/2/22/2/2/20.97 (0.95 0.99)0.94 (0.87 0.97)0.98 (0.94 0.99)4.66.63.810.715.58.92.62.52.7
tphase22/2/2/22/2/2/22/2/2/20.96 (0.91 0.98)0.95 (0.90 0.98)0.98 (0.95 0.99)6.26.44.514.415.010.42.82.92.9
Sit-uptcycle2/2/2/22/2/2/22/2/2/20.99 (0.98 0.99)0.99 (0.98 1.00)0.99 (0.98 1.00)4.63.83.710.78.98.63.83.73.9
tphase12/2/2/22/2/2/22/2/2/20.99 (0.98 0.99)0.99 (0.97 0.99)0.99 (0.98 1.00)4.44.73.610.311.08.54.03.54.0
tphase22/2/2/22/2/2/22/2/2/20.98 (0.96 0.99)0.99 (0.97 0.99)0.98 (0.96 0.99)6.04.75.914.111.013.74.03.93.9
Shoulder Abductiontcycle2/2/2/22/2/2/22/2/2/20.98 (0.96 0.99)0.98 (0.97 0.99)0.99 (0.98 1.00)4.43.22.710.37.46.42.92.52.6
tphase12/2/2/22/2/2/22/2/2/20.94 (0.87 0.97)0.97 (0.93 0.99)0.99 (0.97 0.99)6.93.83.316.18.97.62.62.32.5
tphase22/2/2/22/2/2/22/2/2/20.98 (0.97 0.99)0.98 (0.97 0.99)0.98 (0.95 0.99)4.63.94.810.79.111.13.32.82.9
Hip
Abduction
tcycle2/2/2/22/2/2/22/2/2/20.90 (0.78 0.95)0.98 (0.96 0.99)0.91 (0.80 0.96)7.74.210.117.99.823.62.42.83.2
tphase12/2/2/22/2/2/22/2/2/20.78 (0.43 0.87)0.86 (0.69 0.93)0.78 (0.53 0.89)14.311.314.833.426.329.02.92.93.7
tphase22/2/2/22/2/2/22/2/2/20.95 (0.89 0.98)0.88 (0.74 0.94)0.90 (0.79 0.95)6.411.610.214.827.123.82.73.33.1
Back
Extension
tcycle2/2/2/22/2/2/22/2/2/20.98 (0.95 0.99)0.99 (0.98 1.00)1.00 (0.99 1.00)7.44.53.117.410.47.34.34.54.7
tphase12/2/2/22/2/2/22/2/2/20.94 (0.88 0.97)0.96 (0.92 0.98)0.99 (0.97 0.99)10.39.35.723.921.813.34.14.54.4
tphase22/2/2/22/2/2/22/2/2/20.98 (0.96 0.99)0.99 (0.98 1.00)0.99 (0.98 0.99)7.65.36.317.812.314.84.84.75.4
Push-uptcycle2/2/2/22/2/2/22/2/2/20.95 (0.90 0.98)0.97 (0.94 0.99)0.98 (0.95 0.99)7.25.75.016.813.411.73.13.22.9
tphase12/2/2/22/2/2/22/2/2/20.89 (0.78 0.95)0.99 (0.98 1.00)0.95 (0.89 0.98)12.93.18.030.27.218.63.83.33.2
tphase22/2/2/22/2/2/22/2/2/20.99 (0.97 0.99)0.92 (0.83 0.96)0.98 (0.96 0.99)3.39.74.17.722.79.52.63.22.7
Movement Measures Expressed as %tcycle (%tphase1, %tphase2)
Two-leg
hop
%tphase12/2/2/22/2/2/22/2/2/20.89 (0.76 0.95)0.96 (0.91 0.98)0.75 (0.47 0.89)3.62.95.18.56.811.91.11.41.1
%tphase22/2/2/22/2/2/22/2/2/20.89 (0.76 0.95)0.96 (0.91 0.98)0.77 (0.49 0.90)3.32.74.87.66.311.11.01.31.1
Lunge%tphase12/2/2/22/2/2/22/2/2/20.81 (0.60 0.91)0.92 (0.83 0.96)0.91 (0.82 0.96)2.82.12.36.54.85.30.60.70.7
%tphase22/2/2/22/2/2/22/2/2/20.81 (0.60 0.91)0.92 (0.83 0.96)0.91 (0.82 0.96)3.22.32.57.45.45.90.70.80.8
Squat%tphase12/2/2/22/2/2/22/2/2/20.81 (0.59 0.91)0.80 (0.26 0.83)0.80 (0.58 0.90)3.94.12.79.19.46.30.90.70.6
%tphase22/2/2/22/2/2/22/2/2/20.81 (0.59 0.91)0.80 (0.26 0.83)0.80 (0.58 0.90)3.94.02.79.29.36.20.90.70.6
Sit-up%tphase12/2/2/22/2/2/22/2/2/20.94 (0.87 0.97)0.88 (0.74 0.94)0.82 (0.62 0.92)2.02.52.74.85.76.30.80.70.6
%tphase22/2/2/22/2/2/22/2/2/20.94 (0.87 0.97)0.88 (0.74 0.94)0.82 (0.62 0.92)2.02.42.74.75.56.30.80.70.6
Shoulder Abduction%tphase12/2/2/22/2/2/22/2/2/20.78 (0.59 0.88)0.84 (0.66 0.92)0.80 (0.59 0.91)2.82.02.96.54.66.60.60.50.6
%tphase22/2/2/22/2/2/22/2/2/20.78 (0.54 0.90)0.84 (0.66 0.92)0.80 (0.59 0.91)2.71.92.76.24.56.40.60.50.6
Hip
Abduction
%phase14/2/2/28/2/2/26/2/2/20.77 (0.59 0.88)0.77 (0.77 0.93)0.78 (0.63 0.88)6.38.87.314.820.517.11.31.21.1
%phase24/2/2/28/2/2/26/2/2/20.77 (0.59 0.88)0.77 (0.77 0.93)0.78 (0.63 0.88)5.88.17.013.618.916.31.21.11.0
Back
Extension
%phase15/2/2/215/2/2/24/2/2/20.75 (0.58 0.87)0.75 (0.60 0.93)0.76 (0.57 0.87)6.76.85.315.715.912.31.20.91.0
%phase25/2/2/215/2/2/24/2/2/20.75 (0.58 0.87)0.75 (0.60 0.93)0.76 (0.57 0.87)6.16.45.114.214.811.91.10.91.0
Push-up%phase15/2/2/24/2/2/28/2/2/20.75 (0.57 0.87)0.75 (0.40 0.82)0.76 (0.60 0.87)3.83.23.39.07.57.70.70.50.5
%phase25/2/2/24/2/2/28/2/2/20.75 (0.57 0.87)0.75 (0.40 0.82)0.76 (0.60 0.87)4.13.33.59.57.78.10.70.50.6
ICC: Excellent (≥0.75), Moderate to Good (0.40–0.75), Poor (<0.40) (classification following Fleiss [22]), SEM%: Low (≤10%), Acceptable (10–15%), High (>15%) [15,23], CV% < 10% [20,21].
Table A2. INTER-Trial Temporal Reliability Indices. Required number of repetitions for the repetition subsequent accumulation between trials (averages of 2 and 3 trials: T1–T2, T1–T2–T3, respectively) to achieve an intraclass correlation coefficient (ICC) ≥ 0.75, a standard error of measurement (SEM%) ≤ 15%, a minimal detectable change (MDC95%) above the SEM% upper boundary limit, and the 2-repetition coefficient of variation CV% for the movement measures expressed in seconds (tcycle, tphase1, tphase2) (top part of the table) and the movement measures expressed as a percentage of tcycle (%tphase1, %tphase2) (bottom part of the table).
Inter-trial
Measures
Number of
Repetitions
(ICC/SEM%/MDC95%/CV%)
ICC
(95% CI)
SEM%MDC95%CV%
T1–T2T1–T2–T3T1–T2T1–T2–T3T1–T2T1–T2–T3T1–T2T1–T2–T3T1–T2T1–T2–T3
Movement Measures Expressed in Seconds (tcycle, tphase1, tphase2)
Two-leg hoptcycle2/2/2/22/2/2/20.96 (0.91 0.98)0.96 (0.92 0.98)3.34.27.69.81.62.7
tphase12/2/2/22/2/2/20.76 (0.75 0.89)0.87 (0.76 0.94)6.35.914.713.71.42.6
tphase22/2/2/22/2/2/20.97 (0.92 0.98)0.96 (0.92 0.98)4.96.311.414.72.53.6
Lungetcycle2/2/2/22/2/2/20.91 (0.75 0.96)0.93 (0.85 0.97)7.57.517.617.42.71.9
tphase12/2/2/22/2/2/20.91 (0.72 0.96)0.94 (0.85 0.97)7.67.617.717.72.71.9
tphase22/2/2/22/2/2/20.90 (0.78 0.96)0.93 (0.86 0.97)8.48.319.619.32.82.3
Squattcycle2/2/2/22/2/2/20.95 (0.75 0.93)0.97 (0.91 0.93)4.84.811.111.12.52.7
tphase12/2/2/22/2/2/20.90 (0.75 0.93)0.95 (0.88 0.93)6.86.215.814.42.52.7
tphase22/2/2/22/2/2/20.95 (0.86 0.93)0.97 (0.93 0.93)5.55.512.912.92.82.9
Sit-uptcycle2/2/2/22/2/2/20.94 (0.89 0.97)0.94 (0.89 0.97)9.311.421.626.63.73.2
tphase12/2/2/22/2/2/20.94 (0.88 0.97)0.95 (0.91 0.98)9.410.521.924.43.83.3
tphase22/2/2/22/2/2/20.94 (0.87 0.97)0.92 (0.85 0.96)10.513.324.531.03.93.5
Shoulder Abductiontcycle2/2/2/22/2/2/20.80 (0.41 0.92)0.88 (0.73 0.95)10.49.524.322.22.82.9
tphase12/2/2/22/2/2/20.79 (0.34 0.92)0.88 (0.70 0.95)9.48.721.920.32.53.1
tphase22/2/2/22/2/2/20.81 (0.48 0.92)0.89 (0.75 0.95)11.810.827.525.33.23.1
Hip Abductiontcycle2/2/2/22/2/2/20.89 (0.70 0.95)0.93 (0.85 0.97)8.08.018.618.62.63.6
tphase12/2/2/22/2/2/20.82 (0.59 0.92)0.87 (0.75 0.93)10.712.124.928.22.73.8
tphase22/2/2/22/2/2/20.88 (0.73 0.94)0.93 (0.84 0.97)9.68.222.519.22.93.8
Back Extensiontcycle2/2/2/22/2/2/20.97 (0.91 0.99)0.98 (0.96 0.99)7.47.617.317.84.43.5
tphase12/2/2/22/2/2/20.95 (0.91 0.98)0.96 (0.94 0.98)9.410.421.924.24.23.7
tphase22/2/2/22/2/2/20.96 (0.87 0.98)0.97 (0.95 0.99)9.39.221.821.44.73.7
Push-uptcycle2/2/2/22/2/2/20.96 (0.87 0.98)0.96 (0.93 0.98)5.67.013.016.43.13.1
tphase12/2/2/22/2/2/20.92 (0.78 0.97)0.95 (0.90 0.97)9.29.321.521.83.53.1
tphase22/2/2/22/2/2/20.93 (0.86 0.97)0.95 (0.91 0.98)7.57.617.517.62.83.5
Movement Measures Expressed as %tcycle (%tphase1, %tphase2)
Two-leg
hop
%phase12/2/2/22/2/2/20.86 (0.70 0.94)0.90 (0.80 0.95)4.44.310.310.11.20.9
%phase22/2/2/22/2/2/20.86 (0.70 0.94)0.89 (0.79 0.95)4.04.19.39.51.10.8
Lunge%phase12/2/2/22/2/2/20.86 (0.71 0.93)0.91 (0.83 0.95)2.42.45.55.60.60.8
%phase22/2/2/22/2/2/20.86 (0.71 0.93)0.91 (0.83 0.95)2.72.76.36.30.70.9
Squat%phase12/2/2/22/2/2/20.80 (0.70 0.86)0.83 (0.75 0.91)3.83.28.87.50.70.9
%phase22/2/2/22/2/2/20.80 (0.70 0.86)0.83 (0.75 0.91)3.73.28.77.40.70.9
Sit-up%phase12/2/2/22/2/2/20.79 (0.55 0.90)0.85 (0.72 0.92)3.43.17.97.30.70.9
%phase22/2/2/22/2/2/20.79 (0.55 0.90)0.85 (0.72 0.92)3.33.17.77.10.70.9
Shoulder Abduction%phase12/2/2/22/2/2/20.83 (0.64 0.92)0.89 (0.79 0.94)2.12.24.85.10.50.9
%phase22/2/2/22/2/2/20.83 (0.64 0.92)0.89 (0.79 0.94)2.02.14.64.90.50.9
Hip Abduction%phase15/2/2/22/2/2/20.75 (0.47 0.89)0.80 (0.63 0.90)5.55.312.812.41.00.9
%phase25/2/2/22/2/2/20.75 (0.47 0.89)0.80 (0.63 0.90)5.15.011.811.60.90.9
Back Extension%phase113/2/2/25/2/2/20.77 (0.52 0.89)0.76 (0.56 0.88)6.76.015.513.90.90.9
%phase212/2/2/25/2/2/20.79 (0.57 0.90)0.76 (0.56 0.88)6.15.614.213.00.80.9
Push-up%phase15/2/2/25/2/2/20.75 (0.28 0.83)0.78 (0.59 0.89)3.93.19.17.30.50.9
%phase25/2/2/25/2/2/20.75 (0.28 0.83)0.78 (0.59 0.89)4.13.39.57.60.50.9
ICC: Excellent (≥0.75), Moderate to Good (0.40–0.75), Poor (<0.40) (classification following Fleiss [22]), SEM%: Low (≤10%), Acceptable (10–15%), High (>15%) [15,23], CV% < 10% [20,21].

References

  1. Allseits, E.K.; Lučarević, J.; Gailey, R.; Agrawal, V.; Gaunaurd, I.; Bennett, C.L. The Development and Concurrent Validity of a Real-Time Algorithm for Temporal Gait Analysis Using Inertial Measurement Units. J. Biomech. 2017, 55, 27–33. [Google Scholar] [CrossRef]
  2. Cudejko, T.; Button, K.; Al-Amri, M. Validity and Reliability of Accelerations and Orientations Measured Using Wearable Sensors during Functional Activities. Sci. Rep. 2022, 12, 14619. [Google Scholar] [CrossRef] [PubMed]
  3. Emmanouil, A.; Rousanoglou, E.; Georgaki, A.; Boudolos, K. Concurrent Validity of Inertially Sensed Measures during Voluntary Body Sway in Silence and While Exposed to a Rhythmic Acoustic Stimulus: A Pilot Study. Digit. Biomark. 2021, 5, 65–73. [Google Scholar] [CrossRef] [PubMed]
  4. Yang, C.-C.; Hsu, Y.; Shih, K.-S.; Lu, J. Real-Time GAIT Cycle Parameter Recognition Using a Wearable Accelerometry System. Sensors 2011, 11, 7314–7326. [Google Scholar] [CrossRef] [PubMed]
  5. Ader, L.G.M.; Greene, B.R.; McManus, K.; Tubridy, N.; Caulfield, B. Short Bouts of Gait Data and Body-Worn Inertial Sensors Can Provide Reliable Measures of Spatiotemporal Gait Parameters from Bilateral Gait Data for Persons with Multiple Sclerosis. Biosensors 2020, 10, 128. [Google Scholar] [CrossRef]
  6. Ader, L.G.M.; Greene, B.R.; McManus, K.; Caulfield, B. Reliability of Inertial Sensor Based Spatiotemporal Gait Parameters for Short Walking Bouts in Community Dwelling Older Adults. Gait Posture 2021, 85, 1–6. [Google Scholar] [CrossRef] [PubMed]
  7. Bourke, A.K.; Scotland, A.; Lipsmeier, F.; Gossens, C.; Lindemann, M. Gait Characteristics Harvested during a Smartphone-Based Self-Administered 2-Minute Walk Test in People with Multiple Sclerosis: Test-Retest Reliability and Minimum Detectable Change. Sensors 2020, 20, 5906. [Google Scholar] [CrossRef] [PubMed]
  8. Cormack, S.J.; Newton, R.U.; McGuigan, M.R.; Doyle, T. Reliability of Measures Obtained during Single and Repeated Countermovement Jumps. Int. J. Sports Physiol. Perform. 2008, 3, 131–144. [Google Scholar] [CrossRef] [PubMed]
  9. Hamill, J.; McNiven, S.L. Reliability of Selected Ground Reaction Force Parameters during Walking. Hum. Mov. Sci. 1990, 9, 117–131. [Google Scholar] [CrossRef]
  10. Racic, V.; Pavic, A.; Brownjohn, J.M. Number of Successive Cycles Necessary to Achieve Stability of Selected Ground Reaction Force Variables during Continuous Jumping. J. Sports Sci. Med. 2009, 8, 639. [Google Scholar]
  11. Oliveira, A.S.; Pirscoveanu, C.-I. Implications of Sample Size and Acquired Number of Steps to Investigate Running Biomechanics. Sci. Rep. 2021, 11, 3083. [Google Scholar] [CrossRef] [PubMed]
  12. Connaboy, C.; Coleman, S.; Moir, G.L.; Sanders, R. Measures of Reliability in the Kinematics of Maximal Undulatory Underwater Swimming. Med. Sci. Sports Exerc. 2010, 42, 762–770. [Google Scholar] [CrossRef]
  13. Venek, V.; Kranzinger, S.; Schwameder, H.; Stöggl, T. Human Movement Quality Assessment Using Sensor Technologies in Recreational and Professional Sports: A Scoping Review. Sensors 2022, 22, 4786. [Google Scholar] [CrossRef]
  14. Cuesta-Vargas, A.; Galán-Mercant, A.; Williams, J.M. The Use of Inertial Sensors System for Human Motion Analysis. Phys. Ther. Rev. 2010, 15, 462–473. [Google Scholar] [CrossRef] [PubMed]
  15. Soulard, J.; Vaillant, J.; Balaguier, R.; Vuillerme, N. Spatio-Temporal Gait Parameters Obtained from Foot-Worn Inertial Sensors Are Reliable in Healthy Adults in Single- and Dual-Task Conditions. Sci. Rep. 2021, 11, 10229. [Google Scholar] [CrossRef] [PubMed]
  16. Forrester, S.E. Selecting the Number of Trials in Experimental Biomechanics Studies. Int. Biomech. 2015, 2, 62–72. [Google Scholar] [CrossRef]
  17. King, A.C.; Hannan, K.B. Segment Coordination Variability during Double Leg Bodyweight Squats at Different Tempos. Int. J. Sports Med. 2019, 40, 725–731. [Google Scholar] [CrossRef]
  18. Šerbetar, I. Establishing Some Measures of Absolute and Relative Reliability of a Motor Tests. Croat. J. Educ. 2014, 17, 37–48. [Google Scholar] [CrossRef]
  19. Grgic, J.; Schoenfeld, B.J.; Skrepnik, M.; Davies, T.B.; Mikulic, P. Effects of Rest Interval Duration in Resistance Training on Measures of Muscular Strength: A Systematic Review. Sports Med. 2018, 48, 137–151. [Google Scholar] [CrossRef]
  20. Atkinson, G.; Nevill, A.M. Statistical Methods For Assessing Measurement Error (Reliability) in Variables Relevant to Sports Medicine. Sports Med. 1998, 26, 217–238. [Google Scholar] [CrossRef]
  21. Hopkins, W.G. Measures of Reliability in Sports Medicine and Science. Sports Med. 2000, 30, 1–15. [Google Scholar] [CrossRef]
  22. Fleiss, J.L. The Design and Analysis of Clinical Experiments; Willey: New York, NY, USA, 1986. [Google Scholar]
  23. Pedersen, B.S.; Kristensen, M.T.; Josefsen, C.O.; Lykkegaard, K.L.; Jønsson, L.R.; Pedersen, M.M. Validation of Two Activity Monitors in Slow and Fast Walking Hospitalized Patients. Rehabil. Res. Pract. 2022, 2022, 9230081. [Google Scholar] [CrossRef] [PubMed]
  24. Koo, T.K.; Li, M.Y. A Guideline of Selecting and Reporting Intraclass Correlation Coefficients for Reliability Research. J. Chiropr. Med. 2016, 15, 155–163. [Google Scholar] [CrossRef] [PubMed]
  25. Weir, J.P. Quantifying Test-Retest Reliability Using the Intraclass Correlation Coefficient and the SEM. J. Strength Cond. Res. 2005, 19, 231. [Google Scholar] [CrossRef] [PubMed]
  26. Kribus-Shmiel, L.; Zeilig, G.; Sokolovski, B.; Plotnik, M. How Many Strides Are Required for a Reliable Estimation of Temporal Gait Parameters? Implementation of a New Algorithm on the Phase Coordination Index. PLoS ONE 2018, 13, e0192049. [Google Scholar] [CrossRef] [PubMed]
  27. Widler, K.; Glatthorn, J.F.; Bizzini, M.; Impellizzeri, F.M.; Munzinger, U.; Leunig, M.; Maffiuletti, N.A. Assessment of Hip Abductor Muscle Strength. A Validity and Reliability Study. J. Bone Jt. Surg. Am. Vol. 2009, 91, 2666–2672. [Google Scholar] [CrossRef] [PubMed]
  28. Shimano, T.; Kraemer, W.J.; Spiering, B.A.; Volek, J.S.; Hatfield, D.L.; Silvestre, R.; Vingren, J.L.; Fragala, M.S.; Maresh, C.M.; Fleck, S.J.; et al. Relationship between the Number of Repetitions and Selected Percentages of One Repetition Maximum in Free Weight Exercises in Trained and Untrained Men. J. Strength Cond. Res. 2006, 20, 819. [Google Scholar] [CrossRef]
  29. Stergiou, N.; Decker, L.M. Human Movement Variability, Nonlinear Dynamics, and Pathology: Is There a Connection? Hum. Mov. Sci. 2011, 30, 869–888. [Google Scholar] [CrossRef]
  30. Bruton, A.; Conway, J.; Holgate, S.T. Reliability: What Is It, and How Is It Measured? Physiotherapy 2000, 86, 94–99. [Google Scholar] [CrossRef]
Figure 1. Exemplary filtered angular velocity trajectories (middle) in each movement pattern (left, the sensor position on the body is noted). Schematic definition of the cycle duration (right) as the time taken between 2 consecutive zero−crossing points (circle markers), indicating the same directional change. For the two−leg hop only, the cycle duration was defined between two consecutive dips (triangle markers) while phase1 (flight) and phase2 (contact) were defined between dip to peak and peak to dip, respectively.
Biomechanics 04 00006 g001
Figure 2. Graphical representation of intraclass correlation coefficient (ICC) for movement durations expressed in seconds (tcycle, tphase1, tphase2) in all accumulated repetitions, for intra-trial reliability (each trial separately: T1, T2, T3) and inter-trial reliability (averages of 2 and 3 trials: T1–T2 and T1–T2–T3, respectively). The error bars indicate the lower and upper bound of the 95% confidence intervals (95% CI).
Biomechanics 04 00006 g002
Figure 3. Graphical representation of standard error of measurement (SEM%) for movement durations expressed in seconds (tcycle, tphase1, tphase2), in all accumulated repetitions, for intra-trial reliability (each trial separately: T1, T2, T3) and inter-trial reliability (averages of 2 and 3 trials: T1–T2 and T1–T2–T3, respectively). The error bars indicate the lower and upper bound of the 95% confidence intervals (95% CI).
Biomechanics 04 00006 g003
Figure 4. Graphical representation of minimal detectable change (MDC95%) for movement durations expressed in seconds (tcycle, tphase1, tphase2) in all accumulated repetitions, for intra-trial reliability (each trial separately: T1, T2, T3) and inter-trial reliability (averages of 2 and 3 trials: T1–T2 and T1–T2–T3, respectively).
Biomechanics 04 00006 g004
Figure 5. Mean (SD) intra-trial (top, across the 3 single trials) and inter-trial (bottom, across T1–T2 and T1–T2–T3) MDC95% units above the SEM% upper boundary limit, for the temporal measures expressed in seconds (tcycle, tphase1, tphase2) and the temporal measures expressed as %tcycle (%tphase1, %tphase2). The MDC95% units above the SEM% upper boundary limit give a magnitude of how much the MDC95% exceeds the upper boundary limit of the SEM%, i.e., how much the observed changes go beyond what would be expected due to random measurement error alone.
Biomechanics 04 00006 g005
Figure 6. Graphical representation of coefficient of variability (CV%) for movement durations expressed in seconds (tcycle, tphase1, tphase2) in all accumulated repetitions for intra-trial reliability (each trial separately: T1, T2, T3) and inter-trial reliability (averages of 2 and 3 trials: T1–T2 and T1–T2–T3, respectively). The error bars indicate the lower and upper bound of the 95% confidence intervals (95% CI).
Biomechanics 04 00006 g006
Disclaimer/Publisher’s Note: The statements, opinions and data contained in all publications are solely those of the individual author(s) and contributor(s) and not of MDPI and/or the editor(s). MDPI and/or the editor(s) disclaim responsibility for any injury to people or property resulting from any ideas, methods, instructions or products referred to in the content.

