
Relationship between Body Center of Mass Velocity and Lower Limb Joint Angles during Advance Lunge in Skilled Male University Fencers

Abstract
:1. Introduction
2. Materials and Methods
2.1. Participants
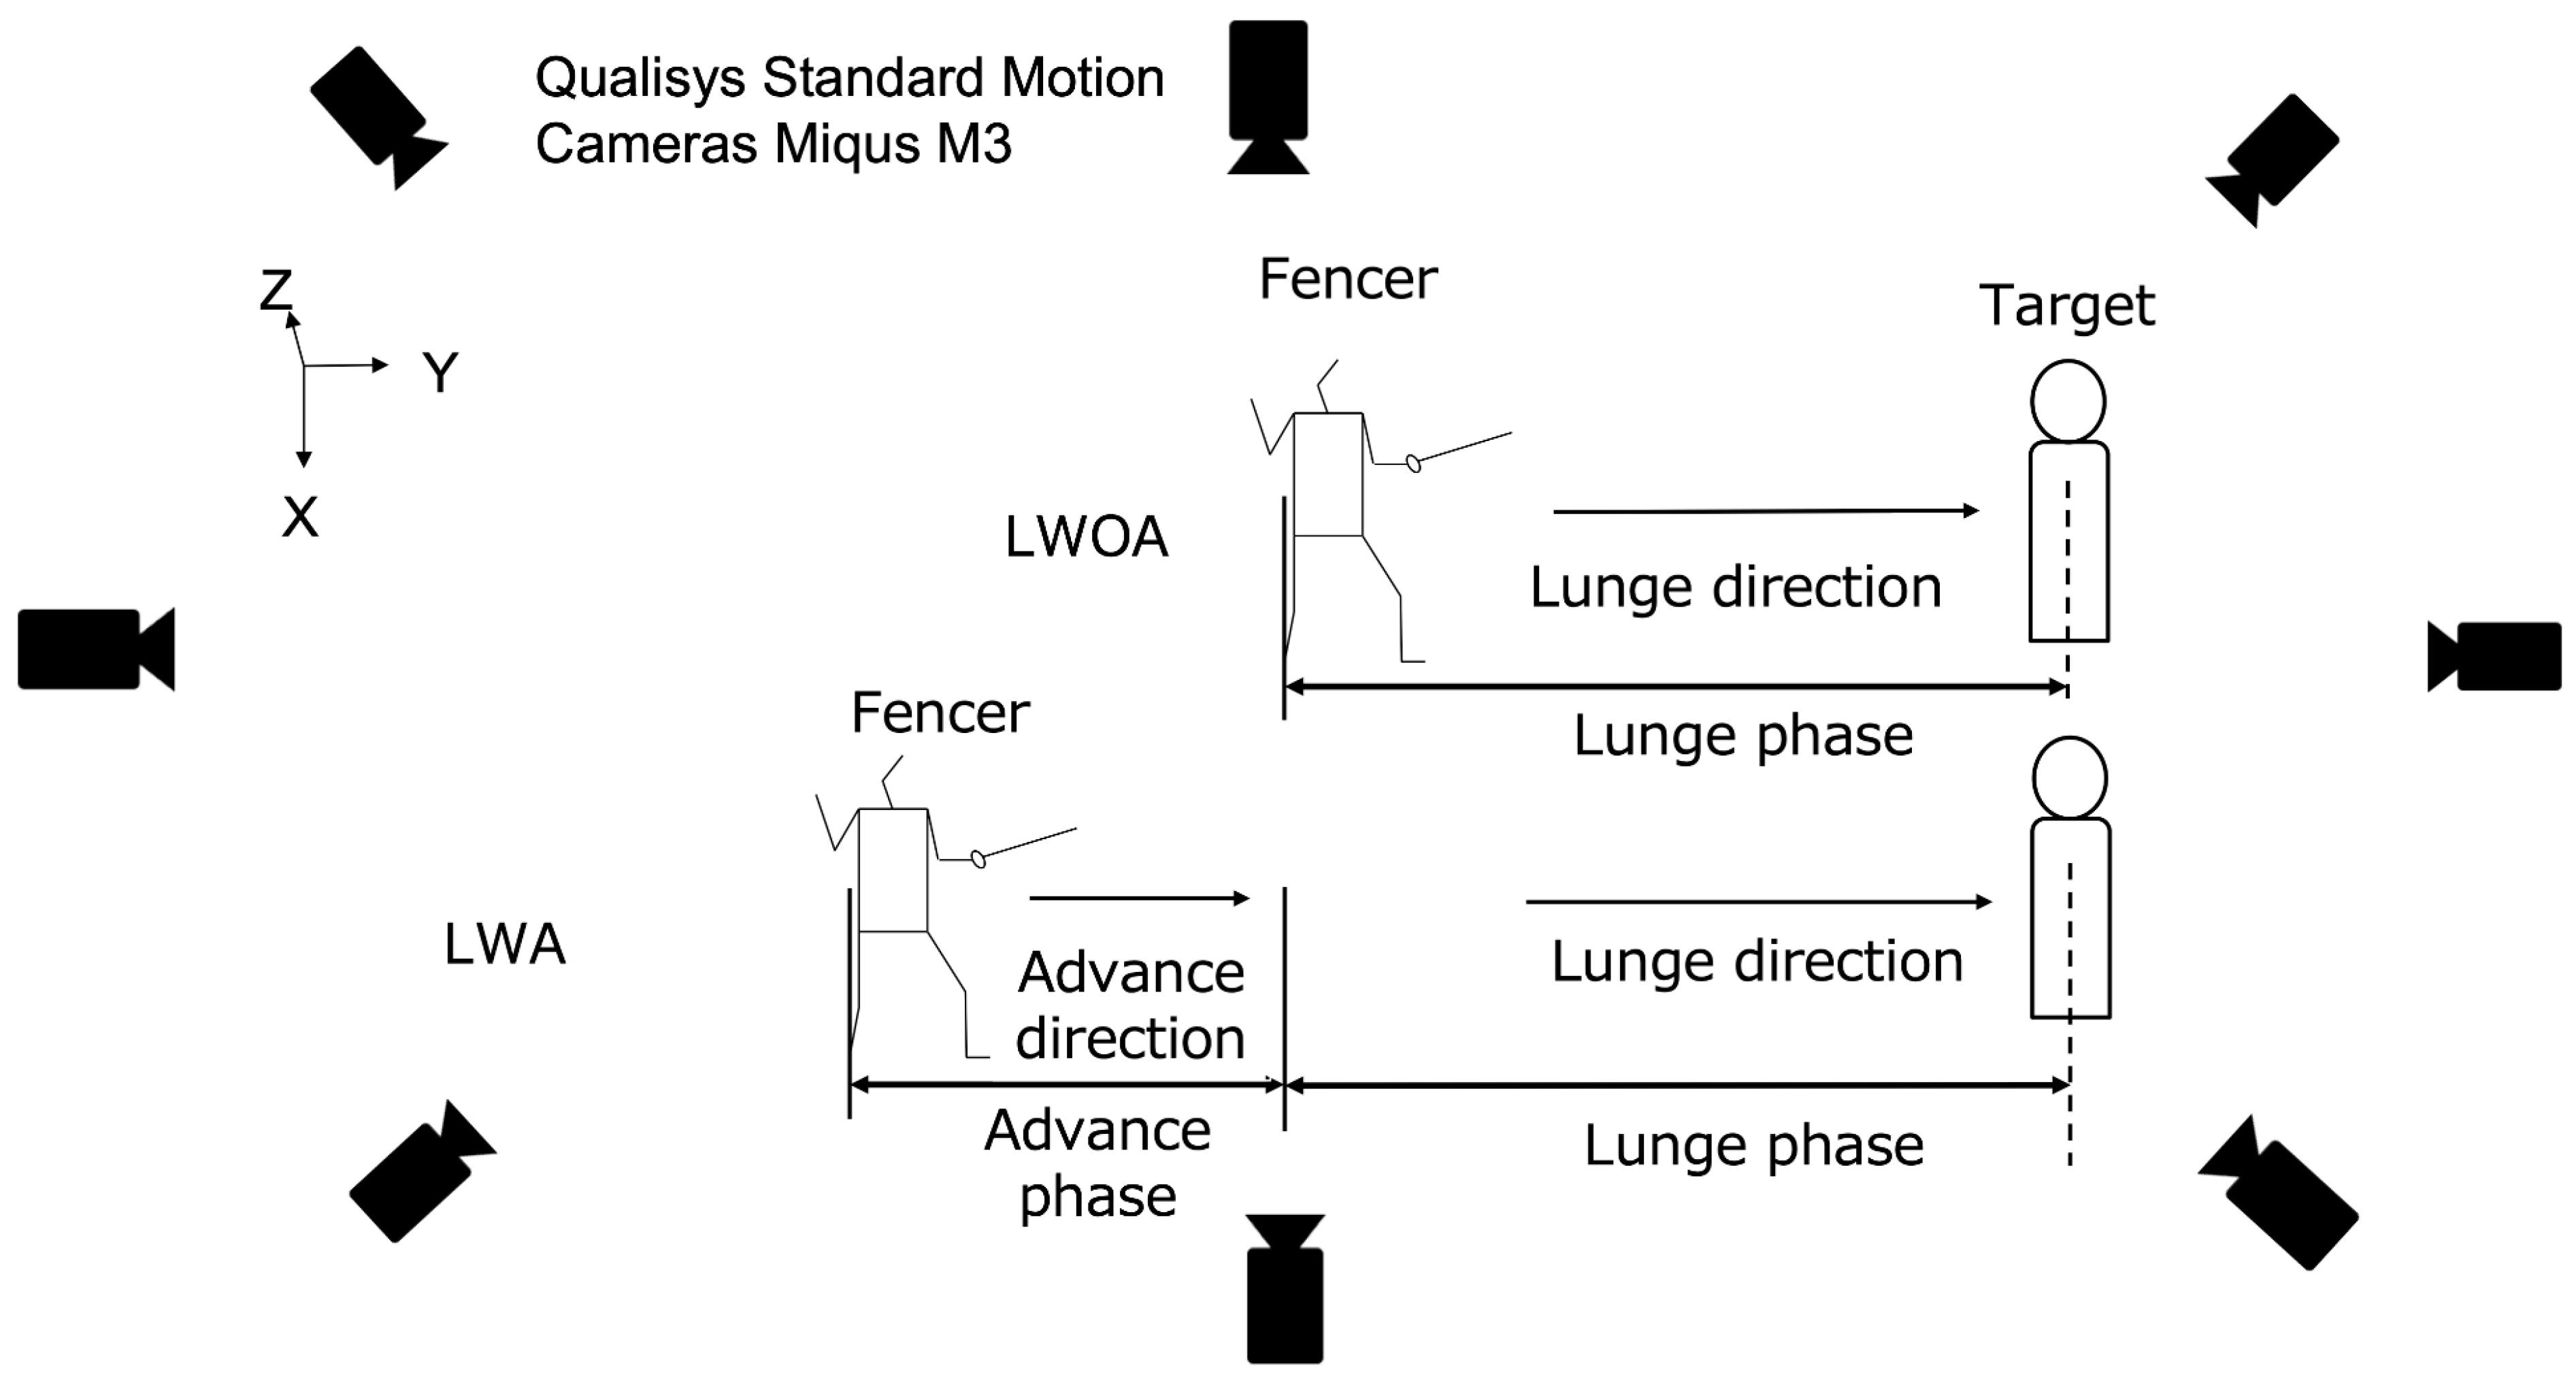
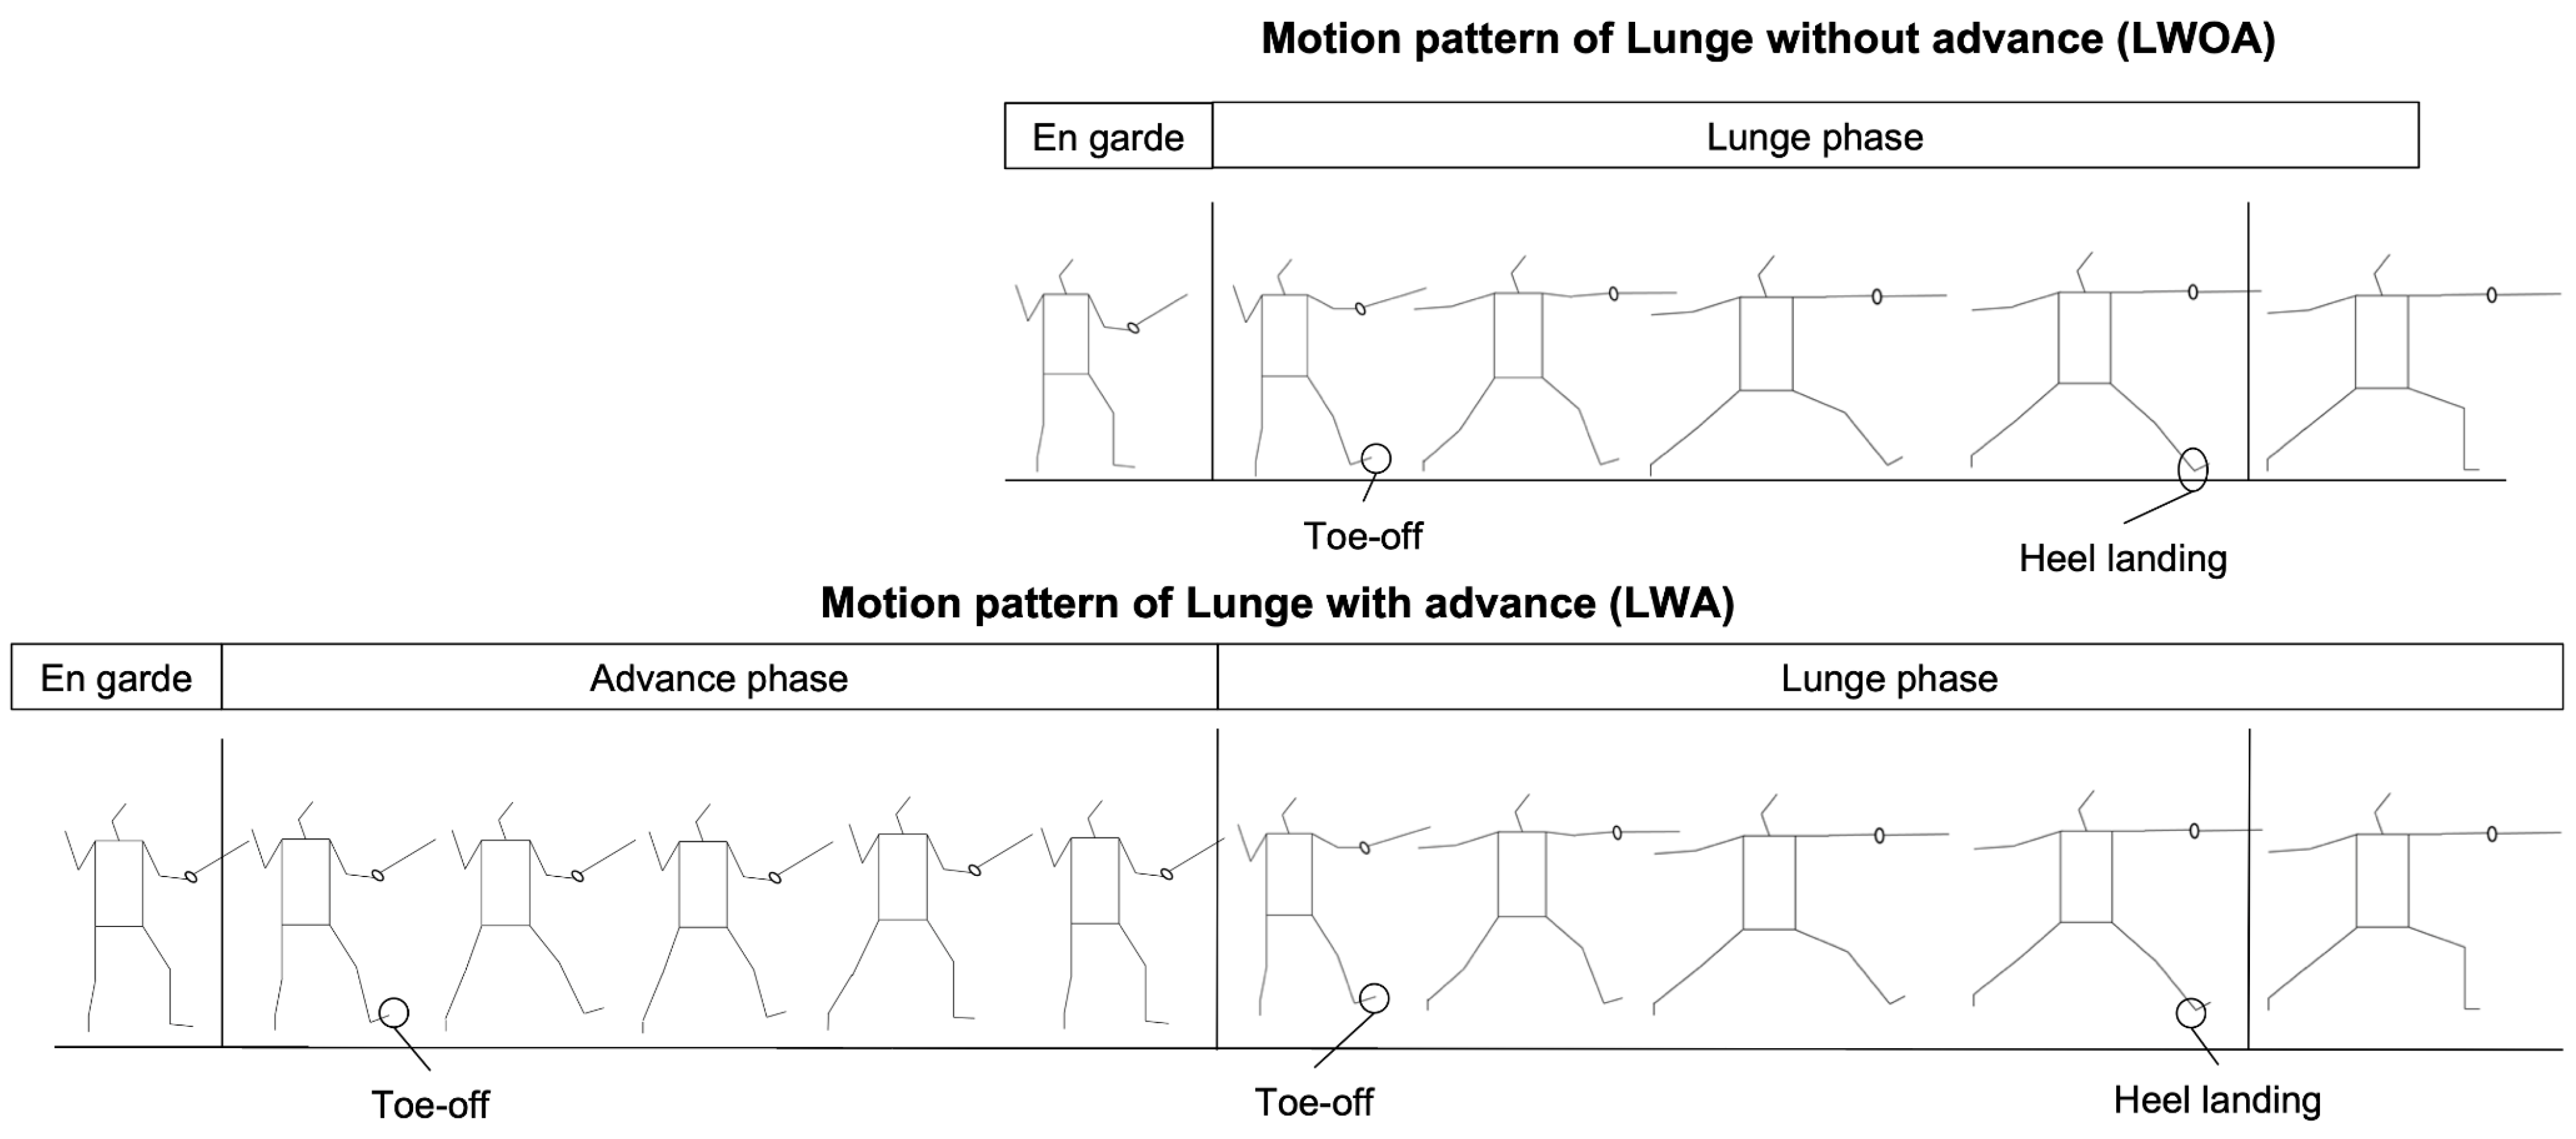
2.2. Study Design
2.3. Trial Conditions
2.4. Procedure
2.5. Analysis
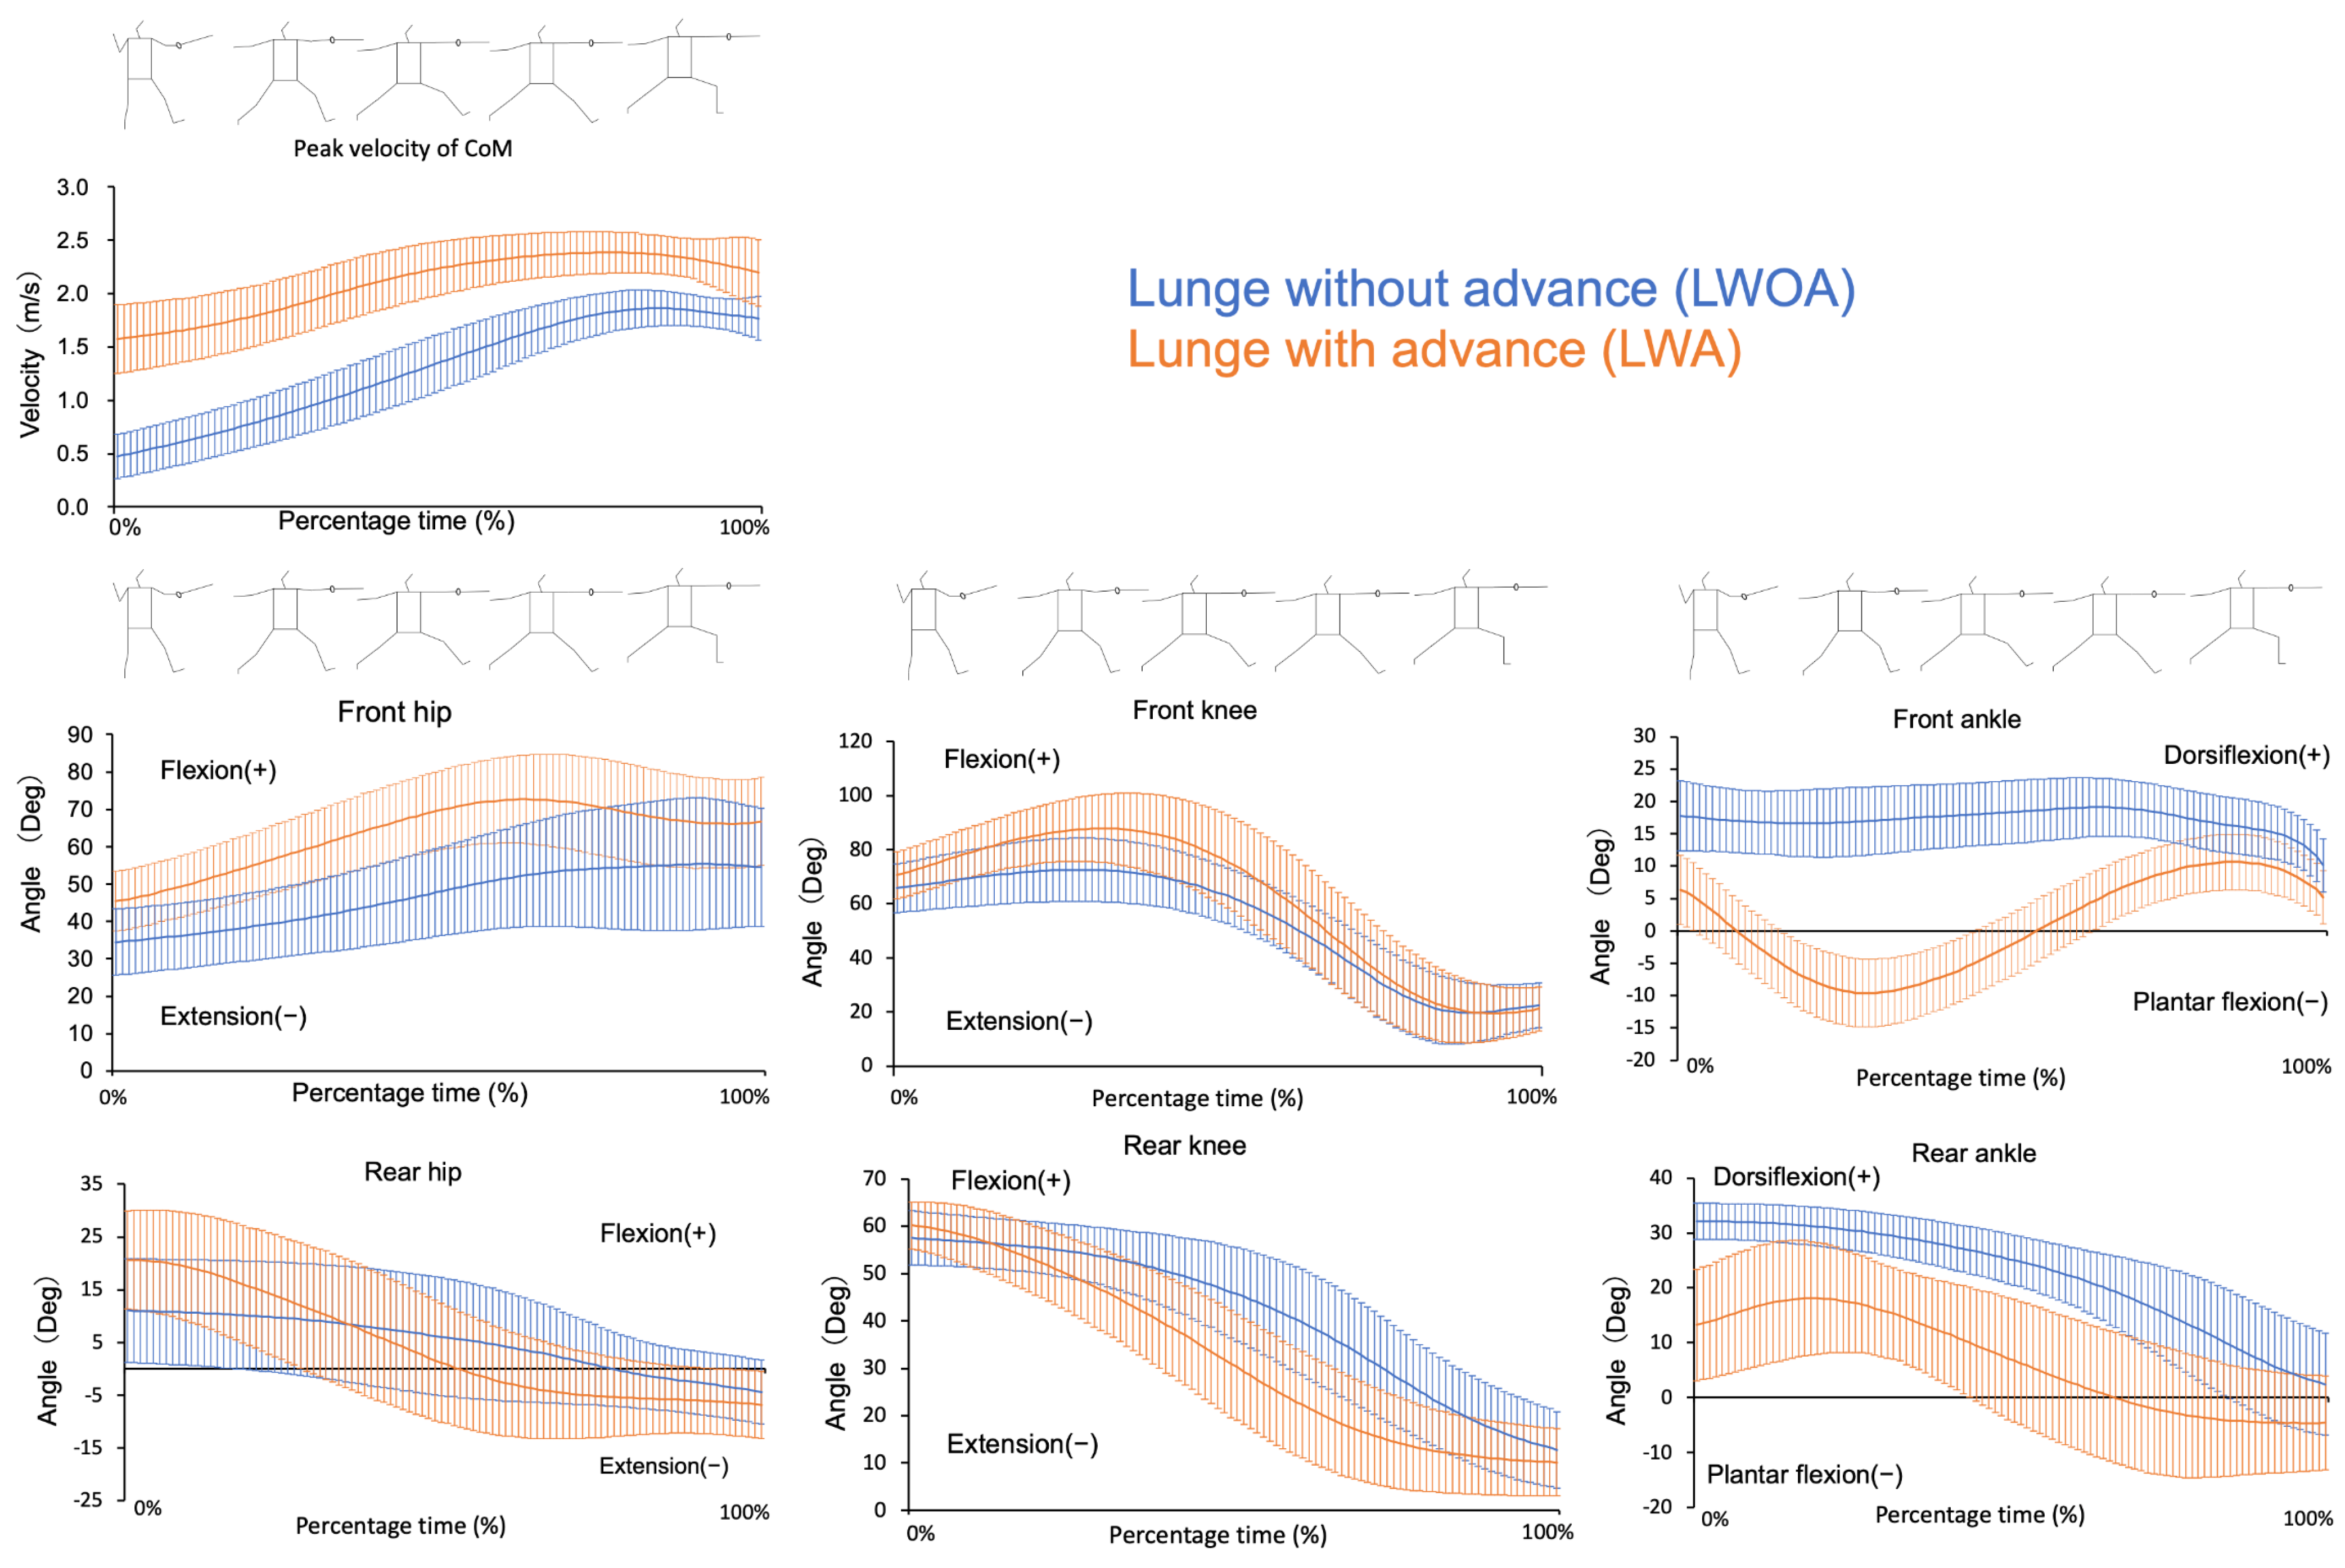
- Velocity parameter: peak velocity of the CoM during the advance phase and peak velocity of the CoM during the lunge phase;
- Lower limb joint angle parameters: PFA, PEA, PDA, PPA, and ROM of front and rear leg during the lunge phase;
- Amount of change in the lower extremity joint angle variables: the LWA minus the LWOA for each lower extremity joint angle variable in the lunge phase.
2.6. Statistical Analyses
3. Results
4. Discussion
4.1. Effects of Advance Movements on Lower Limb Joint Angles during the Lunge
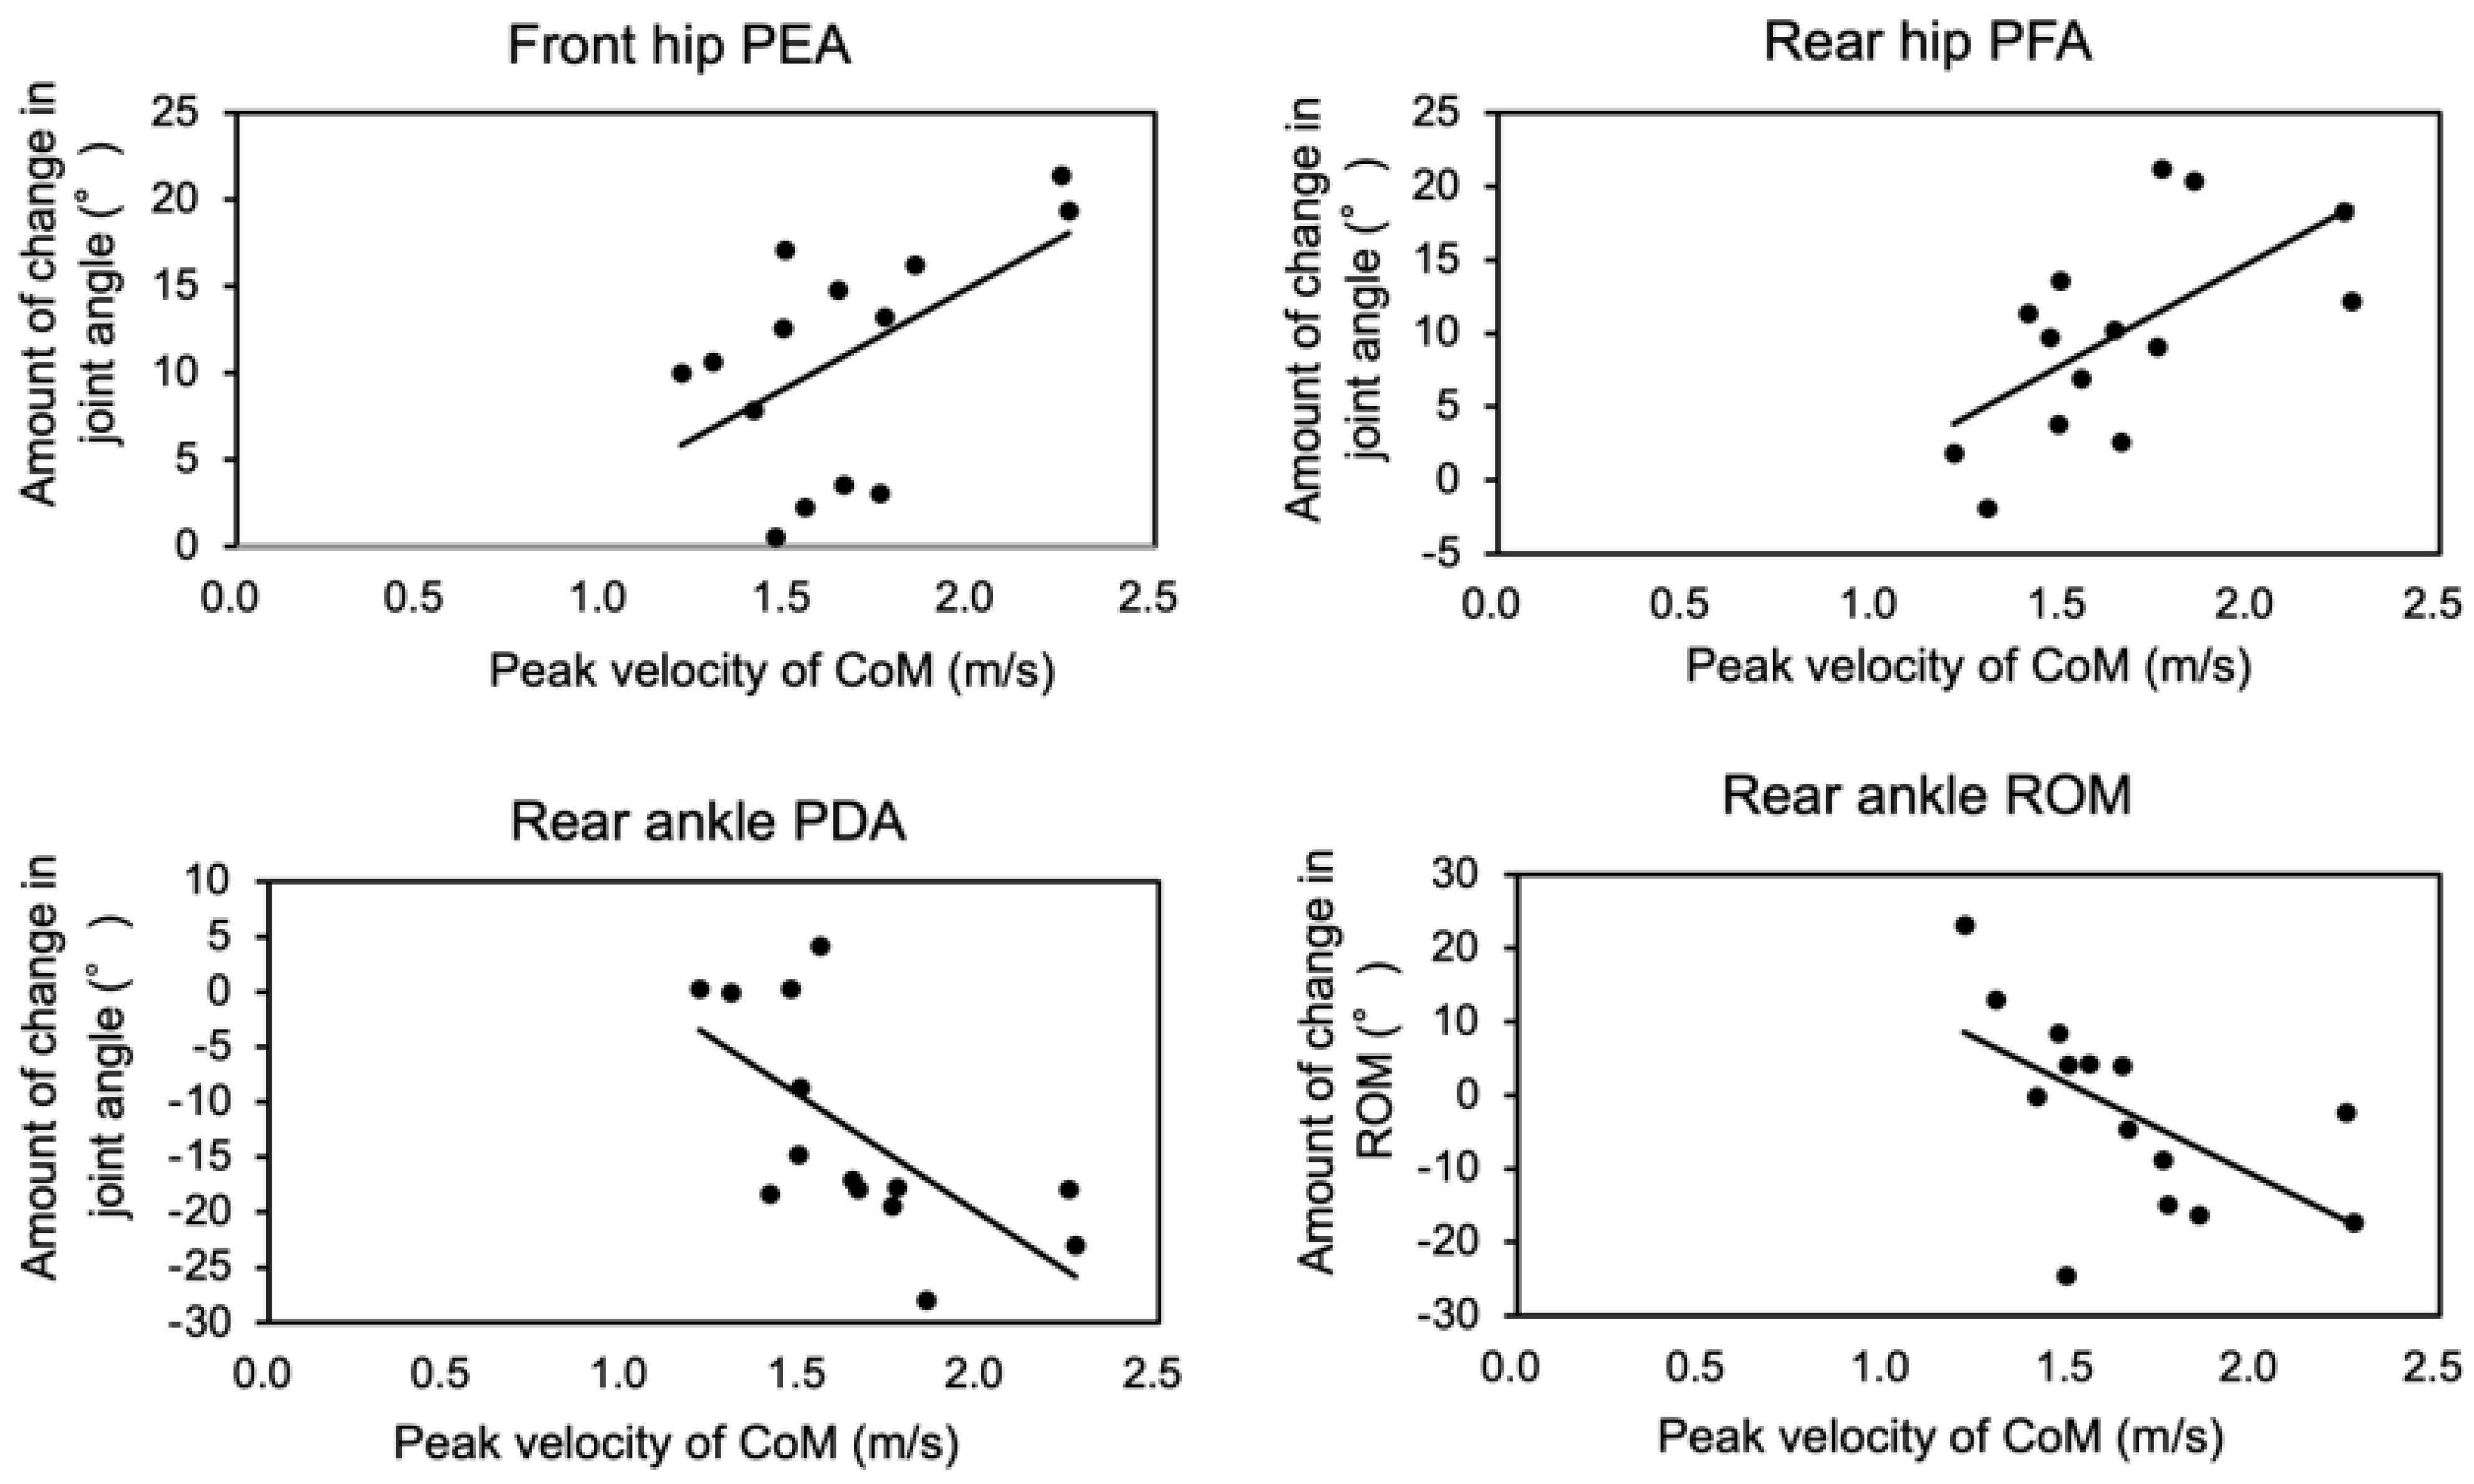
4.2. Lower Limb Joint Angle Variables Contributing to Peak Velocity of LWA
4.3. Implications for Coaching of Fencers
4.4. Limitations and Future Work
5. Conclusions
Author Contributions
Funding
Institutional Review Board Statement
Informed Consent Statement
Data Availability Statement
Acknowledgments
Conflicts of Interest
References
- Roi, G.S.; Bianchedi, D. The science of fencing. Implications for performance and injury prevention. Sports Med. 2008, 38, 465–481. [Google Scholar] [CrossRef] [PubMed]
- FIE (Fédération Internationale d’Escrime). Technical Rules, November 2022. Available online: https://static.fie.org/uploads/28/141642-technical%20rules%20ang.pdf (accessed on 21 April 2023).
- Barth, B.; Beck, E. Performance structure, performance capacity and performance development. In The Complete Guide to Fencing; Meyer and Meyer Verlag: Aachen, Germany, 2007; pp. 62–63. [Google Scholar]
- Bottoms, L.; Greenhalgh, A.; Sinclair, J. Kinematic determinants of weapon velocity during the fencing lunge in experienced épée fencers. Acta Bioeng. Biomech. 2013, 15, 109–113. [Google Scholar] [PubMed]
- Chen, T.L.; Wong, D.W.; Wang, Y.; Ren, S.; Yan, F.; Zhang, M. Biomechanics of fencing sport: A scoping review. PLoS ONE 2017, 12, e0171578. [Google Scholar] [CrossRef] [PubMed]
- Gholipour, M.; Tabrizi, A.; Farahmand, F. Kinematics analysis of lunge fencing using stereophotogrametry. World J. Sport Sci. 2008, 1, 32–37. [Google Scholar]
- Gutierrez-Davila, M.; Rojas, F.J.; Antonio, R.; Navarro, E. Response timing in the lunge and target change in elite versus medium-level fencers. Eur. J. Sport Sci. 2013, 13, 364–371. [Google Scholar] [CrossRef] [PubMed]
- Gutierrez-Davila, M.; Zingsem, C.; Gutierrez-Cruz, C.; Giles, F.J.; Rojas, F.J. Effect of uncertainty during the lunge in fencing. J. Sports Sci. Med. 2014, 13, 66–72. [Google Scholar] [PubMed]
- Hassan, S.E.A.; Klauck, J. Kinematics of lower and upper extremities motions during the fencing lunge: Results and training implications. ISBS Conf. Proc. Arch. 1998, 1, 170–173. [Google Scholar]
- Sorel, A.; Plantard, P.; Bideau, N.; Pontonnier, C. Studying fencing lunge accuracy and response time in uncertain conditions with an innovative simulator. PLoS ONE 2019, 14, e0218959. [Google Scholar] [CrossRef] [PubMed]
- Tsolakis, C.; Kostaki, E.; Vagenas, G. Anthropometric, flexibility, strength-power, and sport-specific correlates in elite fencing. Percept. Mot. Ski. 2010, 110, 1015–1028. [Google Scholar] [CrossRef] [PubMed]
- Turner, A.; Bishop, C.; Chavda, S.; Edwards, M.; Brazier, J.; Kilduff, L.P. Physical characteristics underpinning lunging and change of direction speed in fencing. J. Strength Cond. Res. 2016, 30, 2235–2241. [Google Scholar] [CrossRef] [PubMed]
- Gresham-Fiegel, C.N.; House, P.D.; Zupan, M.F. The effect of nonleading foot placement on power and velocity in the fencing lunge. J. Strength Cond. Res. 2013, 27, 57–63. [Google Scholar] [CrossRef] [PubMed]
- Guan, Y.; Guo, L.; Wu, N.; Zhang, L.; Warburton, D.E.R. Biomechanical insights into the determinants of speed in the fencing lunge. Eur. J. Sport Sci. 2018, 18, 201–208. [Google Scholar] [CrossRef] [PubMed]
- Cheng, K.B.; Wang, Y.H.; Kuo, S.Y.; Wang, K.M.; Huang, Y.C. Perform kicking with or without jumping: Joint coordination and kinetic differences between Taekwondo back kicks and jumping back kicks. J. Sports Sci. 2015, 33, 1614–1621. [Google Scholar] [CrossRef] [PubMed]
- Williams, L.R.; Walmsley, A. Response amendment in fencing: Differences between elite and novice subjects. Percept. Mot. Ski. 2000, 91, 131–142. [Google Scholar] [CrossRef] [PubMed]
- Kim, J.W.; Kwon, M.S.; Yenuga, S.S.; Kwon, Y.-H. The effects of target distance on pivot hip, trunk, pelvis, and kicking leg kinematics in Taekwondo roundhouse kicks. Sports Biomech. 2010, 9, 98–114. [Google Scholar] [CrossRef] [PubMed]
- Dempster, W.T. Space requirements of the seated operator. Geometrical kinematic and mechanical aspects of the body with special reference to the limbs. In Technical Report; US Air Force Wright Air Development Center (WADC): Dayton, OH, USA, 1955; Volume 55/159, pp. 1–254. Available online: https://deepblue.lib.umich.edu/handle/2027.42/4540 (accessed on 9 August 2023).
- Bell, A.L.; Brand, R.A.; Pedersen, D.R. Prediction of hip joint centre location from external landmarks. Hum. Mov. Sci. 1989, 8, 3–16. [Google Scholar] [CrossRef]
- Bell, A.L.; Pedersen, D.R.; Brand, R.A. A comparison of the accuracy of several hip center location prediction methods. J. Biomech. 1990, 23, 617–621. [Google Scholar] [CrossRef] [PubMed]
- Błażkiewicz, M.; Borysiuk, Z.; Gzik, M. Determination of loading in the lower limb joints during step-forward lunge in fencing. Acta Bioeng. Biomech. 2018, 20, 3–8. [Google Scholar] [PubMed]
- Guilhem, G.; Giroux, C.; Couturier, A.; Chollet, D.; Rabita, G. Mechanical and muscular coordination patterns during a high-level fencing assault. Med. Sci. Sports Exerc. 2014, 46, 341–350. [Google Scholar] [CrossRef]
- Cohen, J. Statistical Power Analysis for the Behavioral Sciences, 2nd ed.; Lawrence Erlbaum: Hillsdale, NJ, USA, 1988. [Google Scholar]
- Hopkins, W.G.; Marshall, S.W.; Batterham, A.M.; Hanin, J. Progressive statistics for studies in sports medicine and exercise science. Med. Sci. Sports Exerc. 2009, 41, 3–13. [Google Scholar] [CrossRef] [PubMed]
- Ziemowit, W. Principles of coaching. In This is Fencing!: Advanced Training and Performance Principles for Foil; Wojciechowski, Z., Ed.; The Crowood Press: Ramsbury, UK, 2019; p. 161. [Google Scholar]


| Variables | LWOA | LWA | p | Effect Size (d) | Power | ||
|---|---|---|---|---|---|---|---|
| Peak velocity of CoM (m/s) | 1.88 ± 0.16 | 2.41 ± 0.20 | <0.001 | 2.84 | 1.00 | ||
| Front | Hip | PFA (°) | 58.94 ± 17.05 | 76.41 ± 10.34 | 0.002 | 1.15 | 0.98 |
| PEA (°) | 34.50 ± 8.88 | 45.40 ± 7.99 | <0.001 | 1.24 | 0.99 | ||
| ROM (°) | 24.44 ± 13.62 | 31.01 ± 9.41 | 0.137 | 0.54 | 0.46 | ||
| Knee | PFA (°) | 73.50 ± 11.63 | 89.42 ± 11.27 | 0.007 | 1.34 | 0.99 | |
| PEA (°) | 17.93 ± 10.38 | 18.06 ± 9.24 | 0.946 | 0.01 | 0.05 | ||
| ROM (°) | 55.57 ± 18.31 | 71.36 ± 12.33 | 0.019 | 0.98 | 0.92 | ||
| Ankle | PDA (°) | 20.85 ± 3.57 | 12.28 ± 4.56 | <0.001 | 2.02 | 0.99 | |
| PPA (°) | 9.65 ± 3.87 | −10.84 ± 8.82 | <0.001 | 2.90 | 1.00 | ||
| ROM (°) | 11.20 ± 4.38 | 23.12 ± 7.61 | <0.001 † | 0.88 # | 0.84 | ||
| Rear | Hip | PFA (°) | 11.50 ± 9.93 | 21.45 ± 9.51 | <0.001 | 0.99 | 0.93 |
| PEA (°) | −4.80 ± 6.33 | −7.61 ± 6.65 | 0.011 | 0.42 | 0.31 | ||
| ROM (°) | 16.30 ± 6.55 | 29.06 ± 6.12 | <0.001 | 1.94 | 0.99 | ||
| knee | PFA (°) | 57.68 ± 5.51 | 60.68 ± 5.62 | 0.115 | 0.52 | 0.44 | |
| PEA (°) | 12.79 ± 8.05 | 8.66 ± 6.24 | 0.024 | 0.55 | 0.48 | ||
| ROM (°) | 44.89 ± 7.51 | 52.02 ± 6.35 | 0.001 | 0.99 | 0.93 | ||
| Ankle | PDA (°) | 32.46 ± 3.27 | 19.71 ± 10.23 | <0.001 | 1.62 | 0.99 | |
| PPA (°) | 2.34 ± 9.38 | −8.13 ± 8.75 | <0.001 | 1.11 | 0.97 | ||
| ROM (°) | 30.12 ± 9.13 | 27.84 ± 12.16 | 0.528 | 0.20 | 0.11 | ||
| Variables | Peak Velocity of CoM in Advance (m/s) | |||
|---|---|---|---|---|
| r | p | |||
| Front | Hip | PFA | 0.11 | |
| PEA | 0.54 | 0.045 | ||
| ROM | −0.11 | |||
| Knee | PFA | 0.11 | ||
| PEA | 0.17 | |||
| ROM | 0.04 | |||
| Ankle | PDA | −0.17 | ||
| PPA | −0.42 | 0.135 | ||
| ROM | 0.29 | |||
| Rear | Hip | PFA | 0.63 | 0.017 |
| PEA | 0.18 | |||
| ROM | 0.47 | 0.088 | ||
| Knee | PFA | 0.40 | 0.16 | |
| PEA | −0.02 | |||
| ROM | 0.42 | 0.133 | ||
| Ankle | PDA | −0.66 | 0.011 | |
| PPA | 0.13 | |||
| ROM | −0.59 | 0.027 | ||
| Variables | B | SE B | β | t | p | R | R2 | Adj. R2 | SE E | VIF |
|---|---|---|---|---|---|---|---|---|---|---|
| LWOA | 0.026 | 0.592 | 0.351 | 0.297 | 0.135 | |||||
| Rear hip ROM | 0.014 | 0.006 | 0.592 | 2.547 | 0.026 | |||||
| LWA | 0.003 | 0.861 | 0.742 | 0.665 | 0.093 | |||||
| Rear knee PEA | −0.01 | 0.003 | −0.537 | −3.232 | 0.009 | 1.070 | ||||
| Rear knee PFA | 0.015 | 0.005 | 0.542 | 3.310 | 0.008 | 1.041 | ||||
| Front knee PEA | −0.007 | 0.002 | −0.460 | −2.763 | 0.020 | 1.076 |
Disclaimer/Publisher’s Note: The statements, opinions and data contained in all publications are solely those of the individual author(s) and contributor(s) and not of MDPI and/or the editor(s). MDPI and/or the editor(s) disclaim responsibility for any injury to people or property resulting from any ideas, methods, instructions or products referred to in the content. |
© 2023 by the authors. Licensee MDPI, Basel, Switzerland. This article is an open access article distributed under the terms and conditions of the Creative Commons Attribution (CC BY) license (https://creativecommons.org/licenses/by/4.0/).
Share and Cite
Chida, K.; Inami, T.; Yamaguchi, S.; Yoshida, Y.; Kohtake, N. Relationship between Body Center of Mass Velocity and Lower Limb Joint Angles during Advance Lunge in Skilled Male University Fencers. Biomechanics 2023, 3, 377-388. https://doi.org/10.3390/biomechanics3030031
Chida K, Inami T, Yamaguchi S, Yoshida Y, Kohtake N. Relationship between Body Center of Mass Velocity and Lower Limb Joint Angles during Advance Lunge in Skilled Male University Fencers. Biomechanics. 2023; 3(3):377-388. https://doi.org/10.3390/biomechanics3030031
Chicago/Turabian StyleChida, Kenta, Takayuki Inami, Shota Yamaguchi, Yasumasa Yoshida, and Naohiko Kohtake. 2023. "Relationship between Body Center of Mass Velocity and Lower Limb Joint Angles during Advance Lunge in Skilled Male University Fencers" Biomechanics 3, no. 3: 377-388. https://doi.org/10.3390/biomechanics3030031