
Effect of Additional Loads on Joint Kinetics and Joint Work Contribution in Males and Females Performing Vertical Countermovement Jumps


Abstract
:1. Introduction
2. Materials and Methods
2.1. Participants
2.2. Design
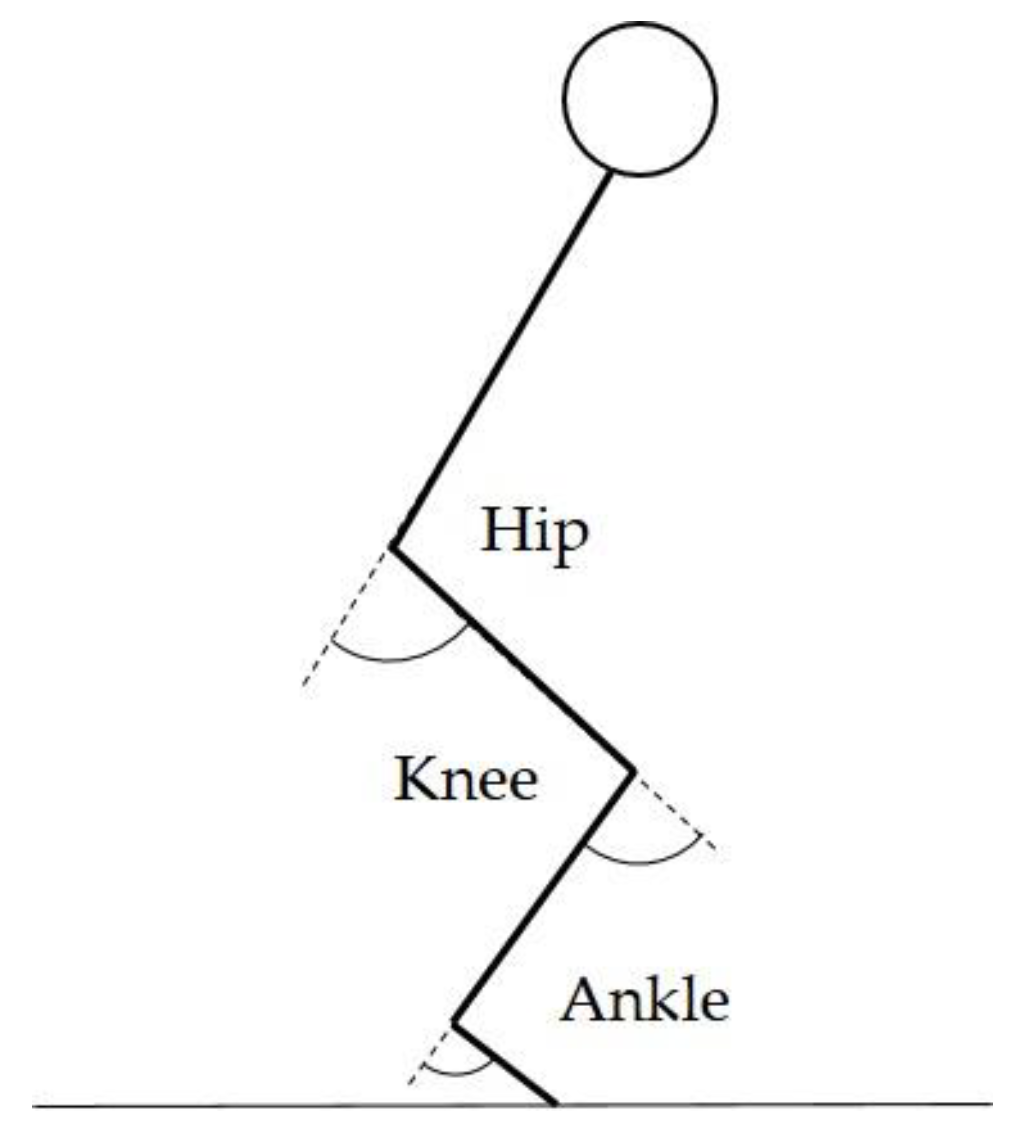
2.3. Data Collection and Analysis
2.4. Statistical Analysis
3. Results
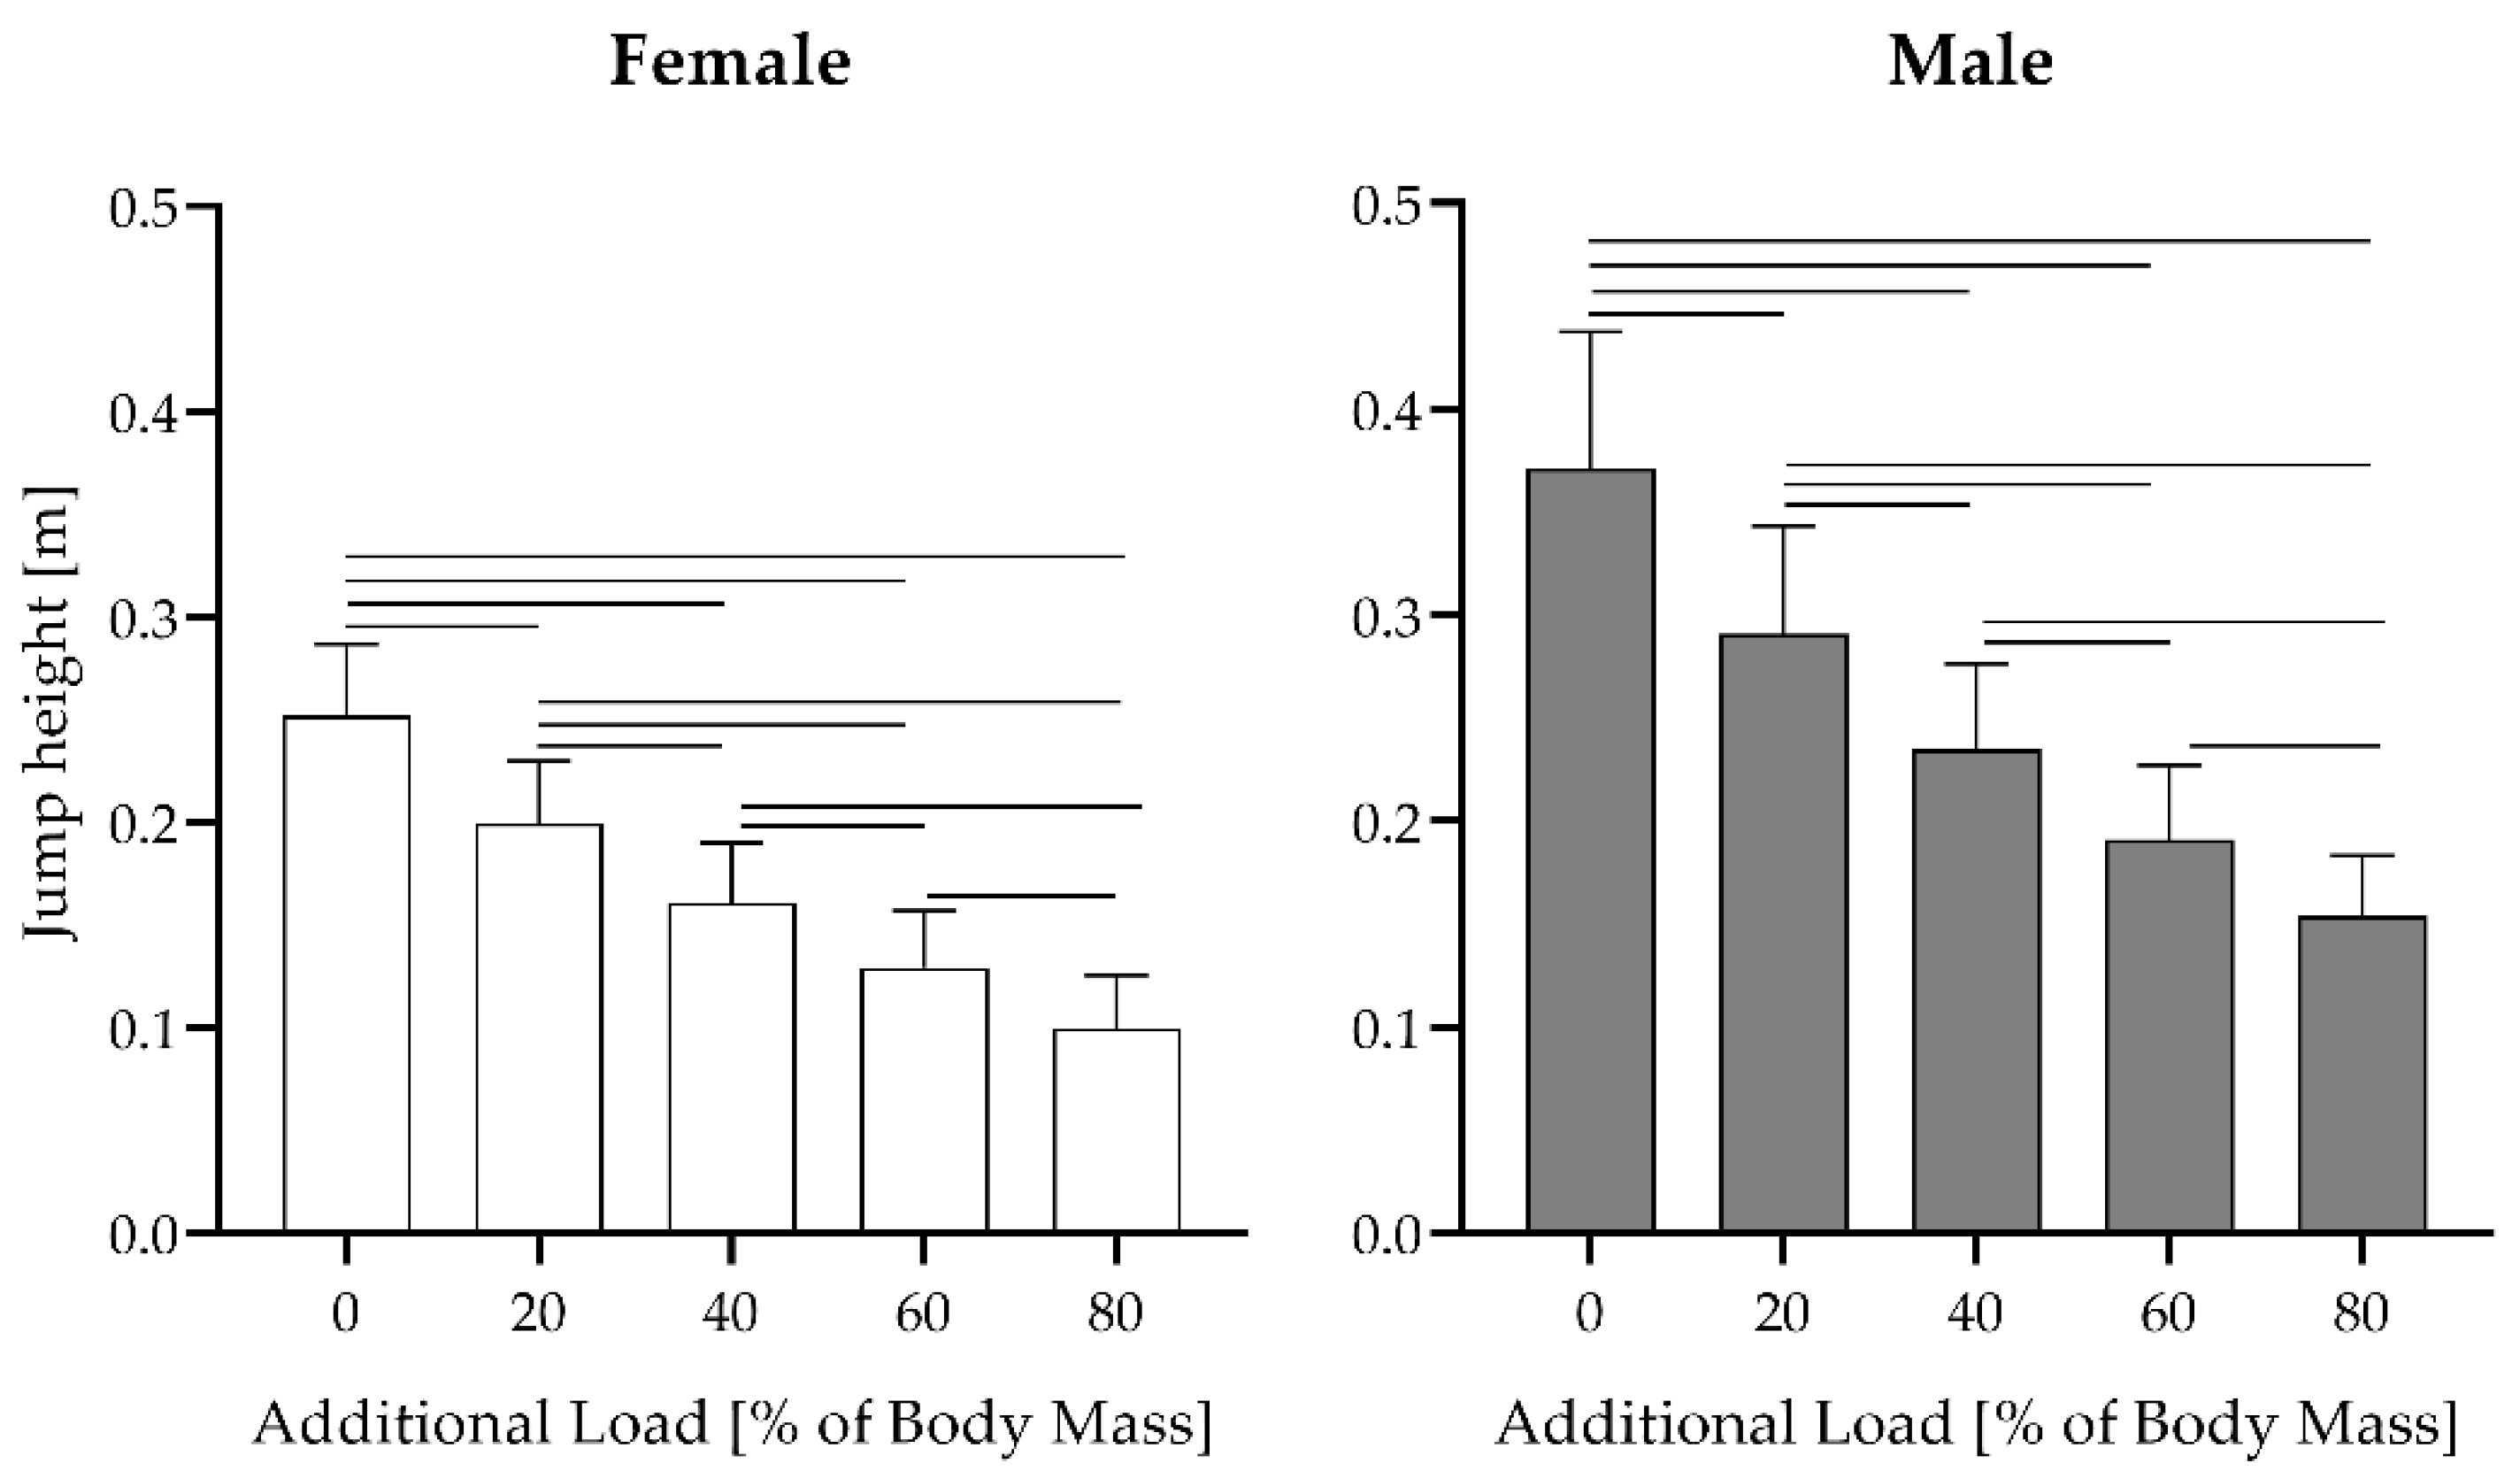
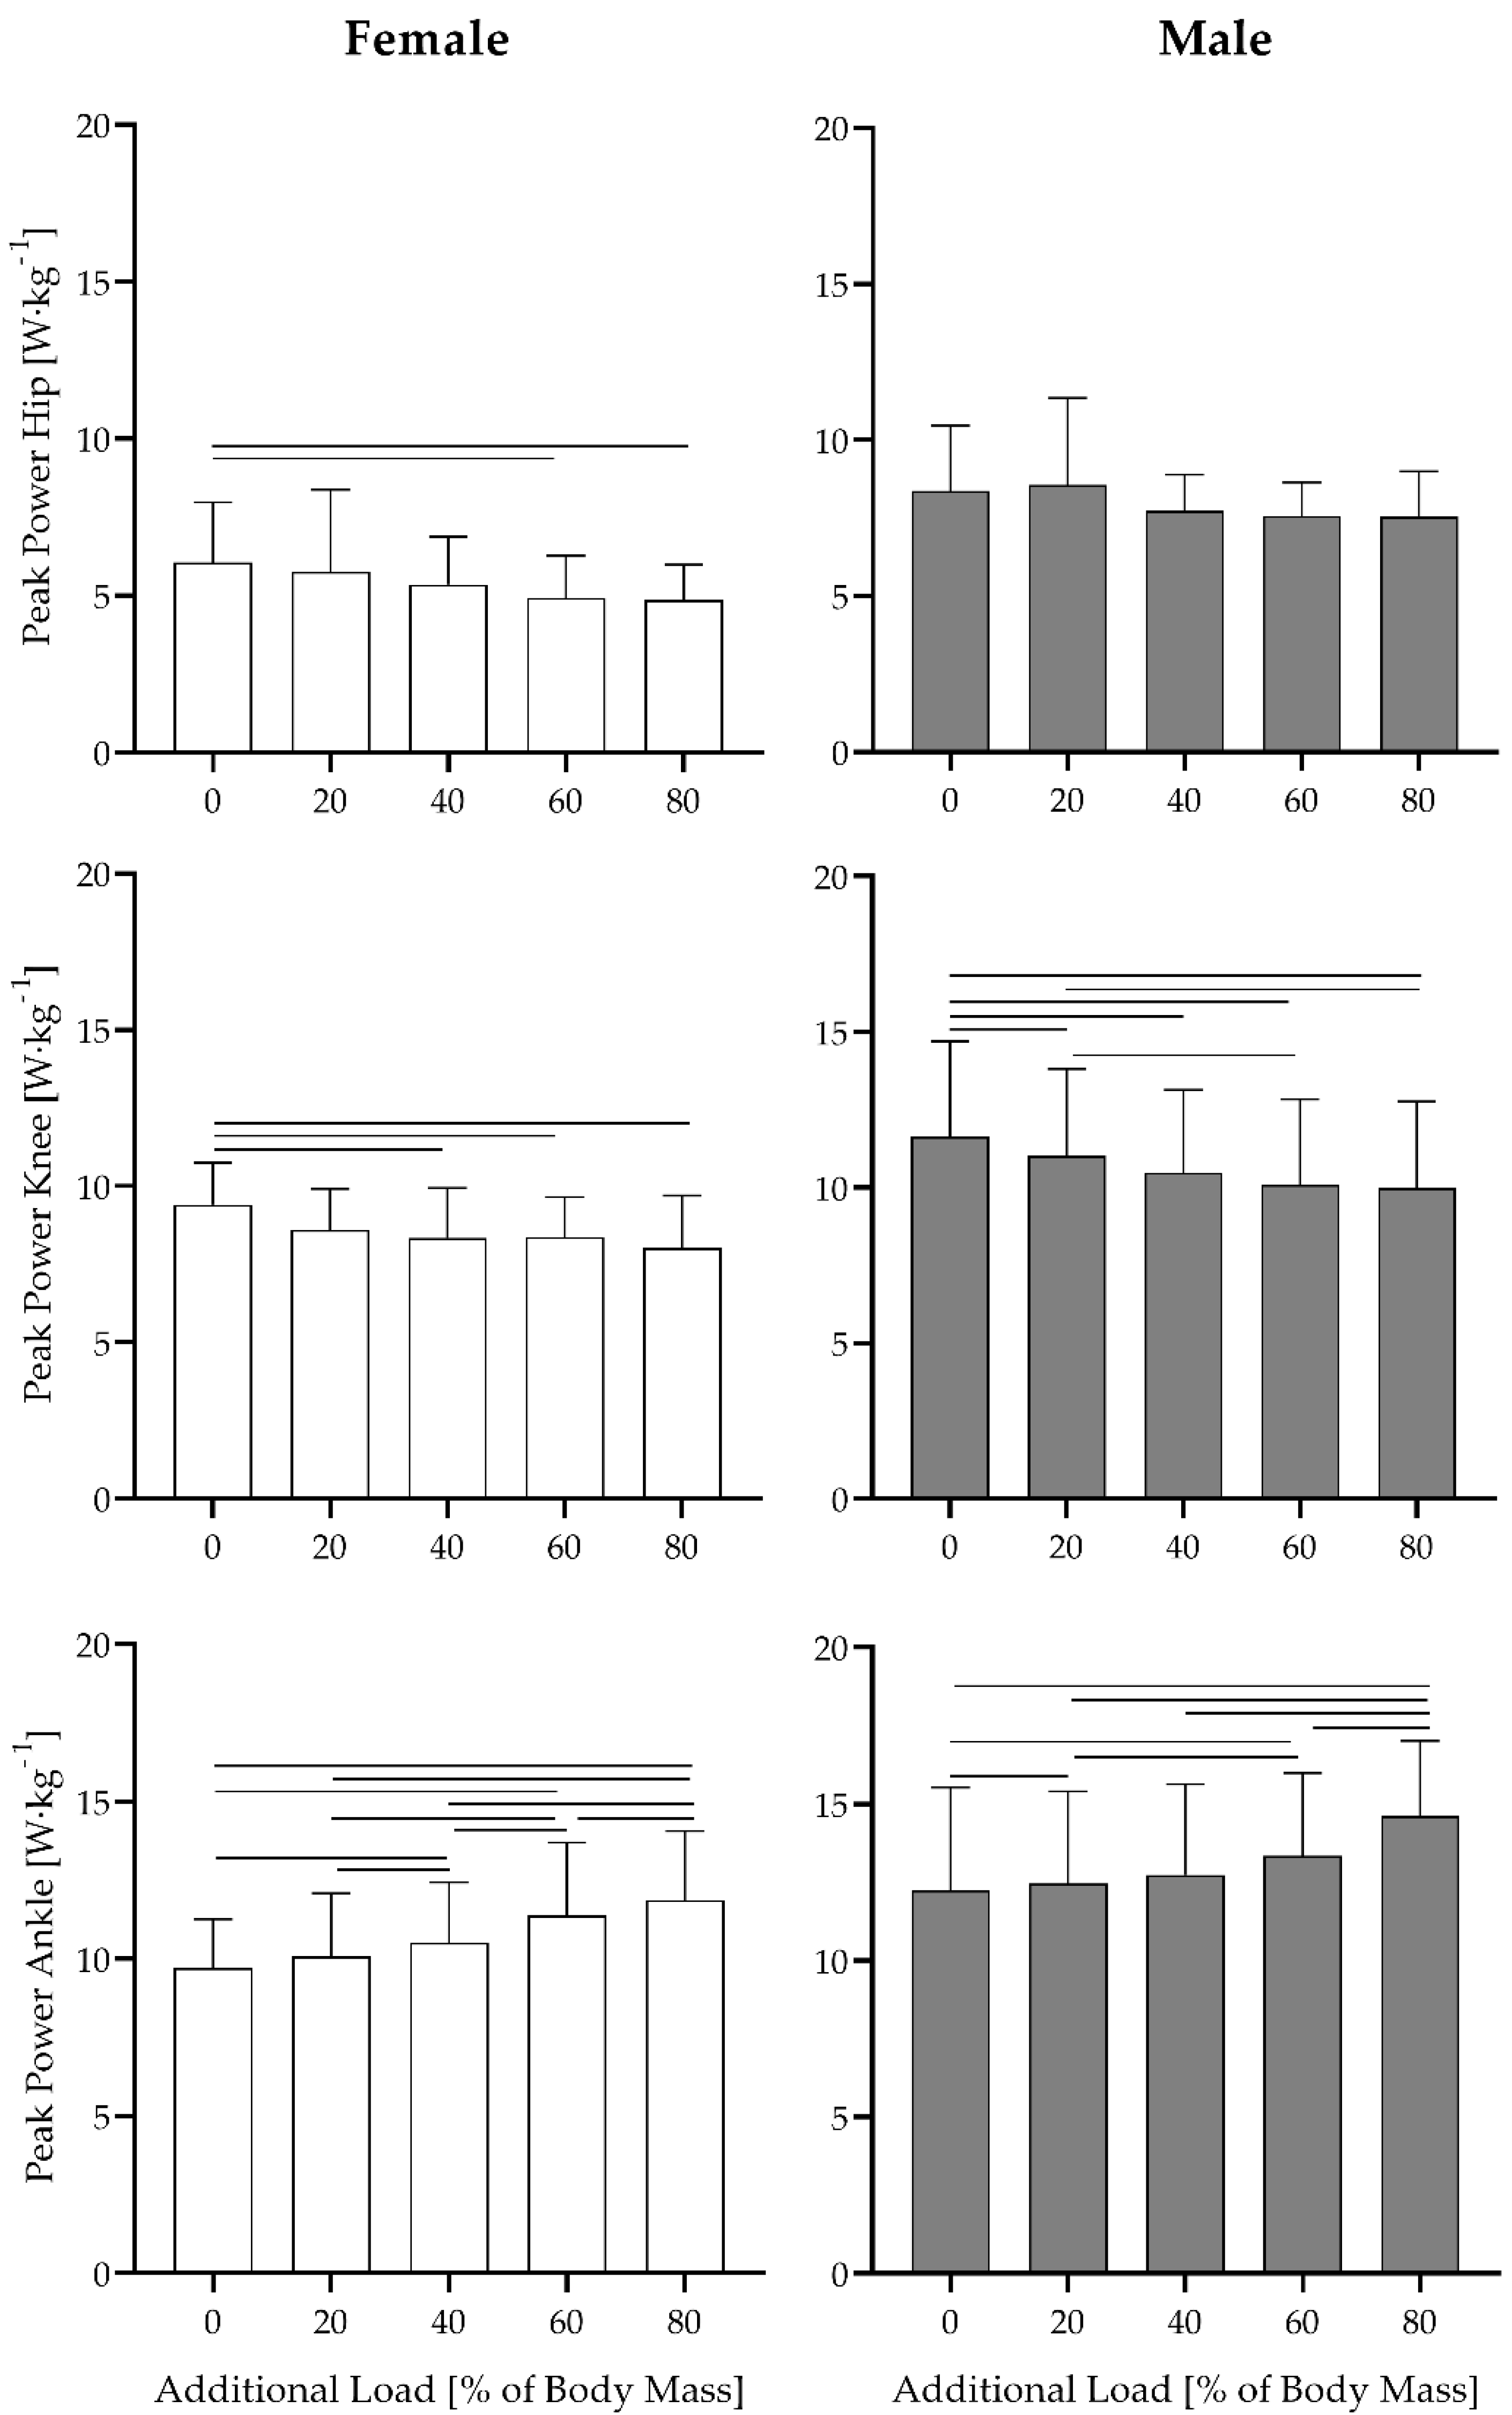
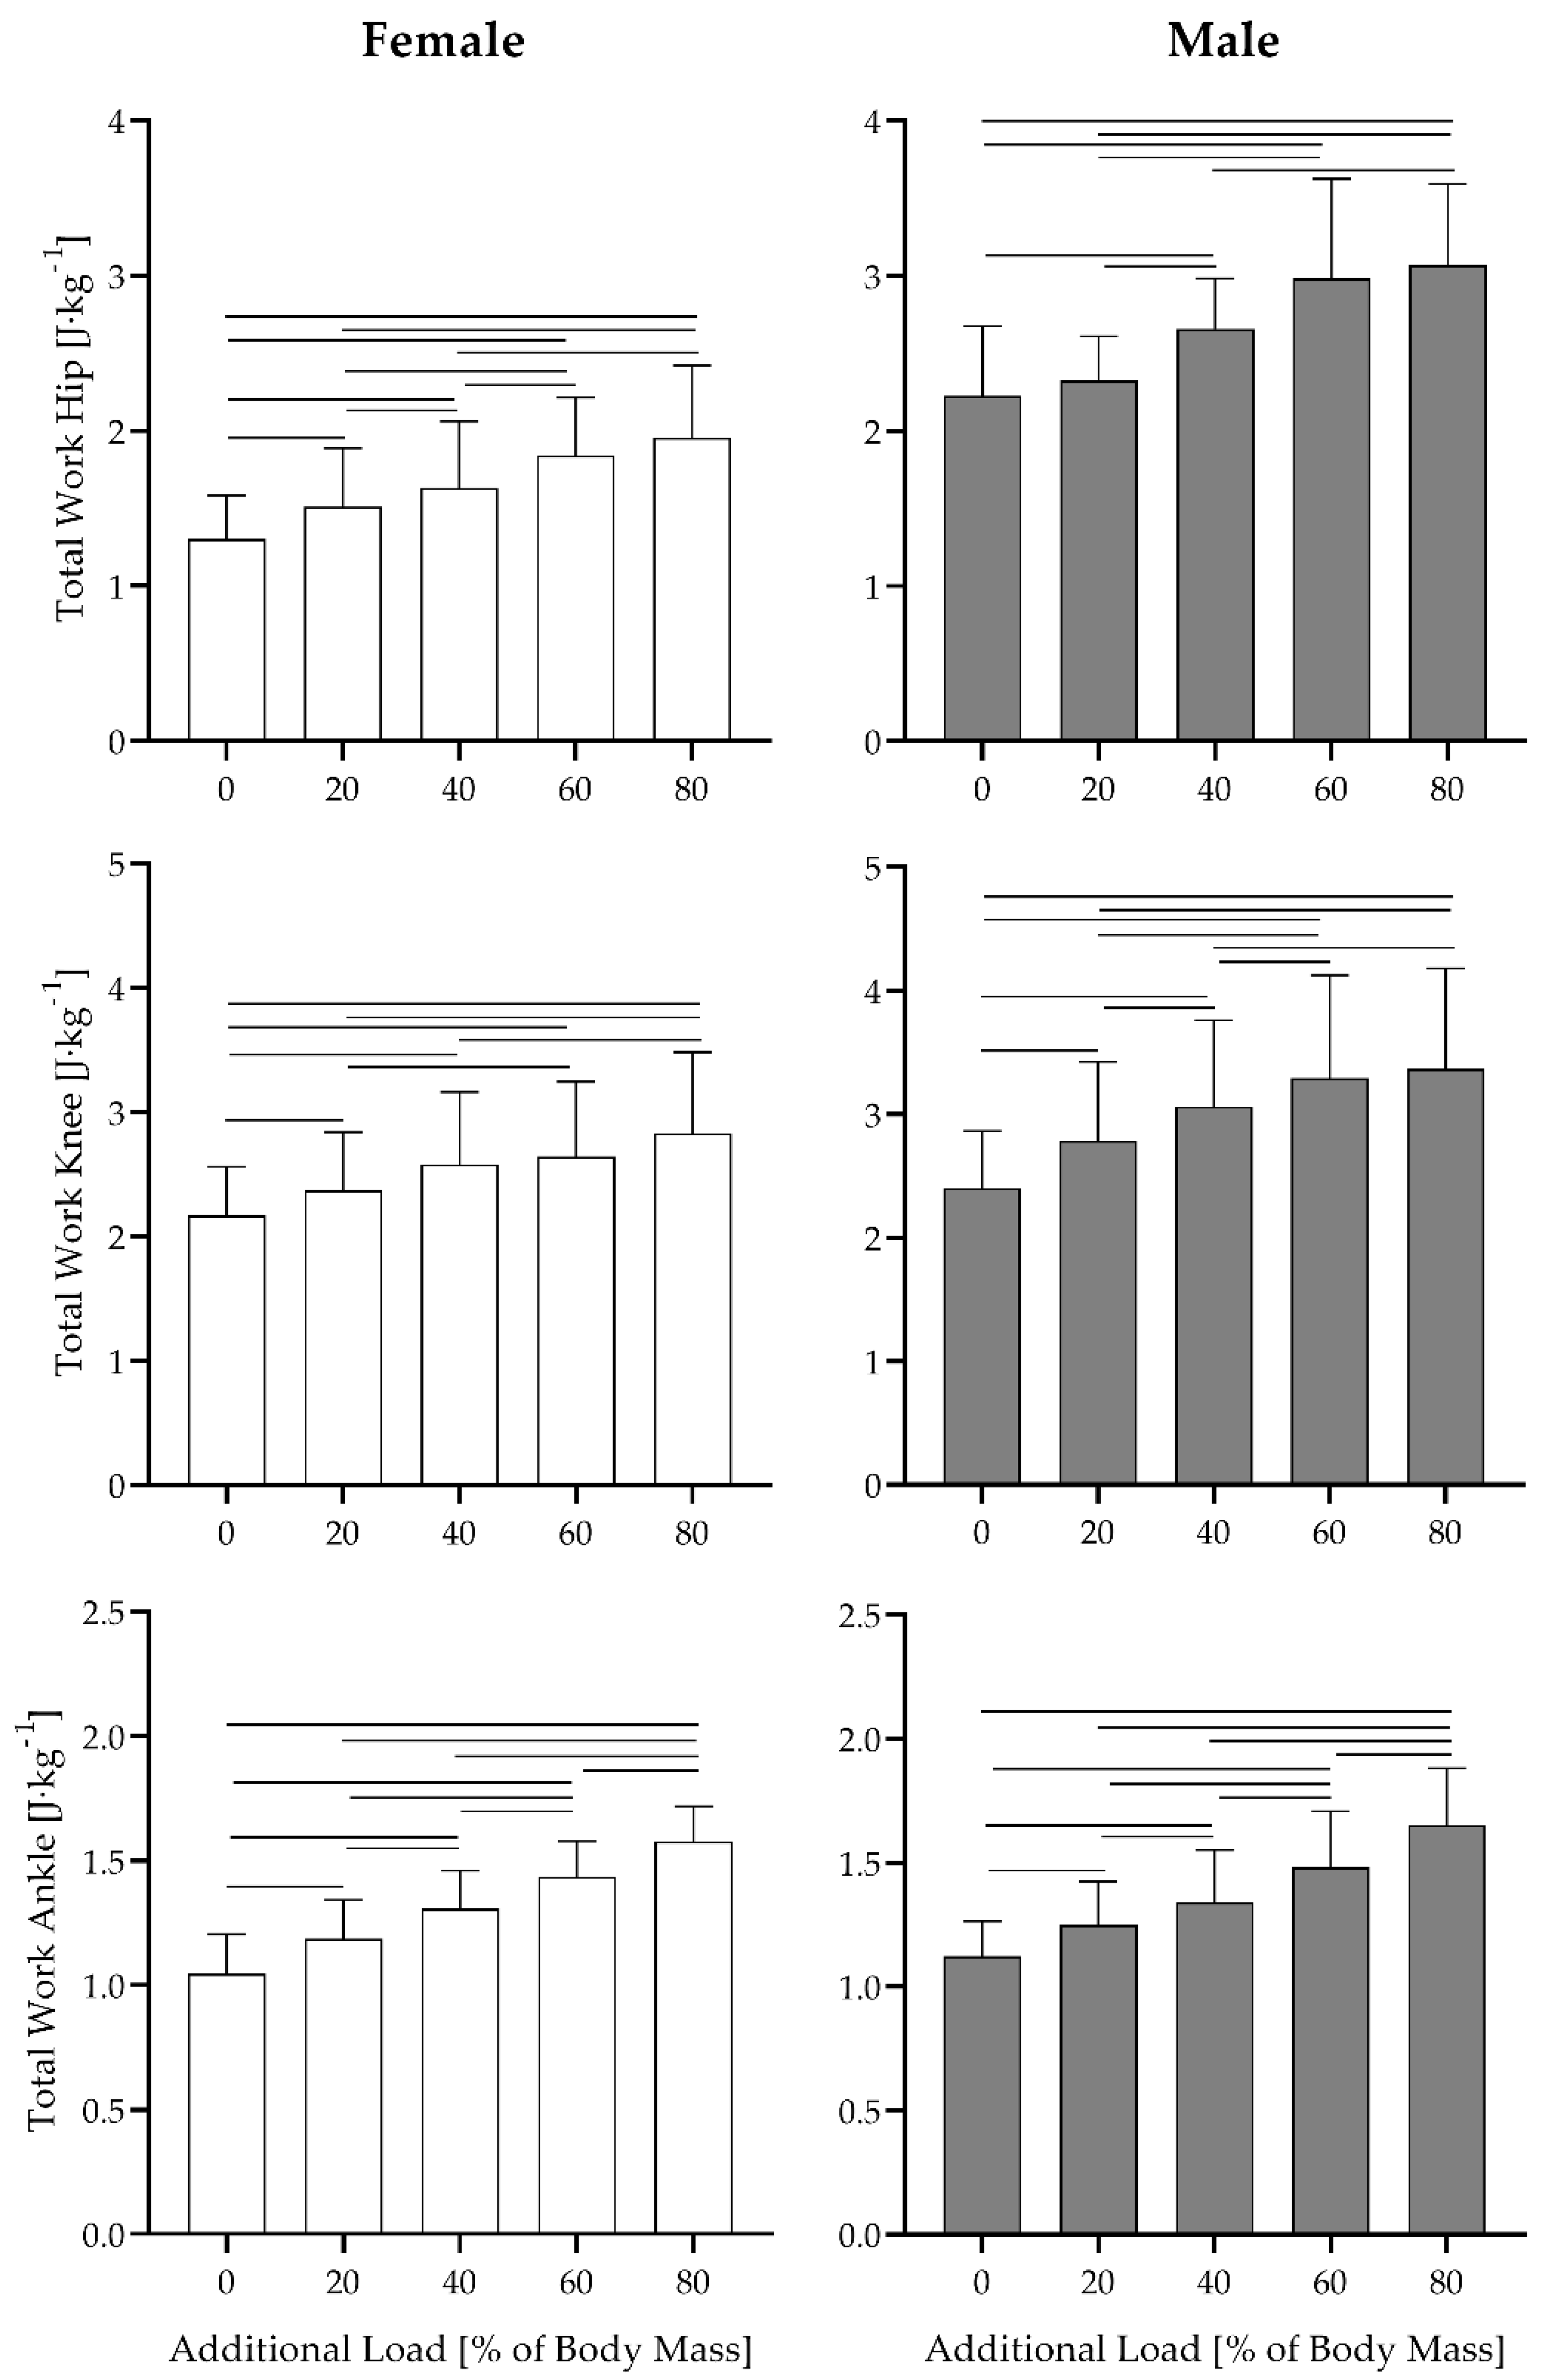
3.1. Load
3.2. Sex
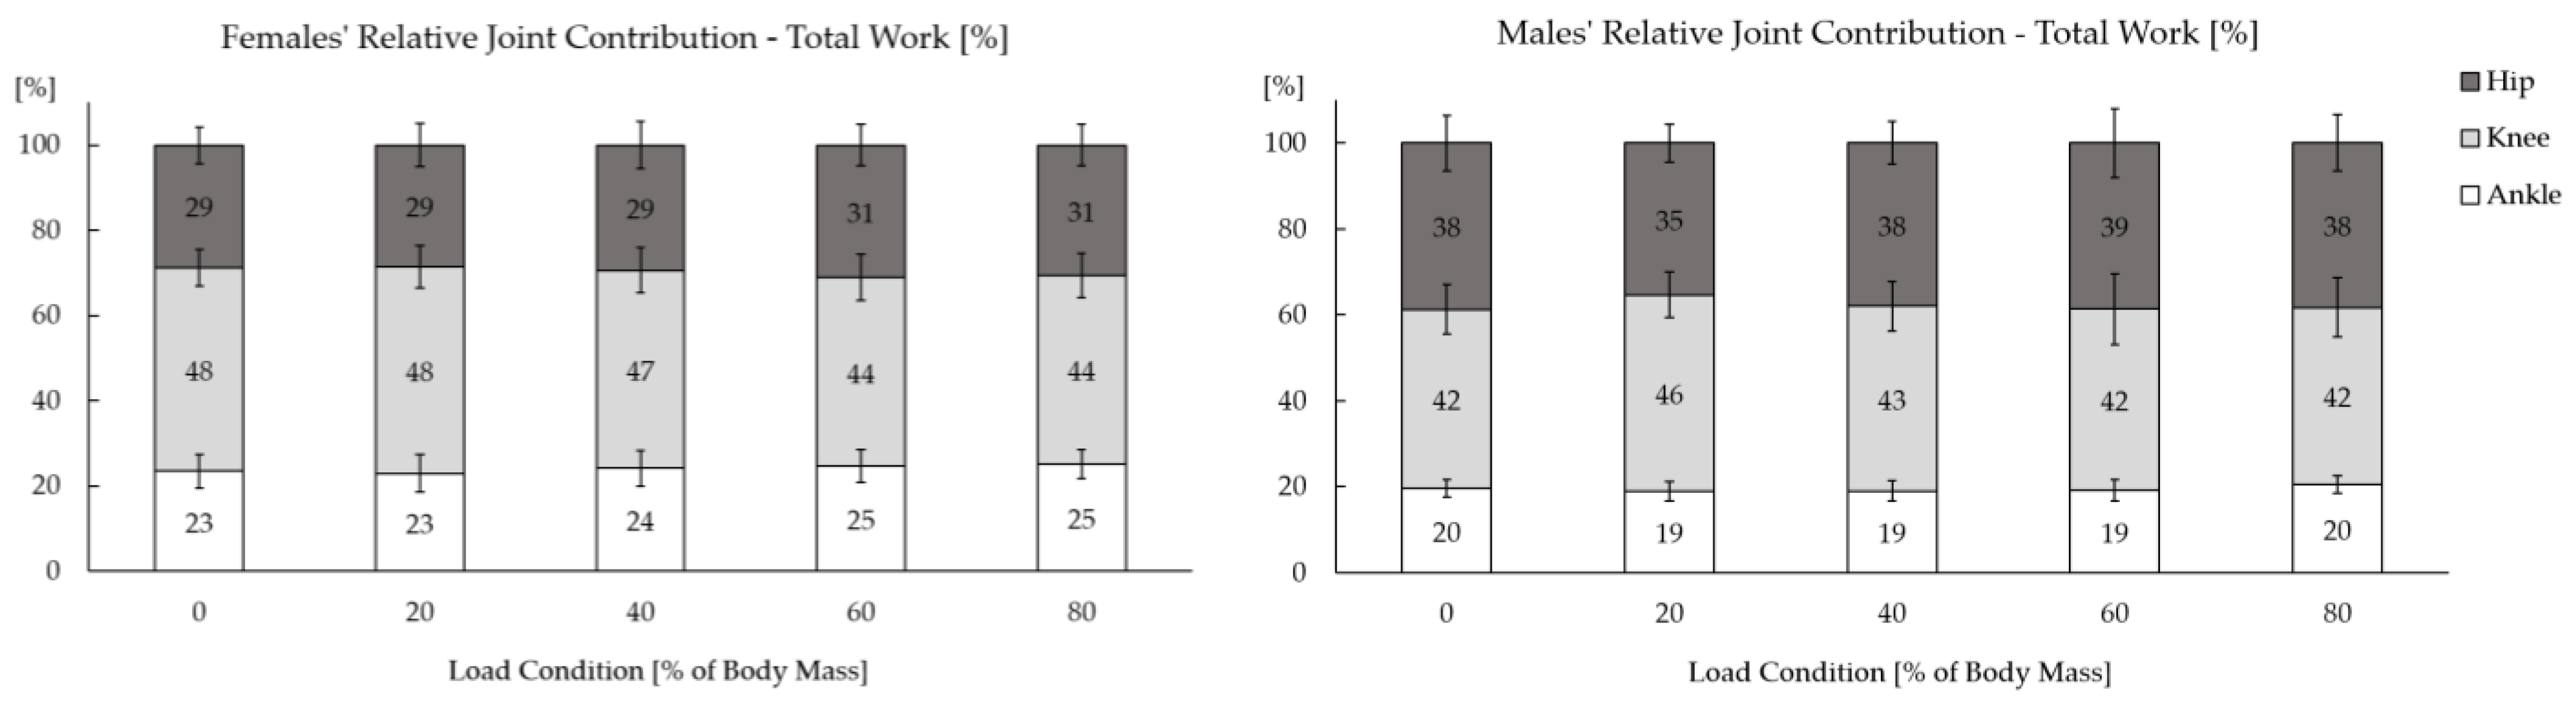
3.3. Joint Work Contribution (Relative Joint Contributions to Total Work)
4. Discussion
4.1. Load
4.2. Sex
4.3. Joint Work Contribution
4.4. Limitations
5. Conclusions
Author Contributions
Funding
Institutional Review Board Statement
Informed Consent Statement
Data Availability Statement
Acknowledgments
Conflicts of Interest
Appendix A

| Parameter | p-Values—Load Condition Pairs (% of Body Mass) | |||||||||
|---|---|---|---|---|---|---|---|---|---|---|
| Female | 0:20 | 0:40 | 0:60 | 0:80 | 20:40 | 20:60 | 20:80 | 40:60 | 40:80 | 60:80 |
| Jump height | 0.000 | 0.000 | 0.000 | 0.000 | 0.000 | 0.000 | 0.000 | 0.000 | 0.000 | 0.000 |
| Peak power ankle | 0.298 | 0.019 | 0.001 | 0.000 | 0.024 | 0.000 | 0.000 | 0.003 | 0.000 | 0.022 |
| Peak power knee | 0.066 | 0.039 | 0.031 | 0.027 | 0.466 | 0.490 | 0.203 | 0.911 | 0.304 | 0.122 |
| Peak power hip | 0.548 | 0.251 | 0.033 | 0.032 | 0.592 | 0.248 | 0.177 | 0.170 | 0.108 | 0.807 |
| Total work ankle | 0.000 | 0.000 | 0.000 | 0.000 | 0.002 | 0.000 | 0.000 | 0.001 | 0.000 | 0.000 |
| Total work knee | 0.022 | 0.002 | 0.001 | 0.001 | 0.091 | 0.022 | 0.013 | 0.530 | 0.009 | 0.072 |
| Total work hip | 0.005 | 0.001 | 0.000 | 0.000 | 0.014 | 0.001 | 0.003 | 0.001 | 0.003 | 0.270 |
| Male | ||||||||||
| Jump height | 0.000 | 0.000 | 0.000 | 0.000 | 0.000 | 0.000 | 0.000 | 0.000 | 0.000 | 0.000 |
| Peak power ankle | 0.616 | 0.346 | 0.035 | 0.002 | 0.275 | 0.019 | 0.000 | 0.057 | 0.001 | 0.003 |
| Peak power knee | 0.041 | 0.003 | 0.007 | 0.000 | 0.068 | 0.004 | 0.005 | 0.291 | 0.069 | 0.717 |
| Peak power hip | 0.732 | 0.111 | 0.093 | 0.115 | 0.206 | 0.155 | 0.162 | 0.515 | 0.520 | 0.933 |
| Total work ankle | 0.005 | 0.000 | 0.000 | 0.000 | 0.000 | 0.000 | 0.000 | 0.001 | 0.000 | 0.000 |
| Total work knee | 0.002 | 0.000 | 0.000 | 0.000 | 0.001 | 0.000 | 0.001 | 0.042 | 0.040 | 0.495 |
| Total work hip | 0.281 | 0.001 | 0.000 | 0.000 | 0.001 | 0.000 | 0.000 | 0.057 | 0.002 | 0.428 |
| Joint | Load Condition (% of Body Mass) | ||||
|---|---|---|---|---|---|
| Female | 0% | 20% | 40% | 60% | 80% |
| Hip (°) | 95.0 ± 8.6 | 91.9 ± 10.4 | 89.2 ± 10.5 | 88.0 ± 9.9 | 84.1 ± 9.6 |
| Knee (°) | 98.6 ± 10.3 | 96.8 ± 11.8 | 95.1 ± 10.5 | 94.2 ± 10.5 | 89.6 ± 9.6 |
| Ankle (°) | 101.7 ± 4.0 | 100.5 ± 4.1 | 99.8 ± 4.5 | 99.1 ± 4.6 | 97.7 ± 4.1 |
| Male | |||||
| Hip (°) | 102.7 ± 5.0 | 99.4 ± 5.3 | 98.8 ± 4.9 | 97.2 ± 6.6 | 92.5 ± 6.0 |
| Knee (°) | 101.0 ± 7.6 | 103.0 ± 7.2 | 103.6 ± 6.6 | 102.0 ± 6.1 | 99.2 ± 7.0 |
| Ankle (°) | 96.5 ± 5.4 | 96.6 ± 6.0 | 96.1 ± 5.4 | 95.6 ± 5.7 | 95.7 ± 5.6 |
References
- Vaverka, F.; Jakubsova, Z.; Jandacka, D.; Zahradnik, D.; Farana, R.; Uchytil, J.; Supej, M.; Vodicar, J. The Influence of an Additional Load on Time and Force Changes in the Ground Reaction Force During the Countermovement Vertical Jump. J. Hum. Kinet. 2013, 38, 191–200. [Google Scholar] [CrossRef] [PubMed] [Green Version]
- McMahon, J.J.; Lake, J.P.; Suchomel, T.J. Vertical Jump Testing. In Performance Assessment in Strength and Conditioning; Routledge: New York, NY, USA, 2018; pp. 96–116. ISBN 1315222817. [Google Scholar]
- McGuigan, M. Monitoring Training and Performance in Athletes; Human Kinetics: Champain, IL, USA, 2017; ISBN 1492535206. [Google Scholar]
- Sleivert, G.; Taingahue, M. The Relationship between Maximal Jump-Squat Power and Sprint Acceleration in Athletes. Eur. J. Appl. Physiol. 2004, 91, 46–52. [Google Scholar] [CrossRef] [PubMed]
- Kraemer, W.J.; Newton, R.U. Training for Muscular Power. Phys. Med. Rehabil. Clin. N. Am. 2000, 11, 341–368. [Google Scholar] [CrossRef]
- Oranchuk, D.J.; Robinson, T.L.; Switaj, Z.J.; Drinkwater, E.J. Comparison of the Hang High Pull and Loaded Jump Squat for the Development of Vertical Jump and Isometric Force-Time Characteristics. J. Strength Cond. Res. 2019, 33, 17–24. [Google Scholar] [CrossRef] [PubMed]
- Ashley, C.D.; Weiss, L.W. Vertical Jump Performance and Selected Physiological Characteristics of Women. J. Strength Cond. Res. 1994, 8, 5–11. [Google Scholar] [CrossRef]
- Nuzzo, J.L.; McBride, J.M.; Cormie, P.; McCaulley, G.O. Relationship between Countermovement Jump Performance and Multijoint Isometric and Dynamic Tests of Strength. J. Strength Cond. Res. 2008, 22, 699–707. [Google Scholar] [CrossRef]
- Sheppard, J.M.; Cronin, J.B.; Gabbett, T.J.; McGuigan, M.R.; Etxebarria, N.; Newton, R.U. Relative Importance of Strength, Power, and Anthropometric Measures to Jump Performance of Elite Volleyball Players. J. Strength Cond. Res. 2008, 22, 758–765. [Google Scholar] [CrossRef] [Green Version]
- Wisløff, U.; Castagna, C.; Helgerud, J.; Jones, R.; Hoff, J. Strong Correlation of Maximal Squat Strength with Sprint Performance and Vertical Jump Height in Elite Soccer Players. Br. J. Sports Med. 2004, 38, 285–288. [Google Scholar] [CrossRef] [Green Version]
- Fukashiro, S.; Komi, P.V. Joint Moment and Mechanical Power Flow of the Lower Limb During Vertical Jump. Int. J. Sports Med. 1987, 8, 15–21. [Google Scholar] [CrossRef]
- McErlain-Naylor, S.; King, M.; Pain, M.T.G. Determinants of Countermovement Jump Performance: A Kinetic and Kinematic Analysis. J. Sports Sci. 2014, 32, 1805–1812. [Google Scholar] [CrossRef] [Green Version]
- Samozino, P.; Rejc, E.; Di Prampero, P.E.; Belli, A.; Morin, J.B. Optimal Force-Velocity Profile in Ballistic Movements—Altius: Citius or Fortius? Med. Sci. Sports Exerc. 2012, 44, 313–322. [Google Scholar] [CrossRef] [PubMed]
- Mundy, P.D.; Smith, N.A.; Lauder, M.A.; Lake, J.P. The Effects of Barbell Load on Countermovement Vertical Jump Power and Net Impulse. J. Sports Sci. 2017, 35, 1781–1787. [Google Scholar] [CrossRef] [PubMed]
- Fain, A.C.; Seymore, K.D.; Lobb, N.J.; Brown, T.N. Lower-Limb Biomechanics Differ between Sexes During Maximal Loaded Countermovement Jumps. J. Strength Cond. Res. 2021, 35, 325–331. [Google Scholar] [CrossRef] [PubMed]
- Feeney, D.; Stanhope, S.J.; Kaminski, T.W.; Machi, A.; Jaric, S. Loaded Vertical Jumping: Force-Velocity Relationship, Work, and Power. J. Appl. Biomech. 2016, 32, 120–127. [Google Scholar] [CrossRef] [PubMed]
- Harry, J.R.; Barker, L.A.; Paquette, M.R. Sex and Acute Weighted Vest Differences in Force Production and Joint Work During Countermovement Vertical Jumping. J. Sports Sci. 2019, 37, 1318–1326. [Google Scholar] [CrossRef] [PubMed]
- Jandacka, D.; Uchytil, J.; Farana, R.; Zahradnik, D.; Hamill, J. Lower Extremity Power During the Squat Jump with Various Barbell Loads. Sports Biomech. 2014, 13, 75–86. [Google Scholar] [CrossRef]
- Moir, G.L.; Gollie, J.M.; Davis, S.E.; Guers, J.J.; Witmer, C.A. The Effects of Load on System and Lower-Body Joint Kinetics During Jump Squats. Sports Biomech. 2012, 11, 492–506. [Google Scholar] [CrossRef]
- Williams, K.J.; Chapman, D.W.; Phillips, E.J.; Ball, N.B. Load-Power Relationship During a Countermovement Jump: A Joint Level Analysis. J. Strength Cond. Res. 2018, 32, 955–961. [Google Scholar] [CrossRef]
- Swinton, P.A.; Stewart, A.; Agouris, I.; Keogh, J.W.; Lloyd, R. A Biomechanical Analysis of Straight and Hexagonal Barbell Deadlifts Using Submaximal Loads. J. Strength Cond. Res. 2011, 25, 2000–2009. [Google Scholar] [CrossRef]
- Cowley, E.S.; Olenick, A.A.; McNulty, K.L.; Ross, E.Z. “Invisible Sportswomen”: The Sex Data Gap in Sport and Exercise Science Research. Women Sport Phys. Act. J. 2021, 29, 146–151. [Google Scholar] [CrossRef]
- Carmichael, M.A.; Thomson, R.L.; Moran, L.J.; Wycherley, T.P. The Impact of Menstrual Cycle Phase on Athletes’ Performance: A Narrative Review. Int. J. Environ. Res. Public Health 2021, 18, 1667. [Google Scholar] [CrossRef] [PubMed]
- Nimphius, S. Exercise and Sport Science Failing by Design in Understanding Female Athletes. Int. J. Sports Physiol. Perform 2019, 19, 1157–1158. [Google Scholar] [CrossRef] [PubMed] [Green Version]
- Mujika, I.; Taipale, R.S. Sport Science on Women, Women in Sport Science. Int. J. Sports Physiol. Perform 2019, 14, 1013–1014. [Google Scholar] [CrossRef] [PubMed] [Green Version]
- Janicijevic, D.; Knezevic, O.; Mirkov, D.; Pérez-Castilla, A.; Petrovic, M.; Samozino, P.; García-Ramos, A. Assessment of the Force-Velocity Relationship During Vertical Jumps: Influence of the Starting Position, Analysis Procedures and Number of Loads. Eur. J. Sport Sci. 2019, 20, 614–623. [Google Scholar] [CrossRef]
- Kibele, A. Possibilities and Limitations in the Biomechanical Analysis of Countermovement Jumps: A Methodological Study. J. Appl. Biomech. 1998, 14, 105–117. [Google Scholar] [CrossRef] [Green Version]
- Hanavan, E.P., Jr. A Mathmatical Mdoel of the Human Body. AMRL 1964, 1–149. Available online: https://cordis.europa.eu/article/id/181132-mathematical-modelling-of-the-human-body (accessed on 5 July 2022).
- Dempster, W.T. Space Requirements of the Seated Operator, Geometrical, Kinematic, and Mechanical Aspects of the Body with Special Reference to the Limbs. In Wright Air Development Center, Air Research and Development Command; Michigan State Univ. East Lansing: East Lansing, MI, USA, 1955. [Google Scholar]
- Cohen, J. Statistical Power Analysis for the Behavioral Sciences, 2nd ed.; Lawrence Erlbaum Associates: Hilldale, NY, USA, 1988; ISBN 1483276481. [Google Scholar]
- Bobbert, M.F.; Gerritsen, K.G.; Litjens, M.C.; Van Soest, A.J. Why Is Countermovement Jump Height Greater Than Squat Jump Height? Med. Sci. Sports Exerc. 1996, 28, 1402–1412. [Google Scholar] [CrossRef]
- Prilutsky, B.I.; Zatsiorsky, V.M. Tendon Action of Two-Joint Muscles: Transfer of Mechanical Energy between Joints during Jumping, Landing, and Running. J. Biomech. 1994, 27, 25–34. [Google Scholar] [CrossRef]
- Vanrenterghem, J.; Lees, A.; Clercq, D.D. Effect of Forward Trunk Inclination on Joint Power Output in Vertical Jumping. J. Strength Cond. Res. 2008, 22, 708–714. [Google Scholar] [CrossRef]
- Brotons-Gil, E.; García-Vaquero, M.P.; Peco-González, N.; Vera-Garcia, F.J. Flexion-Rotation Trunk Test to Assess Abdominal Muscle Endurance: Reliability, Learning Effect, and Sex Differences. J. Strength Cond. Res. 2013, 27, 1602–1608. [Google Scholar] [CrossRef]
- Farris, D.J.; Raiteri, B.J. Modulation of Leg Joint Function to Produce Emulated Acceleration During Walking and Running in Humans. R. Soc. Open Sci. 2017, 4, 160901. [Google Scholar] [CrossRef] [Green Version]
- Komi, P.V.; Bosco, C. Utilization of Stored Elastic Energy in Leg Extensor Muscles by Men and Women. Med. Sci. Sports 1978, 10, 261–265. [Google Scholar] [PubMed]
- McBride, J.M.; McCaulley, G.O.; Cormie, P. Influence of Preactivity and Eccentric Muscle Activity on Concentric Performance During Vertical Jumping. J. Strength Cond. Res. 2008, 22, 750–757. [Google Scholar] [CrossRef] [PubMed]
- Fritz, J.; Stallegger, J.; Fessl, I.; Schwameder, H.; Kröll, J. Jumping with Barbell Load: Assessment of Lower Limb Joint Kinematics and Kinetics During Landing. J. Biomech. 2021, 120, 110354. [Google Scholar] [CrossRef] [PubMed]
- Mayhew, J.; Salm, P.C. Gender Differences in Anaerobic Power Tests. Eur. J. Appl. Physiol. Occup. Physiol. 1990, 60, 133–138. [Google Scholar] [CrossRef]
- Fessl, I.; Wiesinger, H.-P.; Kröll, J. Power-Force-Velocity Profiling as a Function of Used Loads and Task Experience. Int. J. Sports Physiol. Perform 2022, 17, 694–700. [Google Scholar] [CrossRef]
- Samozino, P. A Simple Method for Measuring Lower Limb Force, Velocity and Power Capabilites During Jumping. In Biomechanics of Training and Testing; Morin, J., Samozino, P., Eds.; Springer Nature: Cham, Switzerland, 2018; pp. 65–96. [Google Scholar]


| Load | Sex | Load * Sex | ||||
|---|---|---|---|---|---|---|
| Parameter | p (F) | η2 | p (F) | η2 | p (F) | η2 |
| Jump height (m) | <0.001 * (631.0) | 0.965 | <0.001 * (28.5) | 0.553 | <0.001 * (20.6) | 0.472 |
| Peak power ankle (W·kg−1) | <0.001 * (27.0) | 0.539 | 0.020 * (6.3) | 0.215 | 0.527 (0.7) | 0.030 |
| Peak power knee (W·kg−1) | <0.001 * (11.7) | 0.336 | 0.022 * (6.1) | 0.208 | 0.616 (0.6) | 0.025 |
| Peak power hip (W·kg−1) | 0.028 * (3.8) | 0.142 | <0.001 * (20.2) | 0.467 | 0.846 (0.2) | 0.008 |
| Total work ankle (J·kg−1) | <0.001 * (153.0) | 0.869 | 0.387 (0.8) | 0.033 | 0.796 (0.3) | 0.014 |
| Total work knee (J·kg−1) | <0.001 * (33.1) | 0.590 | 0.060 (3.9) | 0.145 | 0.126 (2.0) | 0.081 |
| Total work (J·kg−1) | <0.001 * (43.5) | 0.654 | <0.001 * (45.3) | 0.663 | 0.098 (2.0) | 0.081 |
Publisher’s Note: MDPI stays neutral with regard to jurisdictional claims in published maps and institutional affiliations. |
© 2022 by the authors. Licensee MDPI, Basel, Switzerland. This article is an open access article distributed under the terms and conditions of the Creative Commons Attribution (CC BY) license (https://creativecommons.org/licenses/by/4.0/).
Share and Cite
Fessl, I.; Harbour, E.; Kröll, J.; Schwameder, H. Effect of Additional Loads on Joint Kinetics and Joint Work Contribution in Males and Females Performing Vertical Countermovement Jumps. Biomechanics 2022, 2, 319-330. https://doi.org/10.3390/biomechanics2030025
Fessl I, Harbour E, Kröll J, Schwameder H. Effect of Additional Loads on Joint Kinetics and Joint Work Contribution in Males and Females Performing Vertical Countermovement Jumps. Biomechanics. 2022; 2(3):319-330. https://doi.org/10.3390/biomechanics2030025
Chicago/Turabian StyleFessl, Isabella, Eric Harbour, Josef Kröll, and Hermann Schwameder. 2022. "Effect of Additional Loads on Joint Kinetics and Joint Work Contribution in Males and Females Performing Vertical Countermovement Jumps" Biomechanics 2, no. 3: 319-330. https://doi.org/10.3390/biomechanics2030025