1. Introduction
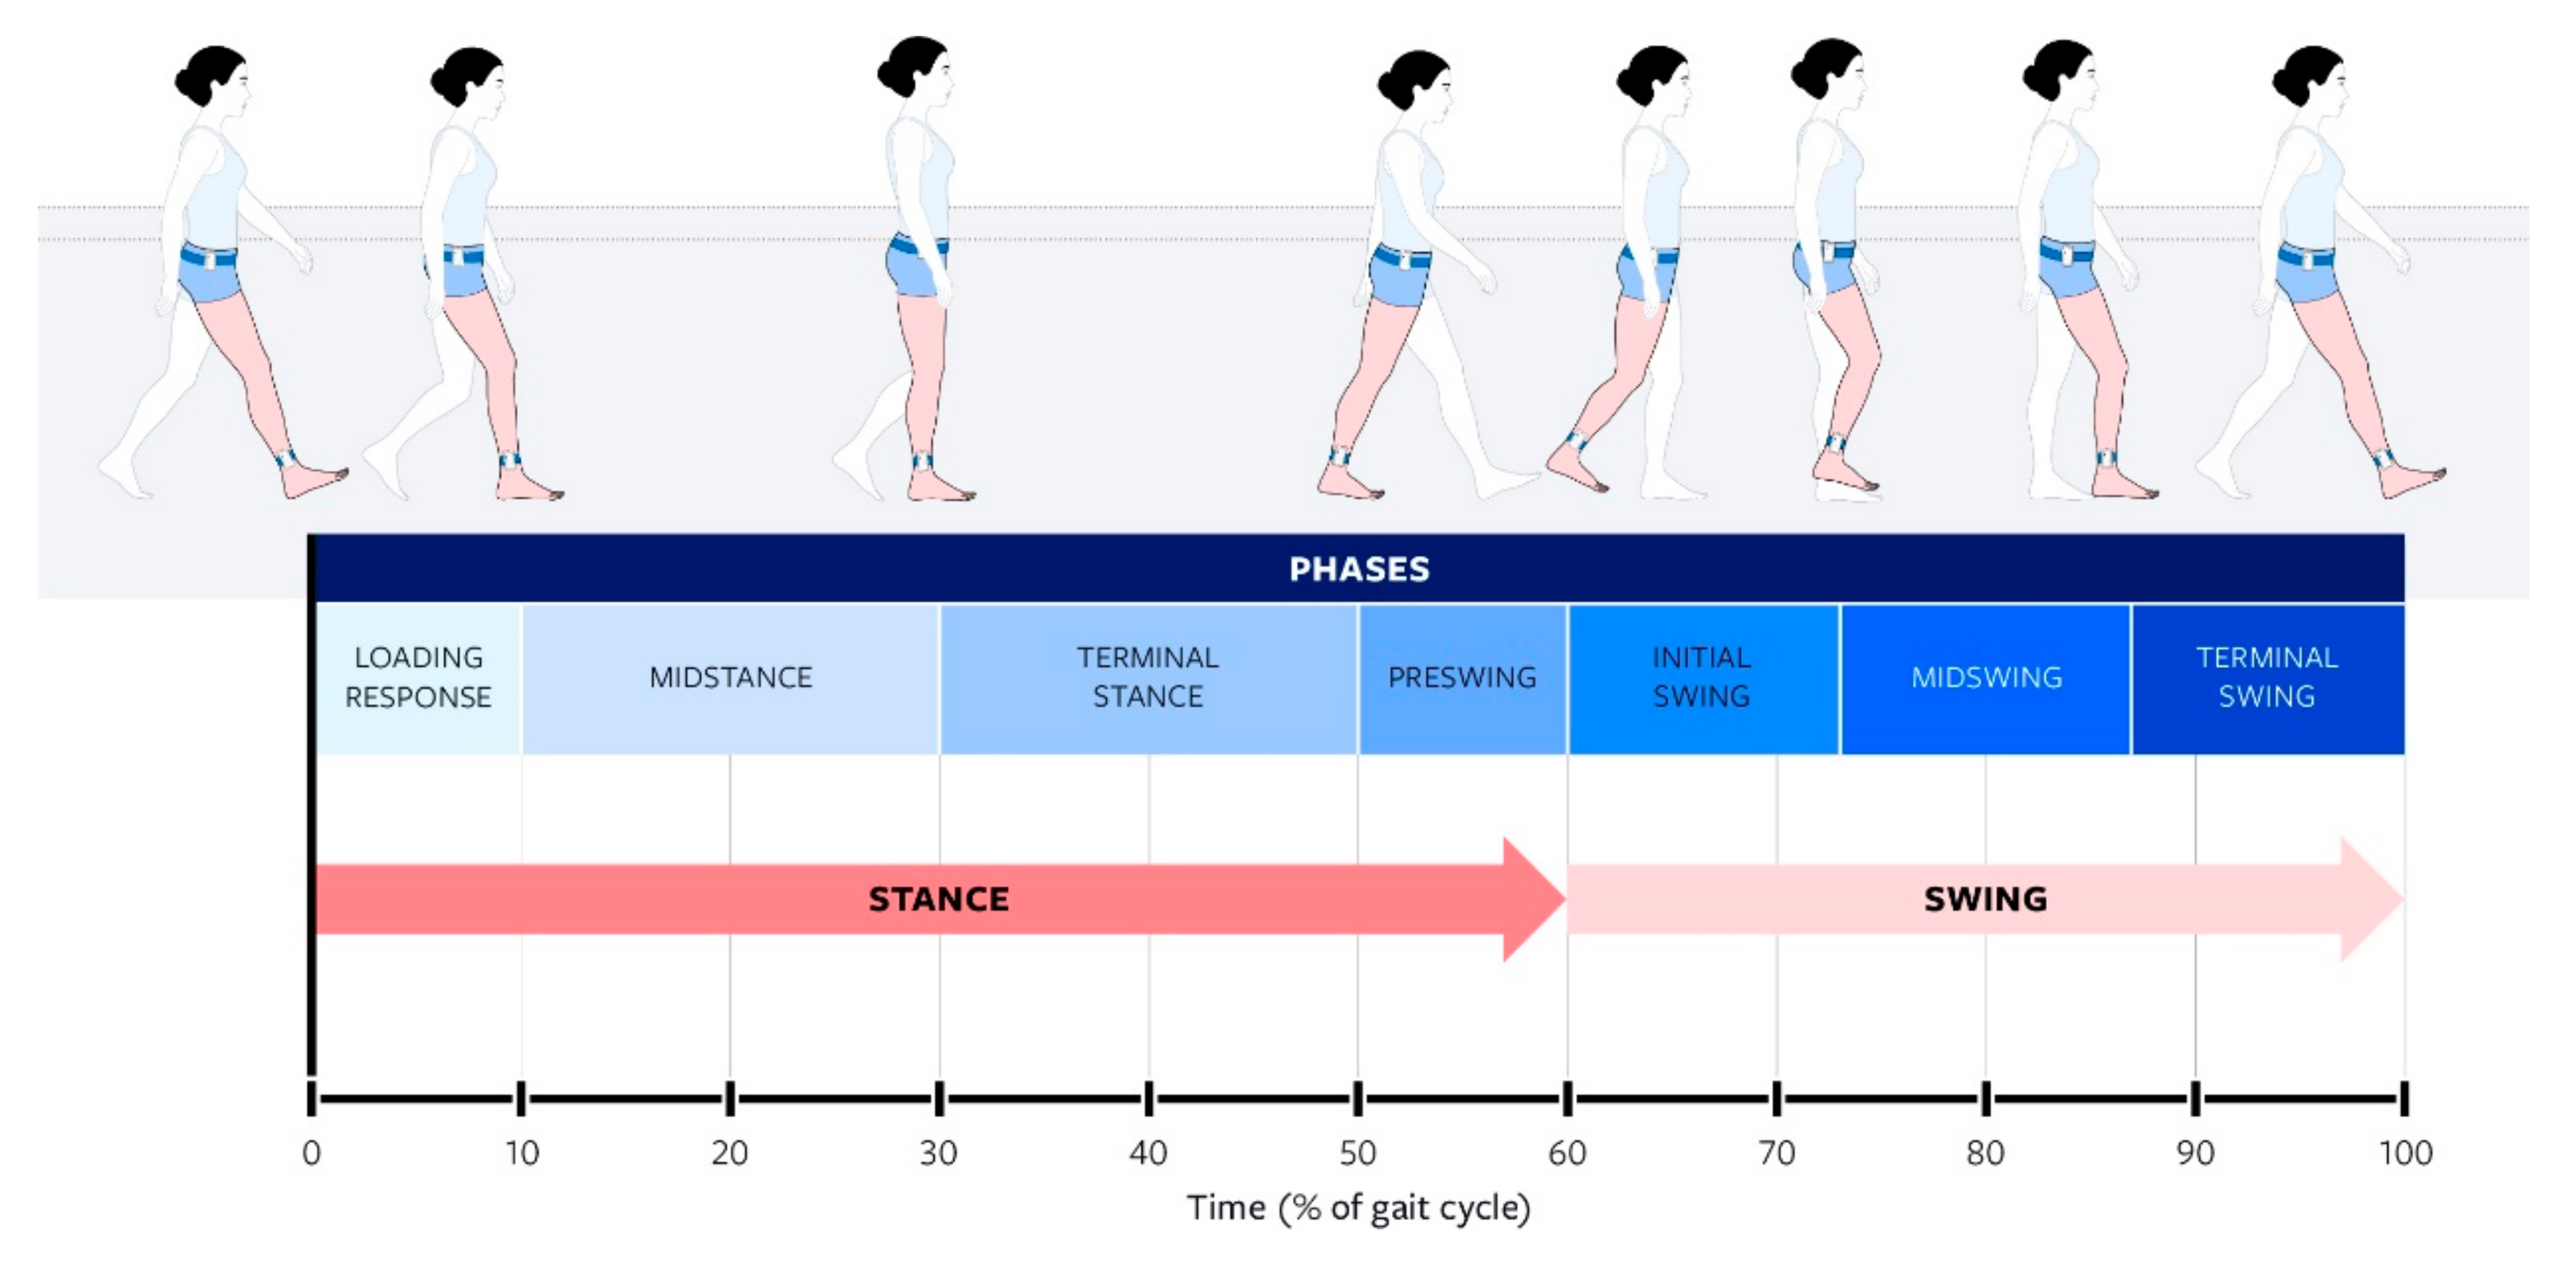
The study of ambulation is termed gait analysis. Human gait is measured via the gait cycle, which is broken down into stance and swing phases as shown in
Figure 1.
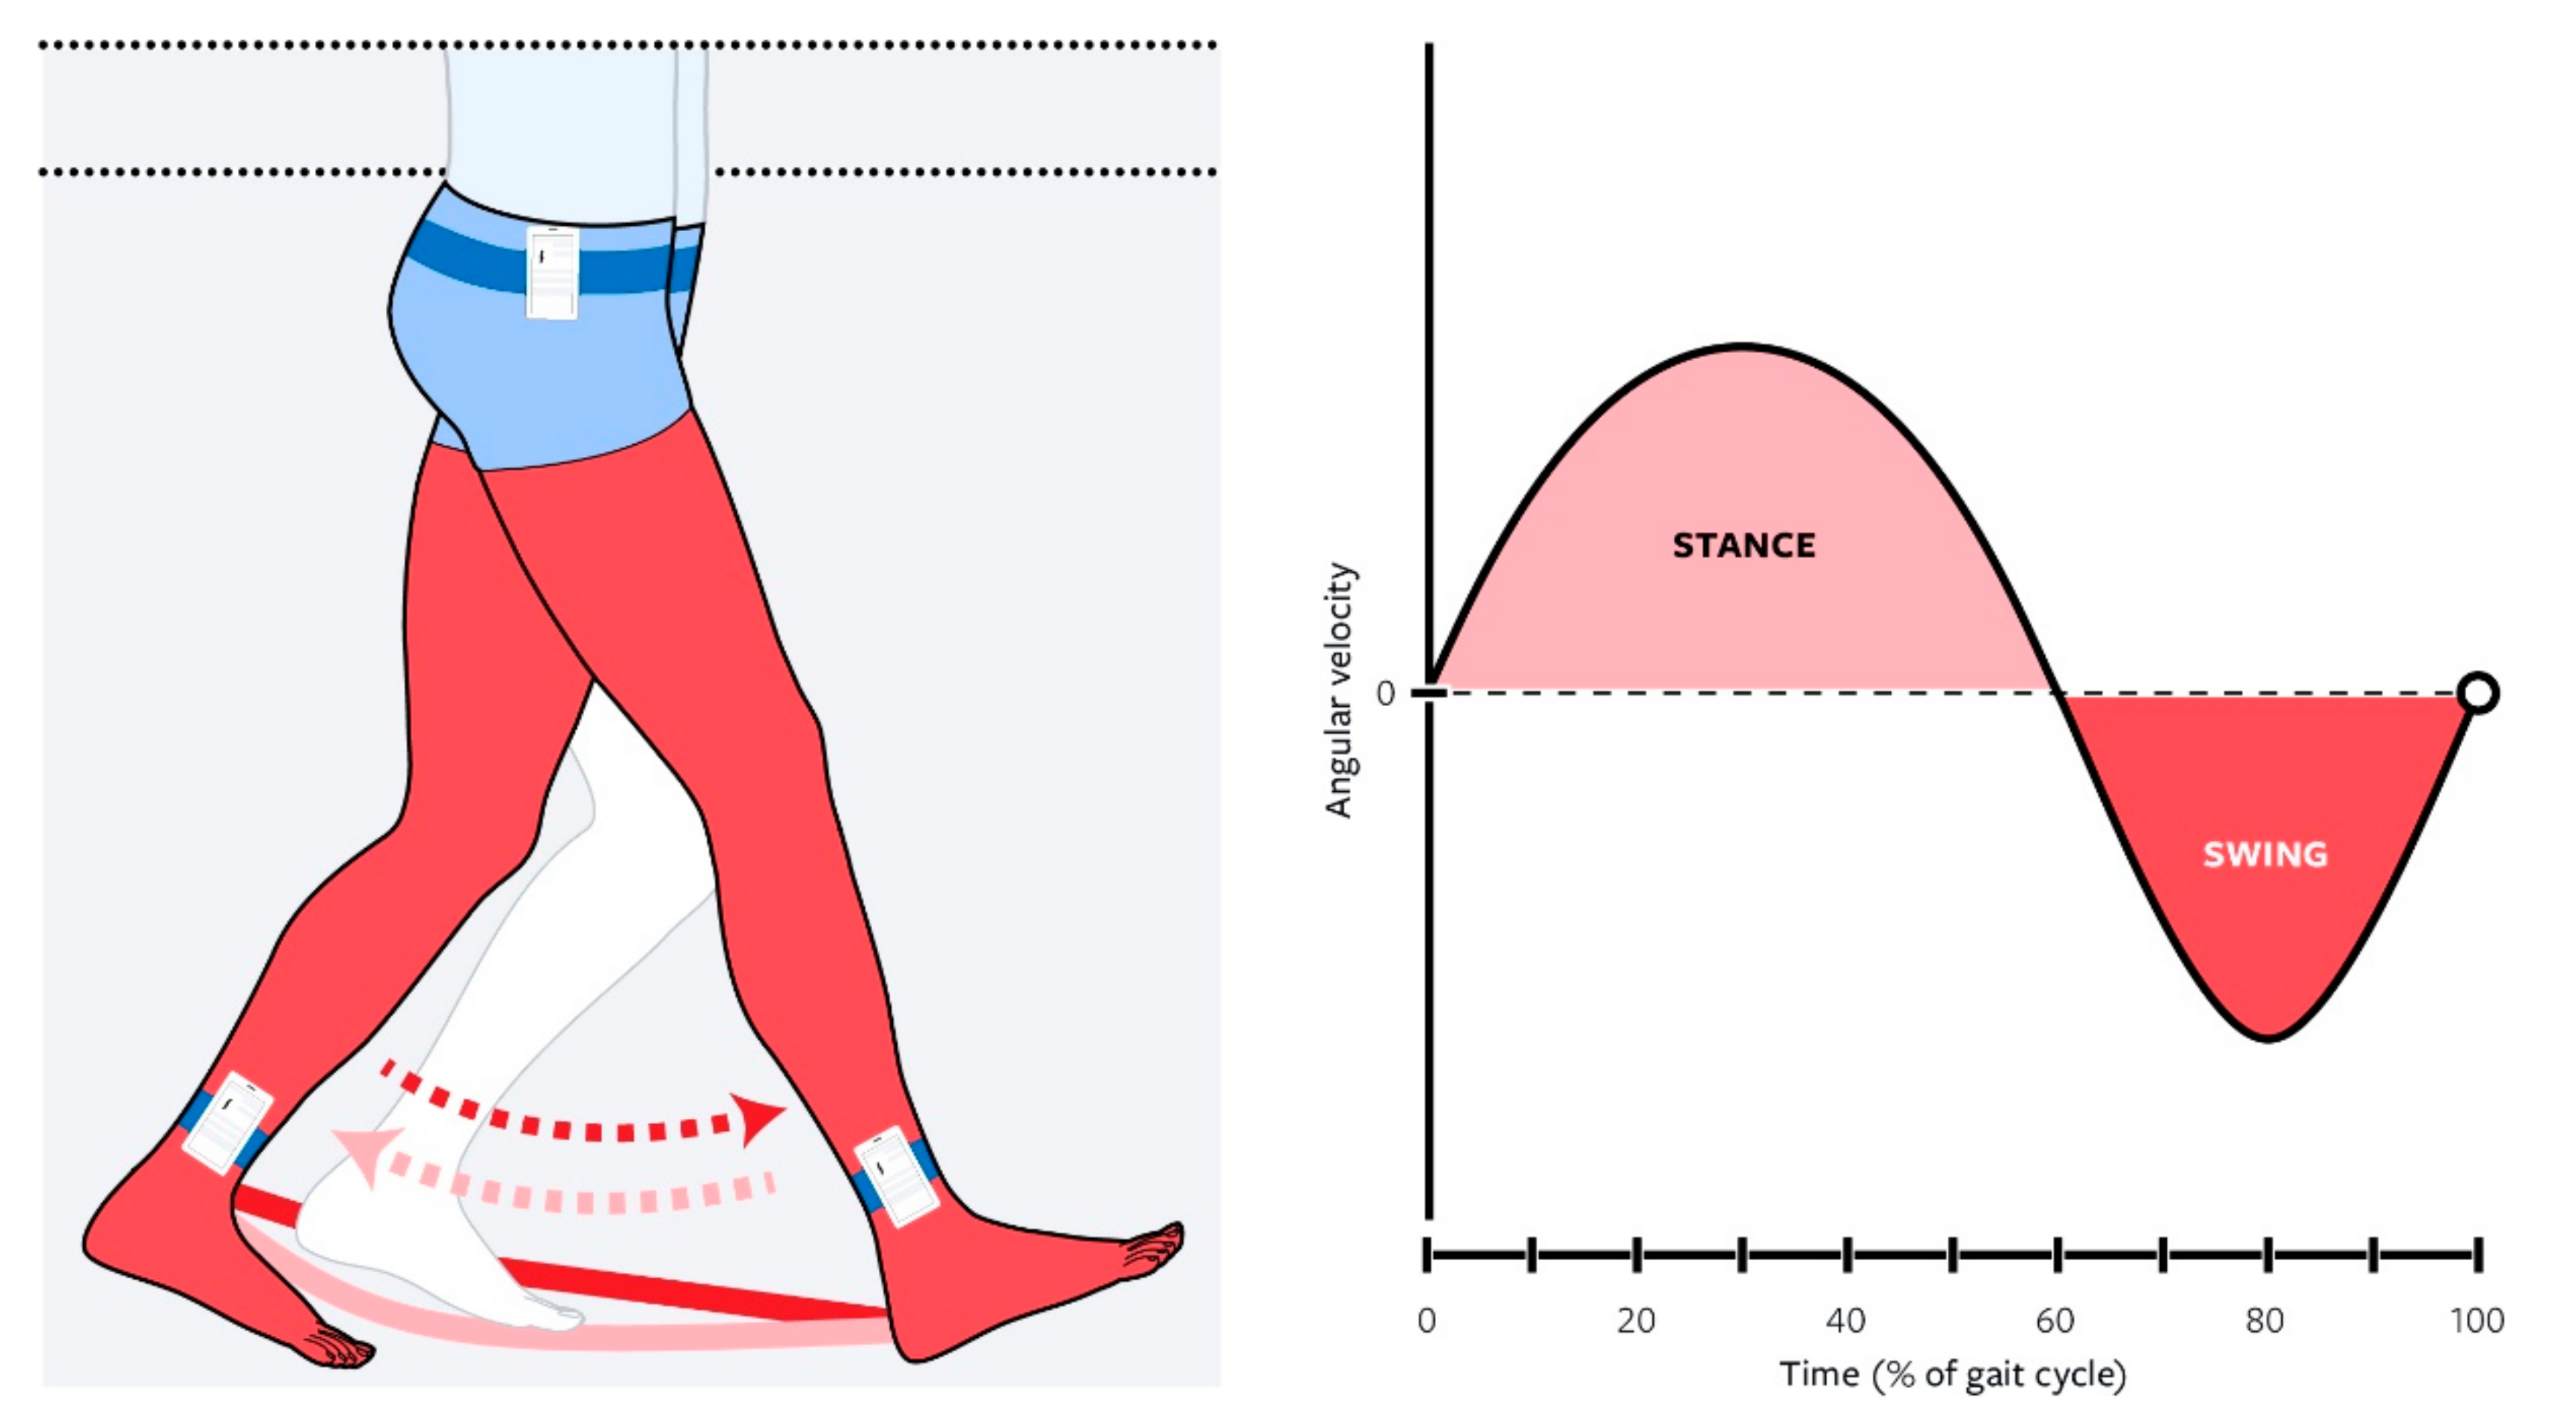
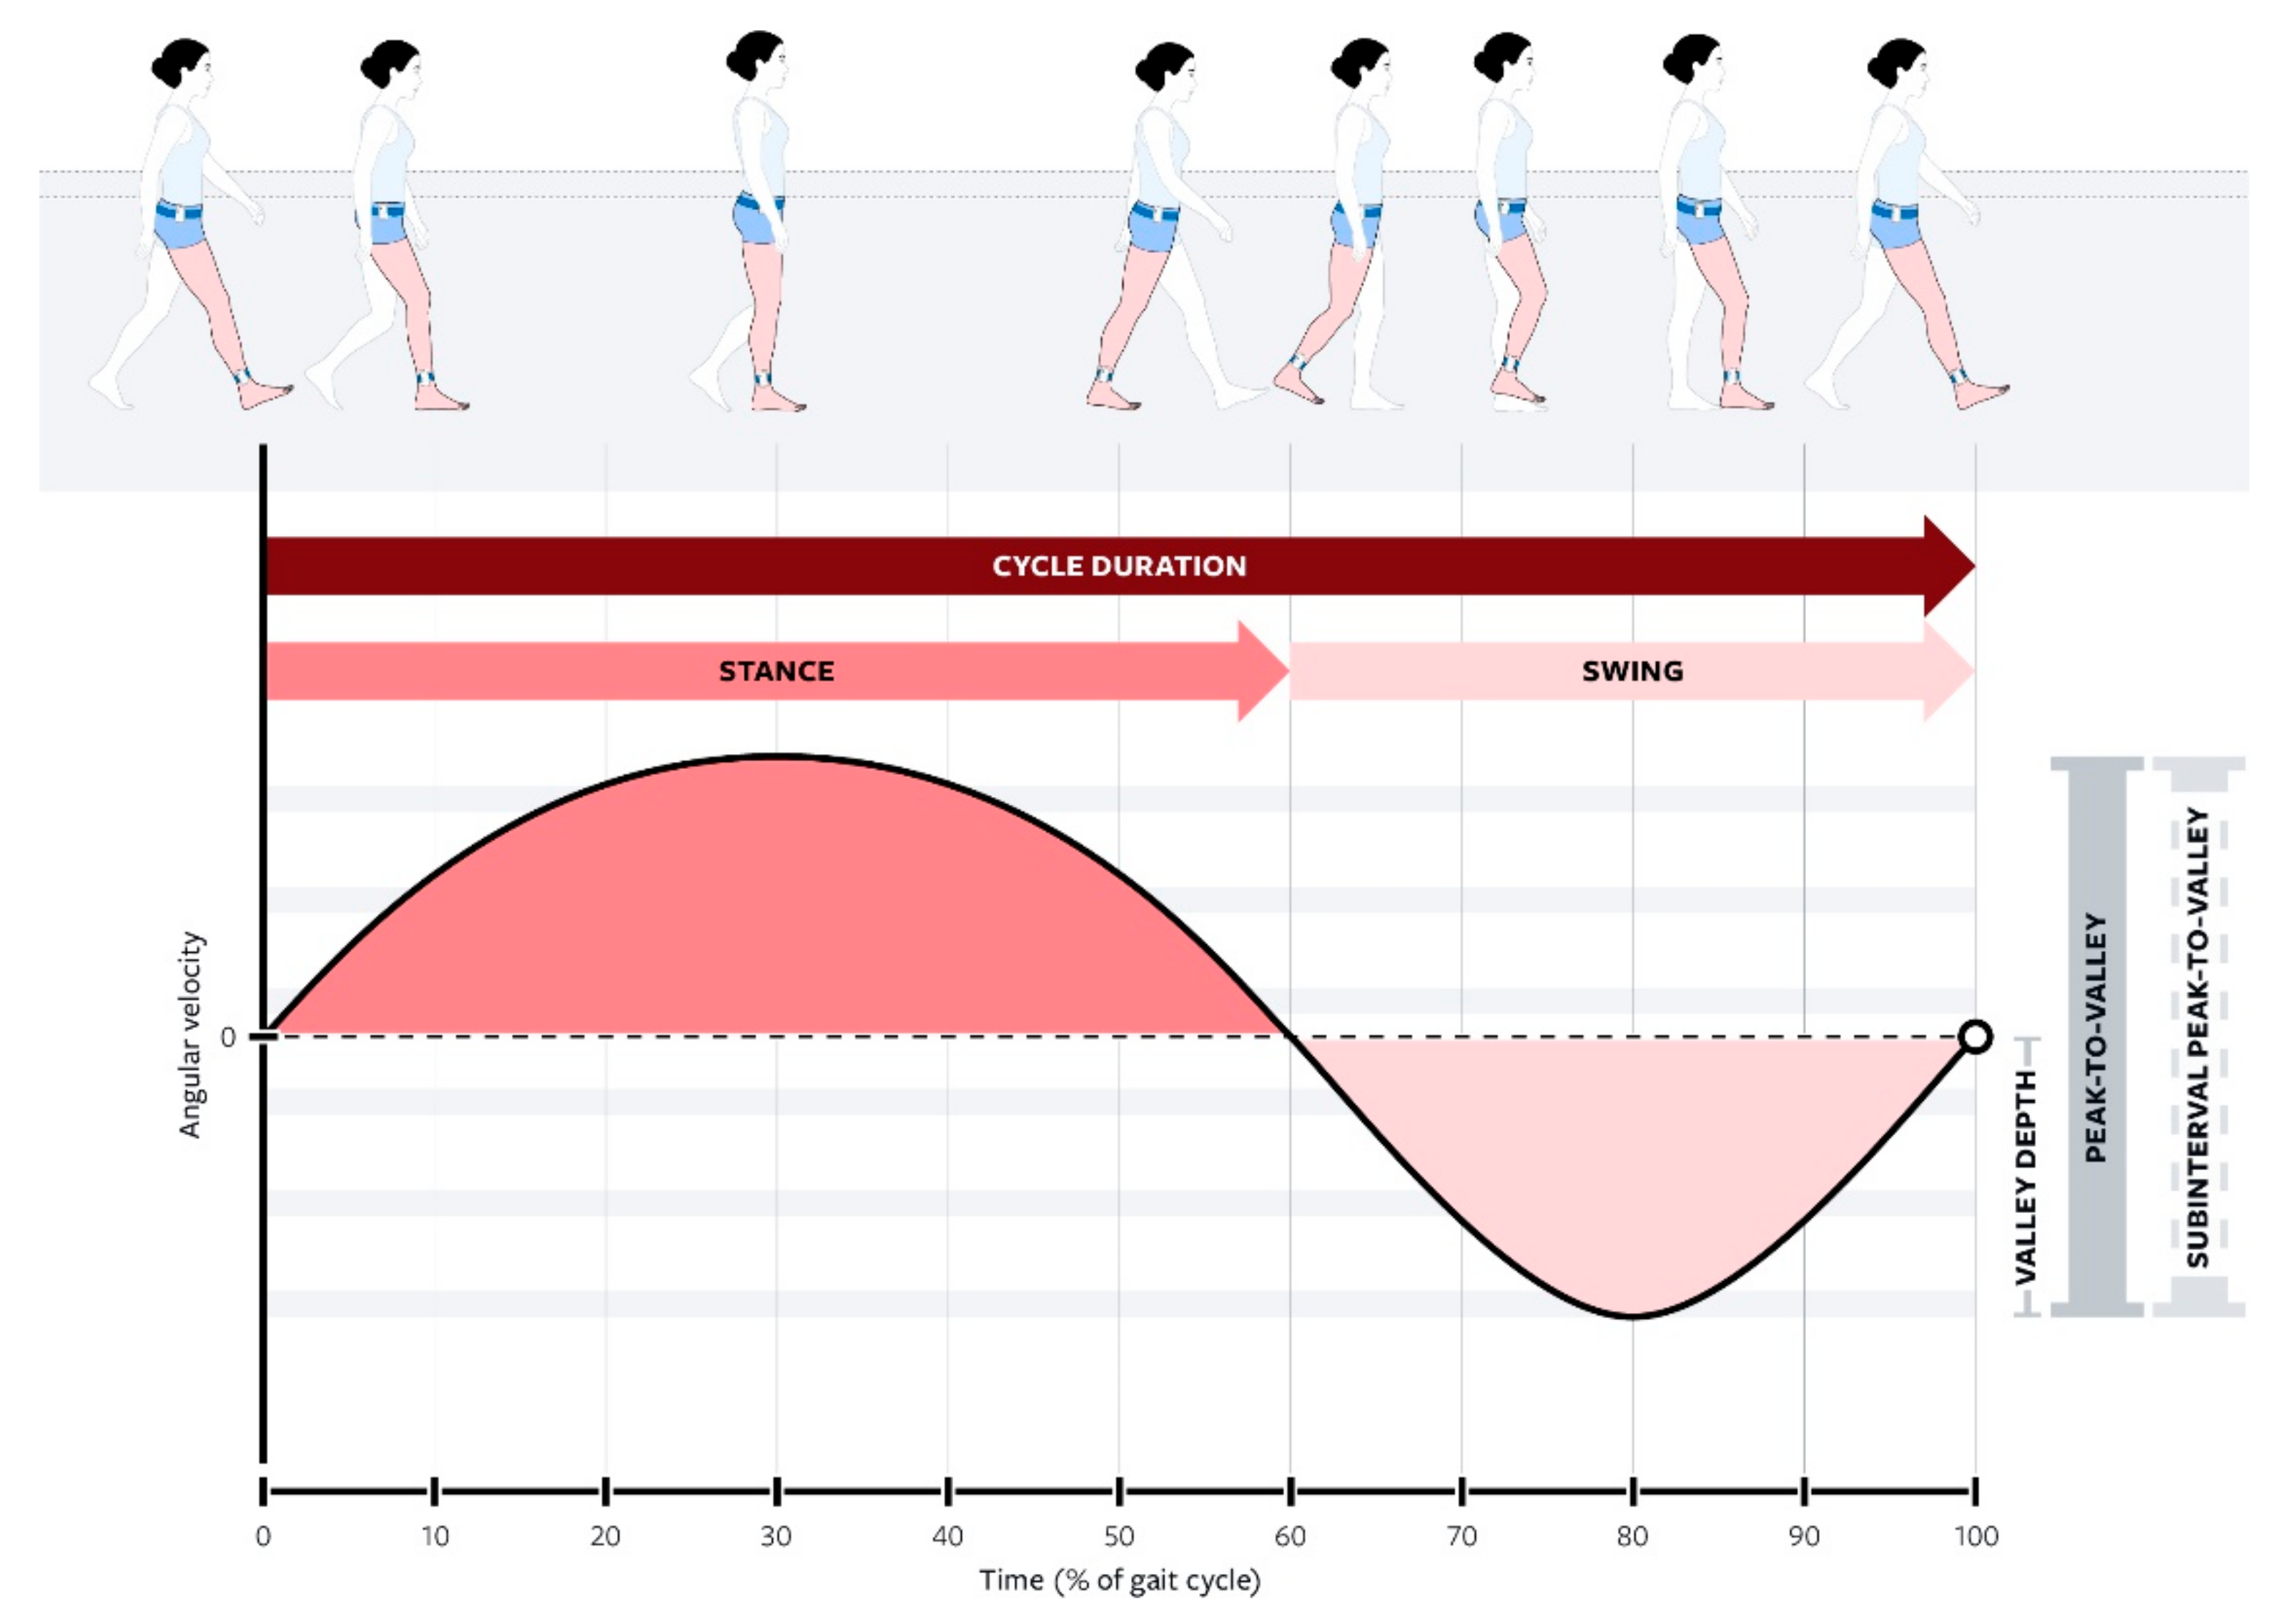
During a gait cycle, the lower extremity’s angular velocity around the mediolateral axis loosely resembles a sine wave, seen in
Figure 2. Heel strike, or initial contact, occurs with the initial increase in angular velocity from zero (starting at the initial zero-crossing). This then builds the stance phase, where the angular velocity increases to a maximum and then returns to zero at toe-off (the second zero-crossing). From there, the velocity continues to increase in a negative direction until the maximal of the mid-swing and then it changes direction again towards positive, going back up to zero, for the next ipsilateral heel strike (the third zero-crossing). Note that the third zero-crossing of a given gait cycle is in fact the first zero-crossing of the next gait cycle.
Gait analysis can be performed for diagnostic, therapeutic, or identification purposes, which makes it an effective tool for biomedical applications [
1,
2,
3,
4]. For diagnostic purposes, gait analysis can be used as a screening tool for cognitive decline in neuromuscular deficits (such as those relating to stroke, Parkinson’s, and Alzheimer’s patients) [
1,
3,
5] and in some cases, for assessing improvement/recovery [
6]. Abnormal gait characteristics, especially in the elderly, have been proven to be an accurate indicator of fall risk and other possible physical impairments [
1,
3,
5,
7], and pathological gait can occur after a medical event or can be a proxy for certain medical diagnoses [
1,
3,
6].
For therapeutic purposes, gait analysis is integral in designing assistive devices such as prosthetics, orthotics, exoskeletons, and rehabilitation [
2]. In fact, the development of such devices is dependent on easily accessible gait measurement and analysis. Developing strategies to create these datasets is important in artificial intelligence as a growing strategy for controlling such devices [
8]. Thus, collecting volumes of gait data both in the lab and in real-world situations is a prominent factor in improving the function of such assistive devices [
9].
Traditionally, gait measurement has been largely conducted through gait laboratories located in research facilities and hospital settings, using an array of cameras and force plates to track an individual’s kinetics and kinematics for real-time or offline analysis [
10,
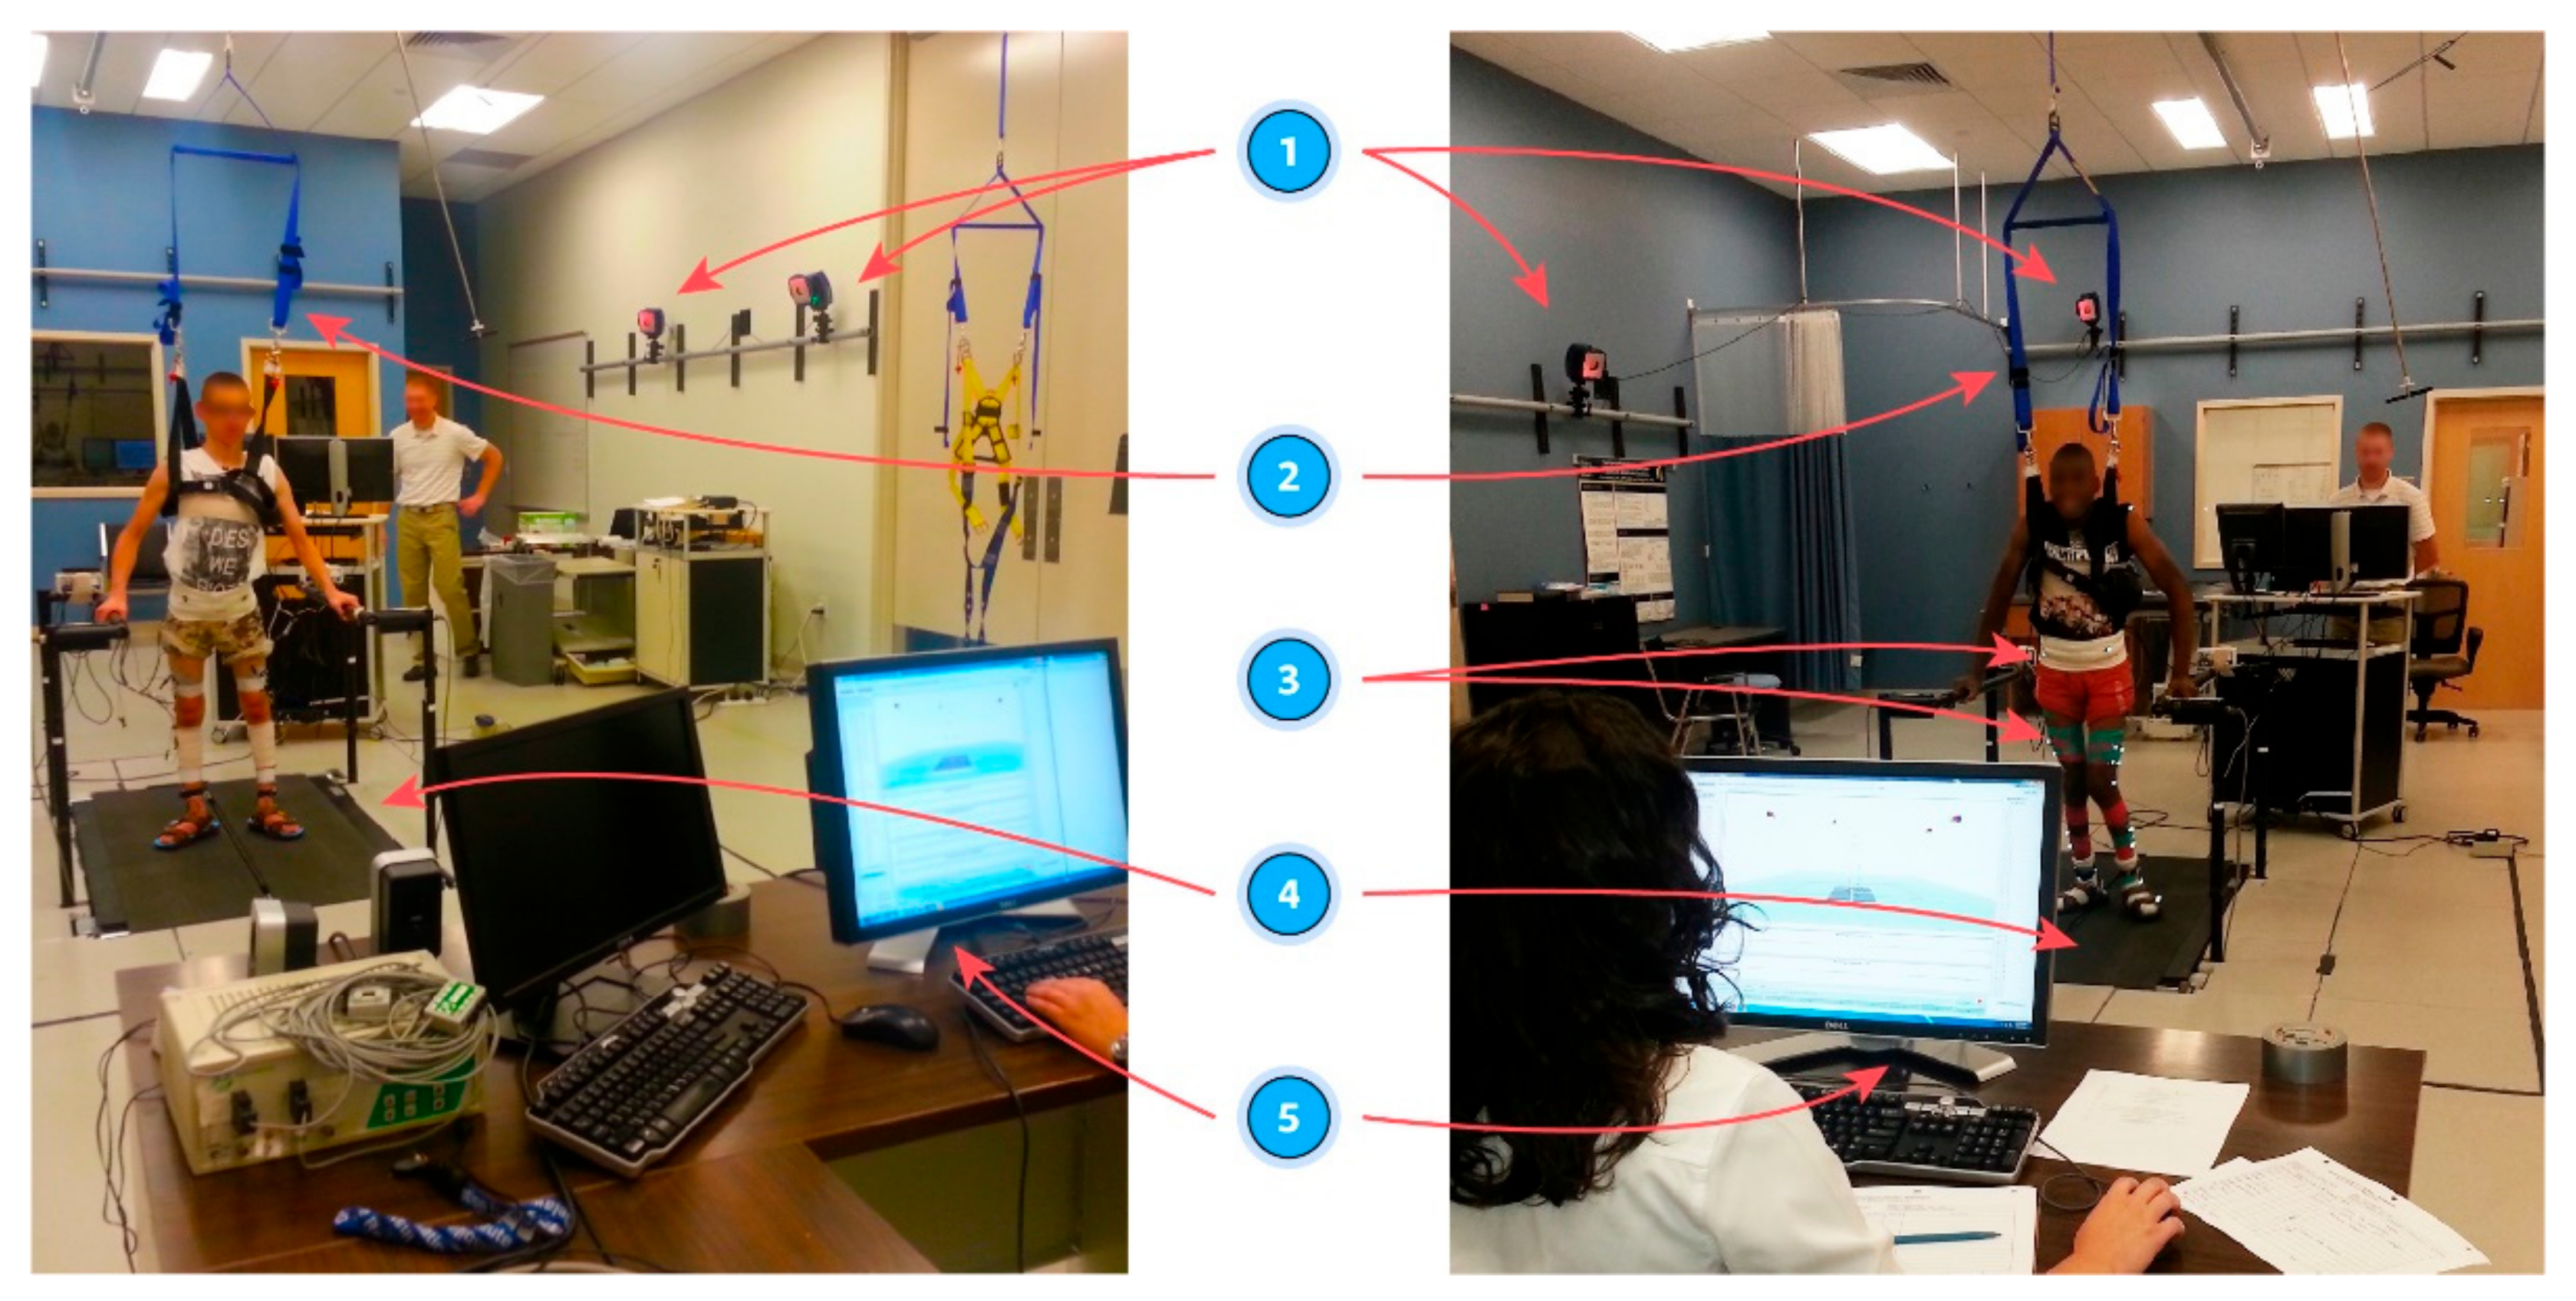
11]. These labs provide a highly accurate means of recording and analyzing gait; however, they are suboptimal for widespread applications. Due to being costly to establish and maintain, traditional gait labs take up dedicated indoor laboratory space and require trained personnel to operate, as shown in
Figure 3, and are not scalable for applications requiring a large volume of subjects [
8]. These factors make gait labs generally difficult to access, especially by the public, smaller research groups, or those located in remote settings [
2]. Additionally, the environment within gait labs is highly fixed, providing little opportunity to observe or reproduce gait in real-life conditions such as various walking terrains during the activities of daily living.
In the context of the COVID-19 pandemic, remote subject-driven measurement allows for ongoing study, while traditional labs may be limited due to direct researcher-to-subject exposure. Subject-driven gait data collection also allows for ongoing daily measurement in various real-world environments and, thus, larger volumes of data accumulation (that would otherwise be limited by gait lab access).
The inability of gait labs to provide opportunities for scalable, prolonged, remote, and self-guided gait analysis combined with the miniaturization and widespread availability of sensor technology resulted in the development of nascent mobile applications for gait analysis [
1,
4,
9,
12]. The inherent limitations of traditional gait labs led to the development of state-of-the-art field-based measurement methods, which are key to observing gait in a more natural and native form accurately, especially in environments where gait adaptation is prevalent. Thus, remote gait analysis involves mobile sensor-based systems in the field and outside of the lab. Field-based measurements are advanced by prevalence and miniaturization of inertial measurement units (IMUs), which allow for direct measurement of kinematics [
1,
2,
3,
10,
13,
14]. While certainly more versatile than a fixed-site gait lab, stand-alone IMUs may not be optimal candidates for scalable data collection. They require extensive effort to distribute, reclaim, and extract data from each sensor, and therefore, lead to a prolonged and costly data collection and data-harvesting process [
9,
10]. Beyond IMUs, other forms of community-based gait measurement outside of a gait lab have been validated, including the GAITRite walkway mat, multi-camera motion tracking, the aTUG chair, and scanning laser rangefinders (SLR) [
7,
15,
16]. Each of these field-based tools has its own inherent advantages/limitations (for example, GAITRite system shows precision but is time consuming) [
7] or requires researcher involvement for setup or usage [
14,
15,
16]. Smartphones, equipped with an array of IMU motion sensors, such as gyroscopes and an accelerometer, have thus become an easier, more-scalable, less-costly, and less-obtrusive investigation tool [
17].
As a tool for gait recording, smartphones possess an impressive array of benefits. Perhaps most obviously, they are readily available, as many individuals carry a smartphone throughout the day. In addition, smartphones have the advantage of real-time data processing, visualization, and data transmission, which eliminates the aforementioned harvesting cost and effort associated with the stand-alone IMUs [
3,
4]. Another benefit is the ability to function as an adaptable multimedia device; they can easily be used to relay simple instructions for how to properly record one’s gait without the need for supervision by a laboratory technician or other professional. These factors make the smartphone an ideal candidate and wearable technology as a remote tool for scalable, widespread, simple, and accurate gait measurement [
2].
Preceding research has validated the use of a smartphone as an instrument of accurately recording gait and has proven its accuracy in comparison to more traditional methods of gait measurement [
2,
5,
18]. Angular velocity, measured by smartphones and stand-alone IMUs, has both been validated as a measure of gait and has been shown to be reliable to delineate the different parts of the gait cycle [
11]. However, most previous investigations have focused on the implementation of smartphone gait measurement in a controlled, supervised, and indoor laboratory setting [
2,
3]. The few studies that have been trialed outdoors have been conducted in controlled and supervised flat walking environments [
2,
3]. Mounting of the smartphone on the subjects (by researchers) has been measured most often either on the chest (in a harness), in a shoulder bag, on the lower back, or at the hip (in pocket) [
2,
10,
18].
The subject group for previous studies was determined either by proximate availability (young college-age adults in proximity to the research lab) or risk factors (i.e., elderly being assessed for fall risk) [
1,
2,
3,
11,
18]. However, looking at the entire available sample pool (irrespective of proximate or risk factors), one notes that the middle-aged group, 40–60 years old, is understudied. As this group is highly adoptive of smartphone usage, there exists a large subject population from which to draw, and such a large pool allows for the generation of large volumes of data, determination of general population baselines, and also serves as longitudinal comparison against near-future trials in this same group (“pre-elderly” vs. elderly). Furthermore, studying a healthy population enables researchers to define the walking profile upon a given surface before testing it on at-risk populations.
Improved knowledge of the specific effect of terrain on gait is important, as it expands gait analysis outside of a controlled laboratory setting into daily life, where it would certainly be more useful in applications (such as exoskeletons) aiming to approximate real life gait. The effects of passive terrain change, i.e., differing overland surfaces, on gait has not yet been fully defined. Increased gait parameters (specifically step time) have been noted when transitioning from a stable, level surface to a less stable surface. Previous research has shown this in both real-world walking (in contrast to indoor laboratory walking) [
19] and irregular hard surfaces (in comparison to level, hard surfaces) [
20]. Previous research in this field has been limited to examining the effects of cognitive load on gait or physical obstruction on gait [
2,
3,
19,
20], but very little research has looked at the effects of the physical environmental load itself, and no research has examined hard versus soft terrain in the environment. Thus, to better measure gait parameters in a real-life setting, comparison across differing outdoor surfaces is necessary.
Here we proposed a remote and purely subject-driven procedure for reproducible and scalable collection of real-life spatiotemporal gait data across two real-life terrains using a smartphone application in a middle-aged study group.
We hypothesized that using a smartphone for a subject-driven comparison of gait cycle metrics on asphalt terrain to the same on grass terrain will lead to significantly higher spatiotemporal gait parameters (specifically, gait cycle duration, measured by lower limbs angular velocity) on grass terrain compared to asphalt.
2. Materials and Methods
2.1. Participants
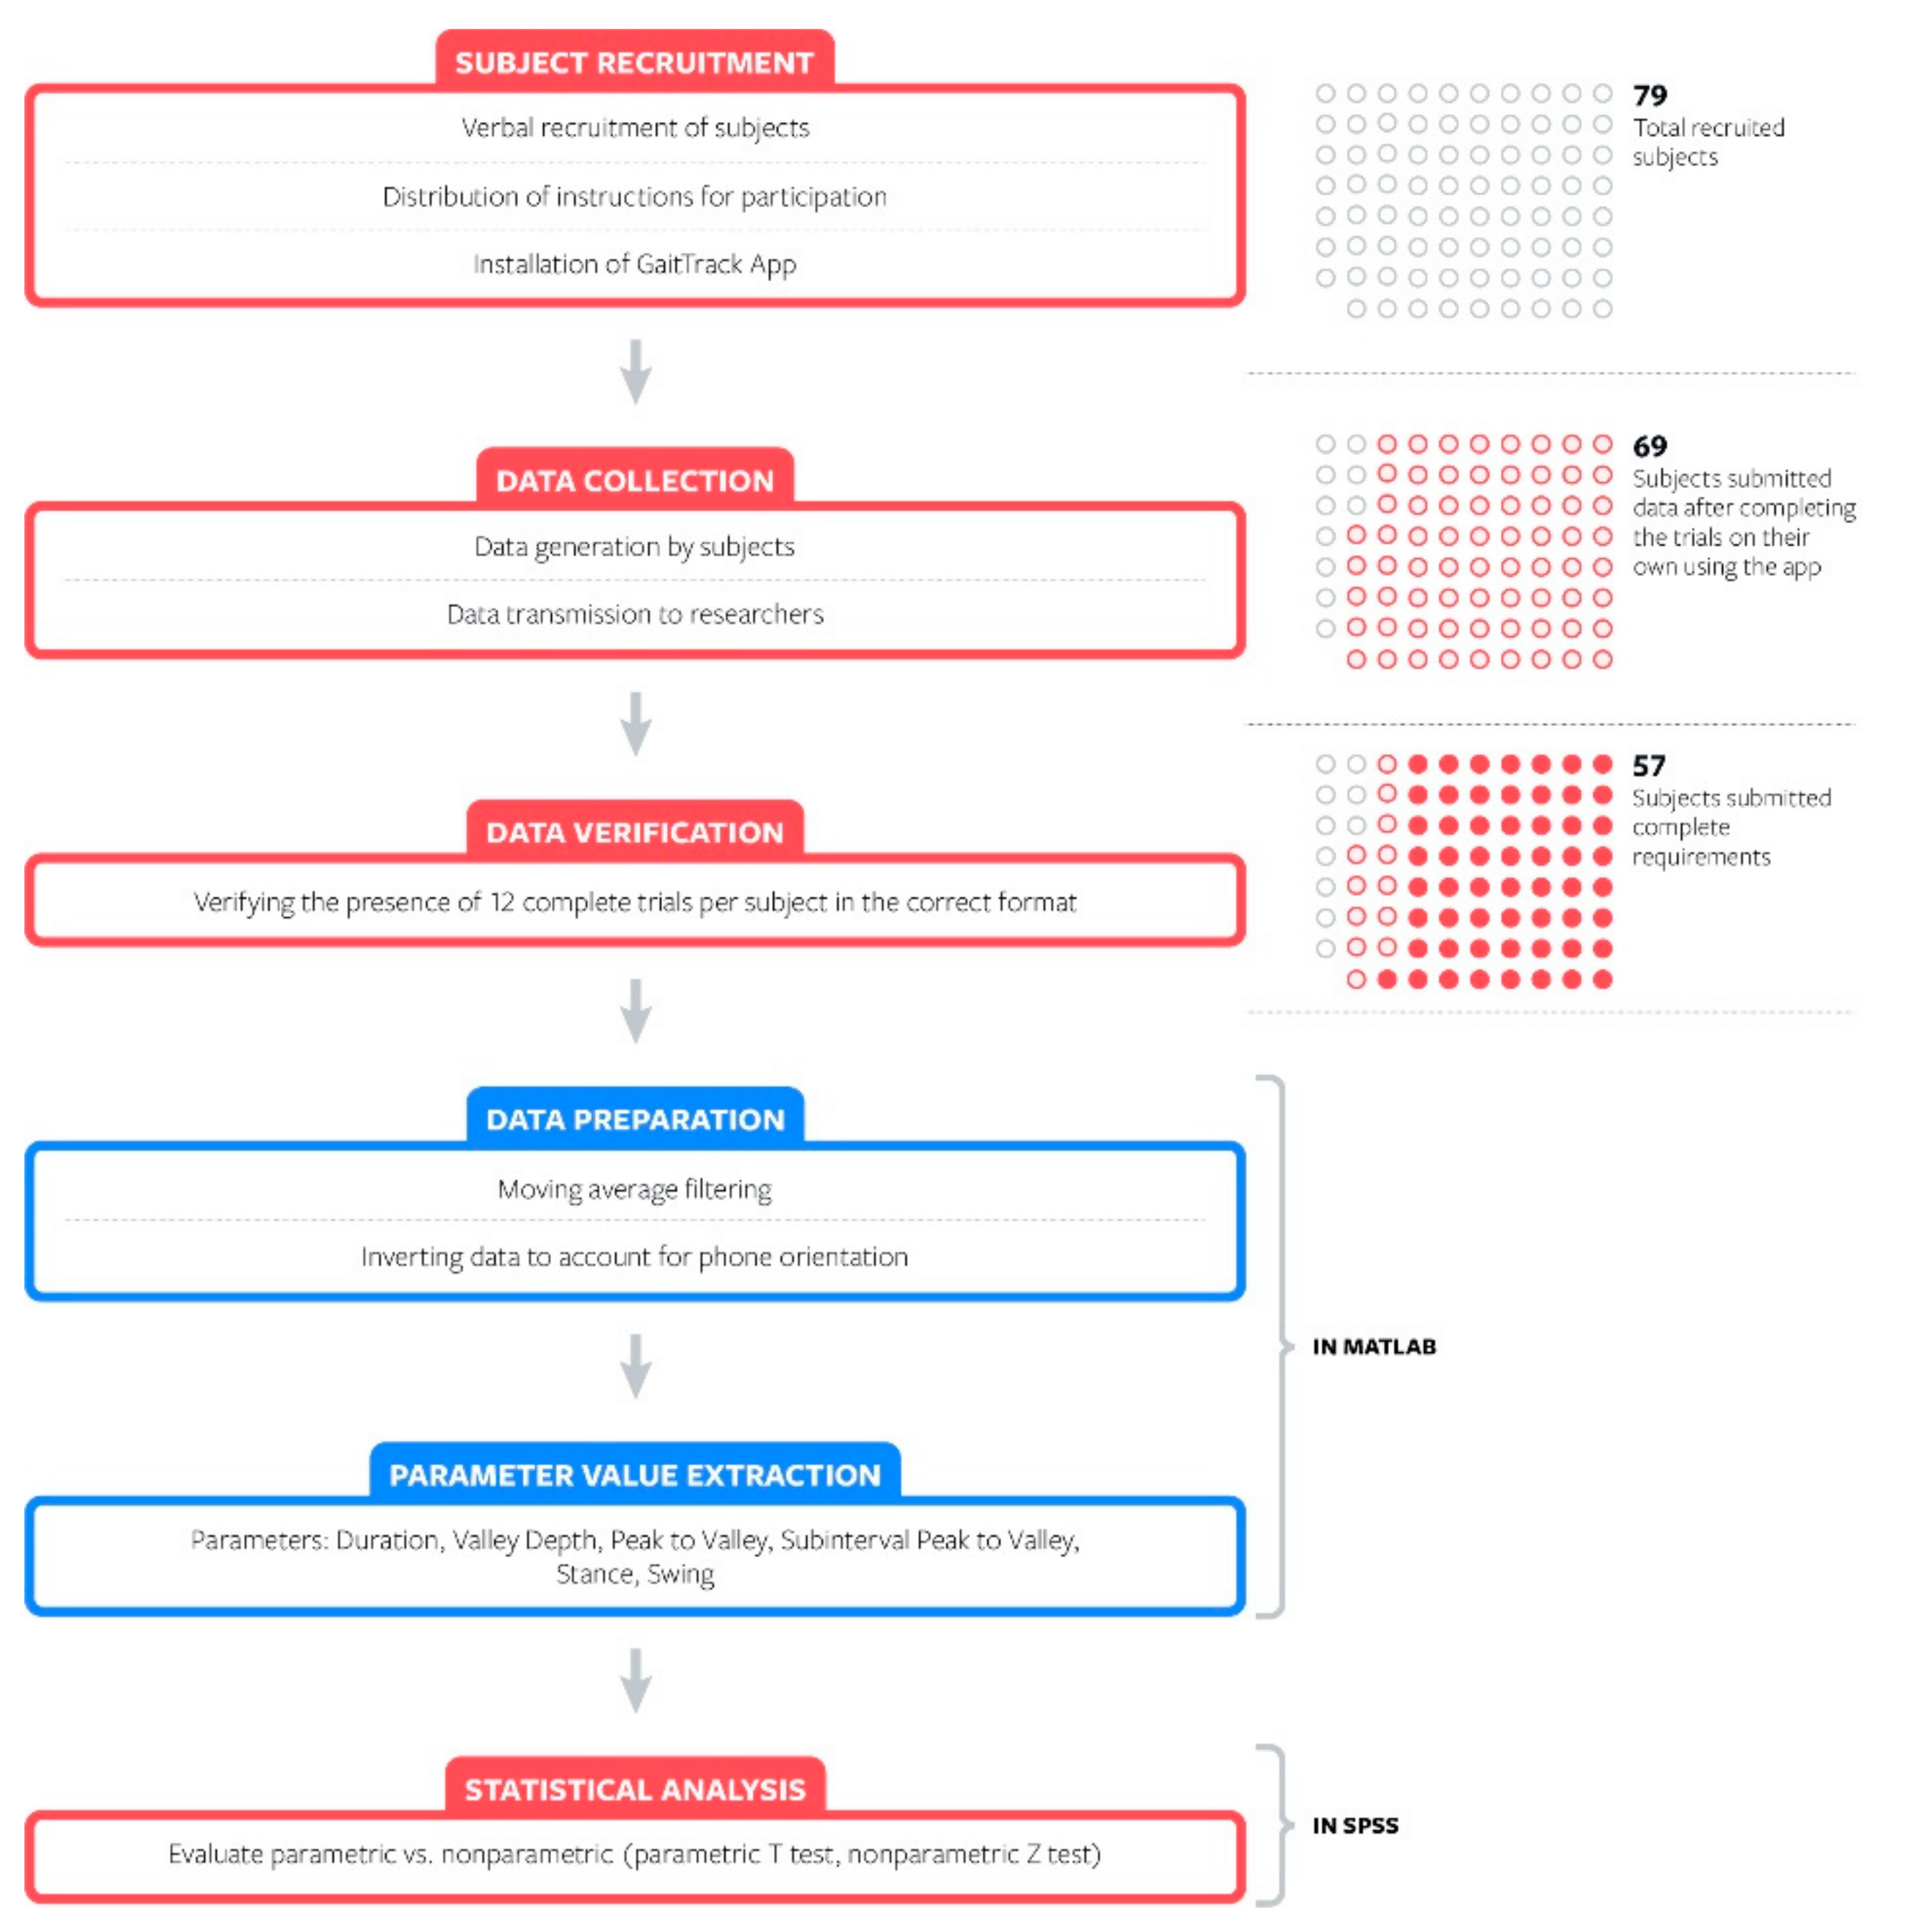
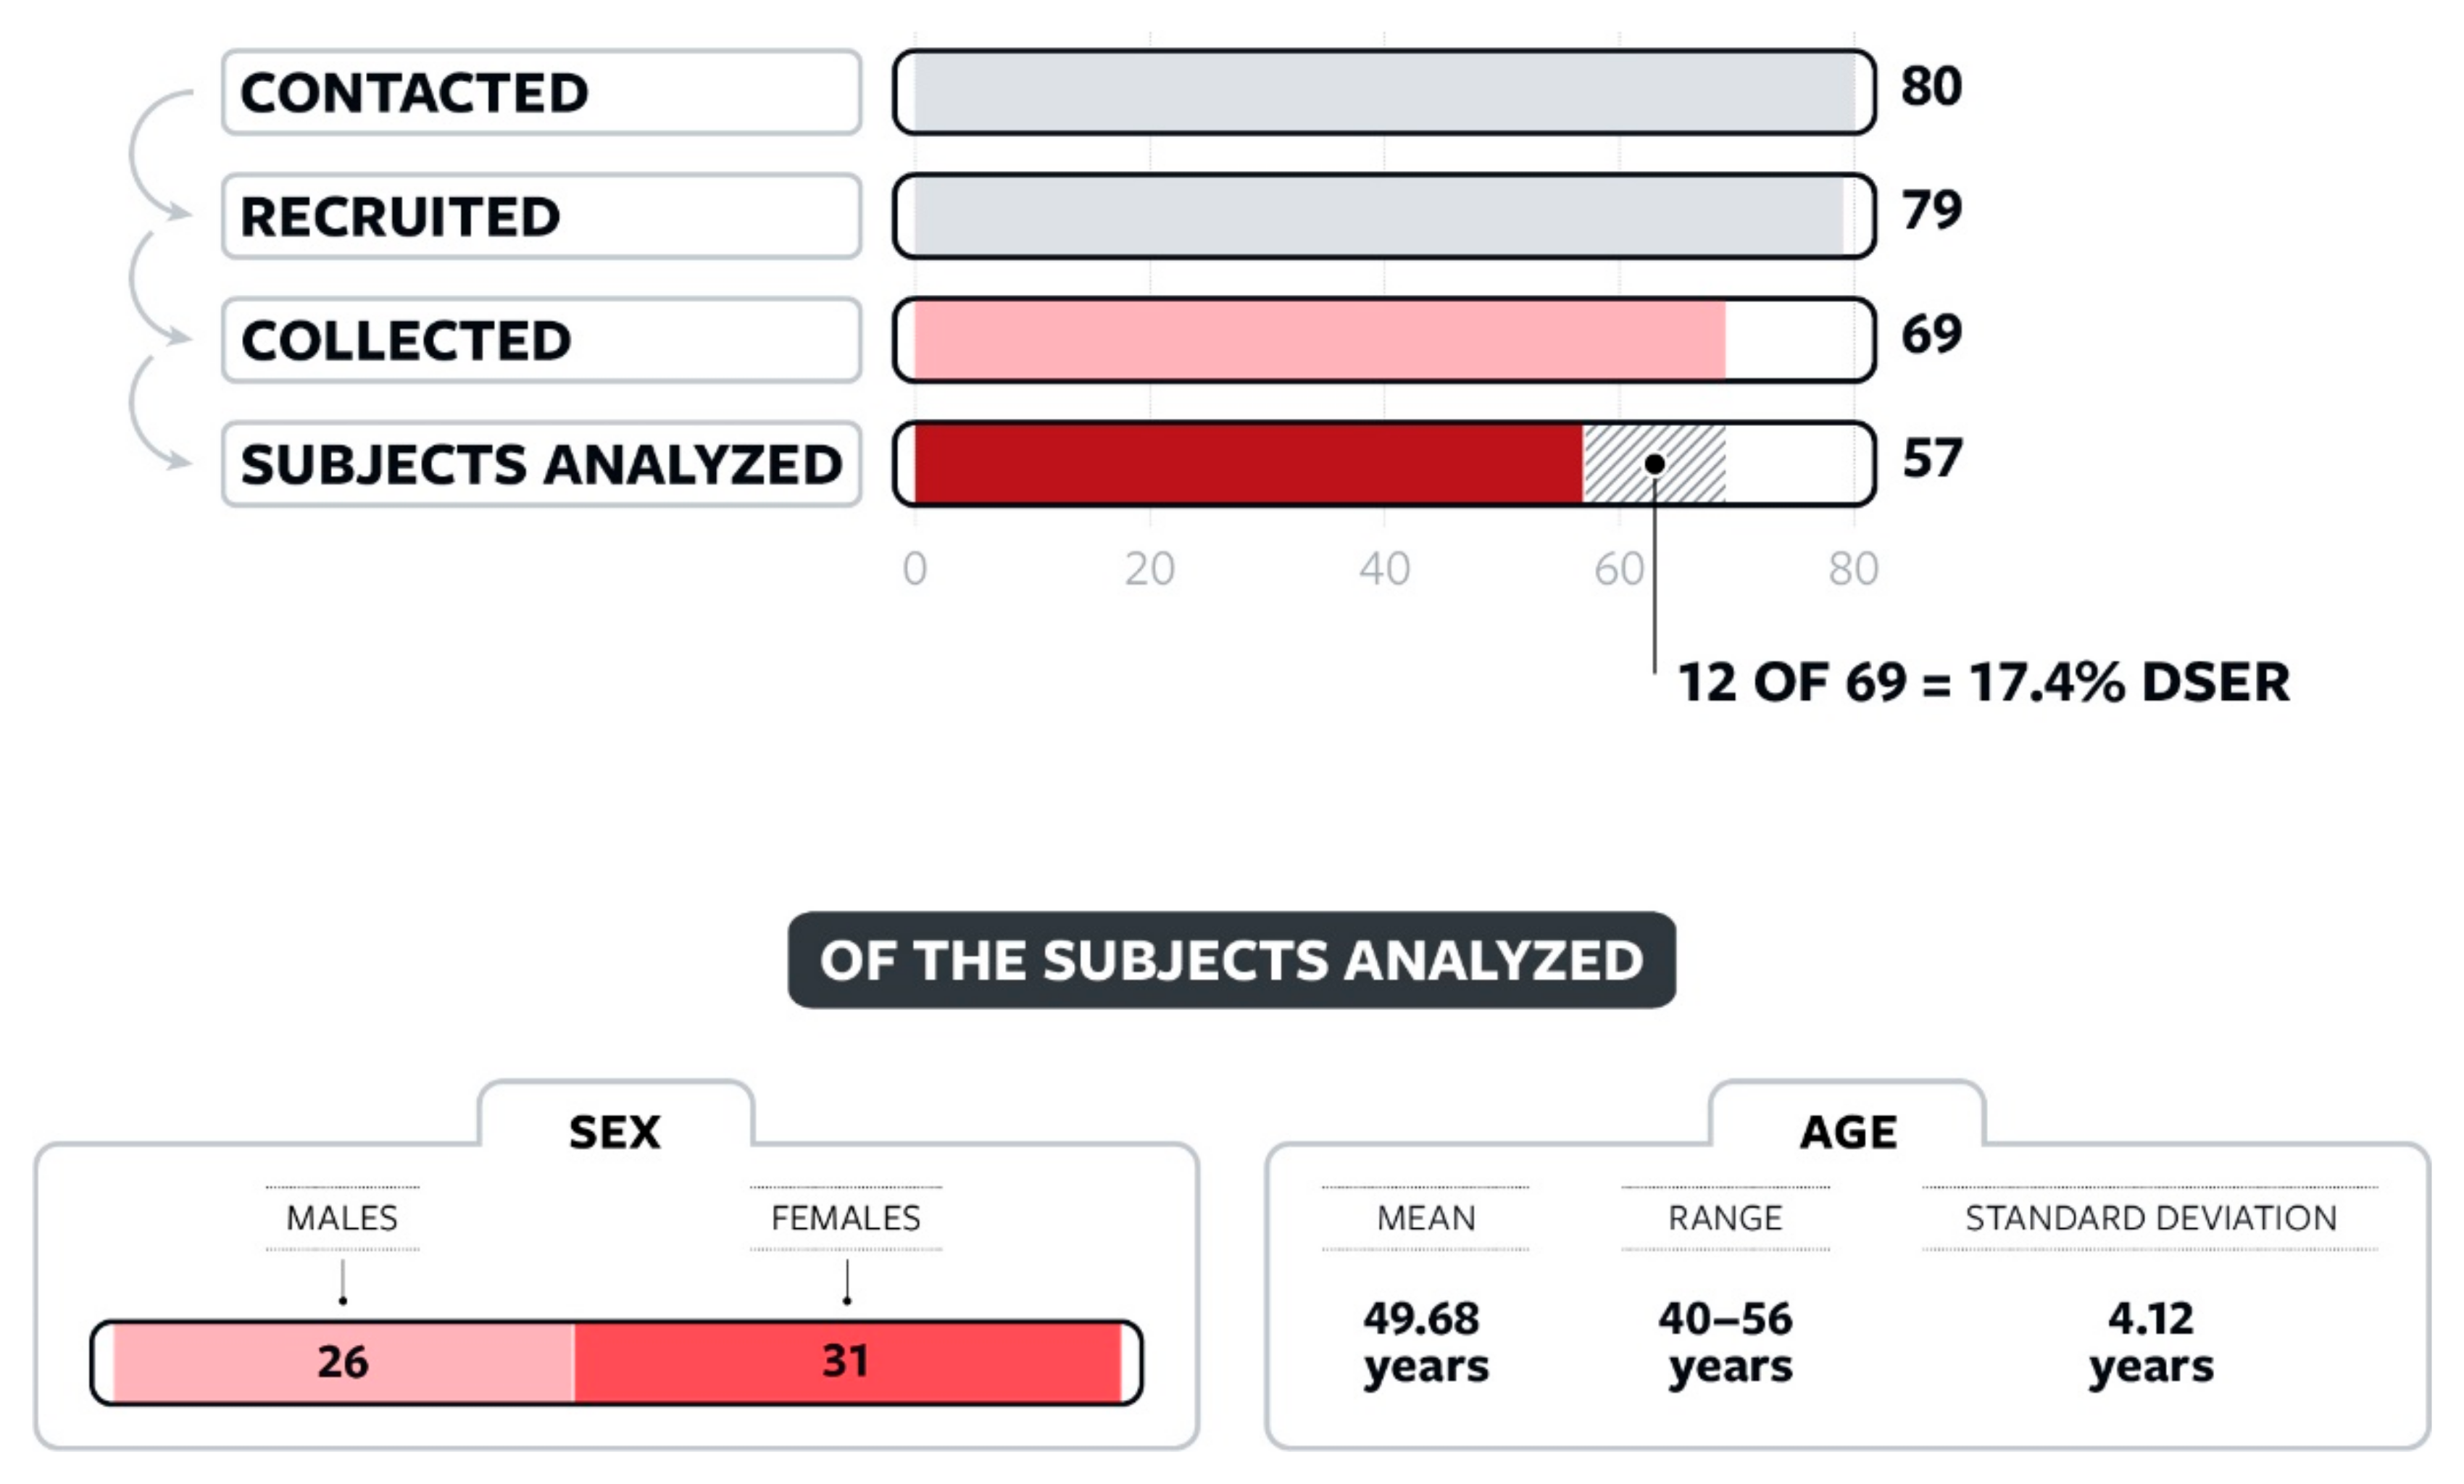
Eighty subjects were recruited, and 79 participants were enrolled in this study, of which 69 completed the trials using the app and submitted their data sets. During a defined 15-day period, these subjects completed data collection on their own and submitted the data for offline review. Of these, preliminary review of the data showed that, though collected and properly transmitted, incomplete data were recorded and saved in 12 of the 69 datasets. All 12 incomplete sets were excluded for incomplete submission of all required trials, resulting in complete data sets from 57 participants. After data collection, a power analysis was run significance α = 0.05, power of 0.8, and a medium effect size (d = 0.5); this power analysis revealed that a minimum of 34 subjects would be needed under those parameters. The number of subjects in each stage from recruitment to data collection to data validation is shown in
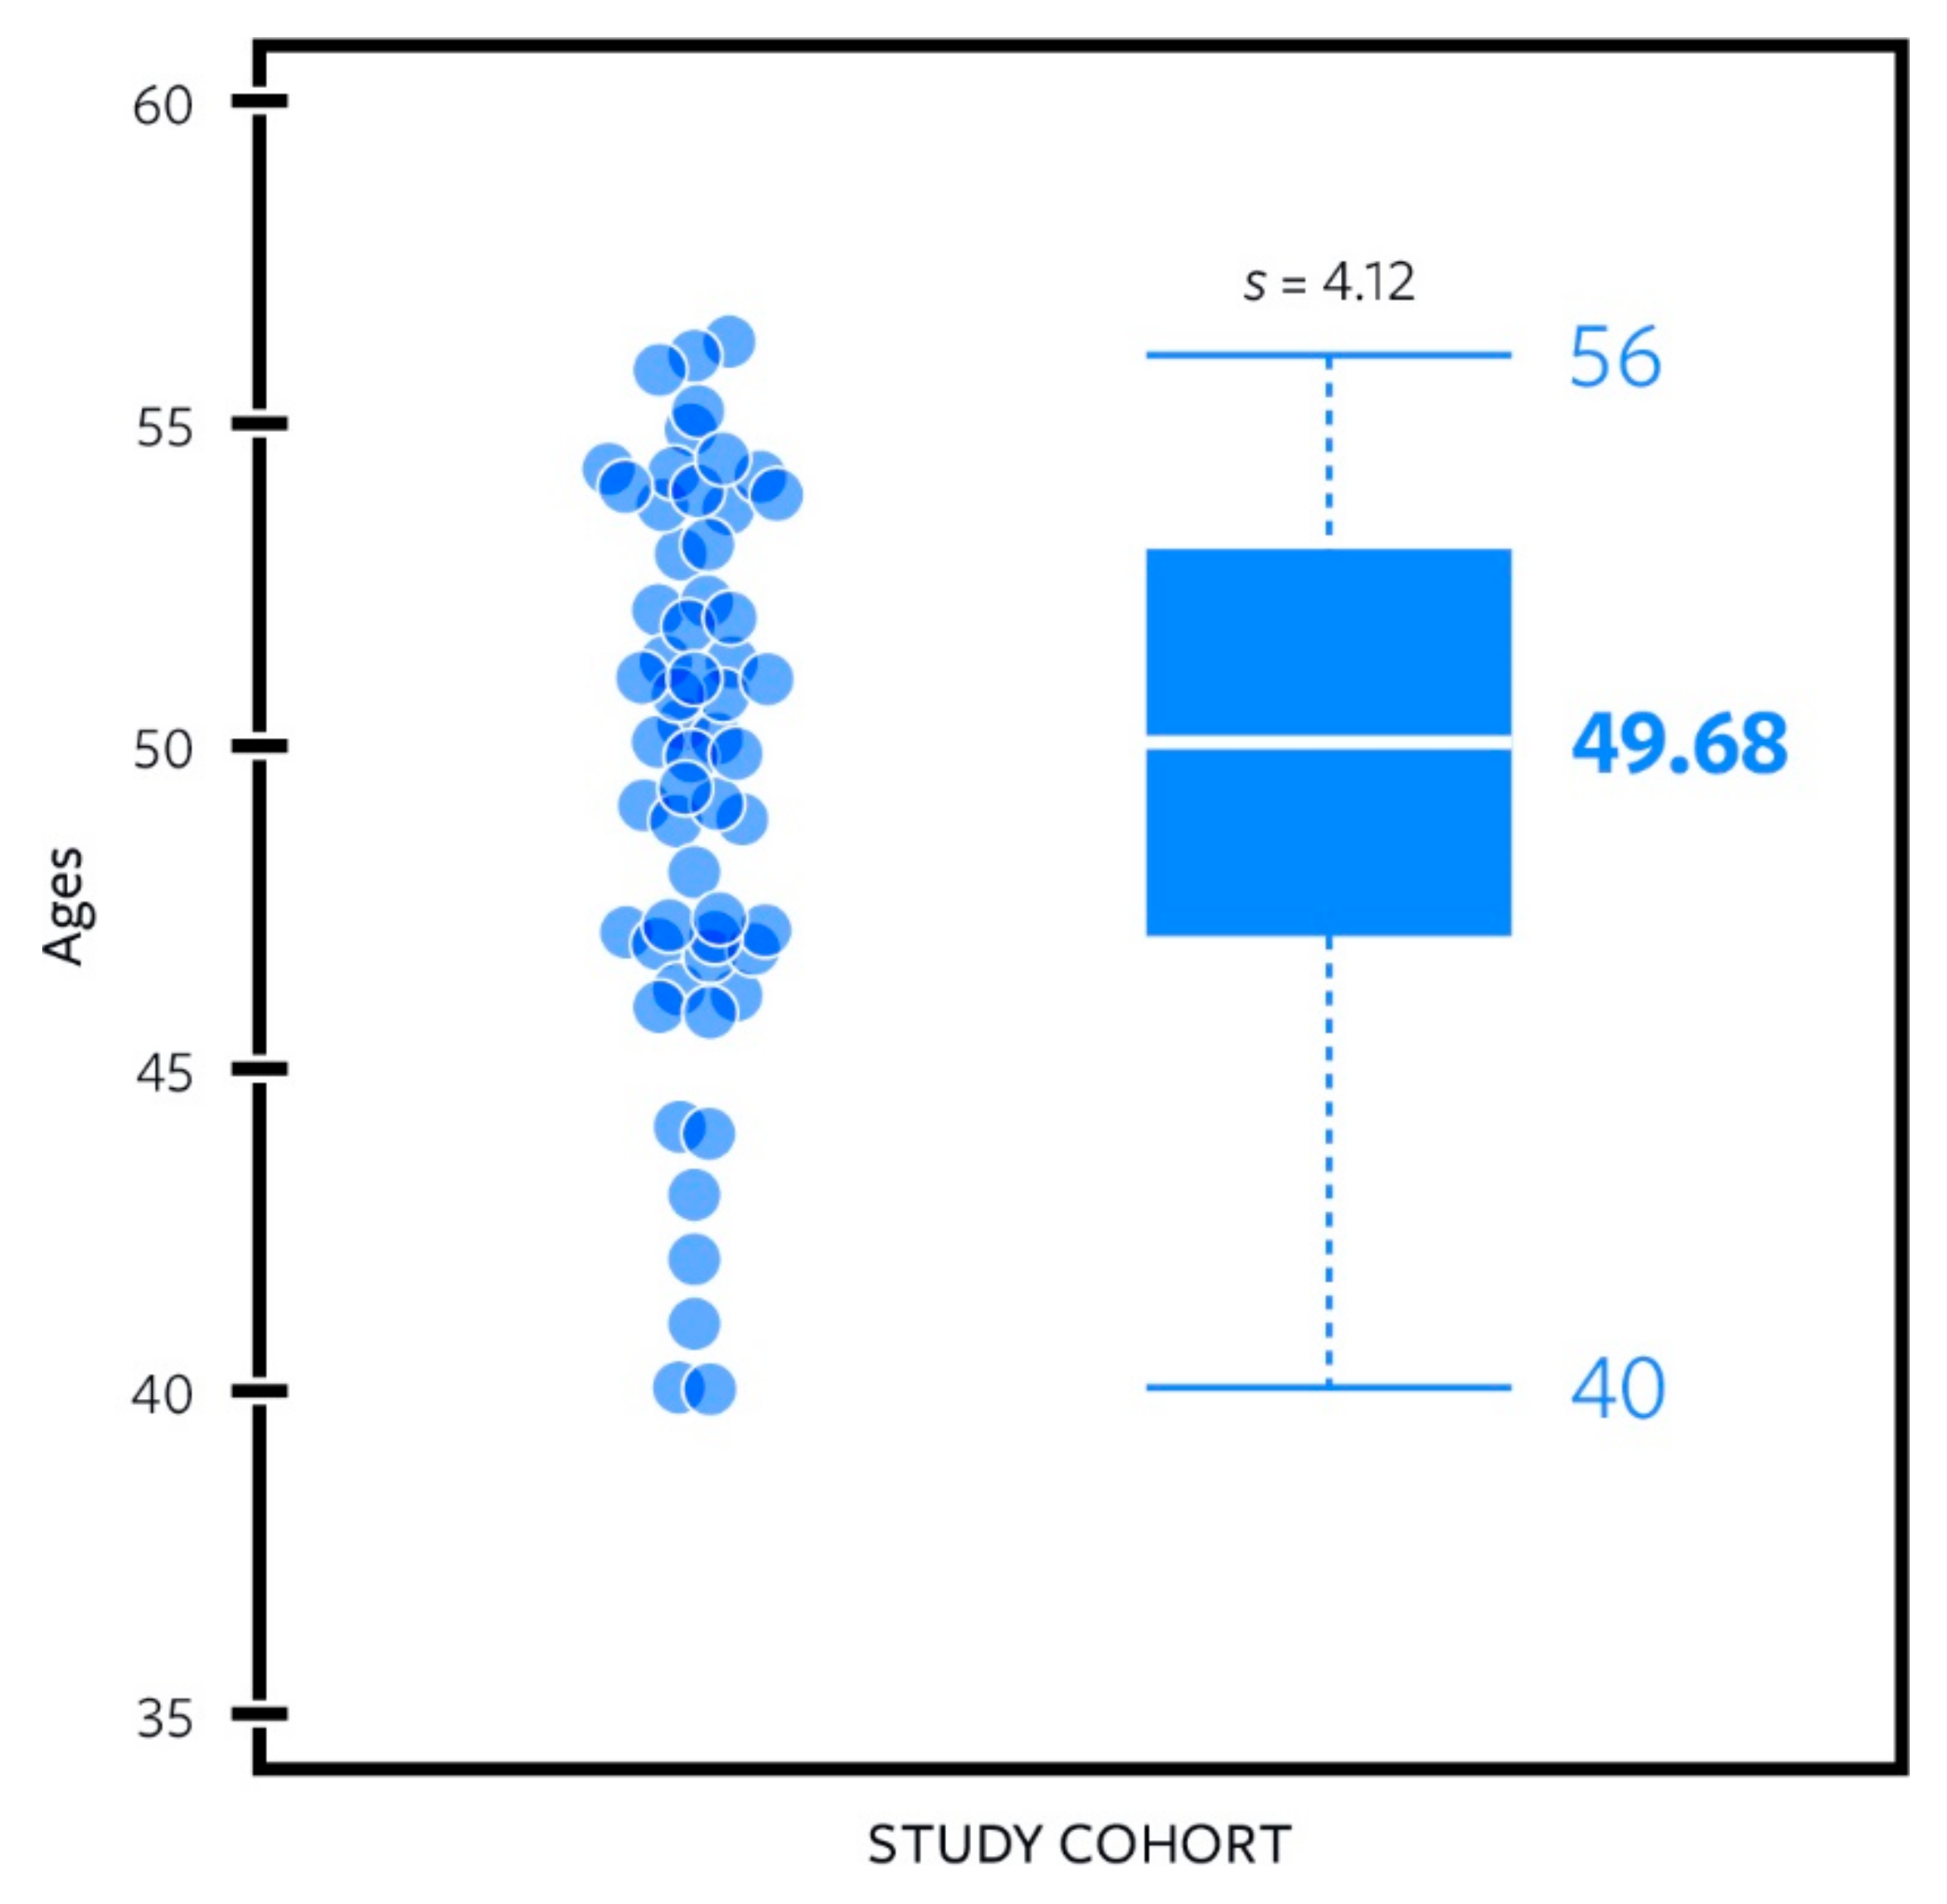
Figure 4. This study group had an average age of 49.68 years old with a standard deviation of 4.12 years and a range of 40–56 years old, as depicted in
Figure 5. The data analyzed were composed of 26 males and 31 females as noted in
Figure 6 (57 total subjects). All participants were able to walk in a straight line for 20 steps without the aid of another person or a walking apparatus. All participants provided written informed consent for their participation in the study and the use of anonymized data in the analysis. Exclusion criteria included a physical disability impeding one’s ability to walk or otherwise modifying one’s gait; a history of neurological disorders; or a history or presence of ulceration, amputation, or pain in the lower extremities.
2.2. iPhone Application
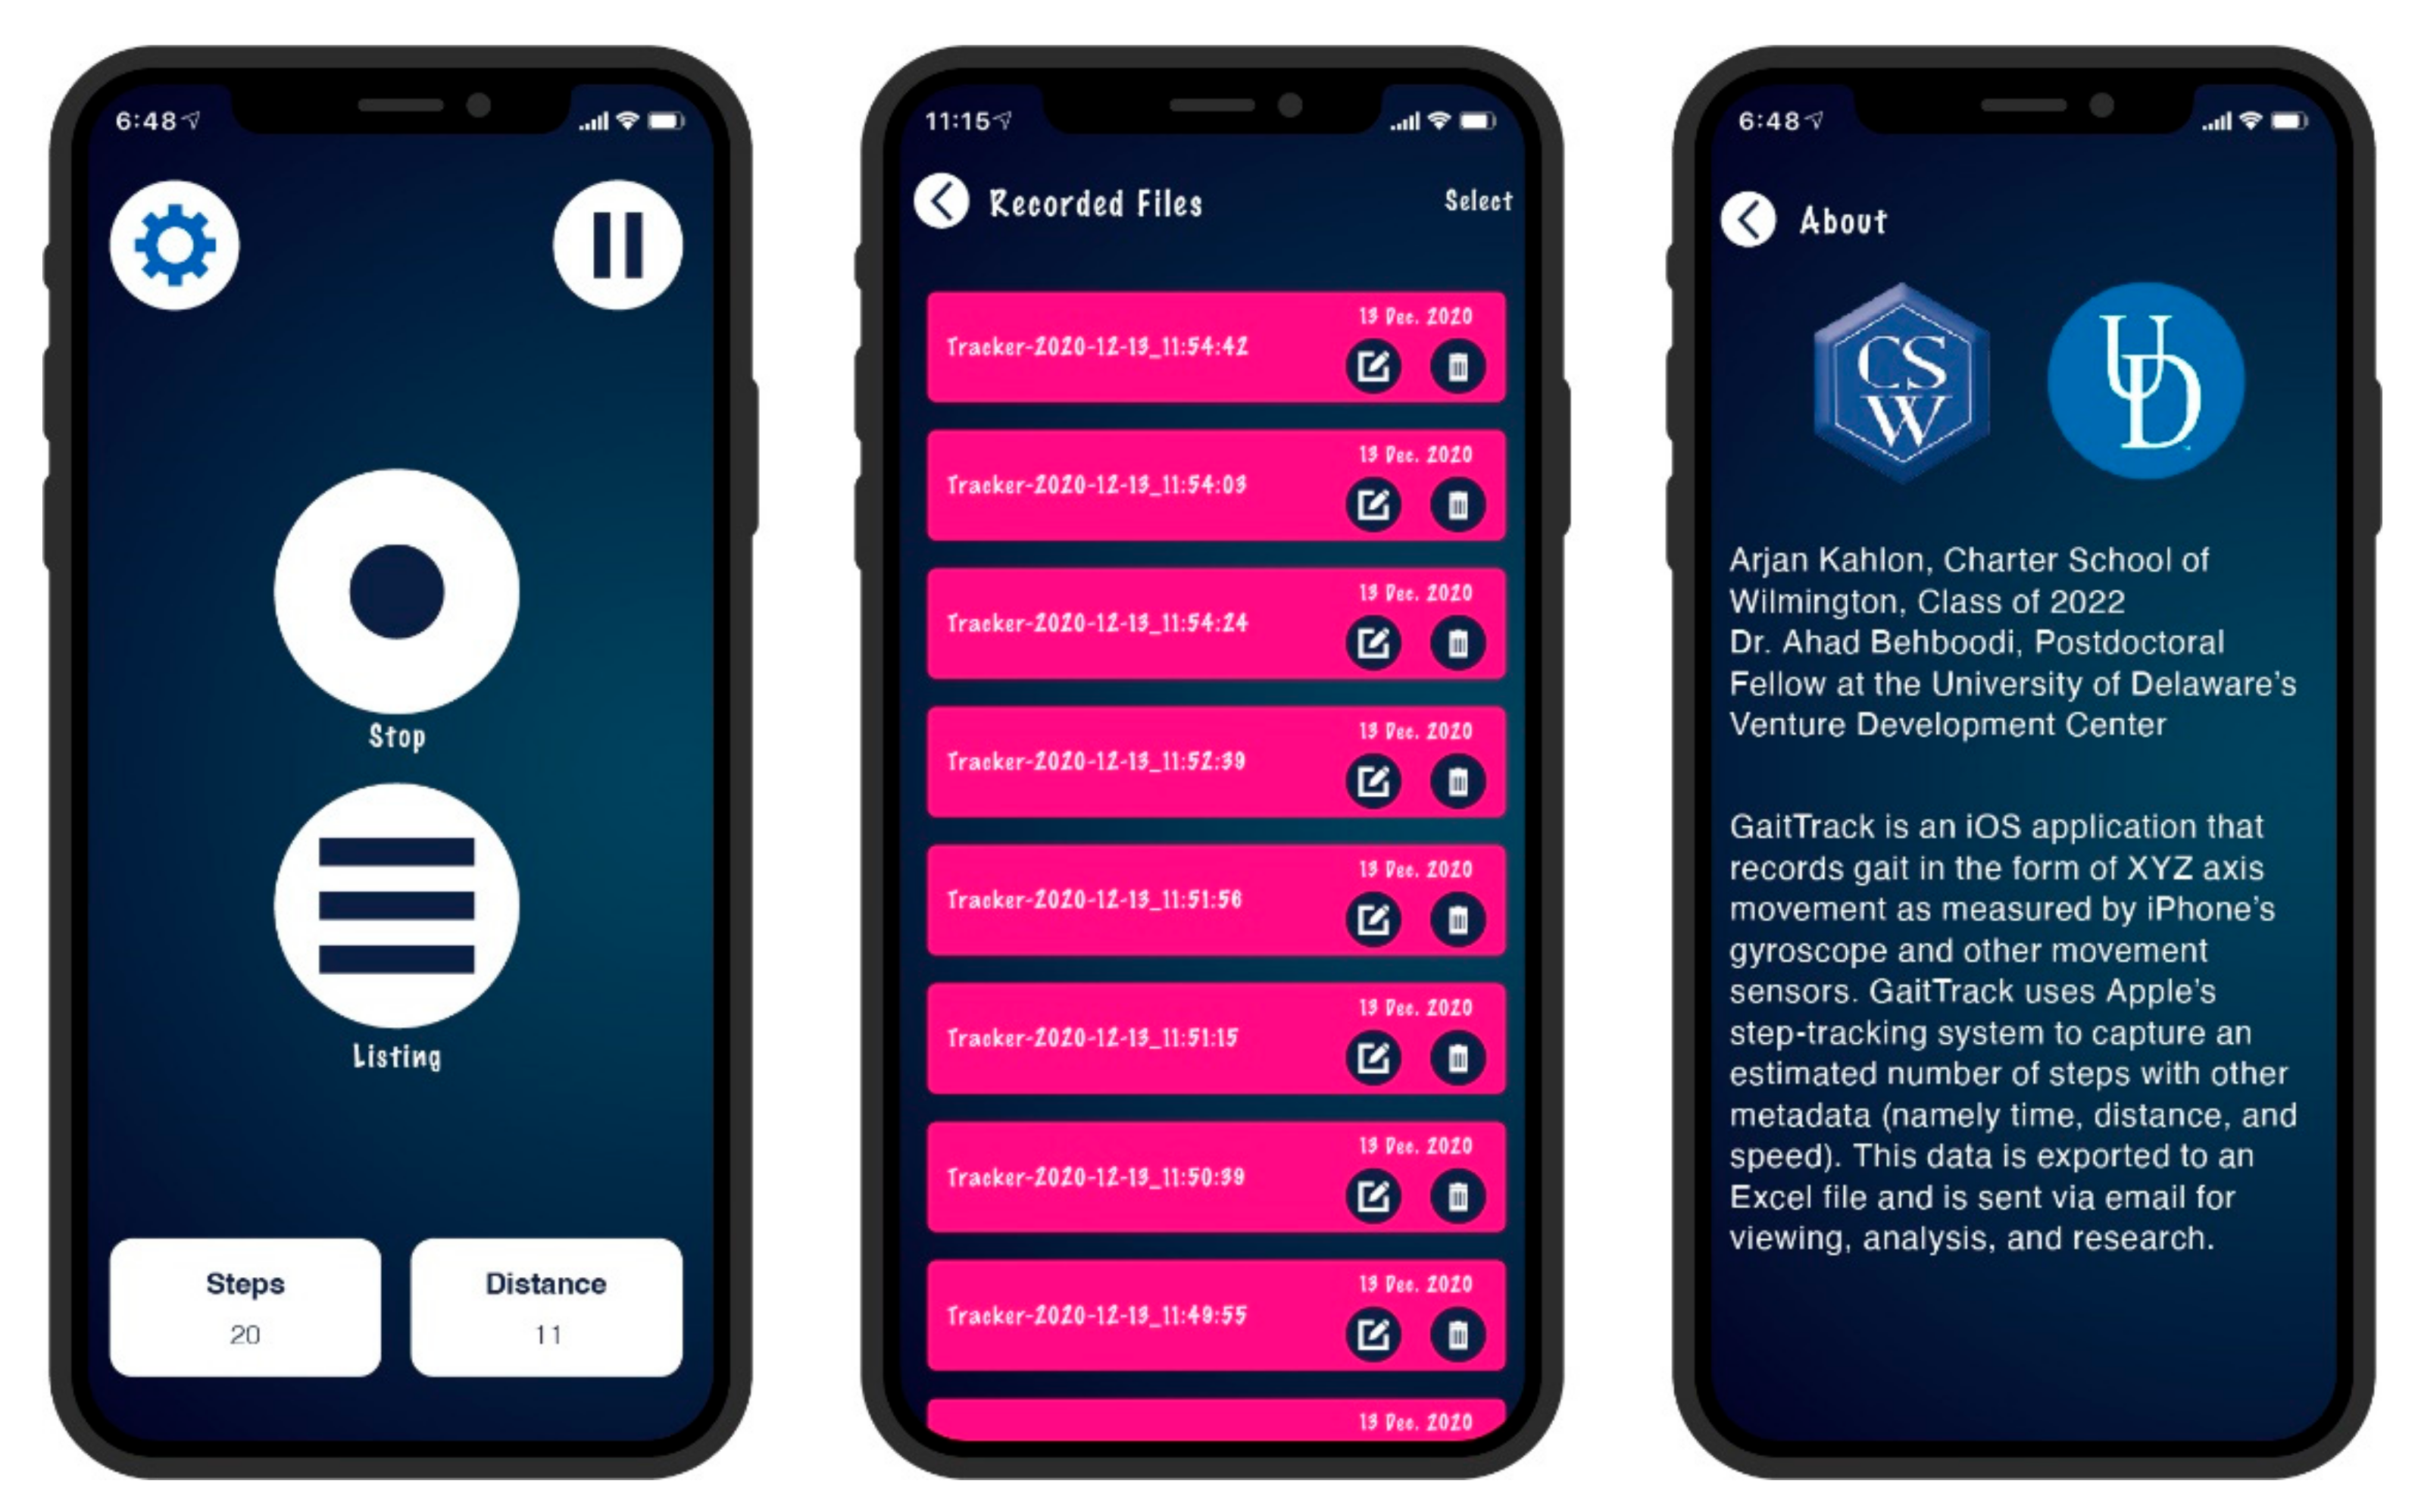
To record and upload each participant’s motion data, we developed and distributed an iPhone application, named GaitTrack, for this experiment, as seen in
Figure 7. GaitTrack was installed via Apple’s TestFlight distribution system and can transmit the collected data via email, making it intuitive for participants to transmit their recordings. The GaitTrack app uses the iPhone’s built-in gyroscope to record the angular velocity of the device along the XYZ axes, sampled at 50 Hz. Due to its more pronounced features in comparison to the other axes, Y axis (mediolateral angular velocity) has been widely used in previous research for gait event detection in wearable applications and was the data stream used for this study. The X- and Z-axis data were also recorded by the GaitTrack app and archived for future analysis purposes.
Pressing the start button to initiate a recording began a 3-s delay timer, allowing the subject ample time to mount the phone without recording this mounting maneuver as signal noise. After an additional 3 s, the app played an audible “start” sound, notifying the participant to begin walking, as the recording of motion data had begun. The app timestamped each trial recording separately, making it easy to reconstruct the order and thus the conditions of each trial should there be an issue in transmission.
2.3. Data Collection
The subjects completed the recording trials individually without researchers’ intervention collecting purely subject-driven gait measurement using GaitTrack. Data collection instructions were emailed to each participant and included downloading, installing, and then utilizing GaitTrack. Remote support was provided (if needed) for the installing and using the application, but not for collecting trial data.
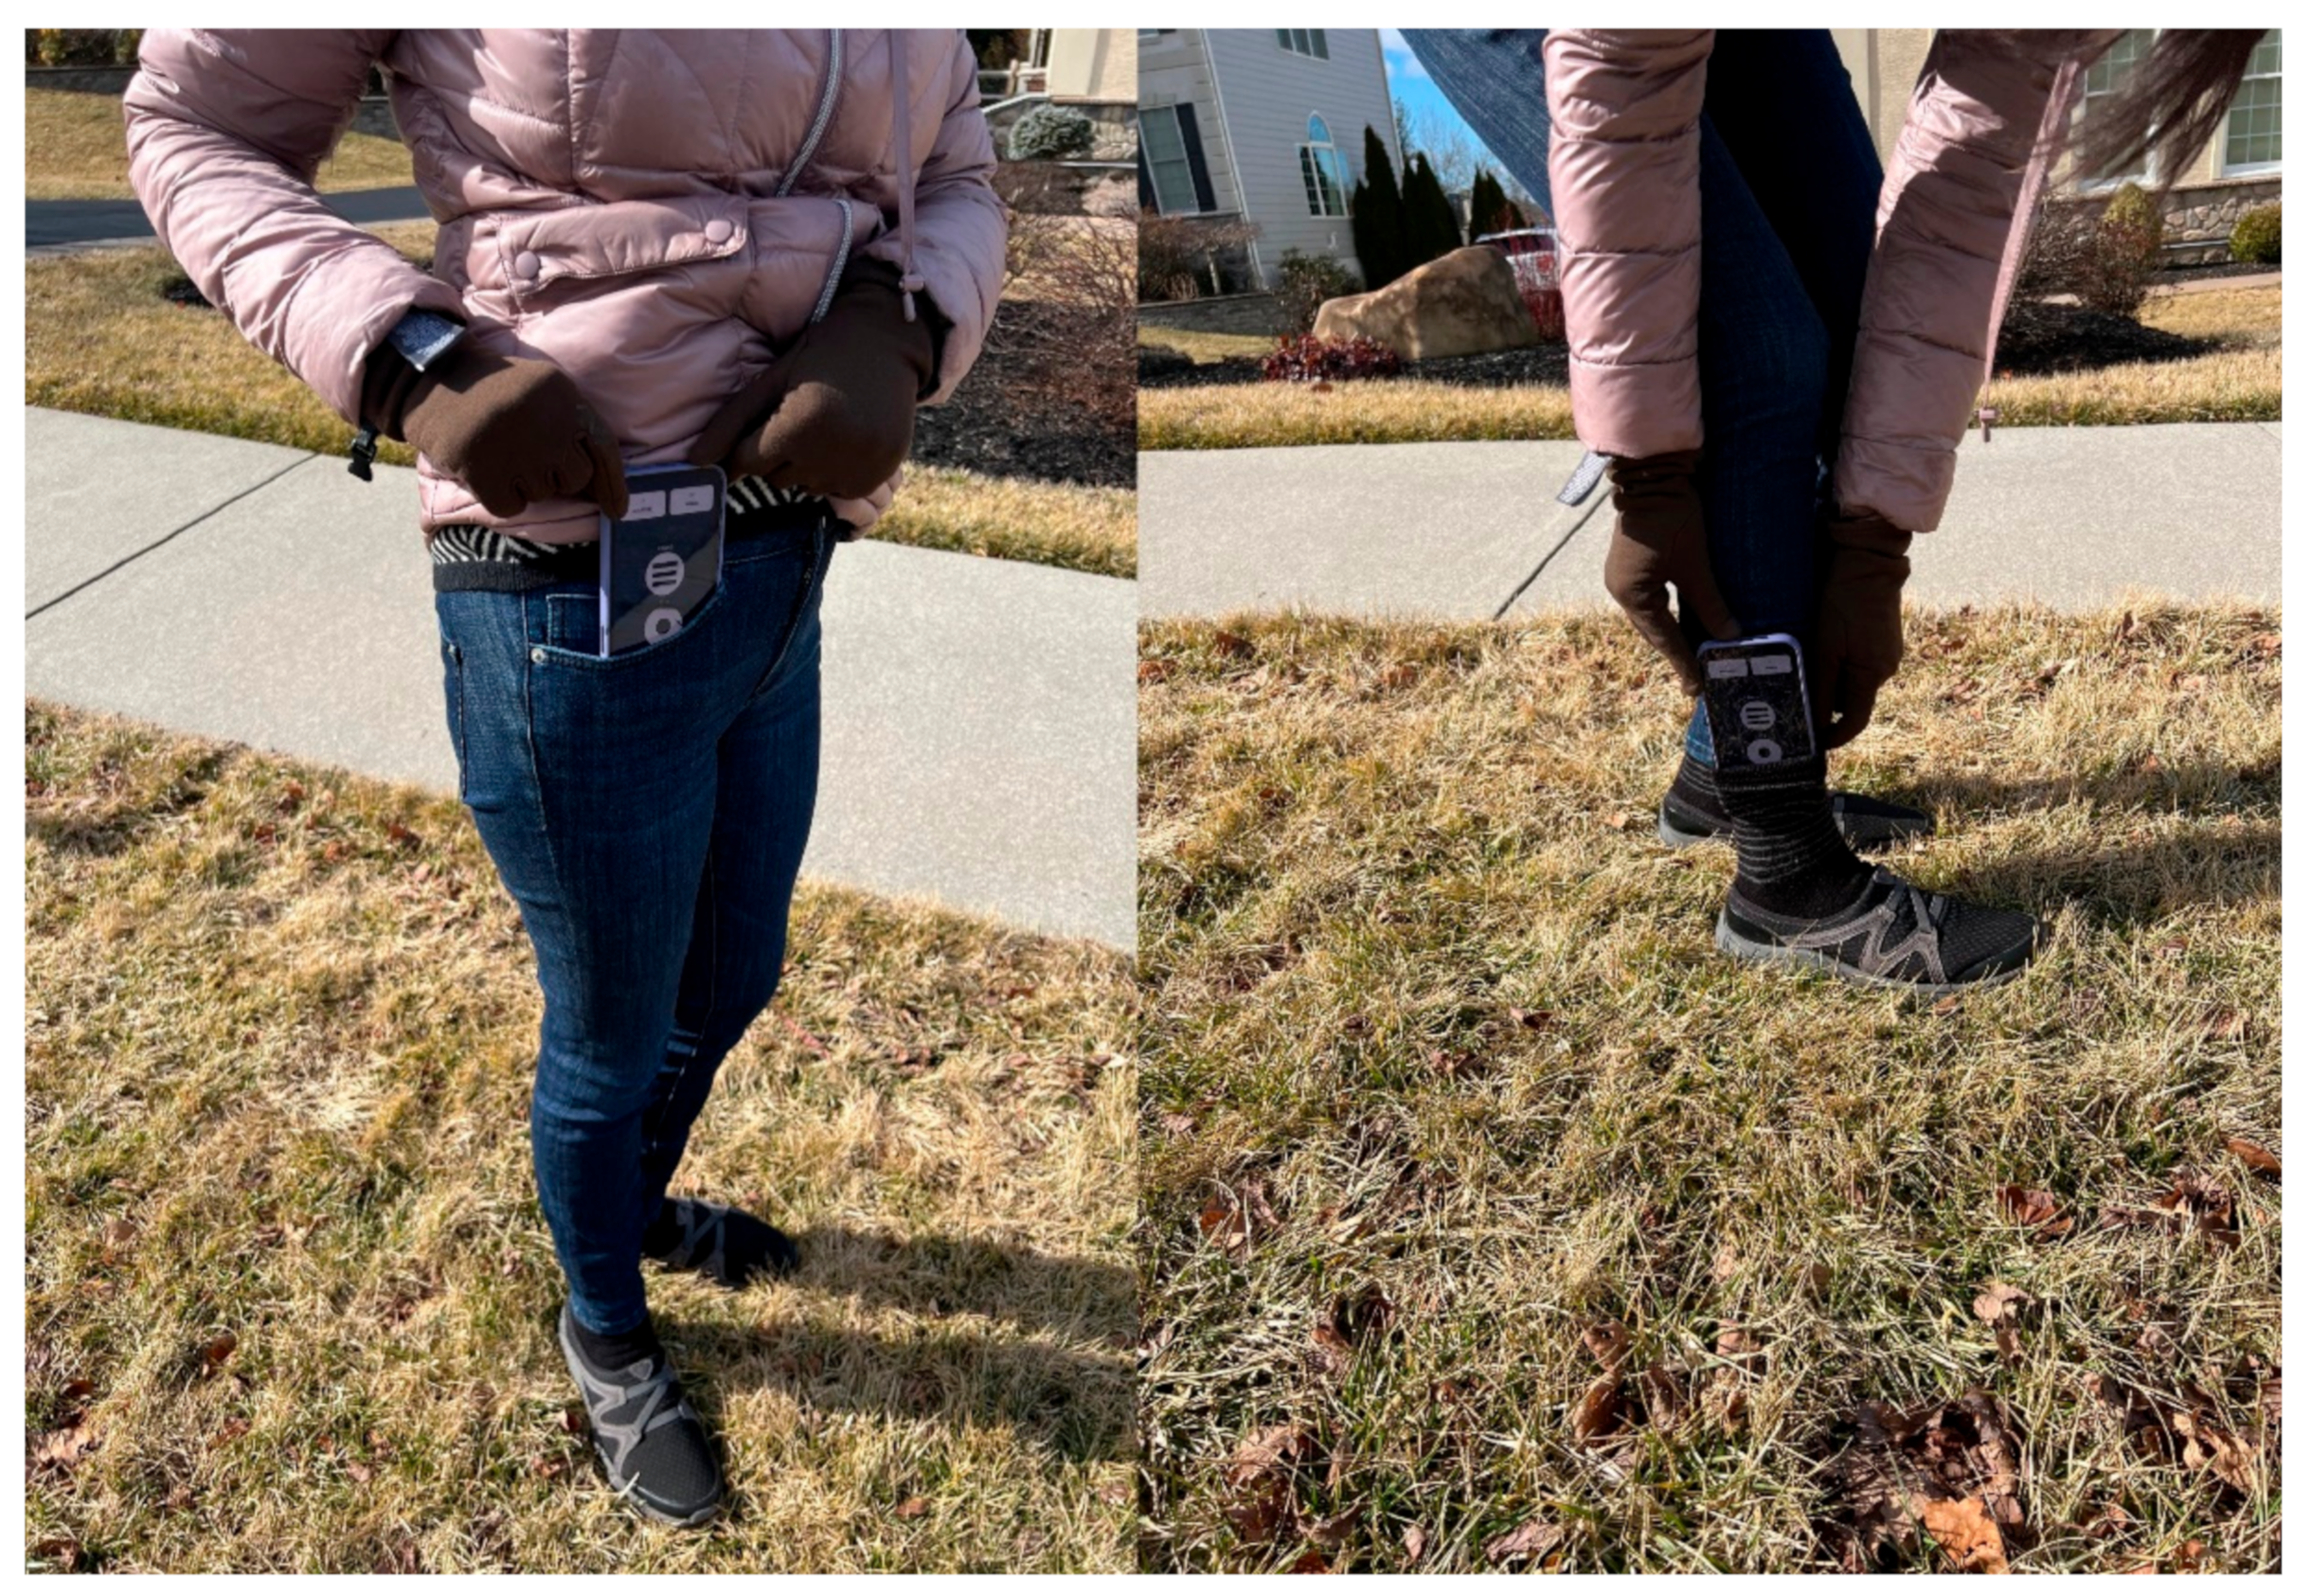
Throughout the experiment, participants wore their preferred clothes and shoes, given that they could accommodate a hip-mounting (right pocket, termed hip in this study) and ankle-mounting (right sock, termed ankle in this study) location for their phone. Subjects were instructed to mount the iPhone in a constant position with the top of the device facing downward and the screen facing outward (down-&-out). The International Society of Biomechanics (ISB) and previous research using a smartphone for gait measurement established a standard [
5] for orienting the axes around human joints to report joint motion. Following this standard, a phone would be placed such that the top of the device is facing upward, “up-&-out”; we chose to instruct participants to orient it at a “down-&-out” position, knowing that we could add a correction factor to return the vector data to the ISB standards. The down-&-out method was chosen to more closely mimic normal smartphone usage. More importantly, it eliminated the risk of inadvertently stopping the recording mid-trial if skin contact accidently hit the Stop button of the GaitTrack screen.
Figure 8 shows a subject mounting their phone in the specified orientation at both the hip and ankle locations. The mounting locations were selected because they (1) provide an accurate measurement of velocity at the ankle and hip; (2) require no training, support, or equipment to set up; and (3) most closely approximate locations that are readily reproducible by subjects. By using mounting locations and orientations that are readily reproduced by subjects, we aimed to increase scalability and trial completion rates and facilitate self-implementation.
After properly configuring the GaitTrack app for data collection, participants were instructed to locate an unsloped and straight surface (asphalt or concrete), mount the phone in the correct orientation, and walk for 20 straight steps on the surface at a natural pace with the phone mounted on the hip (in pocket). Subjects were instructed to complete 12 trials of outdoor overground walking under 2 conditions, six trails on a flat asphalt surface, and then six trials on grass. A complete documentation of the instructions given to participants can be found at
http://tiny.cc/GaitData (accessed on 30 December 2021). A 15-day data collection period for all subjects was defined to minimize seasonal weather and atmospheric variations to the data as the trials were, by necessity, performed outdoors. Asphalt condition began with the phone mounted at the hip location (in the right front hip pocket), switched to the ankle location (in the right sock), and alternated as such twice more for a total of six asphalt trials; this entire process was then repeated on grass to yield 12 trials alternating between hip and ankle; this alternating method was done to ensure that measured differences across mounting locations were not the result of shifting gait over during the duration of the trials. Each trial contained 20 steps (10 complete gait cycles).
In this manner, each participant’s dataset contained asphalt hip, asphalt ankle, grass hip, and grass ankle. For each trial, subjects walked at a self-selected speed in a straight line, avoiding turns to maintain consistently oriented angular velocity vectors. Once recorded, GaitTrack transmitted the trial via email for offline analysis. Thereby, we received 69 total datasets. After scanning those for data completeness, the clean datasets, 57, were uploaded to a remote, cloud-based data server for secure storage to preserve the original copy of the data, including the X, Y, and Z-axis data, and to be screened and processed to ensure the validity, file integrity, and presence of exactly 12 complete, properly recorded, and correctly transmitted trials per subject.
2.4. Data Processing
A custom-written program in MATLAB (Mathworks, Natick, MA, USA) was used for data extraction purposes as shown in the data flowchart in
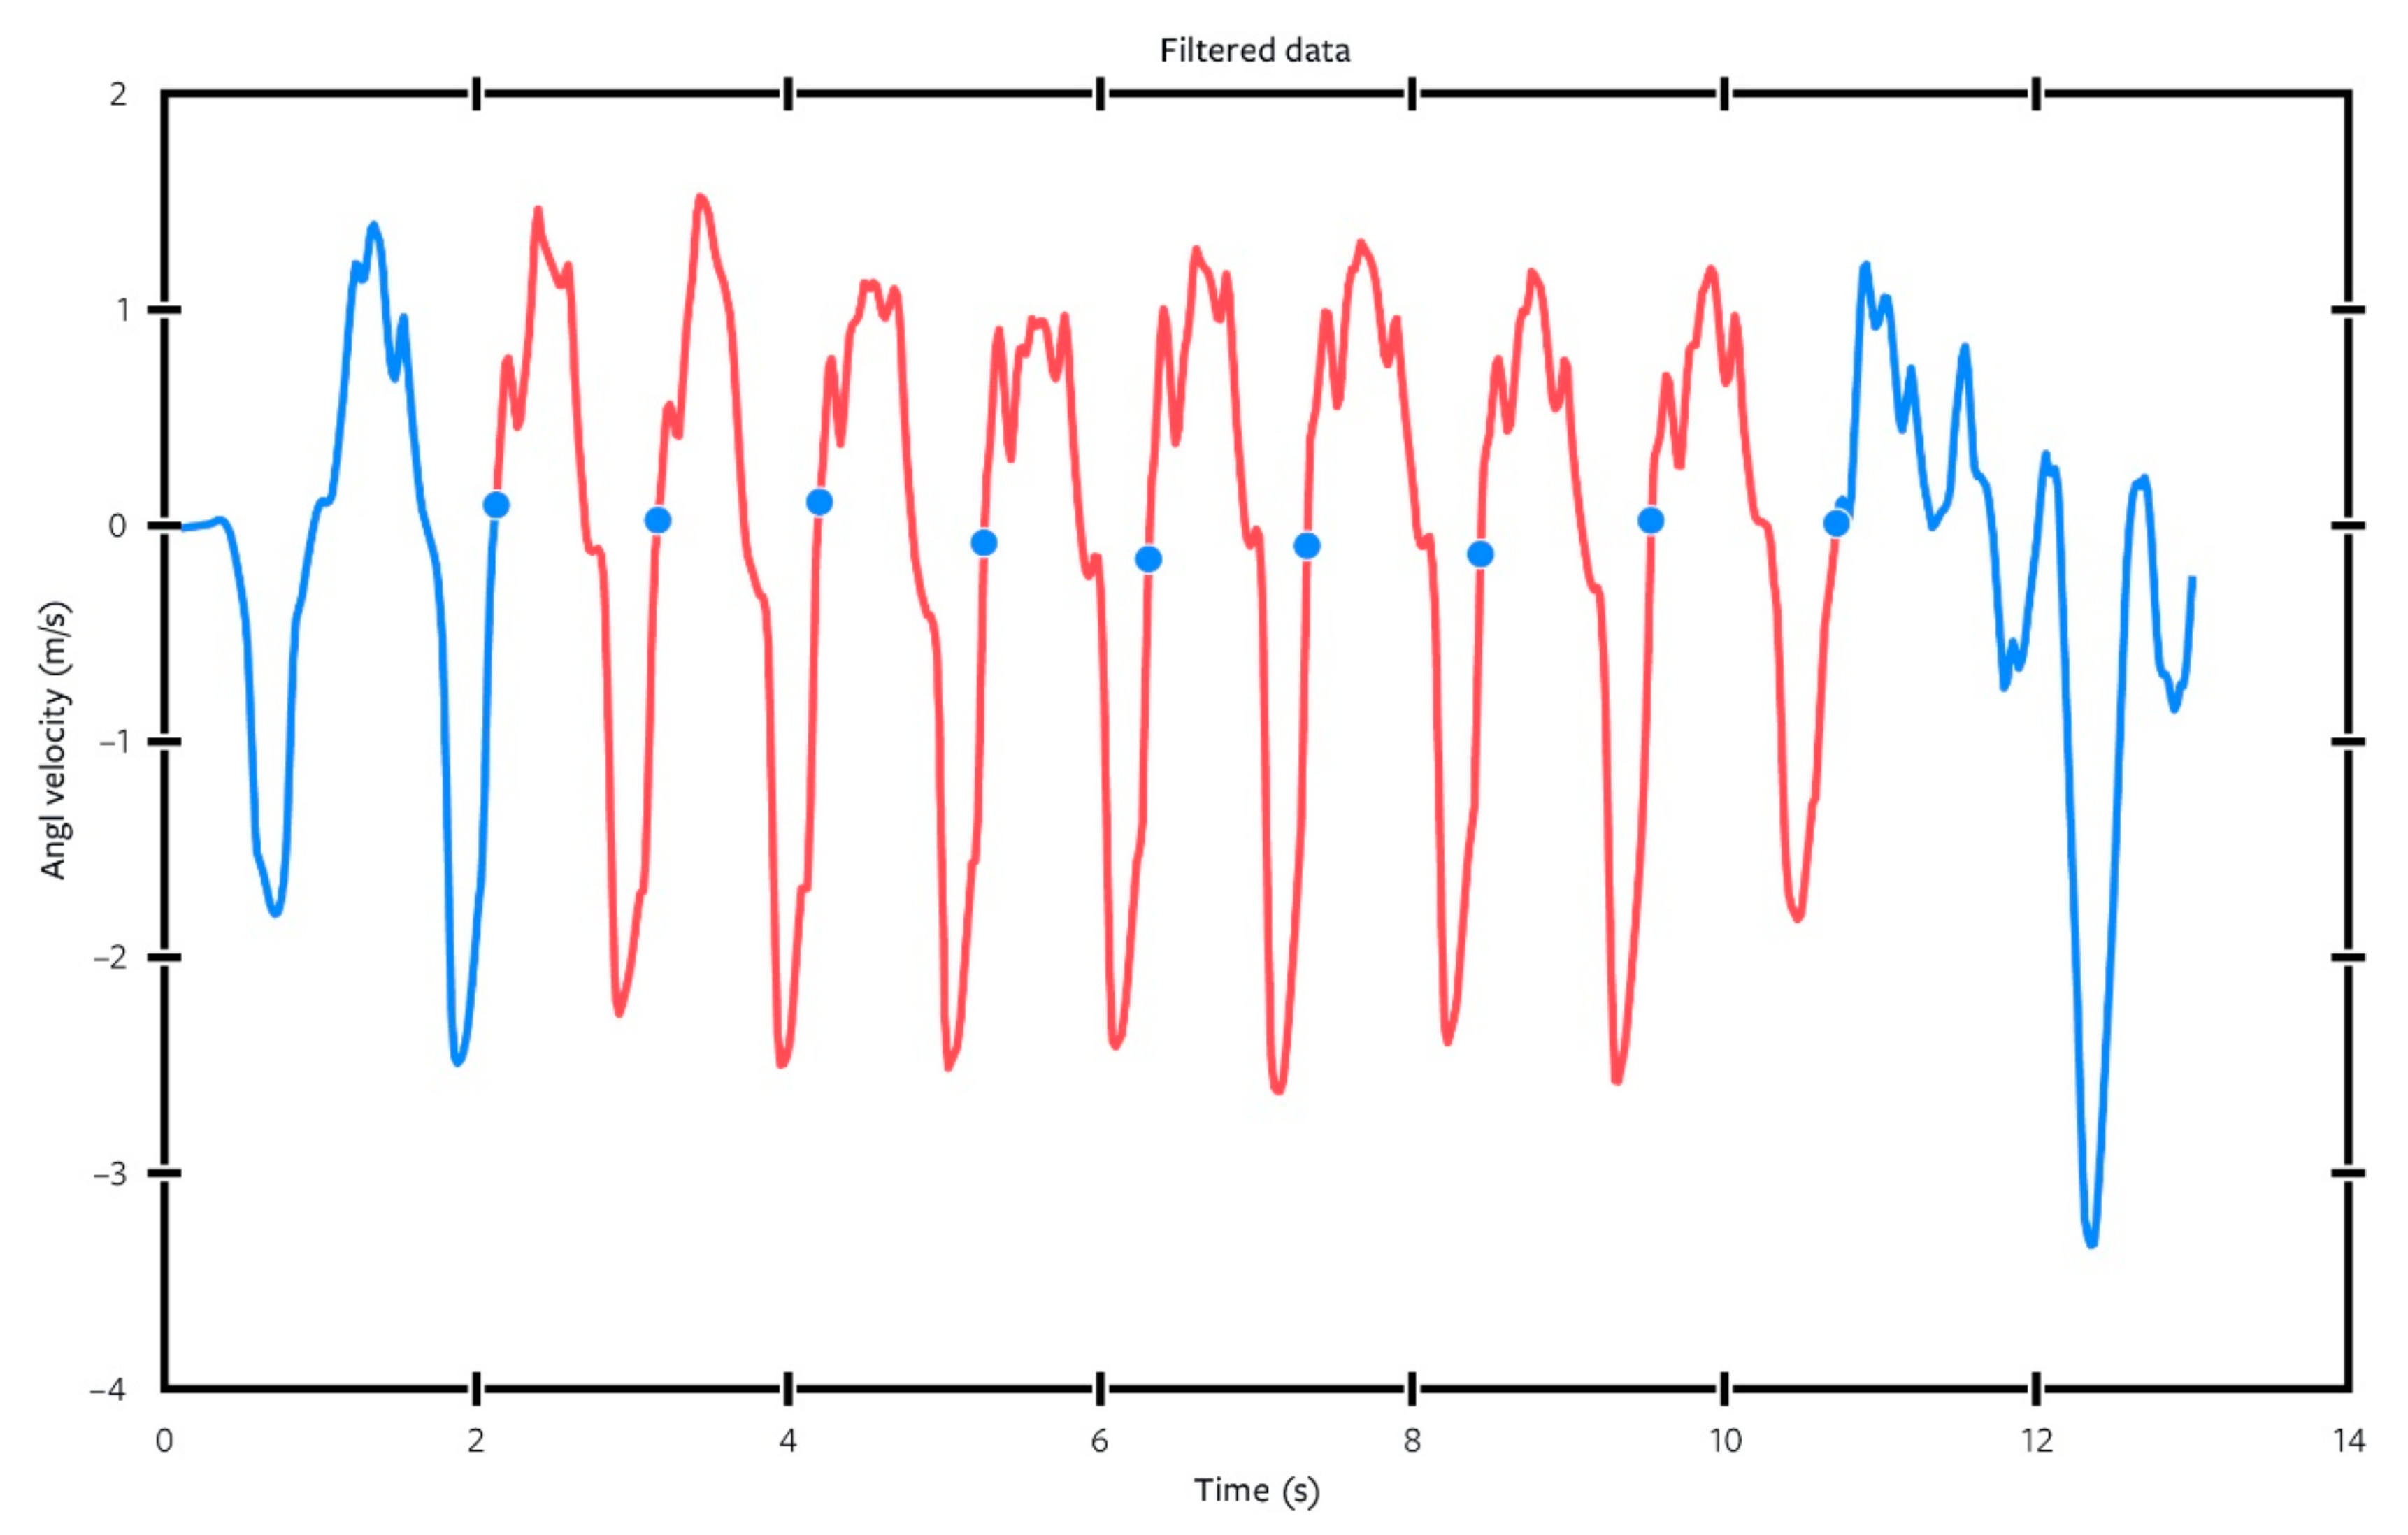
Figure 4. The program begins by inverting the Y-data (multiplied by −1) so that its direction follows the established ISB standard and allows for comparison of the results with those of existing literatures. The data were then passed through a moving-average instance of MATLAB’s “filter” function (a 1-D digital filter), to remove signal noise, resulting in a signal that could be analyzed automatically with a higher degree of accuracy, as seen in
Figure 9.
Using the filtered angular velocity data, the program identified both (a) the prominent peak and valley and (b) zero-crossings in each gait cycle (the first zero-crossing being negative-to-positive and second zero-crossing going from positive-to-negative). The function trimmed the ends of each file to remove mechanical signal noise, which was created by mounting/dismounting the smartphone (either at the beginning or the end of each recording). To avoid irregularity caused by acceleration and deceleration, the first and last gait cycles were not used for the analysis, resulting in eight gait cycles per trial. Each trial was then graphed and visually checked for adequate representation to increase standardization of the data. When necessary, the period of eight gait cycles was shifted forward or backward to minimize data noise at either end of the trial and to best capture the representative consecutive eight gait cycles from the data set.
The primary and secondary parameters (outcome measures) were then calculated as follows:
Primary parameters/outcome measures (full cycle):
Cycle duration time, defined as the time difference between two consecutive heel strikes (zero-crossings when mediolateral angular velocity goes from negative values, i.e., counter-clockwise rotation, to positive).
Secondary parameters/outcome measures (full cycle)
Valley depth: defined as the absolute magnitude of angular velocity during swing.
Peak-to-valley, the difference between the magnitude of the highest peak in stance and the lowest valley in swing.
Sub Peak-to-valley: defined as the largest peak-to-valley distance on each subinterval (eight gait cycles) of one full trial.
Secondary parameters/outcome measures (intra-cycle)
Stance time, defined as the time difference between the first zero-crossing, heel strike, to the second zero-crossing, toe off (where mediolateral angular velocity goes from values positive to negative).
Swing time, defined as the time difference between the second zero-crossing, toe off, to the third zero-crossing (from negative to positive).
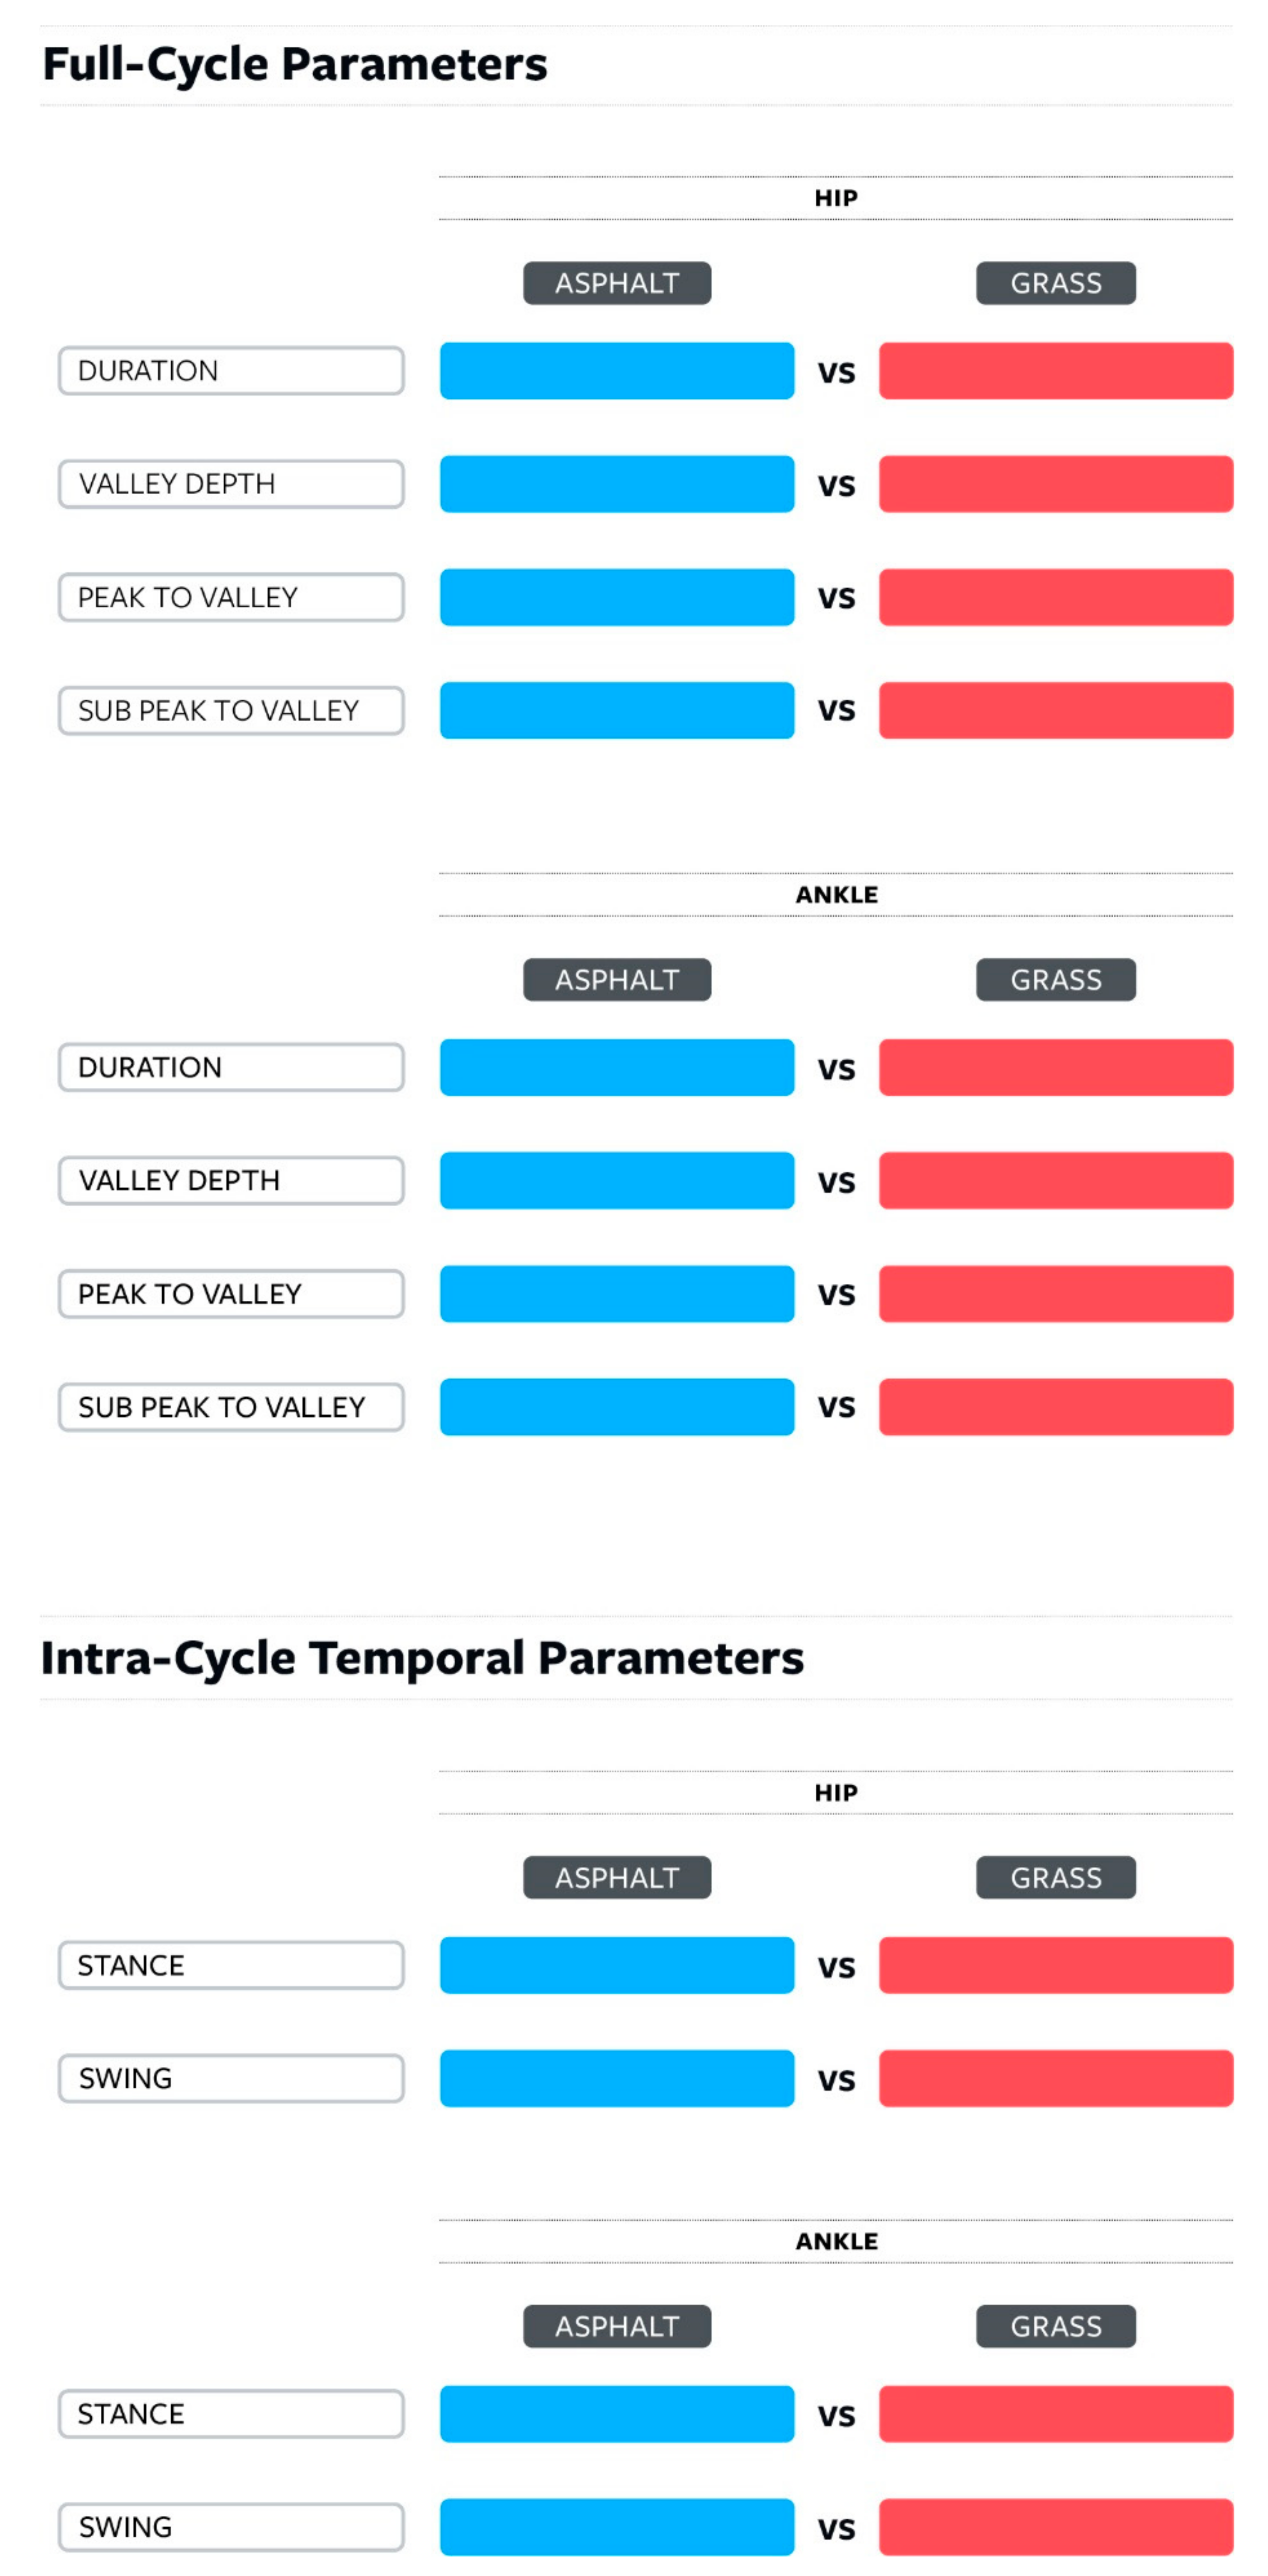
All the measured parameters are depicted in the gait cycle in
Figure 10 and are listed in
Figure 11. The outcome measures are divided into two sub-groups: full-cycle and intracycle measures.
2.5. Statistical Analysis
All statistical analyses were conducted using SPSS (version 28, SPSS Inc., Chicago, IL, USA). The two groups in the study were the two different terrains: grass and asphalt, with the dependent variables being the measured parameters (duration, valley depth, peak-to-valley, sub peak-to-valley, stance duration, and swing duration). Within each parameter, we assessed the normality for each group of the 57 mean values using histograms, QQ plots, and Shapiro–Wilk tests. From the 24 parameter mean values per subject, 12 comparative pairs were derived to compare identical measurements, with each parameter on asphalt terrain being compared to the same parameter on grass (see
Figure 11). Either a Paired
t-test (when both sets of mean values were parametric) or Wilcoxon Signed-Ranks test (when one or both sets of mean values were nonparametric) was run to identify differences in these comparative data sets. The relationship between sex, age and duration measures was statistically analyzed using Pearson’s correlation coefficient. Regardless of the statistical test used above, significance was defined as having an unadjusted alpha significance value < 0.05, following statistical guidelines.
3. Results
In this study, 57 usable datasets were collected and analyzed from subjects between 40 to 60 years old with an average age of 49.68 years old (SD = 4.12 years).
Due to the nature of purely subject-driven data collection, there was some loss of data. Of the 69 participants who completed the study and submitted data, 12 data sets were incomplete, which resulted in 57 complete sets usable for analysis. (Review of the group data both with and without the 12 sets revealed no significant change to the group’s demographic data). To capture this previously unreported data subset, we termed this the participants’ data submission error rate (DSER), defined as the number of invalid data sets divided by number of total data sets collected and reported as a percentage. In this current study, the DSER was 12/69, or 17.4%.
Of the 24 parameter values, we analyzed the direct comparison between the 12 datasets from asphalt to each corresponding dataset from grass (from
Figure 11), since these comparisons allowed direct asphalt to grass comparison for a given variable and mounting condition.
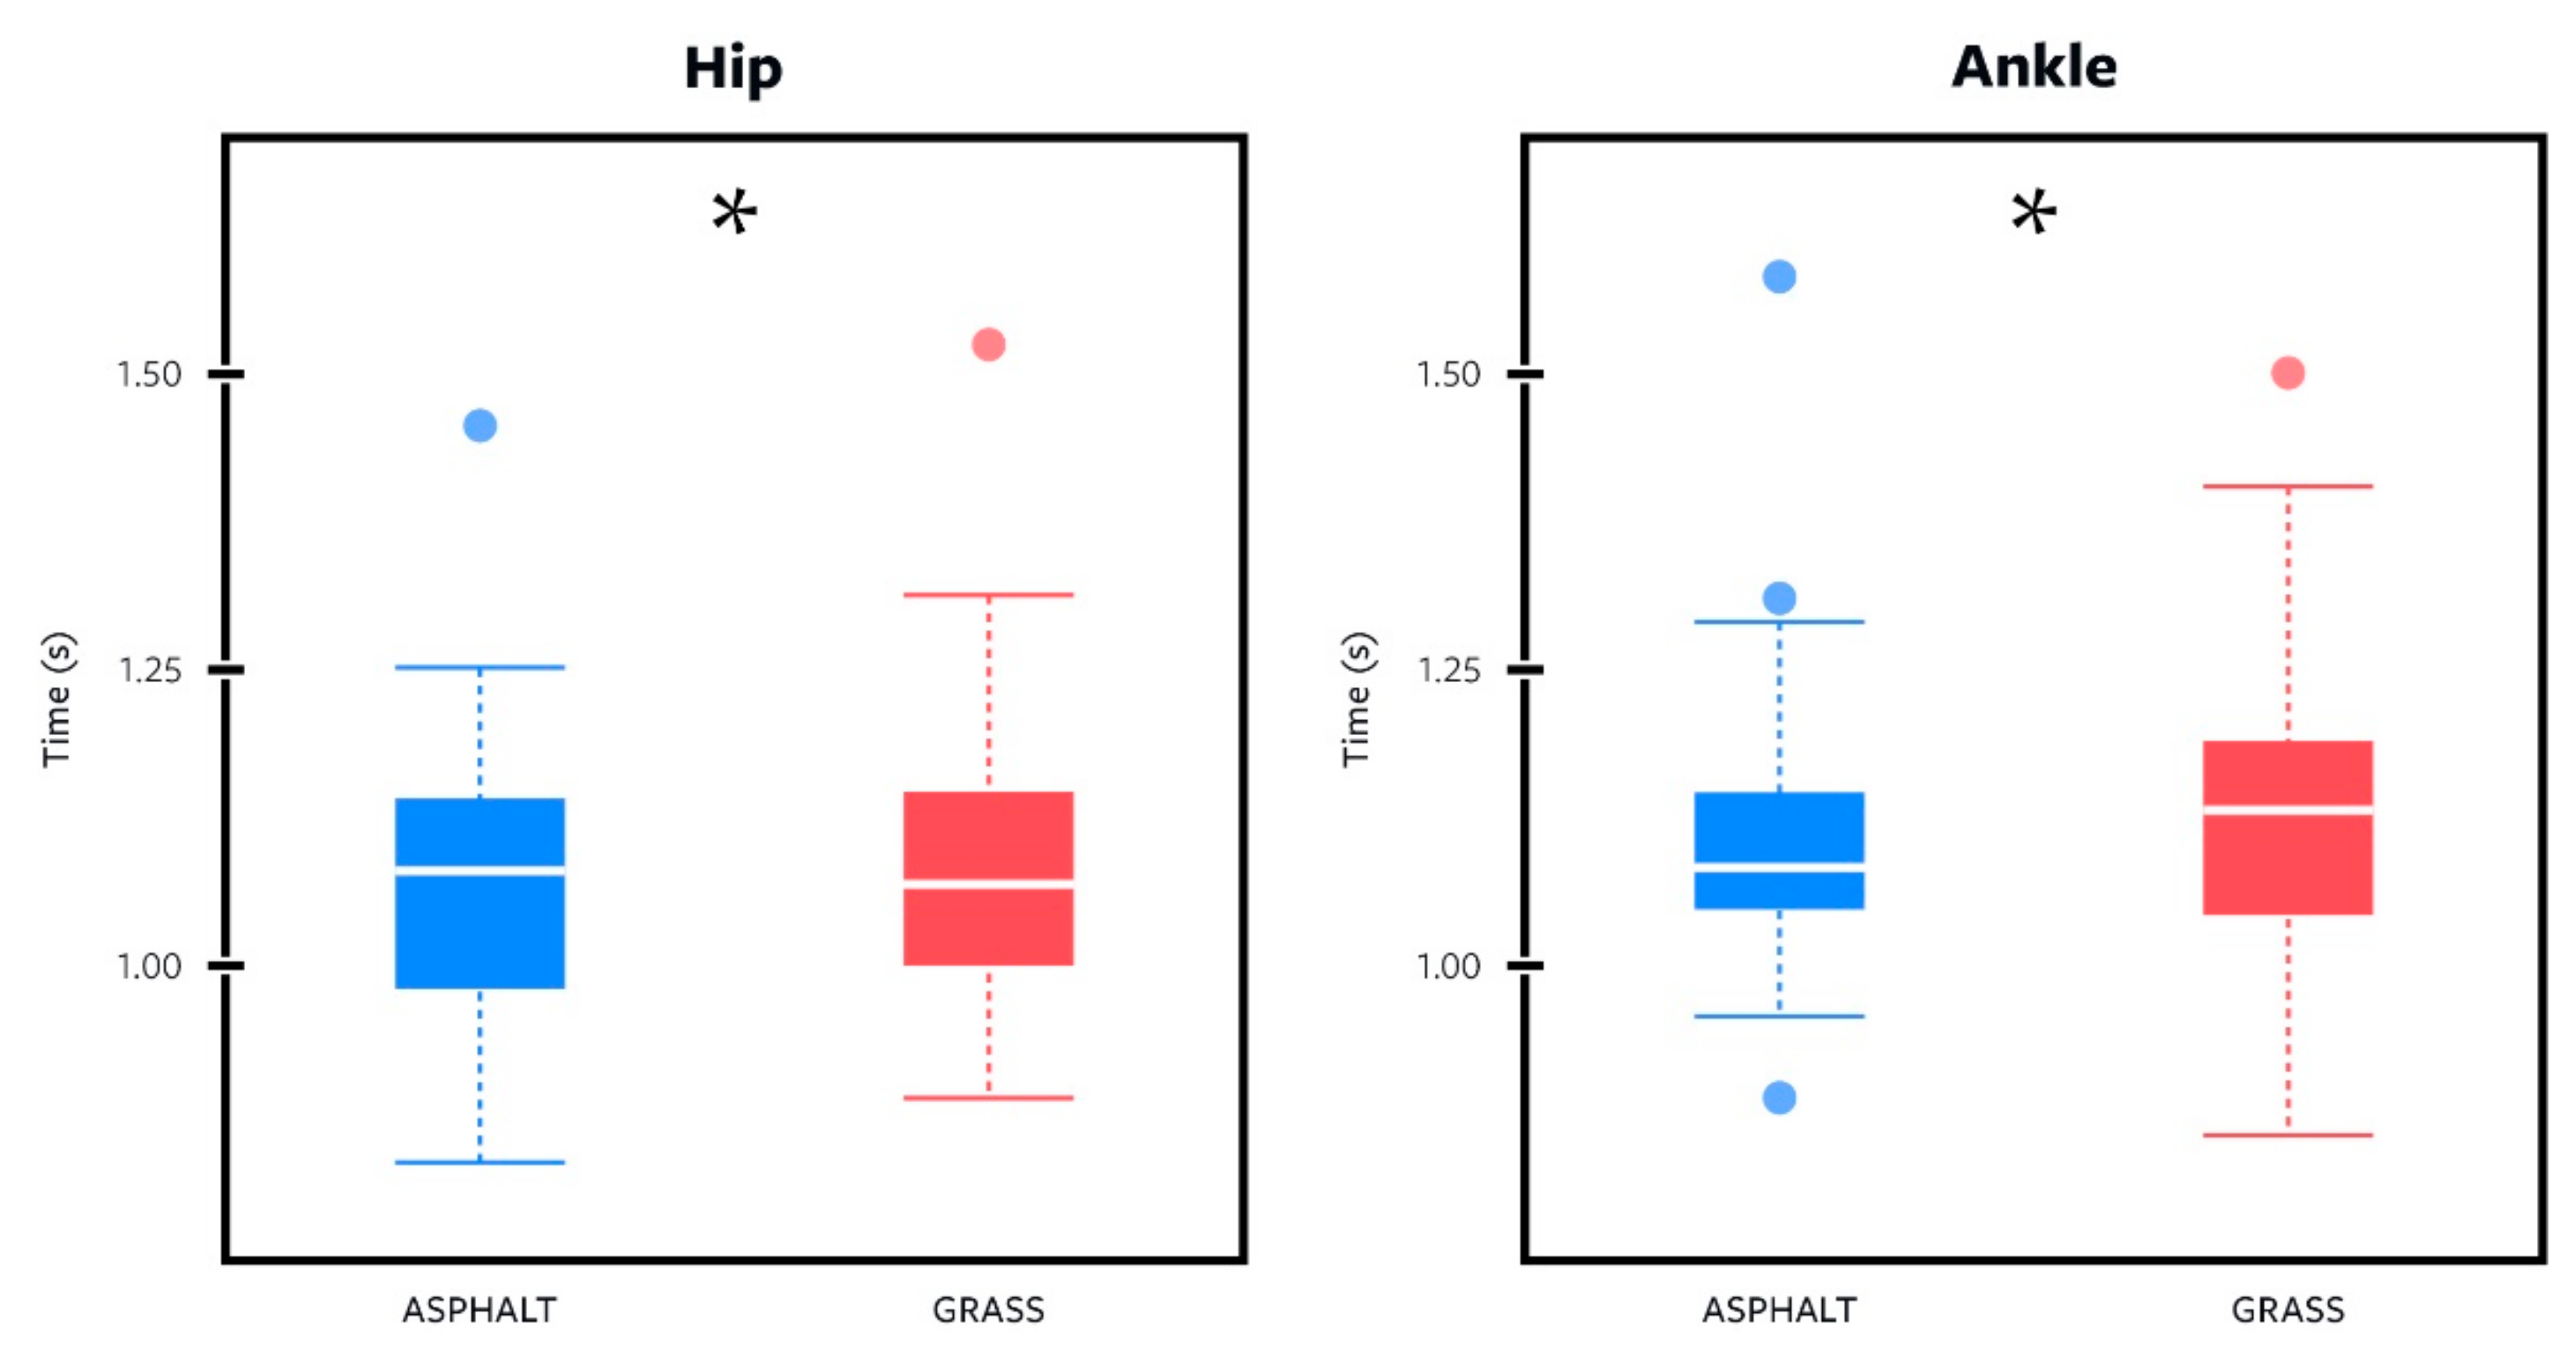
A boxplot representing the distribution of cycle duration values, a primary outcome measure, is shown in
Figure 12. At first glance, the distributions appear to be similar due to the minimal variations, however, zooming in with statistical analysis reveals their difference to be statistically significant, with grass having larger values than asphalt across both mounting locations.
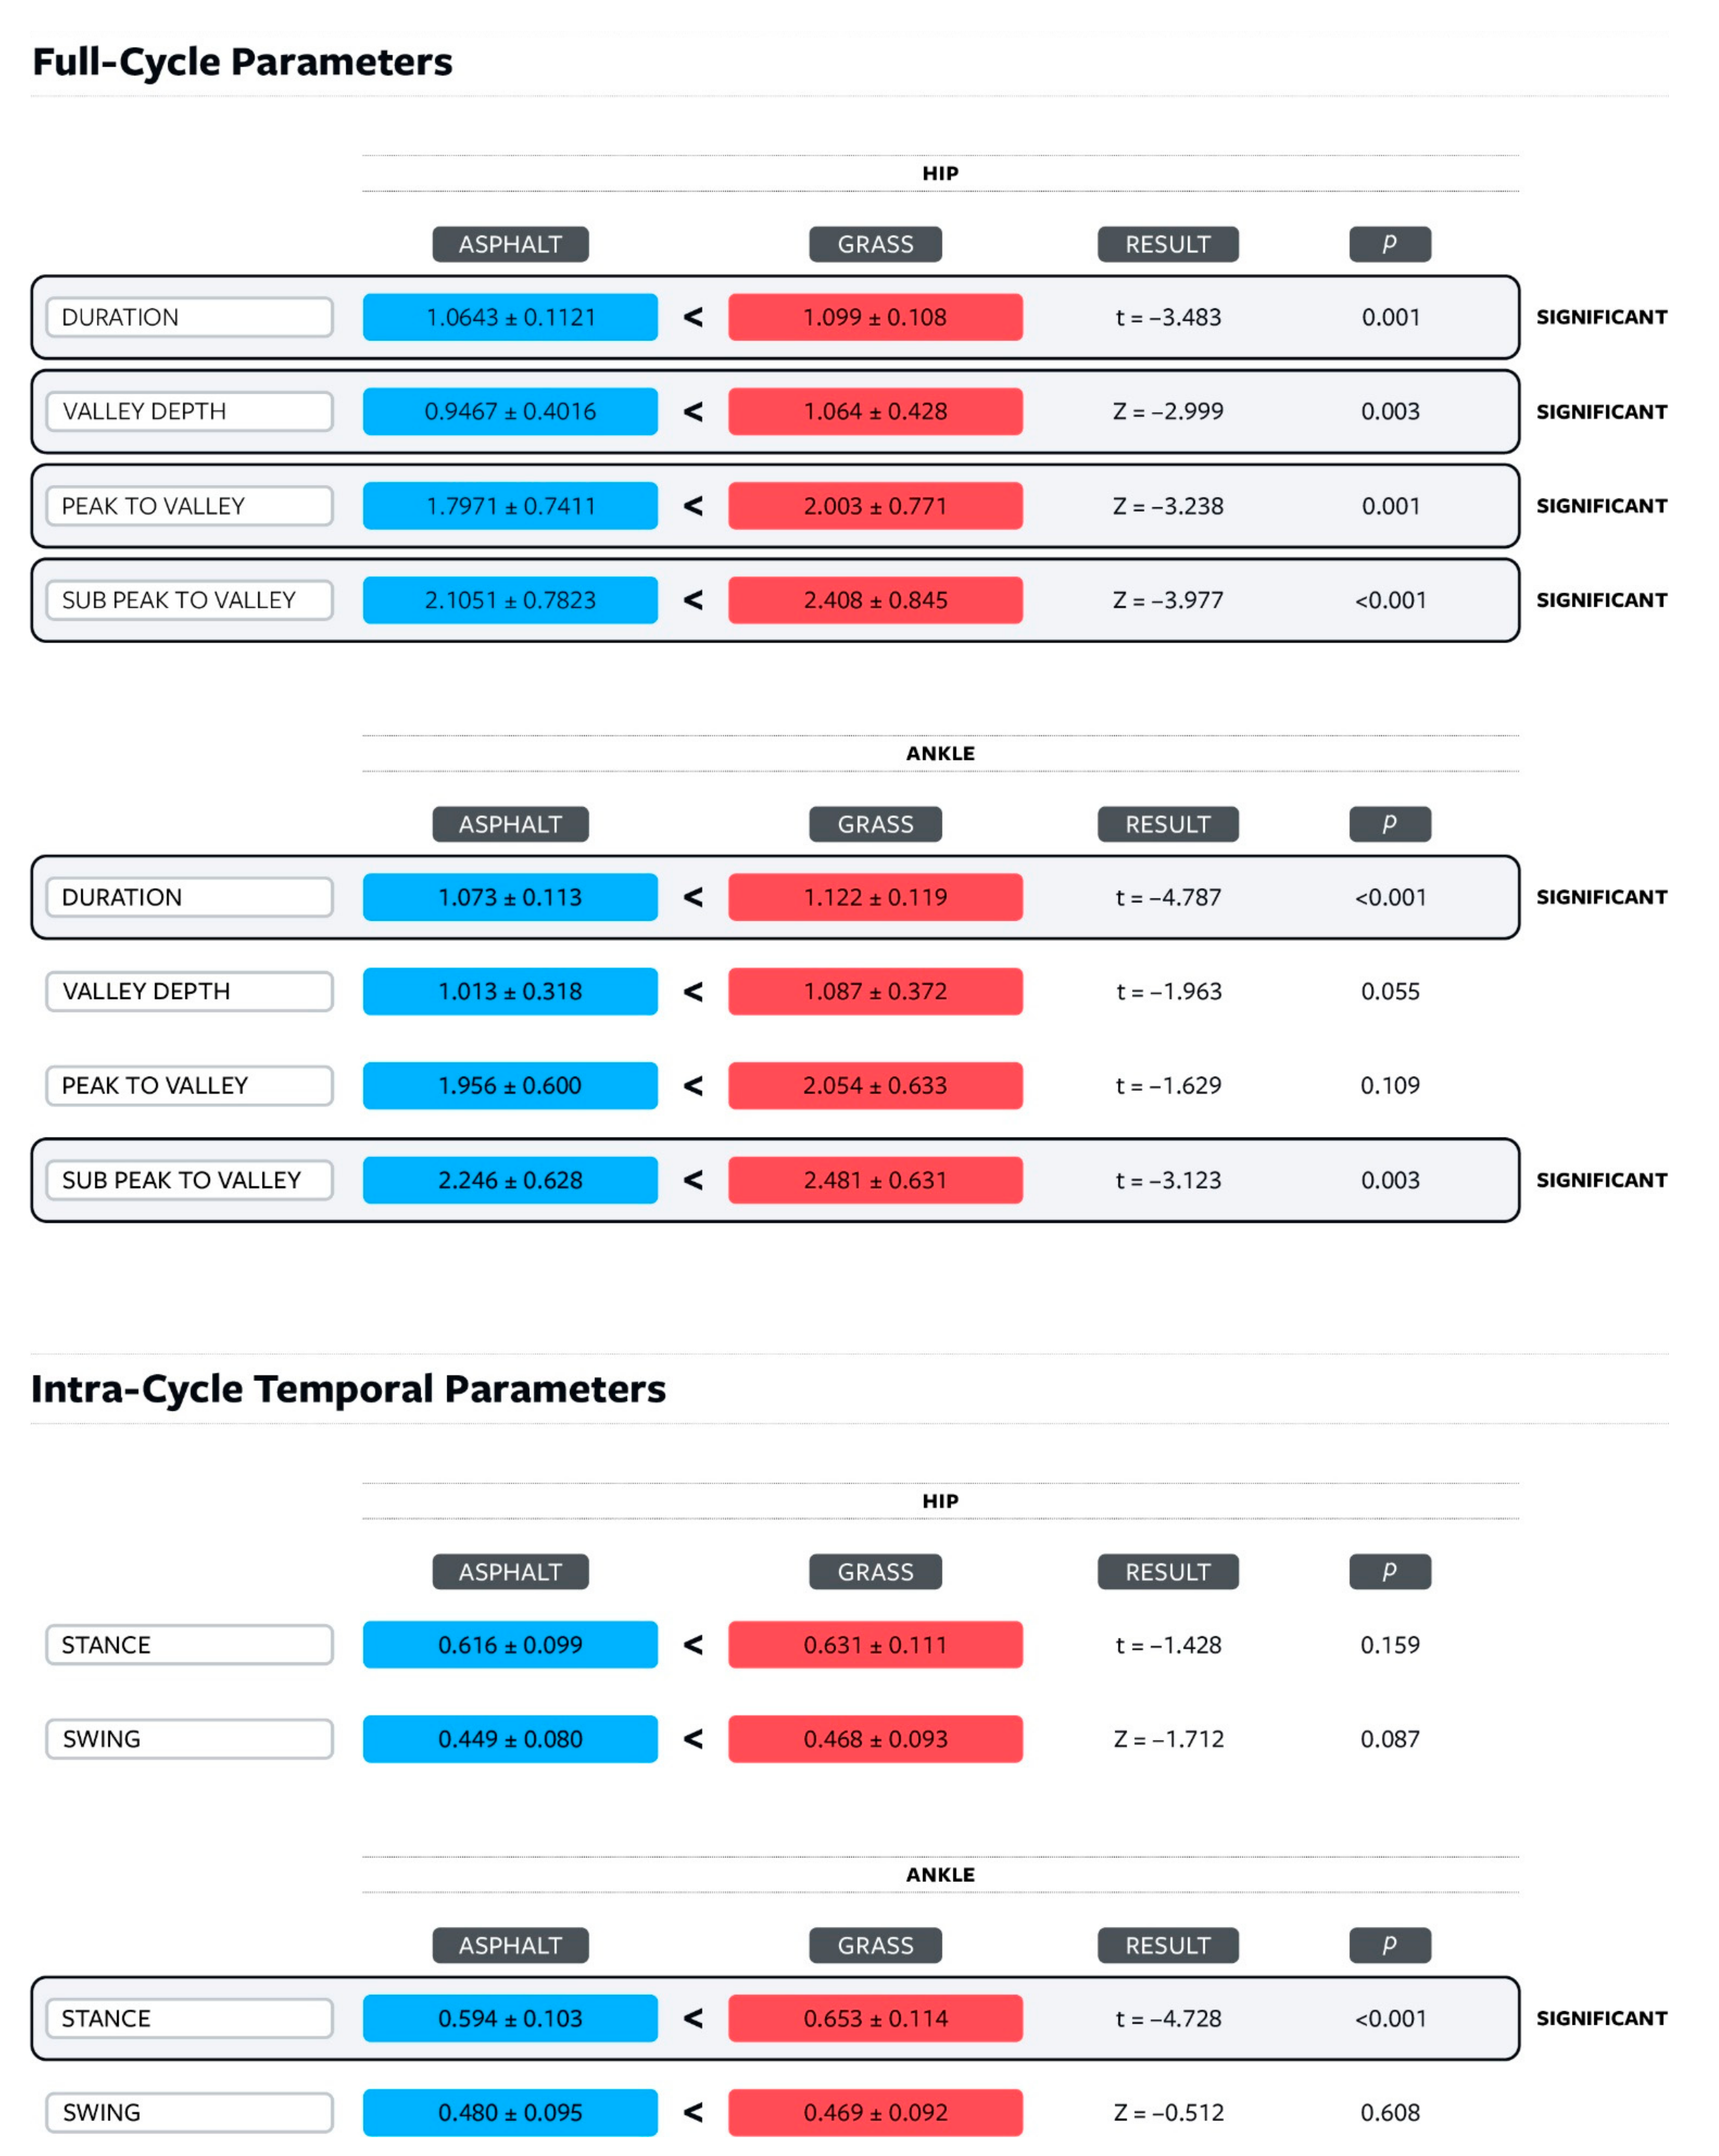
Across the 12 parameter comparisons between the different terrains, there was a trend towards higher measurements across all spatiotemporal parameters for grass when compared to asphalt as shown in
Figure 13. Of the 12 comparisons, 8 were full-cycle comparisons and 4 were intra-cycle comparisons.
In the full-cycle parameters comparisons (cycle duration, valley depth, peak to valley, and sub peak to valley), six of the eight showed a statistical difference between asphalt and grass (p < 0.05). When the smartphone was mounted at the hip, all four comparisons of the gait analysis parameters were significant. With the smartphone mounted at the ankle, two of the four comparisons were significant, while a third had p = 0.055.
Below are the eight full-cycle comparisons between a given parameter on asphalt and its grass counterpart and which statistical test was used for each pair. Six of the eight comparisons show statistical significance (
p < 0.05). The raw mean values and statistical significance are presented in
Figure 13.
Shown below are the four comparisons between a given intra-cycle temporal parameter, stance, and swing time, on asphalt and its grass counterpart, which were used to confirm the integrity of the gait cycle across terrains. Three of the four comparisons showed statistically insignificant results (p > 0.05).
- 3
With the smartphone placed at the hip,
Paired Samples t-Test indicated that stance duration on grass was more than that for asphalt (t = −1.428, df 56, p = 0.159). However, these differences were not statistically significant.
Wilcoxon Signed-Ranks test indicated that the swing duration on grass (mean rank = 29.77) was more than for asphalt (mean rank = 27.77), Z = −1.712, p = 0.087. However, these differences were not statistically significant.
- 4
With the smartphone placed at the ankle,
Paired Samples t-Test indicated that stance duration on grass was significantly more than that for asphalt (t = −4.728, df 56, p < 0.001).
Wilcoxon Signed-Ranks test indicated that the swing duration on grass (mean rank = 25.40) was more than for asphalt (mean rank = 33.00), Z = −0.512, p < 0.608. However, this difference was not statistically significant.
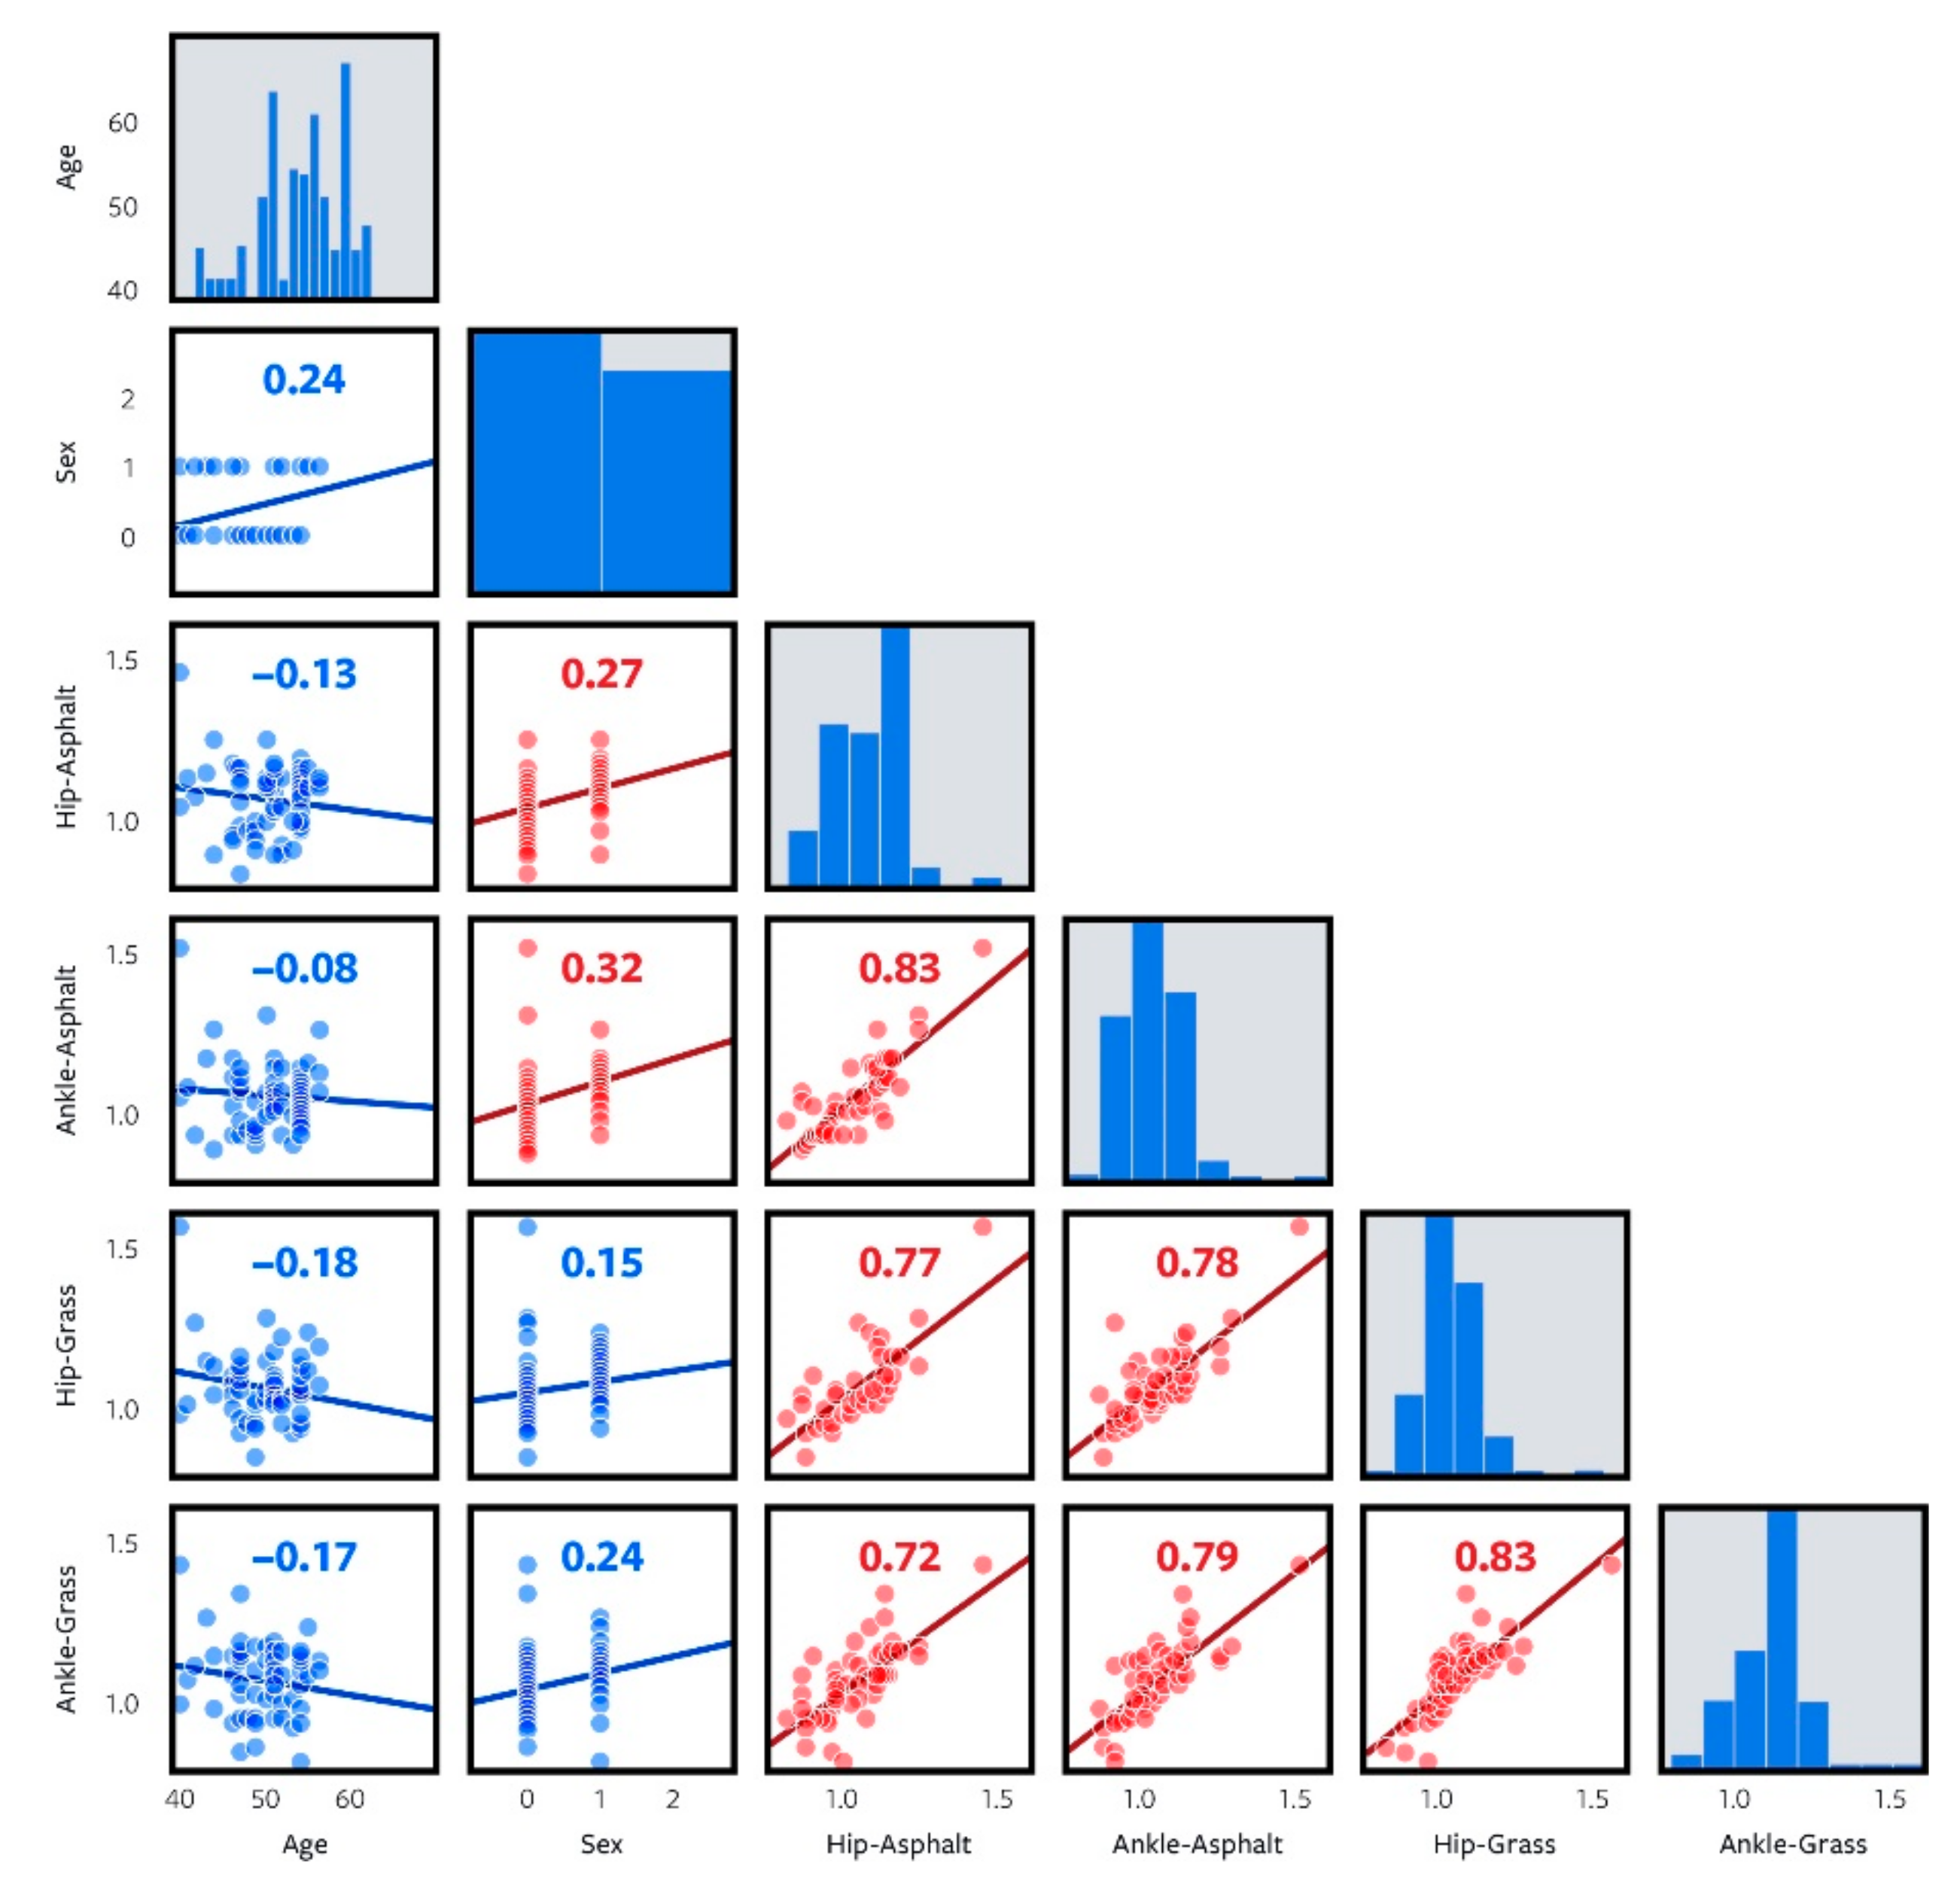
The correlation matrix for the primary outcome, cycle duration, is shown in
Figure 14. There is no statistically significant correlation between age and the reported measures of cycle duration (hip–asphalt, ankle–asphalt, hip–grass, and ankle–grass). Of the measured parameters shown for cycle duration, each of them showed a statistically significant and strong correlation with each other. There were statistically significant correlations between age sex and duration over asphalt for both hip and ankle, 0.27 and 0.32, respectively. Similar relationships were not found over asphalt.
4. Discussion
The prominence of remote data collection and telemedicine has been growing; this has been accelerated recently during the COVID-19 pandemic. Here we presented one of the very first efforts to devise a remote scalable and fully subject-driven gait data collection procedure. To this end, we designed an iPhone application capable of collecting angular velocity and transmitting the data to the researchers via email. In comparison to existing literature, a large number of middle-aged subjects were recruited and enrolled. Data were collected by the subjects without real-time researcher assistance, and thus we expected some subject errors leading to incomplete datasets. This study was overpowered, such that we were able to detect a baseline DSER in this group, remove those datasets from the analyzed data, and still have enough subjects to meet the requirements of the power analysis (minimum of 34 subjects).
To assess the viability for this procedure, we collected data on the effect of two different real-life terrains, asphalt, and grass. Our results showed a significant increase of our primary outcome measure, cycle duration, in softer and uneven terrains, such as grass, versus those of more even and firm terrains, such as asphalt, in the middle-aged population. At the ankle, the mean cycle duration was longer on grass (mean 1.122, SD 0.119) than on asphalt (mean 1.073, SD 0.113), t = −4.787, p < 0.001. Similarly, at the hip, mean cycle duration was also greater on grass (mean 1.099, SD 0.108) than on asphalt (mean 1.064, SD 0.112), t = −3.483, p = 0.001.
The smartphone was validated as a tool sensitive enough to measure gait differences when under cognitive load [
2,
18] and when comparing gait lab data to outdoor flat surface data [
19]. Thus, most studies using a smartphone to conduct gait analysis measuring load have focused on cognitive load but rarely on physical environmental load. Based on similarities to lab surfaces and previous outdoor studies, asphalt walking can be defined as normal walking [
10]. It is on this outdoor surface that past research has added cognitive load [
19] and some obstacles [
20]. While previous research has generally focused on differences in even-surface walking, this is the first work to demonstrate the capability of smartphones in recording gait differences, while comparing an even and hard asphalt surface to an irregular and soft grass surface; therefore, the evidence allows us to comment on direct physical environmental load effects. The irregular surface acts as a physical environmental load, which has not been studied in gait studies with or without remote wearable technology.
In this study, we demonstrated that physical environmental load caused changes in gait that were measurable by a smartphone when self-mounted & self-recorded by a subject under real-life circumstances. These differences were not only detectable but significant and indicative of broader gait adaptation patterns. Specifically, duration (cycle time), valley depth (maximum shank angular velocity swing phase), and peak-to-valley (the maximum changes of shank angular velocity during a gait cycle) were all found to be greater on grass when compared to asphalt, and significance was noted in six of the eight different comparisons of asphalt to grass for these parameters. In past research on different types of gait, different postural and gait stabilization strategies have been documented as a gait response [
21], and these strategies were likely the reason for the gait changes we detected here across terrains. The subjects responded to the surface change with a more cautious and more tentative approach, reflected as longer gait duration, while implementing proximal muscle-stabilization strategies, which is reflected in the increased valley depth. Identifying the strategies implemented in response to different terrain becomes important when developing and implementing controllers in the assistive devices and exoskeletons.
Given that we detected a longer overall stride duration difference with no concomitant statistically significant difference in the swing duration difference between the two terrains, the increased angular velocity measured at the hip means that it is undergoing faster motion in the same time interval and therefore rotating farther. In the recorded data, hip extension during the stance is followed by a more pronounced valley depth on grass, which would confirm the more extended initial contact for the hip, which then results in a greater angular velocity when moving from extension into flexion, measured in valley depth during the swing phase. Similar results in the increased peak-to-valley distance (total velocity change from mid-stance to mid-swing) would confirm the greater hip extension and resultant greater hip flexion speed. In addition, these increased differences are measured at both the hip and ankle (not just one), likely indicating that the two results are both of the same origins. Since this increased movement effect is detectable at both the proximal location (hip) and distal location (ankle), we can conclude that they are a result of muscle adaptation above the proximal location. Note that both sensors are downstream from the muscle adaptation and thus would be similarly affected by the upstream adaptation. In this case, the muscle adaptation at and above the hip is the above-mentioned proximal muscle stabilization strategy (the postural gait adaptation).
This study is the first to have fully patient-mounted and patient-collected data independent of any researcher presence, which allows it to serve as a proof of concept for scalability. While smartphone applications for gait analysis are not new, widespread adoption of such applications by subjects has not been implemented. Rather, smartphone applications have been used in researcher-driven data acquisition [
1,
2,
5,
12,
19,
20]; even then, their deployment in research has generally involved small sample sizes participating in a controlled laboratory environment. One previous study did incorporate a multimedia presentation with instructions to improve implementation; however, it was used by subjects in a guided lab environment first with the researcher, not the subject, running the trials in the lab and then at home later [
2]. This greatly increases the input of usable complete data; however, it also creates an inherent limit on widespread data acquisition in a real-life environment, where the availability of the researcher and lab is a limiting factor. To obtain the required data for designing control algorithms of assistive and rehabilitative devices such as prosthetics, exoskeletons, and robots, large volumes of data will be needed. The volume of data is even more important for machine learning algorithms, which are getting more and more prominent in rehabilitation technology [
22]. Thus, a subject-driven data collection method would greatly enhance data acquisition in the large volumes from participants day-to-day environments.
In previous research, torso positions were studied using both smartphones and mobile sensors, while shank mounts were studied using mobile sensors [
11]. Ankle mounting of the smartphone is less common but was selected as it better mimics real-life subject-driven usage (placing the smartphone in a sock as opposed to strapping to the shank). While all smartphone measurements include degrees of signal noise, we did note that sock mount data were more variable and showed more signal noise than the hip, even after filtering. We hypothesize a few possible reasons for this. Firstly, socks too short to secure the entirety of the smartphone may have resulted in more motion at the mounting site itself, such that the combined mount site motion plus the ankle motion may have resulted in a noisier signal. The difference in sock lengths across subjects may have amplified this effect in some subjects and nullified it in others. While sock mounts were certainly much easier for subjects than traditionally strap-mounted shank mounts (important since we are aiming for a simple subject-driven mount), it may be that there is too much variability at that mounting location to provide meaningful data. However, if the smartphone data is to be used for robotics or prosthetic programming, then terminal extremity data will be equally essential as hip or torso data. Further data analysis of the ankle-mounted data with specific comparison to the hip-mounted data on similar terrain would allow for more refined programming and optimal data collection. Therefore, we suggest that future studies should still consider the ankle as a mounting site, but perhaps consider a more uniform stabilization method for the ankle mount.
This is the first study in mobile gait analysis to study a middle-aged subject group (ages 40–60 years old, average age 49.68), whereas previous studies focused on either young adults or the elderly [
1,
2,
3,
10,
11,
18]. Recruiting subjects was made easier (the participation rate was greatly enhanced) by the nature of wearable technology, the app user interface, and transparent information about peer participation. This was a group that had not been studied before and showed significant enthusiasm for the study as evidenced by participation rates. Data from this specific subject population are comparable, but not identical, to that of the previously studied groups on flat, even surfaces, and can also be used for future longitudinal studies in this same group (pre-elderly vs. elderly). In addition, testing gait on uneven or irregular surfaces for the first time is best done in the non-elderly population until the safety profile of the irregular surface gait can be better defined.
One issue noted with this subject-driven data collection model was the number of incomplete data sets produced, i.e., DSER. This is in direct contrast to previous research done in gait analysis with the researcher present and thus with data verification inherent to the collection process. While 69 participants completed the study and submitted data, only 57 datasets showed a complete usable data set, which represents a 17.4% DSER in data acquisition. This is likely due to some combination of either user error and/or an underdeveloped app user interface. Previous research on purely subject-driven data collection is extremely limited and does not document incomplete submission of data. This specific type of error (by some subjects in data collection and submission) is a unique issue with remote subject-driven studies.
In our extensive literature search, we were not able to identify any other similar reports of subject-driven remote gait data collection and, therefore, we believe this reported participants data submission error rate (DSER) to be the first report of such data loss in a subject-driven gait study. This study now provides, for the first time in gait analysis research, a delineation of error rates for a study that is fully subject-driven, as opposed to researcher-supervised. Lacking any previous frame of reference, it is not yet possible to comment on acceptable DSER levels. However, future studies may be able to yield lower DSER rates.
To standardize subject-driven mounting, the smartphone was positioned in a manner that is easy to mount, with the screen facing “down & out” on the right side, and used a correction factor to return the vectors to standard ISB orientation for study purposes. This is the first study to specifically position the smartphone in this manner to more closely mimic normal smartphone usage while avoiding the risk of skin contact between the ankle and the on-screen stop button, inadvertently ending the data recording mid-trial. As smartphones are used for more purposes and as those uses are user-driven (rather than researcher-driven), this kind of accommodation will improve the reliability and reproducibility of acquired data.
The study certainly has limitations. For the data acquisition, due to the nature of this study, there was no researcher supervision. This resulted in significant offline effort to review the data (each individual trial) to ensure the data formatting and orientation were accurate before running the data through MATLAB. We noted that, for a few participants, there were usage errors that led to errors in recording and/or transmission, the DSER. We were able to identify these few data sets and exclude them, but, ideally, in future follow-up work the DSER could be lowered by improving the app interface, possibly adding multimedia instruction, providing live data verification, or by adding two-way communication between the sender and receiver, among other solutions. In this manner, data could be verified real-time within the app at the time of data acquisition and before transmission, and this may improve the participants’ DSER. Another limitation of our study, and of similar studies, is the short walking distance, which required the determination of specific representative gait cycles and trimming of the recorded motion data (while mounting or unmounting the smartphone) at the beginning and end of each trial. Longer walking distances may increase the size of the data set and provide additional information at later periods in the walking trials. Including some additional aspects of gait, such as turning and incline walking, would provide additional rich material for analysis and comparison.


