Communication

Predicting the Average Composition of an AlFeNiTiVZr-Cr Alloy with Machine Learning and X-ray Spectroscopy

Laboratoire d’Automatique, de Mécanique et d’Informatique Industrielles et Humaines, LAMIH, Université Polytechnique Hauts-de-France, UMR CNRS 8201, 59313 Valenciennes, France
Compounds 2023, 3(1), 224-232; https://doi.org/10.3390/compounds3010018
Submission received: 3 February 2023 / Revised: 14 February 2023 / Accepted: 22 February 2023 / Published: 3 March 2023

Abstract

:
A multi-principal element alloy (MPEA) is a type of metallic alloy that is composed of multiple metallic elements, with each element making up a significant portion of the alloy. In this study, the initial atomic percentage of elements in an (AlFeNiTiVZr)1-xCrx MPEA alloy as a function of the position on the surface was investigated using machine learning algorithms. Given the absence of a linear relationship between the atomic percentage of elements and their location on the surface, it is not possible to discern any clear association from the dataset. To overcome this non-linear relationship, the prediction of the atomic percentage of elements was accomplished using both decision tree (DT) and random forest (RF) regression models. The models were compared, and the results were found to be consistent with the experimental findings (a coefficient of determination R2 of 0.98 is obtained with the DT algorithm and 0.99 with the RF one). This research demonstrates the potential of machine learning algorithms in the analysis of wavelength-dispersive X-ray spectroscopy (WDS) datasets.

1. Introduction

A multi-principal element alloy (MPEA) is a metallic alloy that is known to contain significant proportions of several metallic elements (at least two) [1,2,3]. Among the various elements, there is no linear relationship that leads to variations in the atomic percentage as a function of the surface position. To overcome this nonlinearity, machine learning can be used to overcome the challenge of predicting the atomic percentage of elements. The term “machine learning” (ML) refers to a group of techniques that enable computers to “learn” the correlation between numerical data representations and output values [4]. ML algorithms have the ability to achieve greater accuracy in predictions compared to conventional methods, and can analyze large datasets quickly, which saves time and resources. Additionally, they can recognize patterns and trends in data that may not be immediately apparent through conventional analyses. ML models can also adapt to changes in data over time, making them especially valuable for applications that require real-time analysis [5]. Numerous applications have made use of machine learning techniques such as the support vector machine (SVM), maximal entropy, and artificial neural network (ANN) [6]. Liu et al. established machine learning models to predict the Vickers hardness (Hv) of amorphous alloys [7]. Pan et al. developed an integrated composition–process–property design system for Cu-Cr-Ni-Co-Si-Zr alloys using machine learning and were able to recognize the relationship between Cu-Ni-Co-Si and Cu-Cr-Zr alloys [8]. Gao et al. used a machine learning model to predict the elastic properties and Poisson’s ratio of non-equiatomic high-entropy alloys (HEA) [9]. Islam et al. developed a neural network (NN) in a machine learning framework to detect the underlying data pattern using an experimental dataset and categorize the associated phase selection in MPEAs, providing insights on developing MPEAs [10]. Wu et al. used eight phase-related variables as input and analyzed six machine learning (ML) classification methods to identify MPEAs with outstanding strength–ductility [11]. Roy et al. presented an ML approach to down-select corrosion-resistant alloys focusing on MPEAs [12]. Manzoor et al. described a method that uses ML to predict the point defect energies in MPEAs using a database of the binary alloys that make up those alloys [13]. Sai et al. used four different machine learning (ML) techniques to estimate the room temperature fatigue lifetimes of single-phase CoaCrbFecMndNie and multi-phase AlfCogCrhFeiMnjNik systems [14]. These algorithms were RF, SVM, gradient boosting (GBOOST), and extreme gradient boosting (XGBOOST). Non-parametric models such as RF and DT have the ability to fit complex data distributions without requiring any assumptions about the underlying data. Additionally, they are capable of providing accurate predictions even when the data are noisy or contain outliers. RF and DT models are versatile enough to be used for both regression and classification problems, which makes them useful for a wide range of applications [15].
In this work, machine learning algorithms are used to study the influence of position on elements’ atomic percentage at the surface of an MPEA sample synthetized using physical vapor deposition (PVD). The process of depositing thin films through PVD methods has been widely adopted in various industries [16,17,18,19]. The atomic percentages of the constituent elements of an (AlFeNiTiVZr)1-xCrx alloy are predicted using decision tree (DT) and random forest (RF) machine learning methods for the first time.

2. Materials and Methods

This work was carried out on the basis of an experimental dataset consisting of acquisition points across a single axis of wavelength-dispersive X-ray spectroscopy (WDS) obtained from the work of Ruiz-Yi et al. [1,2]. WDS is better than energy-dispersive X-ray spectroscopy (EDS) when it comes to high-energy resolution, its detection limits, and its ability to detect elements with low atomic weights [20]. The samples were obtained by co-deposing an AlFeNiTiVZr metal alloy and a Cr target using magnetron sputtering. Magnetron sputtering has emerged as the preferred method for applying various coatings that are important in the industrial sector [21]. Further details regarding magnetron sputtering and sample preparation are presented elsewhere [2]. In this work, the use of both decision tree (DT) and random forest (RF) models is discussed. DT is a simple and interpretable machine learning algorithm that is commonly used for regression and classification tasks [22]. It is part of the supervised algorithms and can be used to predict a value from a set of parameters by modeling the relationships between the input data and target output. The interpretability of decision tree models makes them advantageous compared to other pattern recognition methods. This allows for easier identification of crucial characteristics and relationships between classes, informing future experiments and data analysis [23]. RF, which is a collection of DTs, typically produces better results than DT [24]. In recent years, the RF classifier has become increasingly popular due to its exceptional classification accuracy and efficient processing speed. The RF classifier provides dependable classifications by combining predictions from a group of decision trees. Additionally, the RF classifier can effectively pick and rank variables that have the highest ability to differentiate between target classes [24]. Keras [25], a popular deep learning library in Python, is used together with the Scikit-learn package [26] to implement the algorithms in home-made programs. Scikit-learn is a Python library that offers a unified interface for implementing machine learning algorithms. It also includes additional functions that are crucial to the machine learning process, such as data preparation methods, data sampling techniques, evaluation metrics, and tuning/optimization search tools for improving an algorithm’s performance [27]. Keras is a high-level neural network application programming interface (API) that is open source and written in Python. It was created by François Chollet. Keras can operate with various machine learning libraries, including TensorFlow (created by Google), CNTK (created by Microsoft), and Theano (created by the University of Montreal) [28]. A forest of 50 trees is used for the RF model, with 80% of the values being used for training and 20% of the values for testing. To improve the training results, the data are rescaled to a range of [0–1]. The algorithms and equations used in this study are described elsewhere [26], and the maximum depth of a tree, minimum number of samples in a leaf node, and minimum number of samples required at a leaf node are set to “None”, 1, and 1, respectively.

3. Results and Discussions

The average composition of the considered elements and the associated position on the (AlFeNiTiVZr)1-xCrx sample were obtained from Rui-Yi et al. [1]. The ranges of attributes of the dataset are presented in Table 1.
Figure 1 shows a scatter matrix plot of the dataset. A scatterplot matrix is a useful tool for identifying linear correlations between multiple variables. It can be used to determine if any of the variables have similar relationships to the data. The process of creating a scatterplot matrix involves loading the data with multiple variables and visually examining the correlations between them. In this work, there is no strong relationship between all the variables (average atomic composition of Al, Fe, Ni, Ti, V, Zr, and Cr) and their position on the sample. The composition of Al, Ti, V, and Zr increases along the sample, while Cr decreases. Fe and Ni show different patterns; the amount of Fe increases and stabilizes, while the amount of Ni increases and decreases. Such differences might be related to the conditions of the deposition process, the cleanliness of the substrate, and the degree of adhesion between the substrate and the deposited material or diffusion effects [29].
Thus, it is challenging to predict the average amount of elements based on the position along the sample with variables that are not linearly dependent.
For the DT and RF models, the average composition of the elements of an (AlFeNiTiVZr)1-xCrx alloy is used as input values, while the corresponding position on the sample serves as the output. Distribution histograms of the attributes are presented in Figure 2. No Gaussian distributions of both the variables and the output are highlighted.
Figure 3 shows a correlation matrix map of the Pearson correlation coefficients [30], which determines the linear link between variables to evaluate the correlation between the features [11]. A correlation matrix is a type of matrix in numerical linear algebra that has the property of being symmetrical and positive semidefinite with diagonal entries equal to 1. This type of matrix is used in areas such as the preconditioning of linear systems and the evaluation of errors in methods for solving symmetric eigenvalue problems [31].
The related Pearson correlation coefficient with two variables X and Y is defined as follows:
ρ ( X ,   Y ) = c o v ( X ,   Y ) σ X σ Y
where the standard deviations of X and Y are represented by σ X and σ Y , and c o v ( X ,   Y ) is the value of covariance [32]. A positive correlation is shown by numbers that are near to 1, while a negative correlation is indicated by values that are close to −1. There is no link between intermediates with values of 0. As seen in Figure 3, there is a positive correlation between most of the elements and the position, but this is not the case for the Cr. This result is expected, as the Cr is the only element whose amount only decreases with the sample position, as highlighted by Figure 1.
The two models were compared using a statistical measure. R-squared or coefficient of determination (R2) was used to assess the efficacy of the machine learning models [33]. Chicco et al. suggest that R-squared is the most informative measurement in many cases compared to other statistics such as symmetric mean absolute percentage error (SMAPE), mean absolute error (MAE) and its percentage variant (MAPE), mean square error (MSE), and the root mean square error (RMSE). It is recommended to use R-squared as the standard measure for evaluating regression analyses across various scientific fields [33].
Figure 4 and Figure 5 display the predicted values of atomic percentage of each element as a function of the true values for the two models (respectively DT and RF) concerning the test dataset. In both cases, the coefficients of determination are very high. The minimum R-squared value is 0.95 and 0.96 (respectively considering the DT and RF models) for the vanadium, and the maximum is 0.99 for the chromium. Both the DT and RF models can effectively predict the atomic percentage of elements, regardless of the position along the line, and could be considered to improve a sputter model.
Machine learning is a very pertinent method that should be considered to predict output value from several input variables that are not linearly dependent, and should be considered in multiple cases of alloy research, for example, in the case of harmonic alloys [34] or transformation-induced plasticity (TRIP) and twinning-induced plasticity (TWIP) alloys [35].

4. Conclusions

Two machine learning models were established from experimental values of the composition of elements of an (AlFeNiTiVZr)1-xCrx alloy, as measured using wavelength-dispersive X-ray spectroscopy. The decision tree and random forest models lead to relevant predicted values of the average composition of the elements, whatever the position along the line of measurements. A mean coefficient of determination of 0.98 is obtained with the decision tree algorithm, and 0.99 with the random forest one. This means that machine learning models are relevant and should be considered to improve a sputter model.

Funding

This research received no external funding.

Data Availability Statement

The data presented in this study are available on request from the corresponding author.

Conflicts of Interest

The author declares no conflict of interest.

References

  1. Ruiz-Yi, B.; Williams, T.; Bunn, J.K.; Ren, F.; Hasan, N.A.; Takeuchi, I.; Hattrick-Simpers, J.; Mehta, A. Characterization Data of an (AlFeNiTiVZr)1-xCrx Multi-Principal Element Alloy Continuous Composition Spread Library. Data Brief 2021, 34, 106758. [Google Scholar] [CrossRef]
  2. Ruiz-Yi, B.; Williams, T.; Bunn, J.K.; Ren, F.; Hasan, N.A.; Takeuchi, I.; Hattrick-Simpers, J.; Mehta, A. Phase Stabilization and Oxidation of a Continuous Composition Spread Multi-Principal Element (AlFeNiTiVZr)1-xCrx Alloy. J. Alloys Compd. 2021, 861, 158565. [Google Scholar] [CrossRef]
  3. Birbilis, N.; Choudhary, S.; Scully, J.R.; Taheri, M.L. A Perspective on Corrosion of Multi-Principal Element Alloys. Mater. Degrad. 2021, 5, 1–8. [Google Scholar] [CrossRef]
  4. Ben Chaabene, W.; Flah, M.; Nehdi, M.L. Machine Learning Prediction of Mechanical Properties of Concrete: Critical Review. Constr. Build. Mater. 2020, 260, 119889. [Google Scholar] [CrossRef]
  5. Celik, B.; Vanschoren, J. Adaptation Strategies for Automated Machine Learning on Evolving Data. IEEE Trans. Pattern Anal. Mach. Intell. 2021, 43, 3067–3078. [Google Scholar] [CrossRef] [PubMed]
  6. Güçlüer, K.; Özbeyaz, A.; Göymen, S.; Günaydın, O. A Comparative Investigation Using Machine Learning Methods for Concrete Compressive Strength Estimation. Mater. Today Commun. 2021, 27, 102278. [Google Scholar] [CrossRef]
  7. Liu, X.; Long, Z.; Peng, L. Prediction of Vickers Hardness of Amorphous Alloys Based on Interpretable Machine Learning. J. Non-Cryst. Solids 2023, 602, 122095. [Google Scholar] [CrossRef]
  8. Pan, S.; Yu, J.; Han, J.; Zhang, Y.; Peng, Q.; Yang, M.; Chen, Y.; Huang, X.; Shi, R.; Wang, C.; et al. Customized Development of Promising Cu-Cr-Ni-Co-Si Alloys Enabled by Integrated Machine Learning and Characterization. Acta Mater. 2023, 243, 118484. [Google Scholar] [CrossRef]
  9. Gao, Y.; Bai, S.; Chong, K.; Liu, C.; Cao, Y.; Zou, Y. Machine Learning Accelerated Design of Non-Equiatomic Refractory High Entropy Alloys Based on First Principles Calculation. Vacuum 2023, 207, 111608. [Google Scholar] [CrossRef]
  10. Islam, N.; Huang, W.; Zhuang, H.L. Machine Learning for Phase Selection in Multi-Principal Element Alloys. Comput. Mater. Sci. 2018, 150, 230–235. [Google Scholar] [CrossRef]
  11. Wu, L.; Wei, G.; Wang, G.; Wang, H.; Ren, J. Creating Win-Wins from Strength–Ductility Trade-off in Multi-Principal Element Alloys by Machine Learning. Mater. Today Commun. 2022, 32, 104010. [Google Scholar] [CrossRef]
  12. Roy, A.; Taufique, M.F.N.; Khakurel, H.; Devanathan, R.; Johnson, D.D.; Balasubramanian, G. Machine-Learning-Guided Descriptor Selection for Predicting Corrosion Resistance in Multi-Principal Element Alloys. Npj Mater. Degrad. 2022, 6, 9. [Google Scholar] [CrossRef]
  13. Manzoor, A.; Arora, G.; Jerome, B.; Linton, N.; Norman, B.; Aidhy, D.S. Machine Learning Based Methodology to Predict Point Defect Energies in Multi-Principal Element Alloys. Front. Mater. 2021, 8, 673574. [Google Scholar] [CrossRef]
  14. Sai, N.J.; Rathore, P.; Chauhan, A. Machine Learning-Based Predictions of Fatigue Life for Multi-Principal Element Alloys. Scr. Mater. 2023, 226, 115214. [Google Scholar] [CrossRef]
  15. Seydi, S.T.; Kanani-Sadat, Y.; Hasanlou, M.; Sahraei, R.; Chanussot, J.; Amani, M. Comparison of Machine Learning Algorithms for Flood Susceptibility Mapping. Remote Sens. 2022, 15, 192. [Google Scholar] [CrossRef]
  16. Helmersson, U.; Lattemann, M.; Bohlmark, J.; Ehiasarian, A.P.; Gudmundsson, J.T. Ionized Physical Vapor Deposition (IPVD): A Review of Technology and Applications. Thin Solid Films 2006, 513, 1–24. [Google Scholar] [CrossRef] [Green Version]
  17. Yin, Z.; Yuan, F.; Li, M.; Xue, M.; Zhou, D.; Chen, Y.; Liu, X.; Luo, Y.; Hong, Z.; Xie, C.; et al. Self-Cleaning, Underwater Writable, Heat-Insulated and Photocatalytic Cellulose Membrane for High-Efficient Oil/Water Separation and Removal of Hazardous Organic Pollutants. Prog. Org. Coat. 2021, 157, 106311. [Google Scholar] [CrossRef]
  18. Yin, Z.; Xue, M.; Luo, Y.; Hong, Z.; Xie, C.; Ren, Z.; Wang, H. Excellent Static and Dynamic Anti-Icing Properties of Hierarchical Structured ZnO Superhydrophobic Surface on Cu Substrates. Chem. Phys. Lett. 2020, 755, 137806. [Google Scholar] [CrossRef]
  19. Yin, Z.; Yuan, F.; Xue, M.; Xue, Y.; Xie, Y.; Ou, J.; Luo, Y.; Hong, Z.; Xie, C. A Multifunctional and Environmentally Safe Superhydrophobic Membrane with Superior Oil/Water Separation, Photocatalytic Degradation and Anti-Biofouling Performance. J. Colloid Interface Sci. 2022, 611, 93–104. [Google Scholar] [CrossRef]
  20. Tanaka, M.; Takeguchi, M.; Furuya, K. X-Ray Analysis and Mapping by Wavelength Dispersive X-ray Spectroscopy in an Electron Microscope. Ultramicroscopy 2008, 108, 1427–1431. [Google Scholar] [CrossRef]
  21. Kelly, P.J.; Arnell, R.D. Magnetron Sputtering: A Review of Recent Developments and Applications. Vacuum 2000, 56, 159–172. [Google Scholar] [CrossRef]
  22. Sadat, T. Prediction of Concrete Peak Load and Compressive Failure Strength Using Machine Learning. Key Eng. Mater. 2022, 938, 235–245. [Google Scholar] [CrossRef]
  23. Myles, A.J.; Feudale, R.N.; Liu, Y.; Woody, N.A.; Brown, S.D. An Introduction to Decision Tree Modeling. J. Chemom. 2004, 18, 275–285. [Google Scholar] [CrossRef]
  24. Belgiu, M.; Drăguţ, L. Random Forest in Remote Sensing: A Review of Applications and Future Directions. ISPRS J. Photogramm. Remote Sens. 2016, 114, 24–31. [Google Scholar] [CrossRef]
  25. Ketkar, N. Introduction to Keras. In Deep Learning with Python: A Hands-On Introduction; Apress: Berkeley, CA, USA, 2017; pp. 97–111. ISBN 978-1-4842-2766-4. [Google Scholar]
  26. Hao, J.; Ho, T.K. Machine Learning Made Easy: A Review of Scikit-Learn Package in Python Programming Language. J. Educ. Behav. Stat. 2019, 44, 348–361. [Google Scholar] [CrossRef]
  27. Bisong, E. Introduction to Scikit-Learn. In Building Machine Learning and Deep Learning Models on Google Cloud Platform: A Comprehensive Guide for Beginners; Bisong, E., Ed.; Apress: Berkeley, CA, USA, 2019; pp. 215–229. ISBN 978-1-4842-4470-8. [Google Scholar]
  28. Nhu, V.H.; Hoang, N.D.; Nguyen, H.; Ngo, P.T.T.; Thanh Bui, T.; Hoa, P.V.; Samui, P.; Tien Bui, D. Effectiveness Assessment of Keras Based Deep Learning with Different Robust Optimization Algorithms for Shallow Landslide Susceptibility Mapping at Tropical Area. Catena 2020, 188, 104458. [Google Scholar] [CrossRef]
  29. Braun, R.; Kelm, K.; Fröhlich, M.; Leyens, C. Oxidation Resistance of γ-TiAl Based Alloy Ti–45Al–8Nb Coated with Intermetallic Ti–Al–Cr–Y Layers and EB-PVD Zirconia Topcoats at 950 °C in Air. Surf. Coat. Technol. 2013, 222, 128–134. [Google Scholar] [CrossRef]
  30. Mu, Y.; Liu, X.; Wang, L. A Pearson’s Correlation Coefficient Based Decision Tree and Its Parallel Implementation. Inf. Sci. 2018, 435, 40–58. [Google Scholar] [CrossRef]
  31. Higham, N.J. Computing the Nearest Correlation Matrix—A Problem from Finance. IMA J. Numer. Anal. 2002, 22, 329–343. [Google Scholar] [CrossRef] [Green Version]
  32. Berger, A.; Witz, J.F.; El Bartali, A.; Sadat, T.; Limodin, N.; Dubar, M.; Najjar, D. Experimental Investigation of Early Strain Heterogeneities and Localizations in Polycrystalline α-Fe during Monotonic Loading. Int. J. Plast. 2022, 153, 103253. [Google Scholar] [CrossRef]
  33. Chicco, D.; Warrens, M.J.; Jurman, G. The Coefficient of Determination R-Squared Is More Informative than SMAPE, MAE, MAPE, MSE and RMSE in Regression Analysis Evaluation. PeerJ Comput. Sci. 2021, 7, e623. [Google Scholar] [CrossRef] [PubMed]
  34. Sadat, T.; Hayashi, K.; Haugou, G.; Morvan, H.; Markiewicz, E.; Dubar, L.; Bigerelle, M.; Ameyama, K.; Dirras, G. Mechanical Properties of Spark Plasma Sintering-Processed Pure Ti and Ti-6Al-4V Alloys: A Comparative Study between Harmonic and Non-Harmonic Microstructures. Compounds 2021, 1, 41–57. [Google Scholar] [CrossRef]
  35. Qian, B.; Mantri, S.A.; Dasari, S.; Zhang, J.; Lilensten, L.; Sun, F.; Vermaut, P.; Banerjee, R.; Prima, F. Mechanisms Underlying Enhanced Strength-Ductility Combinations in TRIP/TWIP Ti-12Mo Alloy Engineered via Isothermal Omega Precipitation. Acta Mater. 2023, 245, 118619. [Google Scholar] [CrossRef]
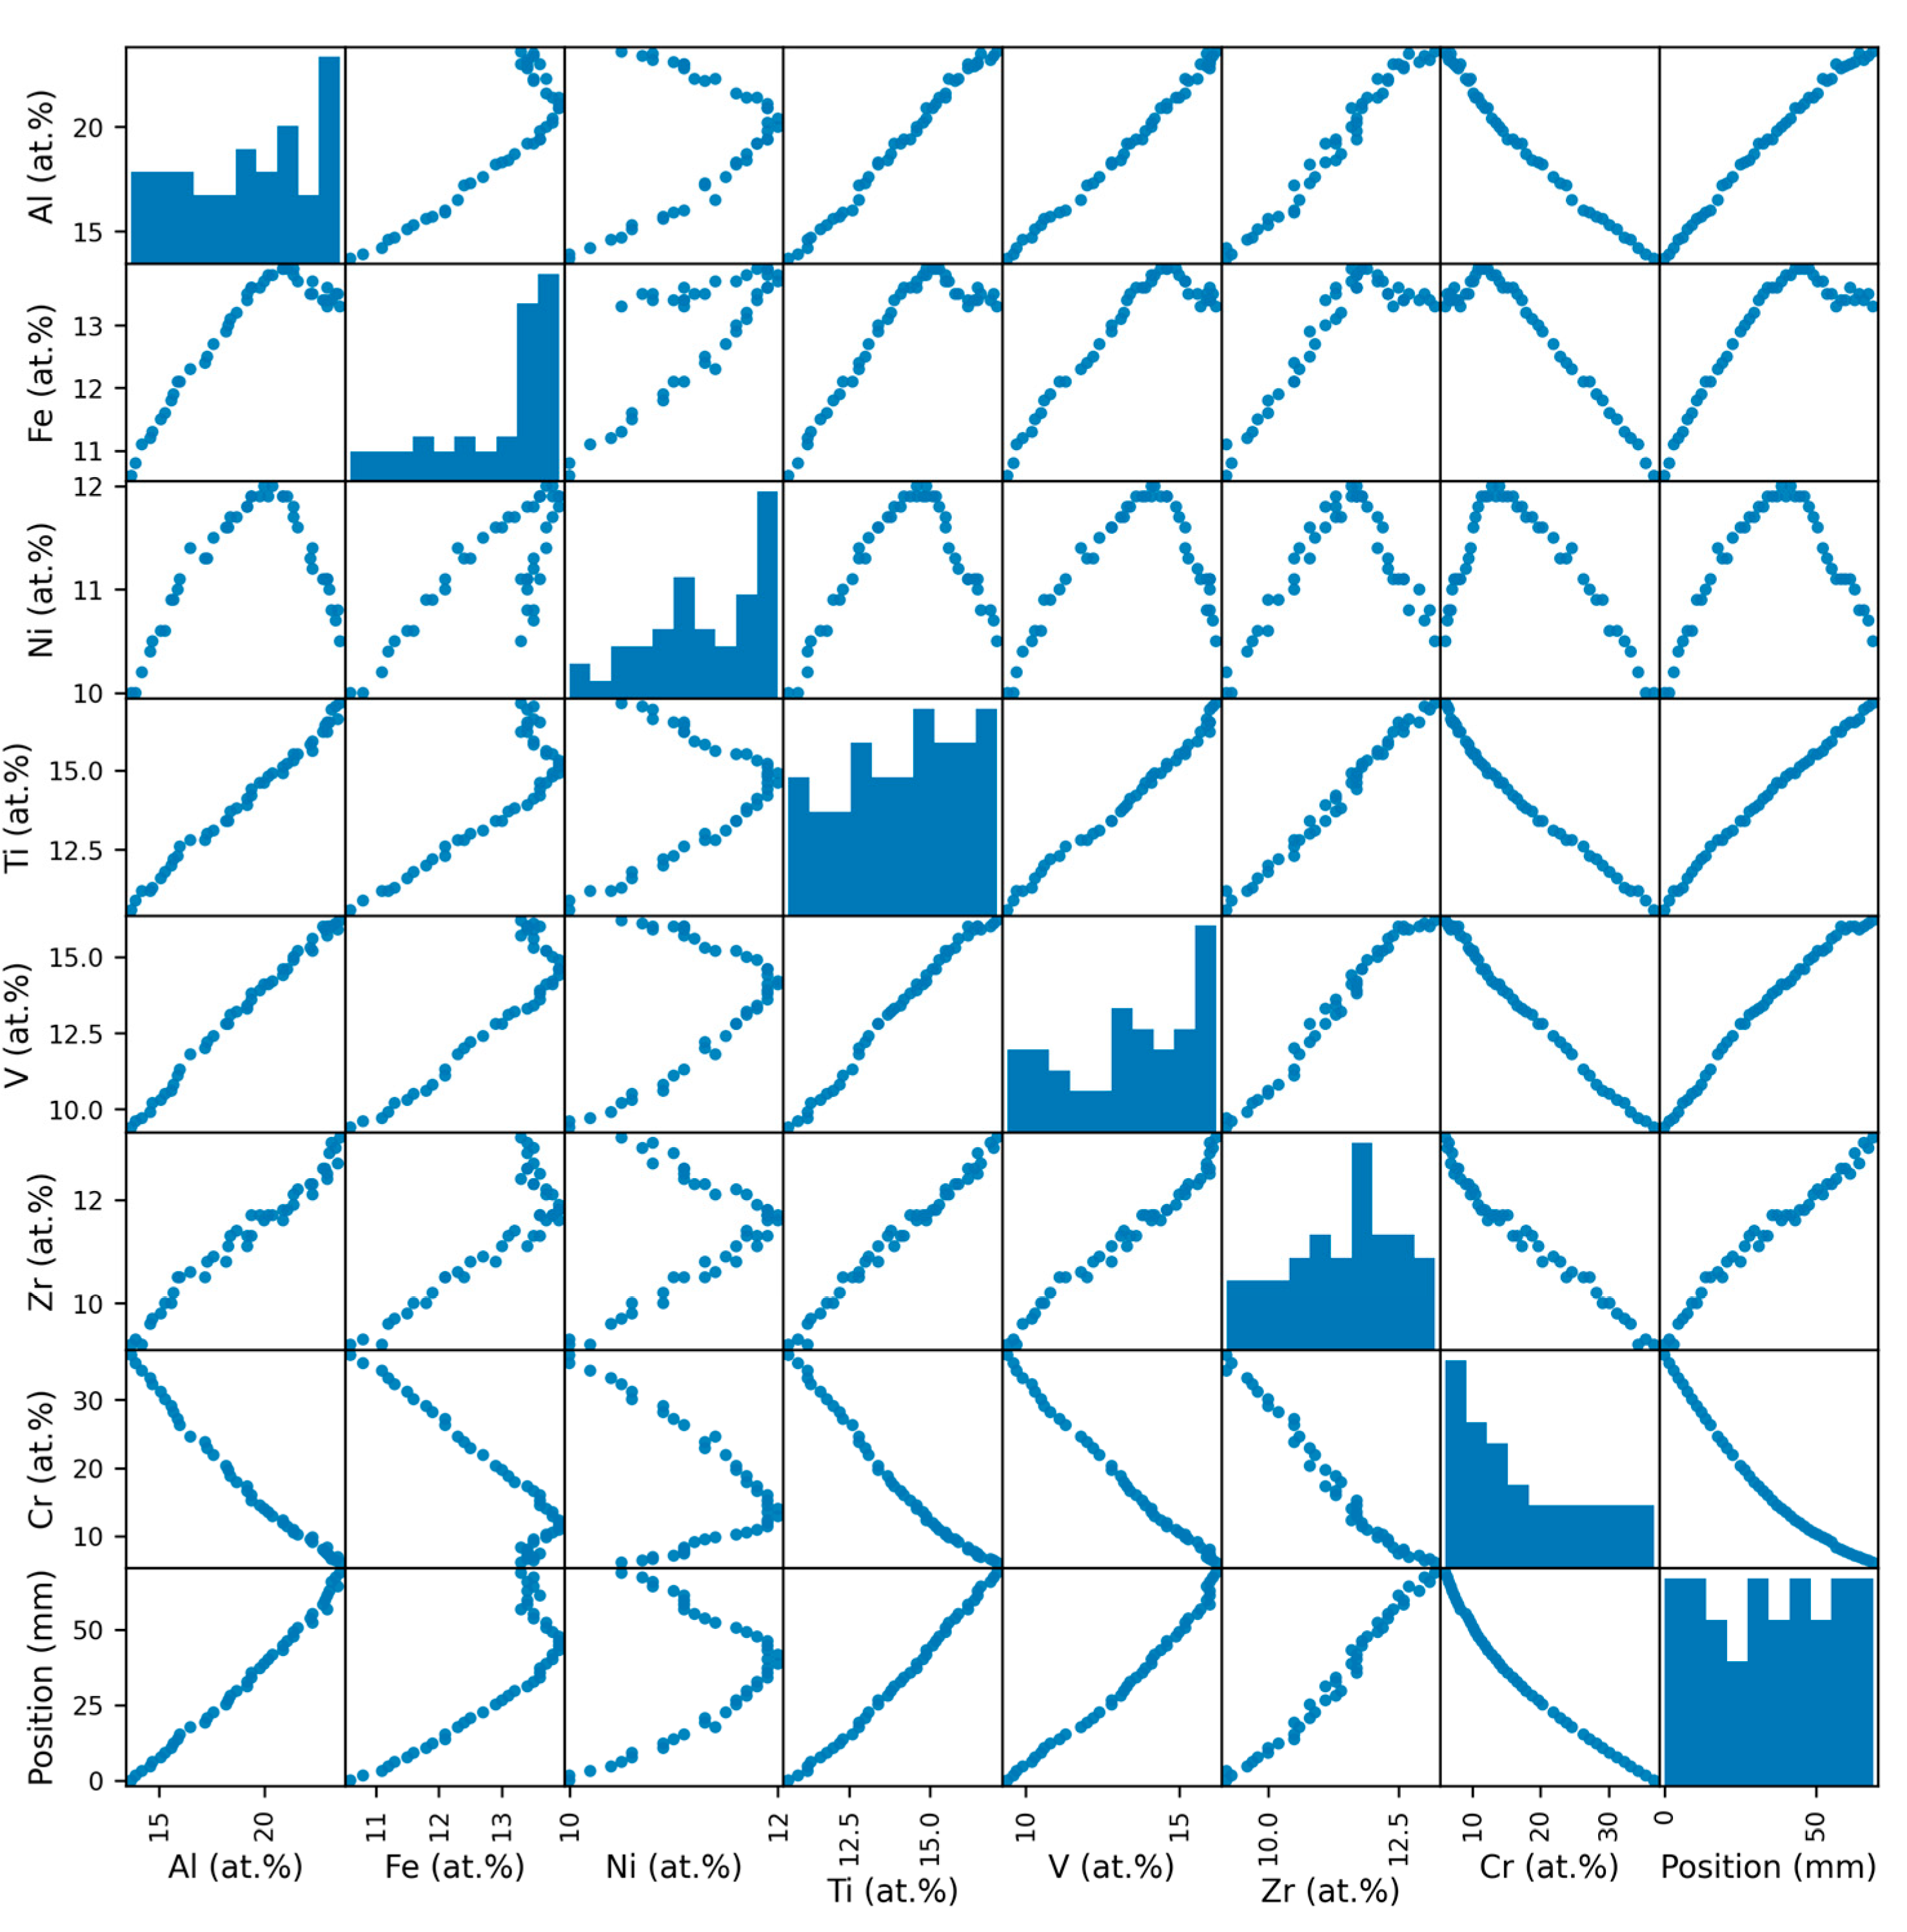
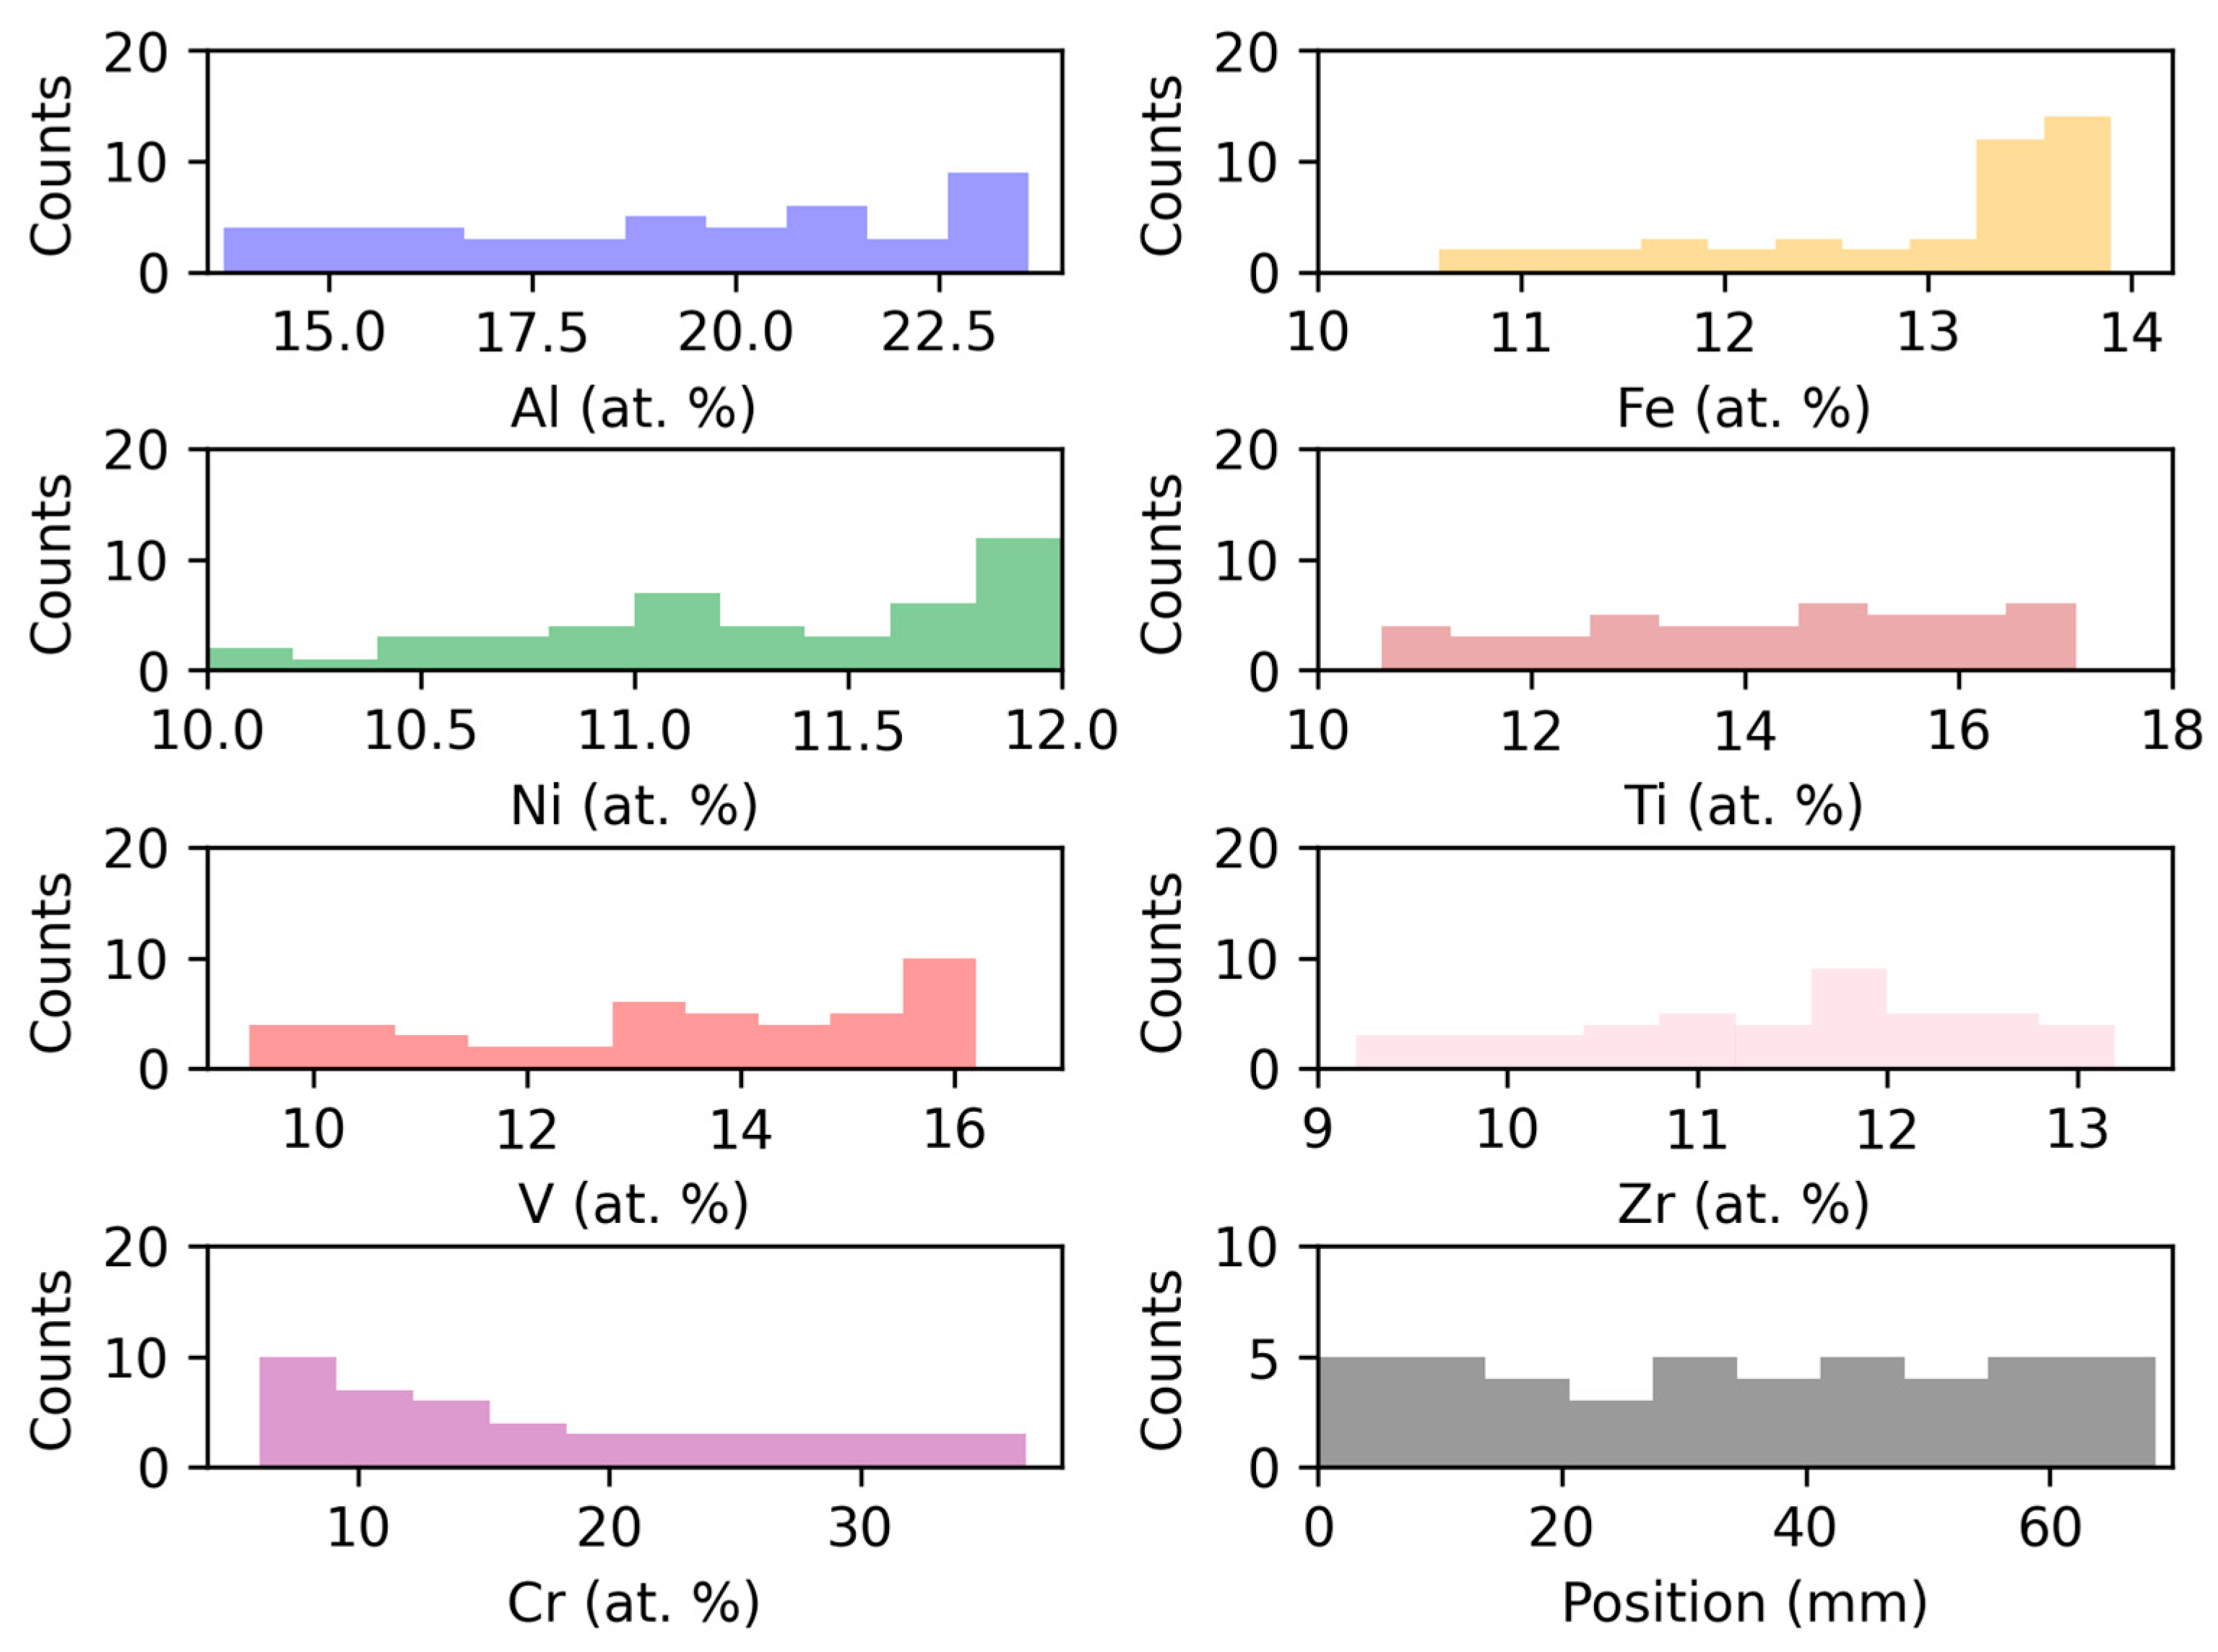
Figure 1. Scatter matrix of the dataset.
Compounds 03 00018 g001
Figure 2. Attribute distribution in the Ruiz-Yi et al. dataset [1].
Compounds 03 00018 g002
Figure 3. Correlation matrix between variables and output of the models.
Compounds 03 00018 g003
Figure 4. True and predicted values of elements’ atomic percentage computed by the decision tree model.
Compounds 03 00018 g004
Figure 5. True and predicted values of elements’ atomic percentage computed by the random forest model.
Compounds 03 00018 g005
Table 1. Ranges of attributes from Ruiz-Yi et al. [1].
AttributeRange
Al (at. %)13.7–23.6
Fe (at. %)10.6–13.9
Ni (at. %)10–17
Ti (at. %)10.6–17.1
V (at. %)9.4–16.2
Zr (at. %)9.2–13.2
Cr (at. %)6.1–36.6
Position (mm)0–68.7
Disclaimer/Publisher’s Note: The statements, opinions and data contained in all publications are solely those of the individual author(s) and contributor(s) and not of MDPI and/or the editor(s). MDPI and/or the editor(s) disclaim responsibility for any injury to people or property resulting from any ideas, methods, instructions or products referred to in the content.

