1. Introduction
The deformation mechanisms of rare earth orthophosphates (REPO
4s) under complex stress states are highly pertinent to several research fields including geoscience and structural ceramics. In shocked xenotime and monazite minerals, REPO
4 deformation microstructures can provide insight into the extreme conditions generated during impact events [
1,
2,
3]. In addition, the pressure-induced xenotime–monazite phase transformation of certain REPO
4 compositions offers the possibility of enhanced toughness and plasticity in ceramic matrix composites (CMCs) for aerospace components subject to extreme conditions [
4,
5]. When tested as CMC fiber coatings, transforming compositions have been shown to deflect or arrest cracks and facilitate fiber sliding at lower stresses than non-transforming compositions [
5].
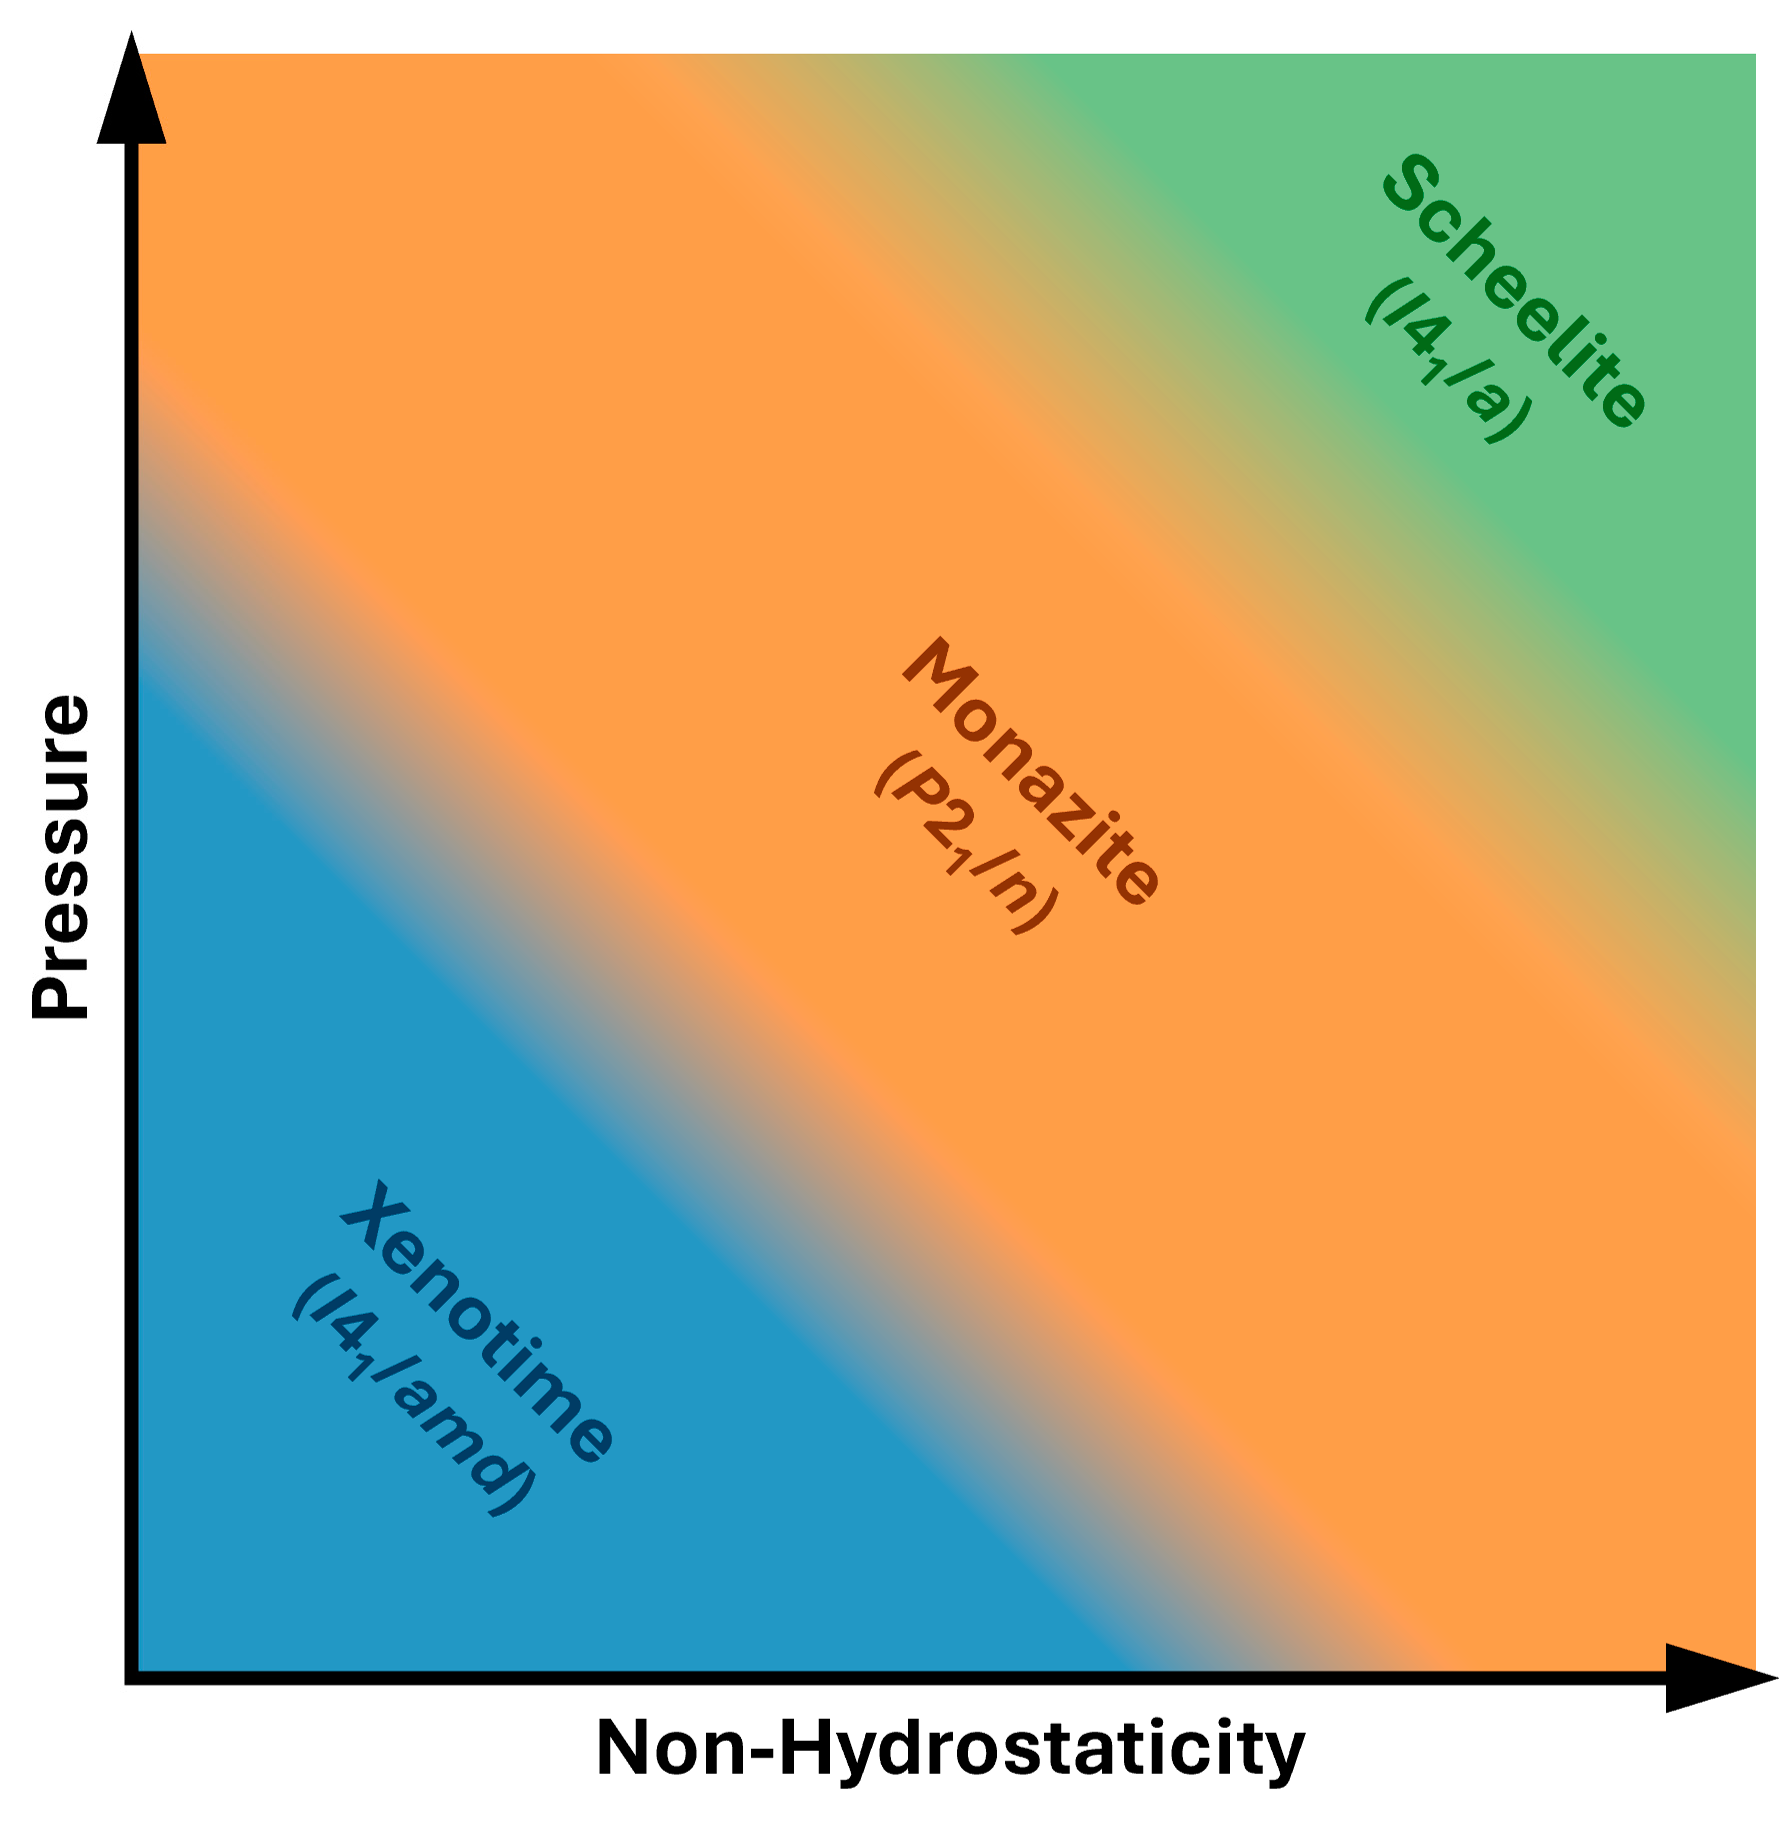
Identifying REPO
4 compositions that undergo the pressure-induced xenotime–monazite phase transformation requires understanding the compositional phase boundary in the middle of the lanthanide series. In equilibrium at 1 atm (10
−4 GPa), compositions with smaller RE
3+ ionic radii (RE = Tb-–Lu, Sc, Y) adopt the xenotime (tetragonal,
I4
1/
amd) structure while those with larger RE
3+ ionic radii (RE = La-Gd) adopt the monazite (monoclinic,
P2
1/
n) structure [
6]. Under high hydrostatic pressure, xenotime-structured compositions are known to transform into either the monazite structure or the scheelite (tetragonal,
I4
1/
a) structure, with the latter being more favorable in xenotime compositions with the smallest RE
3+ ionic radii [
7]. The three aforementioned crystal structures are illustrated in
Figure 1.
The xenotime, monazite, and scheelite structures all contain chains of alternating RE-O polyhedra and PO
4 tetrahedra and have RE-O coordination numbers of 8, 9, and 8, respectively [
8].
Figure 1 shows the compaction of the REPO
4 structure from xenotime to monazite to scheelite due to the increasing rotations and translations of the RE-O polyhedra and PO
4 tetrahedra [
8]. Such rotations and translations can be induced using hydrostatic pressure, and they can be prematurely induced in the presence of non-hydrostatic stress, which disrupts stable bonding symmetries more dramatically than pure hydrostatic stress [
5,
9]. An intermediate structure, anhydrite (orthorhombic, Amma), has also been reported in xenotime compositions that are extremely close to the xenotime–monazite phase boundary (e.g., Gd
0.
5Tb
0.
5PO
4) or subjected to high deviatoric stresses at low hydrostatic pressures (e.g., Gd
xDy
1−xPO
4, TbPO
4) [
5,
10,
11].
While the pressure-induced phase transformations of REPO
4s have been extensively characterized in (quasi-)hydrostatic environments via in situ diamond anvil cell (DAC) X-ray diffraction (XRD) and Raman spectroscopy (RS), studies which systematically evaluate the influence of non-hydrostaticity are extremely limited [
7]. Such studies typically vary the pressure-transmitting medium (PTM) in the DAC in order to vary the hydrostaticity of the stress state experienced by the sample. For example, Santamaria-Perez et al. studied orthorhombic BaSO
4 using three different fluid PTMs (helium, silicone oil, and 4:1 methanol–ethanol), finding a decreasing hydrostatic limit led to lower transformation onset pressures (P
onset) and wider pressure ranges of phase coexistence [
12]. In REPO
4 literature specifically, Lacomba-Perales et al.’s in situ DAC XRD study notes that shear promotes earlier xenotime–monazite transformation in YPO
4, but this conclusion is based on a cursory comparison of their findings to a prior YPO
4 study carried out by others [
13]. Our recent in situ DAC XRD study probed the effect of shear on the xenotime–monazite transformation of DyPO
4 by systematically varying the PTM [
9]. We found neon and 16:3:1 methanol–ethanol–water (MEW) PTM yield similar P
onset values of 9.1(1) GPa and 9.3 GPa, respectively, while KCl PTM yields a much lower P
onset of 7.0 GPa (a ~22% drop). Even though neon crystallizes at 4.7 GPa, neon and MEW both remain (quasi-)hydrostatic at P
onset; therefore, employing only one of these two PTMs is sufficient (assuming other conditions are held constant) [
14]. The significant P
onset reduction under KCl is likely attributable to a higher shear stress state given the fact that KCl is never hydrostatic, and its ambient pressure bulk modulus (B
0) is ~20 times that of neon [
15,
16,
17]. We note that B
0 does not reflect the DAC conditions at P
onset since a material’s bulk modulus (B) generally increases with pressure. However, materials whose B
0 values differ by orders of magnitude do not attain similar B values at the high pressures of interest. At a given DAC pressure, an increase in the B value of a PTM results in less PTM compression, which is expected to generate greater contact stresses and friction at PTM–sample interfaces. Given the non-uniform magnitude and direction of the contact stresses and friction, greater shear stress is expected to be induced in the sample. While the quantification of stress transfer and shear stress generation by solid PTMs has not been detailed in the literature, results from prior DAC experiments on α-Ti support the expectation that solid PTMs with higher B
0 impart more shear stress on the sample than PTMs with lower B
0 [
18]. Because DyPO
4 was not tested under any solid PTM (solid at 1 atm) other than KCl, another high-shear state was not evaluated. Beyond our DyPO
4 study, the effect of shear on phase transformations has yet to be reported for any other REPO
4 [
9]. In addition, the high-pressure, post-monazite phase of TbPO
4 has yet to be experimentally observed.
This study employs in situ DAC synchrotron XRD to probe the pressure-induced phase transformations of xenotime TbPO
4 under variable hydrostaticity. The experiments performed in this study involve three PTMs: neon, KCl, and “none” (i.e., cell packed with sample and no PTM material). In the “none” PTM condition, the sample is effectively the PTM. Xenotime DyPO
4 is also tested in the “none” condition to build on our prior study [
9]. DyPO
4 and TbPO
4 have B
0 values of 144 GPa and 134 GPa, respectively, which are an order of magnitude higher than the B
0 of KCl [
9,
19]. Our TbPO
4 experiment using neon PTM shows a xenotime–monazite P
onset of 8.7(6) GPa, which is lower than other reported XRD-based hydrostatic P
onset values of 9.8 GPa and 9.9 GPa [
19]. In addition, TbPO
4 experiments in this study show a systematic lowering of the xenotime–monazite P
onset when changing the PTM from neon to KCl to “none” (i.e., as PTM bulk modulus increases). Lastly, our TbPO
4 experiment with no medium shows an almost 50% drop in P
onset (reaching the lowest value reported for any REPO
4 to date), provides evidence for scheelite as the post-monazite phase, and corroborates Hay et al.’s ex situ observation of monazite in indented xenotime TbPO
4.
2. Materials and Methods
Xenotime TbPO
4 and DyPO
4 powders were synthesized via precipitation reactions and subsequent calcination. Details of these synthesis steps are provided in the
Supplementary Materials. The sample powder consisted of grains ranging from sub-micrometer to a few micrometers in size; these grains exhibited the anisotropic, elongated crystal habit expected of tetragonal materials (see
Figure S1). In situ DAC XRD was conducted at room temperature at Beamline 12.2.2 of the Advanced Light Source at Berkeley National Laboratory. For experiments involving neon PTM, DACs were loaded with neon using the University of Chicago Gas Loader in the high-pressure lab at Beamline 12.2.2. Two-dimensional diffraction patterns were collected with a PILATUS 3S 1M detector at an X-ray wavelength of 0.4947 Å and an exposure time of 20 s. All DACs used were of the symmetric Princeton design and were compressed using a membrane driven by a Druck PACE 6000 pressure controller. Additional experiment details are shown in
Table 1. In the table and elsewhere in the manuscript, values within parentheses following a pressure represent the standard deviation of the last digit of the pressure.
For pressure marking during initial membrane engagement, ruby was used (R1 fluorescence calibration) [
20], while gold was used during diffraction data collection (using a 3rd order Birch–Murnaghan equation of state) [
21]. Data collection began at pressures higher than 0 GPa due to some initial compression required to confirm membrane engagement. There are no reported TbPO
4 or DyPO
4 phase transitions below these starting pressures (as corroborated by prior work); therefore, the initial jump does not preclude any material insight [
7,
9,
19]. The maximum pressure in each experiment (P
max) was limited by the performance of the gasket. Experiments were concluded when the gasket hole collapsed, approached the edge of the culets, or was otherwise unable to maintain a proper seal.
XRD pattern integration, masking, and background subtraction were performed using Dioptas [
22]. Pattern fitting was then performed using X’Pert HighScore Plus 3.0 [
23]. This software fits monazite using the
P2
1/
c cell setting as a default. Though both the
P2
1/
c and
P2
1/
n cell settings are valid descriptions of monazite (space group No. 14), fitted lattice parameters were converted to the
P2
1/
n cell setting to facilitate comparison to the literature. The LeBail fitting approach was used instead of traditional Rietveld structural refinement to accommodate the significant preferred orientation present in all scans [
24]. This apparent preferred orientation appears due to the small spot size of the beam with respect to the grain size of the sample (effectively sampling a finite number of grains), rather than any systematic preferred orientation of the sample grains. P
onset is determined by visual inspection of individual XRD patterns and fit residuals, not by judging color in the contour plots shown in the next section. Visual inspection involves plotting the square root of intensity against Q to ensure emerging peaks are not overlooked due to their extremely low intensity. The following reference structures were used in this study: xenotime TbPO
4 from Lopez-Solano et al. [
19], xenotime DyPO
4 from Milligan et al. [
25], monazite TbPO
4 and DyPO
4 from Heuser et al. [
26], anhydrite TbPO
4 from Losch et al. [
27], gold from Couderc et al. [
28], ruby from Jephcoat et al. [
29], and calculated scheelite TbPO
4 from López-Solano et al. [
19]. In the XRD patterns, the peaks of the ruby, anhydrite TbPO
4, and scheelite TbPO
4 structures are extremely weak or obscured by stronger peaks; as a result, LeBail fits incorporating these phases did not converge. Thus, the peaks of these three phases were only used in peak position comparison and were not employed in LeBail fitting. Traces of the anhydrite phase of TbPO
4 appear at the beginning of the Tb-neon experiment and may have arisen inadvertently from grinding during sample preparation or DAC loading. This phase does not appear in every scan (or even in every experiment), as the particular set of sample grains under X-ray illumination varies. For computation involving derived data (e.g., unit cell volume, gold-based pressure, cell setting conversion), the uncertainties Python package was used to propagate error [
30].
3. Results and Discussion
Across all experiments, increasing pressure causes XRD peaks to drift to higher Q and broaden due to uniform and non-uniform strain, respectively. In addition, XRD signal quality deteriorates under increasingly non-hydrostatic PTMs (i.e., going from neon to KCl to none); this trend has been previously reported in hydrostaticity studies of other materials [
12,
18]. Given these effects, the XRD patterns analyzed in the current study are limited to pressures at which key peaks are sufficiently distinguishable for phase identification and LeBail fitting.
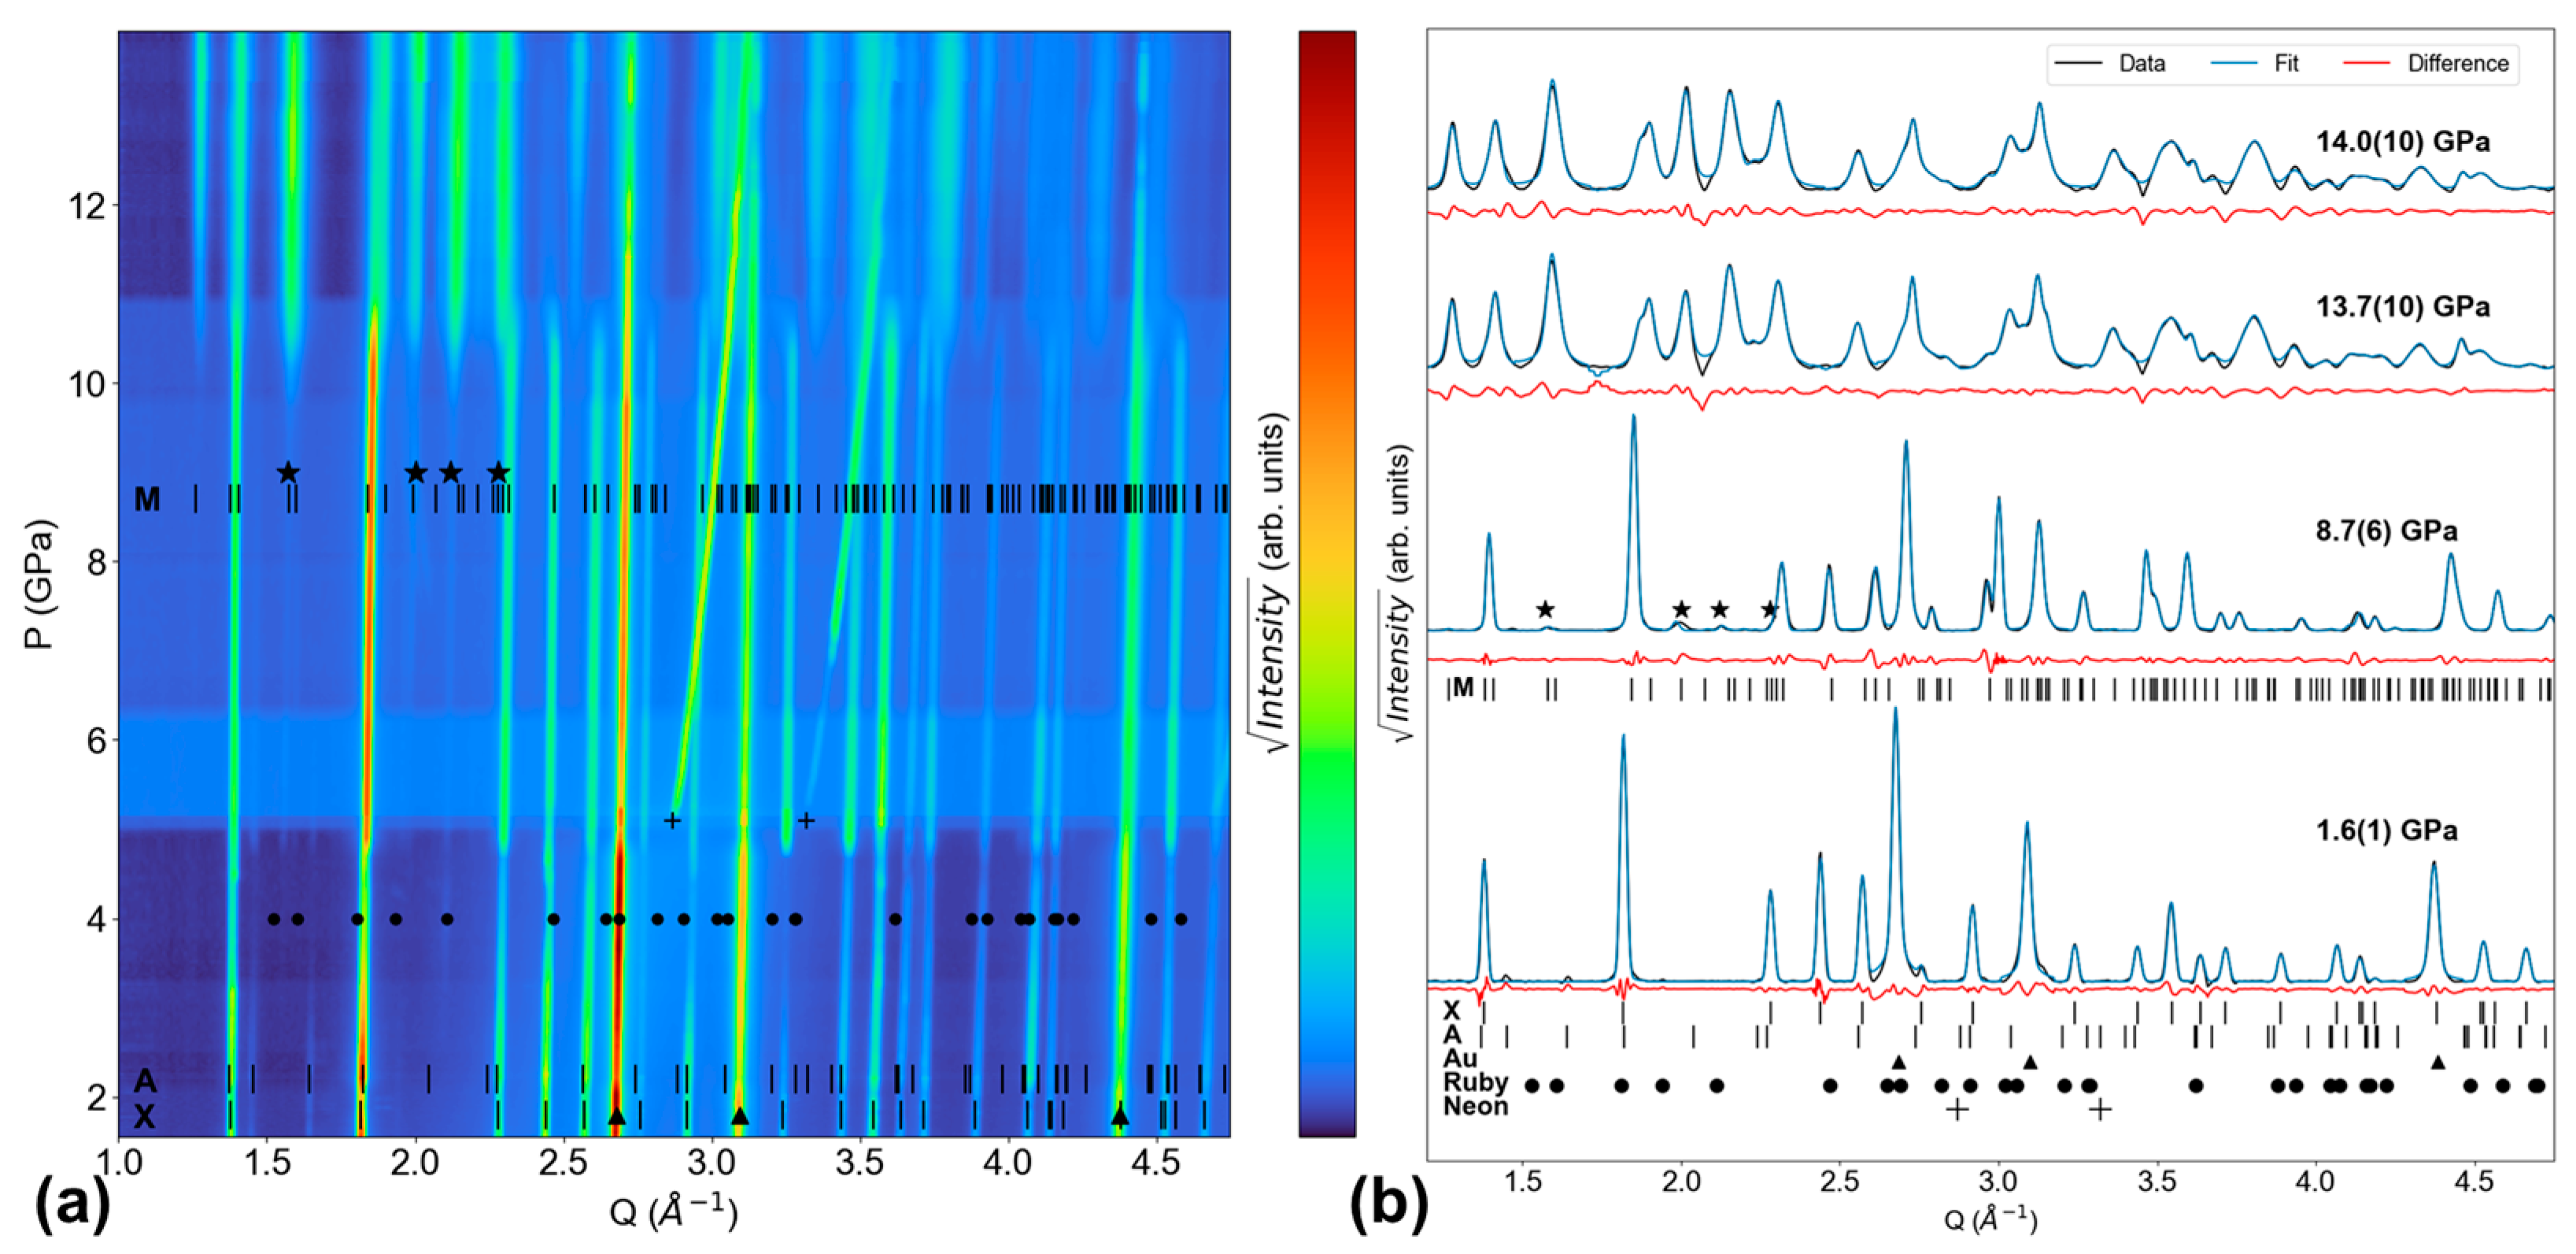
For the Tb-neon experiment,
Figure 2a shows XRD pattern evolution throughout the entire experiment, while
Figure 2b shows LeBail fit quality at P
initial (1.6(1) GPa), P
onset (8.7(6) GPa), the transformation end pressure (P
end, 13.7(10) GPa), and P
max (14.0(10) GPa). The first scan in this experiment features xenotime, anhydrite, and gold (upward triangle symbol) peaks. At ~5 GPa, the neon PTM crystallizes, and conditions shift from hydrostatic (in liquid neon) to quasi-hydrostatic (in solid neon) [
31]. Solid neon adopts an FCC structure and is still extremely compressible with a bulk modulus of ~1 GPa [
32]. Neon remains the most compressible material in the DAC, as evidenced by neon peaks shifting much more dramatically with increasing pressure than the other materials’ peaks in
Figure 2a. The first discernible monazite peaks emerge at 8.7(6) GPa and are located at Q = 1.58 Å
−1, 1.59 Å
−1, 1.98 Å
−1, 2.13 Å
−1, and 2.29 Å
−1 (as denoted by stars in
Figure 2); these are the (110), (10
), (002), (02
), and (21
) reflections, respectively.
Figure 2 also shows these peaks grow with pressure. In the P
onset scan in
Figure 2b, the refined monazite lattice parameters are a = 6.175(1) Å, b = 6.699(1) Å, c = 6.483(1) Å, and β = 100.67(1)°. This P
onset value is higher than neon’s crystallization pressure and lower than neon’s hydrostatic limit, meaning the stress state is quasi-hydrostatic at P
onset. With increasing pressure, monazite peaks grow while xenotime peaks diminish. At 13.7(10) GPa, there are no longer any clearly discernible peaks that are attributable to xenotime. Therefore, 13.7(10) GPa is P
end and yields a xenotime–monazite phase coexistence range of 5.0(10) GPa. In the final scan at 14.0(10) GPa, monazite, gold, and neon are the only phases present.
A key result from the Tb-neon experiment is the P
onset of 8.7(6) GPa, which is the lowest P
onset value for TbPO
4 in neon PTM reported to date. Lopez-Solano et al. reported a higher value of 9.9 GPa based on XRD experiments also conducted with neon PTM [
19]. Our experiment shows monazite peaks are clear at 9.9 GPa and at pressures leading up to this value (see
Figure 2a).
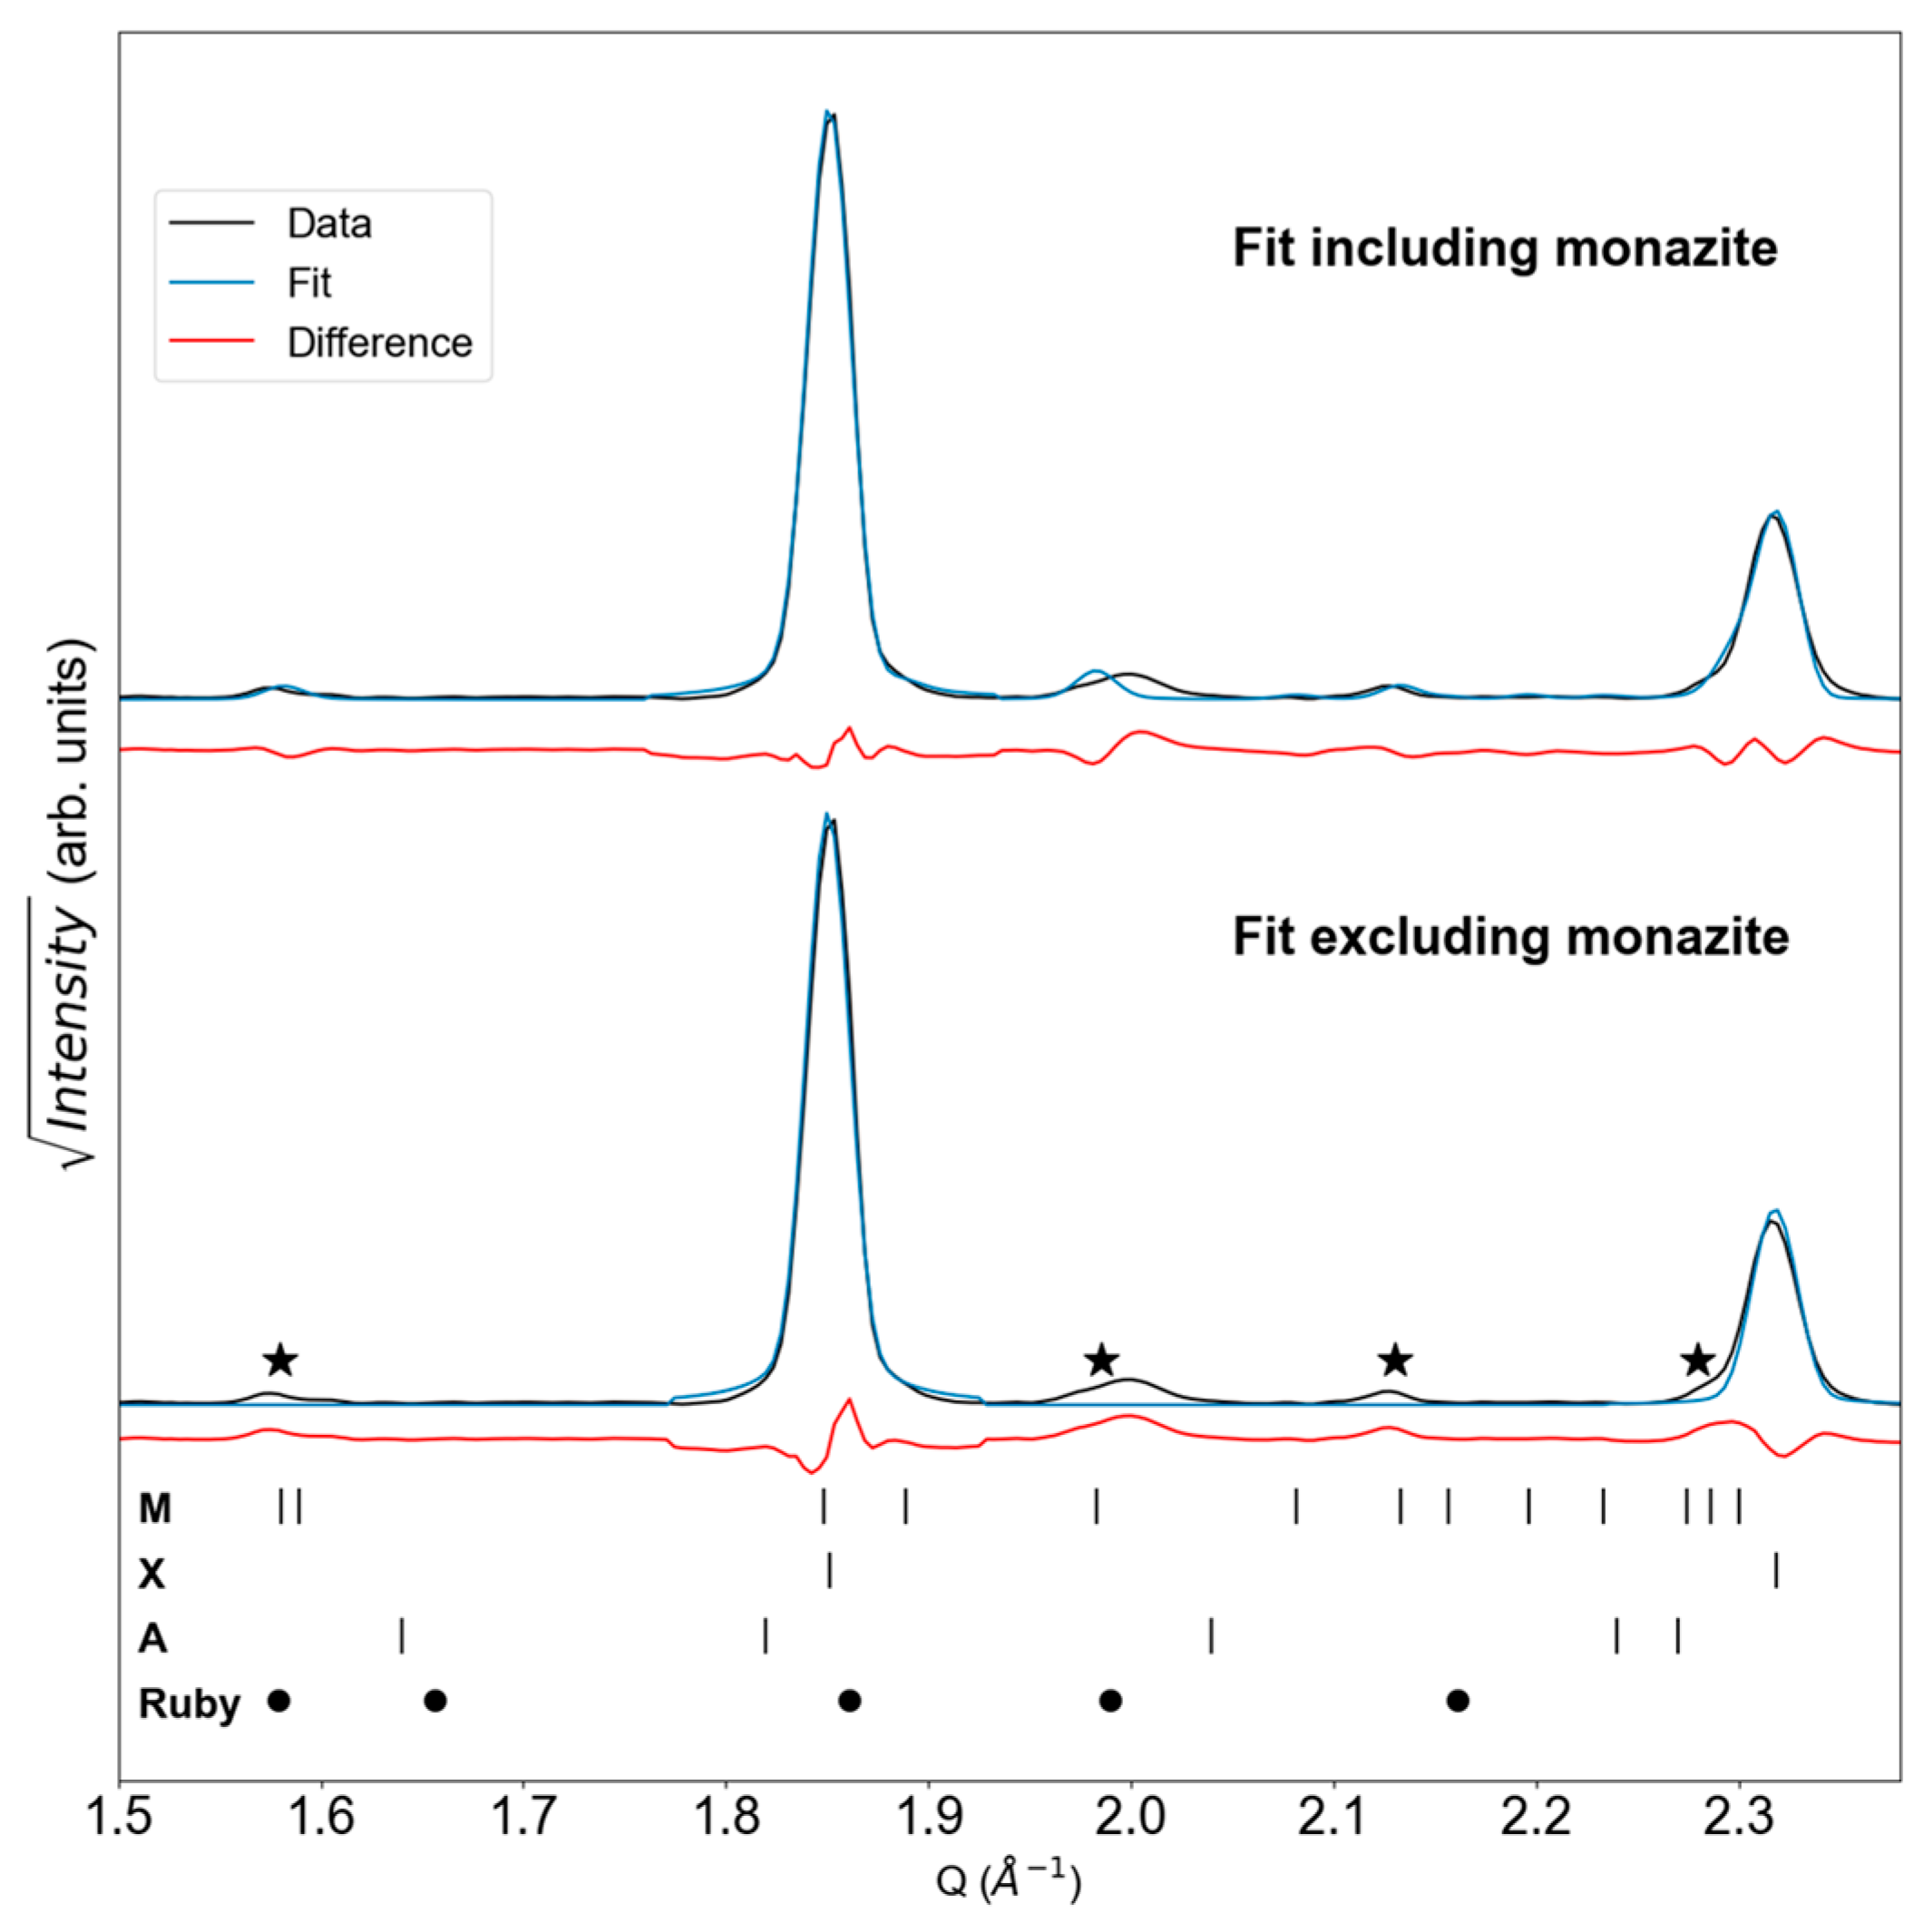
Figure 3 provides a closer look at our dataset, showing how including the monazite structure improves the fit of the XRD pattern collected at 8.7(6) GPa.
When monazite is excluded from the fit, there are regions of increased residual intensity (denoted by stars) that align with monazite peak positions. Although some ruby peaks are also quite close to the starred regions, ruby peaks do not align with all of these regions. Furthermore, the ruby signal is not expected to intensify with pressure, while the intensity in those starred regions does (as shown in
Figure 2).
Further consideration of thermodynamic data between neighboring REPO
4 compounds gives additional support to a lower P
onset than the one reported by Lopez-Solano et al. [
19]. Thermodynamic data (i.e., calculated enthalpy differences between xenotime and monazite phases as well as experimental calcination temperatures required to convert monazite to xenotime) show the monazite phase is more favorable in TbPO
4 than in DyPO
4 [
33,
34,
35,
36]. As a result, TbPO
4 is expected to have a lower xenotime–monazite P
onset than DyPO
4, but Lopez-Solano et al.’s TbPO
4 P
onset is higher than the previously reported DyPO
4 P
onset of 9.1(1) GPa (also in neon PTM) [
9]. The lower TbPO
4 P
onset reported in the present study is consistent with thermodynamic expectations. Nevertheless, the P
end of 13.7(10) GPa determined in this study is consistent with Lopez-Solano et al.’s P
end of 13.8 GPa.
For the Tb-KCl experiment,
Figure 4a shows XRD pattern evolution throughout the entire experiment, while
Figure 4b shows LeBail fit quality at P
initial (2.2(2) GPa), P
onset (5.6(4) GPa), and P
max (11.9(8) GPa). The first scan in this experiment contains peaks belonging to xenotime, gold (upward triangle symbol), and B1-KCl (left-pointing triangle symbol). B1-KCl is the ambient pressure phase of KCl with a NaCl-type structure, and it begins transforming into the CsCl-type B2-KCl structure (right-pointing triangle symbol) at 2.3(1) GPa. Similar to neon in the Tb-neon experiment, KCl in this experiment is the most compressible material in the DAC, causing its peaks to shift in Q more than the sample’s peaks [
37]. KCl peaks do not shift as dramatically as neon’s peaks in the Tb-neon experiment because KCl has a higher bulk modulus than neon.
At 5.6(4) GPa, monazite peaks emerge at Q = 1.55 Å
−1, 2.1 Å
−1, and 2.58 Å
−1 (as denoted by stars in
Figure 4); these are the (110), (02
), and (211) reflections, respectively. In the P
onset scan, the refined monazite lattice parameters are a = 6.239(1) Å, b = 6.832(3) Å, c = 6.793(1) Å, and β = 99.06(1)°. Both the xenotime and monazite phases persist through the end of the experiment at 11.9(8) GPa, so the phase coexistence range is at least 6.3(8) GPa. In the final scan at 11.9(8) GPa, xenotime, monazite, gold, and B2-KCl are the only phases present.
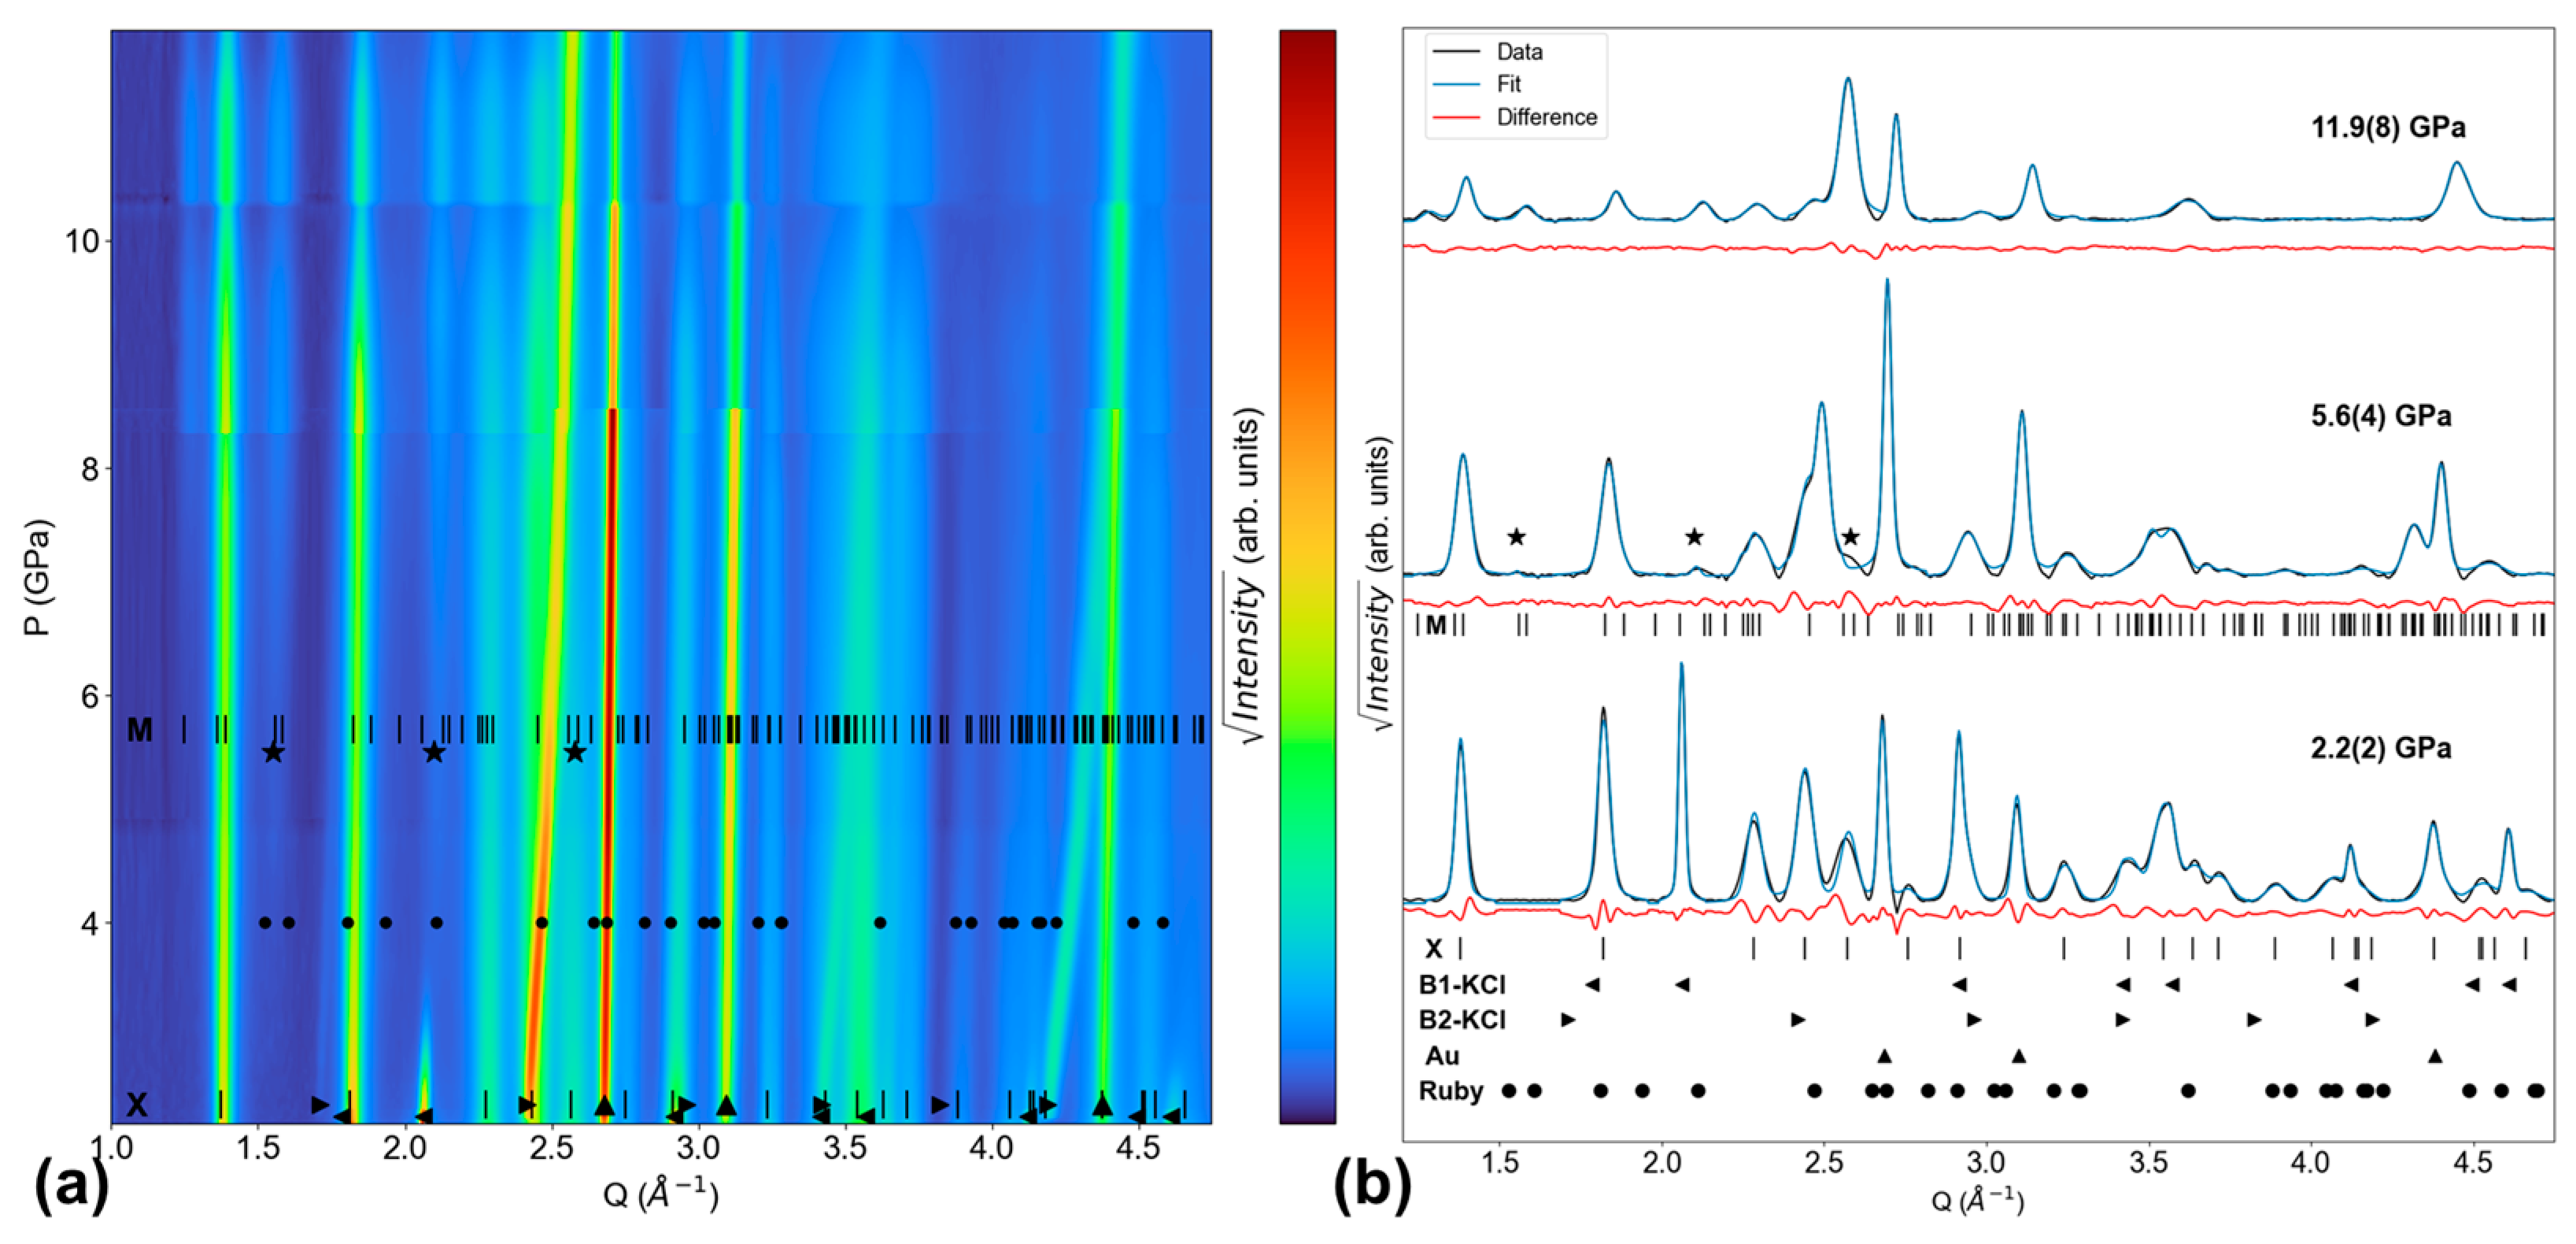
For the Tb-none experiment,
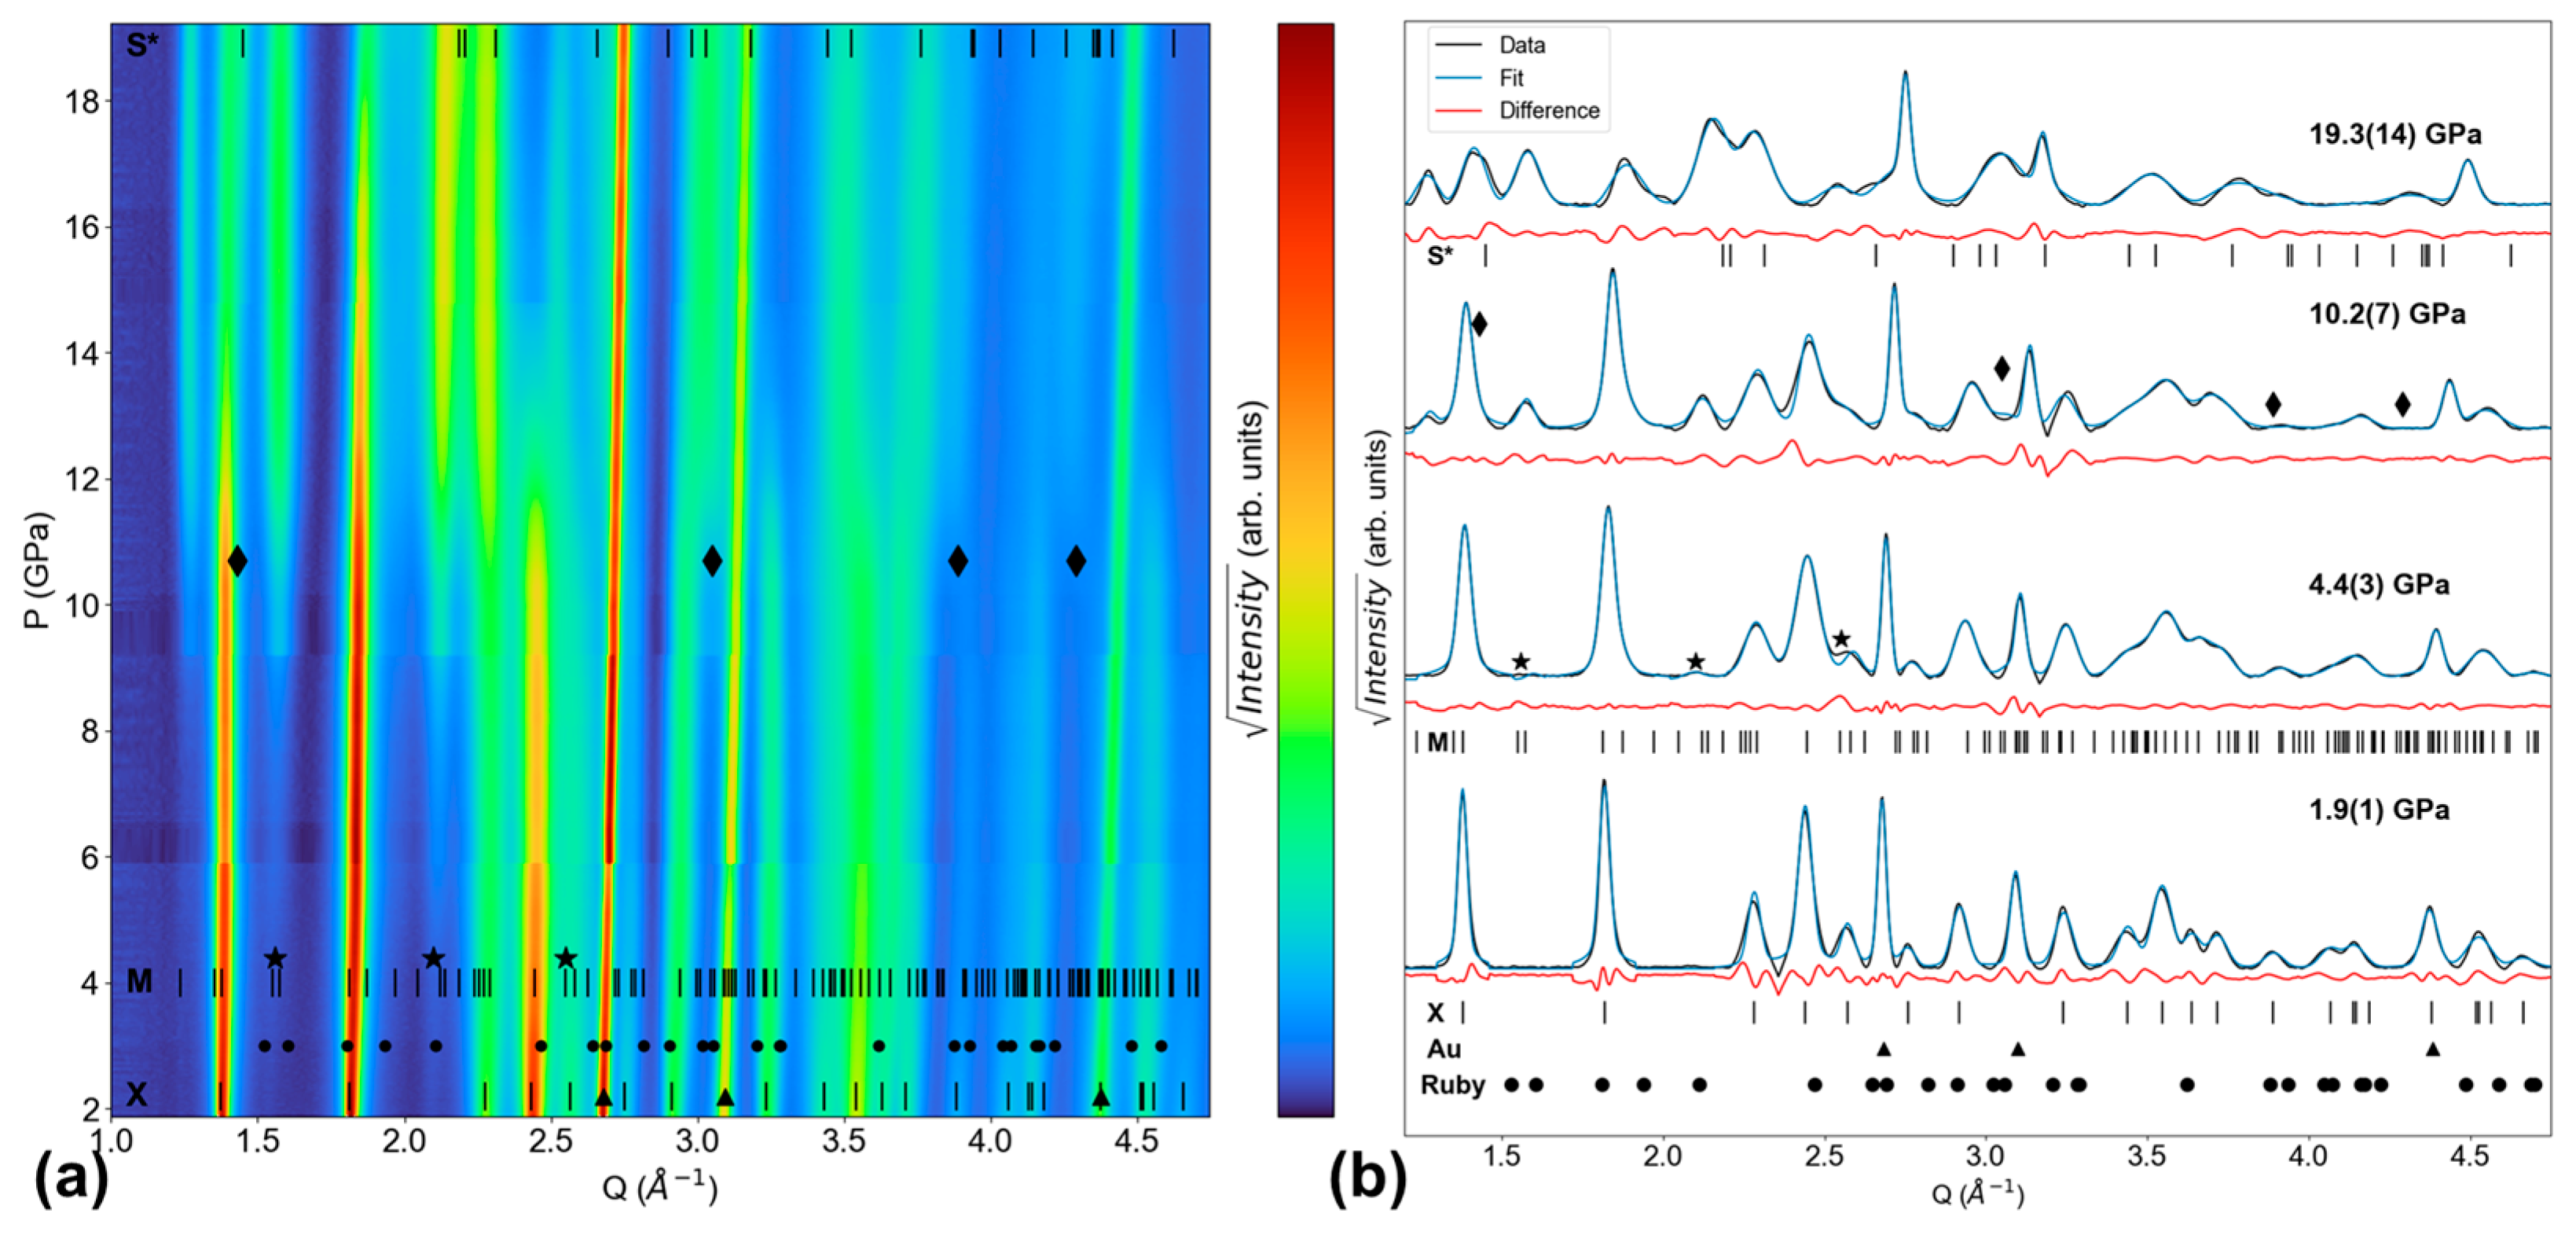
Figure 5a shows XRD pattern evolution throughout the entire experiment, while
Figure 5b shows LeBail fit quality at P
initial (1.9(1) GPa), the xenotime–monazite P
onset (4.4(3) GPa), the potential scheelite P
onset (10.2(7) GPa), and P
max (19.3(14) GPa). The first scan in this experiment shows xenotime, gold (upward triangle symbol), and possibly weak ruby (circle symbol) peaks. At 4.4(3) GPa, monazite peaks emerge at Q = 1.55 Å
−1, 2.10 Å
−1, and 2.58 Å
−1 (as denoted by stars in
Figure 5); these are the (110), (02
), and (211) reflections, respectively. In the P
onset scan, the refined monazite lattice parameters are a = 6.134(1) Å, b = 6.870(1) Å, c = 6.187(2) Å, and β = 99.83(2)°.
At 10.2(7) GPa, new peaks emerge at Q = 1.43 Å
−1, 3.05 Å
−1, 3.89 Å
−1, and 4.29 Å
−1 (denoted by diamond symbols in
Figure 5), and these peaks grow as pressure continues to increase. The phase giving rise to these peaks is likely scheelite-structured TbPO
4, as Lopez-Solano et al. and Bose et al. both predicted scheelite would be the post-monazite phase of TbPO
4, and scheelite has been experimentally observed in YPO
4, TmPO
4, YbPO
4, LuPO
4, and ScPO
4 [
19,
38,
39,
40].
Figure 5 also shows ‘S*’ ticks, which represent the peak positions of a scheelite TbPO
4 structure simulated at 20.5 GPa, as reported by Lopez-Solano et al. [
19]. The diamond symbols are not perfectly aligned with the S* ticks; however, this slight misalignment is expected given the differences in conditions between this experimental study and Lopez-Solano et al.’s simulation (e.g., pressure, stress state, temperature, and the confounding effects of these factors on individual peak positions). Therefore, the emergence of new peaks (diamond symbols) and their proximity to the ‘S*’ ticks suggests the presence of scheelite is plausible and requires confirmation via further XRD experiments. If confirmed, 10.2(7) GPa would be the lowest pressure at which any scheelite structure has been reported in REPO
4s to date.
The final scan in this experiment contains xenotime, monazite, gold, and potentially scheelite. Therefore, this experiment yields a xenotime–monazite phase coexistence range of at least 14.9(14) GPa and a potential xenotime–monazite–scheelite phase coexistence range of at least 9.1(14) GPa.
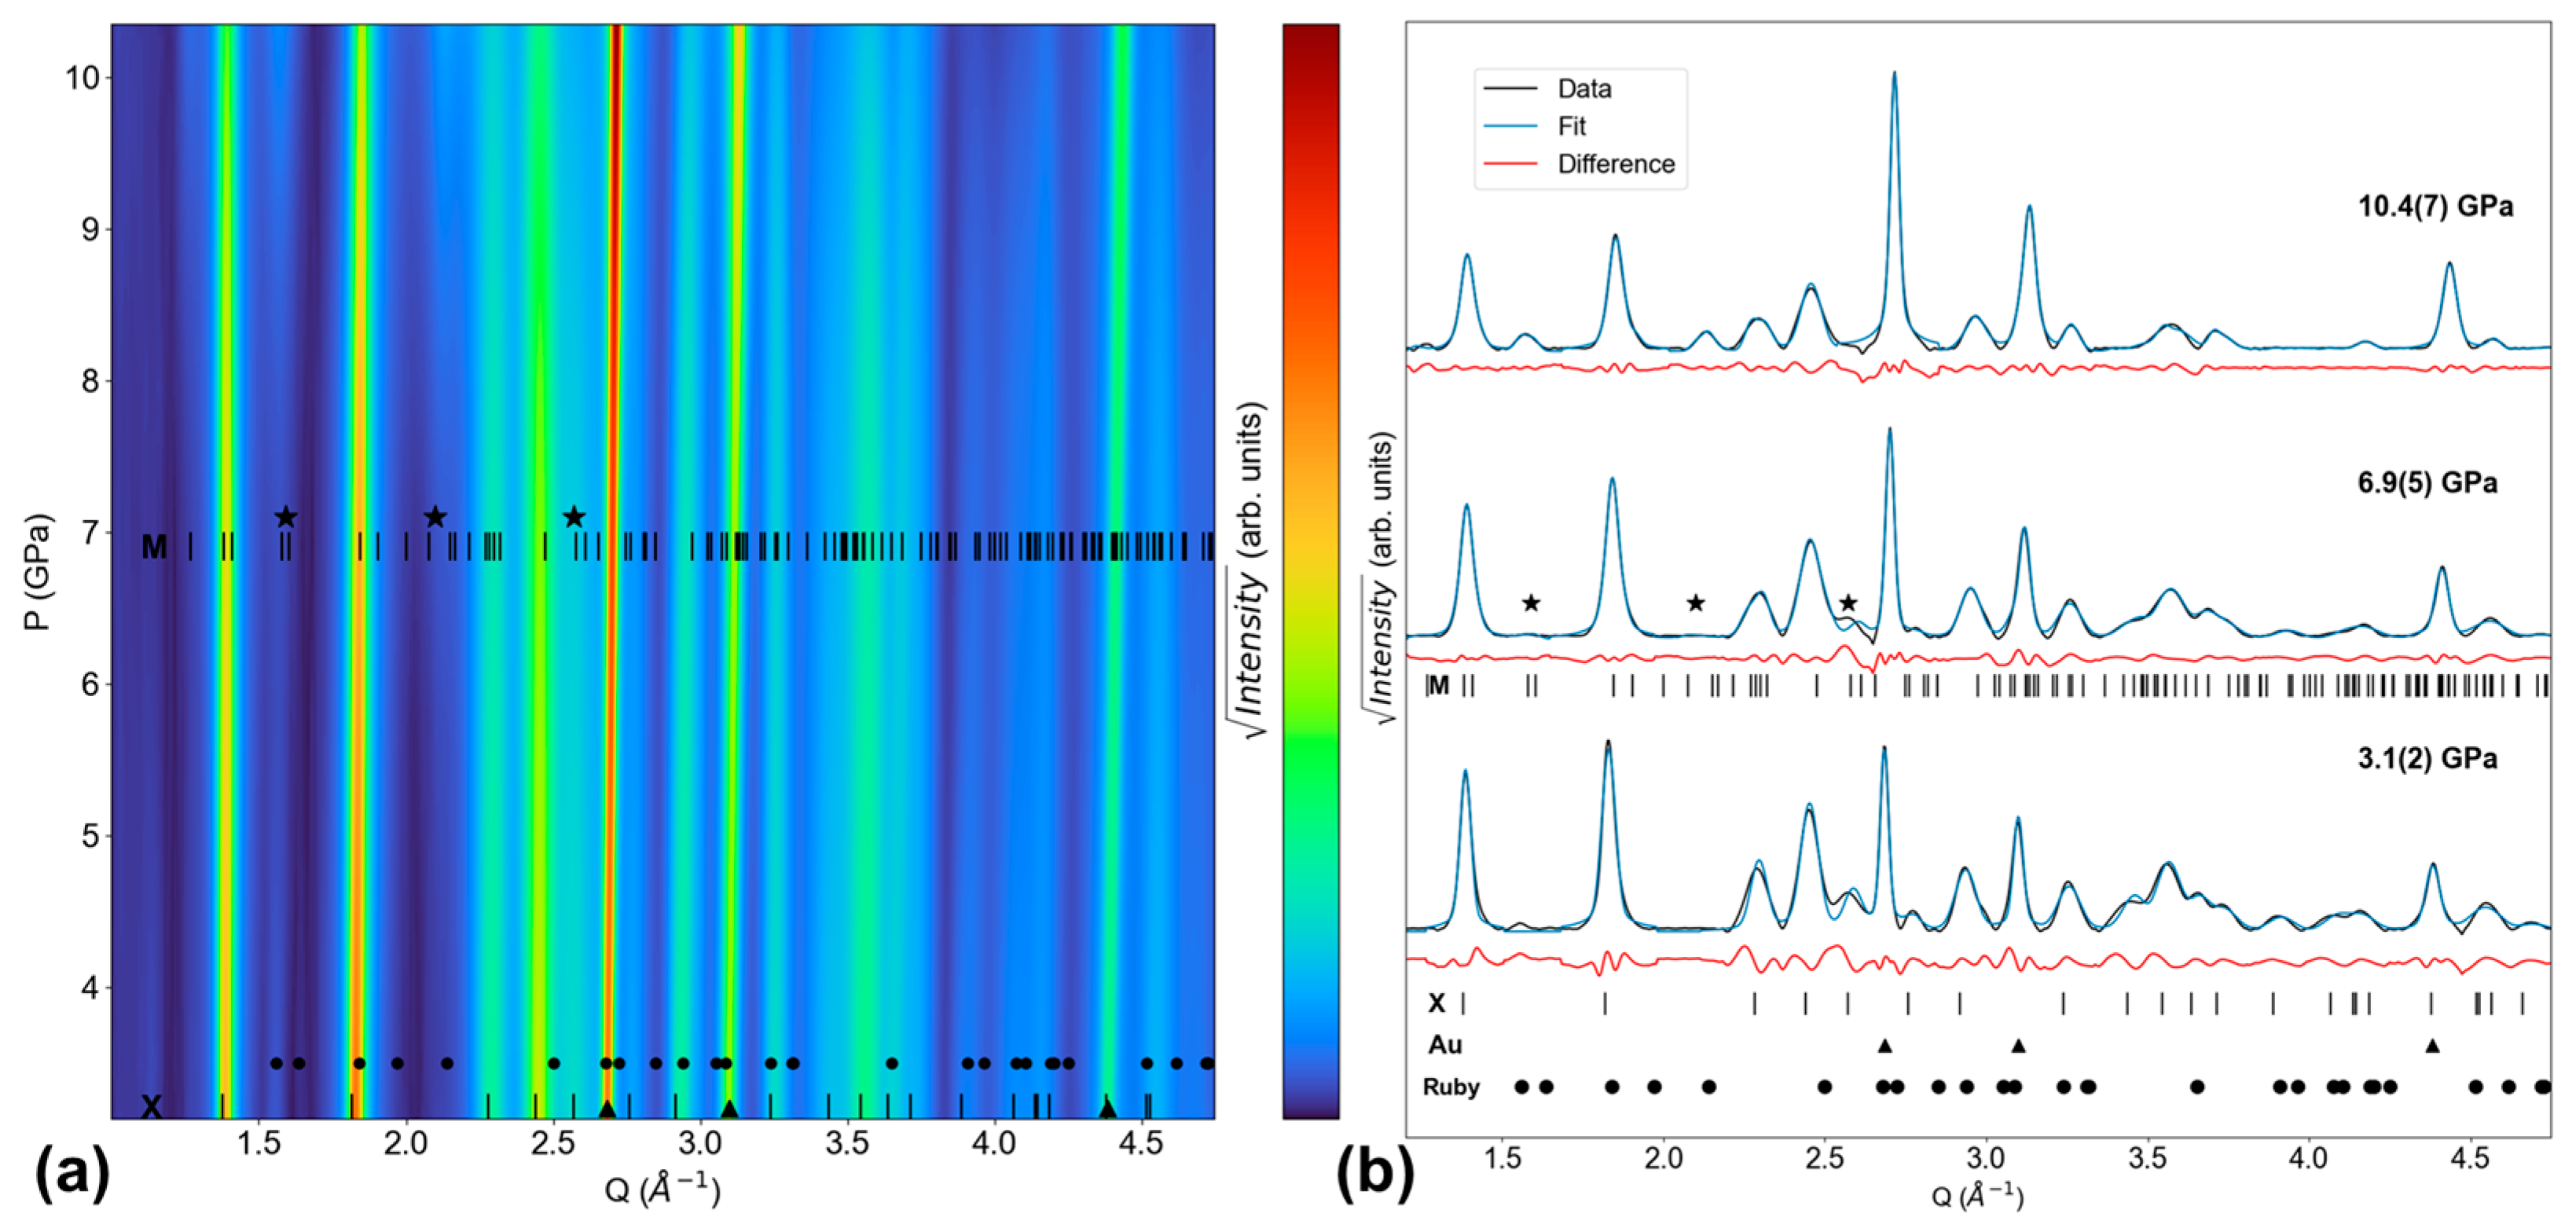
A Dy-none experiment was also performed to build on our prior DyPO
4 study, in which KCl was the only PTM tested that was solid at 1 atm [
9].
Figure 6a shows XRD pattern evolution throughout the entire experiment, while
Figure 6b shows LeBail fit quality at P
initial (3.1(2) GPa), at the xenotime–monazite P
onset (6.9(5) GPa), and at P
max (10.4(7) GPa). The first scan in this experiment shows xenotime, gold (upward triangle symbol), and ruby (circle symbol) peaks. At 6.9(5) GPa, monazite peaks emerge at Q = 1.59 Å
−1, 2.10 Å
−1, and 2.57 Å
−1 (as denoted by stars in
Figure 5); these are the (110), (02
), and (211) reflections, respectively. In the P
onset scan, the refined monazite lattice parameters are a = 6.187(3) Å, b = 6.603(2) Å, c = 6.783(5) Å, and β = 102.40(4)°. The final scan at 10.4(7) GPa contains xenotime, monazite, and gold. Consequently, the DyPO
4 xenotime–monazite phase coexistence range is found to be at least 3.5(7) GPa.
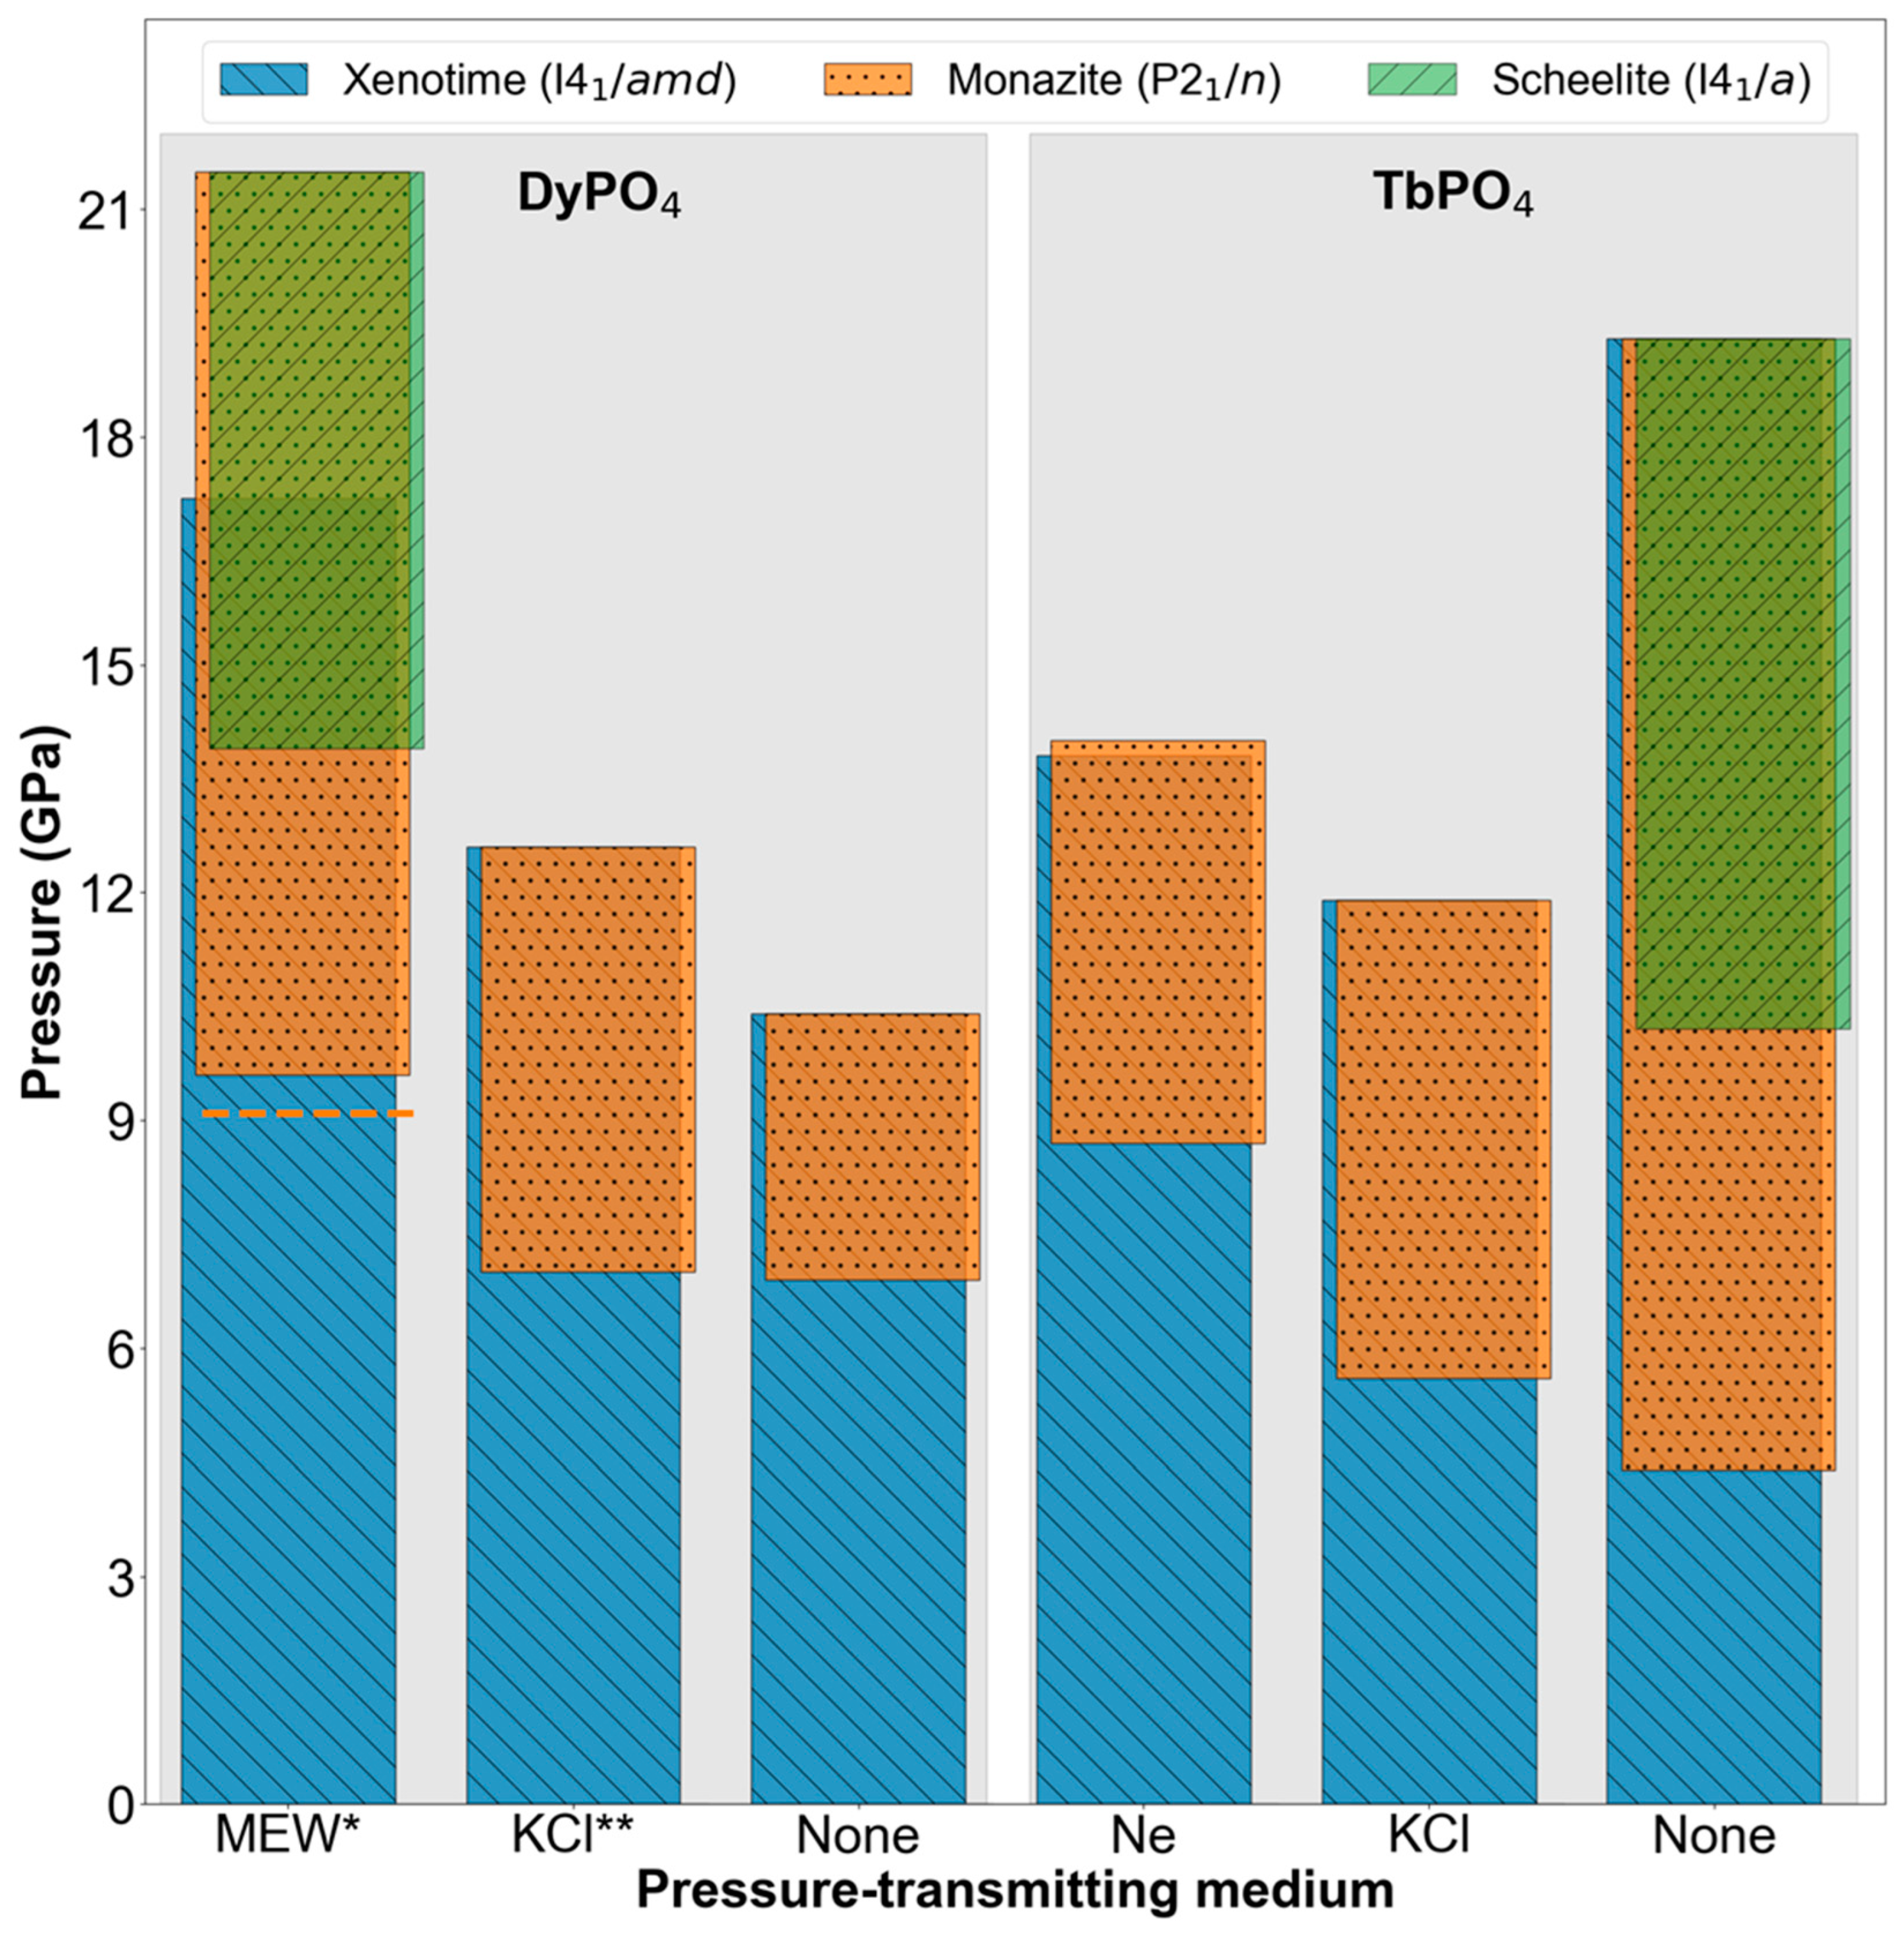
Figure 7 summarizes the DyPO
4 and TbPO
4 phase behavior transformation data reported in this study as well as in two prior DyPO
4 studies [
7,
9]. In the DyPO
4 section, phase data from an experiment using the MEW PTM (Dy-MEW [
7]) are shown, since a prior experiment using neon (Dy-neon [
9]) did not reach pressures high enough to gauge the xenotime–monazite phase coexistence range. MEW has a hydrostatic limit of 10.5(5) GPa and is therefore hydrostatic at the xenotime–monazite P
onset, like neon. The P
onset from the Dy-neon experiment (9.1(1) GPa) is shown as an orange dashed line in
Figure 7 and is within the error bar of the P
onset from the Dy-MEW experiment (9.6(7) GPa).
Figure 7 shows DyPO
4 and TbPO
4 both exhibit xenotime–monazite P
onset reductions with non-hydrostatic PTMs. Shear can facilitate the plastic deformation involved in phase transformation (i.e., polyhedral rotations and translations) and thereby reduce the hydrostatic pressure required to induce phase transformation. In fact, non-hydrostatic conditions have been suggested to lower the pressure required to induce mechanical instability in other REPO
4 and REVO
4 materials [
41,
42]. High-pressure dynamical instability (i.e., the softening of Raman-active and silent phonon modes) has also been observed in these materials, but it has less influence on P
onset than mechanical instability does [
36,
41,
42]. In addition, the TbPO
4 P
onset values are marginally (KCl) or significantly (none) lower than those of DyPO
4 in the same PTM. TbPO
4 P
onset values being lower likely stems from the monazite phase being more thermodynamically favorable in TbPO
4 than in DyPO
4 regardless of the kinetic barriers involved [
33,
34,
35,
36].
Figure 7 also shows the onset of the scheelite phase at 13.9(10) GPa in the Dy-MEW experiment and at 10.2(7) GPa in the Tb-none experiment. This difference in scheelite P
onset values is likely a convolution of compositional and shear effects. Because the Tb-none experiment is less hydrostatic than the Dy-MEW experiment, the onset pressure of the scheelite phase in the former experiment is expected to be lower. This expectation is consistent with observations from the other experiments. However, the effect of composition on the onset of the scheelite phase remains unclear. Moreover, the lack of scheelite (green bars) in the other four experiments shown in
Figure 7 may simply be a consequence of those four experiments not reaching sufficiently high pressures. Considering strictly the DyPO
4 experiments, we expect the scheelite P
onset to be lower in Dy-KCl and Dy-none than in Dy-MEW (as MEW is the most hydrostatic medium of the three) based on a hypothesis of shear-induced lowering of transformation pressure. Unfortunately, the Dy-KCl and Dy-none experiments terminated at pressures significantly lower than the scheelite P
onset of Dy-MEW, leaving significant untested pressure ranges in which the onset of scheelite is still plausible. Considering the TbPO
4 experiments, the emergence of scheelite in Tb-none evidently shows a shear-induced lowering of P
onset because scheelite is not observed at the same pressure in lower shear experiments (i.e., Tb-neon, Tb-KCl). These lower shear experiments are expected to yield higher scheelite P
onset values than Tb-none, so the lack of scheelite observation may be attributable to an insufficient P
max. In order to clarify the presence of scheelite, additional Dy-KCl, Dy-none, Tb-neon, and Tb-KCl experiments going to higher pressures are merited.
Next, the effect of shear on xenotime–monazite phase coexistence is considered. All experiments shown in
Figure 7 show significant phase coexistence ranges of at least 3 GPa, further supporting the notion that REPO
4 phase transformations are diffusional rather than martensitic. Consistent with our prior DyPO
4 studies, the coexistence of multiple REPO
4 phases at certain pressures defies Gibbs’ phase rule and further shows the sluggish nature of pressure-induced phase transformation in these materials [
7,
9]. Furthermore, the TbPO
4 experiments show that while shear induces earlier onset of transformation, it does not induce earlier completion of transformation. While the xenotime–monazite coexistence range is 5.0(10) GPa in the Tb-neon experiment, this range extends to at least 6.3(8) GPa and at least 14.9(14) GPa in the Tb-KCl and Tb-none experiments, respectively. This range extension has also been reported in BaSO
4 and α-Ti when these materials are compressed using non-hydrostatic PTMs [
18,
19]. At a fundamental level, extended phase coexistence under shear may be attributable to non-uniform stress fields causing varying degrees of transformation progression in a given volume of material. Conclusions regarding coexistence trends cannot be drawn from the DyPO
4 experiments, as the Dy-KCl and Dy-none experiments do not go to sufficiently high pressures. For completeness, plots showing the pressure-dependence of TbPO
4 and DyPO
4 monazite and xenotime lattice parameters as well as a table of axial compressibilities are provided in the
Supplementary Materials.
The findings in this study provide key insights for understanding REPO
4s under complex stress states and inform potential structural applications, including CMC fiber coatings. This work provides in situ evidence to corroborate ex situ observations of phase transformation of TbPO
4 under shear from other types of experiments (e.g., indentation, fiber pull-out) [
4,
5]. In addition, this study shows a high-shear environment can lower the P
onset to pressures below the xenotime REPO
4′s hardness, suggesting transformation-related strain-hardening affects measured hardness values [
4,
43]. Moreover, this work suggests REPO
4 compositions further from the xenotime–monazite phase boundary (i.e., with higher hydrostatic P
onset values) may be considered for CMC fiber coating applications if P
onset is proven to drop as dramatically under shear as it does in TbPO
4. The benefits of REPO
4 phase transformation (i.e., enhanced CMC plasticity and toughening) may be accessible at lower pressures and over a wider range of pressures than previously understood.


