
Microstructure-Based CZE Model for Crack Initiation and Growth in CGI: Effects of Graphite-Particle Morphology and Spacing


Abstract
:
1. Introduction
2. Methodology
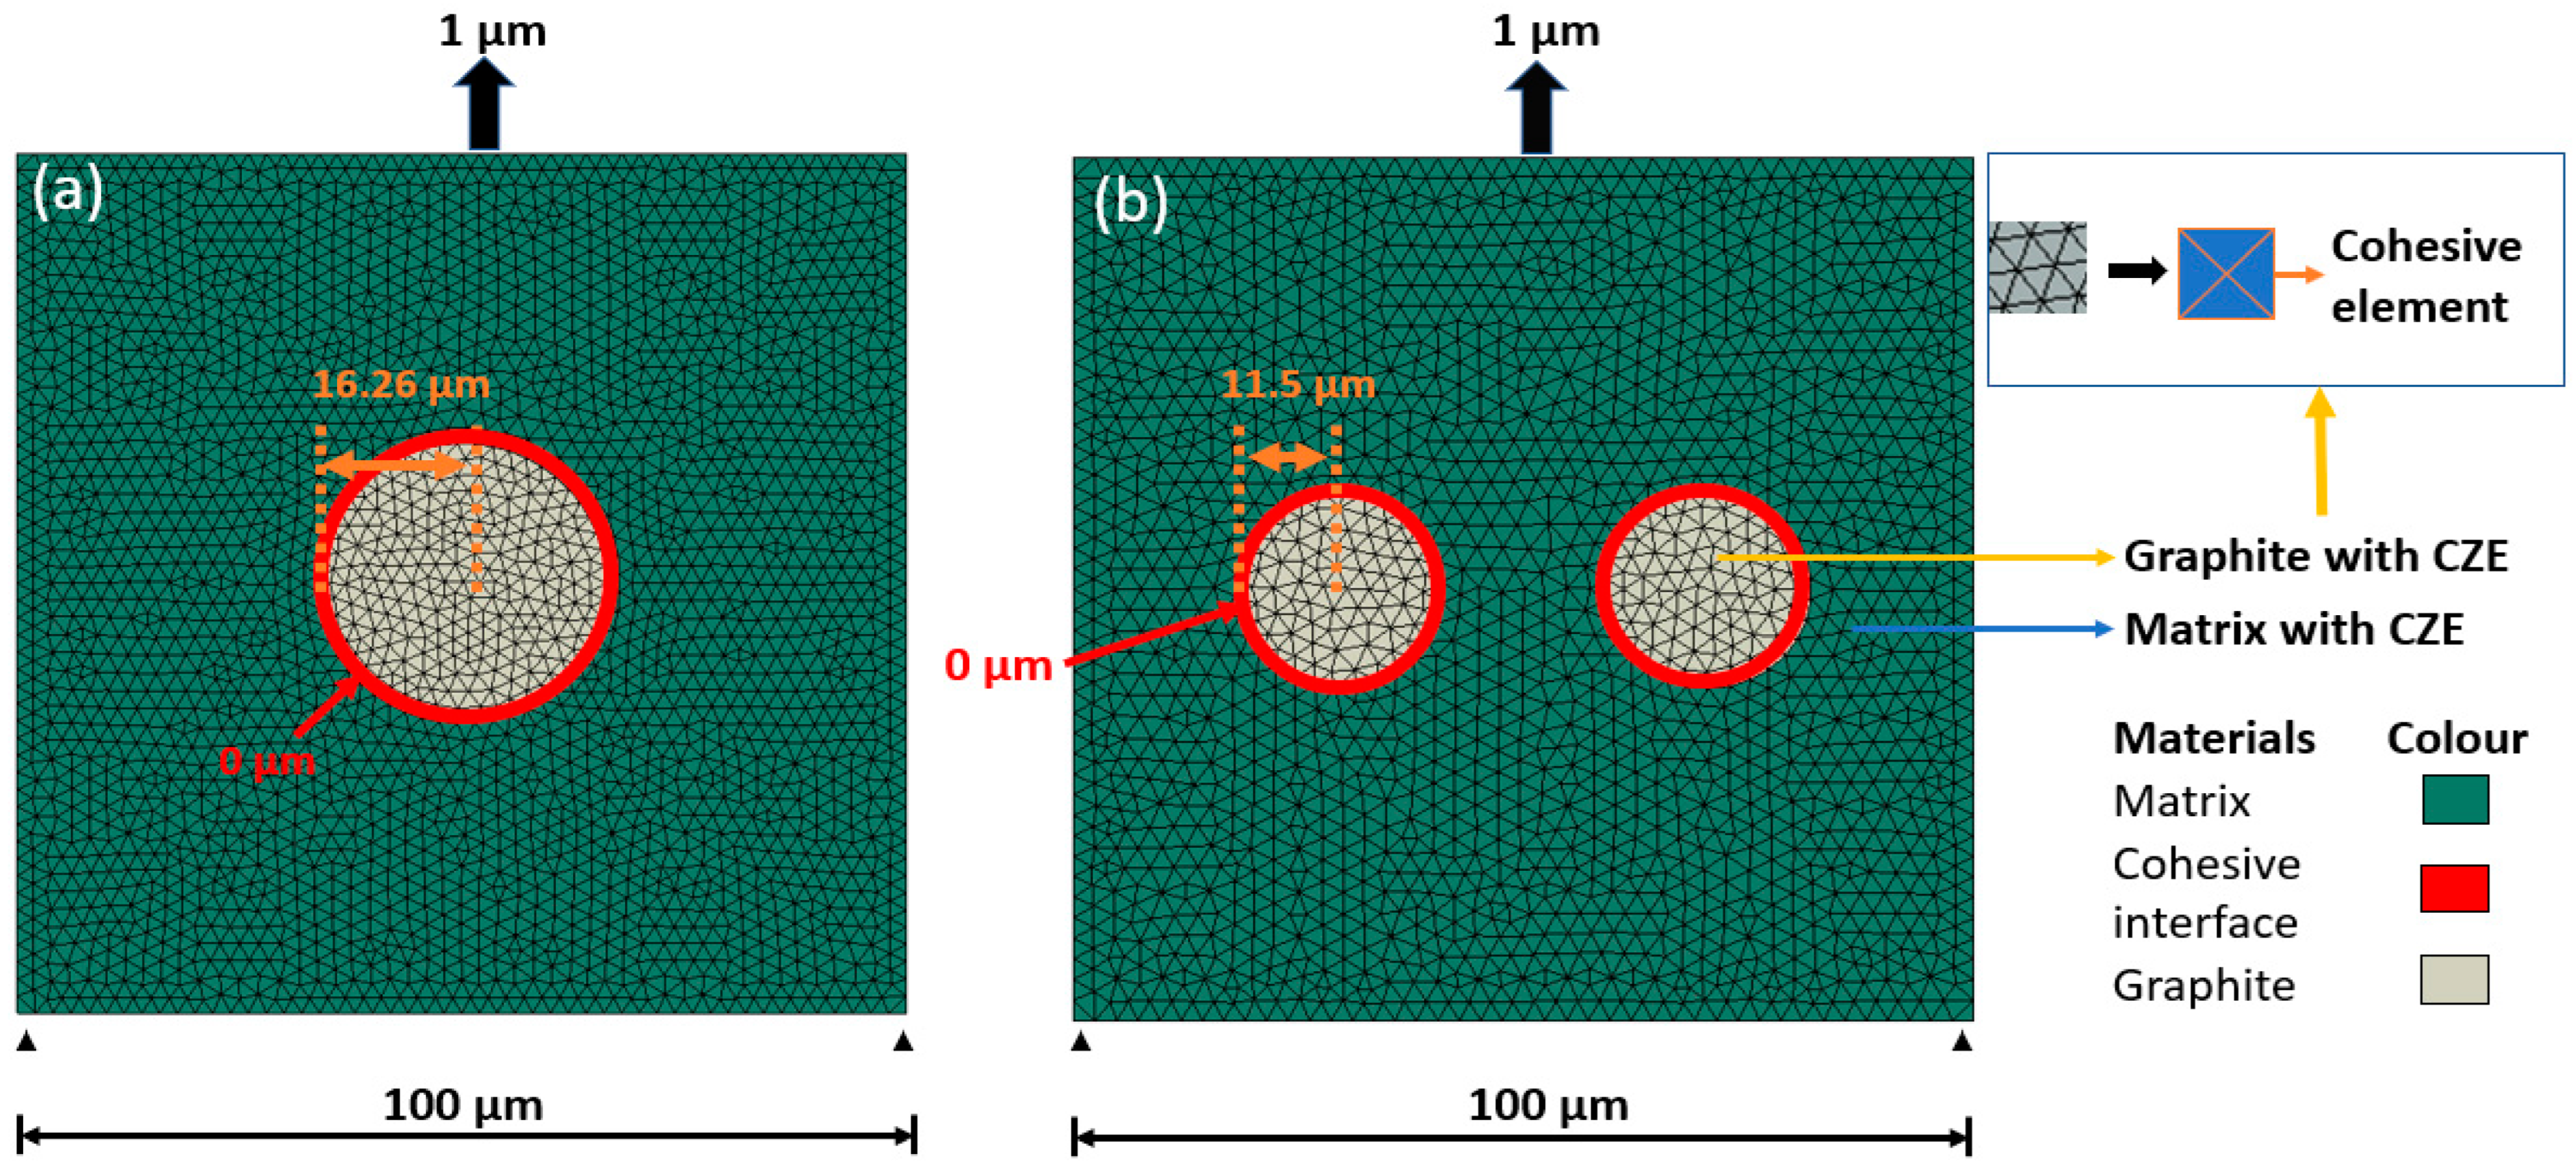
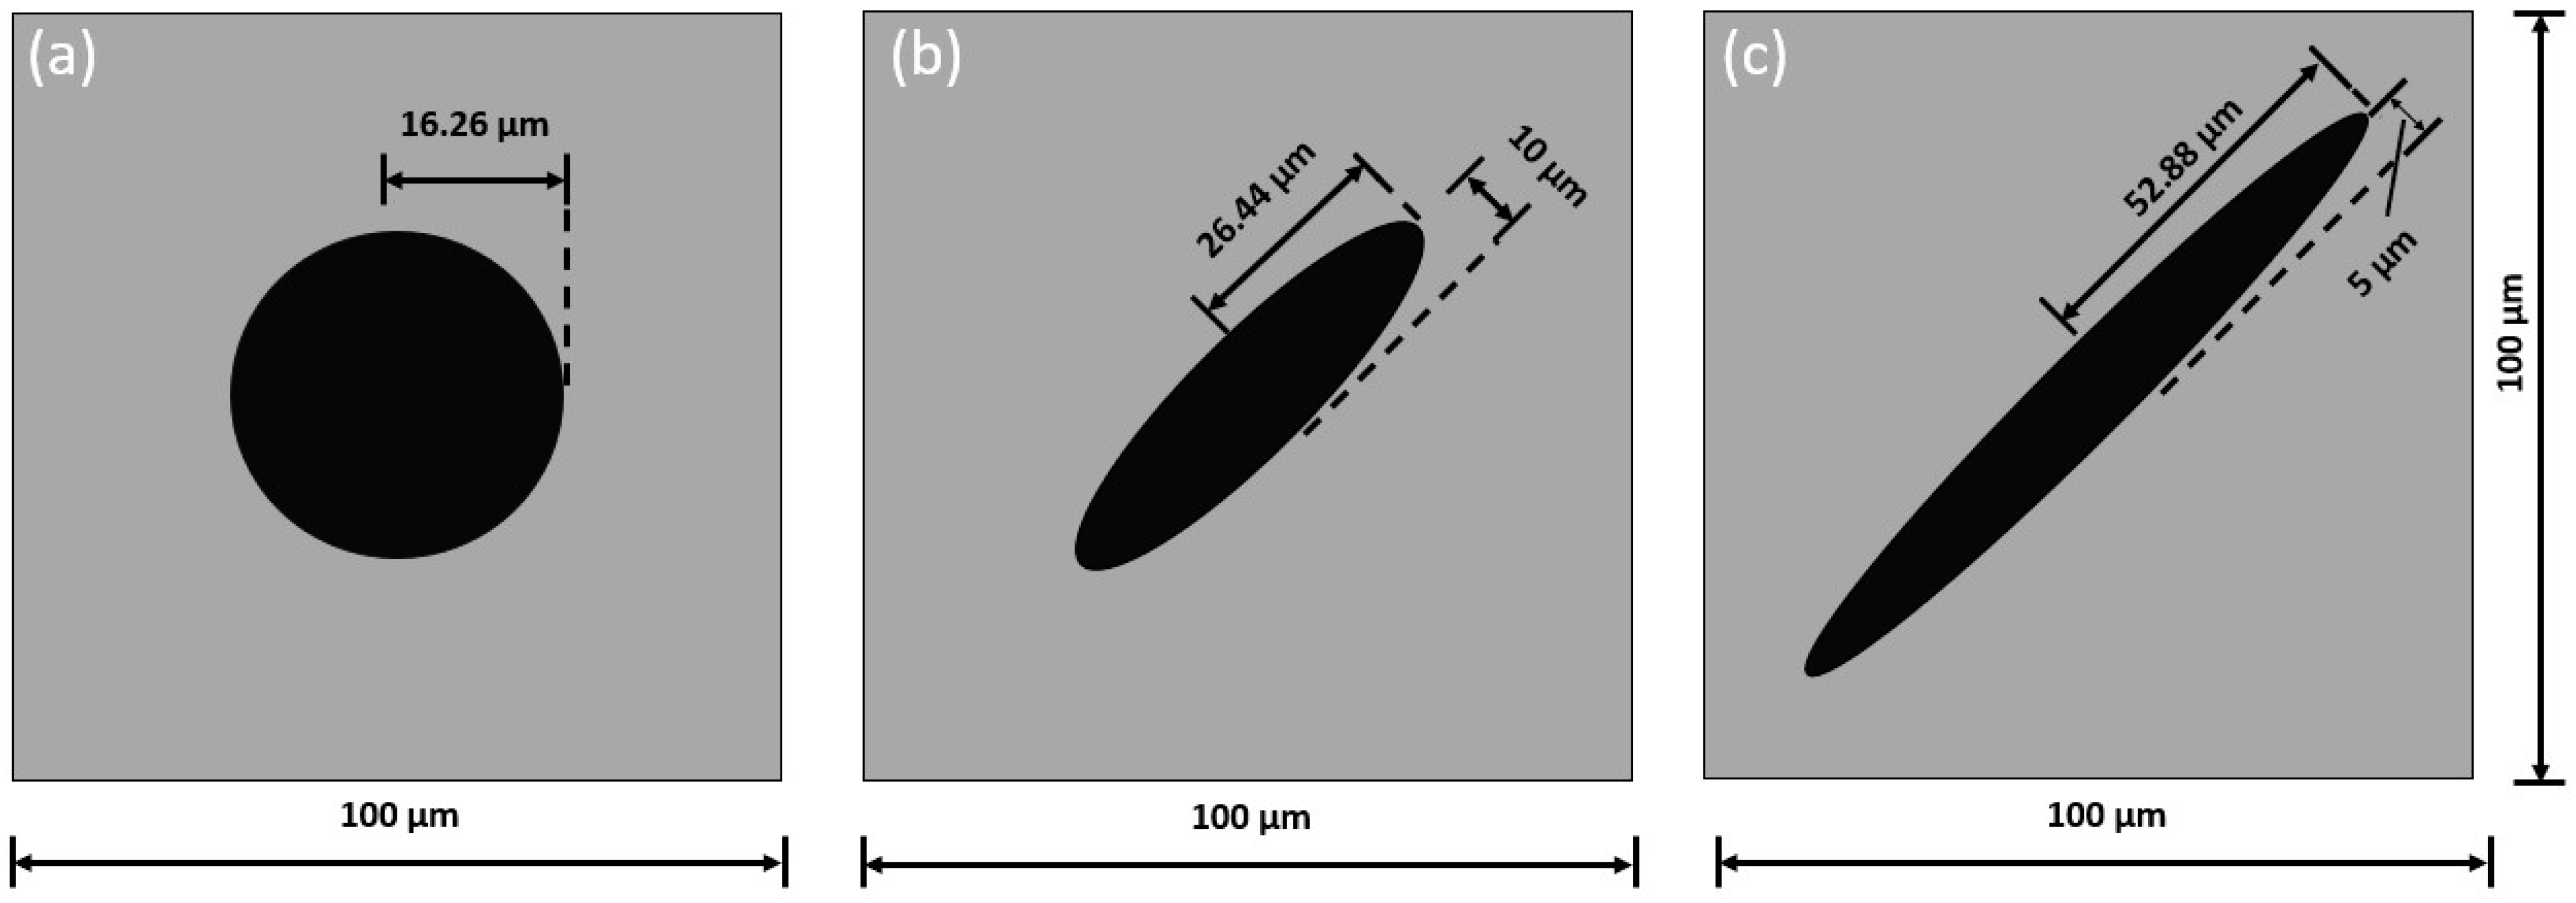
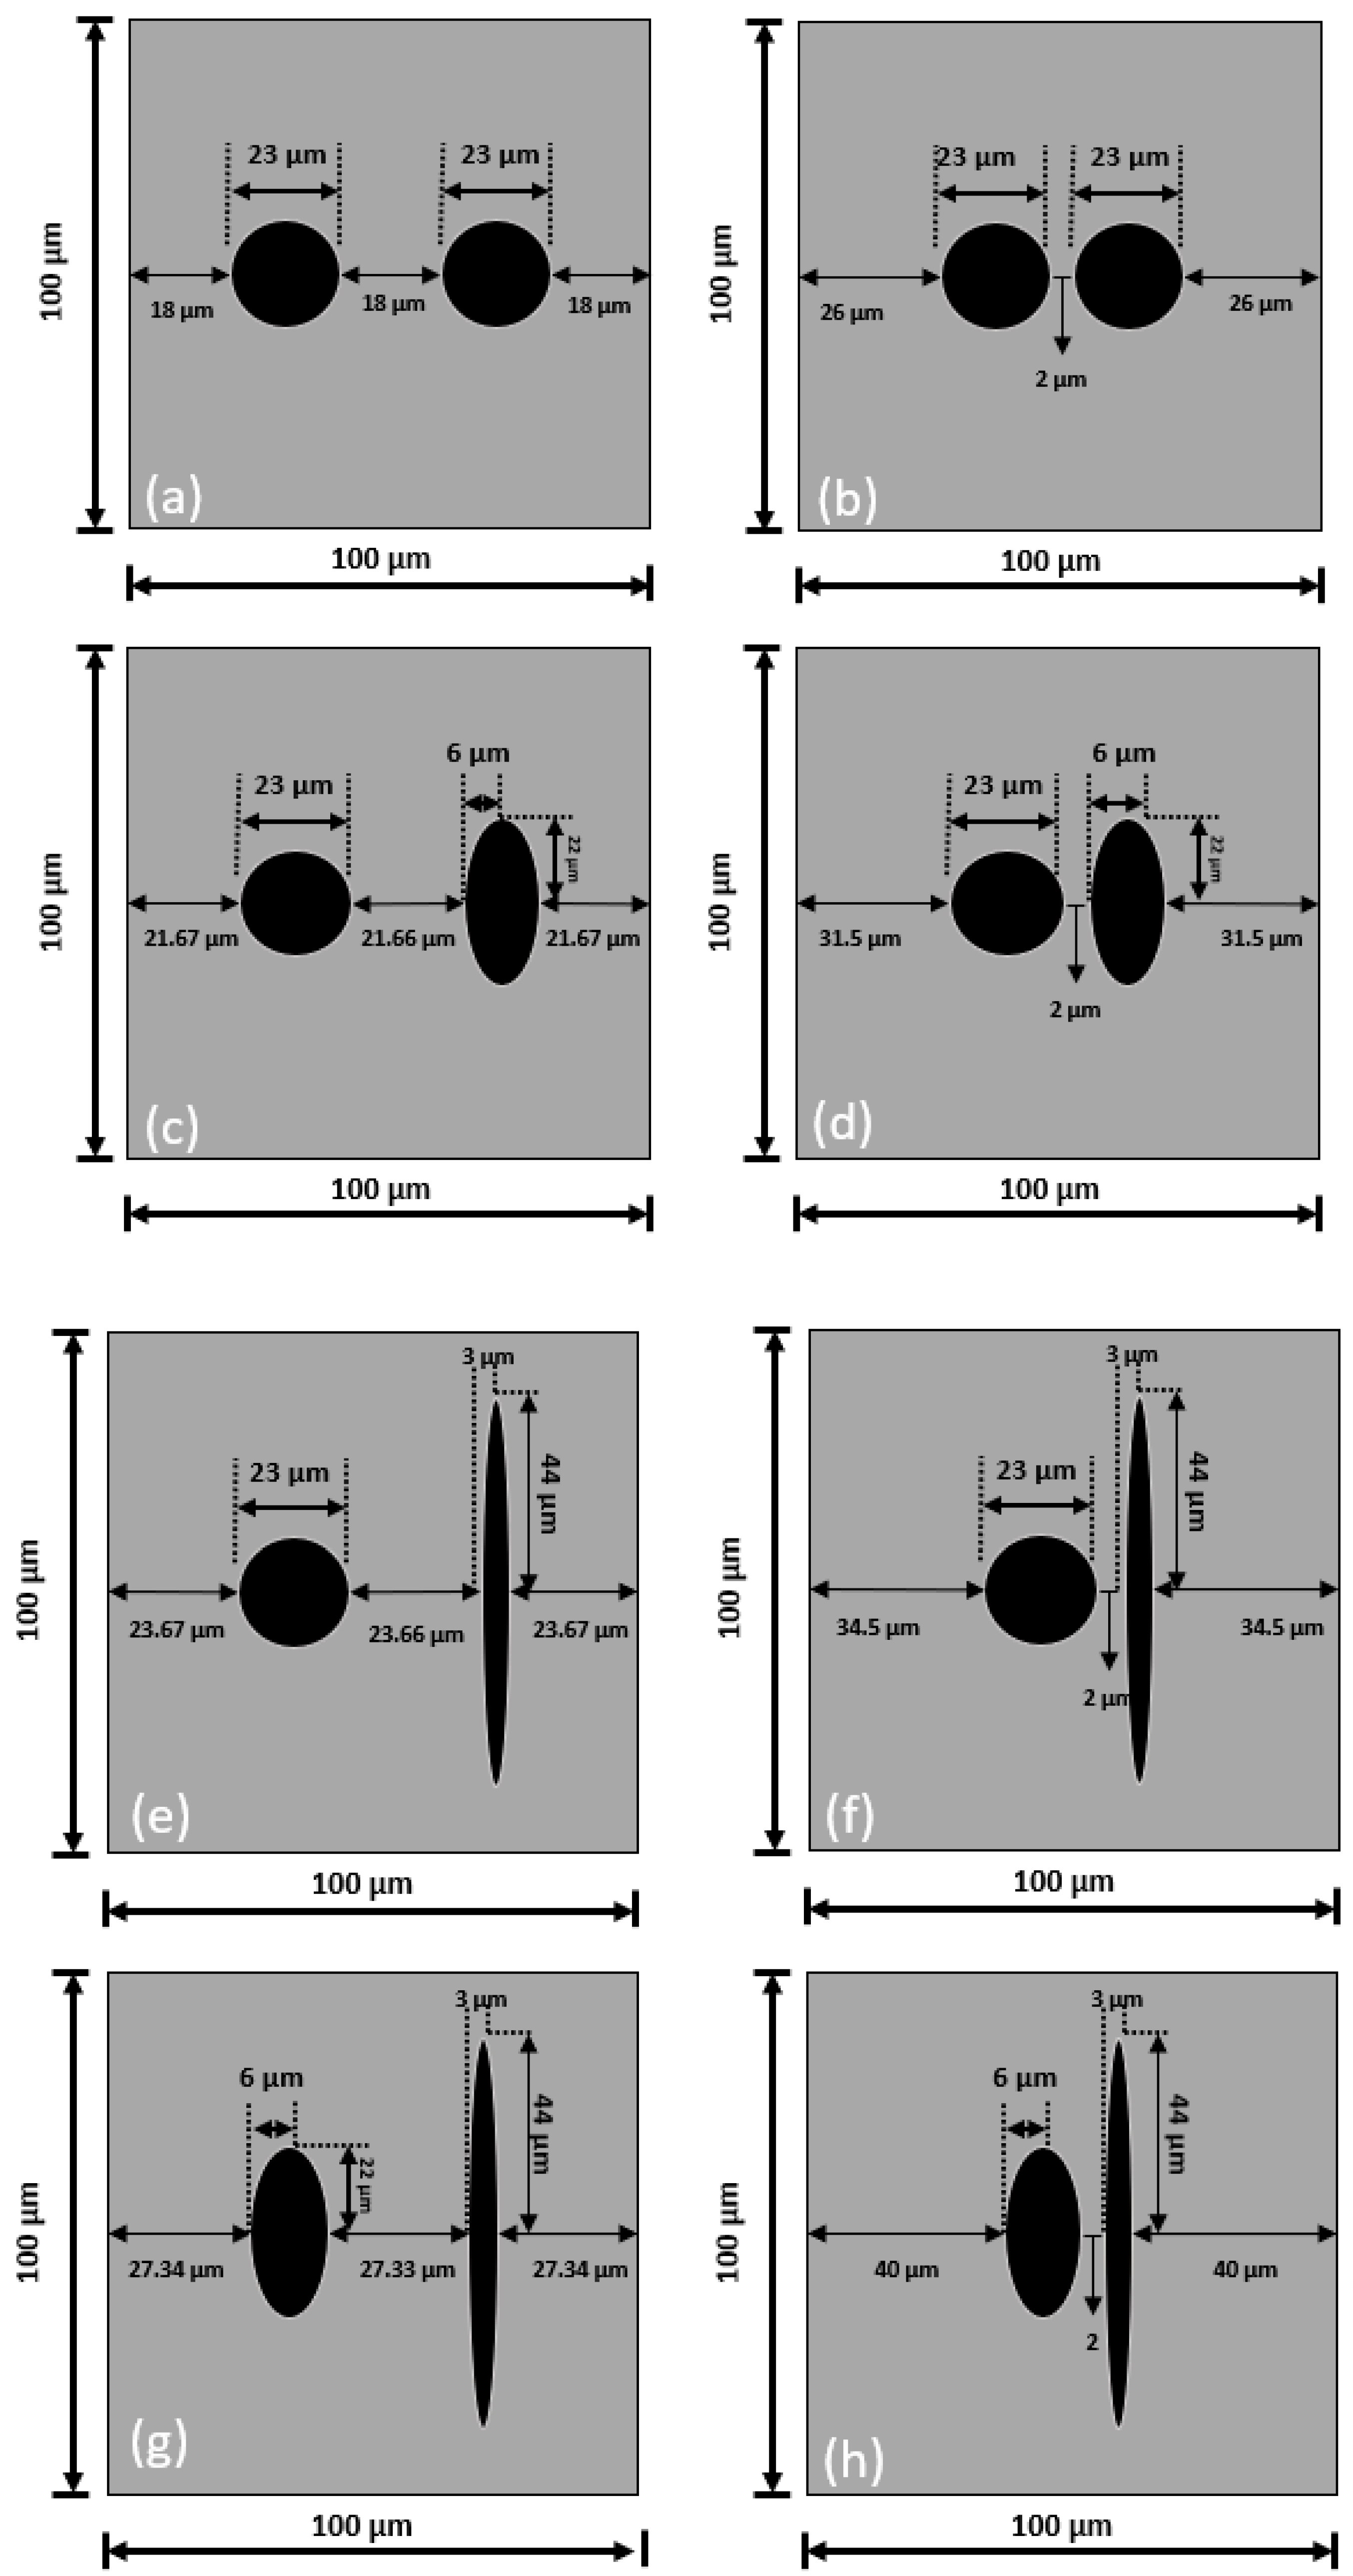
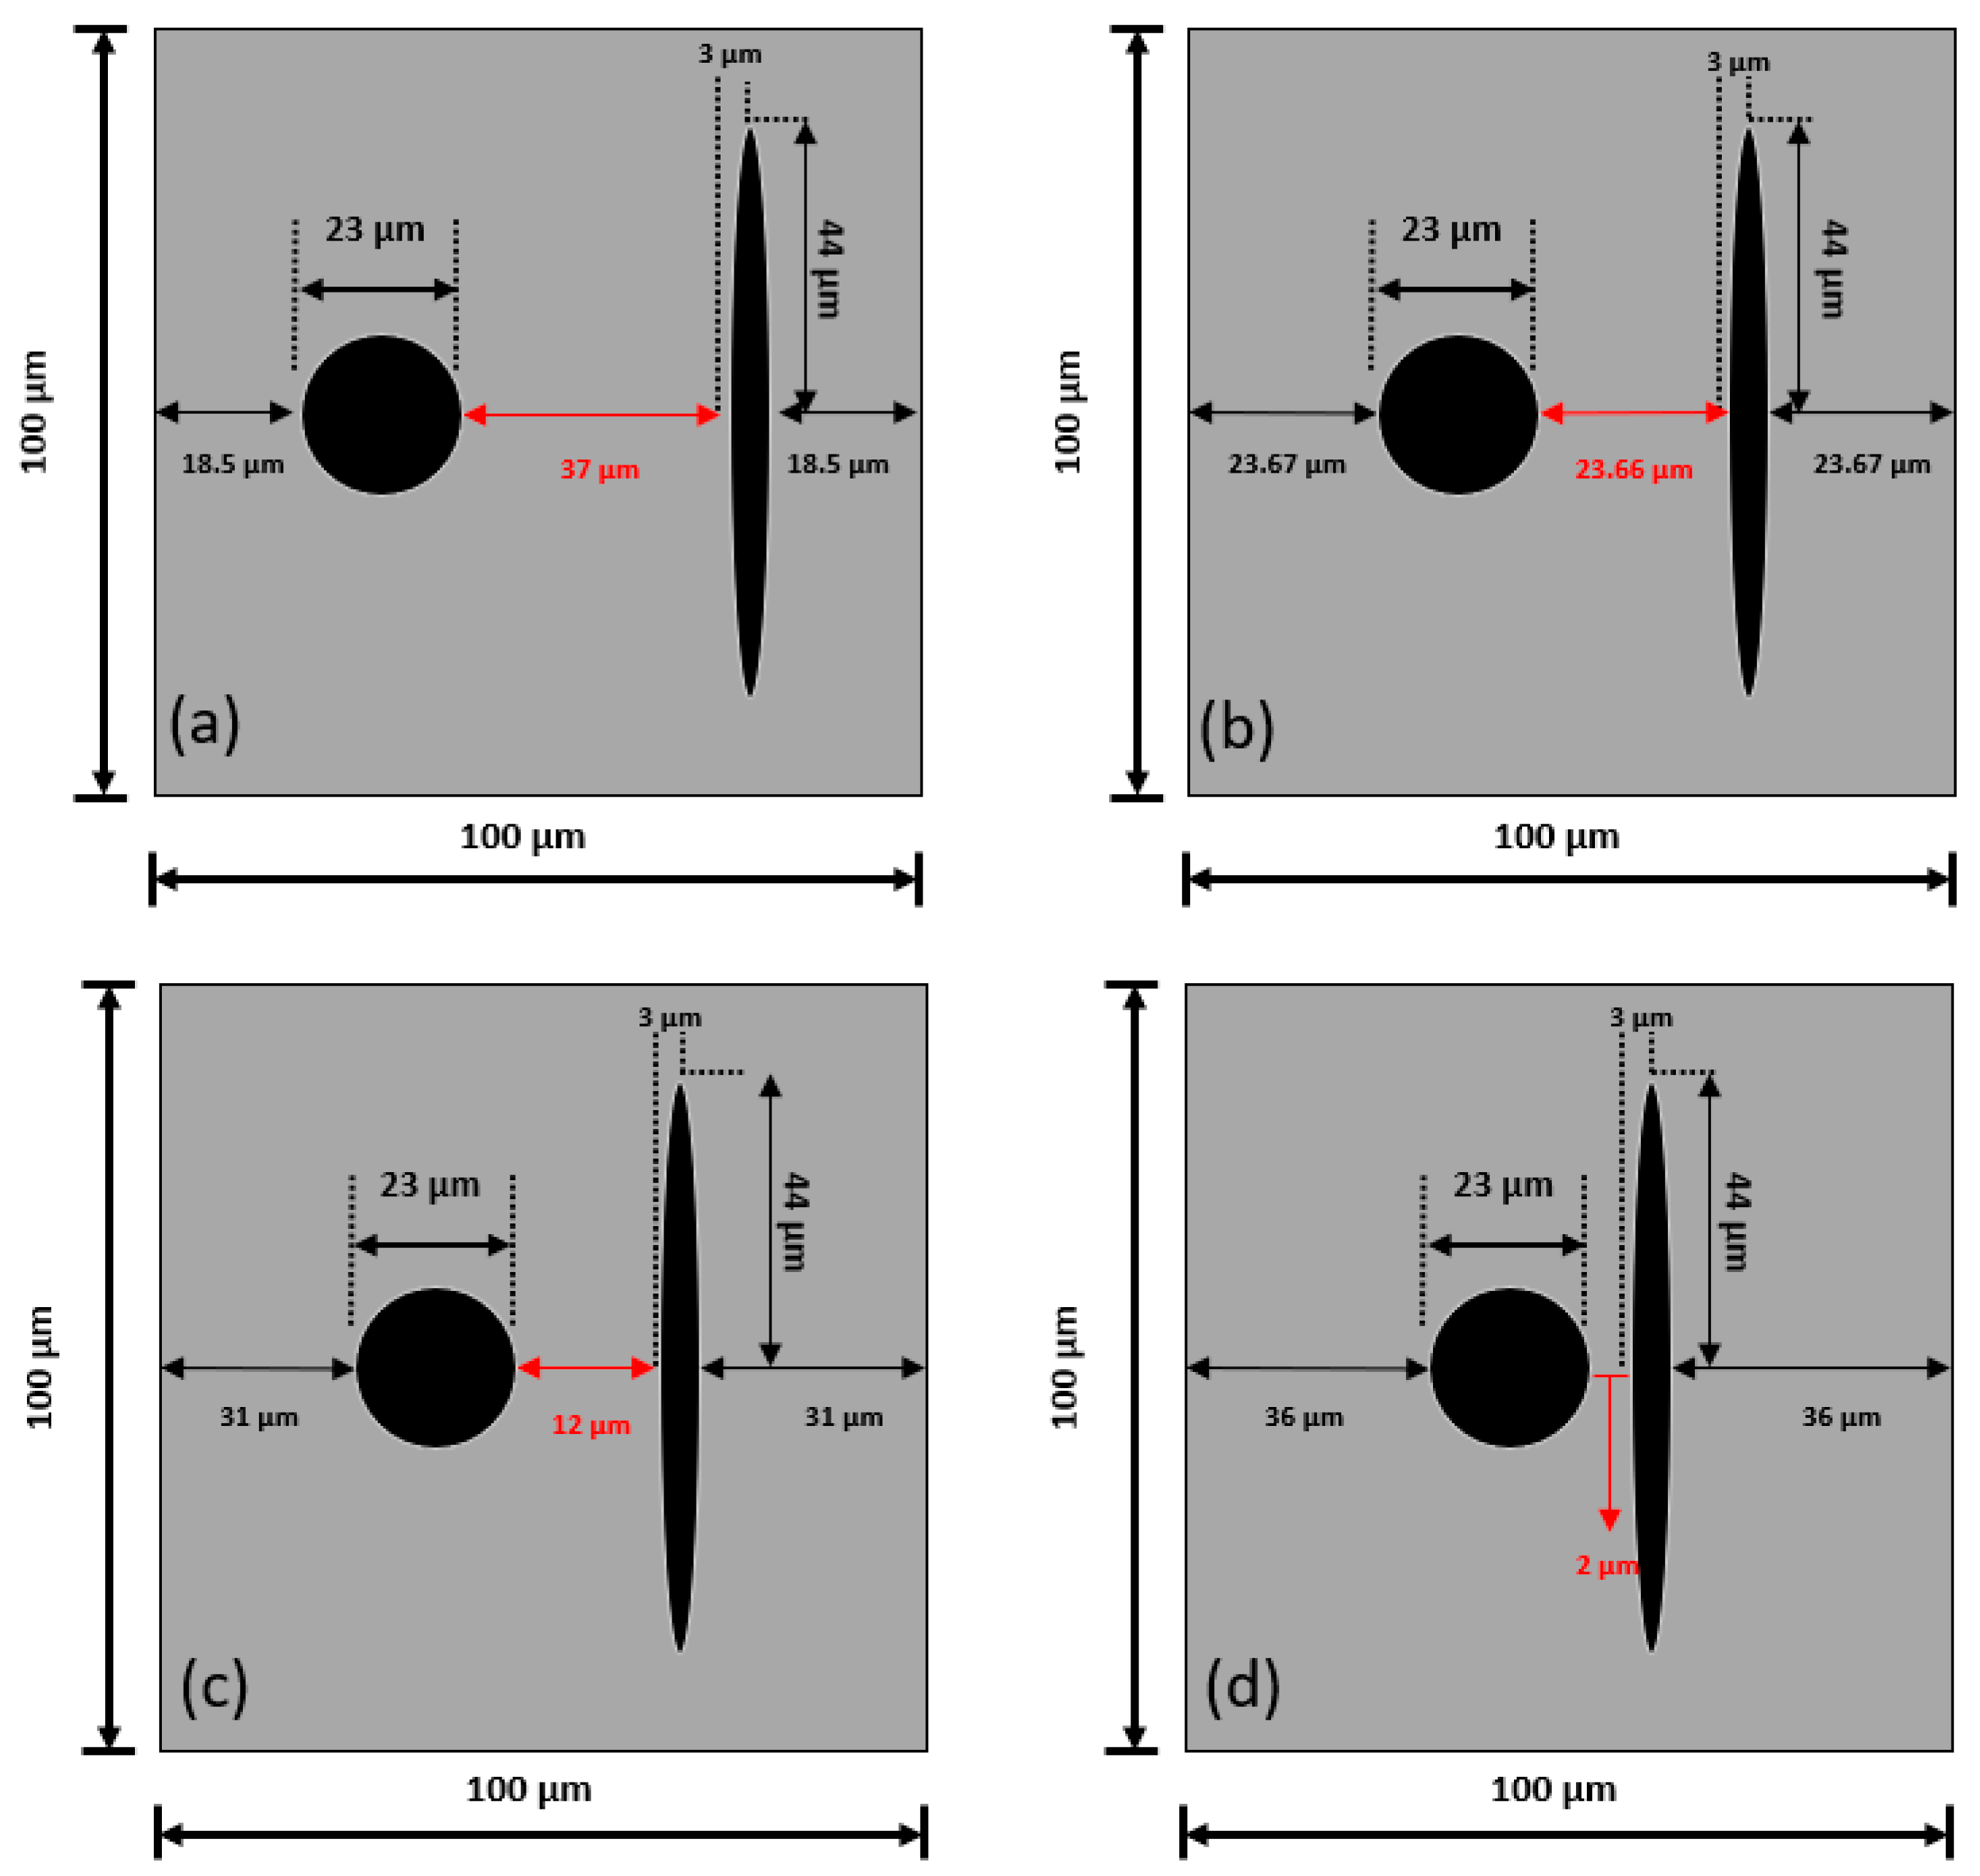
2.1. Model Geometry
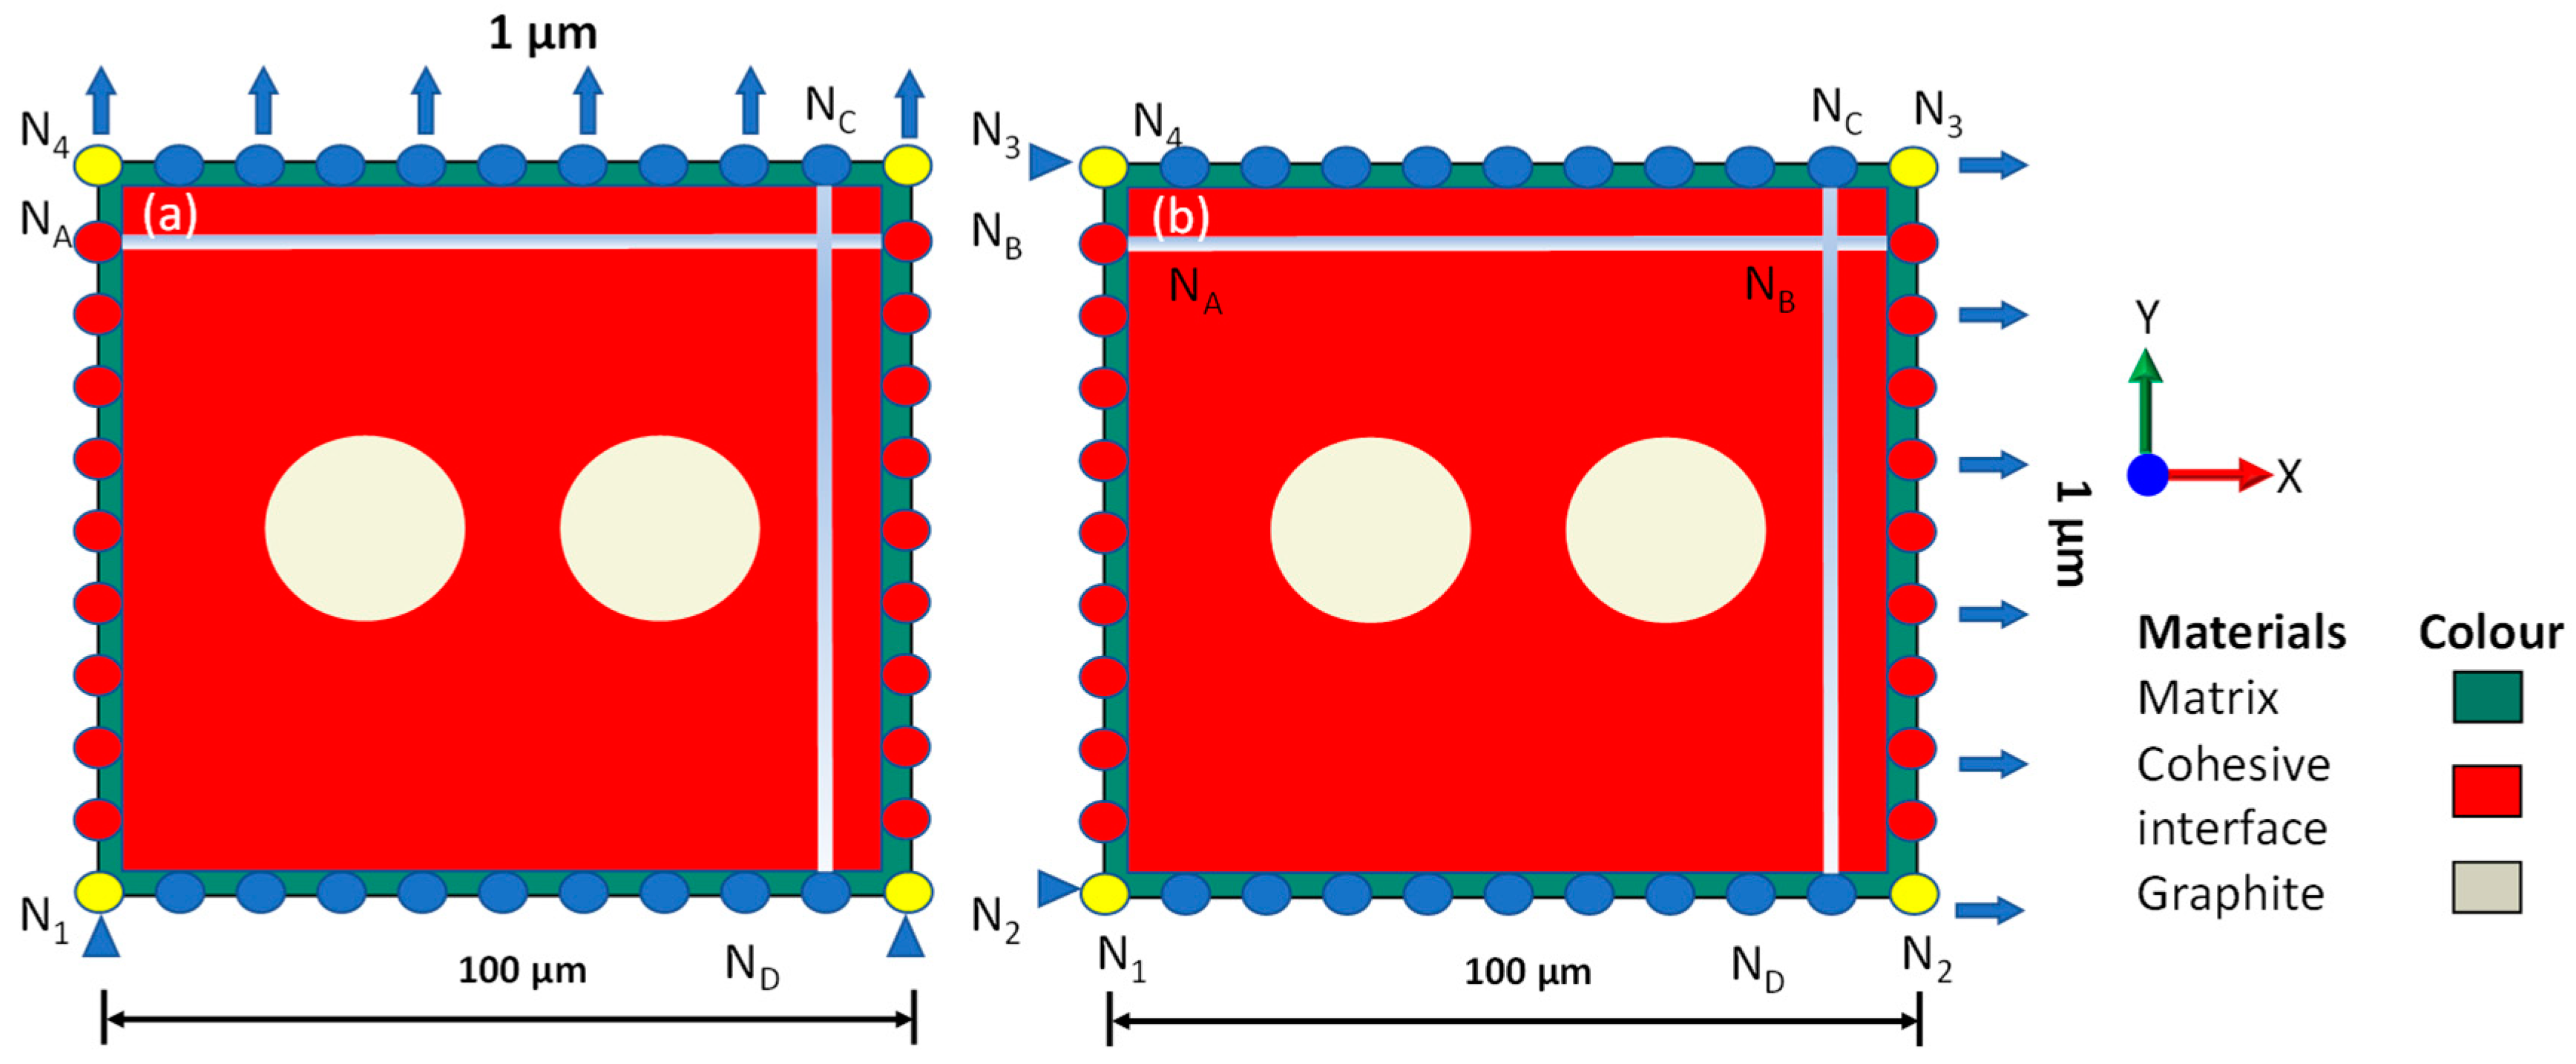
2.2. Boundary Conditions
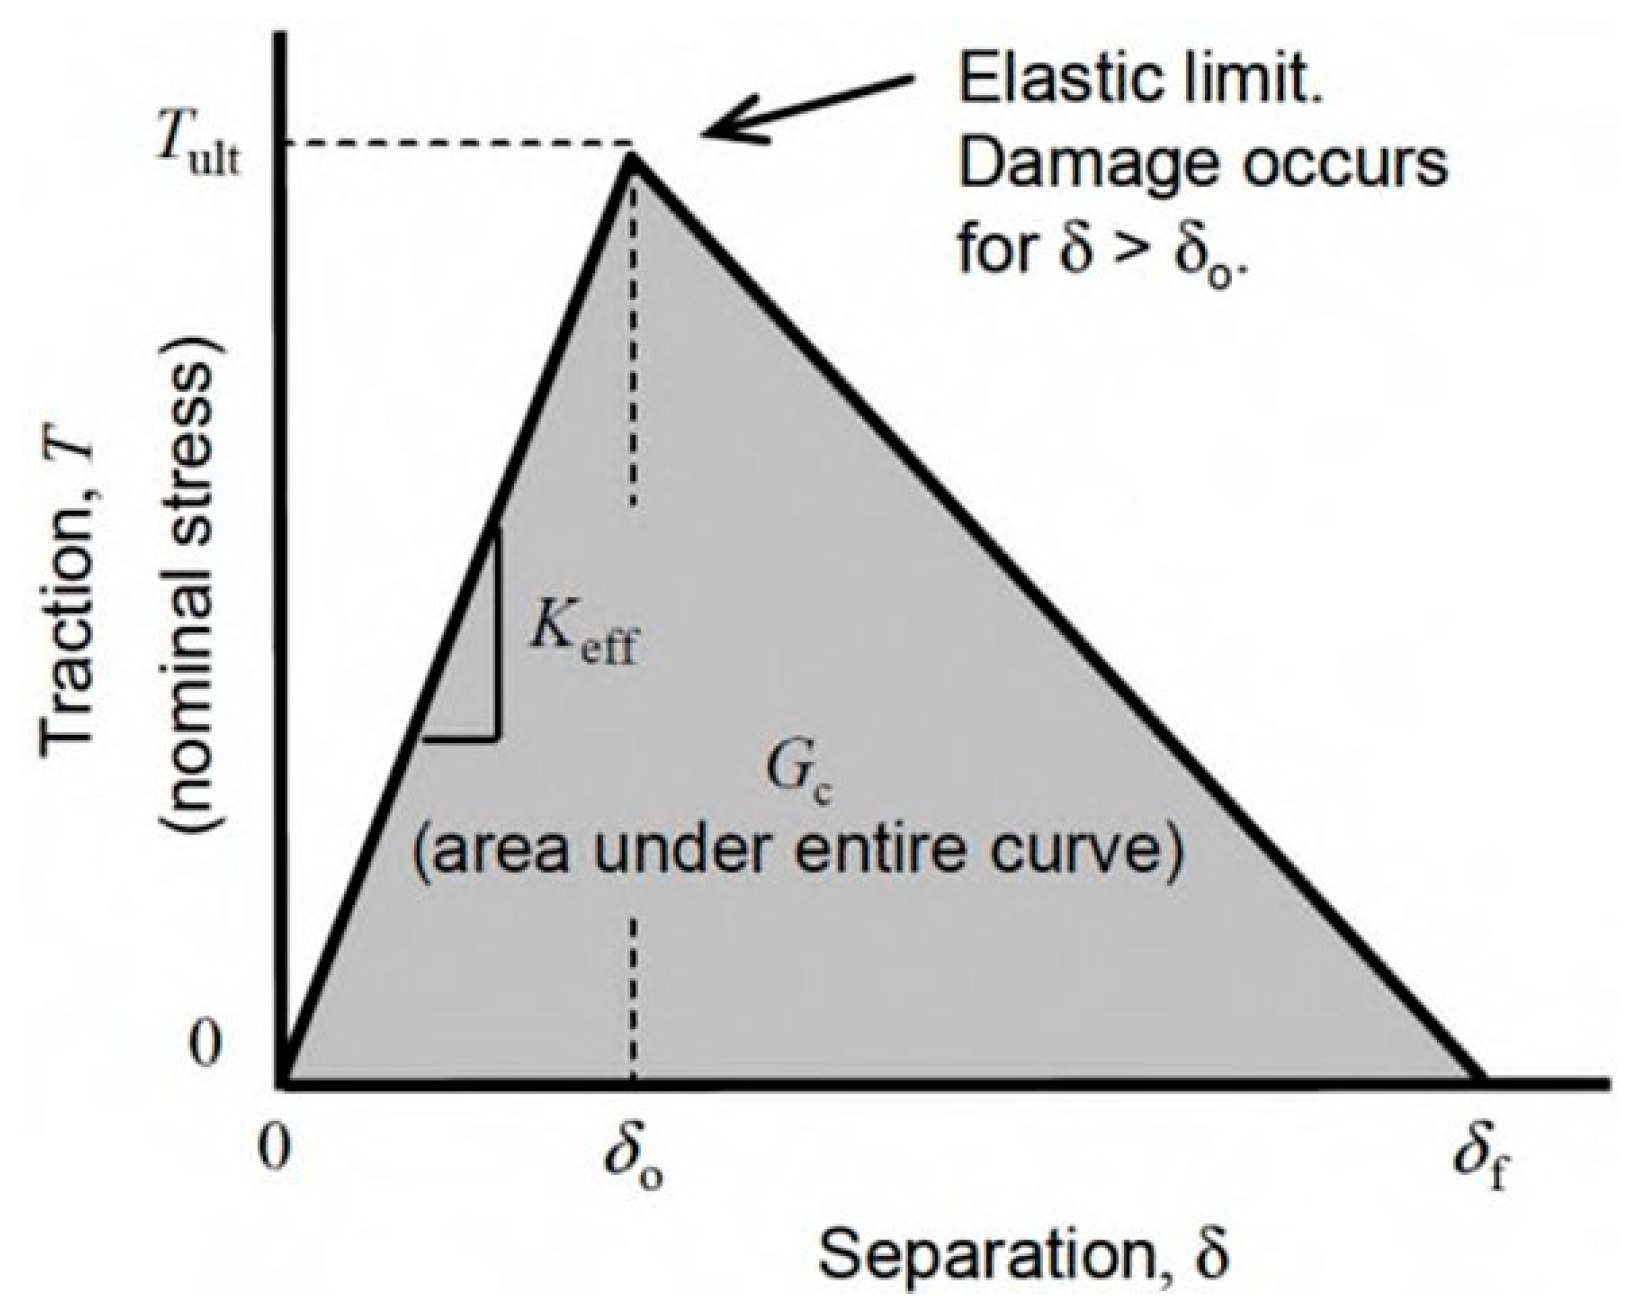
2.3. Constitutive Relations
3. Results and Discussion
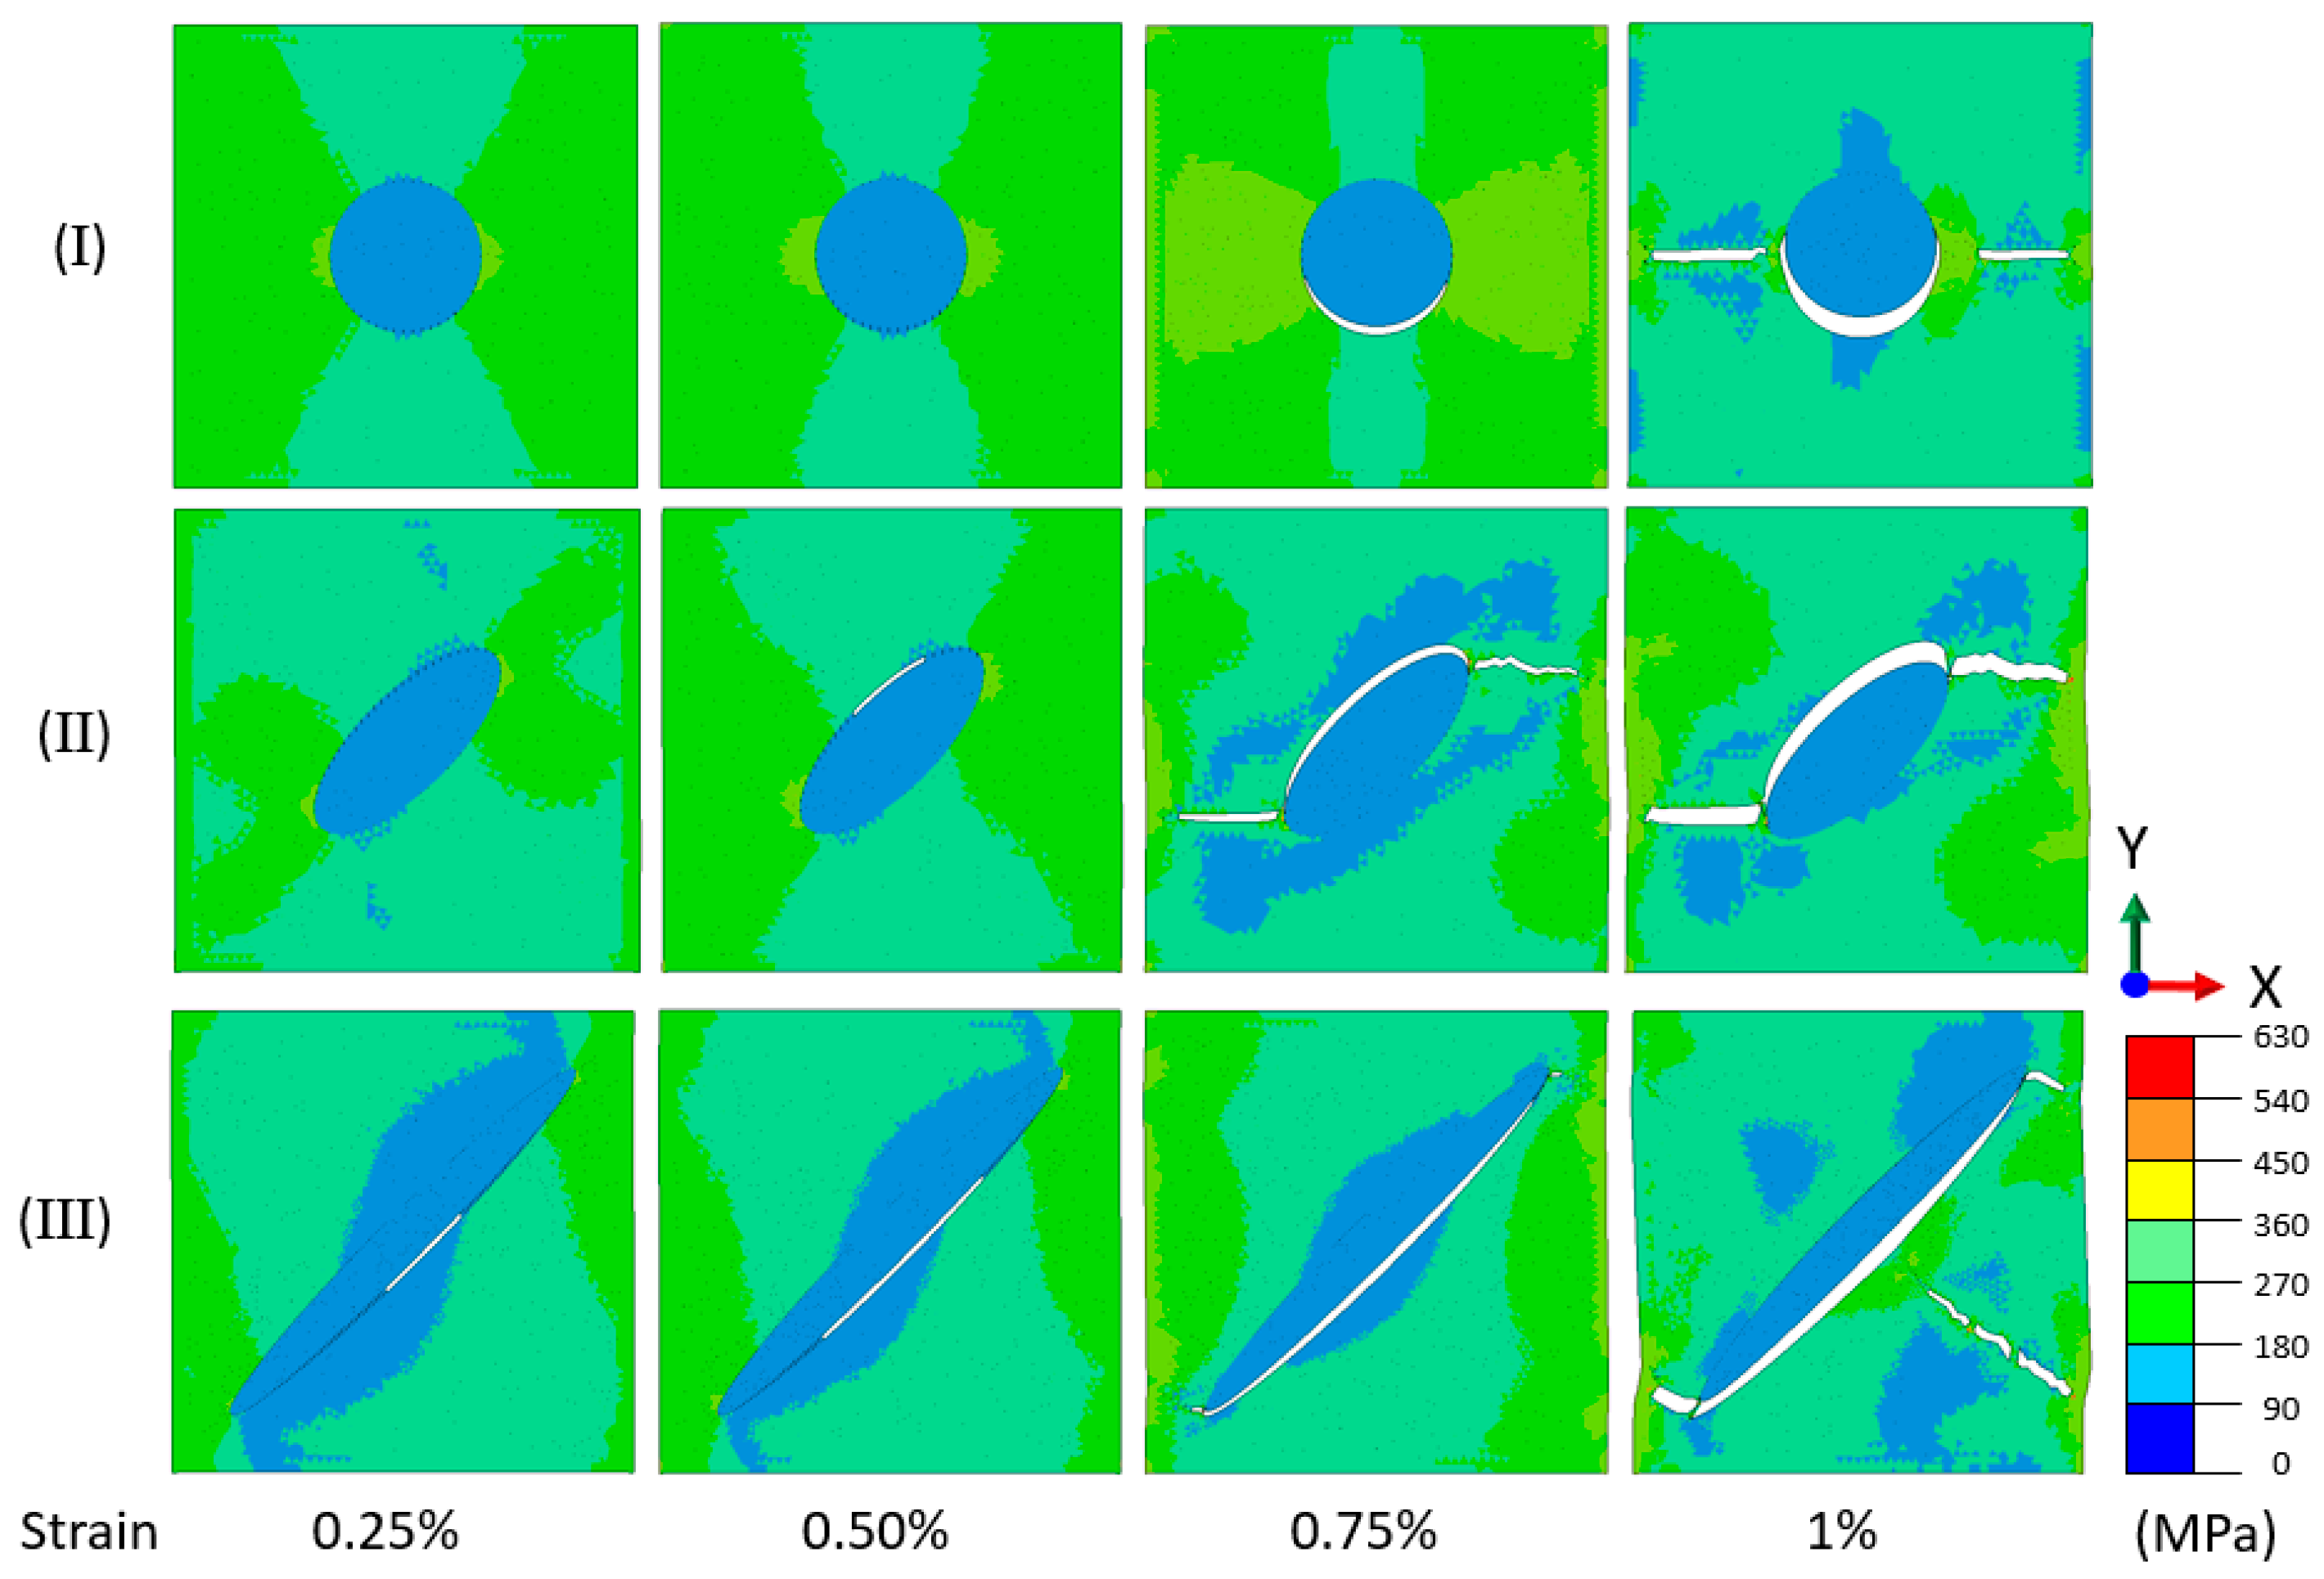
3.1. Effect of Graphite Morphology: Single-Particle Unit Cells
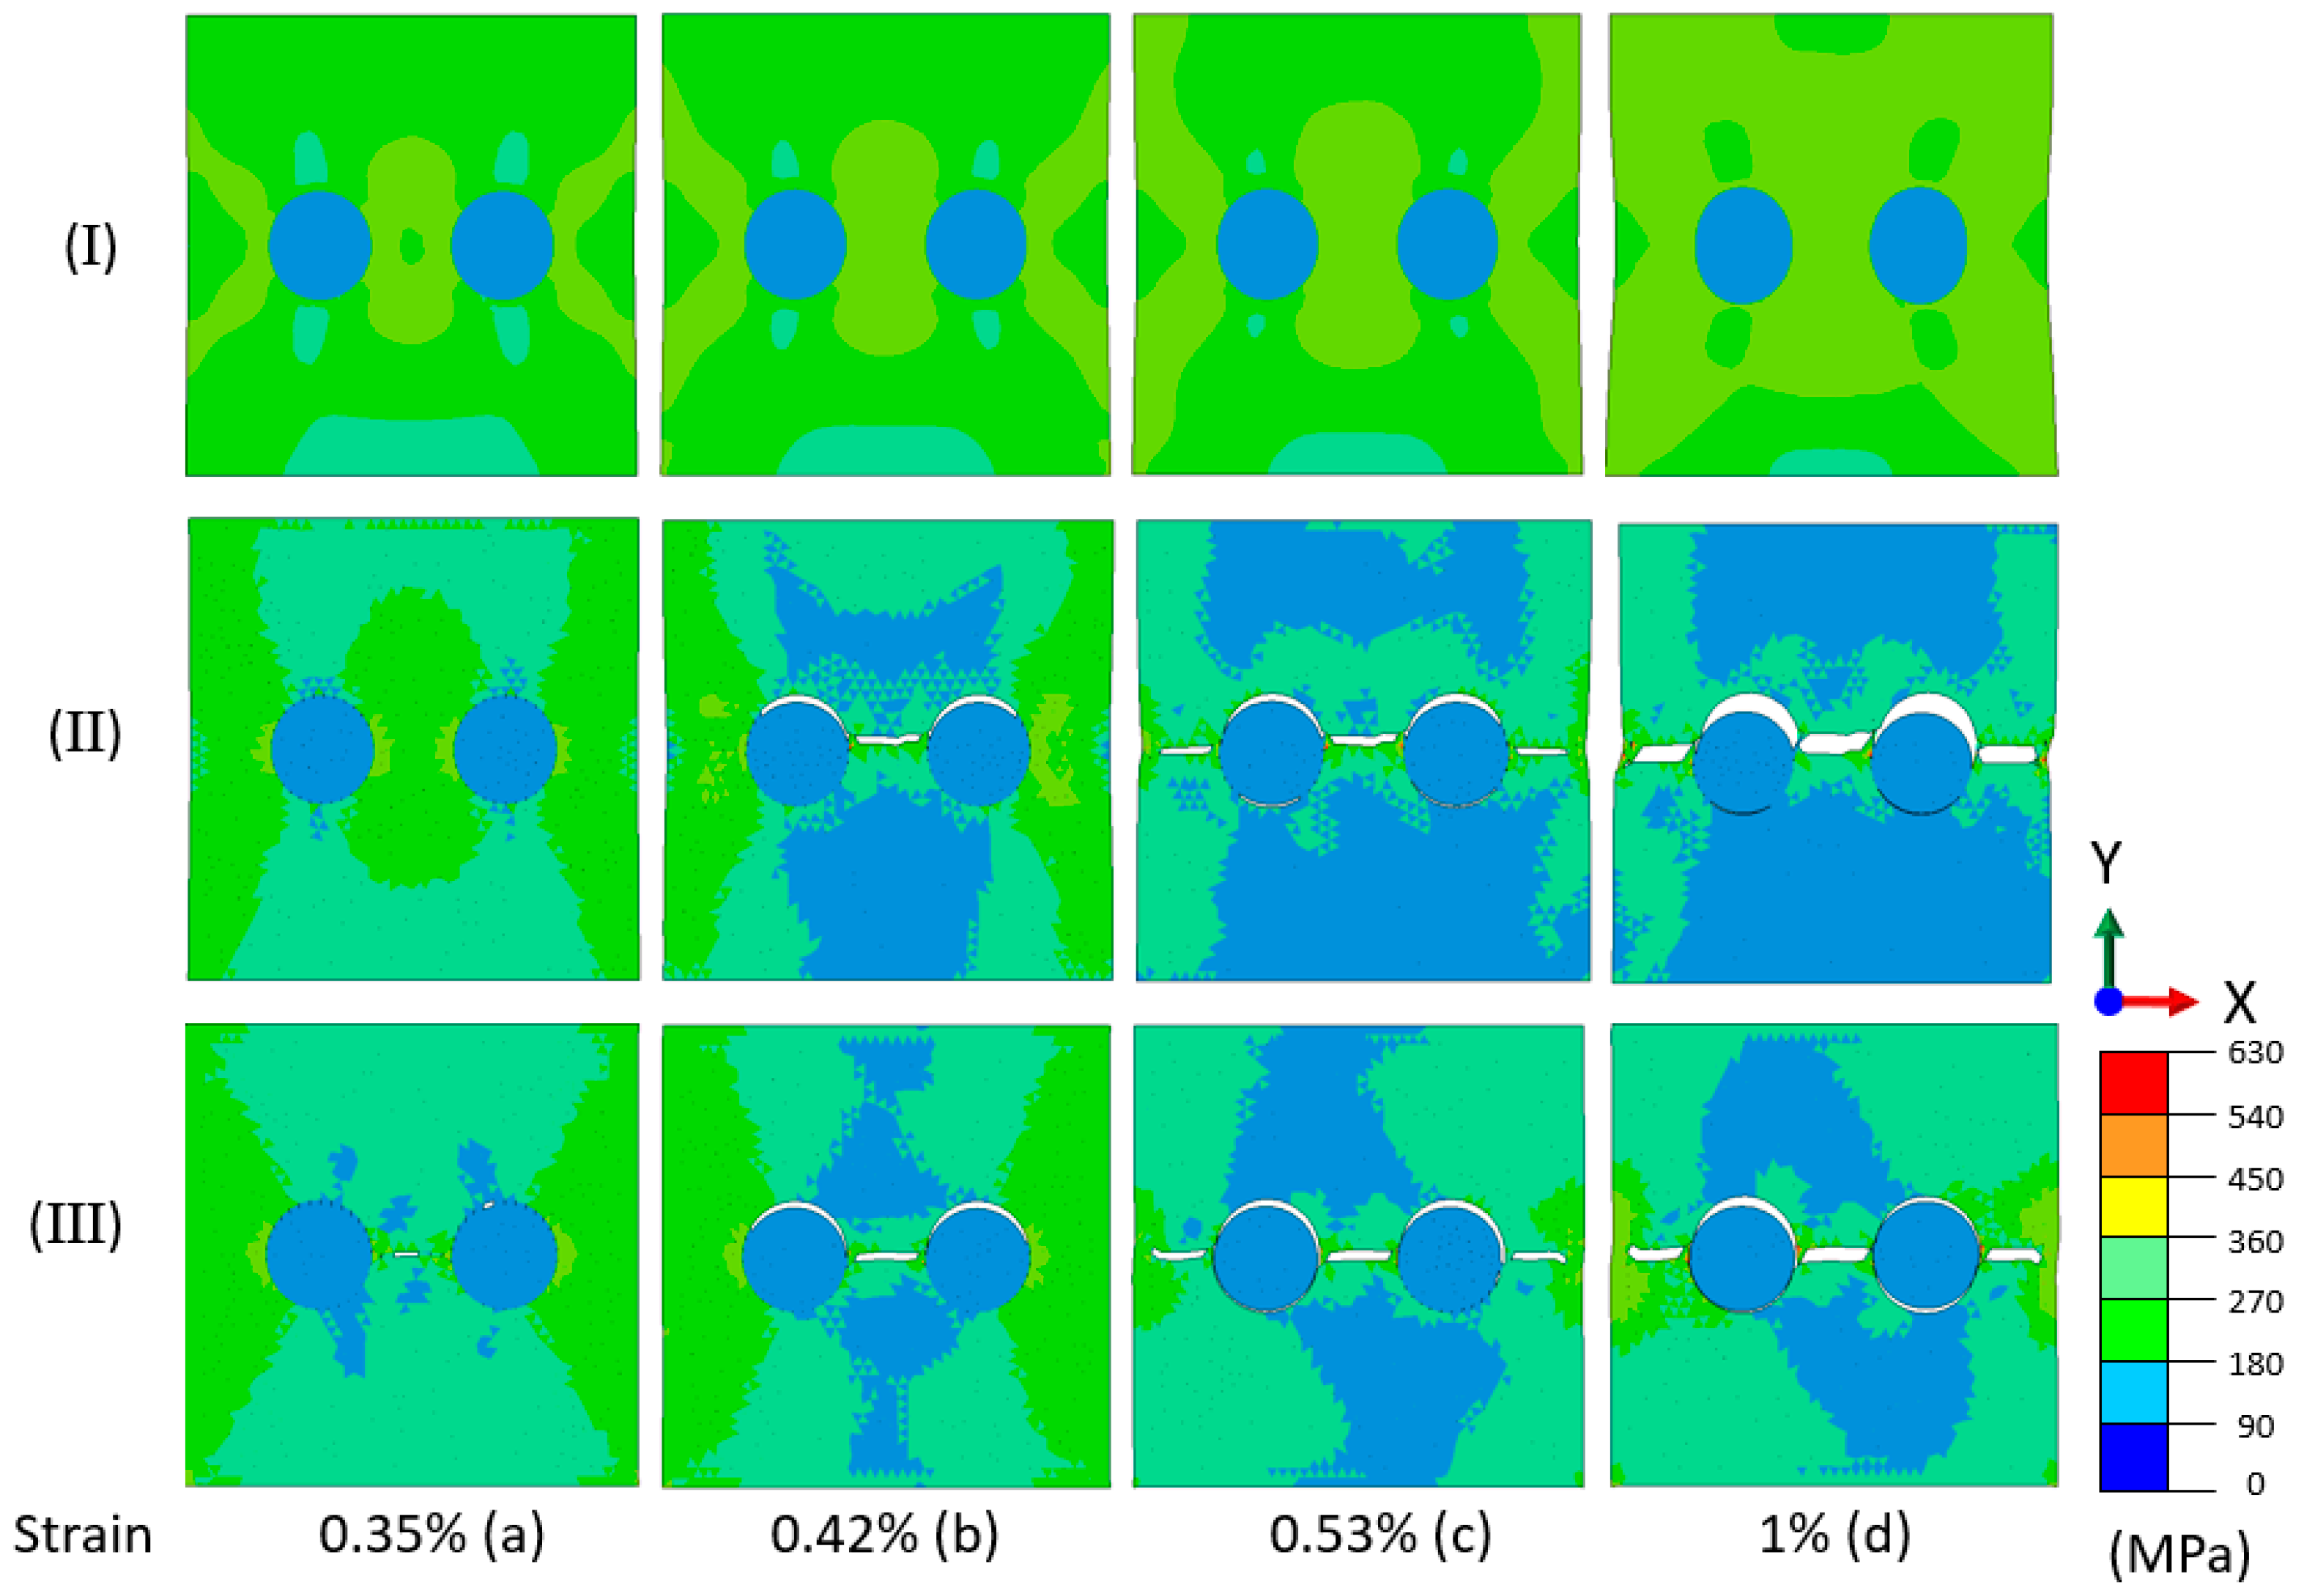
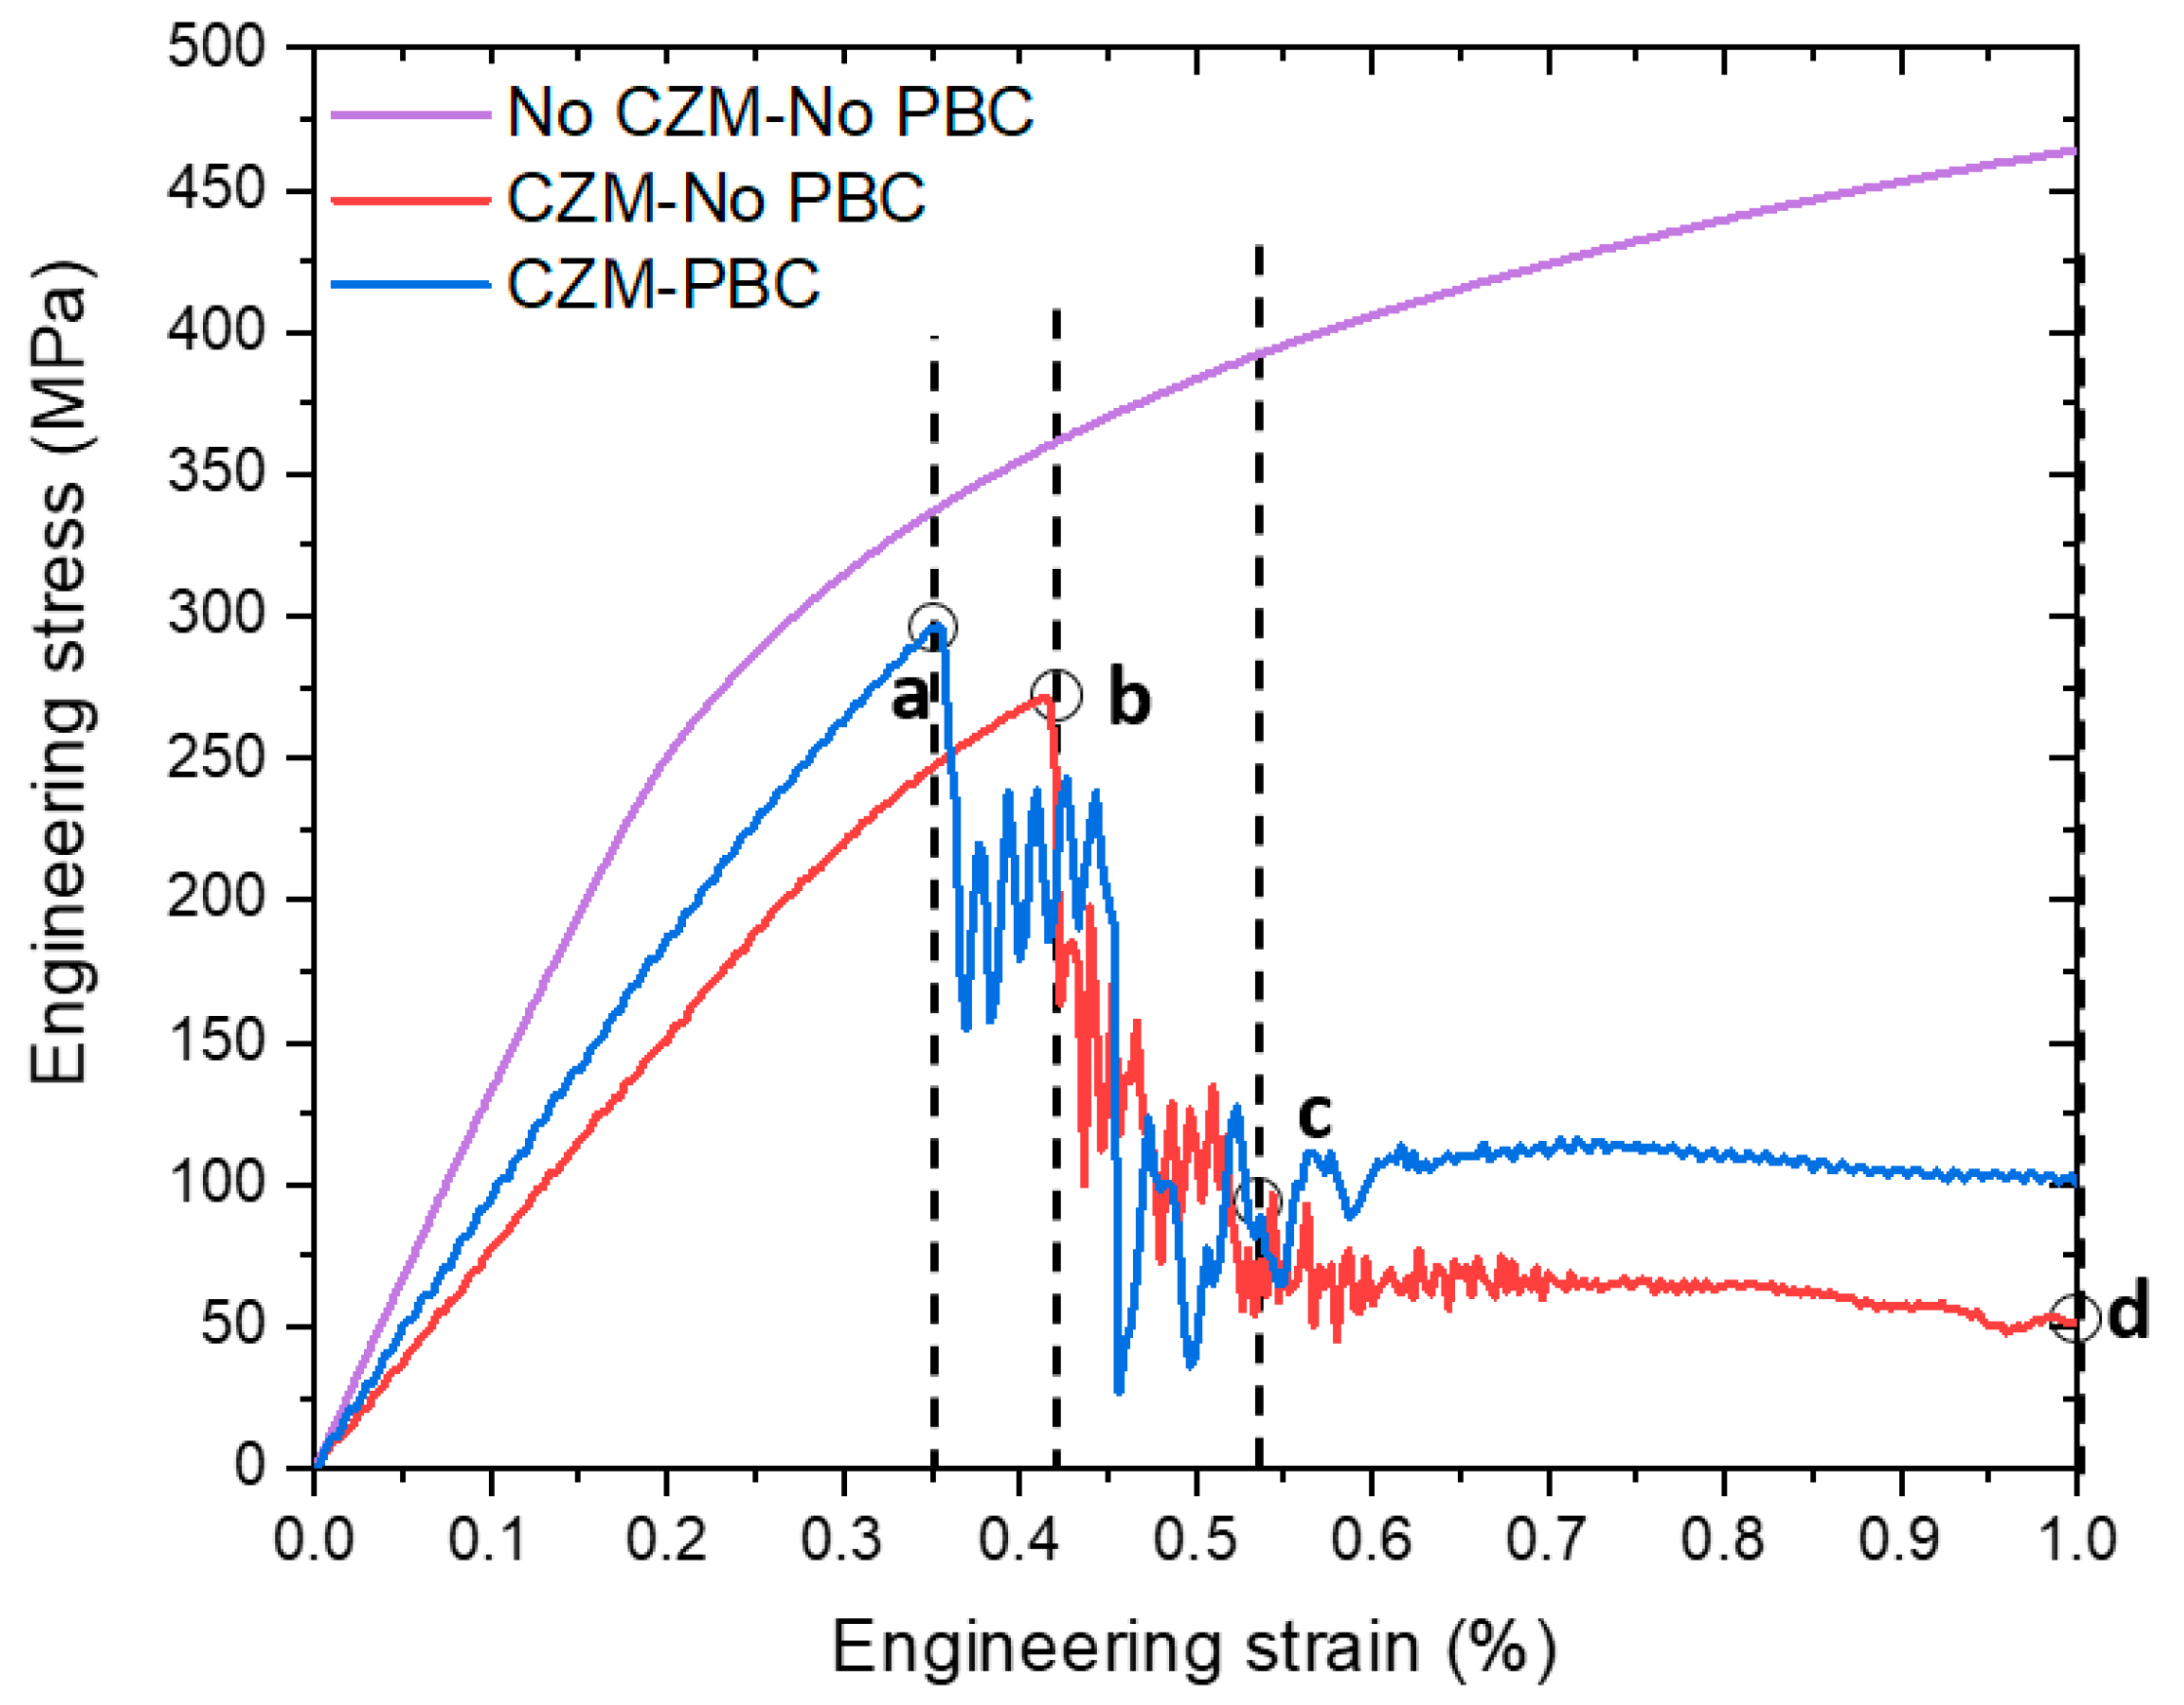
3.2. Effect of Periodic Boundary Conditions: Two-Particle Unit Cells
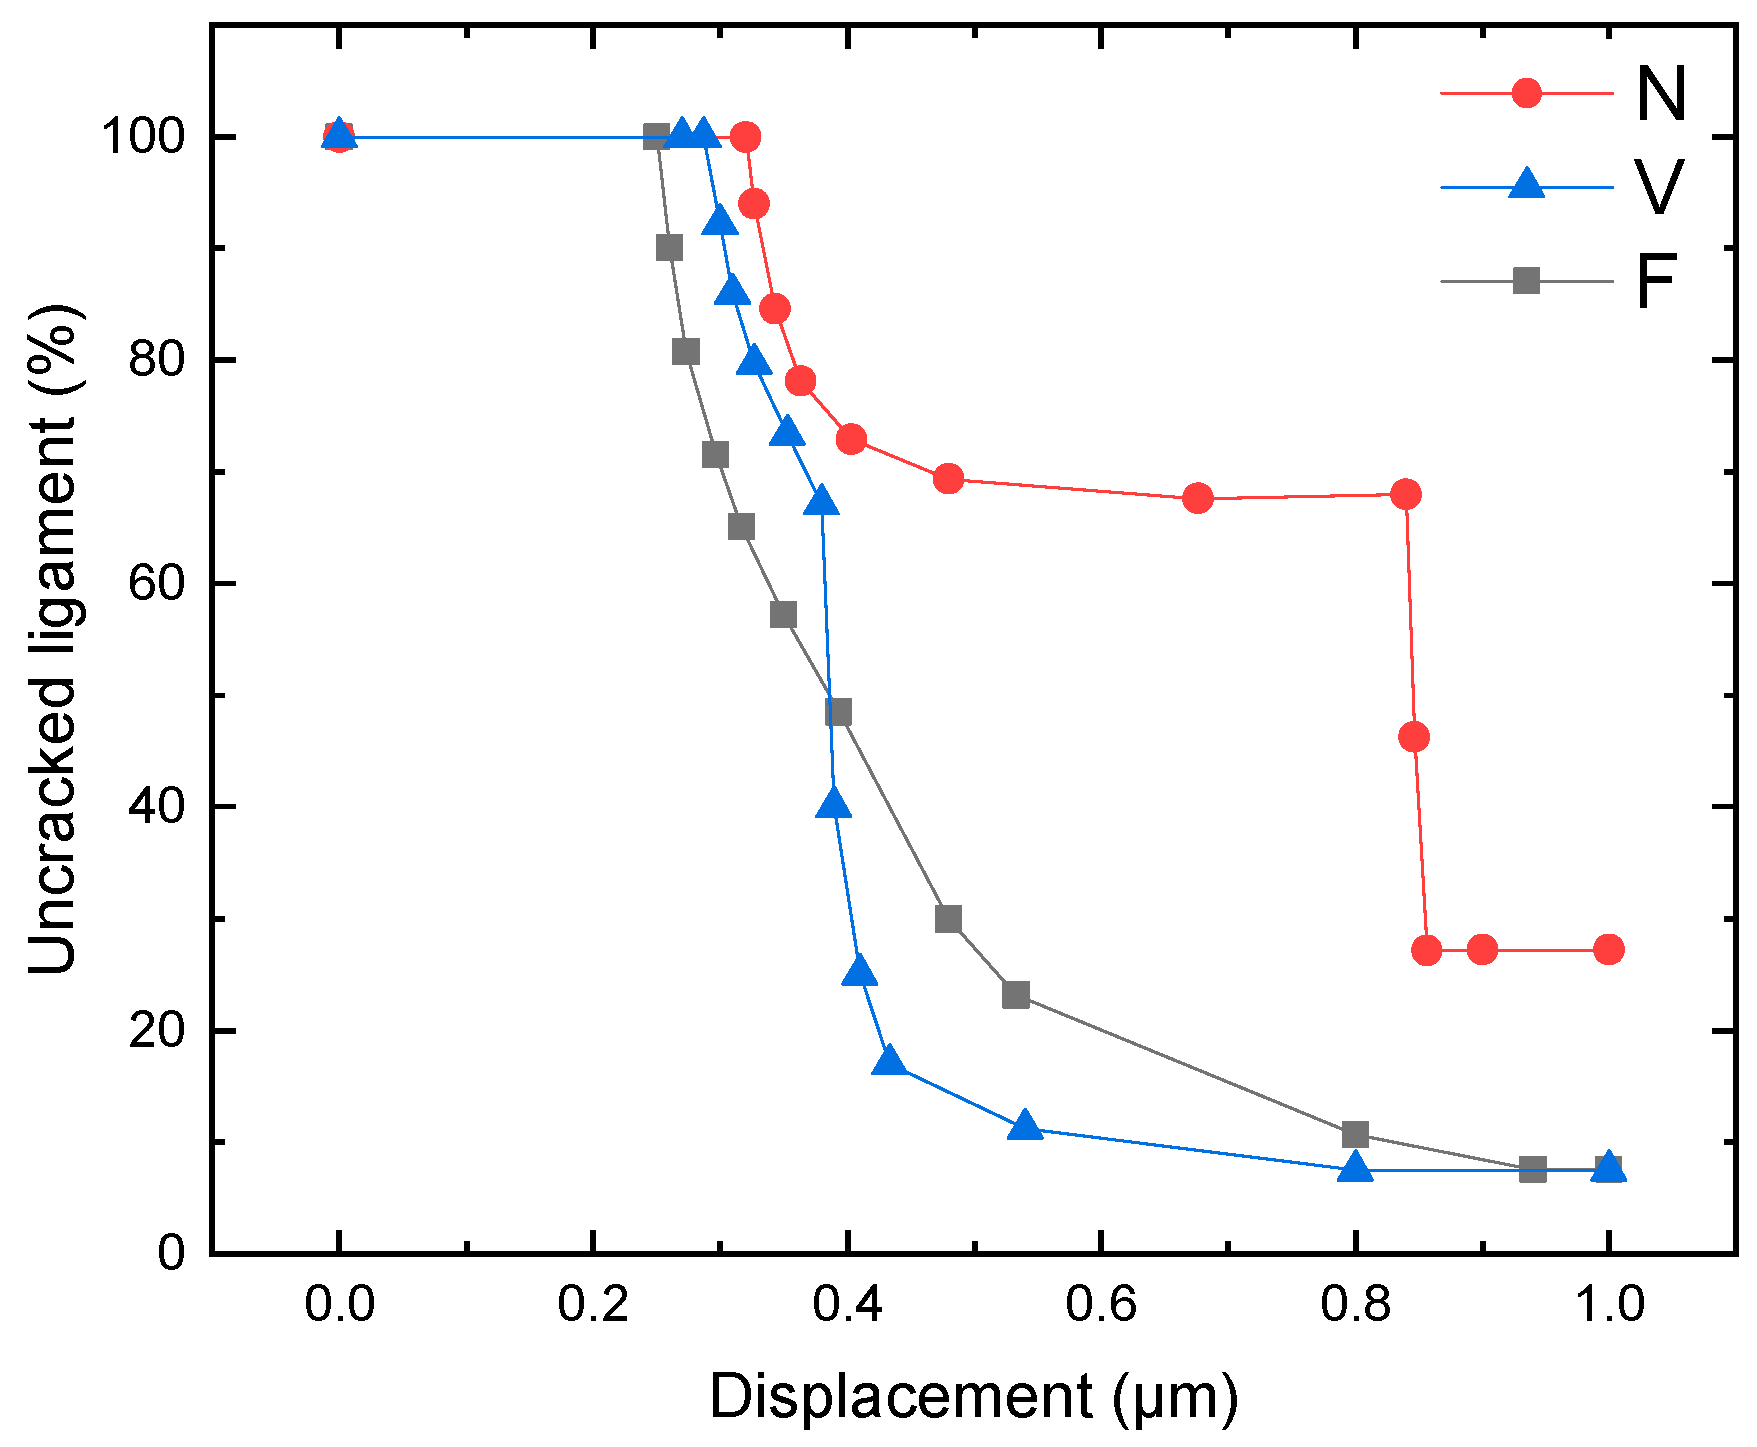
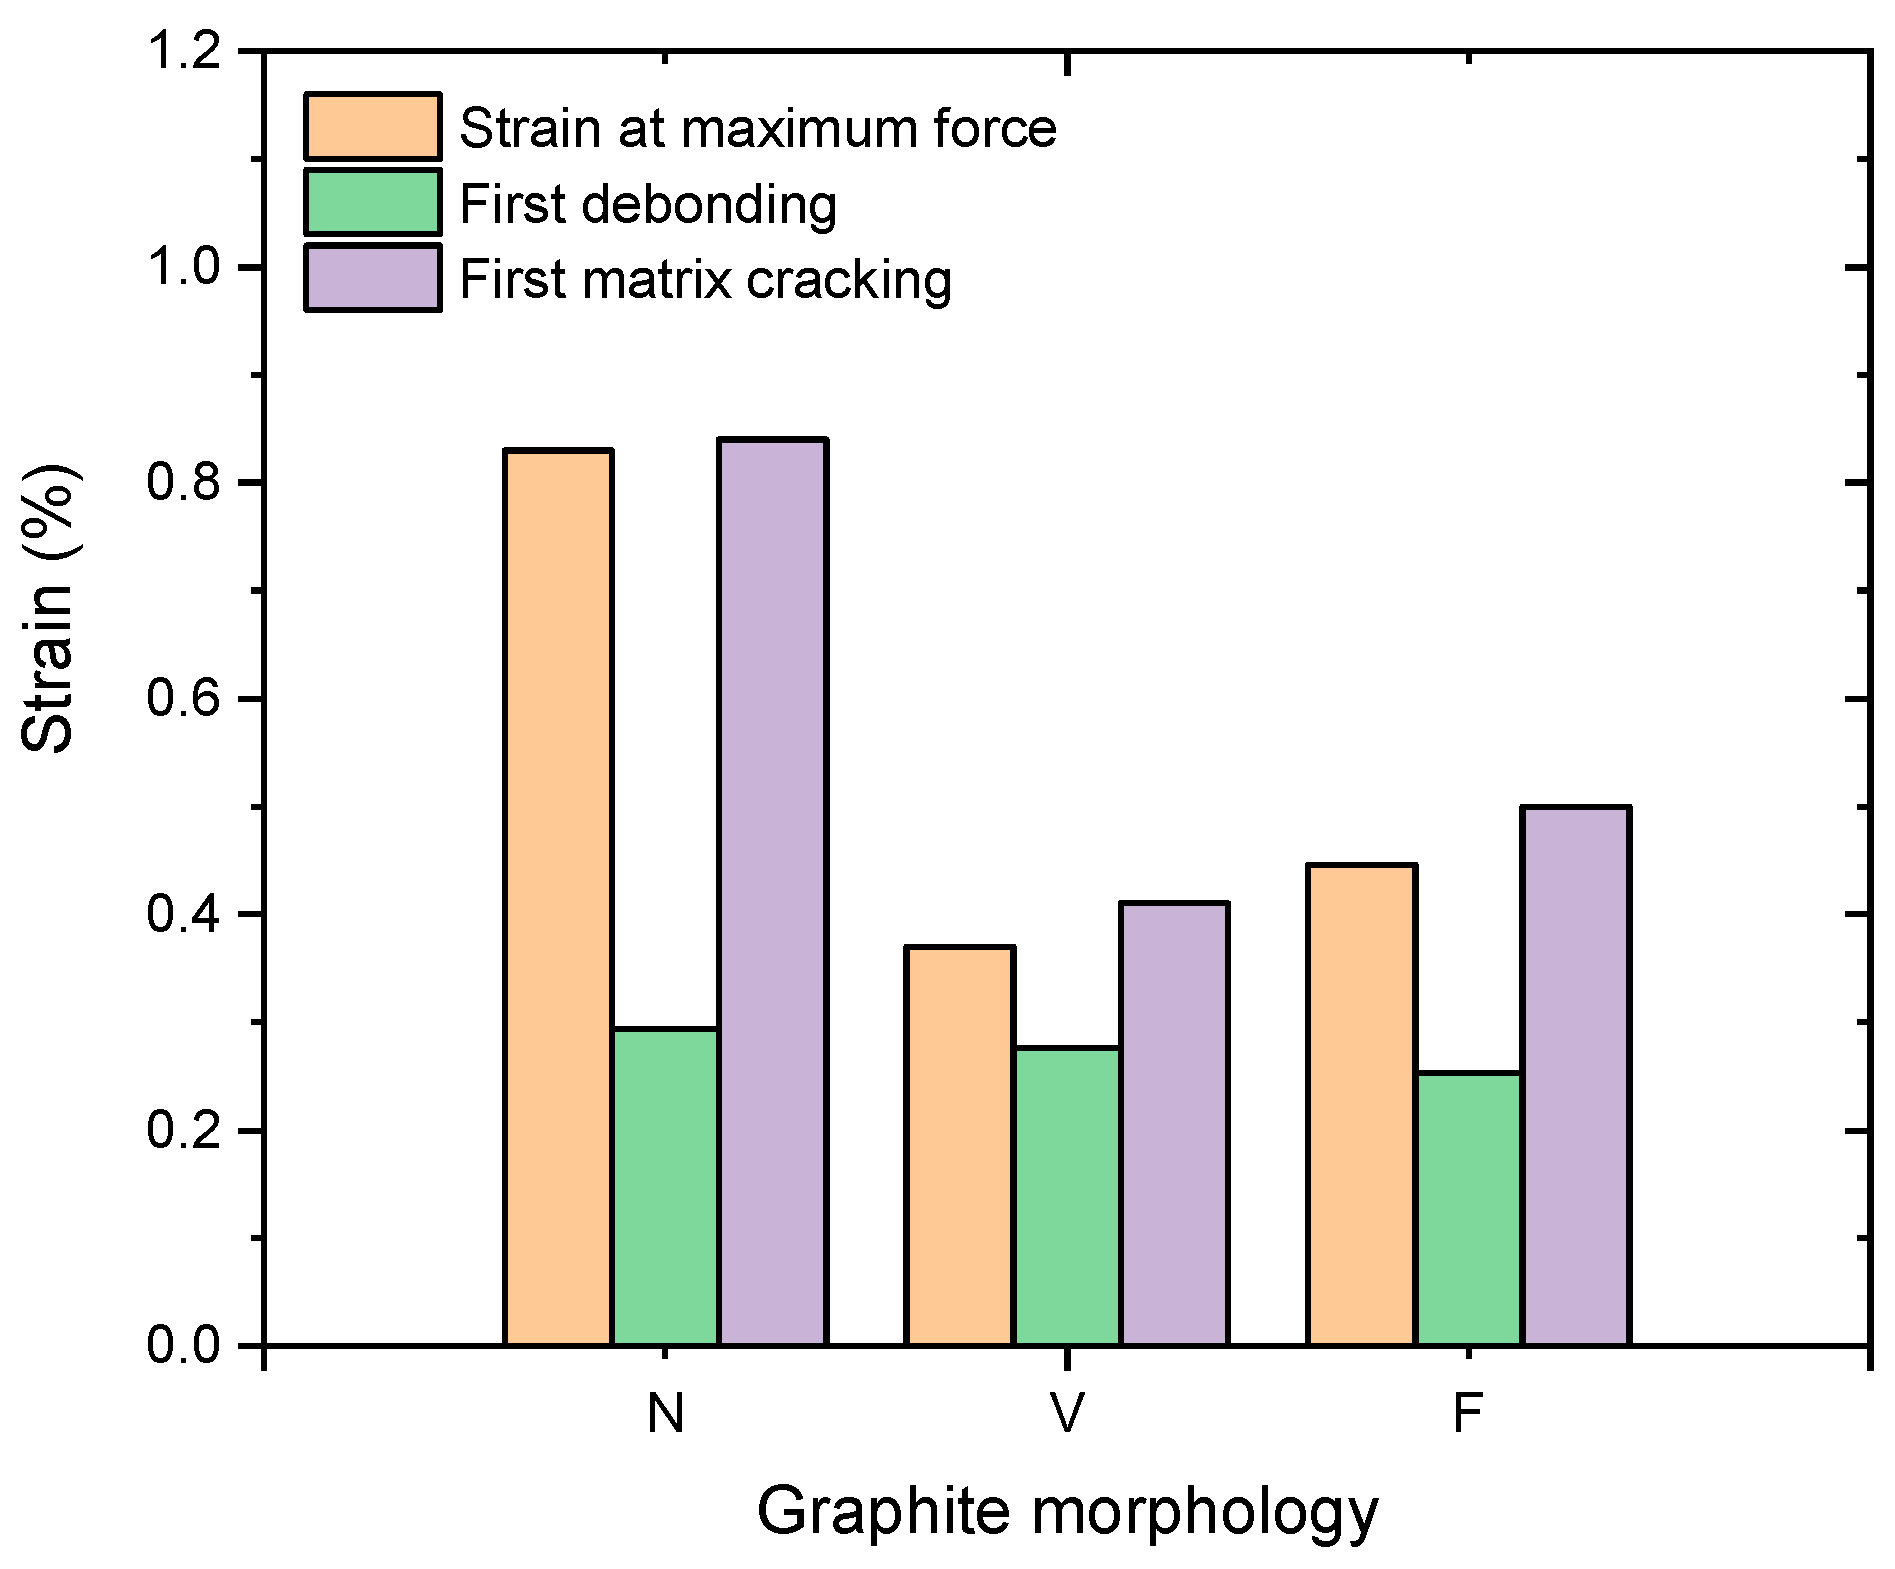
3.3. Effect of Graphite Morphology and Spacing: Two-Particle Unit Cells
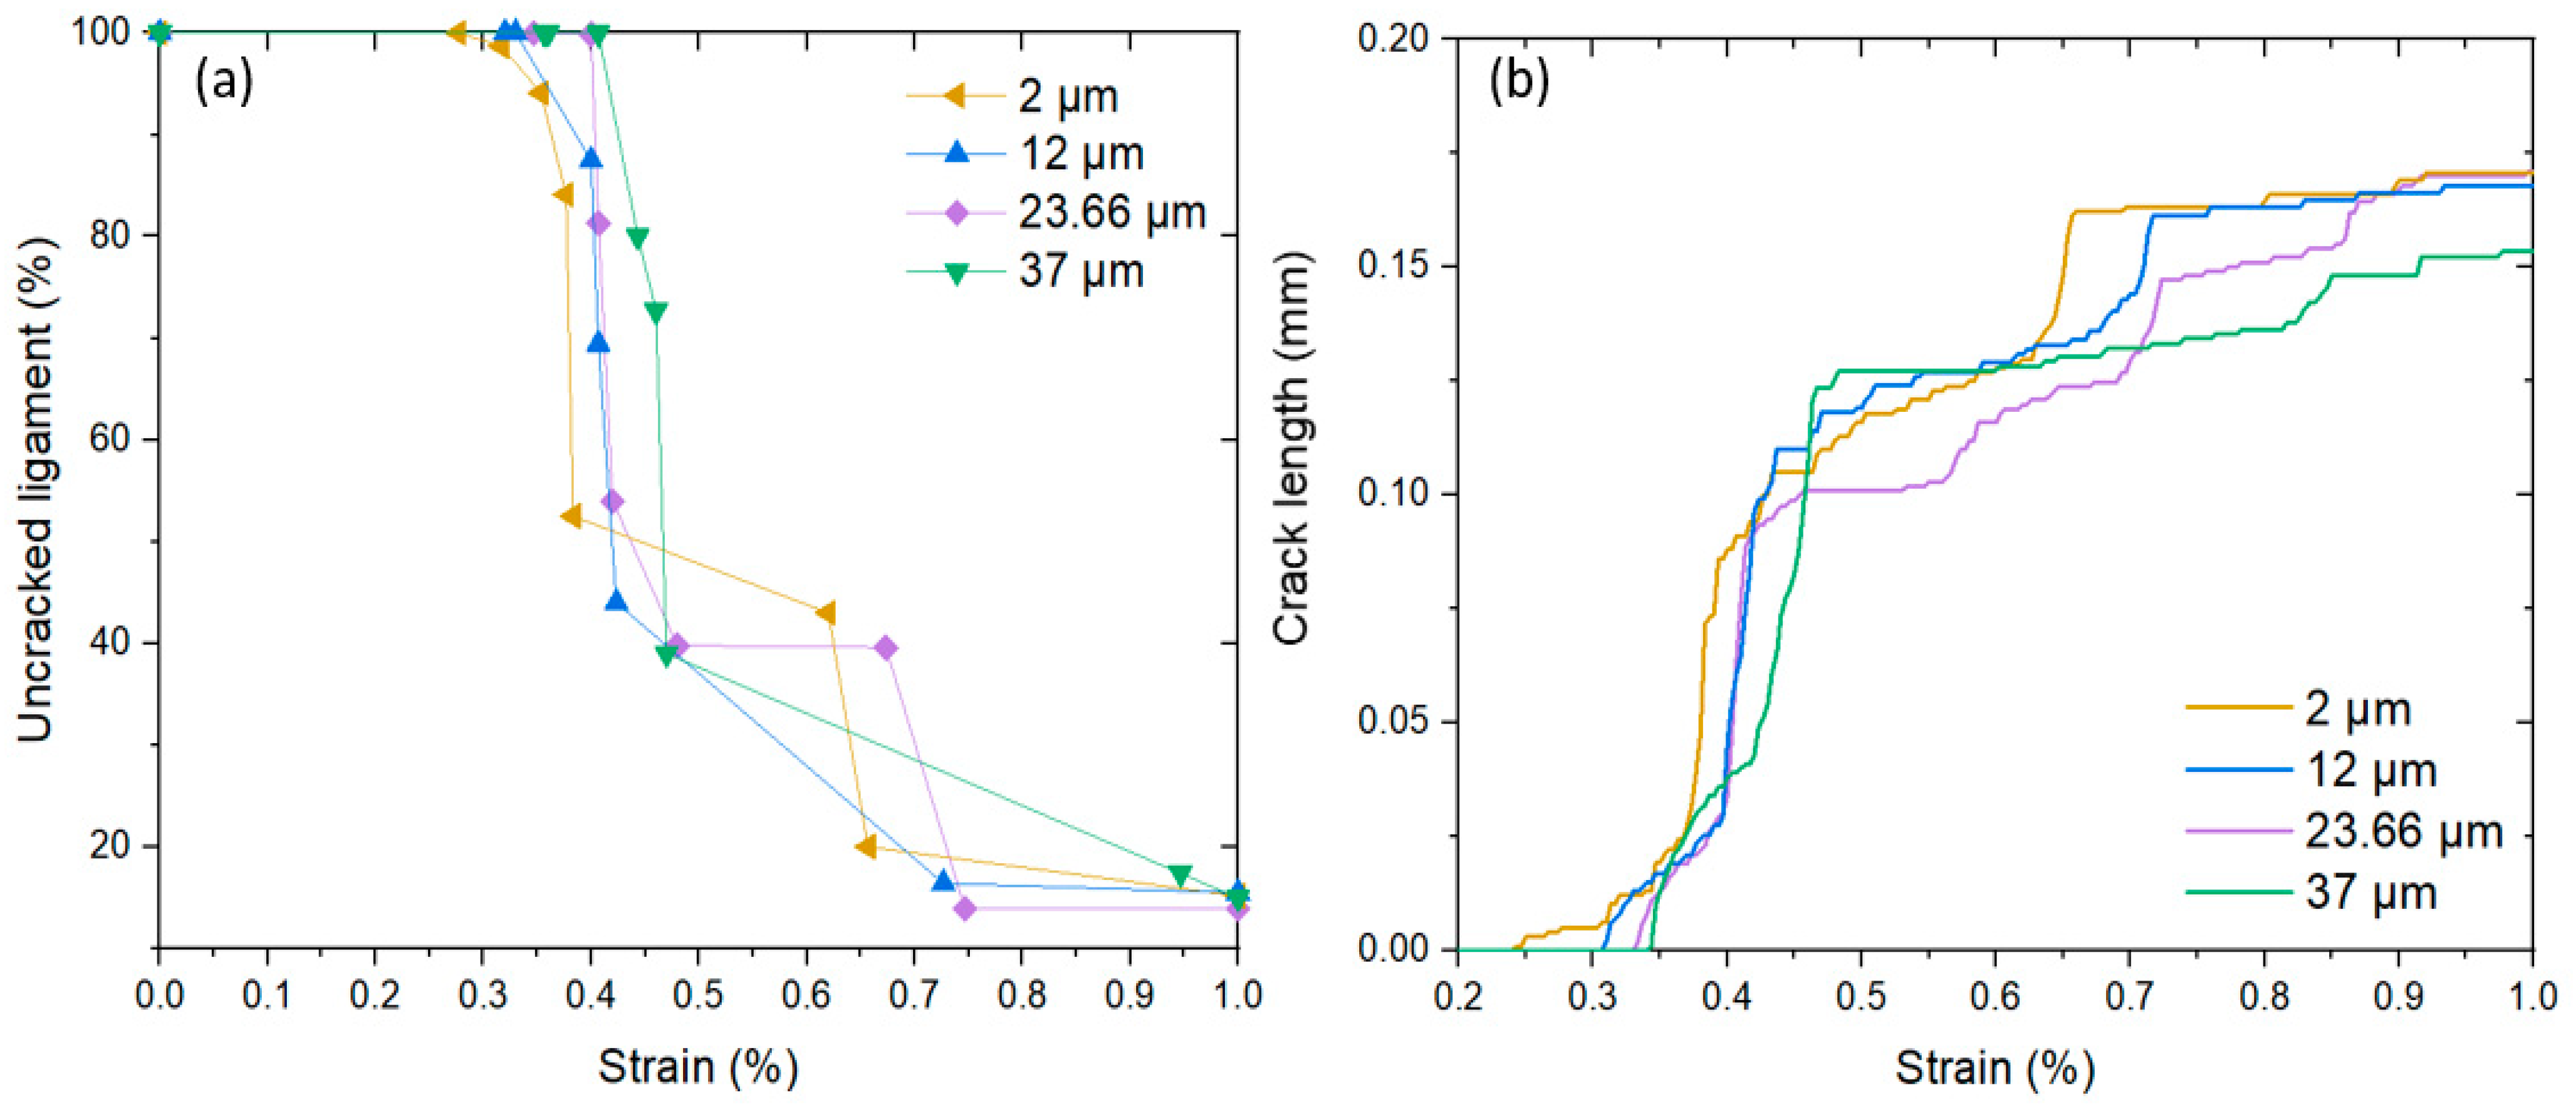
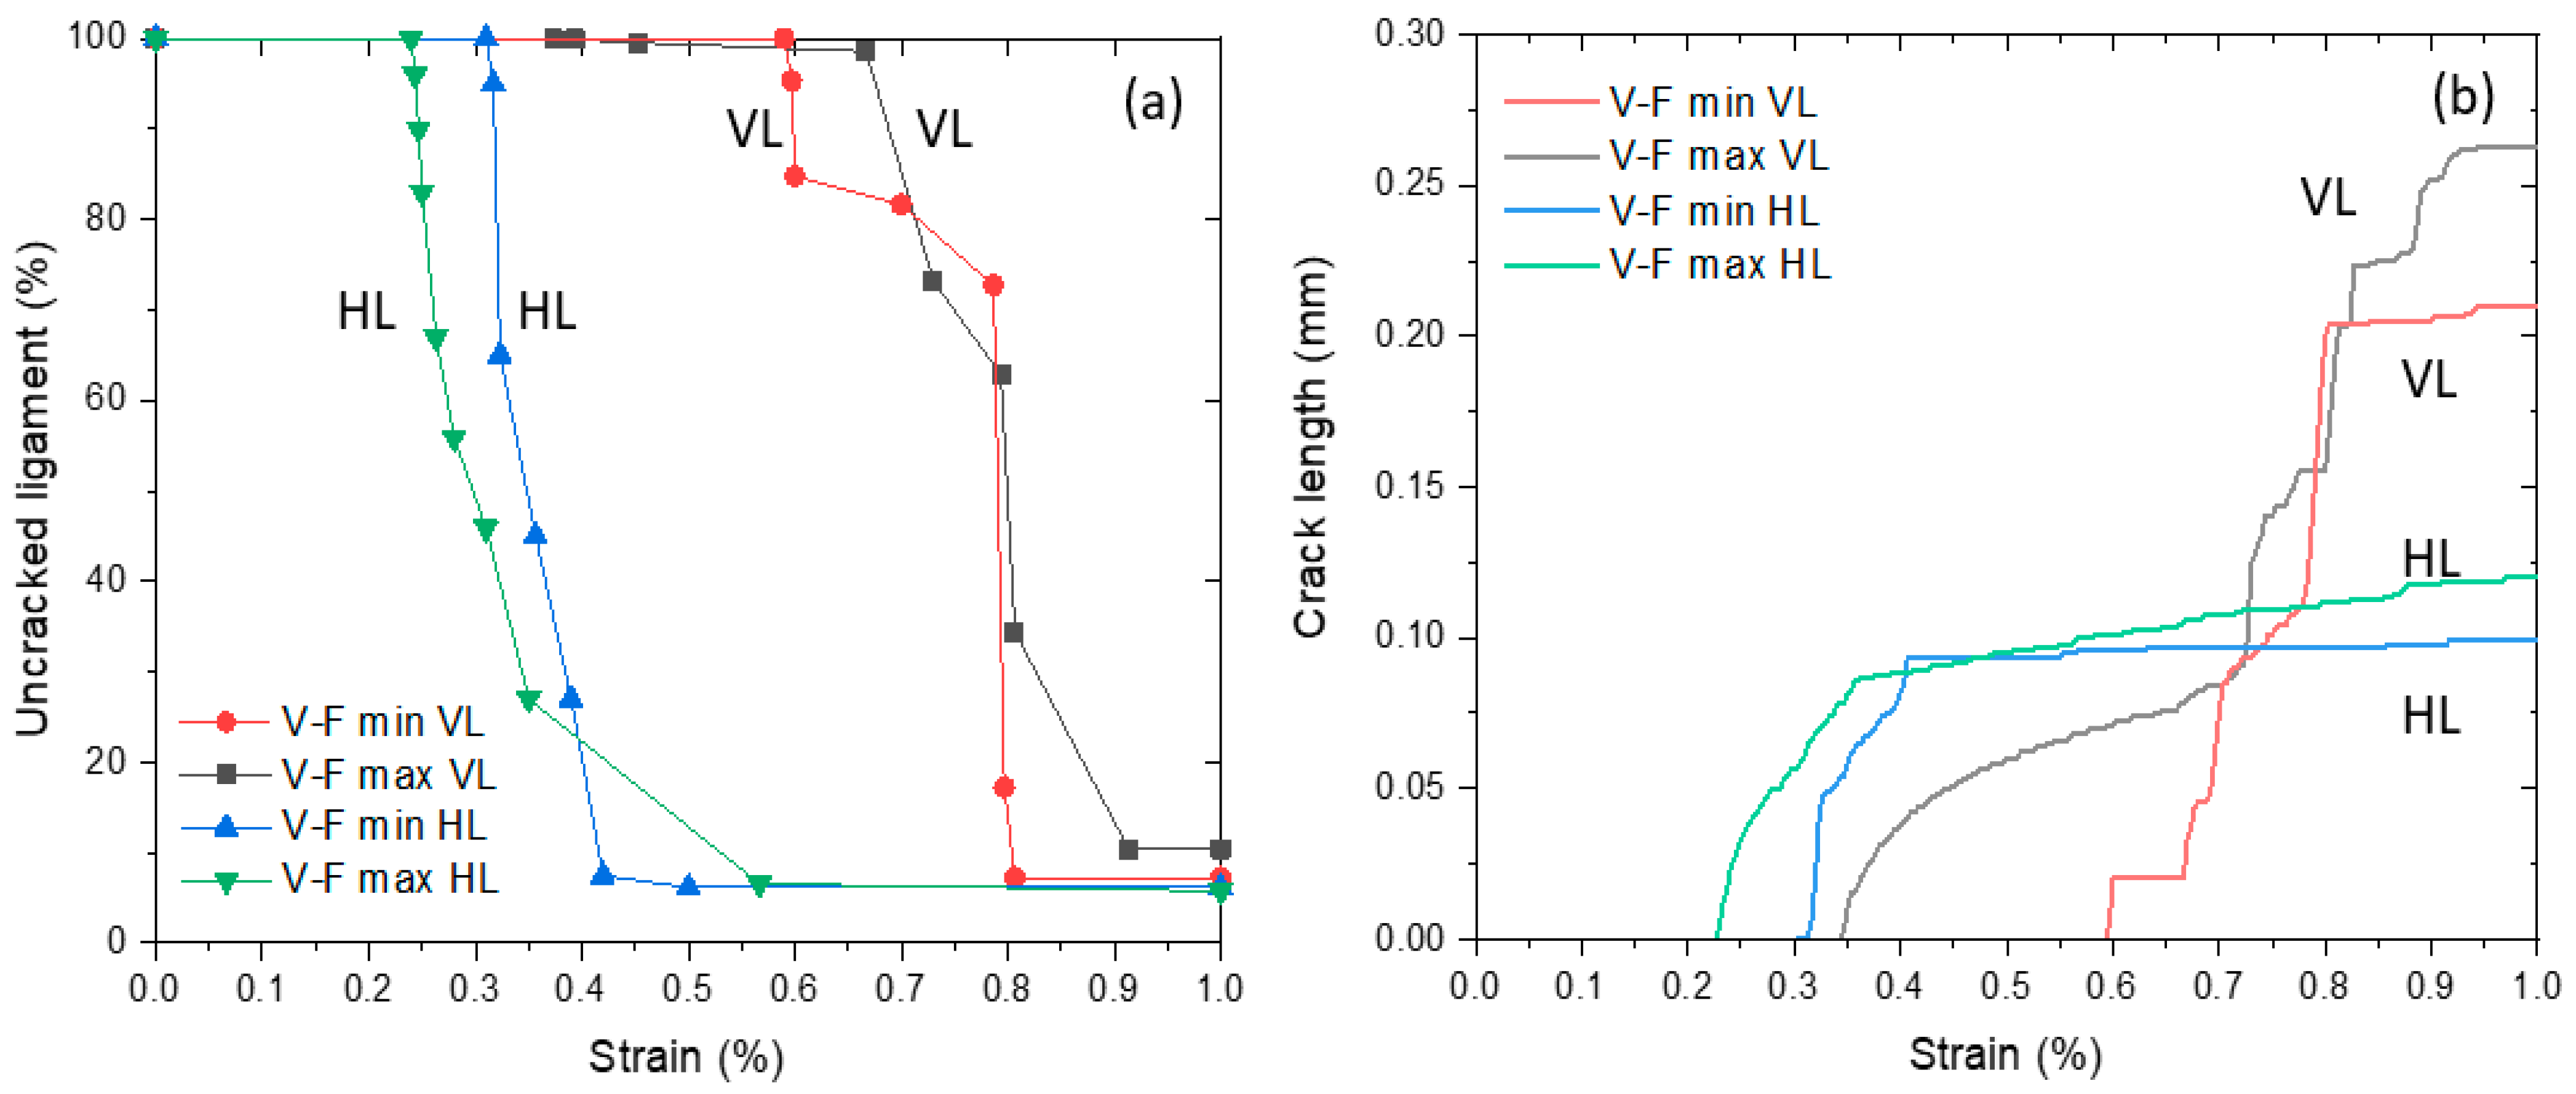
3.4. Effect of Inter-Particle Distance on Interactions of Nodular and Flake Inclusions
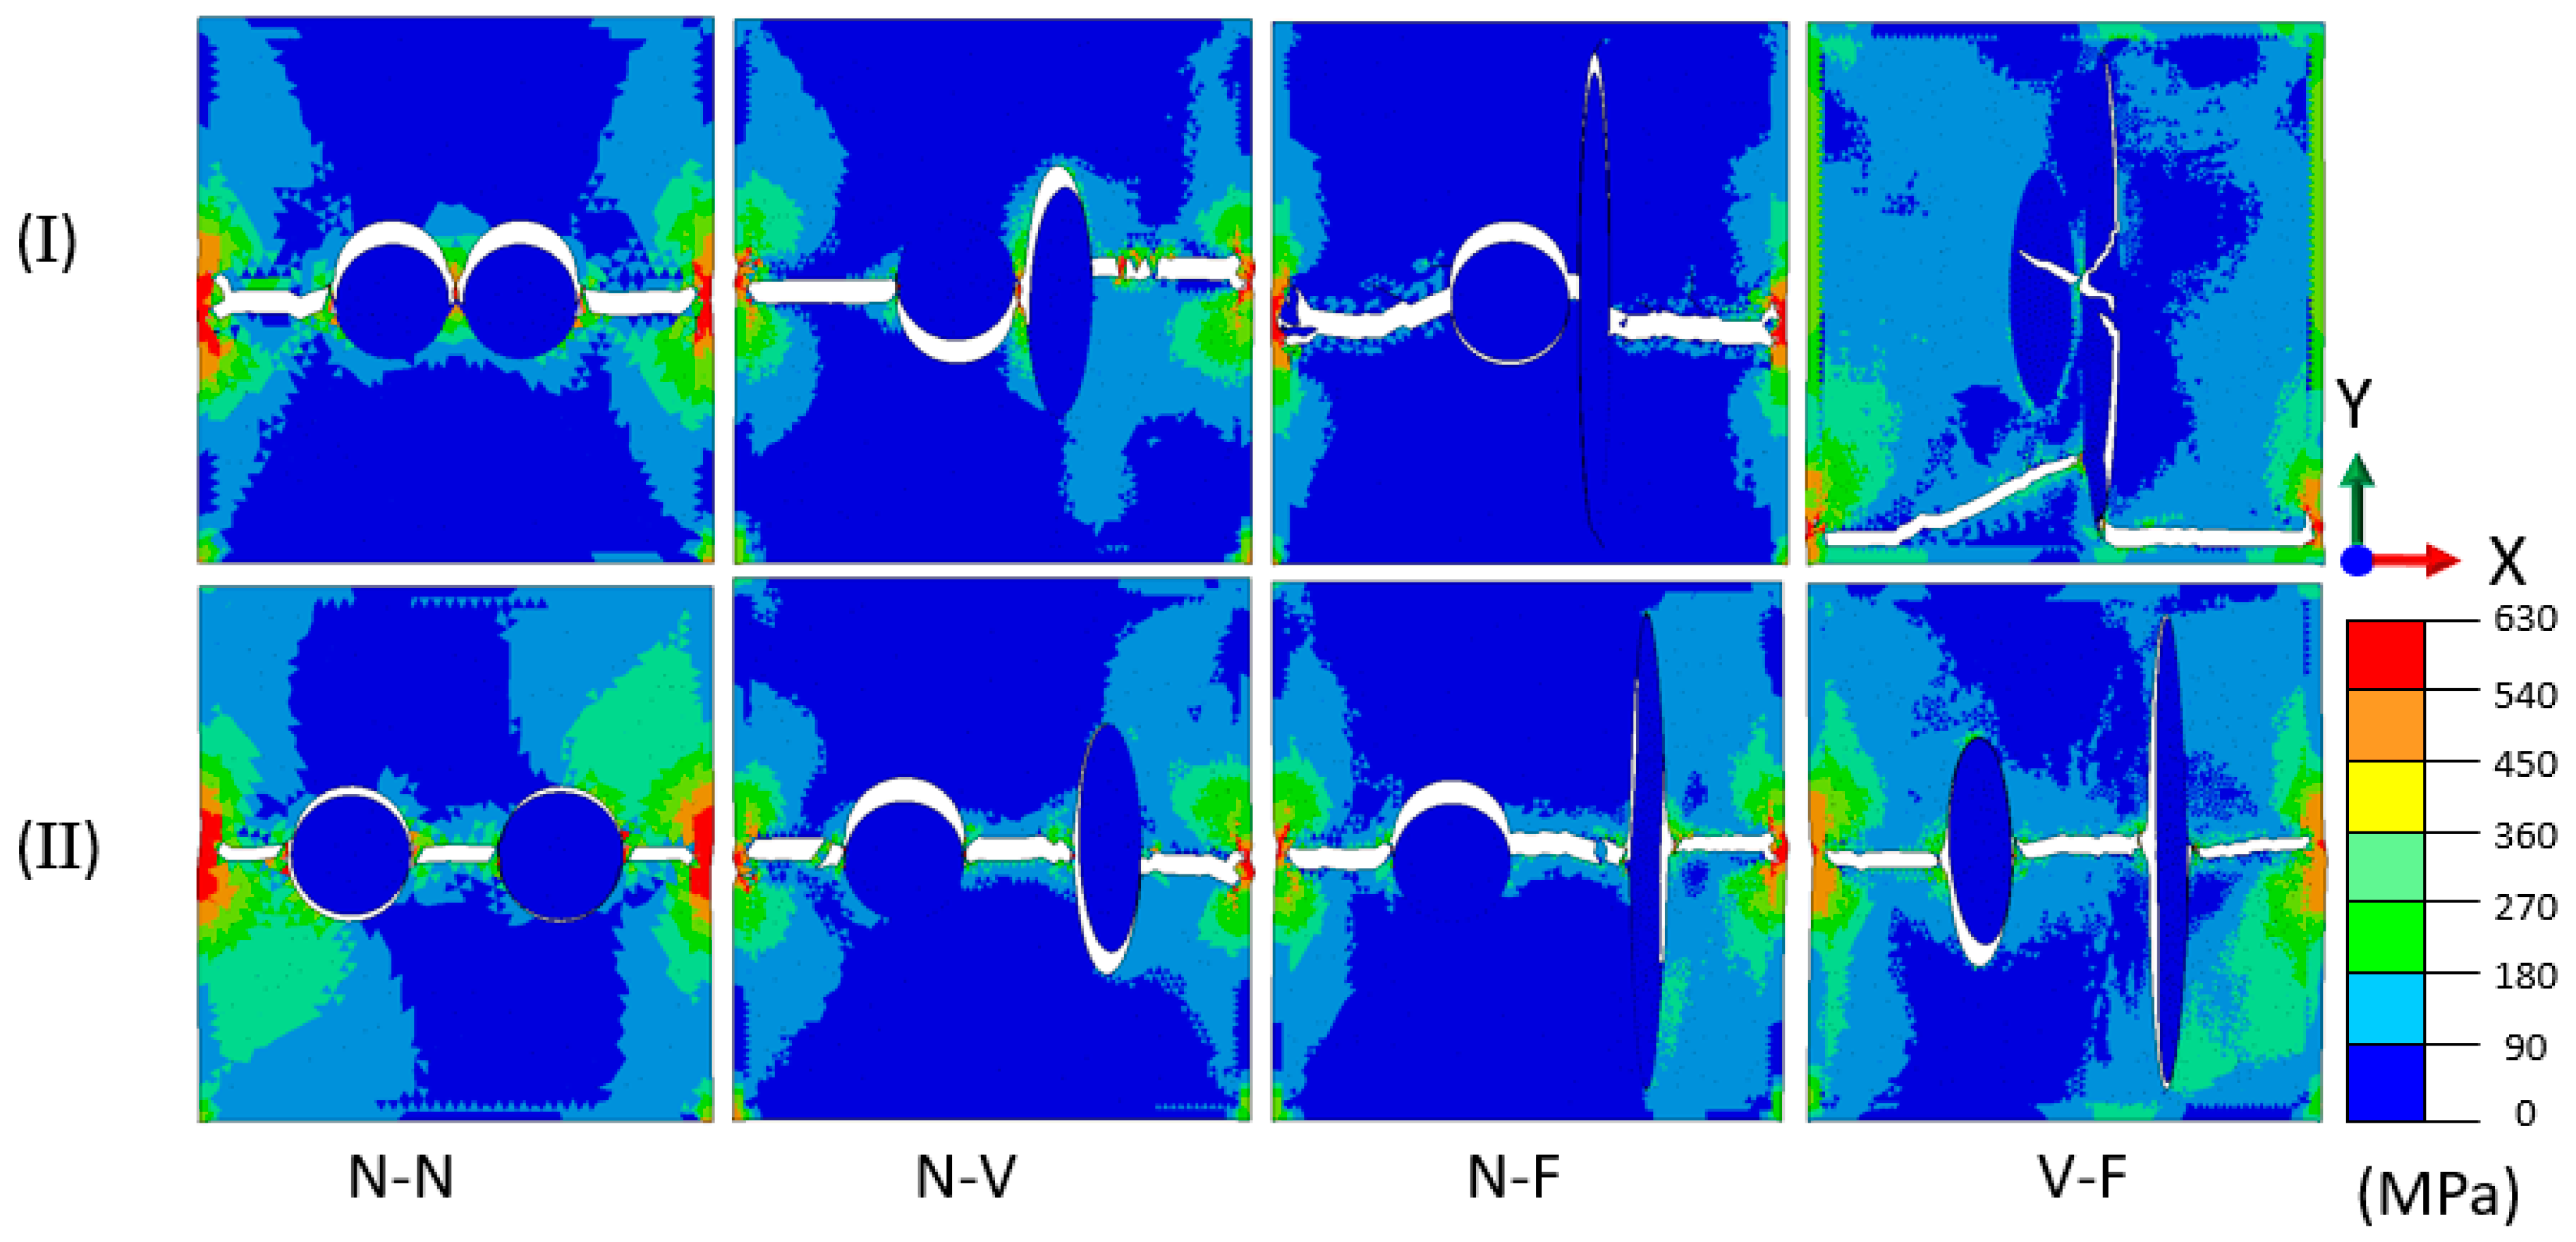
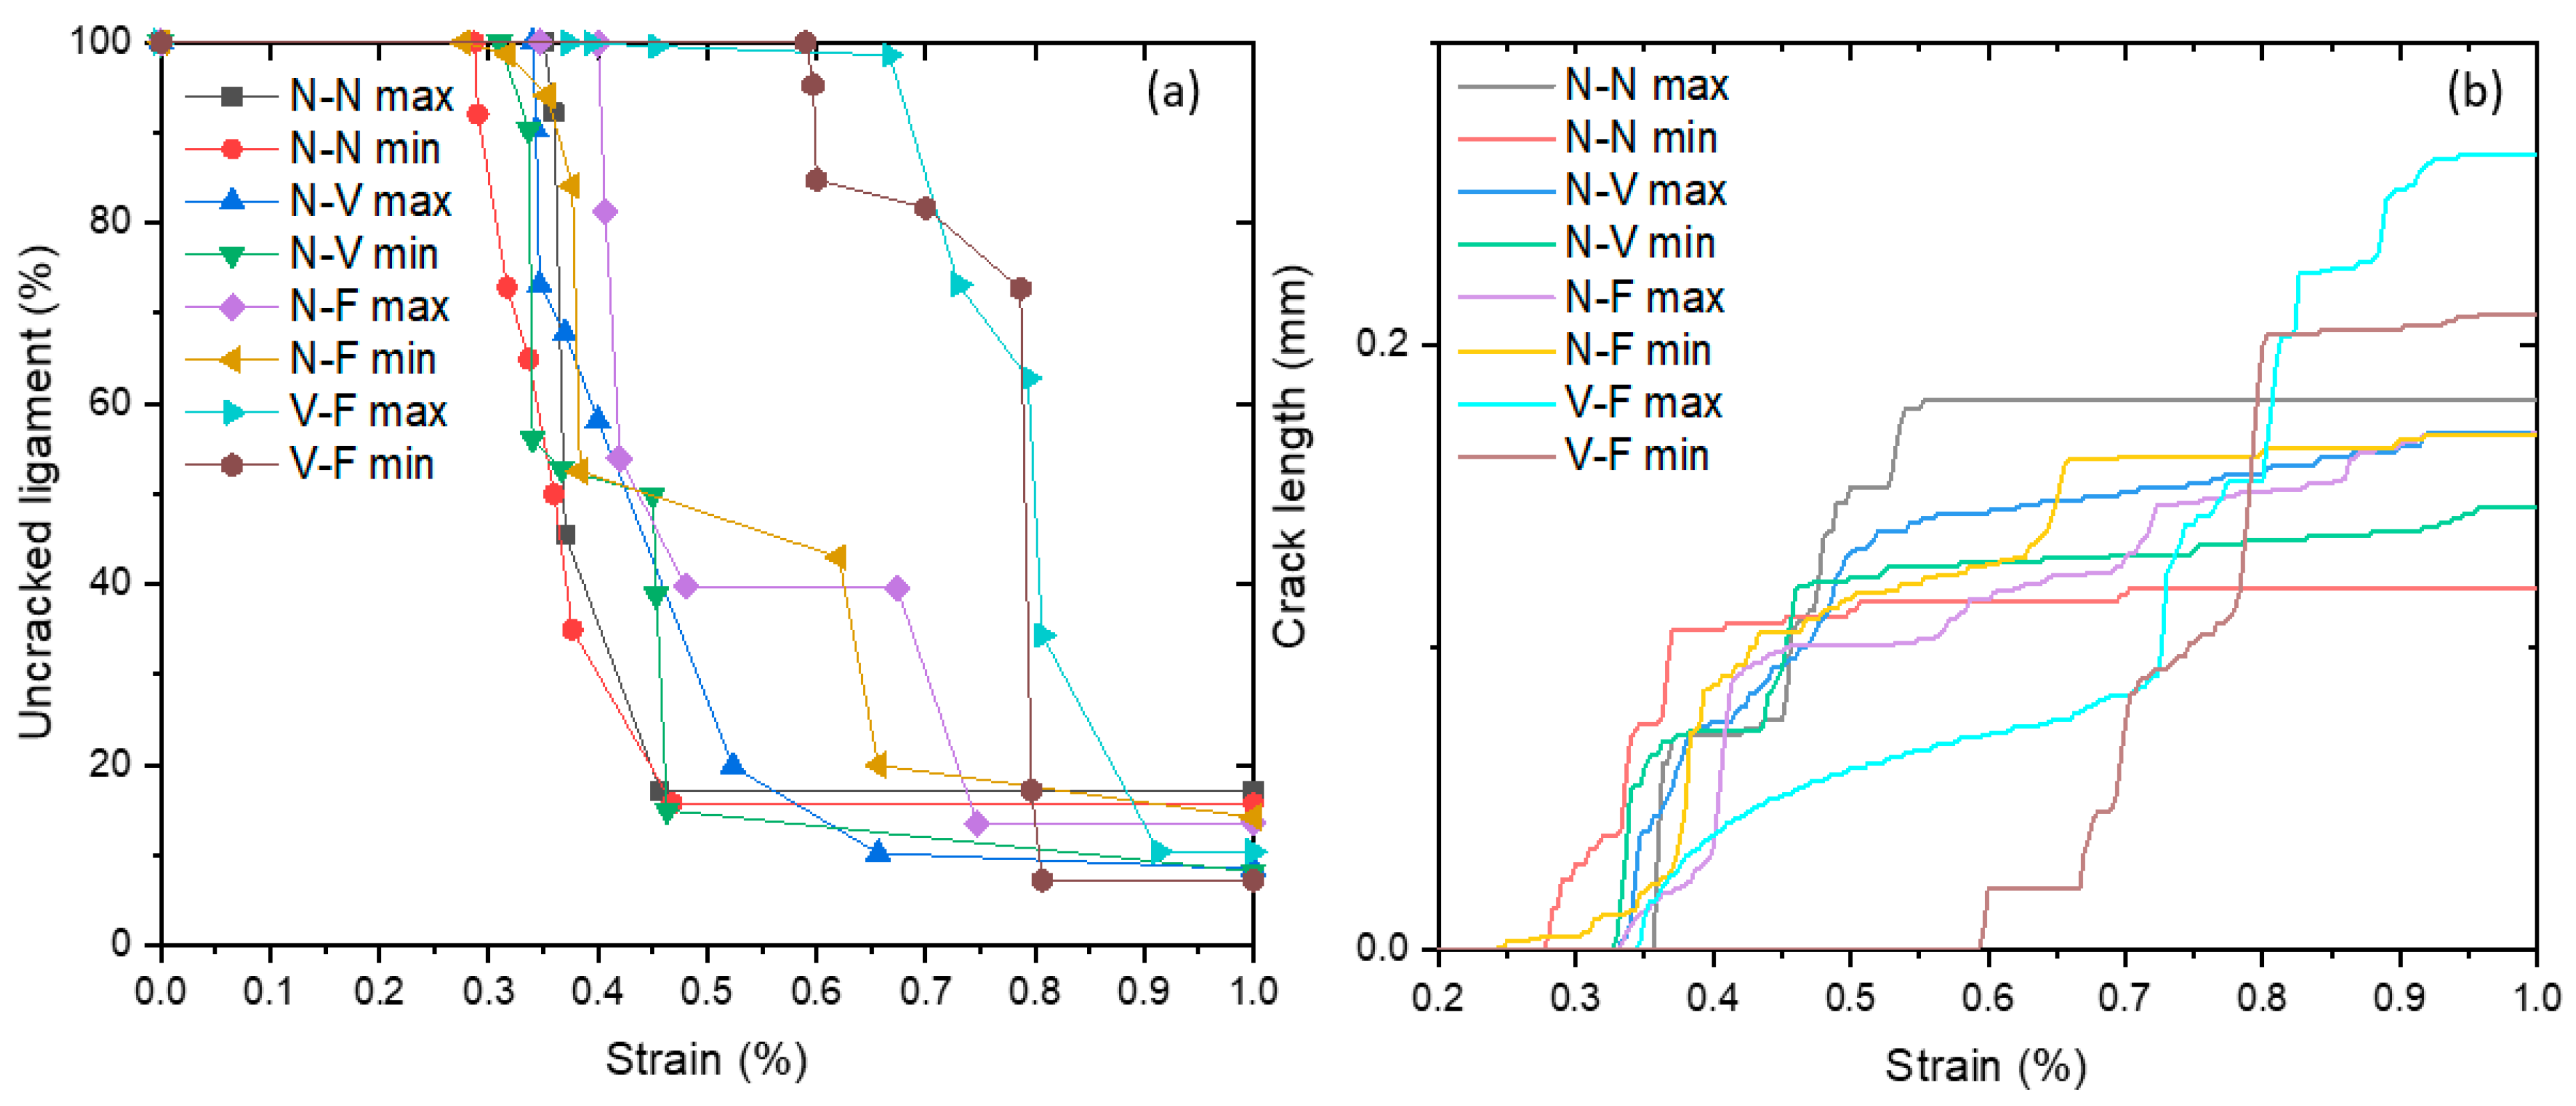
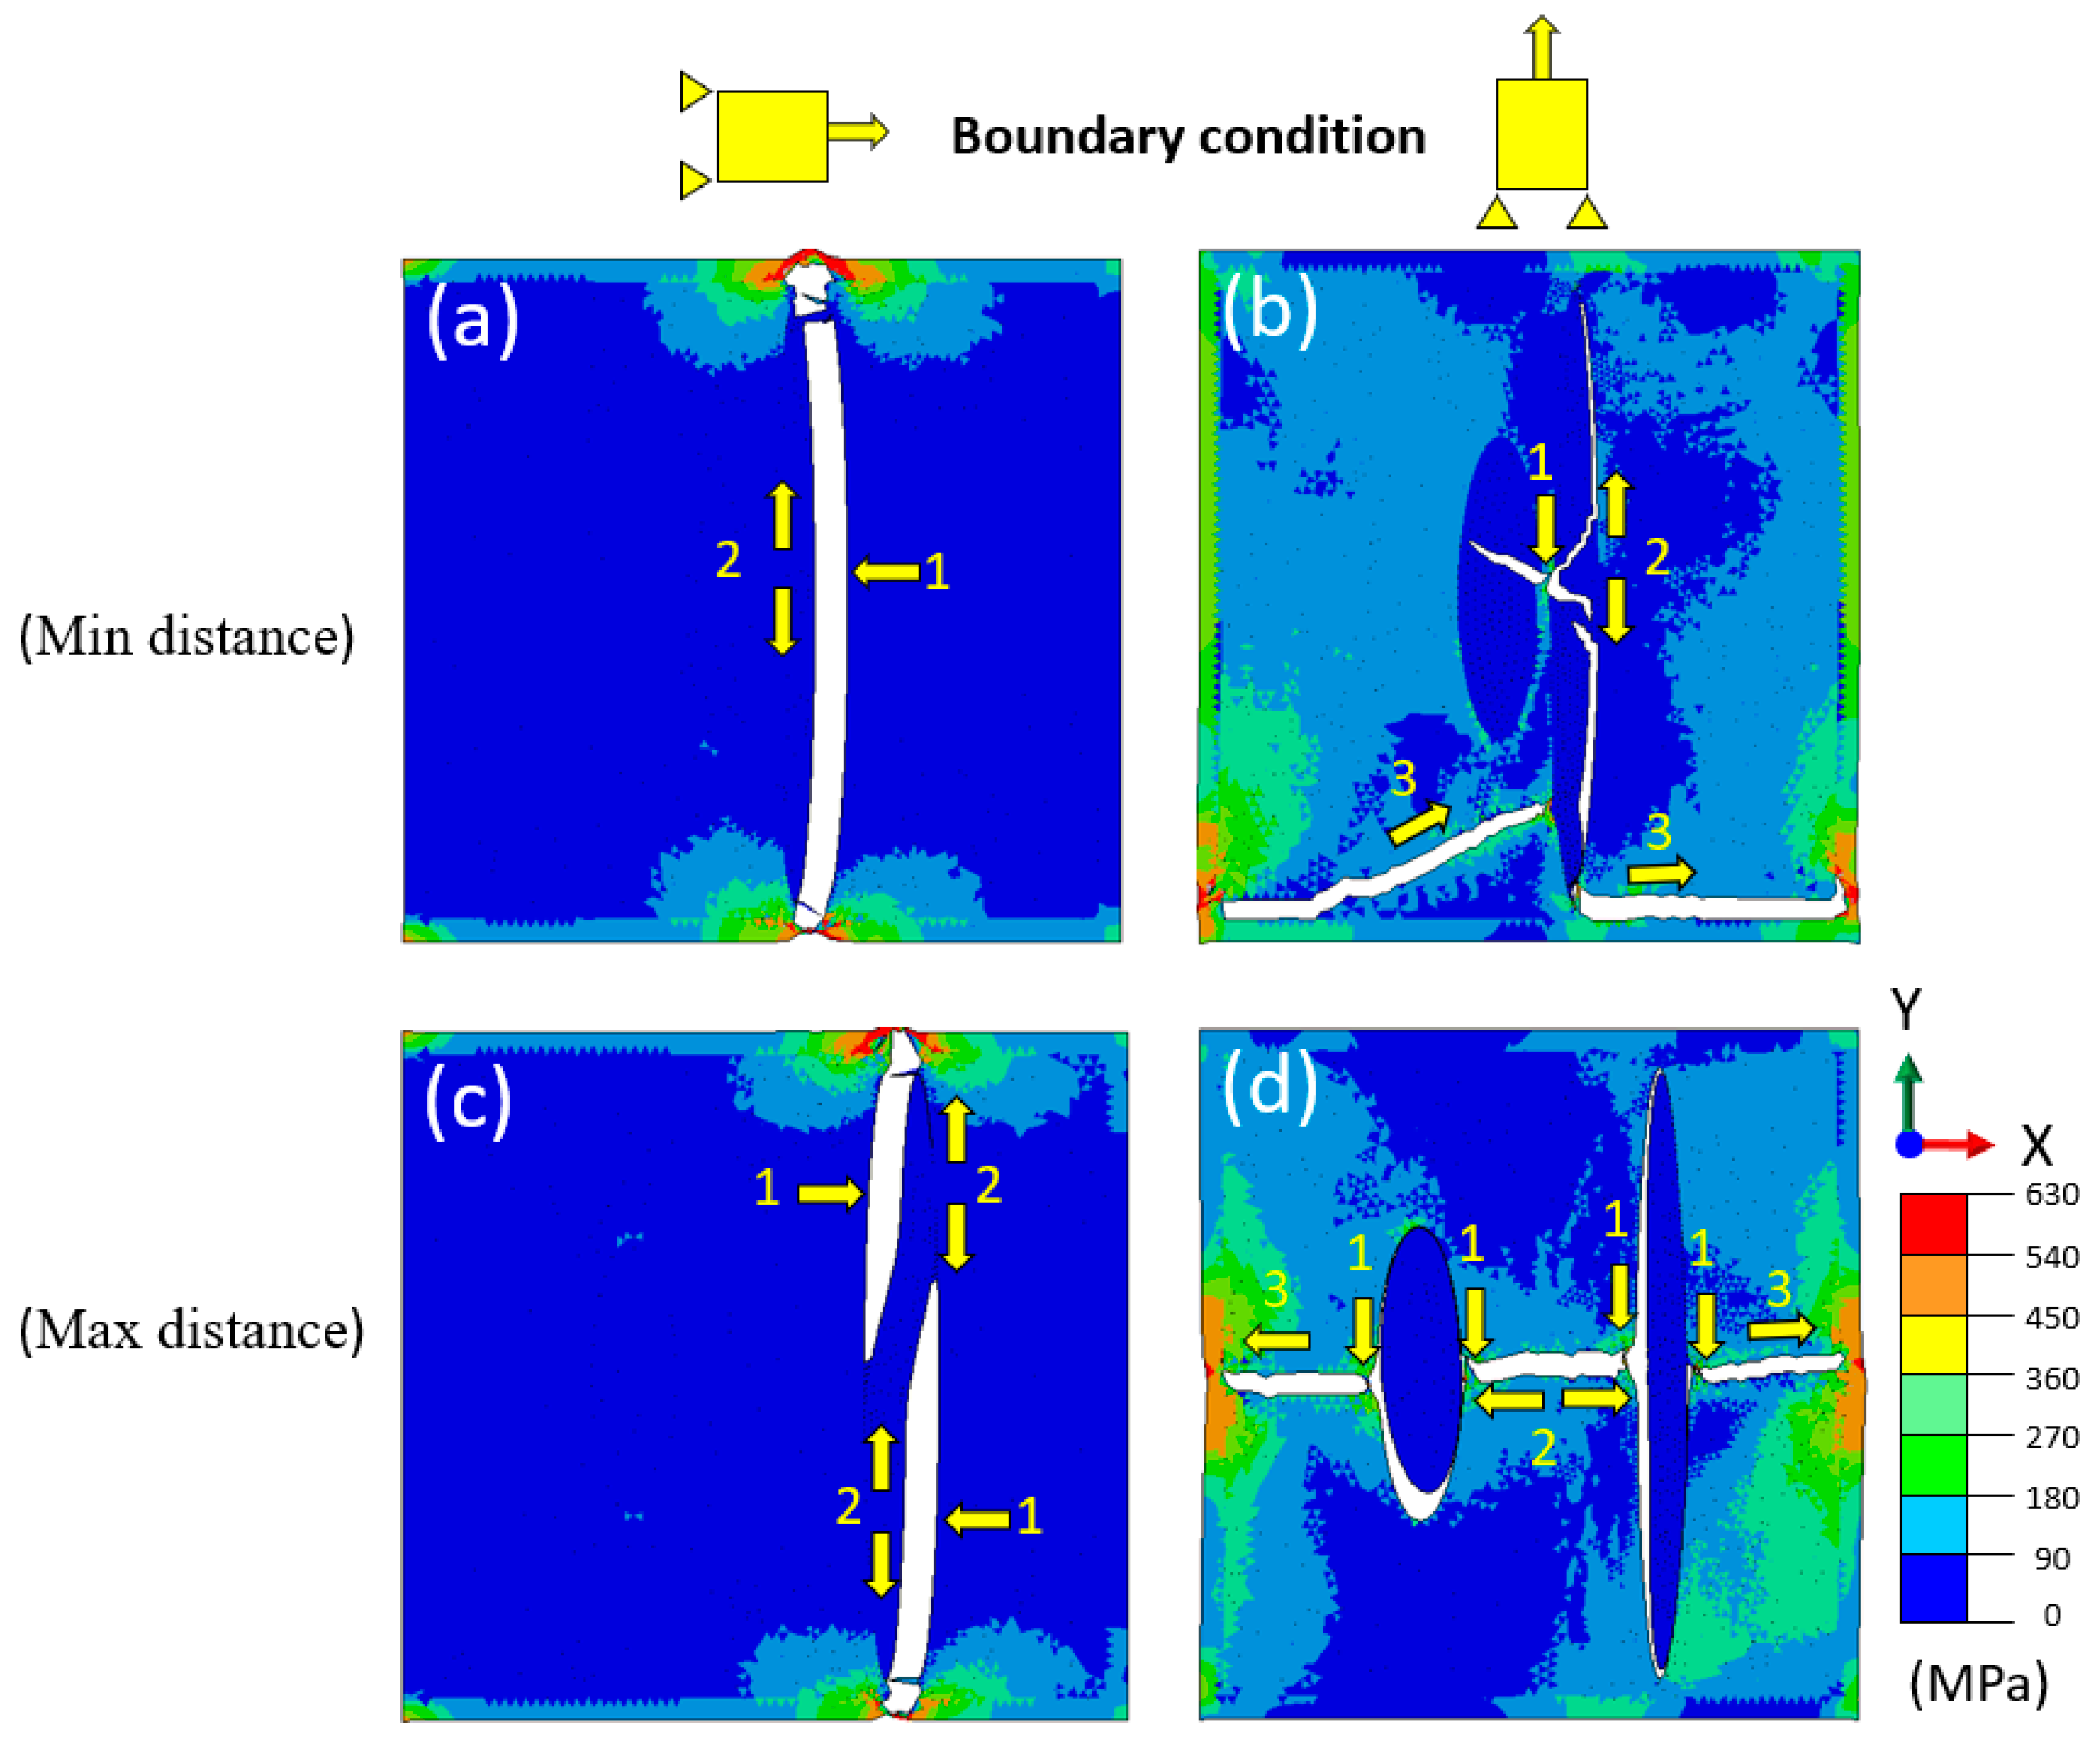
3.5. Effect of Loading Direction: Two-Particle Unit Cells
4. Conclusions
- Although graphite morphology had a minimal effect on the debonding of CGI interfaces, the presence of nodular inclusions could notably enhance the macroscopic stiffness of the material and effectively impede the propagation of cracks within the metallic matrix.
- The introduction of the periodic boundary conditions enhanced the propagation of cracks in the unit cells, especially with the particle’s end situated close to the model boundaries.
- The minimal distance between the graphite particles could significantly accelerate the crack initiation and propagation when the loading is aligned with the main axis of graphite inclusions.
- The case of neighbouring vermicular and flake particles aligned along the loading direction exhibited the best crack resistance compared to all the other combinations of particles when both vermicular and flake graphite particles were orthogonal to this direction (for the same loading direction). The change in the loading direction for this case of particles to the orthogonal one could promote the crack initiation and accelerate the crack propagation rate, with the flake graphite preventing the interfacial debonding for another particle due to the shielding effect.
Author Contributions
Funding
Data Availability Statement
Acknowledgments
Conflicts of Interest
References
- Gad, S.I.; Attia, M.A.; Hassan, M.A.; El-Shafei, A.G. Predictive computational model for damage behavior of metal-matrix composites emphasizing the effect of particle size and volume fraction. Materials 2021, 14, 2143. [Google Scholar] [CrossRef] [PubMed]
- Collini, L.; Nicoletto, G. Determination of the relationship between microstructure and constitutive behaviour of nodular cast iron with a unit cell model. J. Strain Anal. Eng. Des. 2005, 40, 107–116. [Google Scholar] [CrossRef]
- Lim, C.H.; Goo, B.C. Development of compacted vermicular graphite cast iron for railway brake discs. Met. Mater. Int. 2011, 17, 199–205. [Google Scholar] [CrossRef]
- Ghahremaninezhad, A.; Ravi-Chandar, K. Deformation and failure in nodular cast iron. Acta Mater. 2012, 60, 2359–2368. [Google Scholar] [CrossRef]
- Coronado, J.J.; Sinatora, A. Particle size effect on abrasion resistance of mottled cast iron with different retained austenite contents. Wear 2009, 267, 2077–2082. [Google Scholar] [CrossRef]
- König, M. Literature review of microstructure formation in compacted graphite Iron. Int. J. Cast Met. Res. 2010, 23, 185–192. [Google Scholar] [CrossRef]
- Shi, G.Q.; Yang, Z.; Li, J.P.; Tao, D.; Ma, Z.J. Investigation on the graphite nucleation and growth mechanism of the compacted graphite iron. J. Mater. Res. Technol. 2020, 9, 8186–8196. [Google Scholar] [CrossRef]
- Muhmond, H.M.; Fredriksson, H. Relationship between the trace elements and graphite growth morphologies in cast iron. Metall. Mater. Trans. A 2014, 45, 6187–6199. [Google Scholar] [CrossRef]
- Vajragupta, N.; Uthaisangsuk, V.; Schmaling, B.; Münstermann, S.; Hartmaier, A.; Bleck, W. A micromechanical damage simulation of dual phase steels using XFEM. Comput. Mater. Sci. 2012, 54, 271–279. [Google Scholar] [CrossRef]
- Hosseini-Toudeshky, H.; Jamalian, M. Simulation of micromechanical damage to obtain mechanical properties of bimodal Al using XFEM. Mech. Mater. 2015, 89, 229–240. [Google Scholar] [CrossRef]
- Palkanoglou, E.N.; Baxevanakis, K.P.; Silberschmidt, V. Thermal debonding of inclusions in compacted graphite iron: Effect of matrix phases. Eng. Fail. Anal. 2022, 139, 1–13. [Google Scholar]
- Cao, M.; Baxevanakis, K.P.; Silberschmidt, V.V. Effect of graphite morphology on the thermomechanical performance of compacted graphite iron. Metals 2023, 13, 473. [Google Scholar] [CrossRef]
- Collini, L.; Pirondi, A. Microstructure-based RVE modeling of the failure behavior and LCF resistance of ductile cast iron. Procedia Struct. Integr. 2019, 24, 324–336. [Google Scholar] [CrossRef]
- Mao, C.; Zhang, R.; Guo, R.; Zhao, X. Two-scale modeling of particle crack initiation and propagation in particle-reinforced composites by using microscale analysis based on Voronoi cell finite element model. Compos. Struct. 2023, 316, 116989. [Google Scholar] [CrossRef]
- Chen, X.; Chen, L.; Chen, H.; Song, B.; Zhao, Y.; Yu, T.; Zhao, J. Meso-scale numerical simulation and experimental verification of single grain grinding TiC–Fe composites. Ceram. Int. 2022, 48, 12299–12310. [Google Scholar] [CrossRef]
- Andriollo, T.; Thorborg, J.; Tiedje, N.S.; Hattel, J. Modeling of damage in ductile cast iron—The effect of including plasticity in the graphite nodules. IOP Conf. Ser. Mater. Sci. Eng. 2015, 84, 012027. [Google Scholar] [CrossRef]
- Andriollo, T.; Thorborg, J.; Hattel, J. Modeling the elastic behavior of ductile cast iron including anisotropy in the graphite nodules. Int. J. Solids Struct. 2016, 100–101, 523–535. [Google Scholar] [CrossRef]
- Li, Y.; Zhou, M. Prediction of fracture toughness of ceramic composites as function of microstructure: I. Numerical simulations. J. Mech. Phys. Solids 2013, 61, 472–488. [Google Scholar] [CrossRef]
- Sjögren, T.; Svensson, I.L. Studying elastic deformation behaviour of cast irons by acoustic emission. Int. J. Cast Met. Res. 2005, 18, 249–256. [Google Scholar] [CrossRef]
- Leyens, C.; Hausmann, J.; Kumpfert, J. Continuous fiber reinforced titanium matrix composites: Fabrication, properties and applications. Adv. Eng. Mater. 2003, 5, 399–410. [Google Scholar] [CrossRef]
- Papakaliatakis, G.; Karalekas, D. Damage growth by debonding in a single fibre metal matrix composite: Elastoplasticity and strain energy density criterion. Theor. Appl. Fract. Mech. 2010, 53, 152–157. [Google Scholar] [CrossRef]
- García, I.G.; Paggi, M.; Mantic, V. Fiber-size effects on the onset of fiber-matrix debonding under transverse tension: A comparison between cohesive zone and finite fracture mechanics models. Eng. Fract. Mech. 2014, 115, 96–110. [Google Scholar] [CrossRef]
- Xu, J.; El Mansori, M. Cutting modeling using cohesive zone concept of titanium/CFRP composite stacks. Int. J. Precis. Eng. Manuf. 2015, 16, 2091–2100. [Google Scholar] [CrossRef]
- Chuang, C.; Singh, D.; Kenesei, P.; Almer, J.; Hryn, J.; Huff, R. 3D quantitative analysis of graphite morphology in high strength cast iron by high-energy X-ray tomography. Scr. Mater. 2015, 106, 5–8. [Google Scholar] [CrossRef]
- Johnson, G.R.; Cook, W.H. Fracture characteristics of three metals subjected to various strains, strain rates, temperatures and pressures. Eng. Fract. Mech. 1985, 21, 31–48. [Google Scholar] [CrossRef]
- Camanho, P.P.; Davila, C.G. Mixed-mode decohesion finite elements for the simulation of delamination in composite materials. NASA Tech. Pap. 2002, 211737, 42. [Google Scholar]
- Eiken, J. Calphad-based phase-field study of the interplay between spheroidal graphite growth and chemical segregation in ductile cast iron. IOP Conf. Ser. Mater. Sci. Eng. 2020, 861, 012055. [Google Scholar] [CrossRef]
- Yang, H.W.; Wang, X.M.; Liu, W.; Huang, W.; Wu, M.; Xue, M.L.; Li, L. Influence of distribution and size of graphite particle on the machinability of nodular cast iron. Eng. Fract. Mech. 2024, 297, 109882. [Google Scholar] [CrossRef]
- Xu, C.; Wigger, T.; Azeem, M.A.; Andriollo, T.; Fæster, S.; Clark, S.J.; Gong, Z.; Atwood, R.; Grivel, J.C.; Hattel, J.H.; et al. Unraveling compacted graphite evolution during solidification of cast iron using in-situ synchrotron X-ray tomography. Carbon N. Y. 2021, 184, 799–810. [Google Scholar] [CrossRef]
- Dessart, L.; Standaert, W.S. storytelling in the age of sustainability. B.H. Creep deformation and damage mechanism of compact graphite cast iron with different pearlite contents. Int. J. Disaster Risk Reduct. 2023, 23. [Google Scholar] [CrossRef]
- Palkanoglou, E.N.; Baxevanakis, K.P.; Silberschmidt, V.V. Thermal debonding in compacted graphite iron: Effect of interaction of graphite inclusions. Procedia Struct. Integr. 2021, 37, 209–216. [Google Scholar] [CrossRef]
- Okereke, M.; Keates, S. Finite Element Applications; Springer International Publishing AG: Cham, Germany; Berlin/Heidelberg, Germany, 2018. [Google Scholar]
- Beskou, N.D.; Muho, E. V Microstructural effects on dynamic response of rigid and flexible pavements to moving load under plane strain. Soil Dyn. Earthq. Eng. 2022, 163, 107544. [Google Scholar] [CrossRef]
- Greenstreet, W.L.; Yahr, G.T.; Valachovic, R.S. The behavior of graphite under biaxial tension. Carbon N. Y. 1969, 11, 43–57. [Google Scholar] [CrossRef]
- Zhang, D.; Wang, Q.; Dong, J. Simulation study on CFRP strengthened reinforced concrete beam under four-point bending. Comput. Concr. 2016, 17, 407–421. [Google Scholar] [CrossRef]
- Qiu, Y.; Pang, J.C.; Yang, E.N.; Li, S.X.; Zhang, Z.F. Transition of tensile strength and damaging mechanisms of compacted graphite iron with temperature. Mater. Sci. Eng. A 2016, 677, 290–301. [Google Scholar] [CrossRef]
- Palkanoglou, E.N.; Baxevanakis, K.P.; Silberschmidt, V. V Interfacial debonding in compacted graphite iron: Effect of thermal loading. Procedia Struct. Integr. 2020, 28, 1286–1294. [Google Scholar] [CrossRef]
- Zhang, Y.; Pang, J.; Shen, R.; Qiu, Y.; Li, S.; Zhang, Z. Investigation on tensile deformation behavior of compacted graphite iron based on cohesive damage model. Mater. Sci. Eng. A 2018, 713, 260–268. [Google Scholar] [CrossRef]


| Software | Analysis Type | Domain Length | Graphite (%) | Mesh Size | Element Type | Loading | Boundary Conditions |
|---|---|---|---|---|---|---|---|
| Abaqus | Dynamic explicit | 0.1 mm | 8.3 | 2 µm | Triangular | Tensile | Periodic |
| Mass Density (Tonne/mm³) | Young’s Modulus (GPa) | Poisson’s Ratio | |
|---|---|---|---|
| 2.26 × 10⁻⁹ | 15.85 | 0.2 | |
| Yield Strain (%) | Yield Stress (MPa) | ||
| 0.184 | 27.56 | ||
| Mass Density (Tonne/mm³) | Young’s Modulus (GPa) | Poisson’s Ratio | |
|---|---|---|---|
| 6.8 × 10⁻⁹ | 150 | 0.25 | |
| Yield Strain (%) | Yield Stress (MPa) | ||
| 0.209 | 323.95 | ||
Disclaimer/Publisher’s Note: The statements, opinions and data contained in all publications are solely those of the individual author(s) and contributor(s) and not of MDPI and/or the editor(s). MDPI and/or the editor(s) disclaim responsibility for any injury to people or property resulting from any ideas, methods, instructions or products referred to in the content. |
© 2024 by the authors. Licensee MDPI, Basel, Switzerland. This article is an open access article distributed under the terms and conditions of the Creative Commons Attribution (CC BY) license (https://creativecommons.org/licenses/by/4.0/).
Share and Cite
Luo, X.; Baxevanakis, K.P.; Silberschmidt, V.V. Microstructure-Based CZE Model for Crack Initiation and Growth in CGI: Effects of Graphite-Particle Morphology and Spacing. Solids 2024, 5, 123-139. https://doi.org/10.3390/solids5010009
Luo X, Baxevanakis KP, Silberschmidt VV. Microstructure-Based CZE Model for Crack Initiation and Growth in CGI: Effects of Graphite-Particle Morphology and Spacing. Solids. 2024; 5(1):123-139. https://doi.org/10.3390/solids5010009
Chicago/Turabian StyleLuo, Xingling, Konstantinos P. Baxevanakis, and Vadim V. Silberschmidt. 2024. "Microstructure-Based CZE Model for Crack Initiation and Growth in CGI: Effects of Graphite-Particle Morphology and Spacing" Solids 5, no. 1: 123-139. https://doi.org/10.3390/solids5010009