
Chemical and Structural Comparison of Different Commercial Food Supplements for Silicon Uptake


1
Inorganic Solid-State Chemistry, Saarland University, 66123 Saarbruecken, Germany
2
INM-Leibniz Institute for New Materials, 66123 Saarbruecken, Germany
*
Author to whom correspondence should be addressed.
Solids 2023, 4(1), 1-21; https://doi.org/10.3390/solids4010001
Submission received: 22 November 2022
/
Revised: 22 December 2022
/
Accepted: 27 December 2022
/
Published: 3 January 2023
(This article belongs to the Special Issue Solids in Europe)
Abstract
:Various food supplements for silicon uptake were compared in terms of their structures and chemical compositions. In particular, we analyzed the silanol group content, which can be an indicator of the uptake of the siliceous species in the human body. We analyzed the commercial products Original Silicea Balsam®, Flügge Siliceous Earth Powder, Pure Colloidal Silicon, and BioSil® by applying various methods such as FTIR, 29Si NMR, and TGA. The Si-OH group content of the samples containing pure silica was the highest for the Original Silicea Balsam followed by the Pure Colloidal Silicon. The siliceous earth powder revealed the lowest content of such groups and the densest structure. BioSil® contained a considerable concentration of organic molecules that stabilized orthosilicic acid. The study may help to understand the silicon uptake behavior of different food supplements depending on their chemical structure.
1. Introduction
Silicon is the second most abundant element on earth and is found in the tissues of virtually all living organisms [1,2]. In the human body it is the third most abundant trace element and contributes to many biological functions [2,3,4]. Silicon is mainly found in connective tissue, the aorta, the trachea, tendons, bones, and skin. In the skin, for example, it is supposed to positively influence collagen synthesis by stimulating fibroblasts to secrete type I collagen [5,6,7]. Moreover, an increased silicon content ensures the strengthening of hair fibers and nails. It also has a positive influence on bone and cartilage formation in the human body because it is important for the synthesis of collagen and glycosaminoglycans, which are required for bone formation [1,5,6]. Studies in animals show that silicon deficiency can lead to brittle bones and impaired production of collagen and glycosamine [1,8,9]. A silicon balance in the body is therefore most likely important for human health [1,3,9,10].
Silicon is exclusively ingested through the diet. The absorption process has been described in the literature in various model organisms; in particular, rats, chickens, and birds [2]. Bioavailability is mainly based on the uptake of compounds such as orthosilicic acid, silicates, or SiO2. Various studies have shown that the bioavailability of silicon is the highest for orthosilicic acid and its soluble oligomers because they are easily absorbed by the mucosa of the gastrointestinal tract due to their size and neutral charge [2,9,10,11]. Insoluble silicates and polysilicates have very low bioavailability in comparison. Therefore, they must first be converted into orthosilicic acid or soluble oligo silicates before they are absorbed in the gastrointestinal tract [2,9,10,12]. This transformation occurs to a small extent in the gastrointestinal tract and depends essentially on the structure of the insoluble silica. Therefore a higher cross-linking of the silicate species most likely leads to a lower bioavailability [1,4,9,11,12]. However, the exact mechanism of the biological uptake of silicon has not yet been completely clarified [9]. Silicon is naturally found in many foods, and its content in plant-based foods is significantly higher than in animal-based foods. One of the most important sources of silicon for humans is water that contains low concentrations of orthosilicic acid, whereby the silicon content strongly depends on the geological origin of the water [3,10]. Important plant sources of silicon are cereals, oats, wheat, and rice, followed by fruits and vegetables [1,3,11]. Due to the common presence of insoluble and polymeric silicon compounds in most foods, the bioavailability of these compounds is often relatively low. In addition to dietary intake, silicon can also be supplied through several dietary supplements. The range of silicon-containing dietary supplements is very broad and ranges from stabilized orthosilicic acids to polymerized colloidal silicon dioxide and sediments of diatoms [1,3,11]. Model studies on molecular silicon compounds such as silatranes revealed the interaction of such compounds with biologically active molecules such as enzymes [13,14,15,16]. Organosilanols containing stabilized Si-OH groups are also among these biologically active compounds. Conventionally, these molecules tend to self-condense, but this can be prevented by a clever choice of organic substituents on the silicon atom. Several synthesized silanediols have demonstrated their potentials as enzyme inhibitors [17]. A selection of typical examples include silanediols that act as HIV protease inhibitors, angiotensin-converting enzyme (ACE) inhibitors, and thermolysin inhibitors [17,18,19,20]. In particular, the chelating properties of the silanol groups to metal centers appear to play a major role in enzyme inhibition [20,21]. Similar to the stable organodisilanols, stabilized organotrisilanols also showed high activities in enzyme inhibition with low toxicities [22,23]. The aforementioned works demonstrated high bioactivity of silanol groups at the molecular level. An imposing example from nature that also illustrates that Si-OH groups can be important for biological processes is the protein-driven assembly of SiO2 cell walls of diatoms from orthosilicic acid dissolved in saline water [24].
Generally, soluble silica and orthosilicic acid show a higher bioavailability than condensed silica [3]. In order to use orthosilicic acid in higher concentrations in dietary supplements, it must be stabilized to prevent condensation into polymers. For this purpose, choline, for example, can be used, which results in a high bioavailability, whereas it is rather low for supplements composed of amorphous SiO2 or colloidal condensed silica [1,3,11]. Until now, it was unclear how the stabilizing agents in these supplements interact with orthosilicic acid and how the additives affect bioabsorption.
In the present study, the chemical composition and structure of various silicon-containing dietary supplements were investigated via different chemical analyses. The goal of the study was to point out similarities and differences in order to make a classification from a chemical point of view and to obtain a first insight into which structural features could possibly be important for an uptake of the substances. For this purpose, we used a selection of several commercial products to exclusively determine their chemical compositions and structures. The dietary supplements selected for the study were: Hübner Original Silicea® Balsam (Anton Hübner GmbH & Co. KG, Ehrenkirchen, Germany), Geosilica (GeoSilica Iceland, Reykjanesbær, Iceland), Flügge Siliceous Earth (Salus Group, Bruckmühl, Germany), and BioSil® (Bio Minerals NV, Destelbergen, Belgium). The study will serve as a starting point for comparing the bioavailability of different silicon-containing dietary supplements based on their compositions.
2. Materials and Methods
2.1. Materials
The Original Silicea Balsam® (Anton Hübner GmbH & Co. KG, Ehrenkirchen, Germany), Flügge Siliceous Earth Powder (SALUS Haus GmbH & Co. KG, Bruckmühl, Germany), Pure Colloidal Silicon (GeoSilica Iceland hf., Keflavík, Iceland), and BioSil® (Bio Minerals NV, Destelbergen, Belgium) were obtained in the free market. Untreated diatomaceous earth (filter aid, dried) was purchased from Sigma Aldrich. The trimethylchlorosilane (98%) and hexamethyldisilazane (98%) were purchased from ABCR GmbH. All chemicals except the trimethylchlorosilane were used without further purification. The trimethylchlorosilane was freshly distilled before use.
2.2. Sample Preparation
All aqueous samples were frozen under rotation in liquid nitrogen, and then the frozen samples were freeze-dried at 0.3–0.1 mbar in a lyophilizer for 2–3 days.
Functionalization of the freeze-dried Silicea/Pure Geosilica (PKS) and Flügge Siliceous Earth with hexamethyldisilazane (HMDS): in a dried 100 mL three-necked round-bottom flask, 1.00 g of the sample was dispersed in 30 mL of absolute toluene under an argon atmosphere. To the prepared dispersion, 10 mL (48.33 mmol) of HMDS was slowly added using a syringe. The reaction mixture was then stirred overnight at 110 °C under reflux. After cooling, the sample was filtered through a glass filter crucible and the solid residue was washed thoroughly with toluene followed by acetone. The washed residue was dried overnight at 30 °C and 10 mbar in a vacuum oven.
2.3. Characterization
The Fourier-transformed infrared (FTIR) spectra were recorded in total internal reflection using a Platinum ATR cell on a Vertex 70 spectrometer (Bruker Optics, Ettlingen, Germany) from 400 to 4500 cm−1 by averaging 16 scans with a spectral resolution of 4 cm−1.
The thermogravimetric measurements were realized with a TG209 F1 Libra (Netzsch Gerätebau GmbH, Selb, Germany). Heating rates of 10 K/min and 1 K/min at a gas flow of 20 mL/min of a N2/O2 mixture (12 parts N2 and 8 parts O2) were used. The thermogravimetric measurements took place in a temperature range of 25–300 °C or in a temperature range of 25–1000 °C. After each measurement up to 1000 °C, a 30 min isotherm at 1000 °C was applied.
The 29Si single-pulse (SP) MAS NMR spectra were recorded on an Avance III HD Ascend 400WB spectrometer (Bruker Corporation, Billerica, MA, USA) using a ZrO2 rotor (4 mm outer diameter). Samples were recorded at a rotational frequency of 13 kHz and a resonant frequency of 79.53 MHz. The measurements were performed with a relaxation time of 20 s and a scan count of 3000–4000 scans. Blank measurements were subtracted from all 29Si SP MAS NMR spectra because there was a light background (sample head) in each measurement. The 29Si SP MAS NMR blank measurement was performed with aluminum oxide as the filler. The liquid NMR spectra were obtained using a Bruker Avance III 400 MHz spectrometer at 79.49 MHz for 29Si NMR.
The CHN elemental analysis was performed using a Vario Micro Cube (Elementar, Langenselbold, Germany).
The X-ray powder diffraction (PXRD) measurements were acquired by applying a D8 Advance diffractometer (Bruker AXS, Karlsruhe, Germany) in a Bragg-Brentano θ-θ geometry (goniometer radius 280 mm). A 2θ range from 7 to 120° (step size: 0.013) was imaged in one hour of scan time. Cu-Kα radiation (λ = 154.0596 pm, 40 kV, 40 mA) was used with a 12 mm thick Ni foil to reduce the Kβ radiation. A variable divergence slit was placed on the primary beam side (irradiated sample area: 10–7 mm). A LYNXEYE 1D detector was used on the secondary beam side.
Visualization of the samples at the nanometer scale was realized using a JEM-2010 transmission electron microscope (Jeol, Akishima, Japan). The samples were viewed on S160-3 carbon-coated copper grids (Plano GmbH, Wetzlar, Germany) at an accelerating voltage of 200 kV. The samples were applied dropwise to the grids as dilute aqueous solutions and dried in air. For the transmission electron microscopy images of undried samples, the sample was coated on a S147-4 carbon film (Plano GmbH, Wetzlar, Germany), blotted for 2 s (pressed between two filter papers), and snap frozen at −165 °C with liquid ethane. The prepared sample was transferred under liquid nitrogen into a model 914 cryo-TEM sample holder (Gatan, Pleasanton, CA, USA). The sample was examined at an accelerating voltage of 200 kV in a JEM-2100 LaB6 transmission electron microscope (Jeol, Akishima, Japan) at −170 °C under gentle conditions. The TEM images were captured using an Orius SC1000 CCD camera (Gatan, Pleasanton, CA, USA) at an exposure time of 2 s.
The scanning electron microscopy (SEM) images were obtained using an SEM-7000 (Jeol, Akishima, Japan) after the sample was placed on a specimen slide with carbon foil adhered and sputtered with a thin layer of gold.
A Quanta 400 FEG (FEI, ThermoFisher, Waltham, MA, USA) was used to observe the in situ freeze-drying by means of an environmental scanning electron microscope (ESEM). These were secondary electron images in ESEM mode (GSAD detector) and high vacuum mode (ETD detector), respectively, at a 10 kV accelerating voltage. The in situ freeze-drying was performed using a Peltier table (FEI, ThermoFisher, Waltham, MA, USA). Samples were introduced in gel form (wet) at 3 °C on a pre-cooled sample carrier while maintaining the aggregate state. A sufficient amount of warm water was placed next to the Peltier table to prevent the samples from drying out during the pump-down process. The freeze-drying was started at a temperature of 3 °C and a pressure of 800 Pa. Subsequently, at regular intervals, the pressure was reduced by 50 Pa each time and the temperature was also slowly reduced to a temperature of −25 °C to perform the in situ freeze-drying.
To determine the surface area, the samples were degassed using a XeriPrep degasser (Quantachrome, Boynton Beach, FL, USA) at 40 °C in a vacuum, and the nitrogen sorption measurements were performed using a Quadrasorb EVO (Quantachrome, Boynton Beach, FL, USA). Six points of the N2 adsorption isotherm were measured in the pressure range P/P0 from 0.05 to 0.3; these points were used to determine the surface area using the BET method.
The dynamic light scattering (DLS) was performed on an ALV/CGS-3 compact goniometer system (ALV GmbH, Langen, Germany) with an ALV/LSE-5003 correlator (ALV GmbH, Langen, Germany) at an angle of 90°. The measurements were performed at 20 °C with 10 scans with 20 s measured for each scan. All measurements were imaged and number-weighted.
3. Results and Discussion
We analyzed and compared dietary supplements that showed obvious variations in their compositions and most likely also in their structure–property relationships. Out of the various dietary supplements, we chose Original Silicea Balsam® (Silicea), Pure Colloidal Silicon (PKS), Flügge Siliceous Earth (FlKe), and BioSil® as different representatives of silicon sources for oral intake. Silicea is a cloudy, highly viscous gel that consists of silicon dioxide in an aqueous medium. PKS is also silicon dioxide in an aqueous medium, but it is clear with a slight blue coloration and a water-like viscosity. Flügge Siliceous Earth is a dry white powder that is produced from purified diatom sediments. BioSil®, on the other hand, consists of soluble silica in a mixture of water, glycerol, and choline. Two of the four dietary supplements (Silicea and PKS) considered in this paper are colloidal condensed silica in an aqueous medium. The other products considered are dry silica and choline-stabilized silica in a mixture of water and glycerol.
FTIR and 29Si SP MAS NMR spectroscopy and a thermogravimetric analysis (TGA) were used to characterize the two products in which the precipitated silica was present in an aqueous dispersion. The FTIR spectra of the untreated aqueous dispersions of Silicea and PKS showed only the typical water stretching vibration bands at 3000–3800 cm−1 and the deformation vibration band at 1632 cm−1, but no signals for the included silica structures [25,26]. Hence, an analysis of the silica in the untreated products with water contents of 97.2% (Silicea) and 95.6% (Pure Geosilica) was not possible. The high water content also made it impossible to analyze the included silica compounds via other analytical methods such as solid-state 29Si NMR or TGA due to their low concentrations. Therefore, for both samples the water had to be removed by using a drying process. However, conventional drying by a temperature treatment was not an option because this could lead to a change in the network structure due to Si-OH condensation reactions and thus the treated sample would differ from the one applied as a supplement. Consequently, we decided to use relatively gentle freeze-drying for removal of the water. Further condensation of the network due to freeze-drying could not be completely ruled out but should have been much less than with a temperature treatment at higher temperatures [27]. In the following studies, only the freeze-dried samples of Silicea and PKS were used. The two other samples (Flügge Siliceous Earth and BioSil®) were analyzed without prior treatment.
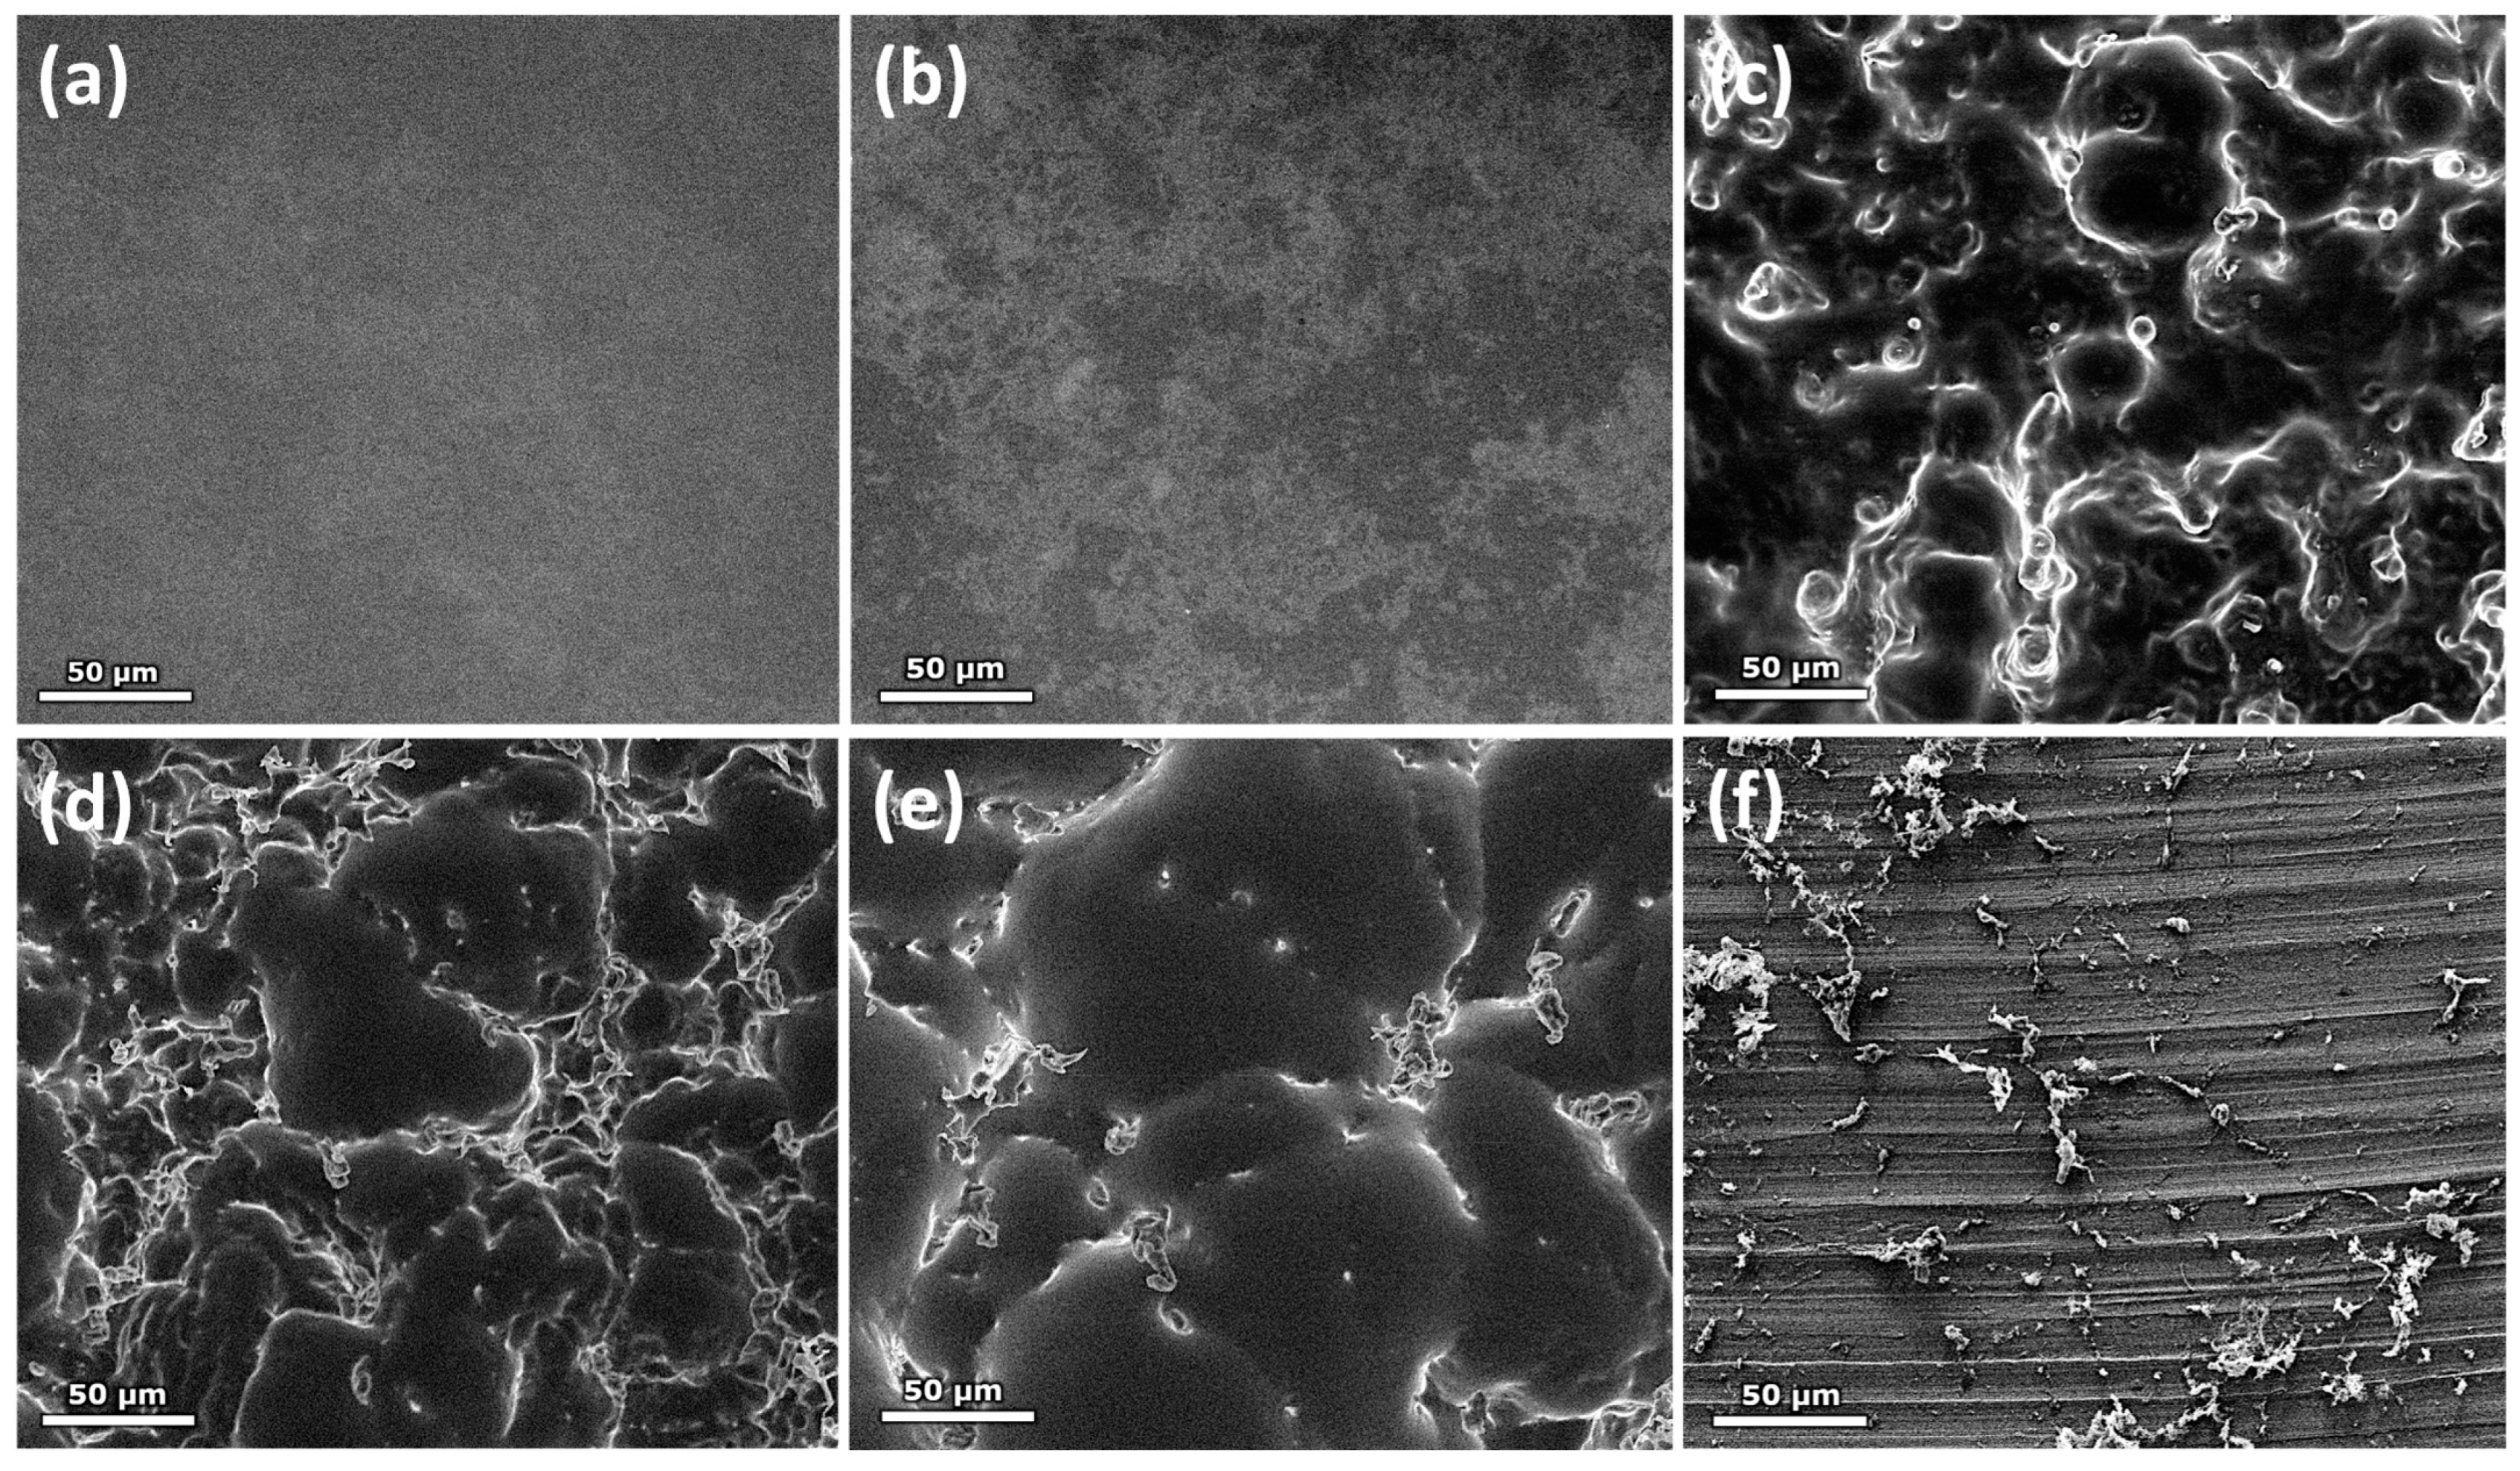
For a first glance at morphology modifications that might have been affected by the freeze-drying process, in the case of Silicea we applied environmental scanning electron microscopy (ESEM). In the image sequence during freeze-drying in the microscope (Figure 1), the compression of the silicon dioxide became visible. Figure 1a,b show the sample still in the non-dried and non-frozen state. Figure 1c shows the point at which the aqueous sample freezes and the SiO2 was compressed by the ice crystals. Figure 1d,e show the loss of the water and the compressed SiO2 becoming more visible from the sample. The completely freeze-dried Silicea sample with the porous structure formed by compression is shown in Figure 1f.
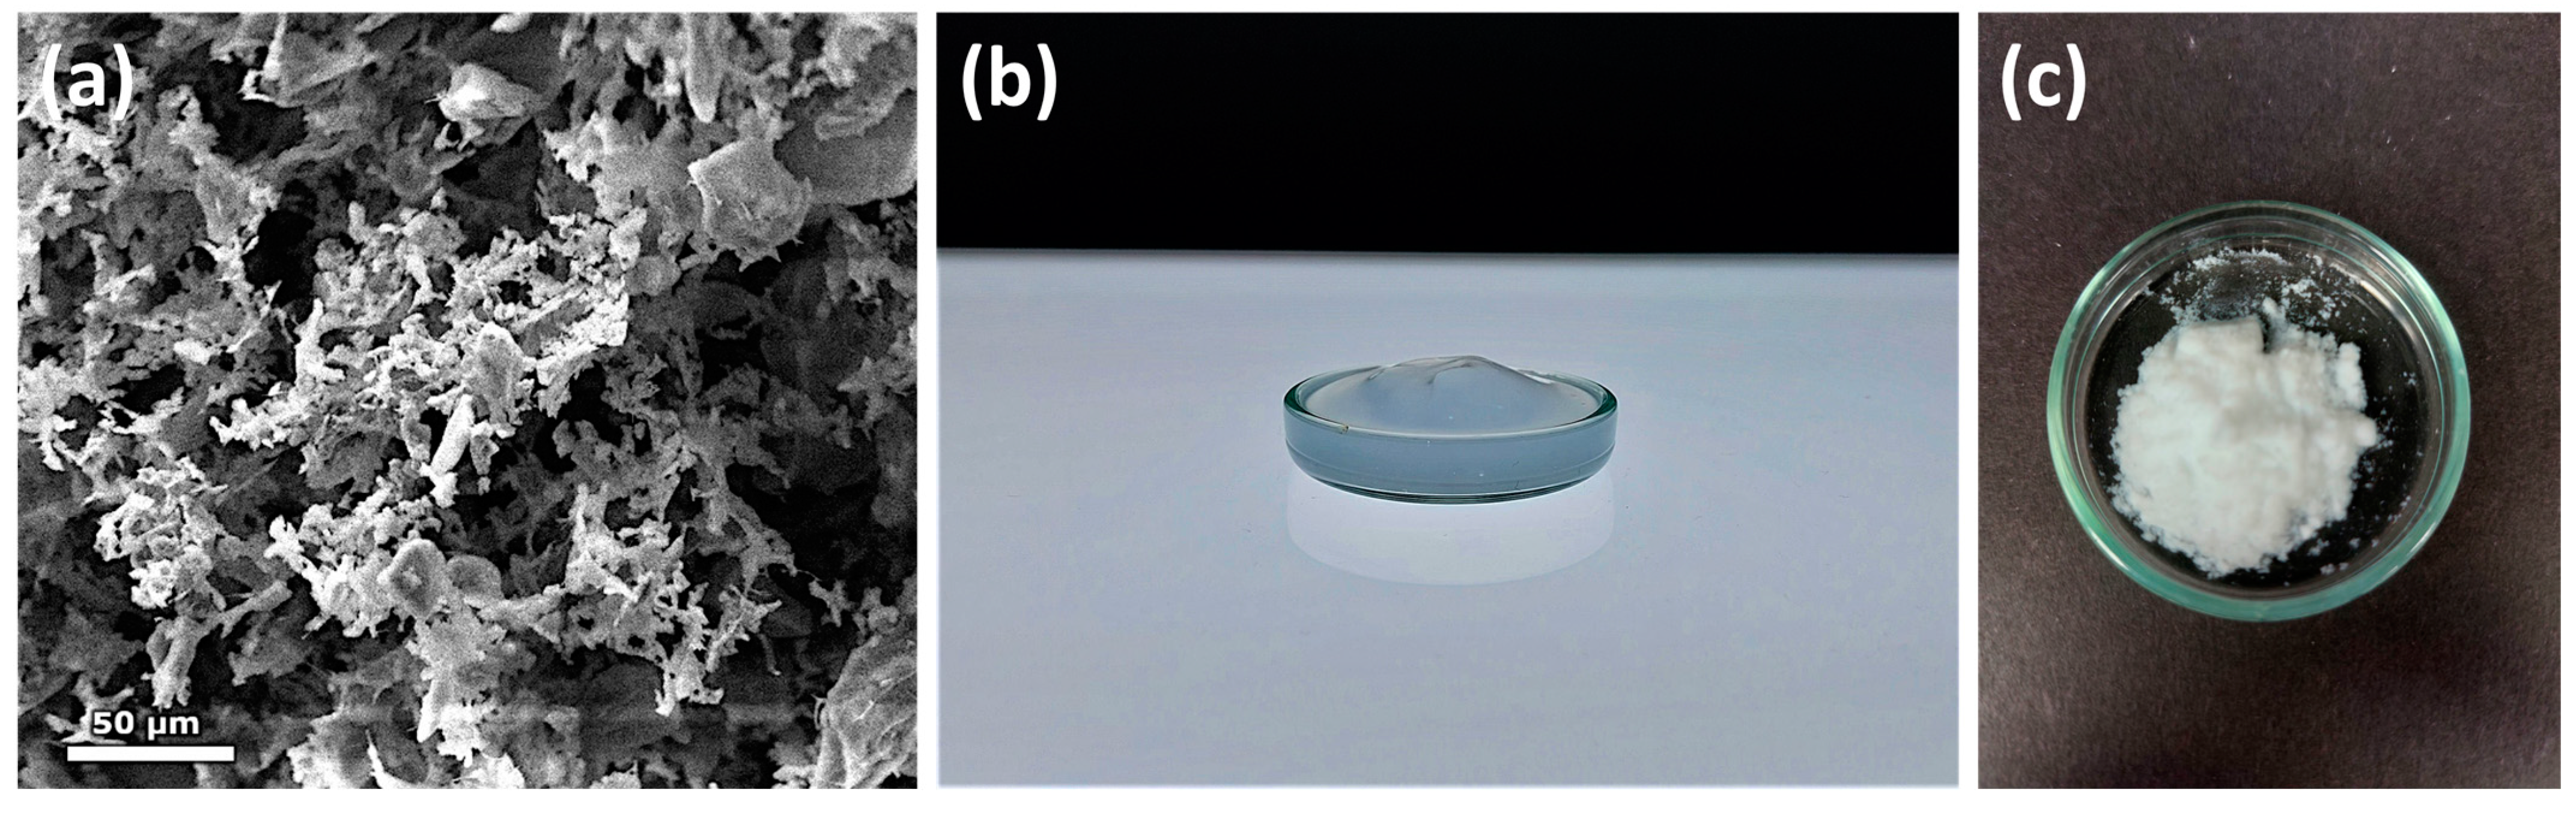
Due to the low amount of SiO2 shown in Figure 1f, another completely freeze-dried area of the same sample is shown in Figure 2a, in which the high porosity of the final structure could be better observed after freeze-drying.
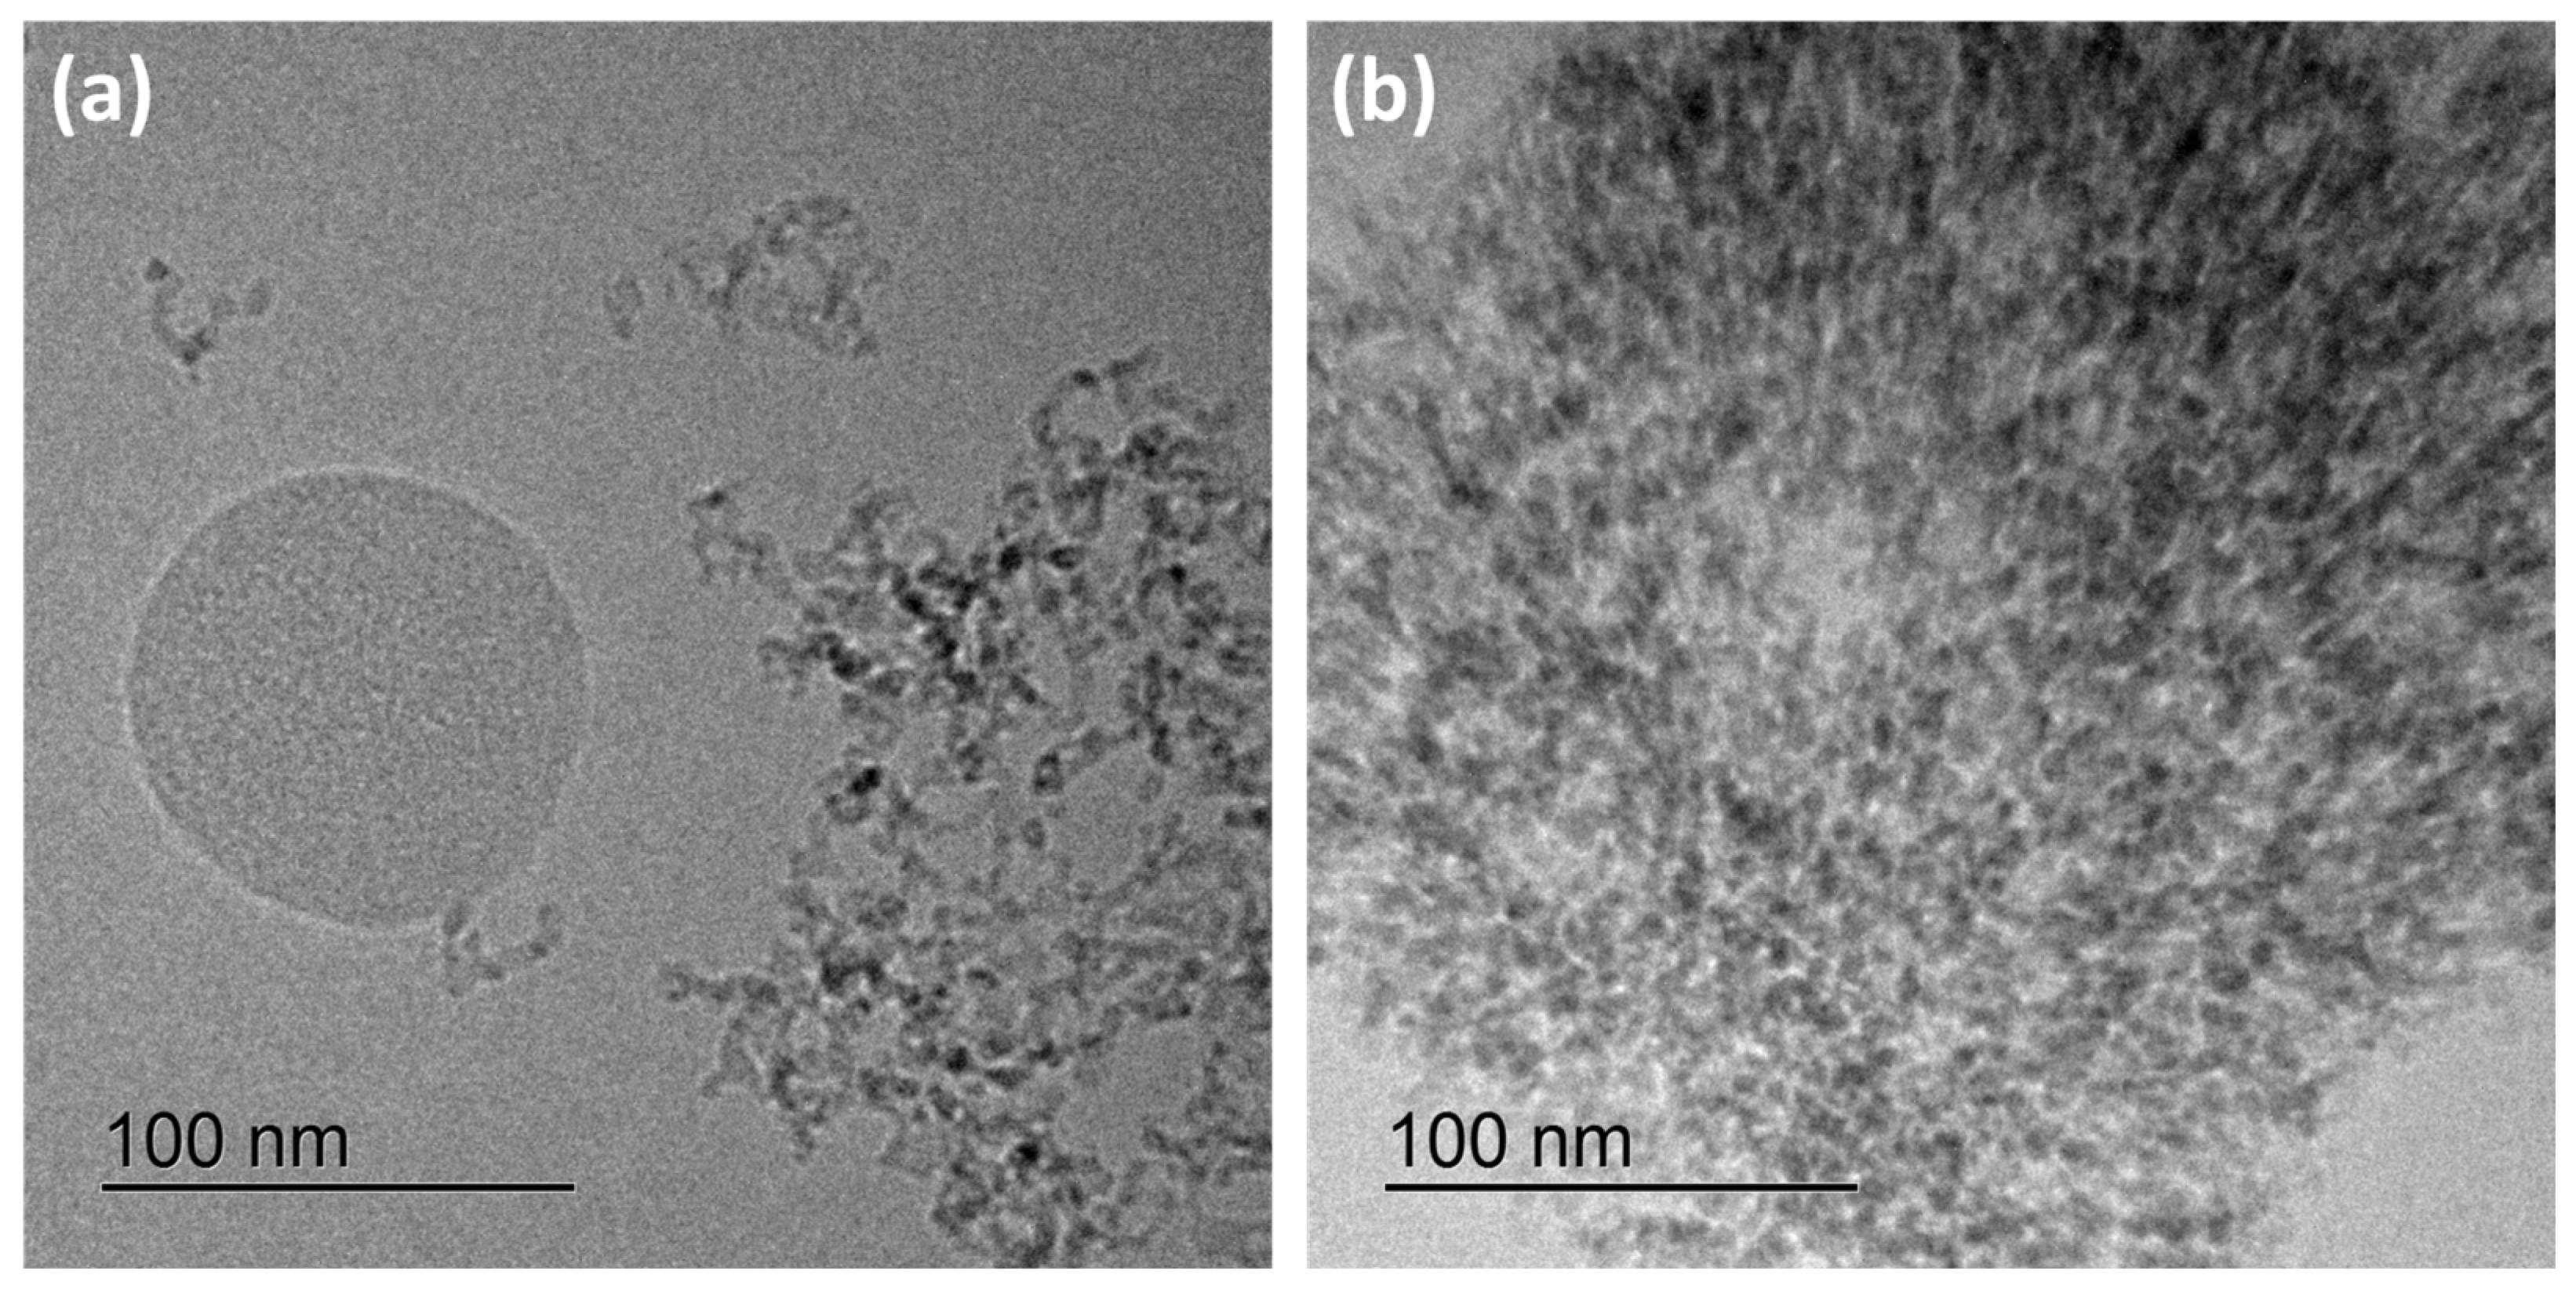
The cryo-TEM images of the Silicea also revealed the compression and the change in morphology during freeze-drying. The network structure of the primary particles was significantly denser in the suspension of the freeze-dried Silicea in water (Figure 3b) than in the non-dried Silicea (Figure 3a). This underpinned the ESEM observations that the Silicea morphology was compressed during the freeze-drying process. However, an exact statement regarding the condensation of Si-OH groups during the freeze-drying could not be made because no analysis of the cross-linking of the untreated Silicea gel was possible. We applied the cryo-electron microscopic studies only to the Silicea and assumed that freeze-drying even had the same or a less pronounced effect on the colloidal structure of the PKS. It was reported in the literature on silica nanoparticles that freeze-drying led to fewer condensation reactions than drying via heat treatment [28]. Consequently, the Silicea and PKS products were characterized in the following in their freeze-dried states and the FlKe and BioSil® were analyzed without prior drying.
3.1. Characterization of Silicea
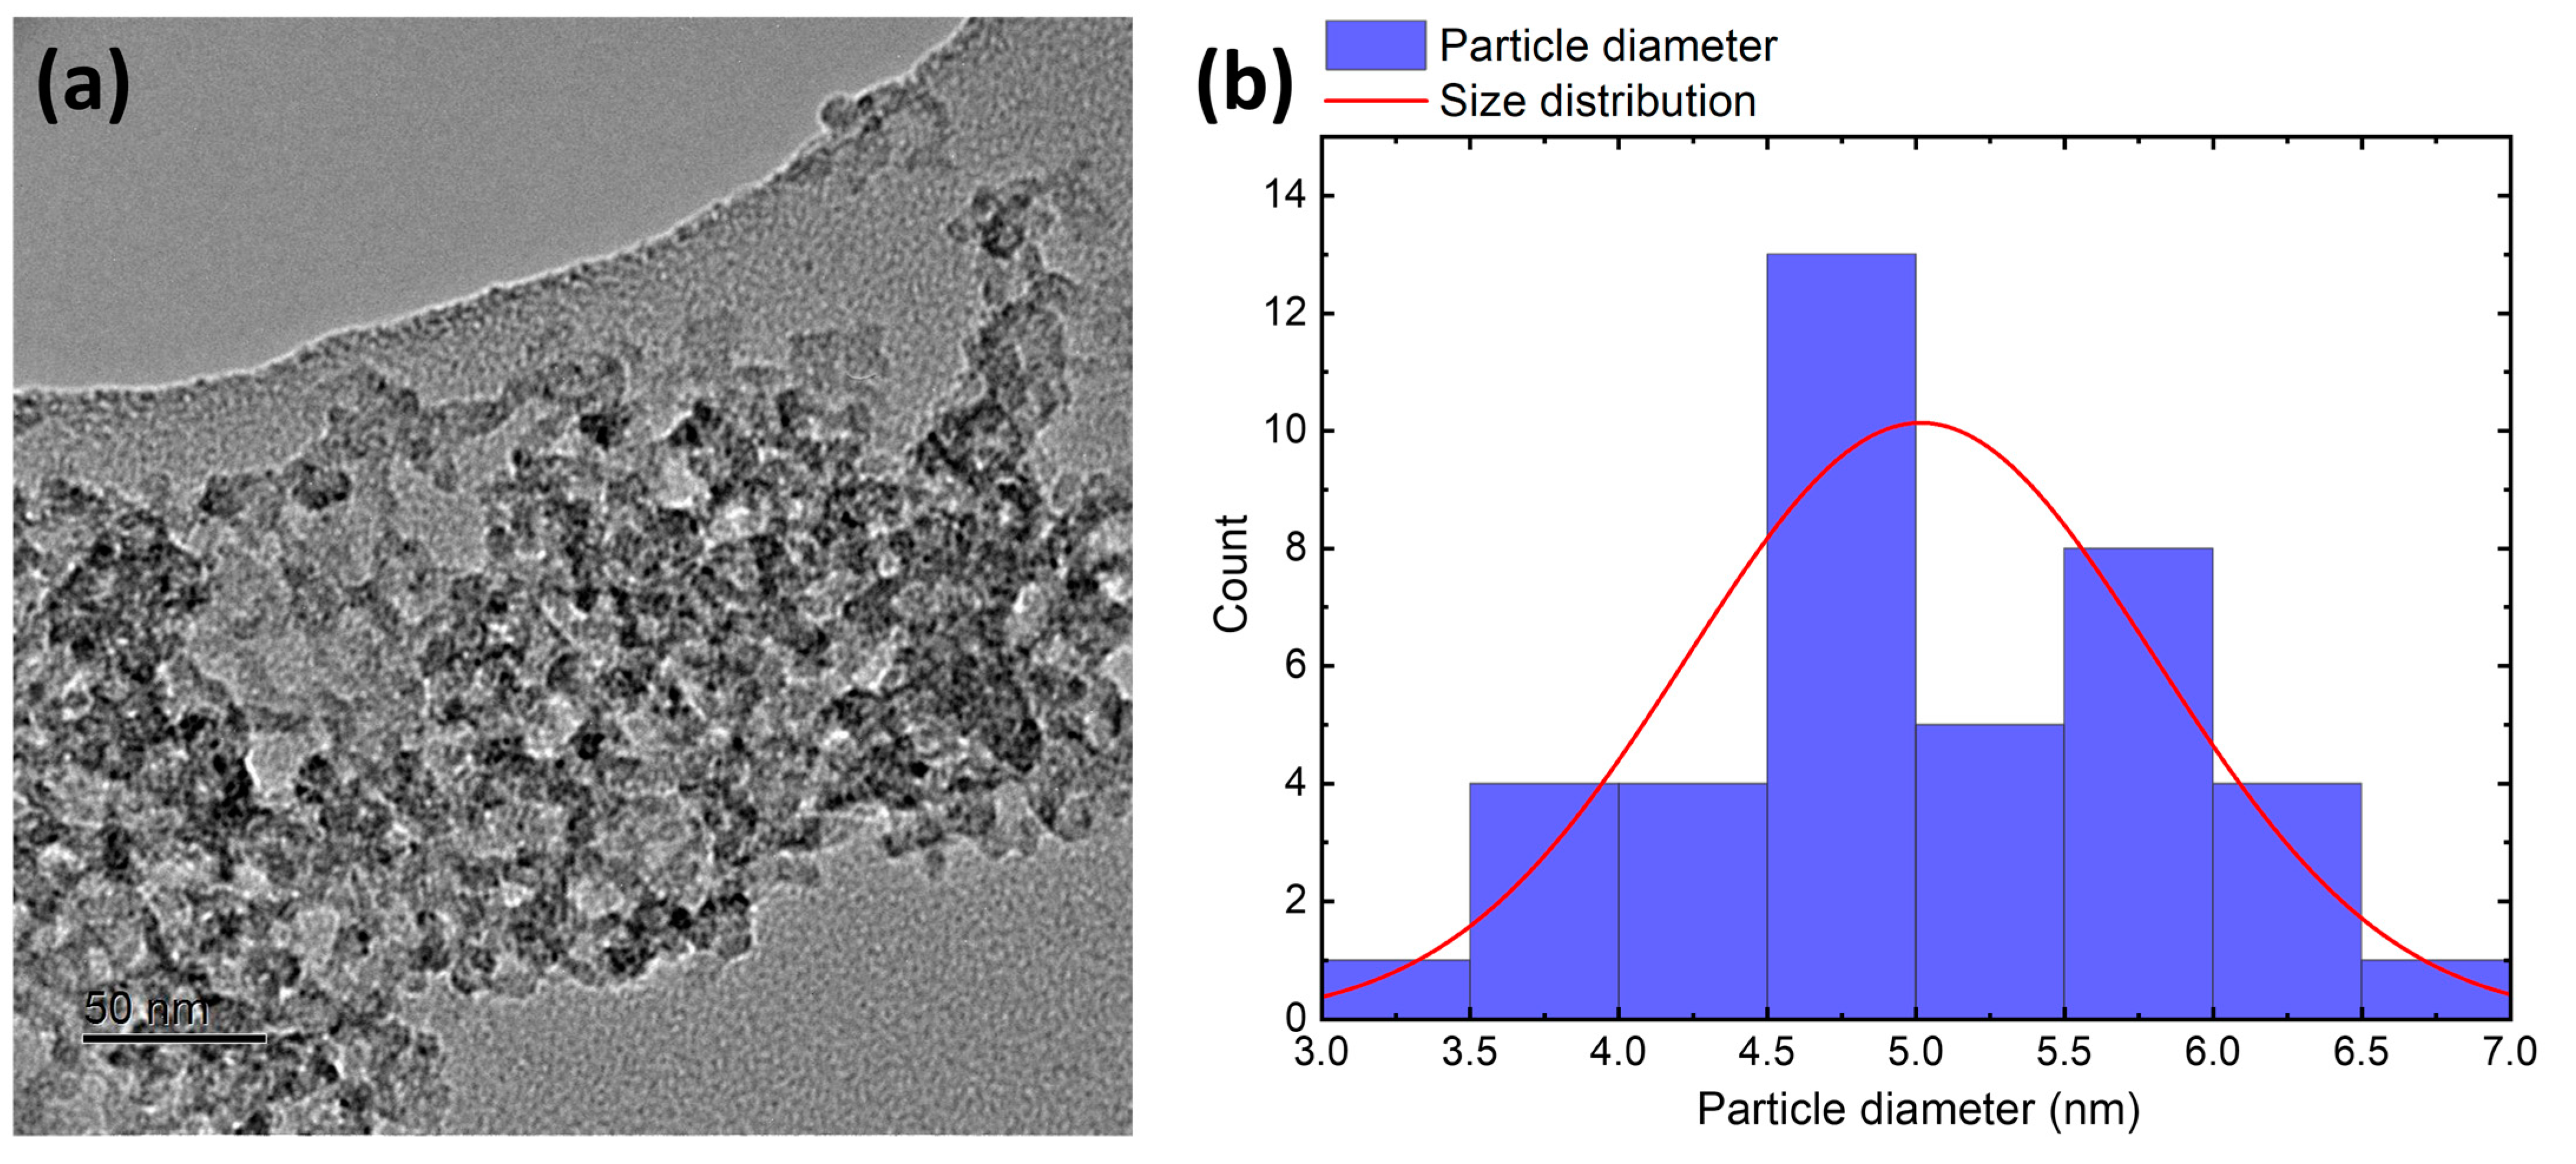
The TEM measurements were used to analyze the radii of the primary particles in the Silicea (Figure 4a). The TEM imaging was carried out with the non-freeze dried Silicea gel, which was dried under air at the TEM mesh. The images showed strongly agglomerated and aggregated SiO2 particles with an average particle diameter of 5.01 ± 0.787 nm (Figure 4b). In the literature, the primary particle diameters (7–14 nm) were reported for precipitated silica [29]. Differences in the primary particle diameters in the samples were based on variations in the reaction conditions and TEM sample preparation.
The aggregates/agglomerates showed a fluffy network that resembled the ones observed in the literature for precipitated silica [29,31].
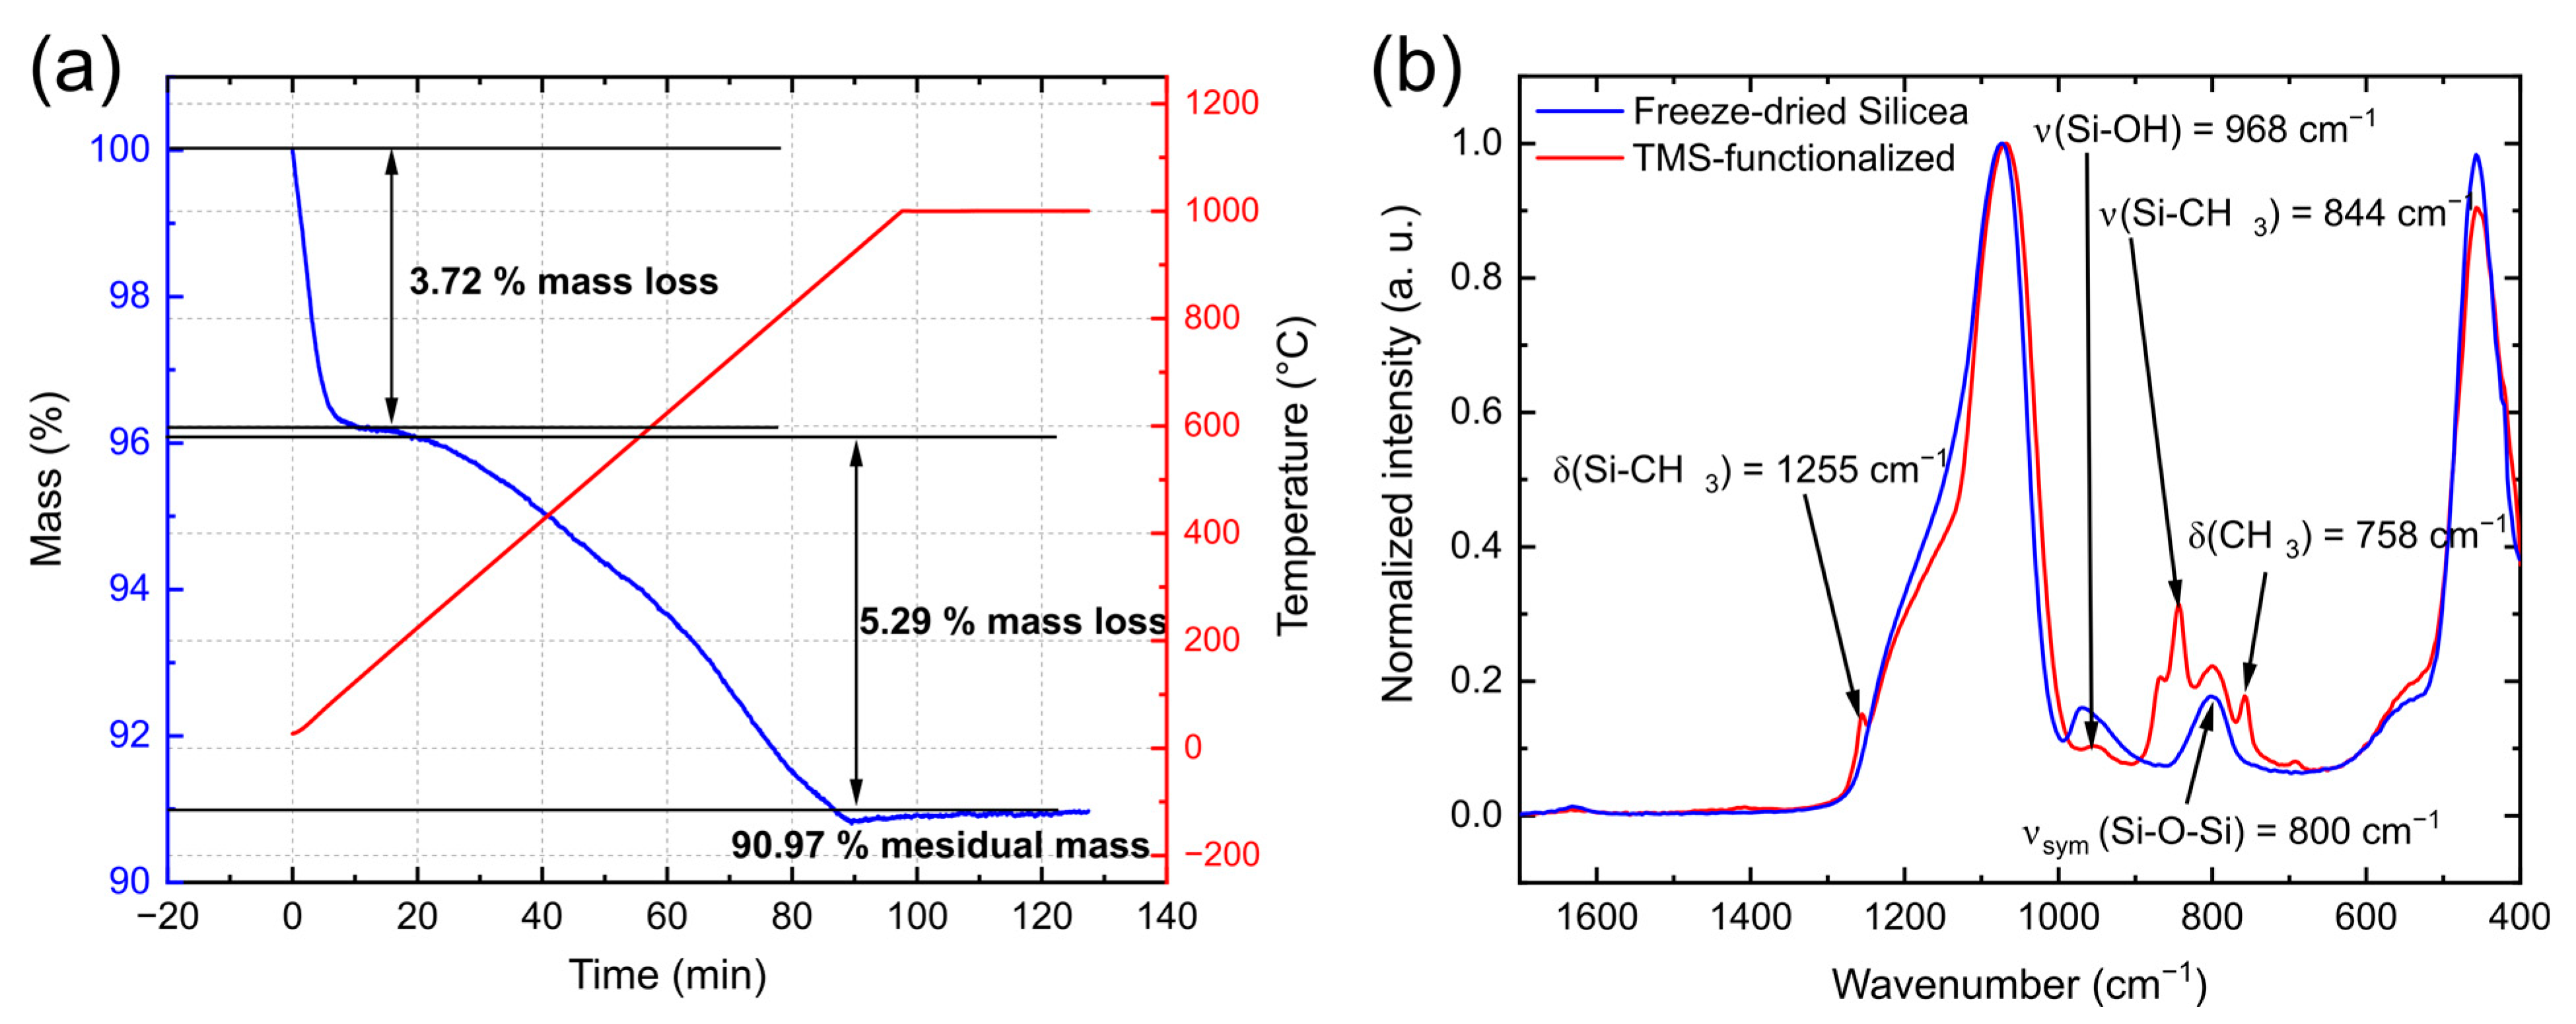
After freeze-drying, the original turbid, highly viscous gel (Figure 2b) was transformed into a fine, white solid (Figure 2c) that was further analyzed via TGA, FTIR, 29Si SP MAS NMR, and nitrogen sorption measurements. The TGA of the freeze-dried Silicea (Figure 5a) showed a total mass loss of 9.03% that could be separated into two thermal events. A mass loss of 3.72% in the temperature range of 25–120 °C was due to water that could not be removed during freeze-drying or that was re-adsorbed after the freeze-dried Silicea was handled in air [32,33,34]. A further mass loss of 5.29% was detected in the temperature range of 200–950 °C that could be attributed to the loss of water due to the condensation reactions of the silanol groups, the loss of water trapped in narrow pores, or the loss of other components the Silicea contained such as sodium chloride [28,32,33,34,35].
In the FTIR spectrum of the freeze-dried Silicea, the bands for the physisorbed water, which were already detected by TGA, were observed on the basis of the broad stretching O-H vibration at 3000–3700 cm−1 and the deformation vibration band at 1630 cm−1 (Figure 5b) [36]. At 1072 cm−1, the characteristic asymmetric stretching vibration band of the Si-O-Si bond was detected as well as the Si-O-Si vibrational bands of the bond at 802 cm−1 and 457 cm−1. The stretching vibration band of the Si-OH group was observed at 968 cm−1, which confirmed the presence of silanol groups [37,38,39,40,41,42,43]. Hence, the FTIR spectrum confirmed that the Silicea did not completely condense during the manufacturing process, but a SiO2 derivative with non-bridging Si-O bonds was formed.
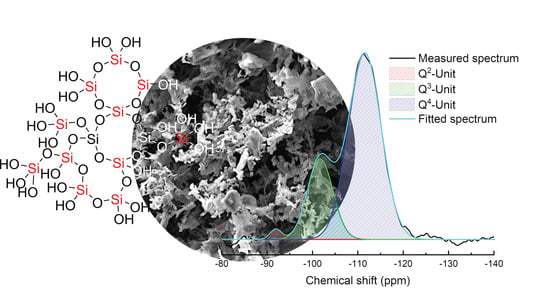
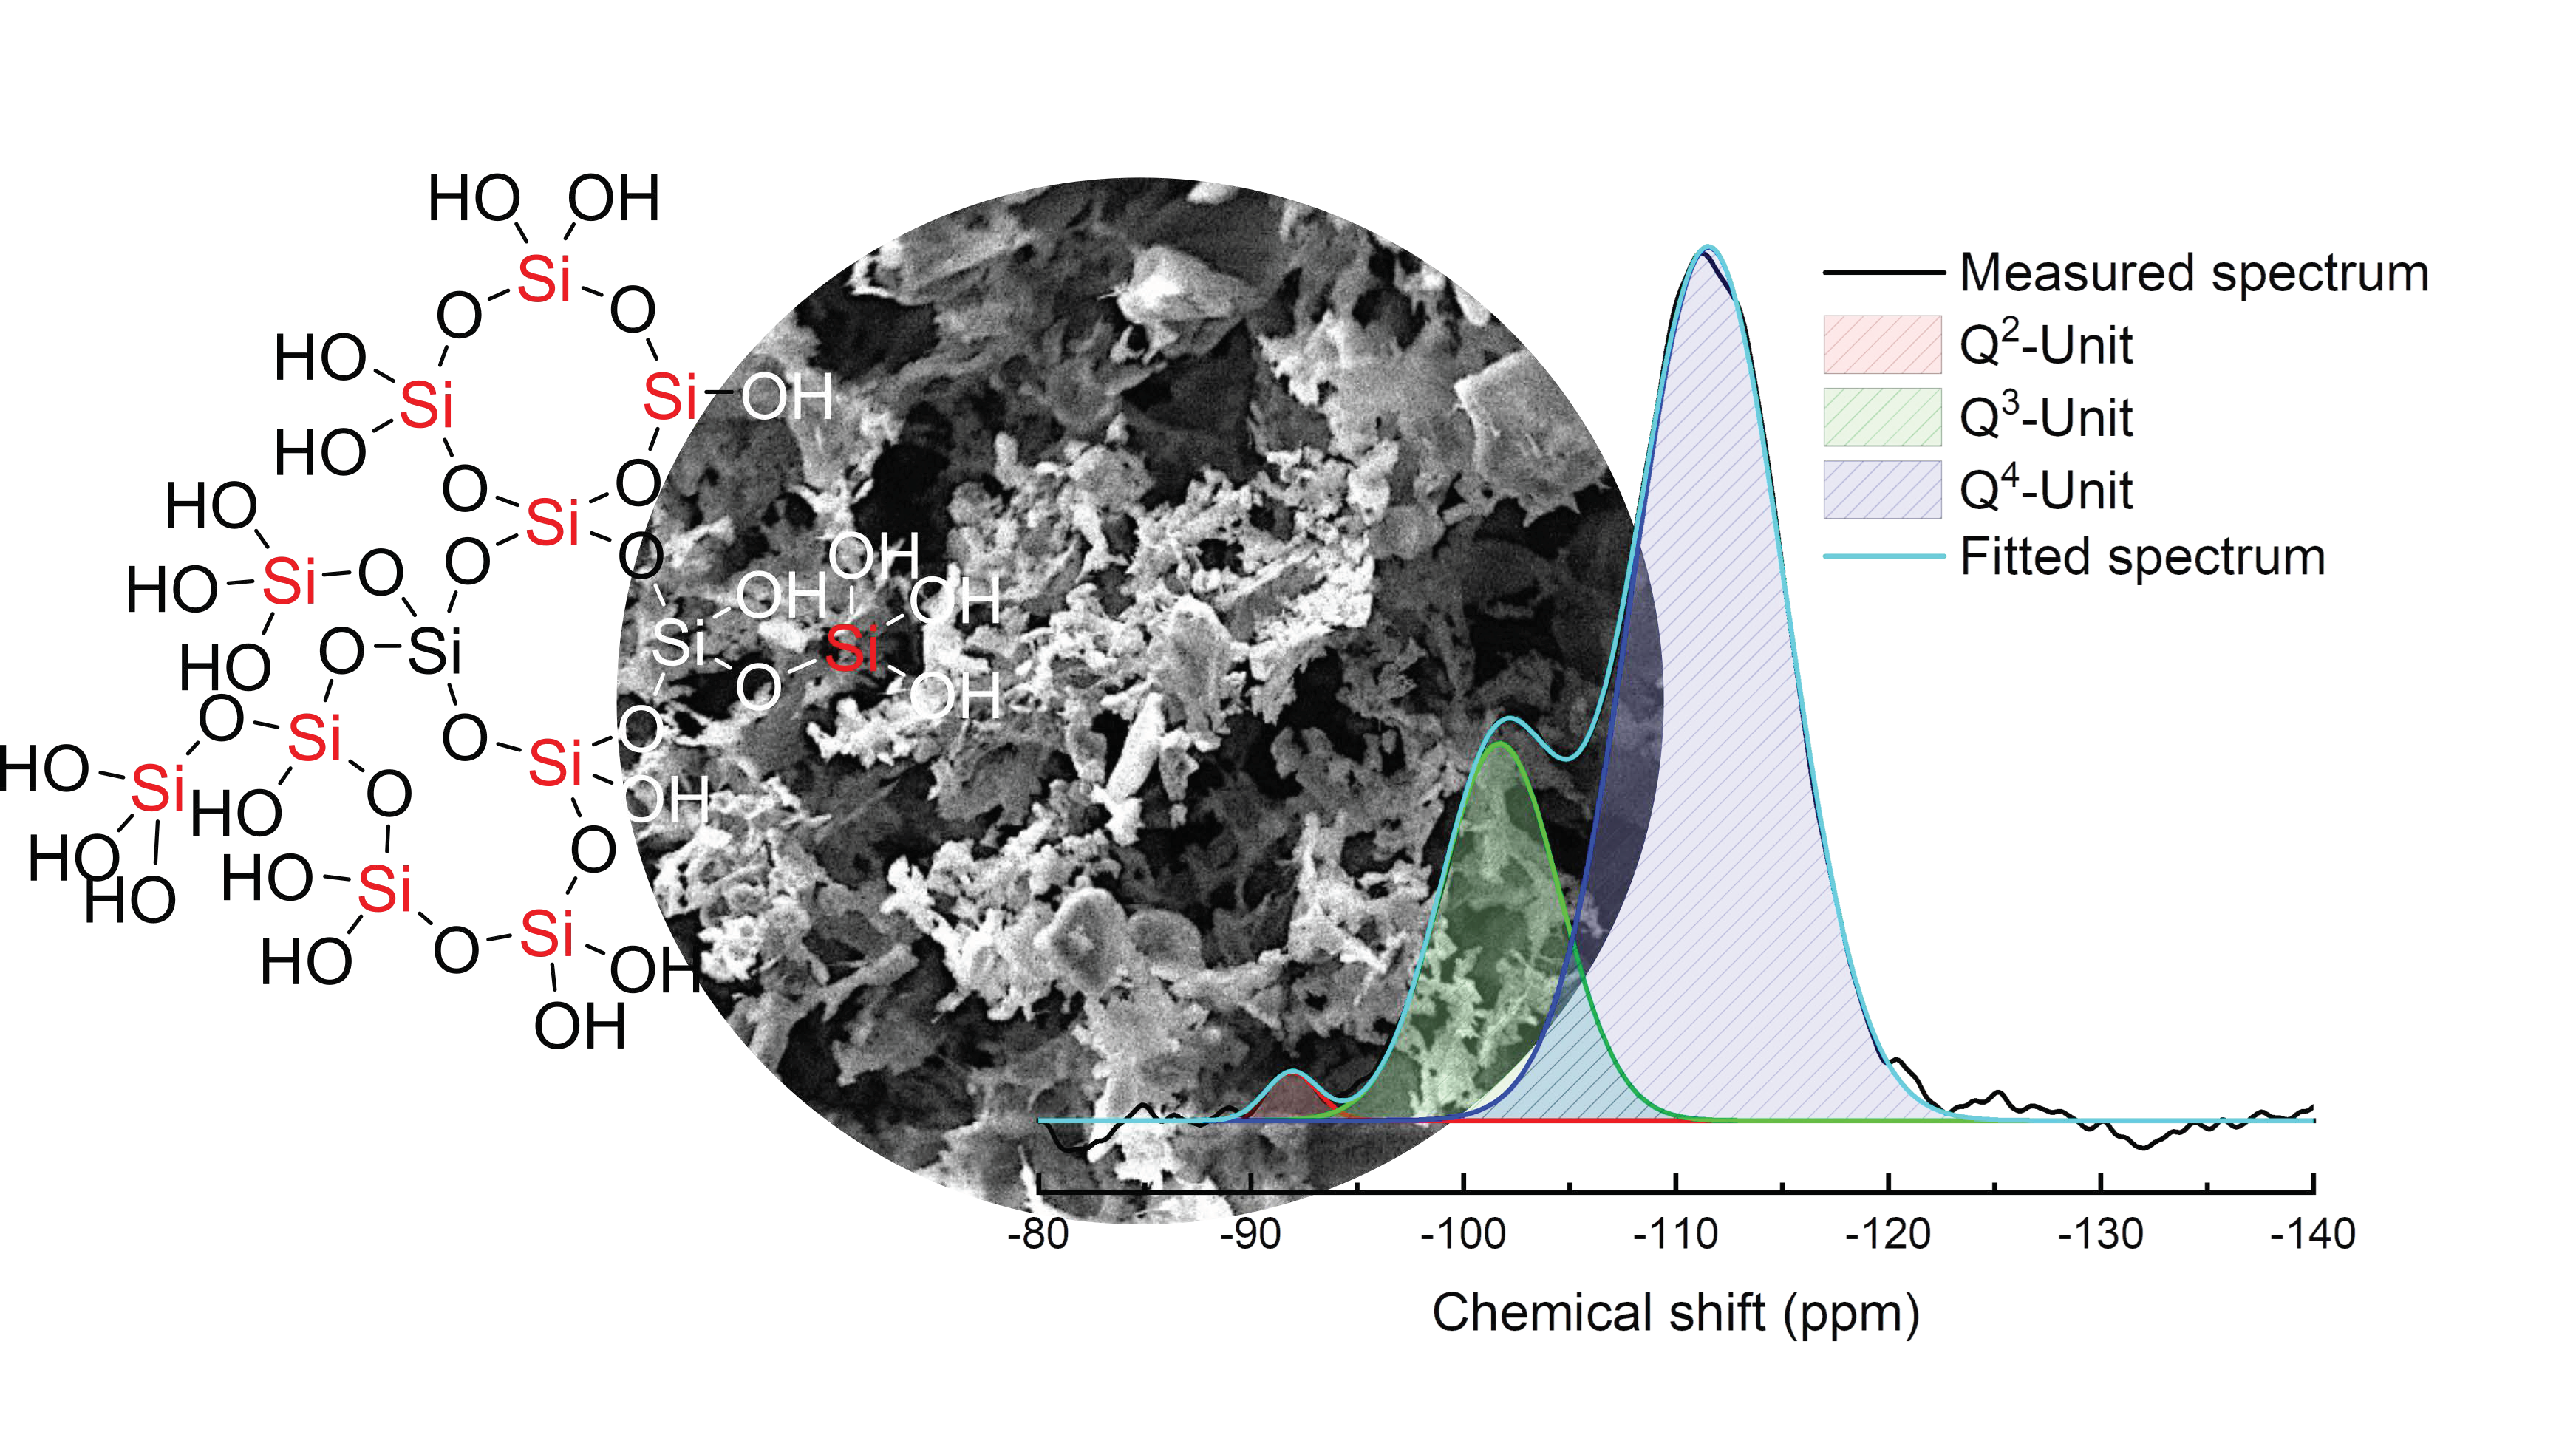
Q2, Q3, and Q4 units were present in the 29Si SP MAS NMR spectrum of the freeze-dried Silicea gel (Figure 6). The intensity of signals increased from Q2 (91 ppm) < Q3 (−102 ppm) < Q4 [44,45,46,47,48,49,50,51]. For a crude estimation of the ratios between the individual Q units, the signals were fitted using Gaussian functions and the integrations of the fitted signals were compared with each other. The obtained distribution is shown in Table 1.
The Si-OH group fraction was calculated by using the integrated area of the Q2 unit twice and that of the Q3 unit once divided by the total of all Q units. In relation to all silicon atoms contained, there were 29% Si-OH groups in the network of the freeze-dried Silicea gel. Thus, despite the rather high degree of cross-linking, there were still many free Si-OH groups present, which may have positively affected the bioactivity of the Silicea [52]. As described previously, the free Si-O group content in the untreated Silicea gel would most likely be higher than in the freeze-dried gel because a slight cross-linking may have occurred during freeze-drying. A literature comparison of highly porous SiO2 samples (MCM and SBA) showed that they had hydroxyl group contents of 28–49% [45]. Thus, the freeze-dried Silicea exhibited similar cross-linking to the porous SiO2 samples in the literature.
The highly porous structure of the freeze-dried Silicea resulted in a specific high surface area of 398.7 ± 7.53 m2/g as determined by the nitrogen sorption measurements of the freeze-dried Silicea gel. For comparison, well-ordered mesoporous SiO2 samples (MCM, SBA) showed surface areas between 600 and 1300 m2/g [45]. Nevertheless, the surface area of the freeze-dried Silicea was significantly larger than that of the SiO2 samples, which did not exhibit high degrees of porosity [45,53]. For example, SiO2 nanoparticles prepared via the Stöber method showed surface areas of 4–105 m2/g [53]. A literature comparison of other acid-precipitated silicas showed that they had similar large surface areas (295–675 m2/g) depending on the reaction conditions during their preparations [29,54].
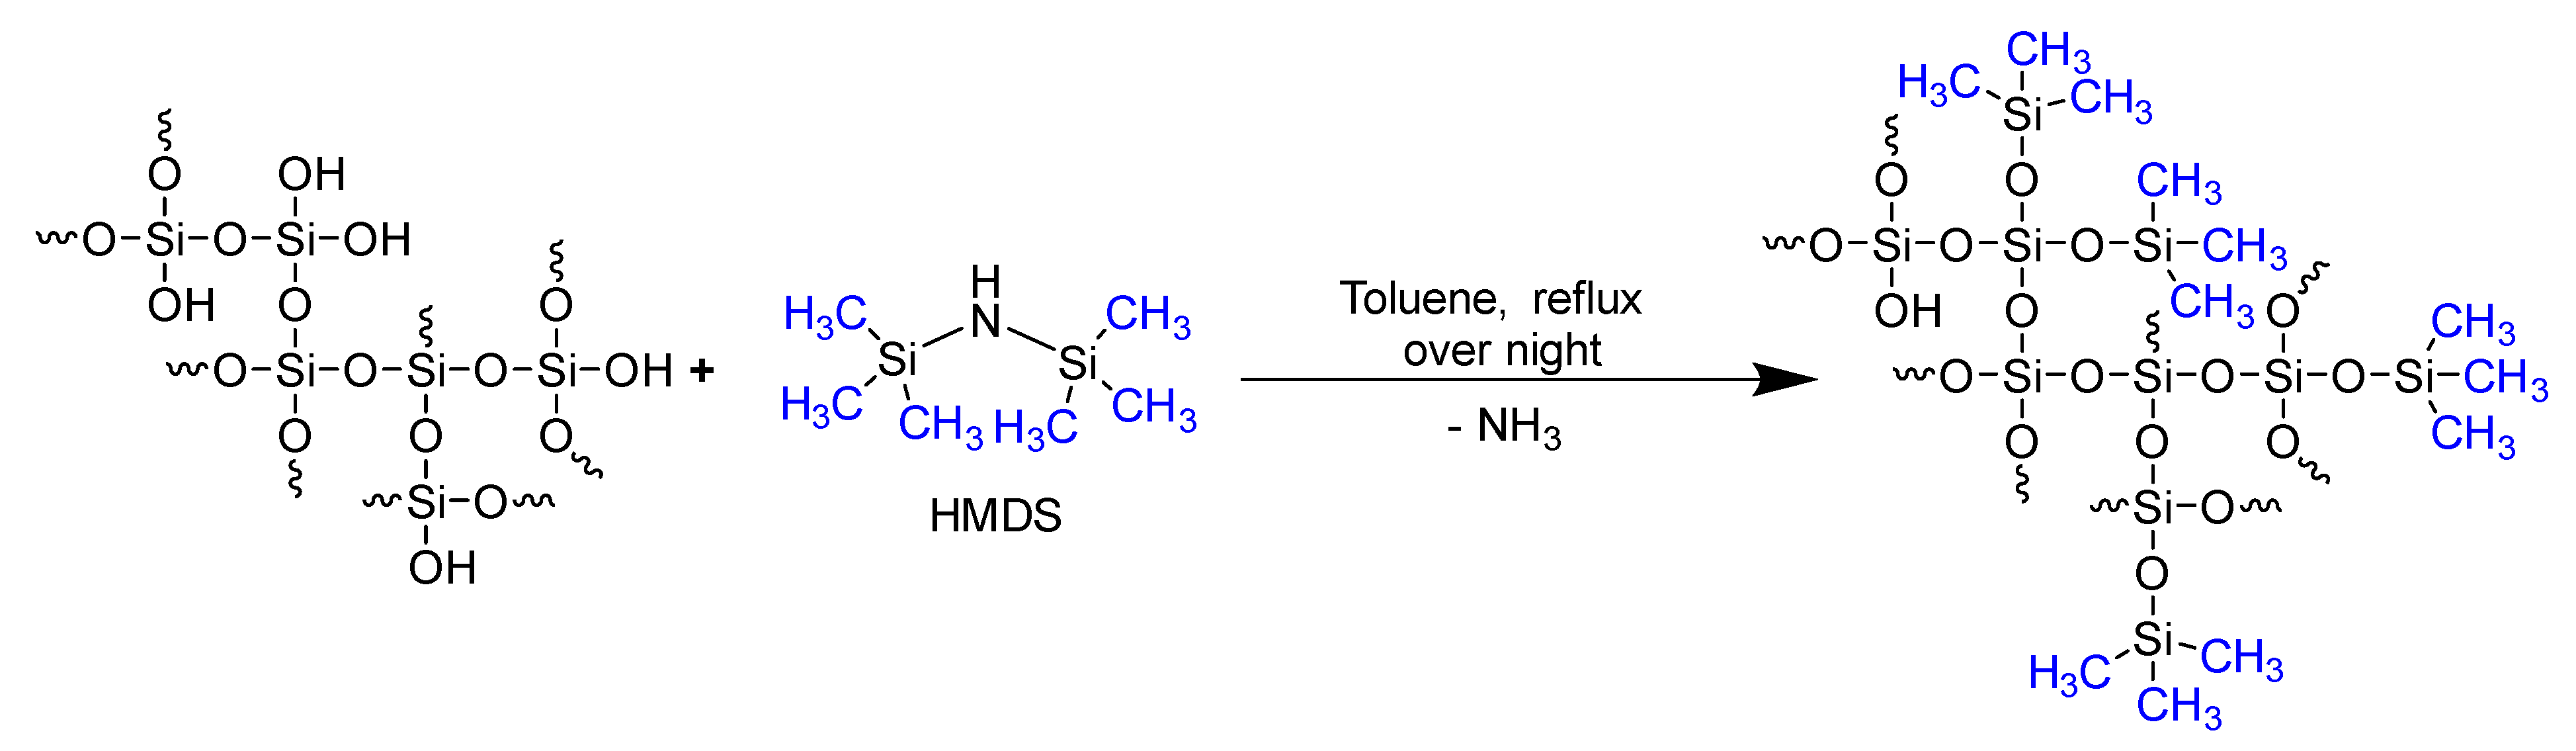
It was difficult to determine the Si-OH content of the Silicea in more detail. While several methods have been described in the literature, we decided to use an organic modification of the accessible silanol groups with hexamethyldisilazane (HMDS), which is a standard method for the functionalization of silanol groups (Figure 7) [55,56,57]. We chose this method because it allowed us to analyze the Si-OH content of the solid samples via TGA measurements and because it did not include the physisorbed water that reacts with HMDS to form hexamethyldisiloxane, which could be easily washed from the solid samples. After functionalization, the accessible OH groups were modified with a trimethylsilyl (TMS) group. The attached organic moiety could be subsequently detected via TGA or CHN analysis, thereby allowing the analysis of the number of Si-OH groups.
After functionalization, the FTIR spectrum revealed the deformation vibration band of Si-C at 1225 cm−1 and the typical stretching vibration band at 844 cm−1 (Figure 5b). Both signals only appeared after the modification and proved a successful attachment of the TMS to hydroxyl groups of the freeze-dried Silicea gel. The signal at 758 cm−1 represented the deformation vibration band of CH3 [50,58,59,60,61,62]. The decrease in the Si-OH stretching vibration band at 968 cm−1 also confirmed a successful conversion.
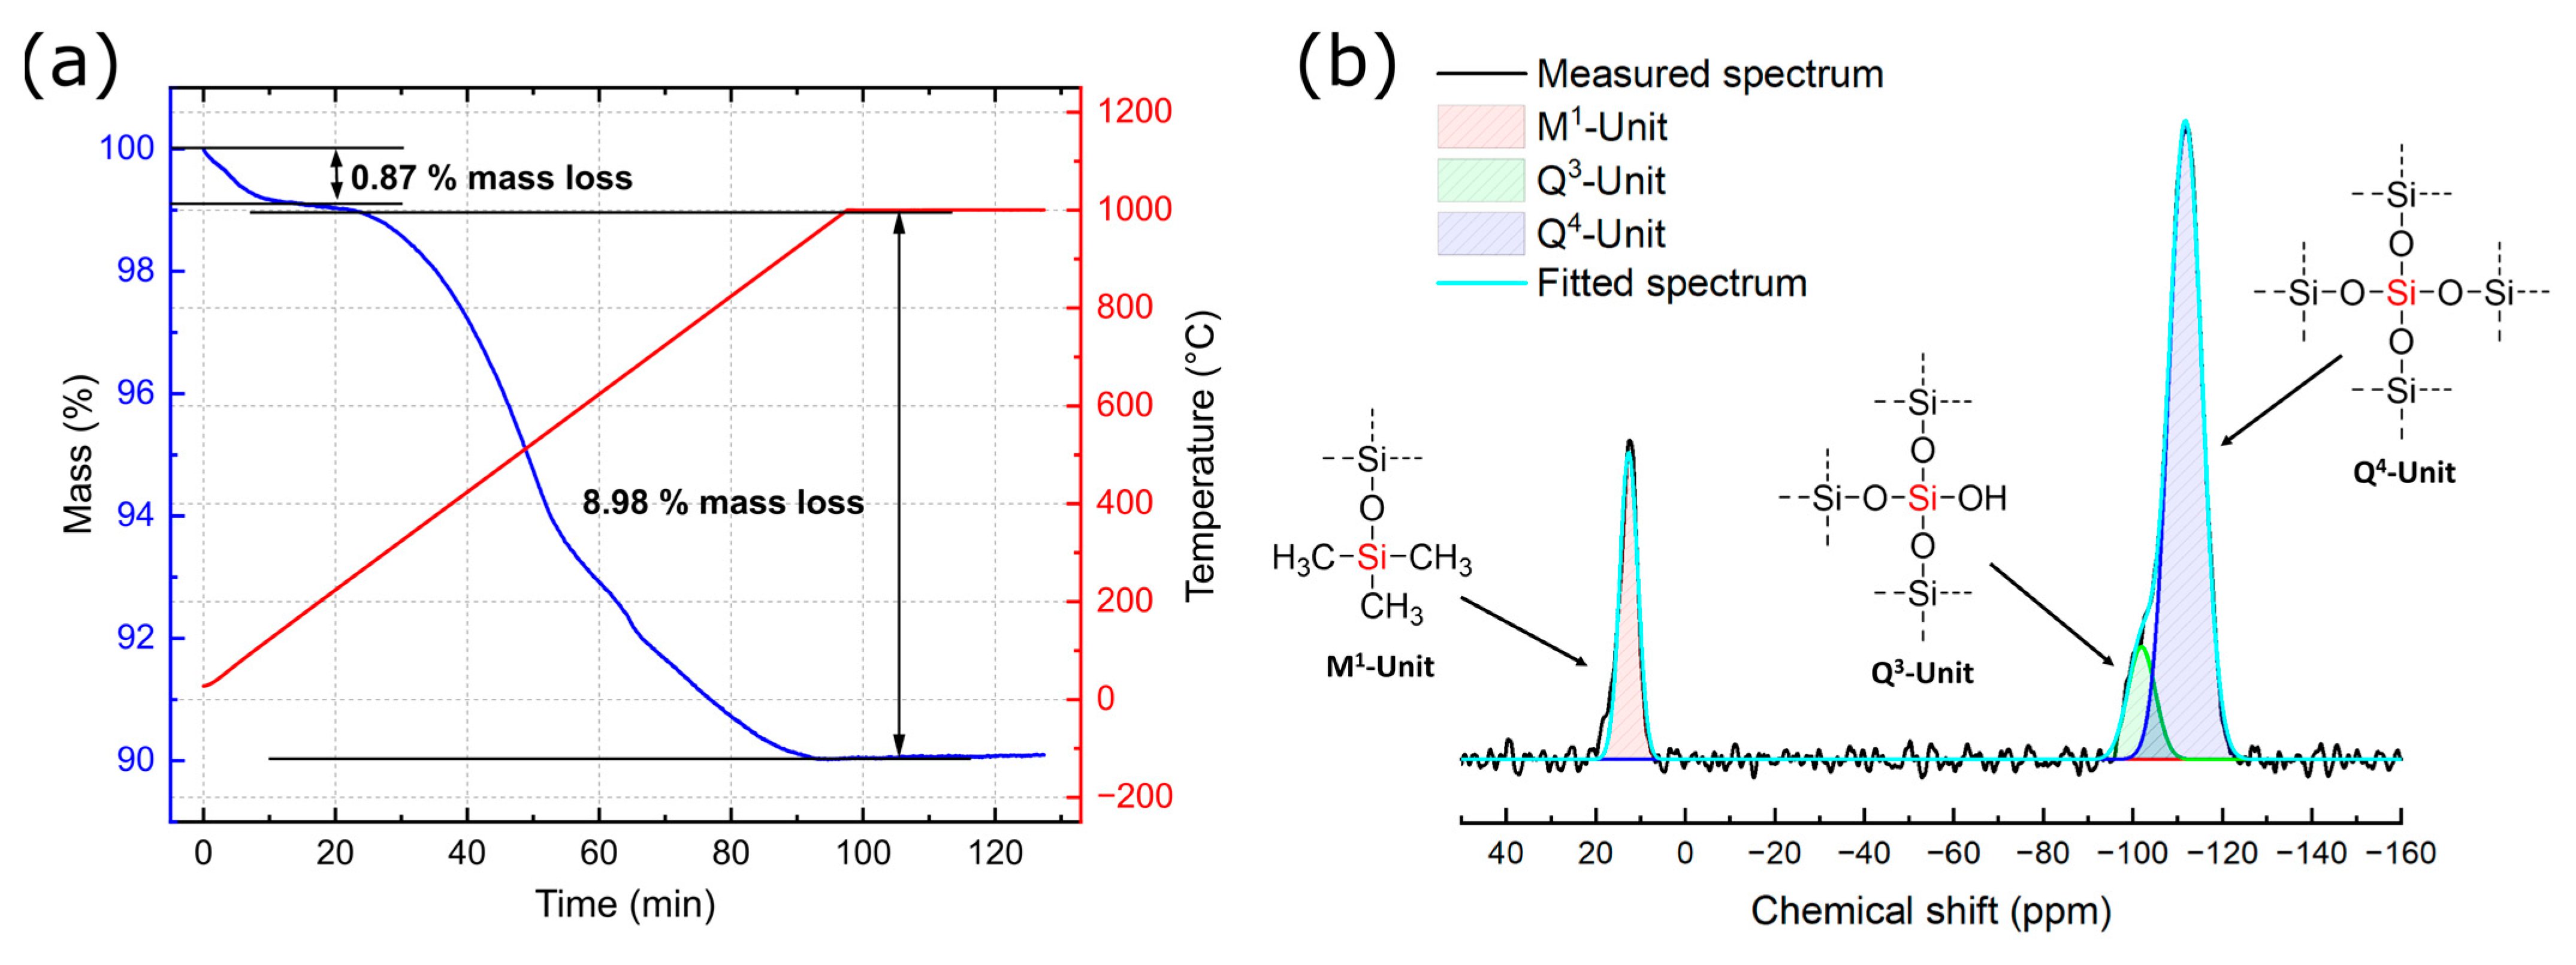
The TGA measurement of the functionalized Silicea (Figure 8a) again showed a typical mass loss of 0.87% for physisorbed water in a temperature range of 25–120 °C, which might be a hint that not all of the Si-OH groups were modified. The residual groups could still interact with water. However, the mass loss was much lower than for the non-functionalized freeze-dried Silicea. A second major mass loss of 8.93% was observed in a temperature range of 250–950 °C; this was significantly larger than for the non-functionalized sample and was based on the decomposition of the TMS groups.
In the 29Si SP MAS NMR spectrum (Figure 8b) of the functionalized freeze-dried Silicea, an additional signal of M1 units (12.2 ppm) was observed in addition to the signals of the Q3 (−101.8 ppm) and Q4 units (−111.9 ppm) [44,45,46,47,48,50,51,63,64]. This signal confirmed the successful functionalization of silanol groups with trimethylsilyl groups. The percentages of each Q unit and hydroxyl groups were calculated by fitting the signals with Gaussian functions and subsequent integration (Table 1). A comparison of the results with the non-functionalized freeze-dried Silicea gel showed that there was a decrease in the Q2 units by 2% and a decrease in the Q3 units by 12%. Thus, a 15% increase in the Q4 units evidently resulted from the attachment of TMS groups to free silanol groups. The Si-OH content relative to the total of all silicon centers decreased by 16% due to the functionalization. Thus, more than half of all Si-OH groups could be functionalized in the reaction with HMDS. The other non-functionalized groups were most likely blocked for functionalization; for example, in porous structures.
The elemental analysis determined a carbon content of 6.42% and a hydrogen content of 1.95%, which resulted in a calculated amount of 5.35 mmol carbon per gram of the functionalized sample. Based on this value, we were able to determine an overall Si-OH group content of 1.78 mmol/g. The quantification could not be performed using TGA because the mass loss of the organics overlapped with the mass loss due to condensation.
3.2. Characterization of the PKS Product
Like Silicea, PKS is also an aqueous system that contains dispersed SiO2. Contrary to Silicea, PKS is not a highly viscous gel but a clear aqueous suspension with a viscosity very similar to water. The sample contained 95.6% water as determined by TGA in a temperature range of 25–120 °C. Therefore, the water content was only slightly lower in the PKS than in the Silicea.
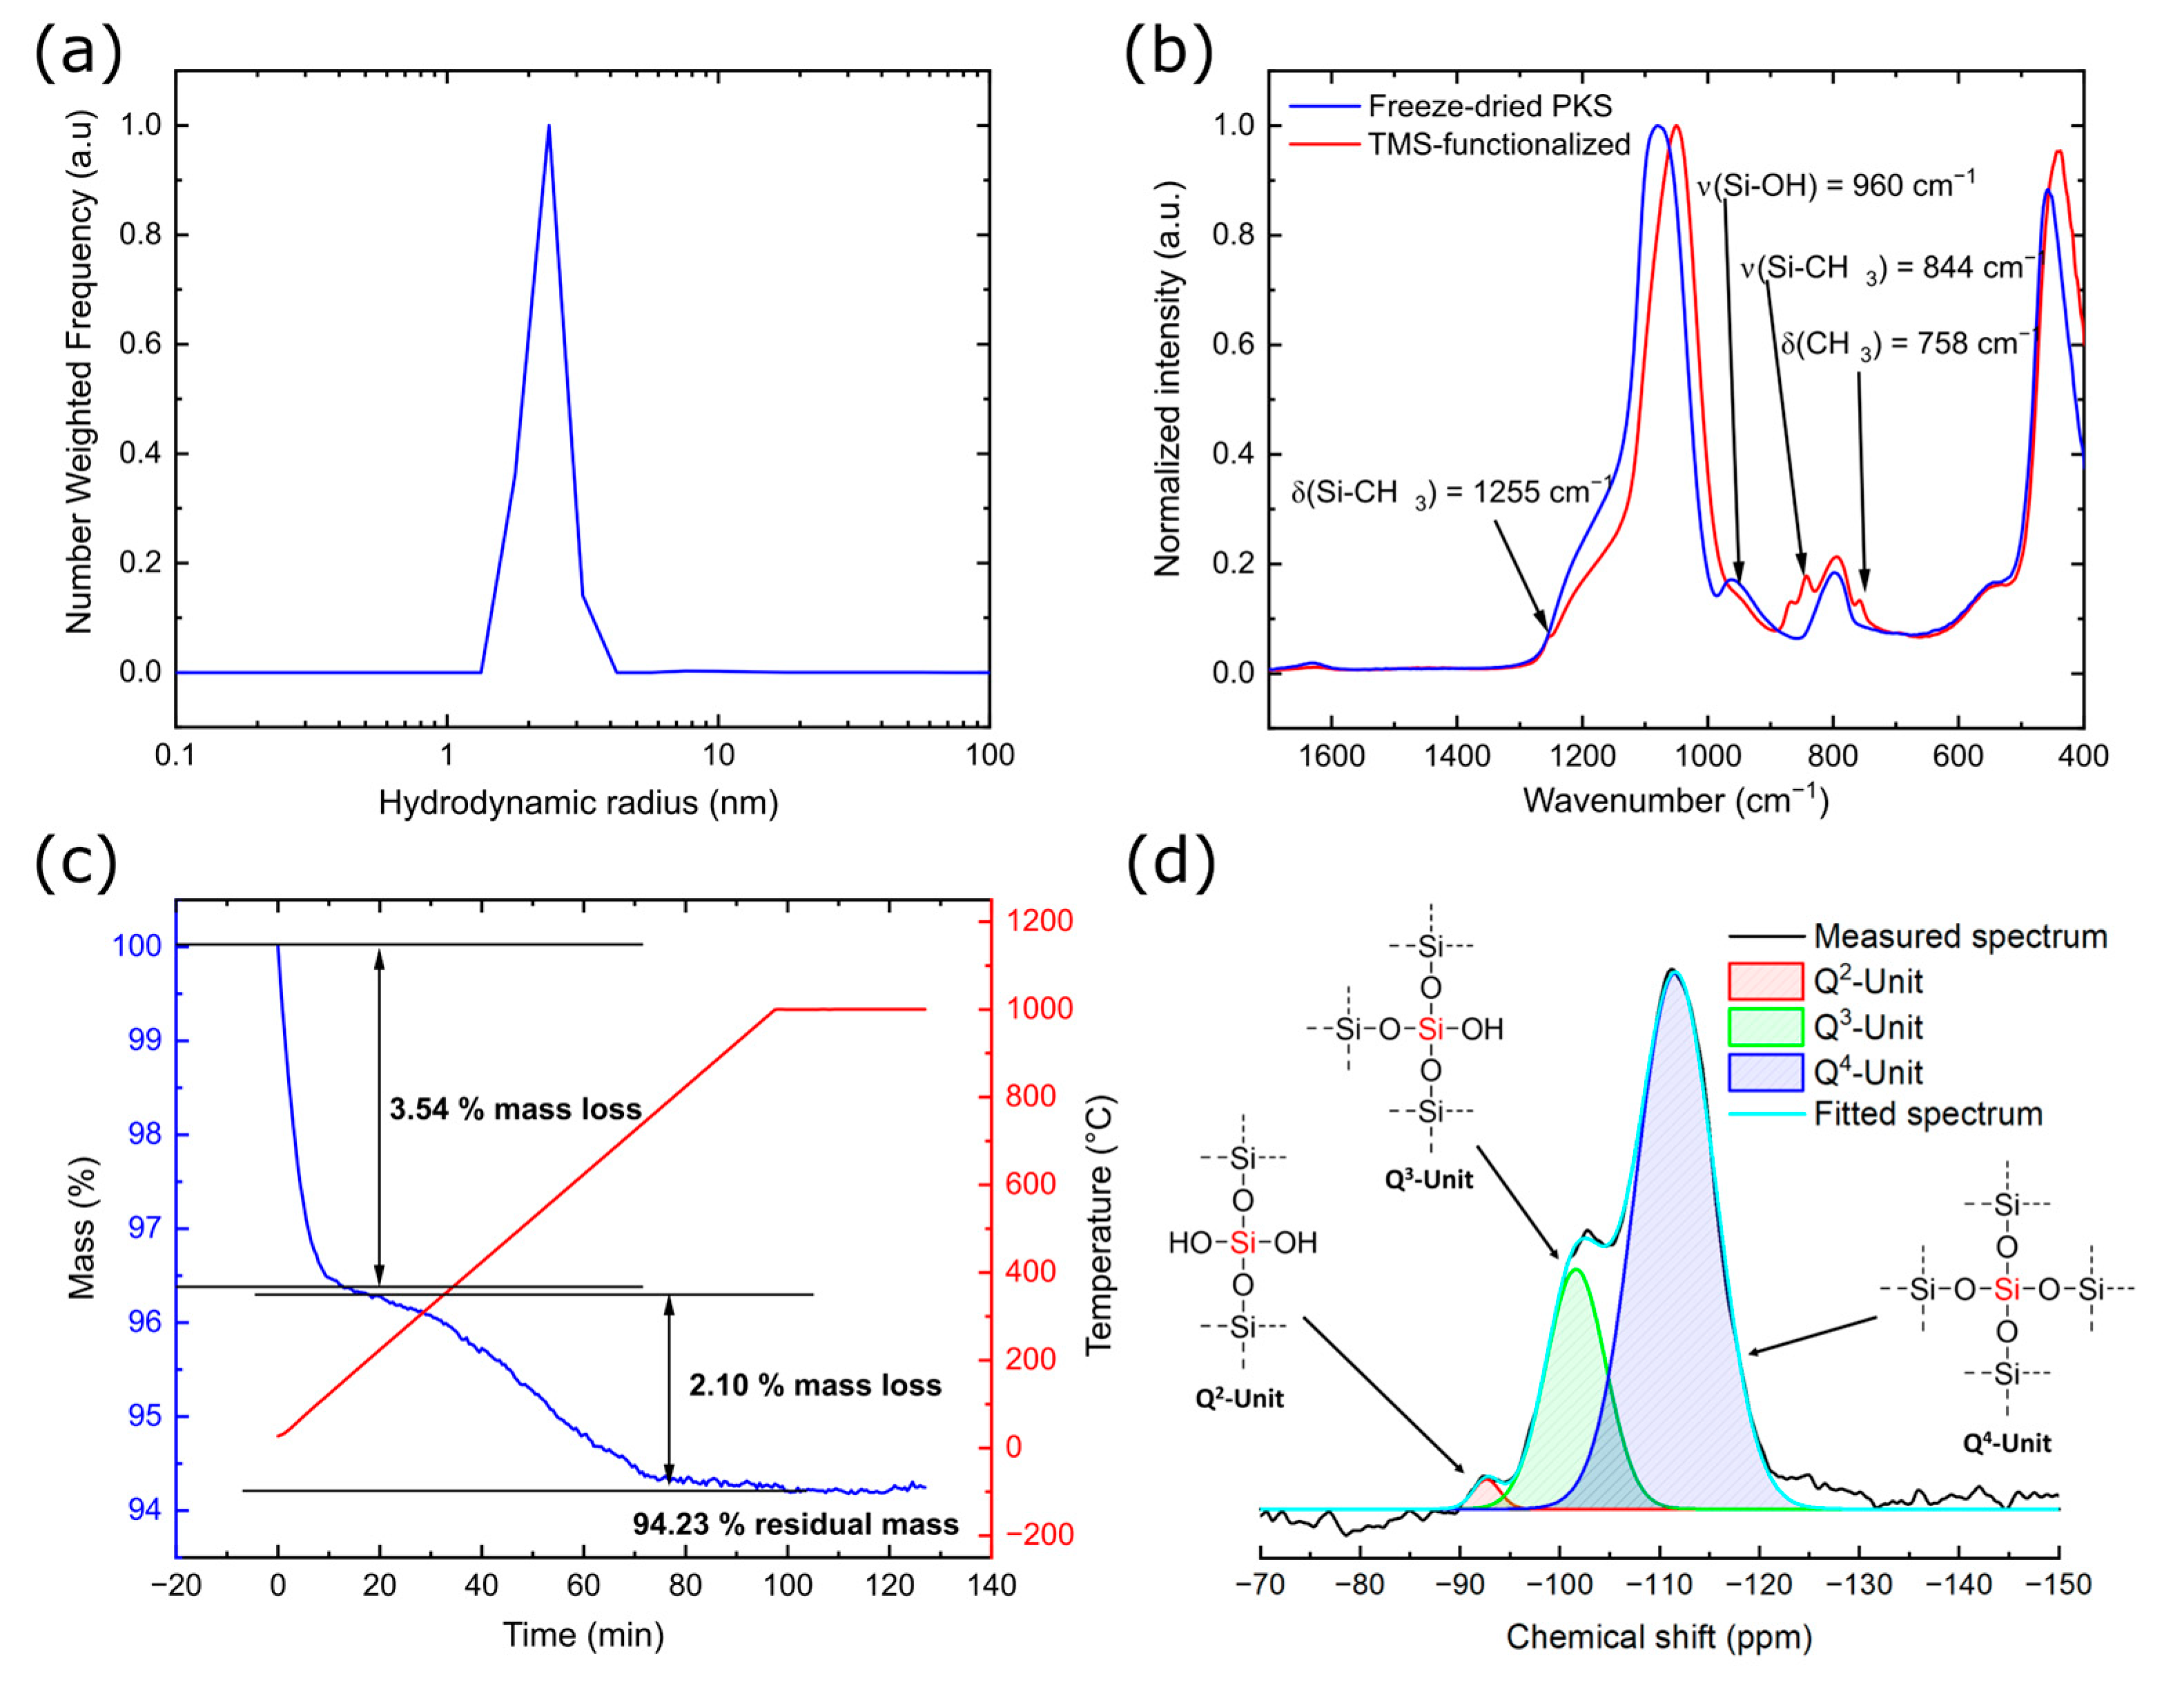
DLS measurements (Figure 9a) revealed a polydisperse particle distribution in which particles with a hydrodynamic radius of 2.3 nm and 9.6 nm (very weak signal) were detected. Thus, the sample consisted exclusively of small SiO2 nanoparticles and did not contain any agglomerates on the micrometer scale.
Due to the high water content, the PKS sample was also freeze-dried and analyzed. It showed an almost identical FTIR spectrum (Figure 9b) to that of the freeze-dried Silicea.
In addition, the TGA measurement (Figure 9c) showed a similar mass loss for physisorbed water of 3.54% in a temperature range of 25–125 °C, which was similar to the results for the Silicea [28,32,33,34,35]. The mass loss of the second stage from 170–960 °C was 2.1% [28]. The mass loss in this temperature range was about 3.2% lower than for the freeze-dried Silicea, which may be explained by higher cross-linking or the significantly lower surface area of the PKS (233.72 ± 1.98 m2/g). It is also possible that in the case of the freeze-dried Silicea, more water was located in the pores, which caused a higher mass loss in the second stage.
The 29Si SP MAS NMR (Figure 9d) revealed the Q2, Q3, and Q4 signals. The Q4 units provided the most intense signal and the Q2 units only a very weak signal. The fractions of the individual Q units and the absolute silanol group fraction thus determined are shown in Table 1.
The proportions of the individual Q units and the absolute silanol group fraction from the freeze-dried PKS sample and the freeze-dried Silicea were almost identical and showed a similar degree of cross-linking. Thus, the differences in the TGA measurements, especially in the temperature range of the condensation reactions, were not caused by a different degree of cross-linking but by the different structures and surface areas.
The TMS functionalization of the freeze-dried PKS was performed identically to the functionalization of the Silicea for quantification of the accessible Si-OH groups. The resulting FTIR spectrum revealed the expected bands such as those for the functionalized Silicea (Figure 9b) [50,58,59,60,61,62].
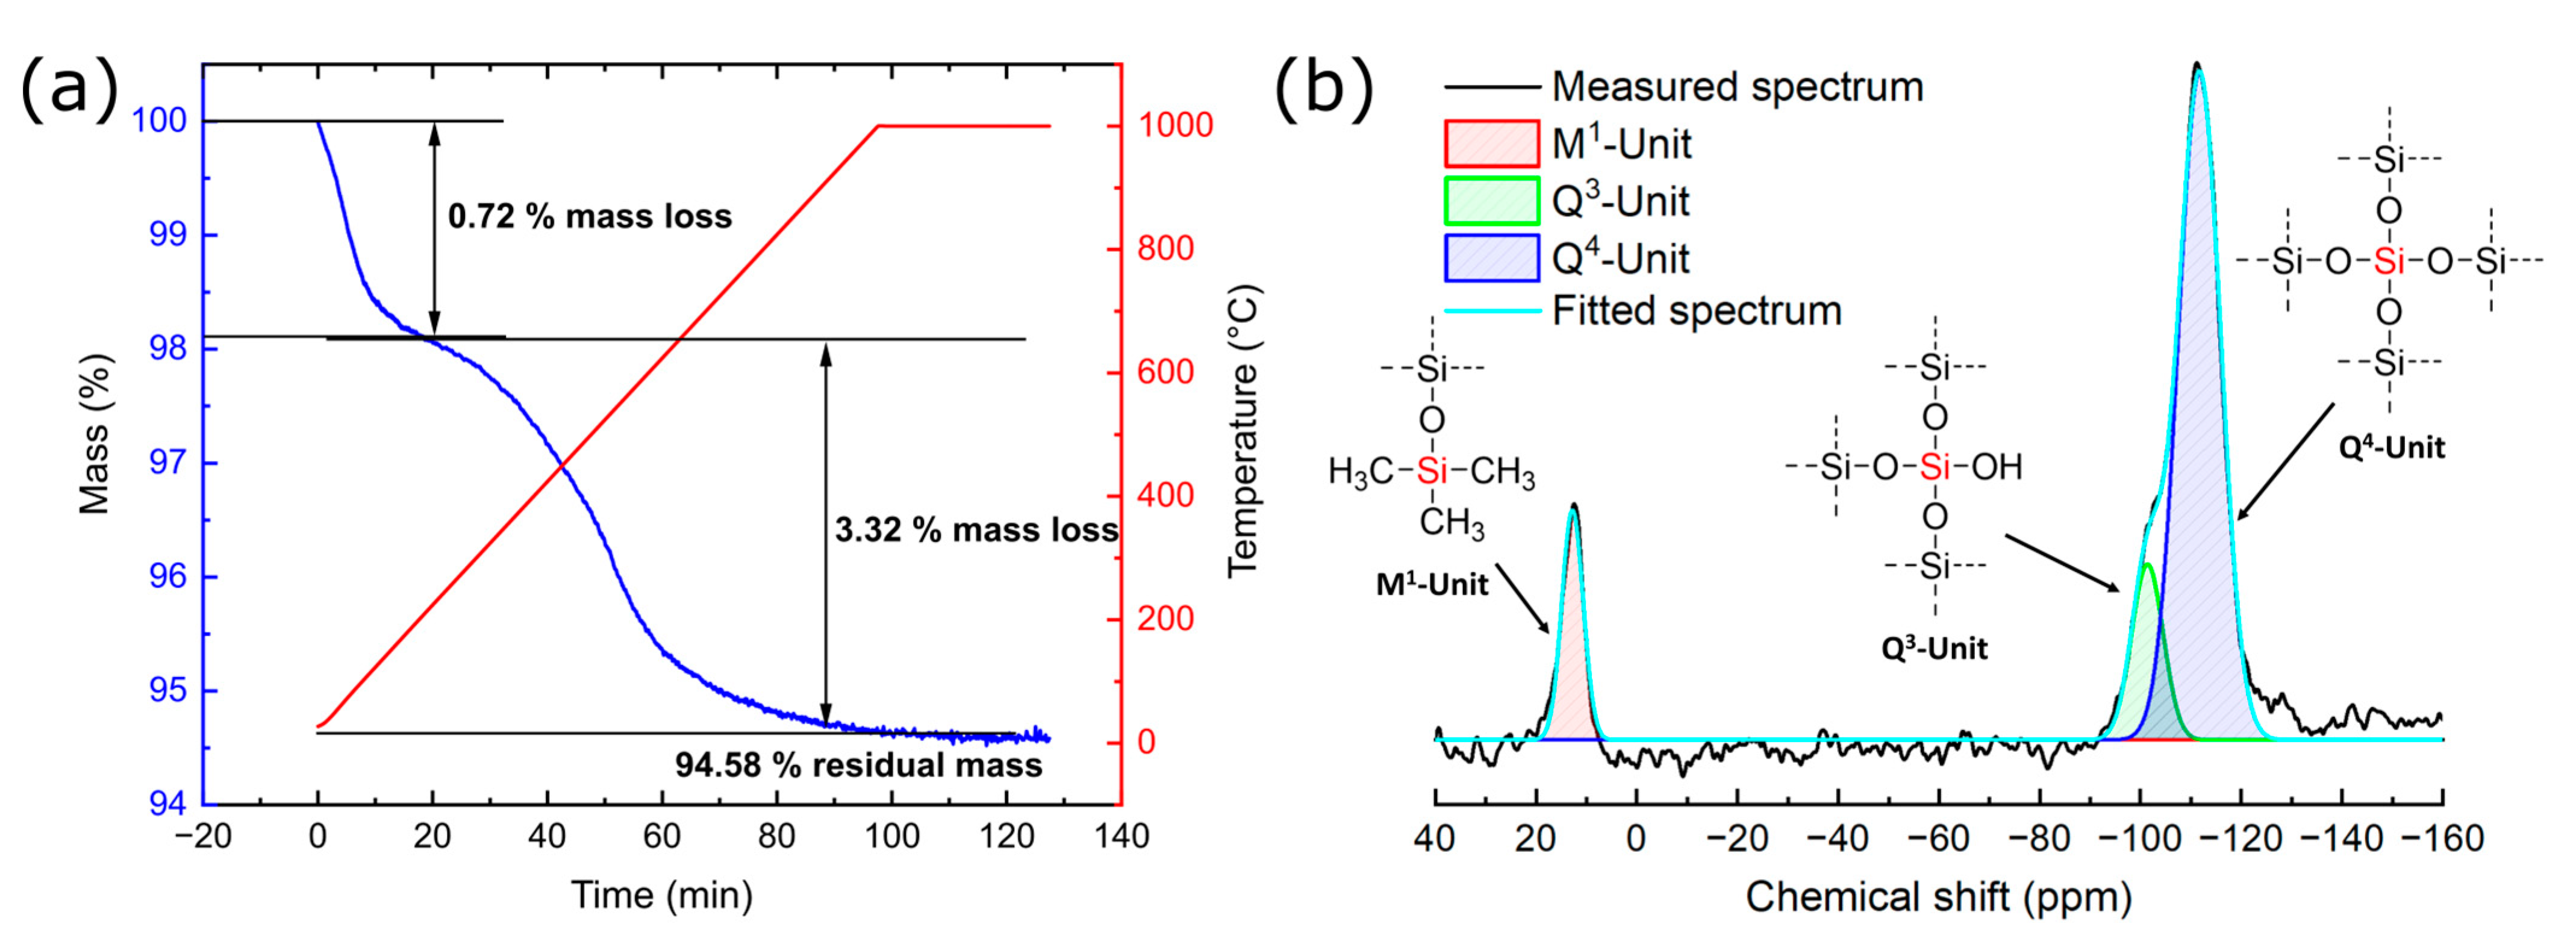
The TGA measurement (Figure 10a) showed that, in contrast to the non-functionalized sample, there was a decrease in the first mass loss (25–125 °C) and an increase in the second mass loss (200–900 °C). In particular, the increase in the second mass loss of 1.22% confirmed a successful TMS functionalization. Due to the superposition of the condensation of residual Si-OH groups and the decomposition of the TMS groups in the second area, no quantification of the functionalization and the reacted Si-OH groups could be performed via the TGA measurement. When comparing only the second temperature stage, the increase in the mass loss was less than the increase in the mass loss in the second stage from Silicea (3.38%), which might have been an indication that the PKS contained fewer available Si-OH groups for TMS functionalization than did the Silicea.
The 29Si SP MAS NMR spectrum (Figure 10b) revealed the typical M1 signal at −12.2 ppm, which indicated a successful functionalization of the Si-OH functions with trimethylsilyl groups. In addition to the M1 units, Q3 and Q4 units were also detected. We used the same approach as in the case of the functionalized Silicea to calculate the fractions of the Q units and the total silanol group content (Table 1).
Compared to the functionalized Silicea, the degree of cross-linking was slightly lower in the functionalized PKS, which might have indicated that fewer free silanol groups reacted in the functionalization of the PKS.
The elemental analysis showed a carbon content of 3.02% and a hydrogen content of 1.27% after functionalization. A nitrogen content of 0.18% was also detected; this most likely was ammonia that was formed as a byproduct that was not completely washed out. However, the nitrogen content was not the residual reactant (HMDS) because this would have been detected in the 29Si NMR spectrum. An OH group fraction of 0.830 mmol/g could be calculated via the carbon content of the functionalized sample. Thus, the proportion of accessible OH groups per gram of sample for the freeze-dried and functionalized PKS was less than half that of the functionalized freeze-dried Silicea. Despite an approximately equal degree of cross-linking, significantly fewer OH groups were accessible with TMS groups. This was most likely due to the significantly lower surface area of the freeze-dried PKS. A comparison of the TGA measurements of the freeze-dried Silicea and freeze-dried PKS also showed that the loss in mass in the temperature range of the mass loss due to condensation was less than half as great for the PKS than for the Silicea. This possibly also confirmed that less-reactive silanol groups were present in the PKS sample. A comparison of the TGA measurements of the functionalized samples showed that the mass loss of the functionalized PKS increased by 1.22% in the second stage compared to 3.69% for the Silicea. Therefore, the TGA measurements revealed that significantly more Si-OH groups were converted in the freeze-dried Silicea than in the PKS, which was consistent with the results of the elemental analysis. The lower percentage of accessible OH groups also possibly had an influence on the bioactivity of the product.
3.3. Characterization of the Product FlKe
Flügge Siliceous Earth (FlKe) is a dry white powder that can be analyzed without prior drying. Siliceous earth is the sediment of diatoms and therefore is not a synthetically manufactured product.
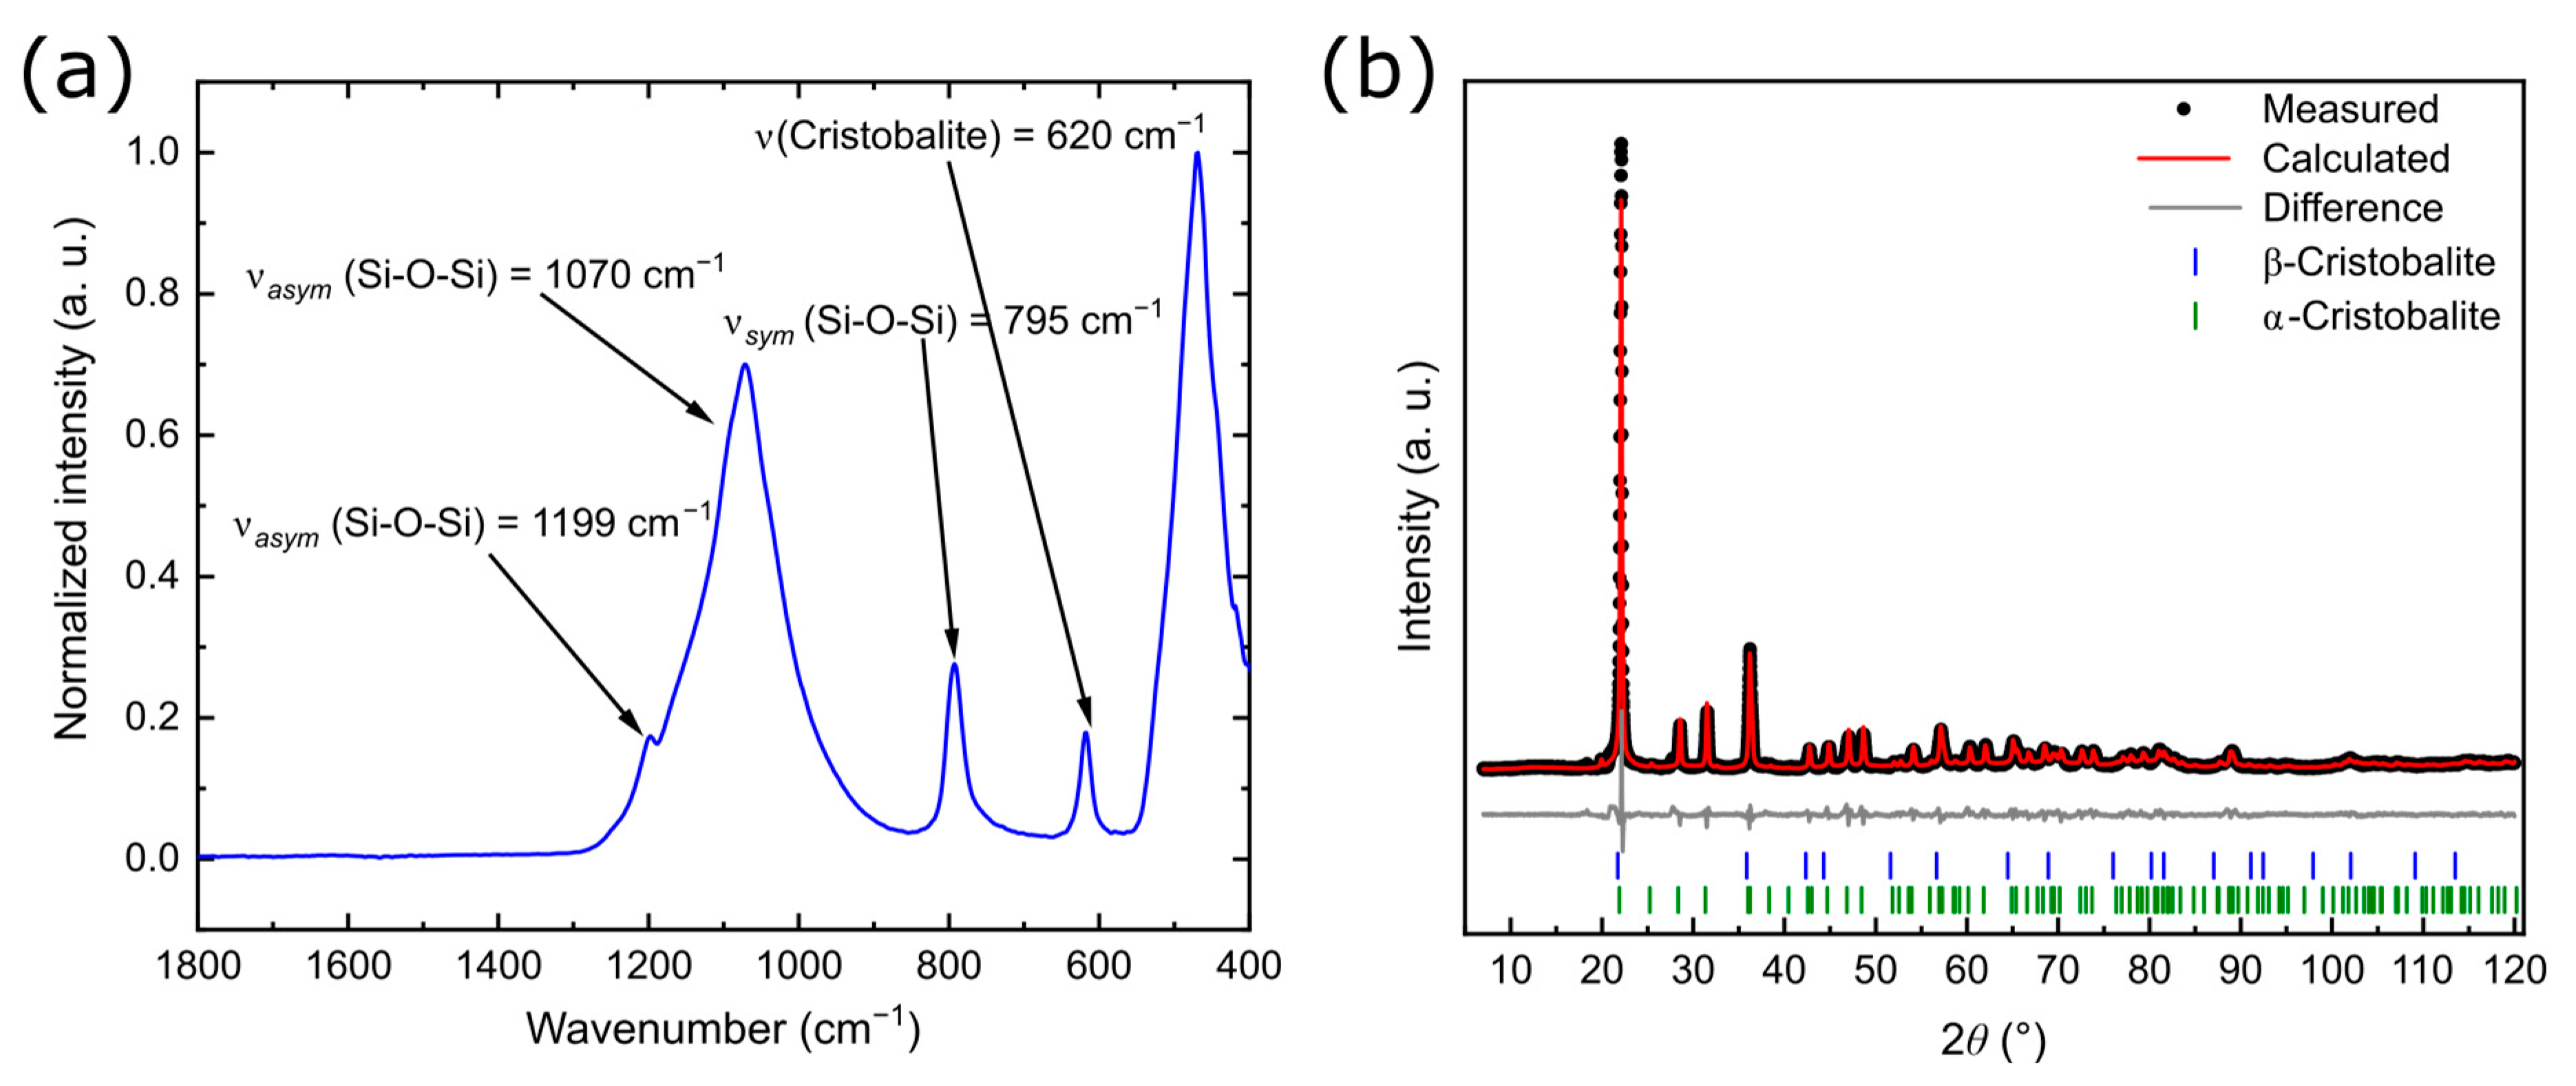
The FTIR spectrum (Figure 11a) revealed the characteristic vibration bands of SiO2 at 1199 cm−1, 1072 cm−1, 792 cm−1, and 468 cm−1. Compared to the previously analyzed products, no Si-OH stretching vibration band at 968 cm−1 was observed, which suggested that no silanol groups were present [37,38,39,40,41,42,43,65]. Furthermore, the typical OH vibrational bands at 3000–3800 cm−1 were also missing. At 620 cm−1, a vibration band typical of cristobalite (a crystalline phase of SiO2) was visible [66]. Diatoms are composed of amorphous, hydrated SiO2 (silica); it therefore was astonishing that a peak of a crystalline phase was visible in the FTIR spectra [67].
The high degree of crystallinity of the sample was also evidenced by XRD (Figure 11b), which showed sharp reflexes that could be fitted to a mixture of 81% α-cristobalite, 3% β-cristobalite, and 16% amorphous SiO2. This strongly indicated a purification of the natural sediments by a temperature treatment ≥1000 °C, which enforced the formation of cristobalite.
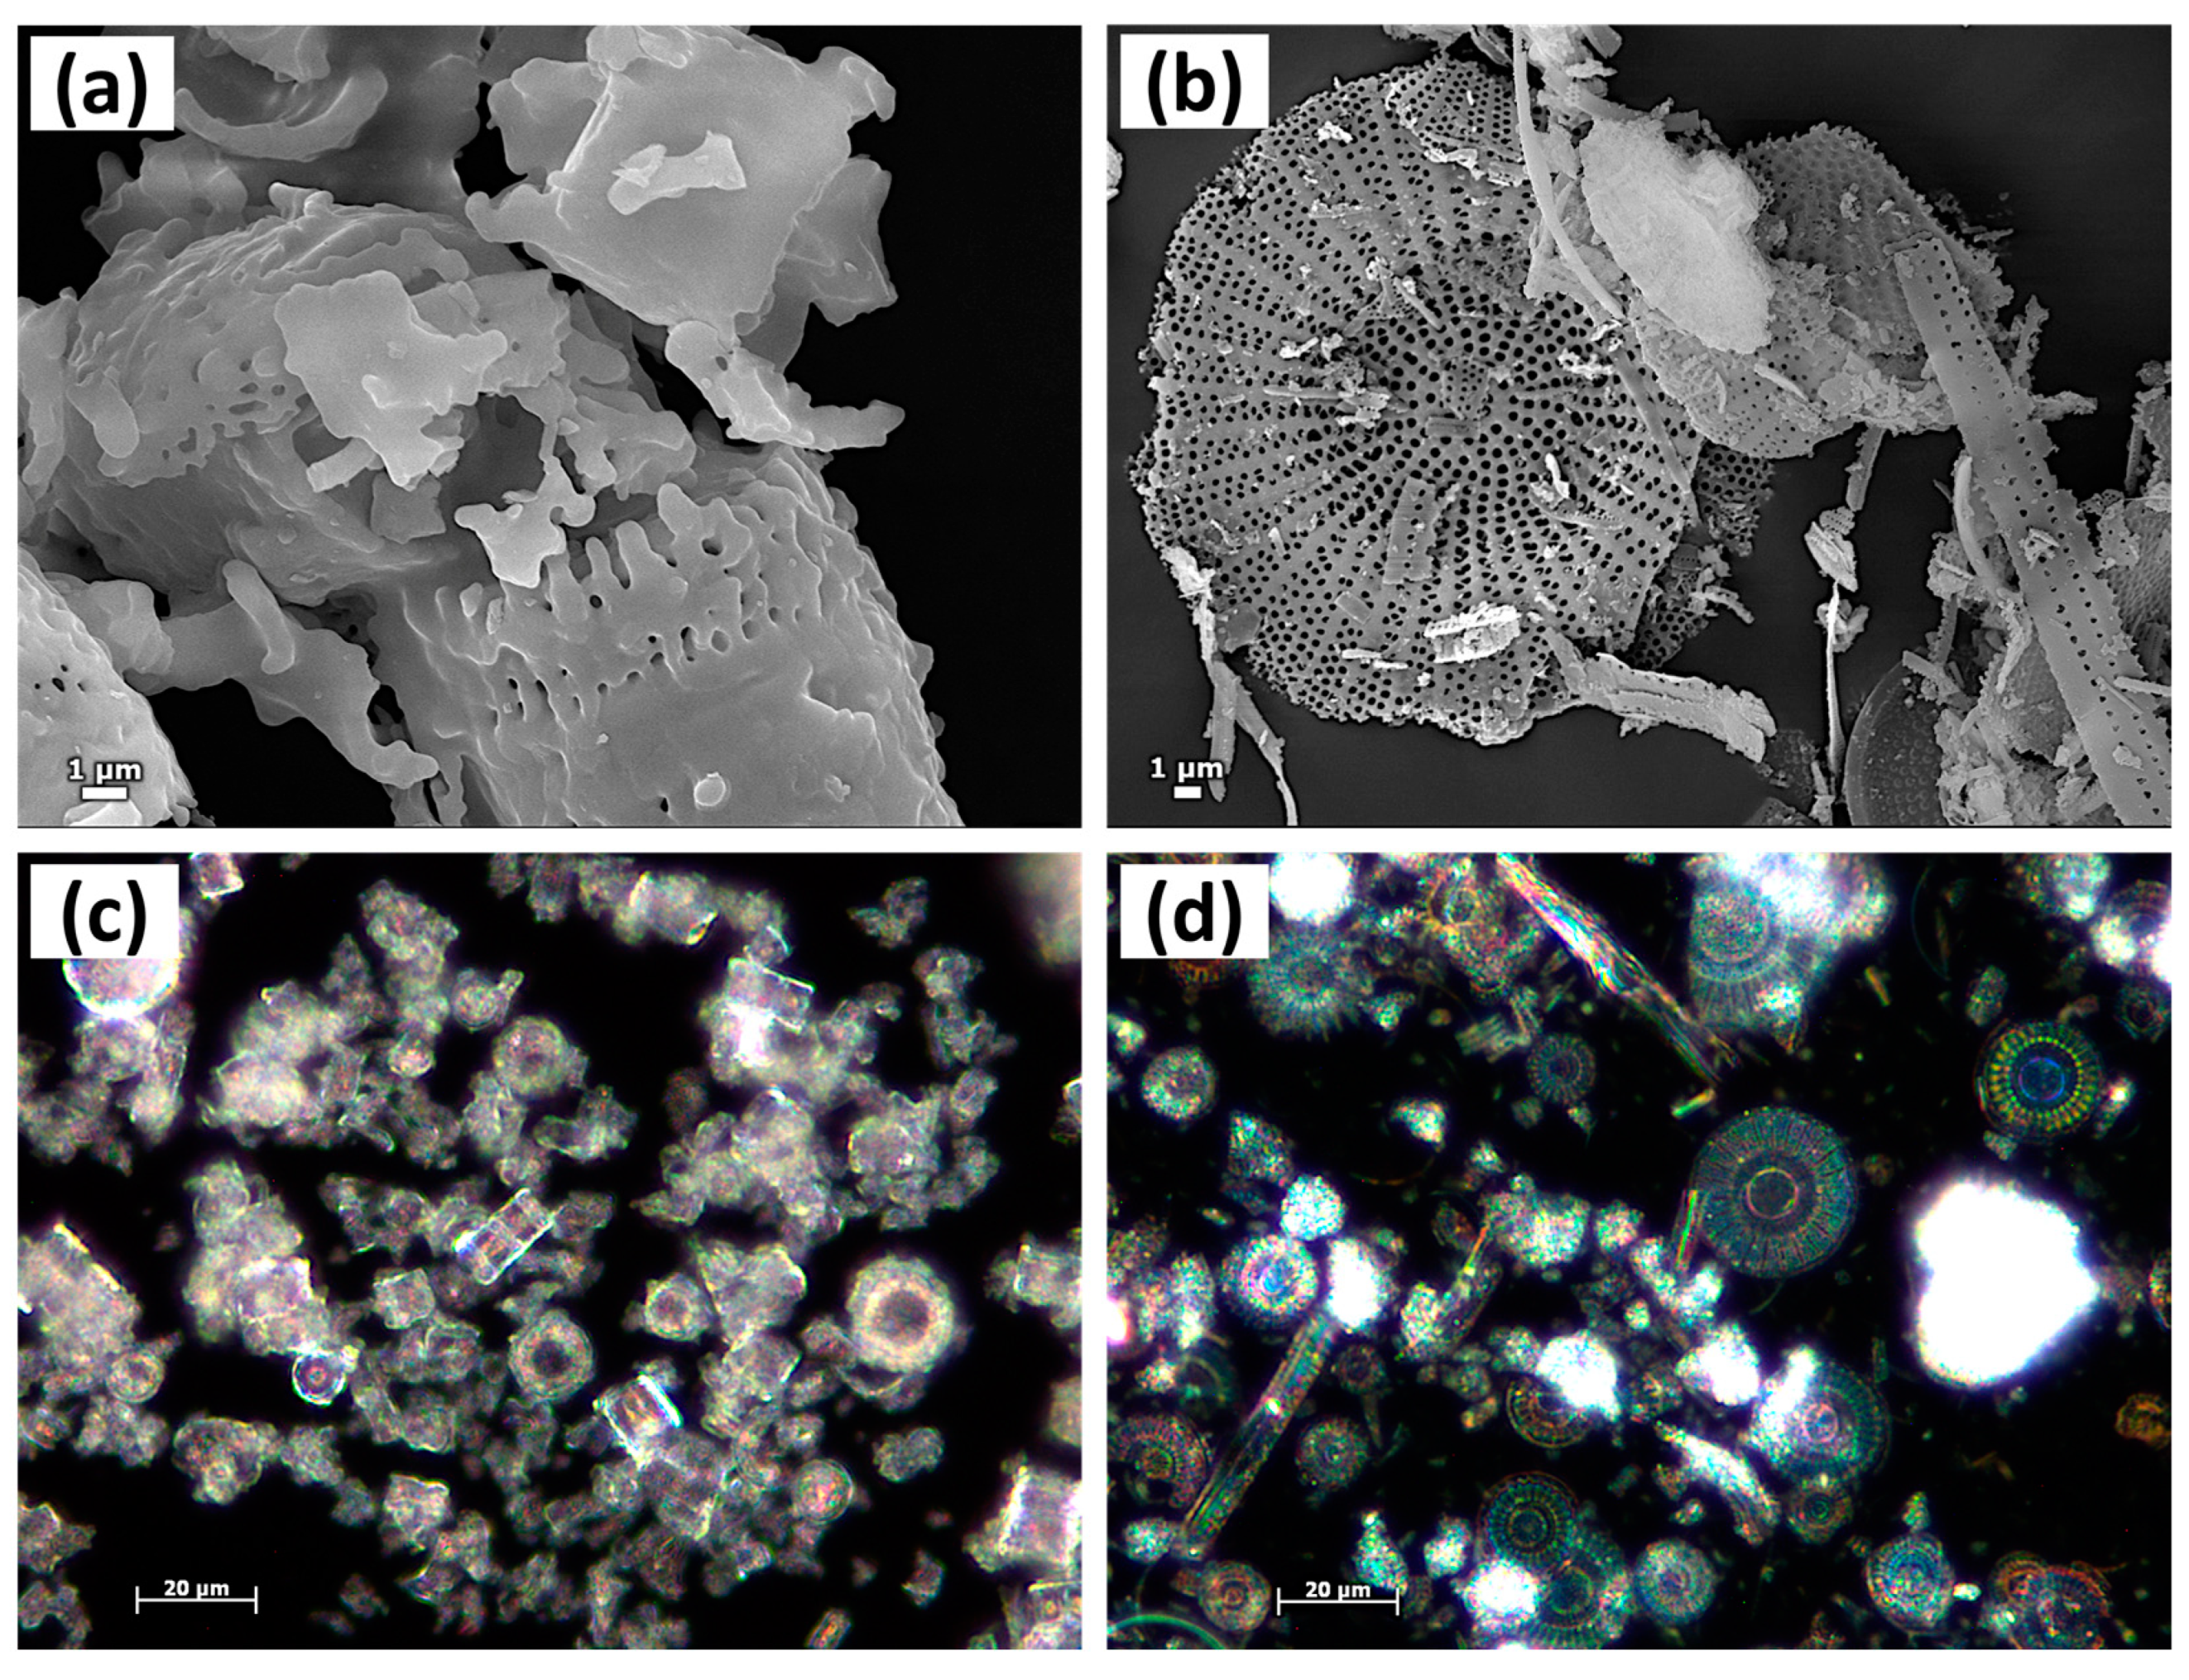
Optical and scanning electron microscope (SEM) images of the sample were compared with images of untreated diatoms (Figure 12). The SEM and light microscopy images of FlKe (Figure 12a,c) revealed distinct structures of the diatoms. However, a comparison with microscopy images of thermally untreated diatoms (Figure 12b,d) also showed clear differences. In particular, the fine structures of the diatoms were diminished in the FlKe sample. This was a further indication that the diatoms in the sample FlKe were purified by high-temperature treatment.
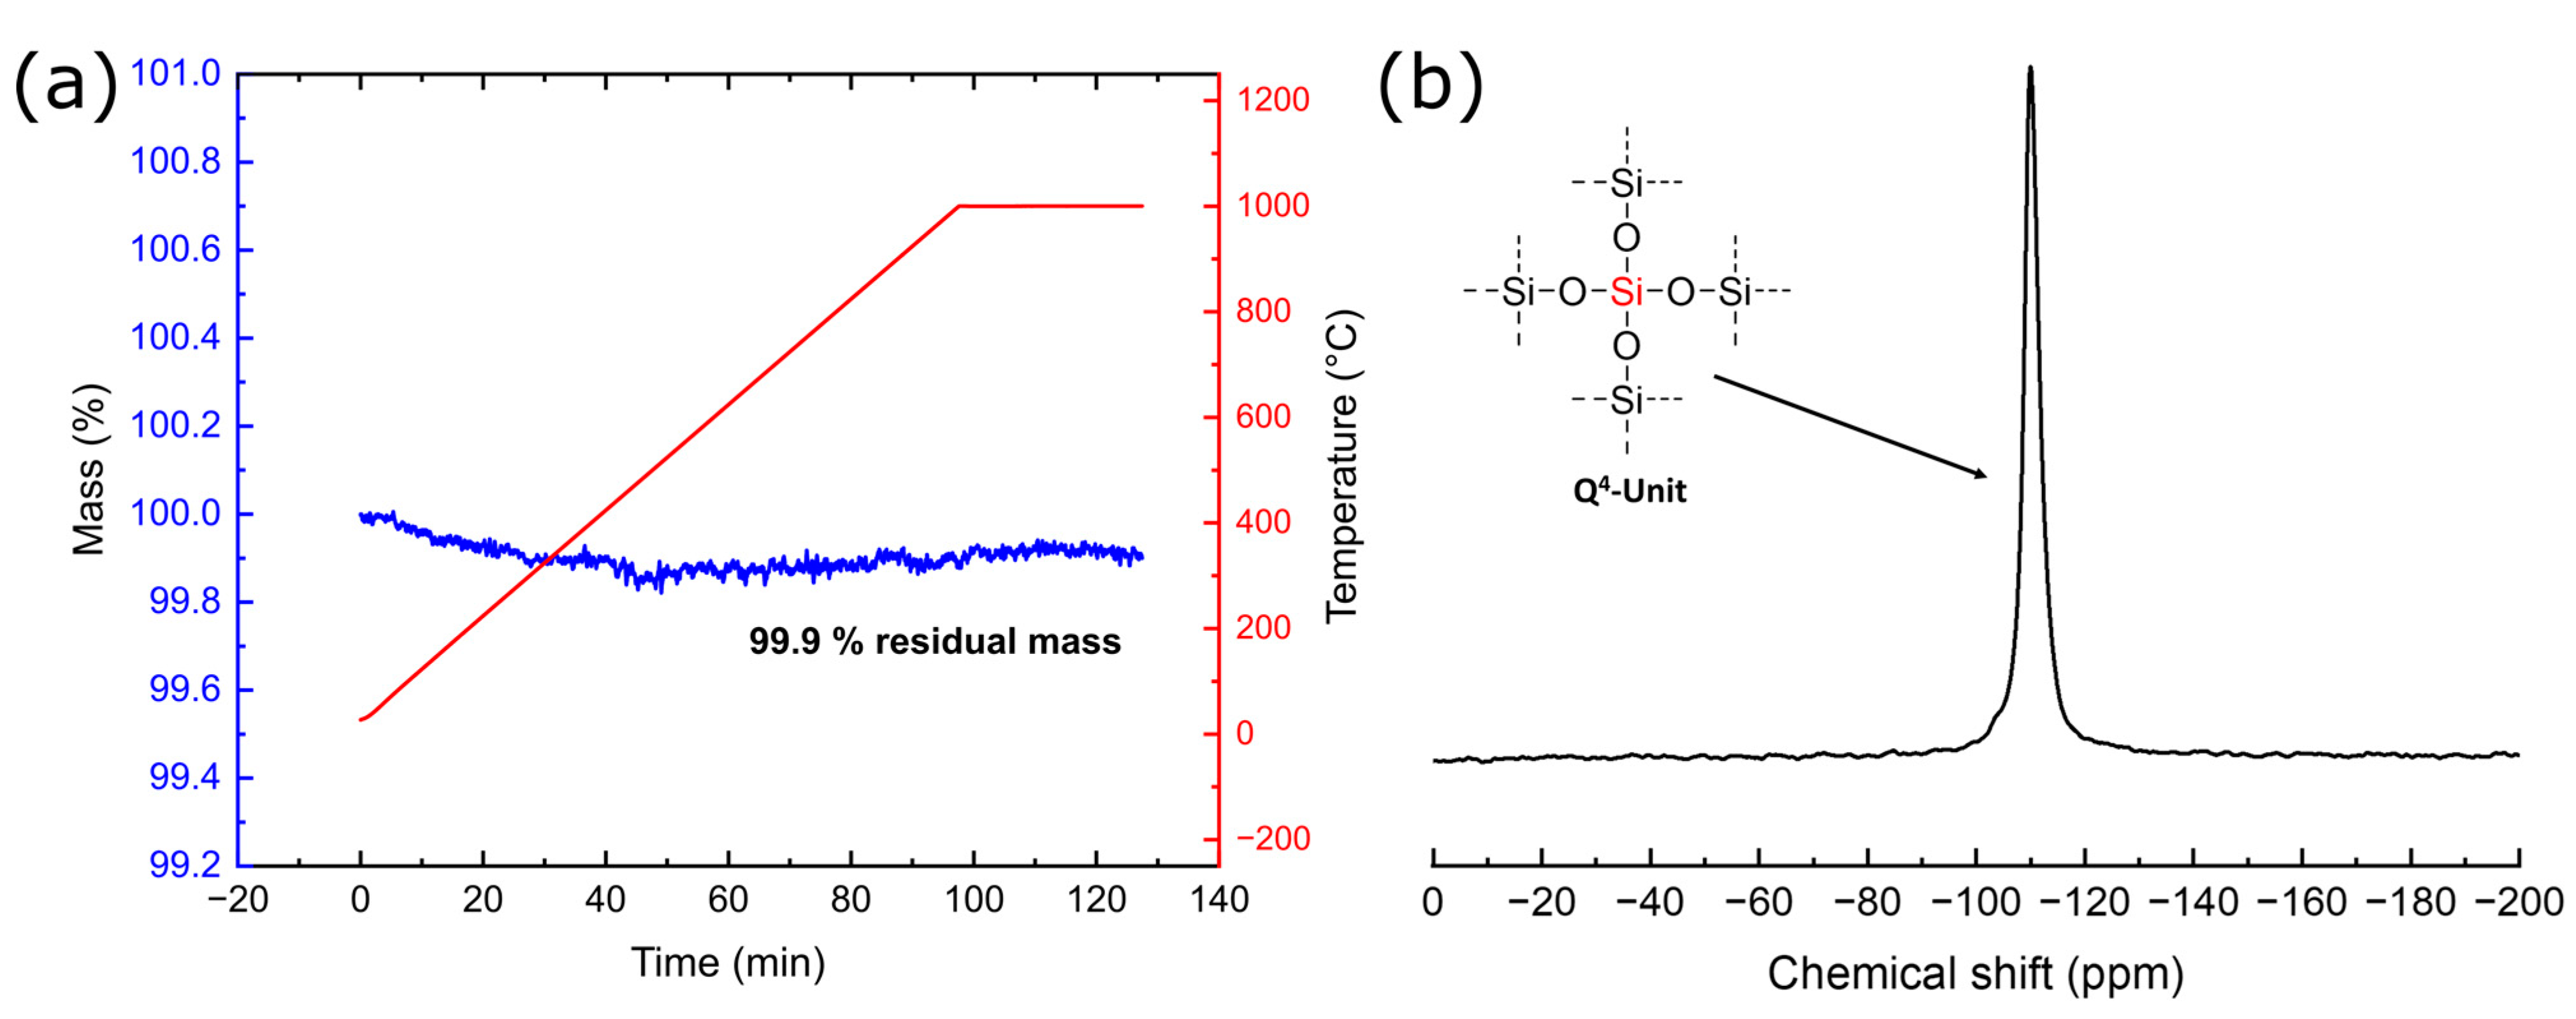
The TGA curve of the FlKe showed no mass loss after heating the sample from 25 °C to 1000 °C (Figure 13a). Thus, there was no physisorbed water on the surface of the silica, which was a strong indication of a lack of silanol groups on the surface. Furthermore, there was no mass loss due to condensation, which also indicated very few or no free OH groups and confirmed the results of the FTIR measurements.
For a more detailed analysis of the composition, 29Si SP MAS NMR was recorded (Figure 13b). In contrast to the freeze-dried Silicea and PKS, only one intense signal of the Q4 unit (−110 ppm) could be detected (Table 1). This was the Q4 peak caused by amorphous SiO2 and α-cristobalite. The α-cristobalite (−109 ppm) and β-cristobalite (−113 ppm) phases showed a similar chemical shift; however, due to the small amount of β-cristobalite, mainly amorphous SiO2 and α-cristobalite were visible [68]. Due to the higher relaxation time, it was also possible that the cristobalite components were not fully reproduced. However, this limitation of the interpretation of the spectra played only a minor role because the proportions could be determined exactly via XRD and no Q3 units could be seen in the spectrum. Thus, unlike the freeze-dried Silicea and PKS, the FlKe consisted of a fully cross-linked SiO2 network without silanol groups. To confirm the complete absence of OH groups, the untreated FlKe was reacted identically to the freeze-dried Silicea and PKS with HMDS to functionalize the free Si-OH groups. In order to detect the success of the reaction, an FTIR measurement was performed for the FlKe after the reaction with HMDS. The spectrum of the functionalized FlKe was identical to that of the untreated sample, and no vibrations of the Si-CH3 group were detectable. Thus, no reaction occurred between the HMDS and FlKe. This proved that the FlKe sample did not contain silanol groups at all. Overall, the FlKe was fully cross-linked SiO2 in which no Si-OH groups were present. This could have a significant influence on the silicon uptake, and thus the bioactivity and bioavailability of the FlKe may be lower than that of the Silicea and PKS [12].
3.4. Characterization of BioSil®
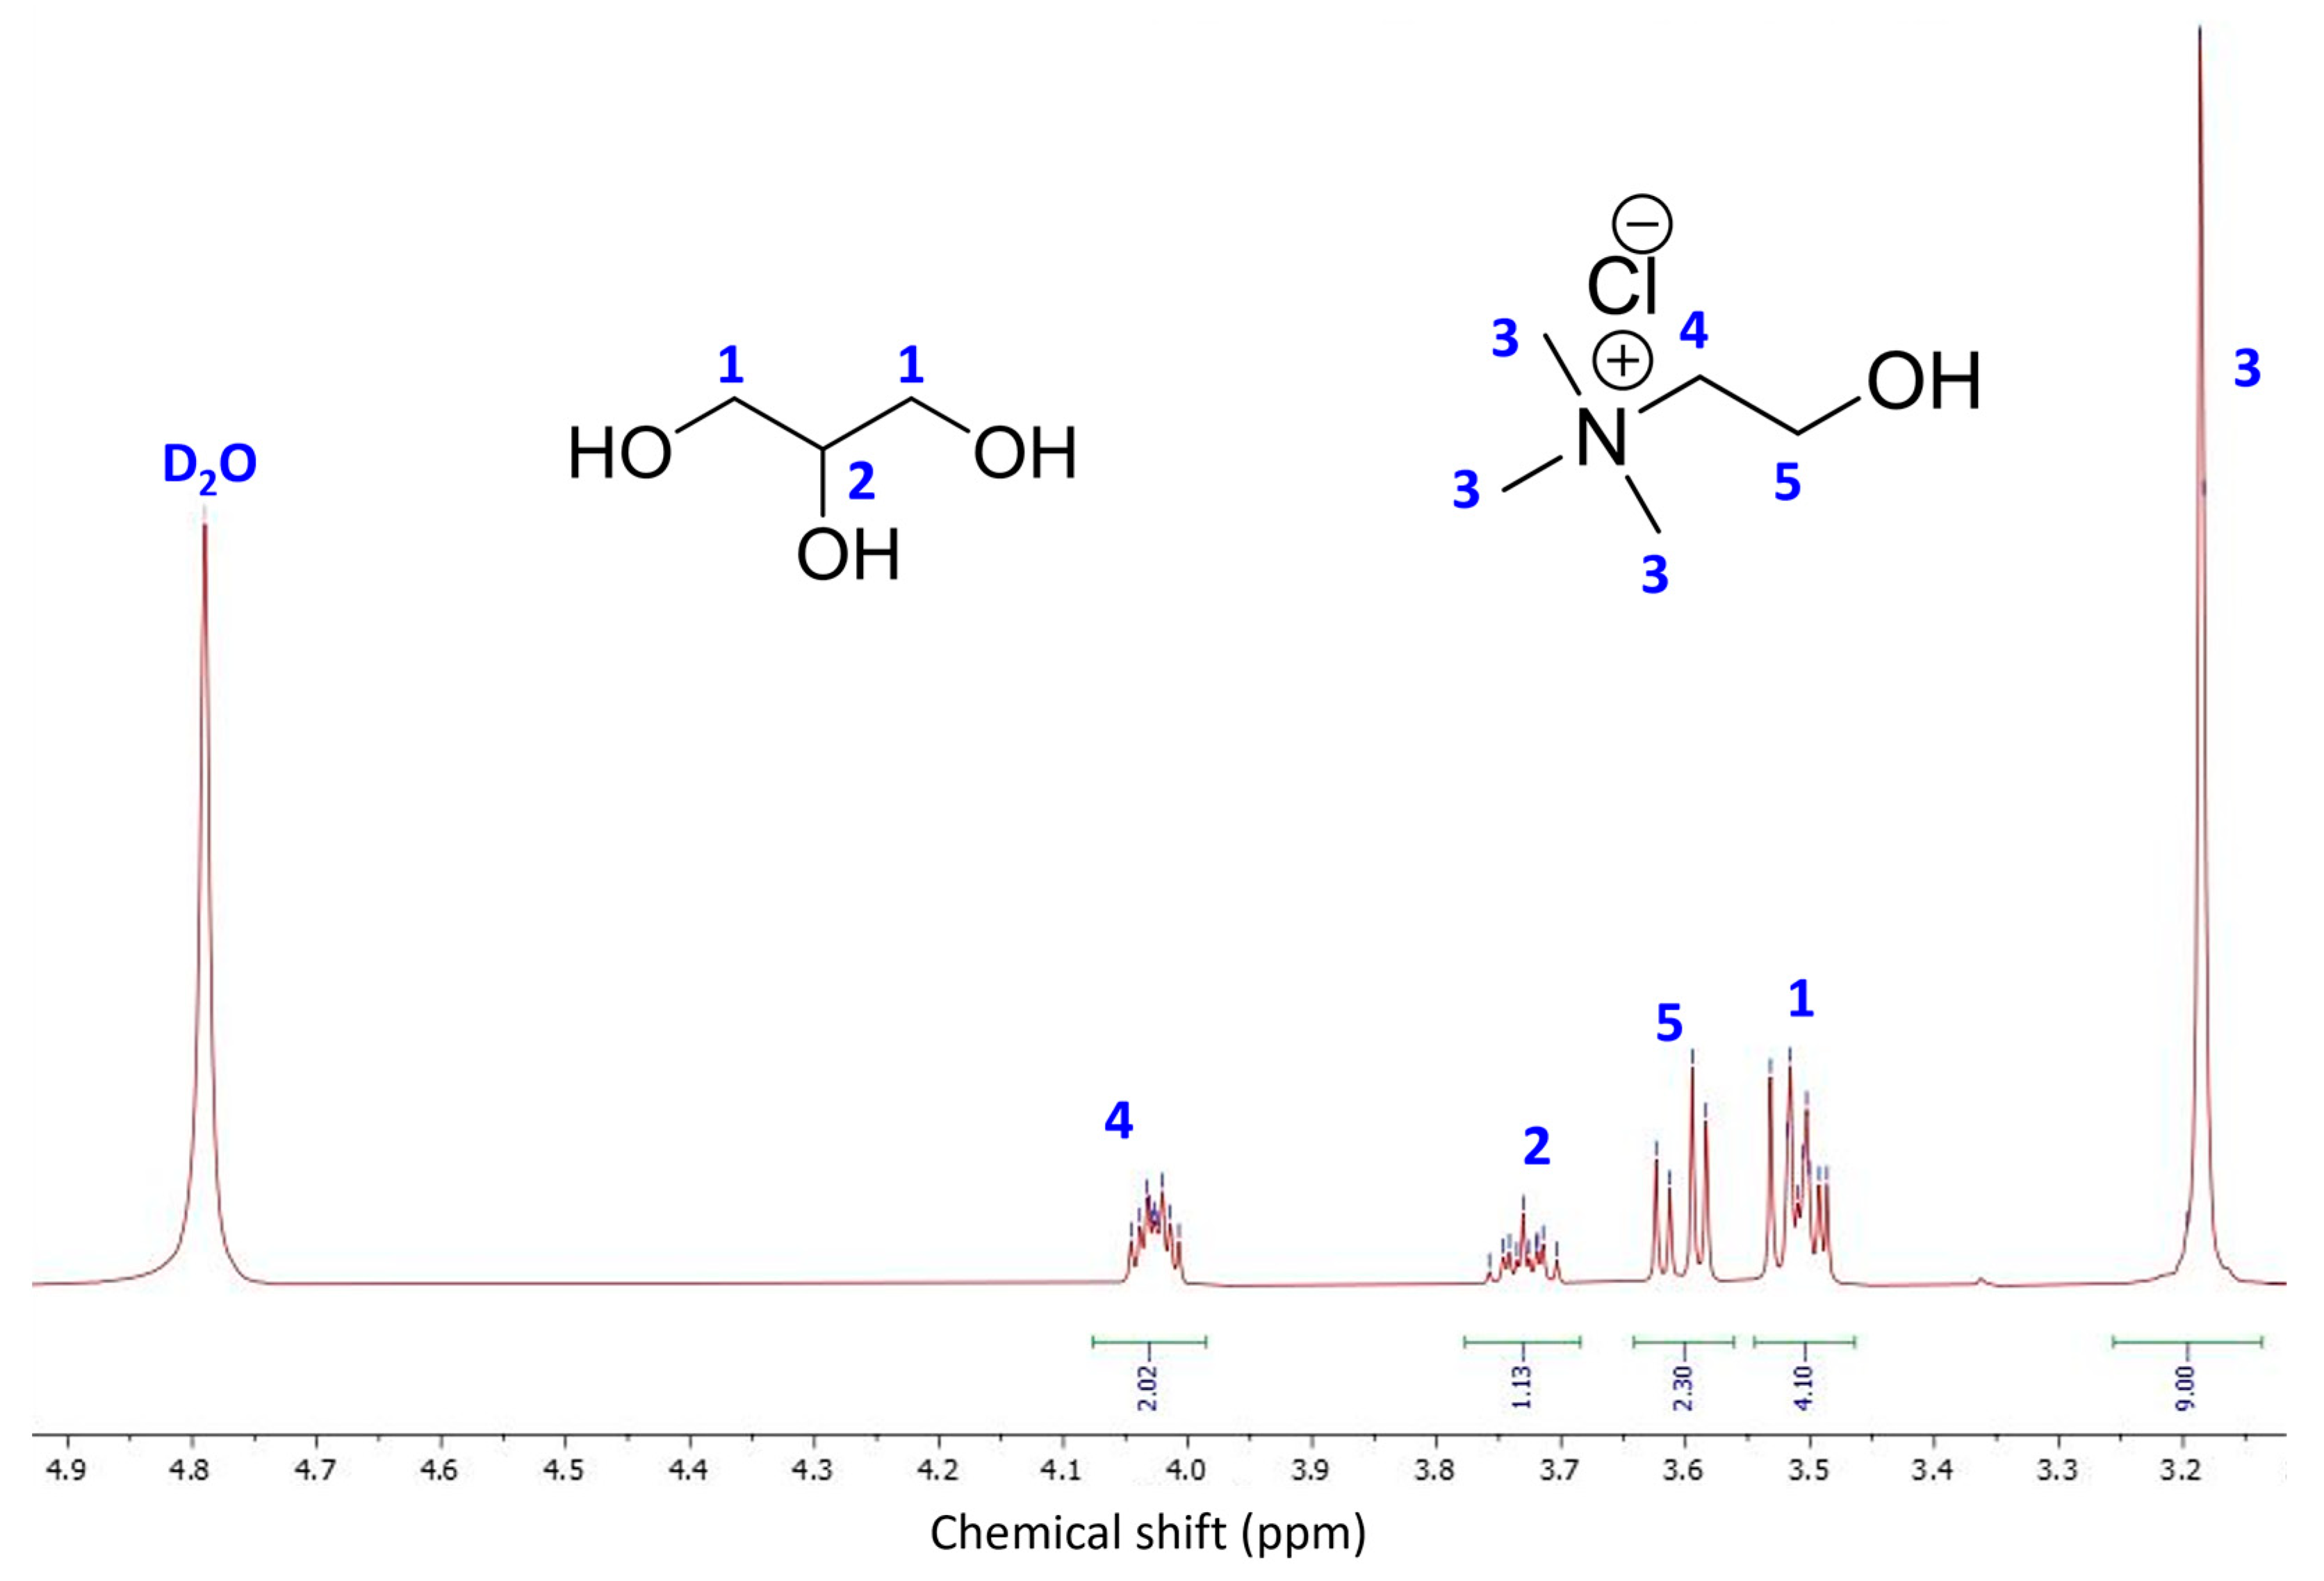
BioSil® is a choline-stabilized orthosilicic acid in a mixture of water and glycerol. BioSil® is not a solid and could not be freeze-dried like Silicea and PKS due to the many organic components that it contains. Contrary to the Silicea and PKS, it is a clear compound. Hence, we analyzed the BioSil® differently than the Silicea, PKS, and FlKe; i.e., as a solution and not as a solid. The focus was on the detection of soluble silicates. In the case of the BioSil® solution, 1H NMR spectroscopy could be used (Figure 14). The signals in the spectrum could be assigned to glycerol (δ = 3.76–3.70 ppm; 3.53–3.49 ppm) and choline (δ = 4.05–4.01 ppm; 3.62–3.58 ppm; 3.19 ppm).
For further analysis of the constituents of the BioSil®, an ICP-MS measurement of diluted BioSil® in distilled water (1:1,000,000) was performed. The concentration of silicon and chlorine in the BioSil® was determined to accurately verify the silica content and the amount of choline. The results could reproduce the concentrations of the elements given by the manufacturer; we found a silicon content of 20.4 g/L and 117 g/L chlorine. The manufacturer mentions on the package 20 and 101.6 g/L for these respective contents.
Thus, the pure Si mass content based on an aqueous solution was about 2%, which corresponded approximately to the pure Si mass content of the PKS. The Silicea had a slightly lower content of about 1.4%. In general, it was shown that similar amounts of silicon were present in all three suspended samples. The choline concentration in the BioSil® was determined via the chlorine counterion of the choline cation according to ICP-MS; the resulting concentration of 460.8 g/L was a bit higher than the manufacturer’s specifications (400 g/L). This was due to a slightly higher proportion of choline as specified or to another chloride source in the BioSil®. The large amount of choline and glycerol in the product most likely acts as stabilizer of the soluble silicate species in order to prevent their condensation.
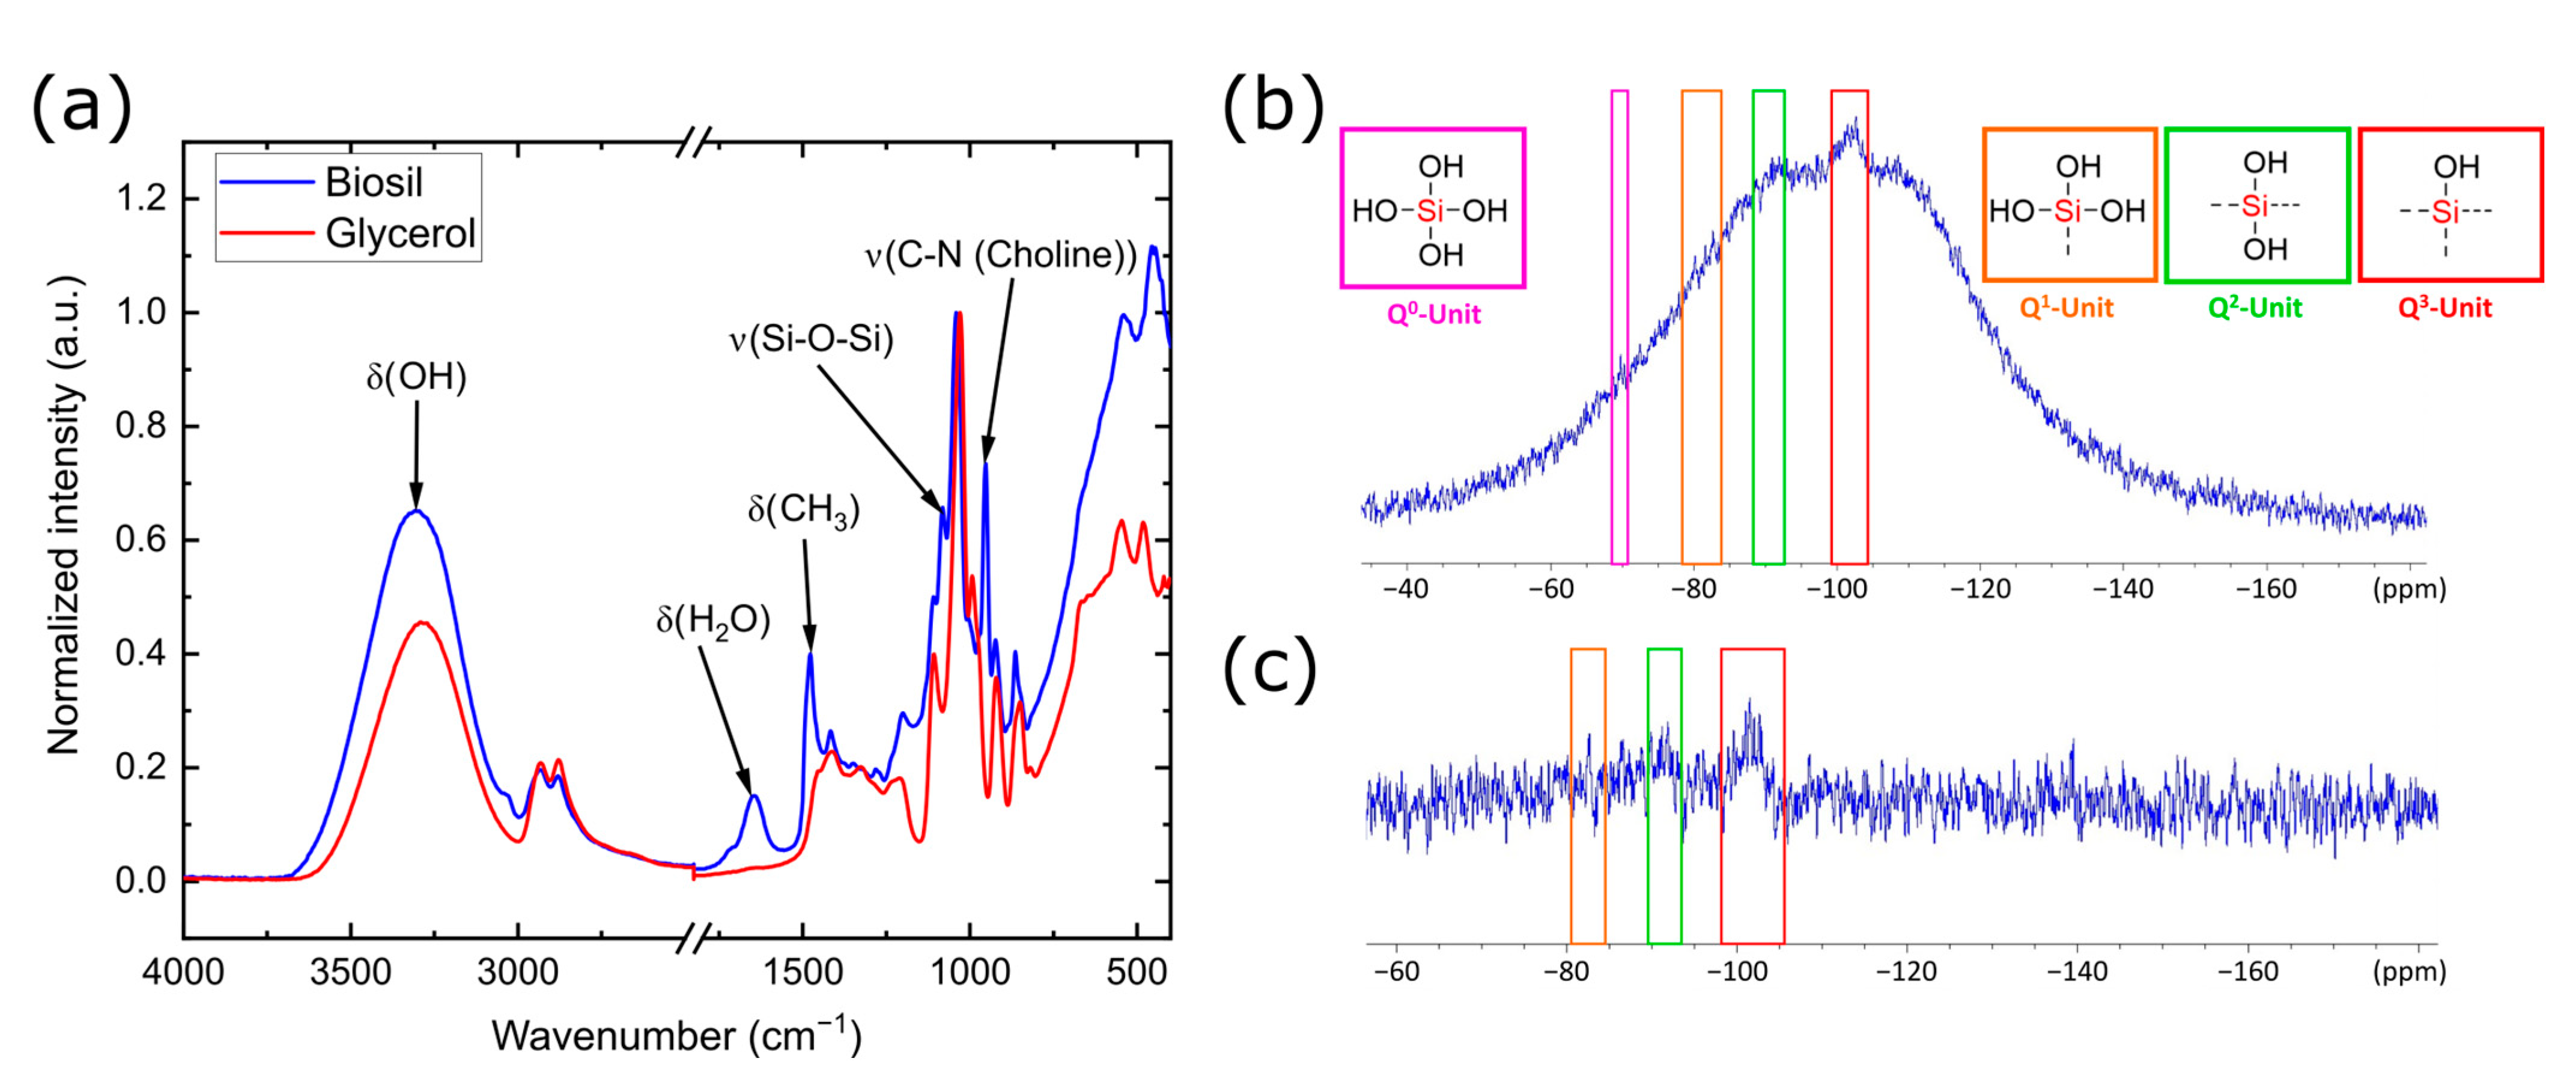
The FTIR spectroscopy (Figure 15a) of the BioSil® revealed that most of the signals in the BioSil® spectrum were caused by glycerol. The bands that are not based on the molecular vibrations of glycerol could be assigned to water or choline [69]. The vibration band at 1083 cm−1 was the characteristic Si-O-Si stretching vibration. This indicated that some cross-linking of the orthosilicic acid in the BioSil® may have occurred. However, due to the large overlap caused by the other constituents, more accurate conclusions could not be made.
A liquid 29Si NMR spectrum was recorded for a more detailed analysis of the silica species in the sample (Figure 15b). Due to the measurement in a usual glass tube, the targeted signals were on top of the amorphous glass typical for this measurement. We also analyzed the spectra by applying a correction method that subtracted the amorphous signals from the measured spectra. In the uncorrected spectrum, it became clear that dissolved silica was contained in the BioSil®. This statement could be made based on the weak signals at −83 ppm (Q1), −91 ppm (Q2), and −102 ppm (Q3). The signal at −71 ppm (Q0) in the uncorrected spectrum showed that orthosilicic acid was also present in the BioSil® [70,71,72,73]. However, the intensities of all signals were quite low, especially the signals of the Q0 unit and the Q1 unit, which could not be detected beyond a doubt due to the low signal-to-noise ratios. Although the Q2 and Q3 units also had low intensities, they could be relatively reliably determined. The signal intensities were very small due to the low silicon concentration. Since the signals of the fewer cross-linked Q units were significantly sharper than those of the Q2 or Q3 units, they could probably be detected even more poorly than the somewhat higher cross-linked Q units. In general, the BioSil® appeared to be the only sample in which orthosilicic acid was present in addition to other species of condensed silica, which could be clearly seen in the Q1, Q2, and Q3 units detected. The BioSil® showed significantly fewer cross-linked silica groups than all other samples considered so far and consequently the highest number of Si-OH groups. This was already evident in purely qualitative terms based on the solubility of the silicas and the presence of the Q0 and Q1 units.
Due to the low concentration of silica and the organic additives, a more precise analysis of the silica could not be carried out.
4. Discussion
Silicon uptake from the human body most likely occurs in the form of silicon of silicic acid (H4SiO4), which is only stable under very restricted conditions; for example, low concentrations and low pH values. While its role in plant growth and development is well understood, its role in the human body is currently only poorly understood due to its low bioavailability. However, several studies in the literature have shown that the bioavailability correlated with the concentration of silicon and its chemical species available in dietary supplements. These studies showed that silicic acid Si(OH)4 revealed the highest bioavailability [74]. Higher cross-linked forms of silica species prevented a good bioavailability due to their low absorption in the gastrointestinal tract [11]. If we translate this to the chemical components found in the various analyzed systems, the uptake would then decrease in the order of Q0 > Q1 > Q2 > Q3 > Q4; correlated in another way, the higher the silanol group content, the higher the bioavailability. The Silicea and PKS were suspensions of rather highly cross-linked SiO2 in water. No orthosilicic acid and no soluble silicic acids could be detected in either sample. However, our study could show that both the number of accessible free silanol groups and the SiO2 surface area were significantly higher in the Silicea than in the PKS. This could possibly have a positive influence on bioavailability and bioactivity [52,75]. The FlKe showed a significantly higher degree of silica cross-linking than the Silicea and PKS. It was also demonstrated that the FlKe was highly crystalline SiO2 in which no free silanol groups were present. Since the bioavailability presumably decreased with increasing cross-linking, the FlKe probably had the lowest bioavailability. In addition, due to the lack of Si-OH groups in the FlKe, the chemical and biological activity of the FlKe was probably lower than that of the Silicea and PKS [52,75]. In the BioSil®, choline-stabilized orthosilicic acid and soluble oligosilicic acid could be detected, which was in contrast to all other products considered. The bioavailability of orthosilicic acid and of soluble silicas was described in literature to be very good because they could be absorbed very well by the gastrointestinal tract without the need for prior metabolism due to their size and neutral charge [1,2,9,10]. However, in the case of the BioSil®, stabilization came at the cost of a high concentration of organic stabilizers. The influence of these stabilizers on the bioavailability compared to that of the non-stabilized silica derivatives is currently unknown and needs to be explored in further studies. It is also not known how the stabilization of orthosilicic acid chemically affects its properties and bioavailability. However, it is conceivable that molecular silicon adducts are formed. No evidence for this was provided in this study, though, which could also be of interest for future studies. The other food supplements usually have a higher silicon concentration. We hypothesized that the bioabsorption of silicon is an interplay of several factors that include the degree of condensation of the silicon species, the presence of other stabilizing agents, and the silanol group content.
5. Conclusions
In this work, it was shown that different silica-based supplements had a variety of chemical structures, degrees of cross-linking, and proportions of accessible silanol groups. Therefore, 29Si SP MAS NMR spectroscopy, TGA, FTIR, and an organic functionalization of the silanol groups were used. In particular, different production methods and sources of SiO2 led to different chemical compositions of dietary supplements. The synthetically produced Original Silicea Balsam showed a rather highly cross-linked SiO2 in an aqueous medium and had a large surface area and still many accessible Si-OH groups. In this product, the SiO2 was present as a gel-like system that consisted of agglomerated and aggregated primary particles in water. According to the manufacturer, the PKS product, which is also in an aqueous medium, originates from natural sources and also has a fairly highly cross-linked SiO2 that, however, has a significantly smaller surface area and a lower proportion of accessible Si-OH groups in the freeze-dried state than the Silicea. This system differs in that it consists of well-dispersed SiO2 nanoparticles in water. In contrast, Flügge’s siliceous earth consists of purified diatoms and, unlike Silicea and PKS, has no free Si-OH groups and consists of fully cross-linked and crystalline SiO2. The product, unlike Silicea and PKS, also exists as a powder and not as a dispersion. The absence of free silanol groups may also have an influence on the bioactivity and bioavailability of the product because this could be increased by free silanol groups. The last product under consideration was a low-cross-linked dissolved silica that is stabilized in a system of water and glycerol with choline as an additive. Stabilized orthosilicic acid and soluble silicas are much better absorbed in the body, and therefore BioSil® from Minerals MV may have a high bioavailability. However, it can be assumed that the bioactivity and bioavailability also depend on other factors such as a high proportion of free silanol groups and a higher overall silicon concentration in the samples. Future studies should investigate the exact relationship between the structure of the SiO2 network and the biological uptake in the human body.
Author Contributions
Conceptualization, G.K.; Methodology, Y.C. and M.K.; Investigation, Y.C. and M.K.; Resources, G.K.; Writing—Original Draft Preparation, Y.C.; Writing—Review and Editing, Y.C., M.K. and G.K.; Supervision, G.K.; Project Administration, G.K.; Funding Acquisition, G.K. All authors have read and agreed to the published version of the manuscript.
Funding
This research was partially funded by Anton Hübner GmbH & Co. KG, Ehrenkirchen, Germany.
Data Availability Statement
The data presented in this study are available on request from the corresponding author. Some data are not publicly available for confidentiality reasons.
Acknowledgments
Instrumentation and technical assistance for this work were provided by the Service Center X-ray Diffraction with financial support from Saarland University and the German Science Foundation (project number INST 256/349-1). We thank Michael Zimmer for support of the NMR measurements and Susanne Harling for carrying out the elemental analyses.
Conflicts of Interest
The funders had no role in the design of the study; in the collection, analyses, or interpretation of data; in the writing of the manuscript; or in the decision to publish the results.
References
- Jurkić, L.M.; Cepanec, I.; Pavelić, S.K.; Pavelić, K. Biological and therapeutic effects of ortho-silicic acid and some ortho-silicic acid-releasing compounds: New perspectives for therapy. Nutr. Metab. 2013, 10, 2. [Google Scholar] [CrossRef] [PubMed] [Green Version]
- Reffitt, D.M.; Jugdaohsingh, R.; Thompson, R.P.H.; Powell, J.J. Silicic acid: Its gastrointestinal uptake and urinary excretion in man and effects on aluminium excretion. J. Inorg. Biochem. 1999, 76, 141–147. [Google Scholar] [CrossRef] [PubMed]
- Sadowska, A.; Świderski, F. Sources, Bioavailability, and Safety of Silicon Derived from Foods and Other Sources Added for Nutritional Purposes in Food Supplements and Functional Foods. Appl. Sci. 2020, 10, 6255. [Google Scholar] [CrossRef]
- Ferreira, A.O.; Freire, É.S.; Polonini, H.C.; Da Silva, P.J.L.C.; Brandão, M.A.F.; Raposo, N.R.B. Anti-Aging Effects of Monomethylsilanetriol and Maltodextrin-Stabilized Orthosilicic Acid on Nails, Skin and Hair. Cosmetics 2018, 5, 41. [Google Scholar] [CrossRef] [Green Version]
- Carlisle, E.M. Silicon as a trace nutrient. Sci. Total Environ. 1988, 73, 95–106. [Google Scholar] [CrossRef]
- Reffitt, D.M.; Ogston, N.; Jugdaohsingh, R.; Cheung, H.F.J.; Evans, B.A.J.; Thompson, R.P.H.; Powell, J.J.; Hampson, G.N. Orthosilicic acid stimulates collagen type 1 synthesis and osteoblastic differentiation in human osteoblast-like cells in vitro. Bone 2003, 32, 127–135. [Google Scholar] [CrossRef]
- Authority, E.F.S. Opinion of the Scientific Panel on Dietetic products, nutrition and allergies [NDA] related to the Tolerable Upper Intake Level of Silicon. EFSA J. 2004, 2, 60. [Google Scholar] [CrossRef]
- Carlisle, E.M. Biochemical and Morphological Changes Associated with Long Bone Abnormalities in Silicon Deficiency. J. Nutr. 1980, 110, 1046–1056. [Google Scholar] [CrossRef]
- Sripanyakorn, S.; Jugdaohsingh, R.; Thompson, R.P.H.; Powell, J.J. Dietary silicon and bone health. Nutr. Bull. 2005, 30, 222–230. [Google Scholar] [CrossRef]
- Jugdaohsingh, R. Silicon and bone health. J. Nutr. Health Aging 2007, 11, 99–110. [Google Scholar]
- Sripanyakorn, S.; Jugdaohsingh, R.; Dissayabutr, W.; Anderson, S.H.C.; Thompson, R.P.H.; Powell, J.J. The comparative absorption of silicon from different foods and food supplements. Br. J. Nutr. 2009, 102, 825–834. [Google Scholar] [CrossRef] [PubMed]
- Scholey, D.V.; Belton, D.J.; Burton, E.J.; Perry, C.C. Bioavailability of a novel form of silicon supplement. Sci. Rep. 2018, 8, 17022. [Google Scholar] [CrossRef]
- Kästele, X.; Klüfers, P.; Kopp, F.; Schuhmacher, J.; Vogt, M. Silicon Chelation in Aqueous and Nonaqueous Media: The Furanoidic Diol Approach. Chem. Eur. J. 2005, 11, 6326–6346. [Google Scholar] [CrossRef]
- Voronkov, M.G.; Baryshok, V.P. Atranes as a new generation of biologically active substances. Her. Russ. Acad. Sci. 2010, 80, 514–521. [Google Scholar] [CrossRef]
- Puri, J.K.; Singh, R.; Chahal, V.K. Silatranes: A review on their synthesis, structure, reactivity and applications. Chem. Soc. Rev. 2011, 40, 1791–1840. [Google Scholar] [CrossRef] [PubMed]
- Frye, C.L.; Vogel, G.E.; Hall, J.A. Triptych-siloxazolidines: Pentacoordinate bridgehead silanes resulting from transannular interaction of nitrogen and silicon. J. Am. Chem. Soc. 1961, 83, 996–997. [Google Scholar]
- Sieburth, S.M.; Chen, C.-A. Silanediol Protease Inhibitors: From Conception to Validation. Eur. J. Org. Chem. 2006, 2006, 311–322. [Google Scholar] [CrossRef]
- Chen, C.-A.; Sieburth, S.M.; Glekas, A.; Hewitt, G.W.; Trainor, G.L.; Erickson-Viitanen, S.; Garber, S.S.; Cordova, B.; Jeffry, S.; Klabe, R.M. Drug design with a new transition state analog of the hydrated carbonyl: Silicon-based inhibitors of the HIV protease. Chem. Biol. 2001, 8, 1161–1166. [Google Scholar] [CrossRef] [Green Version]
- Kim, J.; Glekas, A.; Sieburth, S.M. Silanediol-Based inhibitor of thermolysin. Bioorg. Med. Chem. Lett. 2002, 12, 3625–3627. [Google Scholar] [CrossRef]
- Mutahi, M.W.; Nittoli, T.; Guo, L.; Sieburth, S.M. Silicon-Based Metalloprotease Inhibitors: Synthesis and Evaluation of Silanol and Silanediol Peptide Analogues as Inhibitors of Angiotensin-Converting Enzyme1. J. Am. Chem. Soc. 2002, 124, 7363–7375. [Google Scholar] [CrossRef]
- Sieburth, S.M.; Nittoli, T.; Mutahi, A.M.; Guo, L. Silanediols: A New Class of Potent Protease Inhibitors. Angew. Chem. Int. Ed. 1998, 37, 812–814. [Google Scholar] [CrossRef]
- Blunder, M.; Hurkes, N.; Spirk, S.; List, M.; Pietschnig, R. Silanetriols as in vitro inhibitors for AChE. Bioorg. Med. Chem. Lett. 2011, 21, 363–365. [Google Scholar] [CrossRef] [PubMed]
- Pietschnig, R.; Spirk, S. The chemistry of organo silanetriols. Coord. Chem. Rev. 2016, 323, 87–106. [Google Scholar] [CrossRef]
- Tacke, R. Milestones in the Biochemistry of Silicon: From Basic Research to Biotechnological Applications. Angew. Chem. Int. Ed. 1999, 38, 3015–3018. [Google Scholar] [CrossRef]
- Mojet, B.L.; Ebbesen, S.D.; Lefferts, L. Light at the interface: The potential of attenuated total reflection infrared spectroscopy for understanding heterogeneous catalysis in water. Chem. Soc. Rev. 2010, 39, 4643–4655. [Google Scholar] [CrossRef]
- Artemov, V.G.; Uykur, E.; Roh, S.; Pronin, A.V.; Ouerdane, H.; Dressel, M. Revealing excess protons in the infrared spectrum of liquid water. Sci. Rep. 2020, 10, 11320–11329. [Google Scholar] [CrossRef]
- Rahman, I.A.; Vejayakumaran, P.; Sipaut, C.S.; Ismail, J.; Chee, C.K. Effect of the drying techniques on the morphology of silica nanoparticles synthesized via sol–gel process. Ceram. Int. 2008, 34, 2059–2066. [Google Scholar] [CrossRef]
- Jafarzadeh, M.; Rahman, I.A.; Sipaut, C.S. Synthesis of silica nanoparticles by modified sol–gel process: The effect of mixing modes of the reactants and drying techniques. J. Sol.-Gel. Sci. Technol. 2009, 50, 328–336. [Google Scholar] [CrossRef] [Green Version]
- Zhang, T.; Wang, Y.; Luo, G.; Bai, S. Effects of Precipitation and Drying Processes on the Synthesis of Silica Materials with a Large-Pore-Volume and Narrow-Pore-Diameter Distribution. Ind. Eng. Chem. Res. 2016, 55, 3579–3587. [Google Scholar] [CrossRef]
- Schneider, C.A.; Rasband, W.S.; Eliceiri, K.W. NIH Image to ImageJ: 25 years of image analysis. Nat. Methods 2012, 9, 671–675. [Google Scholar] [CrossRef]
- Sarawade, P.B.; Kim, J.-K.; Hilonga, A.; Quang, D.V.; Kim, H.T. Effect of drying technique on the physicochemical properties of sodium silicate-based mesoporous precipitated silica. Appl. Surf. Sci. 2011, 258, 955–961. [Google Scholar] [CrossRef]
- Ek, S.; Root, A.; Peussa, M.; Niinistö, L. Determination of the hydroxyl group content in silica by thermogravimetry and a comparison with 1H MAS NMR results. Thermochim. Acta 2001, 379, 201–212. [Google Scholar] [CrossRef]
- de Farias, R.F.; Airoldi, C. Thermogravimetry as a Reliable tool to Estimate the Density of Silanols on a Silica Gel Surface. J. Therm. Anal. Calorim. 1998, 53, 751–756. [Google Scholar] [CrossRef]
- Peng, L.; Qisui, W.; Xi, L.; Chaocan, Z. Investigation of the states of water and OH groups on the surface of silica. Colloids Surf. A 2009, 334, 112–115. [Google Scholar] [CrossRef]
- Cheng, Z.; Shan, H.; Sun, Y.; Zhang, L.; Jiang, H.; Li, C. Evolution mechanism of surface hydroxyl groups of silica during heat treatment. Appl. Surf. Sci. 2020, 513, 145766. [Google Scholar] [CrossRef]
- Metin, C.O.; Lake, L.W.; Miranda, C.R.; Nguyen, Q.P. Stability of aqueous silica nanoparticle dispersions. J. Nanoparticle Res. 2011, 13, 839–850. [Google Scholar] [CrossRef]
- Liu, Q.X.; Xu, W.C. Study on Preparation and Properties of Precipitated Silica. Adv. Mater. Res. 2012, 468–471, 1353–1358. [Google Scholar] [CrossRef]
- Uchino, T.; Sakka, T.; Iwasaki, M. Interpretation of Hydrated States of Sodium Silicate Glasses by Infrared and Raman Analysis. J. Am. Ceram. Soc. 1991, 74, 306–313. [Google Scholar] [CrossRef]
- Jitianu, A.; Gonzalez, G.; Klein, L.C. Hybrid Sol–Gel Glasses with Glass-Transition Temperatures Below Room Temperature. J. Am. Ceram. Soc. 2015, 98, 3673–3679. [Google Scholar] [CrossRef] [Green Version]
- Husung, R.D.; Doremus, R.H. The infrared transmission spectra of four silicate glasses before and after exposure to water. J. Mater. Res. 1990, 5, 2209–2217. [Google Scholar] [CrossRef]
- Al-Oweini, R.; El-Rassy, H. Synthesis and characterization by FTIR spectroscopy of silica aerogels prepared using several Si(OR)4 and R′′Si(OR′)3 precursors. J. Mol. Struct. 2009, 919, 140–145. [Google Scholar] [CrossRef]
- Medvedev, E.F.; Komarevskaya, A.S. IR spectroscopic study of the phase composition for sodium silicate synthesized in aqueous medium. Glass Ceram. 2007, 64, 7–11. [Google Scholar] [CrossRef]
- Kapusuz, D. Sol–gel derived silica/polyethylene glycol hybrids as potential oligonucleotide vectors. J. Mater. Res. 2019, 34, 3787–3797. [Google Scholar] [CrossRef]
- Li, J.; Hayakawa, S.; Shirosaki, Y.; Osaka, A. Revisiting structure of silica gels from water glass: An 1H and 29Si MAS and CP-MAS NMR study. J. Sol.-Gel. Sci. Technol. 2013, 65, 135–142. [Google Scholar] [CrossRef]
- Ide, M.; El-Roz, M.; De Canck, E.; Vicente, A.; Planckaert, T.; Bogaerts, T.; Van Driessche, I.; Lynen, F.; Van Speybroeck, V.; Thybault-Starzyk, F.; et al. Quantification of silanol sites for the most common mesoporous ordered silicas and organosilicas: Total versus accessible silanols. Phys. Chem. Chem. Phys. 2013, 15, 642–650. [Google Scholar] [CrossRef] [PubMed]
- Halasz, I.; Kierys, A.; Goworek, J.; Liu, H.; Patterson, R.E. 29Si NMR and Raman Glimpses into the Molecular Structures of Acid and Base Set Silica Gels Obtained from TEOS and Na-Silicate. J. Phys. Chem. C 2011, 115, 24788–24799. [Google Scholar] [CrossRef]
- Bahlmann, E.K.F.; Harris, R.K.; Say, B.J. Method for the quantification of silicon-29 NMR spectra, developed for viscous silicate solutions. Magn. Reson. Chem. 1993, 31, 266–267. [Google Scholar] [CrossRef]
- Bahlmann, E.F.; Harris, R.; Rockliffe, J.; Smith, E. Silicon-29 NMR self-diffusion and chemical-exchange studies of concentrated sodium silicate solutions. J. Chem. Soc. Faraday Trans. 1997, 93, 93–98. [Google Scholar] [CrossRef]
- Cabrera, Y.; Cabrera, A.; Larsen, F.H.; Felby, C. Solid-state 29Si NMR and FTIR analyses of lignin-silica coprecipitates. Holzforschung 2016, 70, 709–718. [Google Scholar] [CrossRef]
- Webb, J.D.; Seki, T.; Goldston, J.F.; Pruski, M.; Crudden, C.M. Selective functionalization of the mesopores of SBA-15. Microporous Mesoporous Mater. 2015, 203, 123–131. [Google Scholar] [CrossRef] [Green Version]
- Protsak, I.S.; Morozov, Y.M.; Dong, W.; Le, Z.; Zhang, D.; Henderson, I.M. A 29Si, 1H, and 13C Solid-State NMR Study on the Surface Species of Various Depolymerized Organosiloxanes at Silica Surface. Nanoscale Res. Lett. 2019, 14, 160. [Google Scholar] [CrossRef] [PubMed] [Green Version]
- Serra, J.; González, P.; Liste, S.; Chiussi, S.; León, B.; Pérez-Amor, M.; Ylänen, H.O.; Hupa, M. Influence of the non-bridging oxygen groups on the bioactivity of silicate glasses. J. Mater. Sci. Mater. Med. 2002, 13, 1221–1225. [Google Scholar] [CrossRef] [PubMed]
- Plumeré, N.; Ruff, A.; Speiser, B.; Feldmann, V.; Mayer, H.A. Stöber silica particles as basis for redox modifications: Particle shape, size, polydispersity, and porosity. J. Colloid Interface Sci. 2012, 368, 208–219. [Google Scholar] [CrossRef] [PubMed]
- Jae Chul, R.; In, J.C. Structures and properties of silica gels prepared by the sol—Gel method. J. Non-Cryst. Solids 1991, 130, 8–17. [Google Scholar] [CrossRef]
- ALOthman, Z.A. A Review: Fundamental Aspects of Silicate Mesoporous Materials. Materials 2012, 5, 2874–2902. [Google Scholar] [CrossRef] [Green Version]
- Fripiat, J.; Uytterhoeven, J. Hydroxyl content in silica gel “Aerosil”. J. Phys. Chem. 1962, 66, 800–805. [Google Scholar] [CrossRef]
- Capel-Sanchez, M.C.; Barrio, L.; Campos-Martin, J.M.; Fierro, J.L.G. Silylation and surface properties of chemically grafted hydrophobic silica. J. Colloid Interface Sci. 2004, 277, 146–153. [Google Scholar] [CrossRef]
- Khedkar, M.V.; Somvanshi, S.B.; Humbe, A.V.; Jadhav, K.M. Surface modified sodium silicate based superhydrophobic silica aerogels prepared via ambient pressure drying process. J. Non-Cryst. Solids 2019, 511, 140–146. [Google Scholar] [CrossRef]
- Bu, J.; Rhee, H.K. Silylation of Ti-MCM-41 by trimethylsilyl-imidazole and its effect on the olefin epoxidation with aqueous H2O2. Catal. Lett. 2000, 66, 245–249. [Google Scholar] [CrossRef]
- Chen, Y.; Sepahvand, S.; Gauvin, F.; Schollbach, K.; Brouwers, H.; Yu, Q. One-pot synthesis of monolithic silica-cellulose aerogel applying a sustainable sodium silicate precursor. Constr. Build. Mater. 2021, 293, 123289. [Google Scholar] [CrossRef]
- Gao, G.-M.; Liu, D.-R.; Zou, H.-F.; Zou, L.-C.; Gan, S.-C. Preparation of silica aerogel from oil shale ash by fluidized bed drying. Powder Technol. 2010, 197, 283–287. [Google Scholar] [CrossRef]
- Venkateswara Rao, A.; Kulkarni, M.M.; Amalnerkar, D.P.; Seth, T. Superhydrophobic silica aerogels based on methyltrimethoxysilane precursor. J. Non-Cryst. Solids 2003, 330, 187–195. [Google Scholar] [CrossRef]
- Haukka, S.; Root, A. The reaction of hexamethyldisilazane and subsequent oxidation of trimethylsilyl groups on silica studied by solid-state NMR and FTIR. J. Phys. Chem. 1994, 98, 1695–1703. [Google Scholar] [CrossRef]
- Koyano, K.A.; Tatsumi, T.; Tanaka, Y.; Nakata, S. Stabilization of Mesoporous Molecular Sieves by Trimethylsilylation. J. Phys. Chem. B 1997, 101, 9436–9440. [Google Scholar] [CrossRef]
- Odenwald, C.; Kickelbick, G. Additive-free continuous synthesis of silica and ORMOSIL micro- and nanoparticles applying a microjet reactor. J. Sol.-Gel. Sci. Technol. 2018, 89, 343–353. [Google Scholar] [CrossRef]
- Xue, S.-H.; Xie, H.; Ping, H.; Li, Q.-C.; Su, B.-L.; Fu, Z.-Y. Induced transformation of amorphous silica to cristobalite on bacterial surfaces. RSC Adv. 2015, 5, 71844–71848. [Google Scholar] [CrossRef]
- Sumper, M.; Kröger, N. Silica formation in diatoms: The function of long-chain polyamines and silaffins. J. Mater. Chem. 2004, 14, 2059–2065. [Google Scholar] [CrossRef]
- Spearing, D.R.; Farnan, I.; Stebbins, J.F. Dynamics of the α-β phase transitions in quartz and cristobalite as observed by in-situ high temperature 29Si and 17O NMR. Phys. Chem. Miner. 1992, 19, 307–321. [Google Scholar] [CrossRef]
- Trujillo, S.A.; Peña-Solórzano, D.; Bejarano, O.R.; Ochoa-Puentes, C. Tin(ii) chloride dihydrate/choline chloride deep eutectic solvent: Redox properties in the fast synthesis of N-arylacetamides and indolo(pyrrolo)[1,2-a] quinoxalines. RSC Adv. 2020, 10, 40552–40561. [Google Scholar] [CrossRef]
- Jansson, H.; Bernin, D.; Ramser, K. Silicate species of water glass and insights for alkali-activated green cement. AIP Adv. 2015, 5, 067167. [Google Scholar] [CrossRef]
- Bass, J.L.; Turner, G.L. Anion Distributions in Sodium Silicate Solutions. Characterization by 29SI NMR and Infrared Spectroscopies, and Vapor Phase Osmometry. J. Phys. Chem. B 1997, 101, 10638–10644. [Google Scholar] [CrossRef]
- Harris, R.K.; Bahlmann, E.K.F.; Metcalfe, K.; Smith, E.G. Quantitative silicon-29 NMR investigations of highly concentrated high-ratio sodium silicate solutions. Magn. Reson. Chem. 1993, 31, 743–747. [Google Scholar] [CrossRef]
- Schraml, J.; Sandor, P.; Korec, S.; Krump, M.; Foller, B. Improved baseline in 29Si NMR spectra of water glasses. Magn. Reson. Chem. 2013, 51, 403–406. [Google Scholar] [CrossRef] [PubMed]
- Van Dyck, K.; Van Cauwenbergh, R.; Robberecht, H.; Deelstra, H. Bioavailability of silicon from food and food supplements. Fresenius J. Anal. Chem. 1999, 363, 541–544. [Google Scholar] [CrossRef]
- Horcajada, P.; Rámila, A.; Boulahya, K.; González-Calbet, J.; Vallet-Regí, M. Bioactivity in ordered mesoporous materials. Solid State Sci. 2004, 6, 1295–1300. [Google Scholar] [CrossRef]
Figure 1.
Sequence of ESEM images taken during in situ freeze-drying of Silicea. (a) ESEM image at the beginning of the in situ freeze-drying (800 Pa, 2.9 °C); (b) ESEM image (450 Pa, −7.1 °C) after 3 min 25 sec; (c) ESEM image (400 Pa, −7.4 °C) after 4 min 6 sec; (d) ESEM image (10 Pa, −25 °C) after 6 min 59 sec; (e) ESEM image (10 Pa, −25 °C) after 7 min 38 sec; (f) ESEM image after 20 min at the end of in situ freeze-drying.

Figure 2.
(a) ESEM image of a freeze-dried sample of Silicea gel; (b) image of the untreated Silicea gel; (c) image of the freeze-dried Silicea.
Figure 2.
(a) ESEM image of a freeze-dried sample of Silicea gel; (b) image of the untreated Silicea gel; (c) image of the freeze-dried Silicea.

Figure 3.
Cryo-TEM images of the Silicea gel: (a) non-dried; (b) freeze-dried in aqueous suspension.
Figure 3.
Cryo-TEM images of the Silicea gel: (a) non-dried; (b) freeze-dried in aqueous suspension.

Figure 4.
(a) TEM images of Silicea; (b) size distribution of determined particle diameters of Silicea primary particles analyzed on 40 particles by applying the ImageJ software ImageJ (Version 1.53e, Bethesda, Rockville, MD, USA) [30].
Figure 4.
(a) TEM images of Silicea; (b) size distribution of determined particle diameters of Silicea primary particles analyzed on 40 particles by applying the ImageJ software ImageJ (Version 1.53e, Bethesda, Rockville, MD, USA) [30].

Figure 5.
(a) TGA measurement of freeze-dried Silicea gel; (b) FTIR spectra of freeze-dried Silicea and the TMS-functionalized Silicea.
Figure 5.
(a) TGA measurement of freeze-dried Silicea gel; (b) FTIR spectra of freeze-dried Silicea and the TMS-functionalized Silicea.

Figure 6.
29Si SP MAS NMR spectrum of freeze-dried Silicea gel.

Figure 7.
Reaction scheme of the functionalization of freeze-dried Silicea gel with HMDS.

Figure 8.
(a) TGA measurements of the freeze-dried Silicea functionalized with HMDS; (b) 29Si SP MAS NMR spectrum of Silicea functionalized with HMDS.
Figure 8.
(a) TGA measurements of the freeze-dried Silicea functionalized with HMDS; (b) 29Si SP MAS NMR spectrum of Silicea functionalized with HMDS.

Figure 9.
(a) Number-weighted DLS measurement of the untreated PKS sample; (b) FTIR spectra of freeze-dried PKS and the TMS-functionalized product; (c) TGA measurement of the freeze-dried PKS sample; (d) 29Si SP MAS NMR spectrum of the freeze-dried sample PKS.
Figure 9.
(a) Number-weighted DLS measurement of the untreated PKS sample; (b) FTIR spectra of freeze-dried PKS and the TMS-functionalized product; (c) TGA measurement of the freeze-dried PKS sample; (d) 29Si SP MAS NMR spectrum of the freeze-dried sample PKS.

Figure 10.
(a) TGA measurement of functionalized PKS; (b) 29Si SP MAS NMR spectrum of the functionalized freeze-dried PKS sample.
Figure 10.
(a) TGA measurement of functionalized PKS; (b) 29Si SP MAS NMR spectrum of the functionalized freeze-dried PKS sample.

Figure 11.
(a) FTIR spectrum of the untreated FlKe sample; (b) XRD pattern of the untreated FlKe.

Figure 12.
SEM images of (a) FlKe and (b) thermally untreated diatoms; light microscopy images of (c) FlKe and (d) thermally untreated diatoms.
Figure 12.
SEM images of (a) FlKe and (b) thermally untreated diatoms; light microscopy images of (c) FlKe and (d) thermally untreated diatoms.

Figure 13.
(a) TGA measurement of untreated FlKe; (b) 29Si SP MAS NMR spectra of FlKe.

Figure 14.
1H NMR spectrum of BioSil® in D2O.

Figure 15.
(a) FTIR spectra of BioSil® and glycerol; (b) 29Si NMR spectrum of BioSil® without correction; (c) 29Si NMR spectrum of BioSil® with correction of the broad signal of amorphous glass.
Figure 15.
(a) FTIR spectra of BioSil® and glycerol; (b) 29Si NMR spectrum of BioSil® without correction; (c) 29Si NMR spectrum of BioSil® with correction of the broad signal of amorphous glass.


Table 1.
Illustration of the degree of cross-linking and Si-OH content of the freeze-dried samples (FD), the functionalized freeze-dried samples (TMS), and FlKe, which was characterized via 29Si SP MAS NMR. The percentages of the Q units were calculated by dividing the integration values of a single Q unit by the sum of all Q units. The total Si-OH content was calculated from the Q2 and Q3 units.
| Sample | Q2 Unit (%) | Q3 Unit (%) | Q4 Unit (%) | Total Si-OH Content (%) |
|---|---|---|---|---|
| Silicea (FD) | 2 | 25 | 73 | 29 |
| Silicea (TMS) | 0 | 13 | 87 | 13 |
| PKS (FD) | 2 | 24 | 74 | 28 |
| PKS (TMS) | 0 | 17 | 83 | 17 |
| FlKe | 0 | 0 | 100 | 0 |
Disclaimer/Publisher’s Note: The statements, opinions and data contained in all publications are solely those of the individual author(s) and contributor(s) and not of MDPI and/or the editor(s). MDPI and/or the editor(s) disclaim responsibility for any injury to people or property resulting from any ideas, methods, instructions or products referred to in the content. |
© 2023 by the authors. Licensee MDPI, Basel, Switzerland. This article is an open access article distributed under the terms and conditions of the Creative Commons Attribution (CC BY) license (https://creativecommons.org/licenses/by/4.0/).
Share and Cite
MDPI and ACS Style
Curto, Y.; Koch, M.; Kickelbick, G. Chemical and Structural Comparison of Different Commercial Food Supplements for Silicon Uptake. Solids 2023, 4, 1-21. https://doi.org/10.3390/solids4010001
AMA Style
Curto Y, Koch M, Kickelbick G. Chemical and Structural Comparison of Different Commercial Food Supplements for Silicon Uptake. Solids. 2023; 4(1):1-21. https://doi.org/10.3390/solids4010001
Chicago/Turabian StyleCurto, Yannic, Marcus Koch, and Guido Kickelbick. 2023. "Chemical and Structural Comparison of Different Commercial Food Supplements for Silicon Uptake" Solids 4, no. 1: 1-21. https://doi.org/10.3390/solids4010001