Article

Removal of Fe3+ Ions from Aqueous Solutions by Adsorption on Natural Eco-Friendly Brazilian Palygorskites

by
Antonieta Middea
1,*,
Luciana dos Santos Spinelli
2,3,
Fernando Gomes de Souza Junior
2,3,
Thais de Lima Alves Pinheiro Fernandes
1,
Luiz Carlos de Lima
1,
Vitoria Maria Tupinamba Souza Barthem
4,
Otávio da Fonseca Martins Gomes
1,5 and
Reiner Neumann
1,5
1
Centre for Mineral Technology (CETEM), Av. Pedro Calmon, 900, Cidade Universitária, Rio de Janeiro 21941908, Brazil
2
Institute of Macromolecules, Federal University of Rio de Janeiro, Av. Horácio Macedo, 2030, Cidade Universitária, Rio de Janeiro 21941598, Brazil
3
COPPE Nanotechnology Engineering Program, Federal University of Rio de Janeiro, Av. Horácio Macedo, 2030, Cidade Universitária, Rio de Janeiro 21941972, Brazil
4
Physics Institute, Federal University of Rio de Janeiro, Av. Athos da Silveira Ramos, 149, Cidade Universitária, Rio de Janeiro 21941972, Brazil
5
National Museum of Brazil, Federal University of Rio de Janeiro, Postgraduate Program in Geosciences, Av. Quinta da Boa Vista, S/N Bairro Imperial de São Cristóvão, Rio de Janeiro 20940040, Brazil
*
Author to whom correspondence should be addressed.
Mining 2024, 4(1), 37-57; https://doi.org/10.3390/mining4010004
Submission received: 21 December 2023 / Revised: 15 January 2024 / Accepted: 18 January 2024 / Published: 19 January 2024

Abstract

:
This work focuses on the characterization of five palygorskite clays from the Brazilian state of Piaui and their feasibility as eco-friendly adsorbents for the removal of Fe3+ ions from aqueous solutions. For characterization, we applied the techniques of X-ray diffraction (XRD), X-ray fluorescence (XRF), scanning electron microscopy with energy dispersive spectroscopy (SEM/EDS), size distribution measurements, density measurement by He pycnometry, superconducting quantum interference device (SQUID) magnetometry, Fourier-transform infrared spectroscopy (FTIR), thermogravimetric analysis (TGA/DTA), zeta potential measurement, hydrophobicity determination by contact angle, Brunauer–Emmett–Teller surface area analysis (BET technique) and atomic force microscopy (AFM). Batch experiments were performed in function of process parameters such as contact time and initial concentration of Fe3+. The natural palygorskites (Palys) had excellent performance for the removal of Fe3+ from aqueous solutions by adsorption (around 60 mg/g), and the Langmuir is supposedly the best model fitted the experimental data.

1. Introduction

Iron is widely used in industry for many purposes, but effluents containing iron require adequate treatment since it is not biodegradable and tends to accumulate in living organisms, causing various diseases and disorders, including digestive problems and brain damage. In drinking water, it can also cause an unpleasant odor and taste along with turbidity [1].
Therefore, removal of Fe3+ from effluents is very important. There are many methods described in the literature for removal of cations [2,3,4,5,6,7]. However, methods are often expensive and complicated to perform, so there is a need to develop new methods that are simpler and less expensive. Among these methods, adsorption is cost-effective and simple to perform [8,9,10]. The adsorption process usually employs natural organic or inorganic materials that are abundant and inexpensive [11,12]. In this regard, palygorskite (Paly) is a low-cost and environmentally friendly natural fibrous silicate clay material with tubular structure and good mechanical strength, thermal stability and hydrophilicity [13,14,15,16,17,18]. The adsorption capacity of Paly results from its relatively high surface area and the net negative charge in its structure, which attracts and holds cations such as Fe3+, and it is a fibrous hydrated magnesium silicate; its structural formula can be written as (OH2)4(OH)2Mg5Si8O20·4H2O [19]. It presents ribbons of 2:1 phyllosilicate units, where each ribbon is connected to the next by the inversion of SiO4 tetrahedrons along a set of Si-O-Si bonds, resulting in channels parallel to the phyllosilicate ribbons that contain zeolitic and bound water [20]. Paly deposits around the world mostly come from arid or semiarid regions [21]. In Brazil, these deposits are mainly located in the municipality of Guadalupe, Piaui state (see Figure 1), and were discovered in 1982 [22,23,24,25,26,27]. Paly has been used in domestic water purification, drilling fluids, cosmetics, pharmaceuticals and polymer formulations [28,29,30,31,32,33,34,35,36], including to remove cations by adsorption [37,38,39,40].
In this work, five eco-friendly adsorbents as Palys (Paly I, Paly II, Paly III, Paly IV and Paly V) were used to remove Fe3+ from an aqueous solution, as a continuation of a previous study where this possibility was investigated [9], being the great novelty of this study. First, the Paly samples were subjected to quartz concentration reduction. After that, they were characterized by XRD, XRF, SEM/EDS, size distribution analysis, density measurement by He pycnometry, SQUID magnetometry, FTIR, TGA/DTA, zeta potential and hydrophobicity by contact angle measurement. Next, adsorption experiments were performed to evaluate the effects of time and initial Fe3+ concentration. Kinetic and equilibrium models were fitted to the experimental adsorption data to investigate the potential adsorptive influence of Palys on the Fe3+ removal. The Paly sample with the best iron adsorption performance was further characterized by the BET and AFM techniques.

2. Materials and Methods
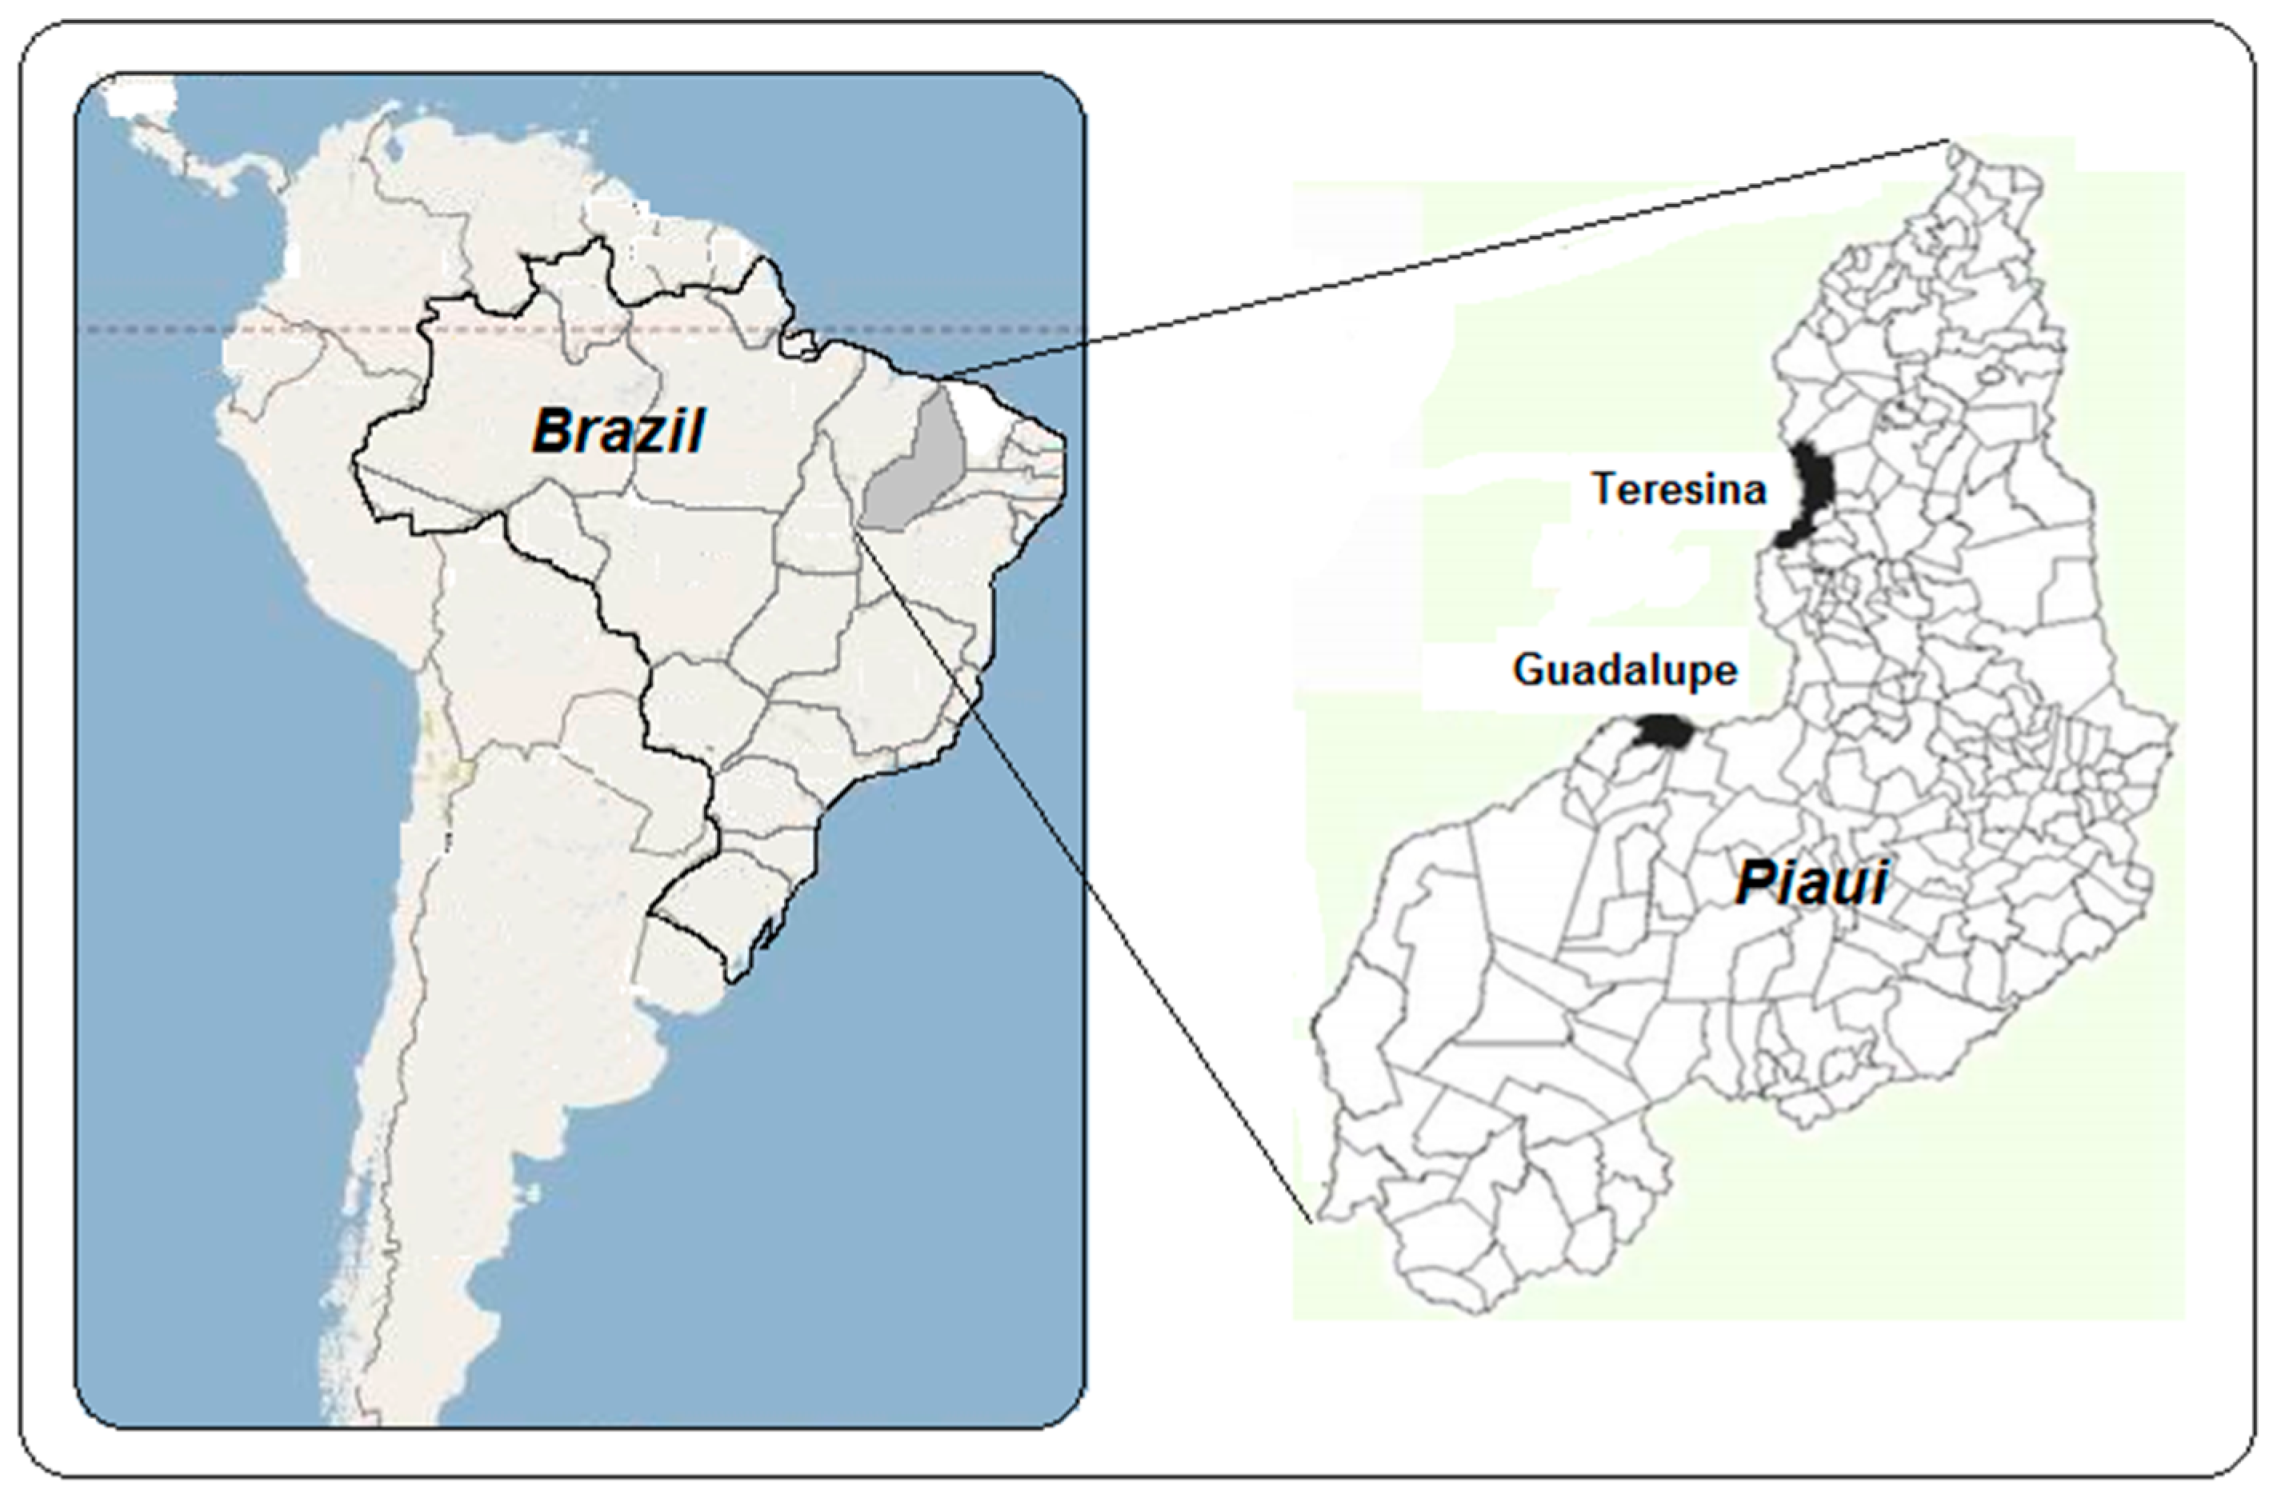
2.1. Materials

The Paly clay deposits used in this work are located in the municipality of Guadalupe, located about 300 km south of the capital of Piaui state, in the North region of Brazil (Figure 1). Regarding the impurities present in the composition of Palys, this depends on the geological formation as well as on the extraction location [41,42,43].
Paly clays were kindly donated by the company Colorminas-Colorífico e Mineração S.A (Piauí-Guadalupe, Brazil) and were purified by sedimentation and screening. The particle size was selectivity restricted to below 20 µm by passing the ground purified sample through a 635-mesh sieve.
For this study, 5 Paly samples were selected from a total of 13 samples from different mining areas of the company. The criterion used for this choice was to observe which samples had the highest peaks referring to Paly in the X-ray diffractogram (d-spacing = 10.5 Å). These five Palys were processed using the dense liquid separation technique (bromoform, d = 2.89 g/cm3) [44] in order to reduce the quartz concentration in the samples.
Analytic-grade ferric chloride hexahydrate (FeCl3·6H2O) was used as received from Merck, and distilled water (pH 6.0 and <550 ppm of total salt content) was used throughout.

2.2. Batch Kinetic Experiments

Batch adsorption experiments were conducted with 100,000 mg/L Paly and initial Fe3+ concentrations (zero to 20,000 mg/L) (Ci) under ambient conditions and carried out in 50 mL conical flasks placed in a thermostatic shaker bath at 130 rpm. The residual concentration (Cf) of Fe3+ after centrifugation at 3500 rpm for 15 min was determined by a LaMotte Smart Spectro UV-VIS spectrophotometer using 1 cm path quartz cells and a wavenumber of 370 nm by comparison with a previously established analytical curve [9].

2.3. Adsorption Procedure

The adsorption capacity of Fe3+ on Palys was calculated through the following equation:
Γ = (Ci − Cf)·V/W
where Γ is the Fe3+ adsorption capacity of the adsorbent (mg/g), Ci is the initial concentration of the Fe3+ solution (mg/L), Cf is the final Fe3+ concentration in solution (mg/L), W is the weight of adsorbent used (g) and V is the volume of the Fe3+ solution (L).

2.4. Characterization of Materials

2.4.1. Mineralogical and Chemical Characterization

The mineralogical analyses of the Paly clays were carried out by XRD. To avoid preferred orientation, the samples were back-loaded and the XRD patterns were obtained with a Bruker-D4 Endeavour diffractometer (Karlsruhe, Germany) operating at a tube voltage and current of 40 kV and 40 mA, respectively, using Co kα radiation. Diffraction patterns were recorded between 5° and 80° 2 theta with a 0.02° step and a position-sensitive LynxEye detector (Karlsruhe, Germany).
The chemical composition of the samples was determined by XRF after loss on ignition (LOI) determination with a LECO TGA 701 analyzer using a Panalytical AxiosMax spectrometer (Worcestershire, UK) on melted beads (lithium metaborate:tetraborate mixture).

2.4.2. SEM/EDS

The morphology and elemental composition of the Palys were carried out using two scanning electron microscopes. The first one observed the morphology of Palys by secondary electrons in an FEI Quanta 400 scanning electron microscope (Hillsboro, OR, USA) operating at 25 kV and small spot size. The second, a Hitachi TM3030Plus (Tokyo, Japan) scanning electron microscope with an integrated energy-dispersive X-ray fluorescence spectrometer (Bruker Quantax 70 from Karlsruhe, Germany) was used for identification of elements present in the Paly samples (coated with Ag), such as magnesium, and the increase in iron content after the process of adsorption. This SEM was operated at 15 kV, small spot size, while images were acquired in backscattered electron mode (BSE) for elemental contrast and EDS maps were used to identify the elements of interest, accumulated during 200 s.

2.4.3. FTIR

The infrared spectra were obtained using a Perkin-Elmer 1720X spectrophotometer (Orpington, UK) in transmission mode. Spectra over the 4000–400 cm−1 range were obtained from 0.01 g of each sample diluted with KBr.

2.4.4. TGA/DTA

The TGA/DTA analysis was performed with a Mettler Toledo TGA/DSC1 Star System (STARe software, version 9.00), at a heating rate of 10 °C/min, under air atmosphere with a flow rate of 50 mL/min.

2.4.5. Size Distribution and Surface Charge

The size distribution of the five Palys was evaluated by two techniques: laser diffraction with a Mastersizer 2000 analyzer and dynamic light scattering with a Zetasizer Nano ZS, both from Malvern Instruments (Grovewood Road, UK). These techniques allow particle size detections between 0.1 μm and 1000 μm and 0.6 nm and 6 μm, respectively. For these methods, the samples were dispersed in water for 30 min at 1700 rpm.
Surface charges were also evaluated with a Malvern Instruments Zetasizer Nano ZS. For surface charge measurements (an average of 3 points), a suspension of each Paly sample in 10−3 molar KCl (indifferent electrolyte) was prepared. The pH was adjusted with NaOH and HCl in the range between 2.0 and 11.0 [21].

2.4.6. Hydrophobicity

The Palys’ hydrophobicity was evaluated by water contact angle measurements with a Dataphysics OCA Series goniometer (Filderstadt, Germany),with the Paly and Paly-Fe3+ samples placed on a slide and pressed to form small disks using the sessile drop technique.

2.4.7. Density Measurement by He Pycnometry and BET Surface Area Analysis

The Palys’ densities and surface areas were measured with an AccuPyc 1330 (He) pycnometer and an ASAP 2010 analyzer, respectively, from Micrometics Instrument Corporation (Norcross, GA, USA).
The BET surface area and pore properties of the Paly III sample were determined from N2 adsorption–desorption experiments at 77 K using an accelerated surface area and porosimetry system. The sample was outgassed at 70 °C for 24 h to remove any moisture or adsorbed contaminants before the surface area measurements. The microporous surface area, external surface area and the micropore volume were obtained by the t-plot method. Meanwhile, the pore volume and pore-size distribution were estimated by the Barrett–Joyner–Halenda (BJH) method [45].

2.4.8. SQUID Magnetometry

SQUID Cryogenic S600 magnetometer

The magnetic behavior of the samples was observed by the measurements obtained with a magnetometry system based on a physical effect and quantification of the magnetic flux in a closed superconductor circuit, which is highly sensitive to small magnetic flux variations. For these measurements, we used a clear plastic straw as the sample holder because of the negligible magnetic signal in relation to that of the various samples tested.

2.4.9. AFM

Finally, the three-dimensional AFM topographical acquisition image of Paly III crystals was obtained with a JPK atomic force microscope, where the sample was fixed on a transparent glass slide using double-sided adhesive tape. Roughness was measured using the root mean square (RMS) value within the given regions.

3. Results and Discussion

3.1. XRD Studies

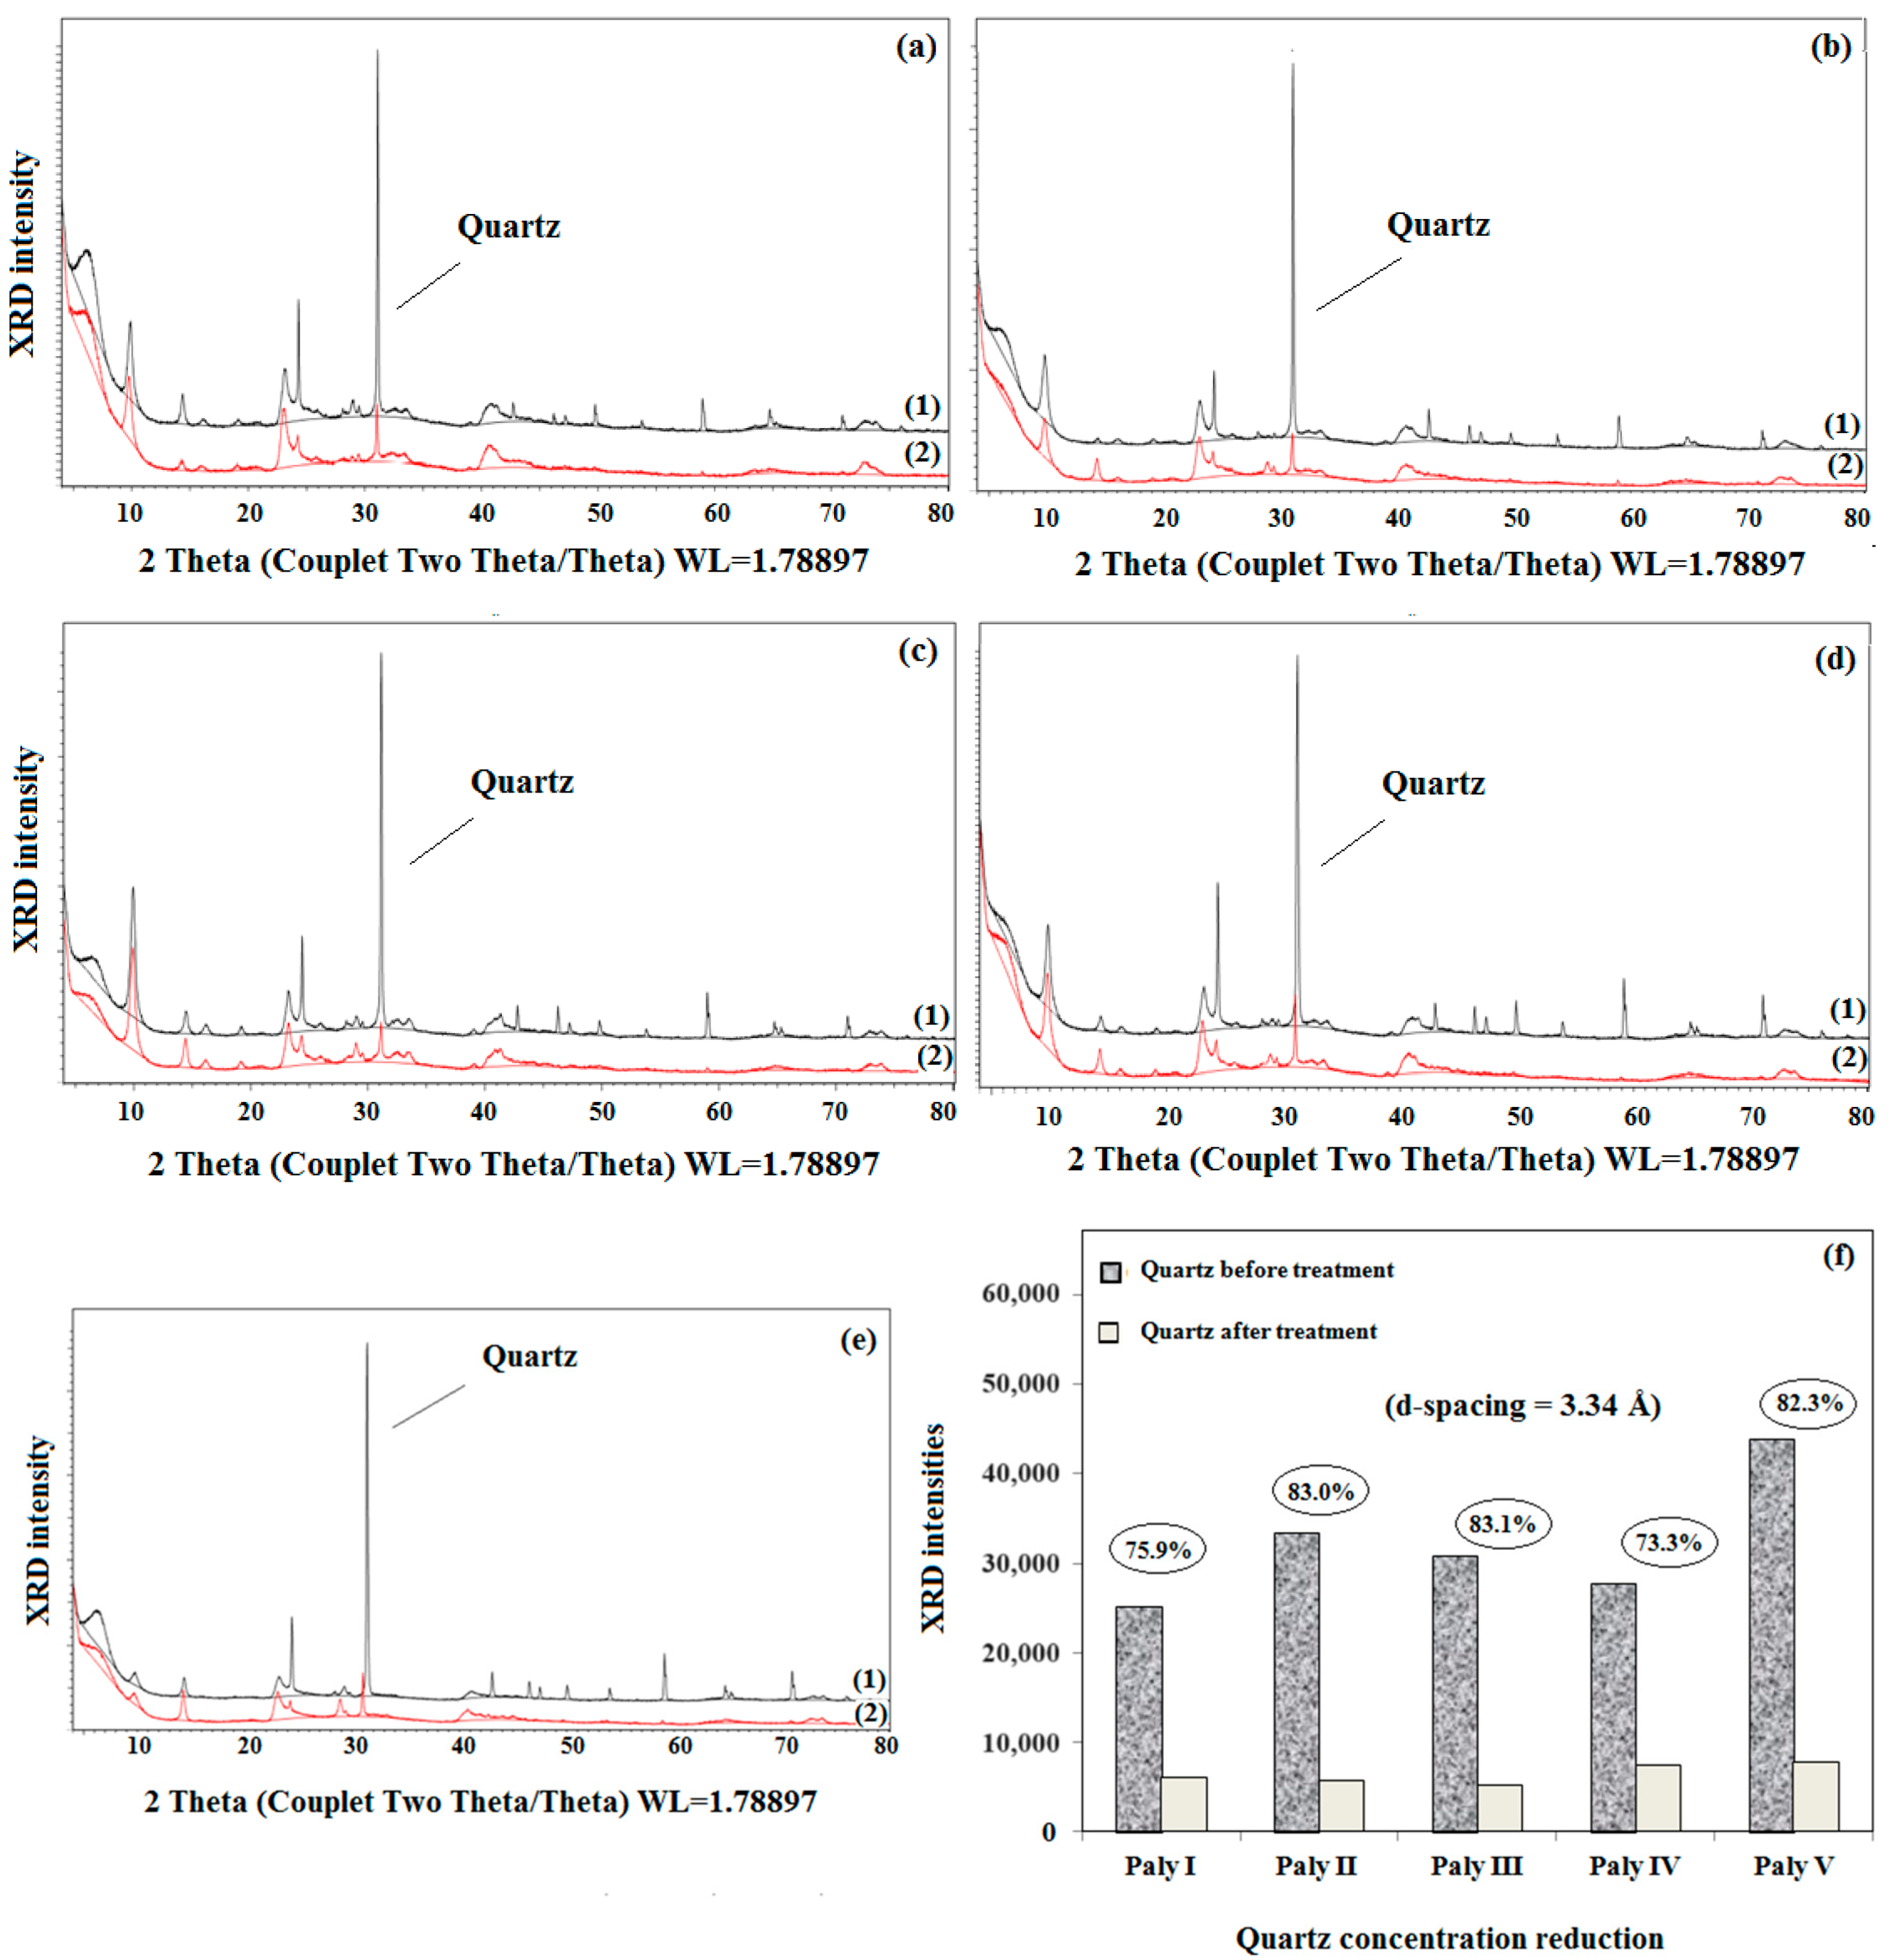
3.1.1. Quartz Concentration Reduction of Raw Palys

Figure 2 shows the comparison of XRD spectra for raw Palys and Palys after quartz reduction. It can be noted that the quartz diffraction peaks were greatly reduced after using the dense liquid separation technique (Figure 2a–e). Figure 2f shows the quartz XRD intensities of the most significant peak (d-spacing = 3.34 Å) before and after reduction treatment. This enabled an approximate analysis of the amount of quartz phase present in the five Palys, verifying quartz reduction efficiency of around 80%.

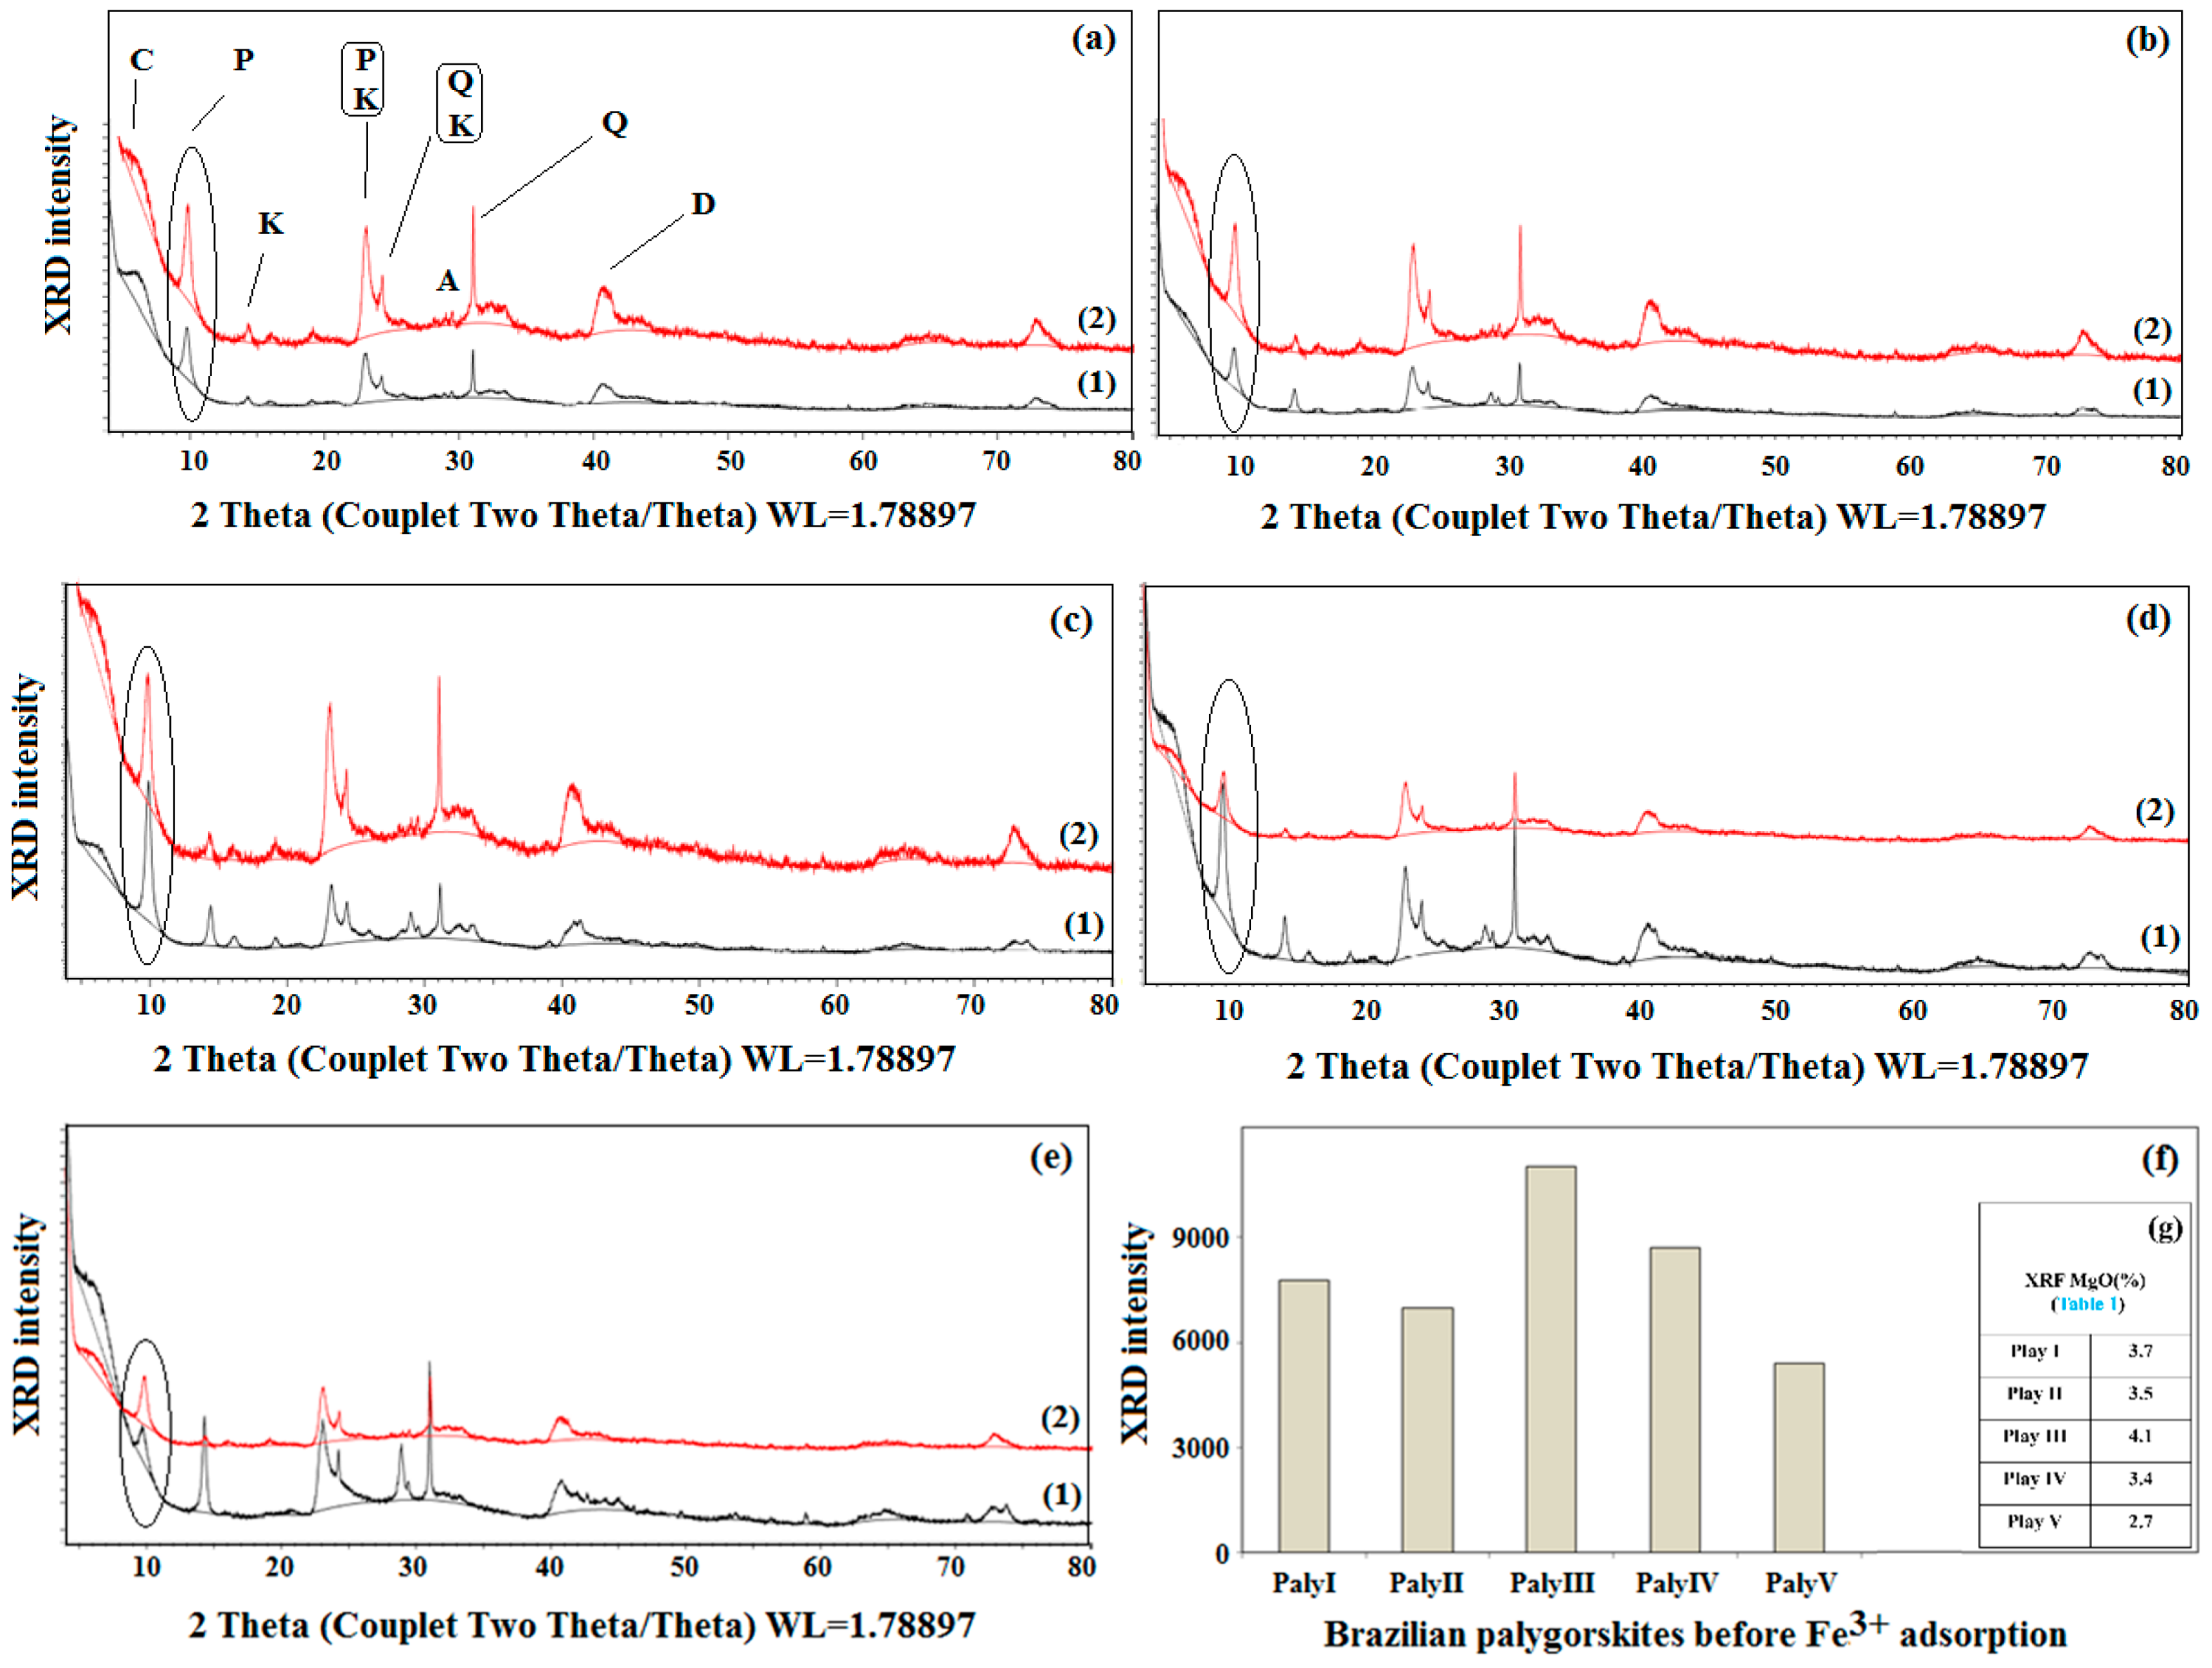
3.1.2. Mineralogical Analysis

The XRD patterns of the Palys and Palys-Fe3+ are shown in Figure 3a–e. An identical pattern of the Paly standard can be seen, and their peaks did not undergo significant changes [46]. The impurities found were clinochlore [Fe6Si4O10(OH)8], kaolinite [Al2Si2O5(OH)2], quartz [SiO2], anatase [TiO2] and diaspore [AlO(OH)]. The identified crystalline phases were in agreement with the results observed by XRF (Table 1). Additionally, Figure 3f shows a comparison of the XRD count intensities of the main Paly peak (d-spacing = 10.5 Å), indicating that Paly III had a higher concentration than the other samples, which can also be observed by XRF for the MgO content (Table 1).

3.2. Characterization of Palys before and after Fe3+ Adsorption (Palys-Fe3+)

3.2.1. XRF

XRF data of Palys and Palys-Fe3+, expressed in oxide percentage, are shown in Table 1. The first loss, around 20%, is related to loss of water and organic matter. SiO2 (above 43%) and Al2O3 (around 15%) were the main components found in the Palys, and both concentrations decreased after Fe3+ adsorption, as expected. On the other hand, iron concentration increased in all Palys studied after Fe3+ adsorption, from approximately 9% to 15%.

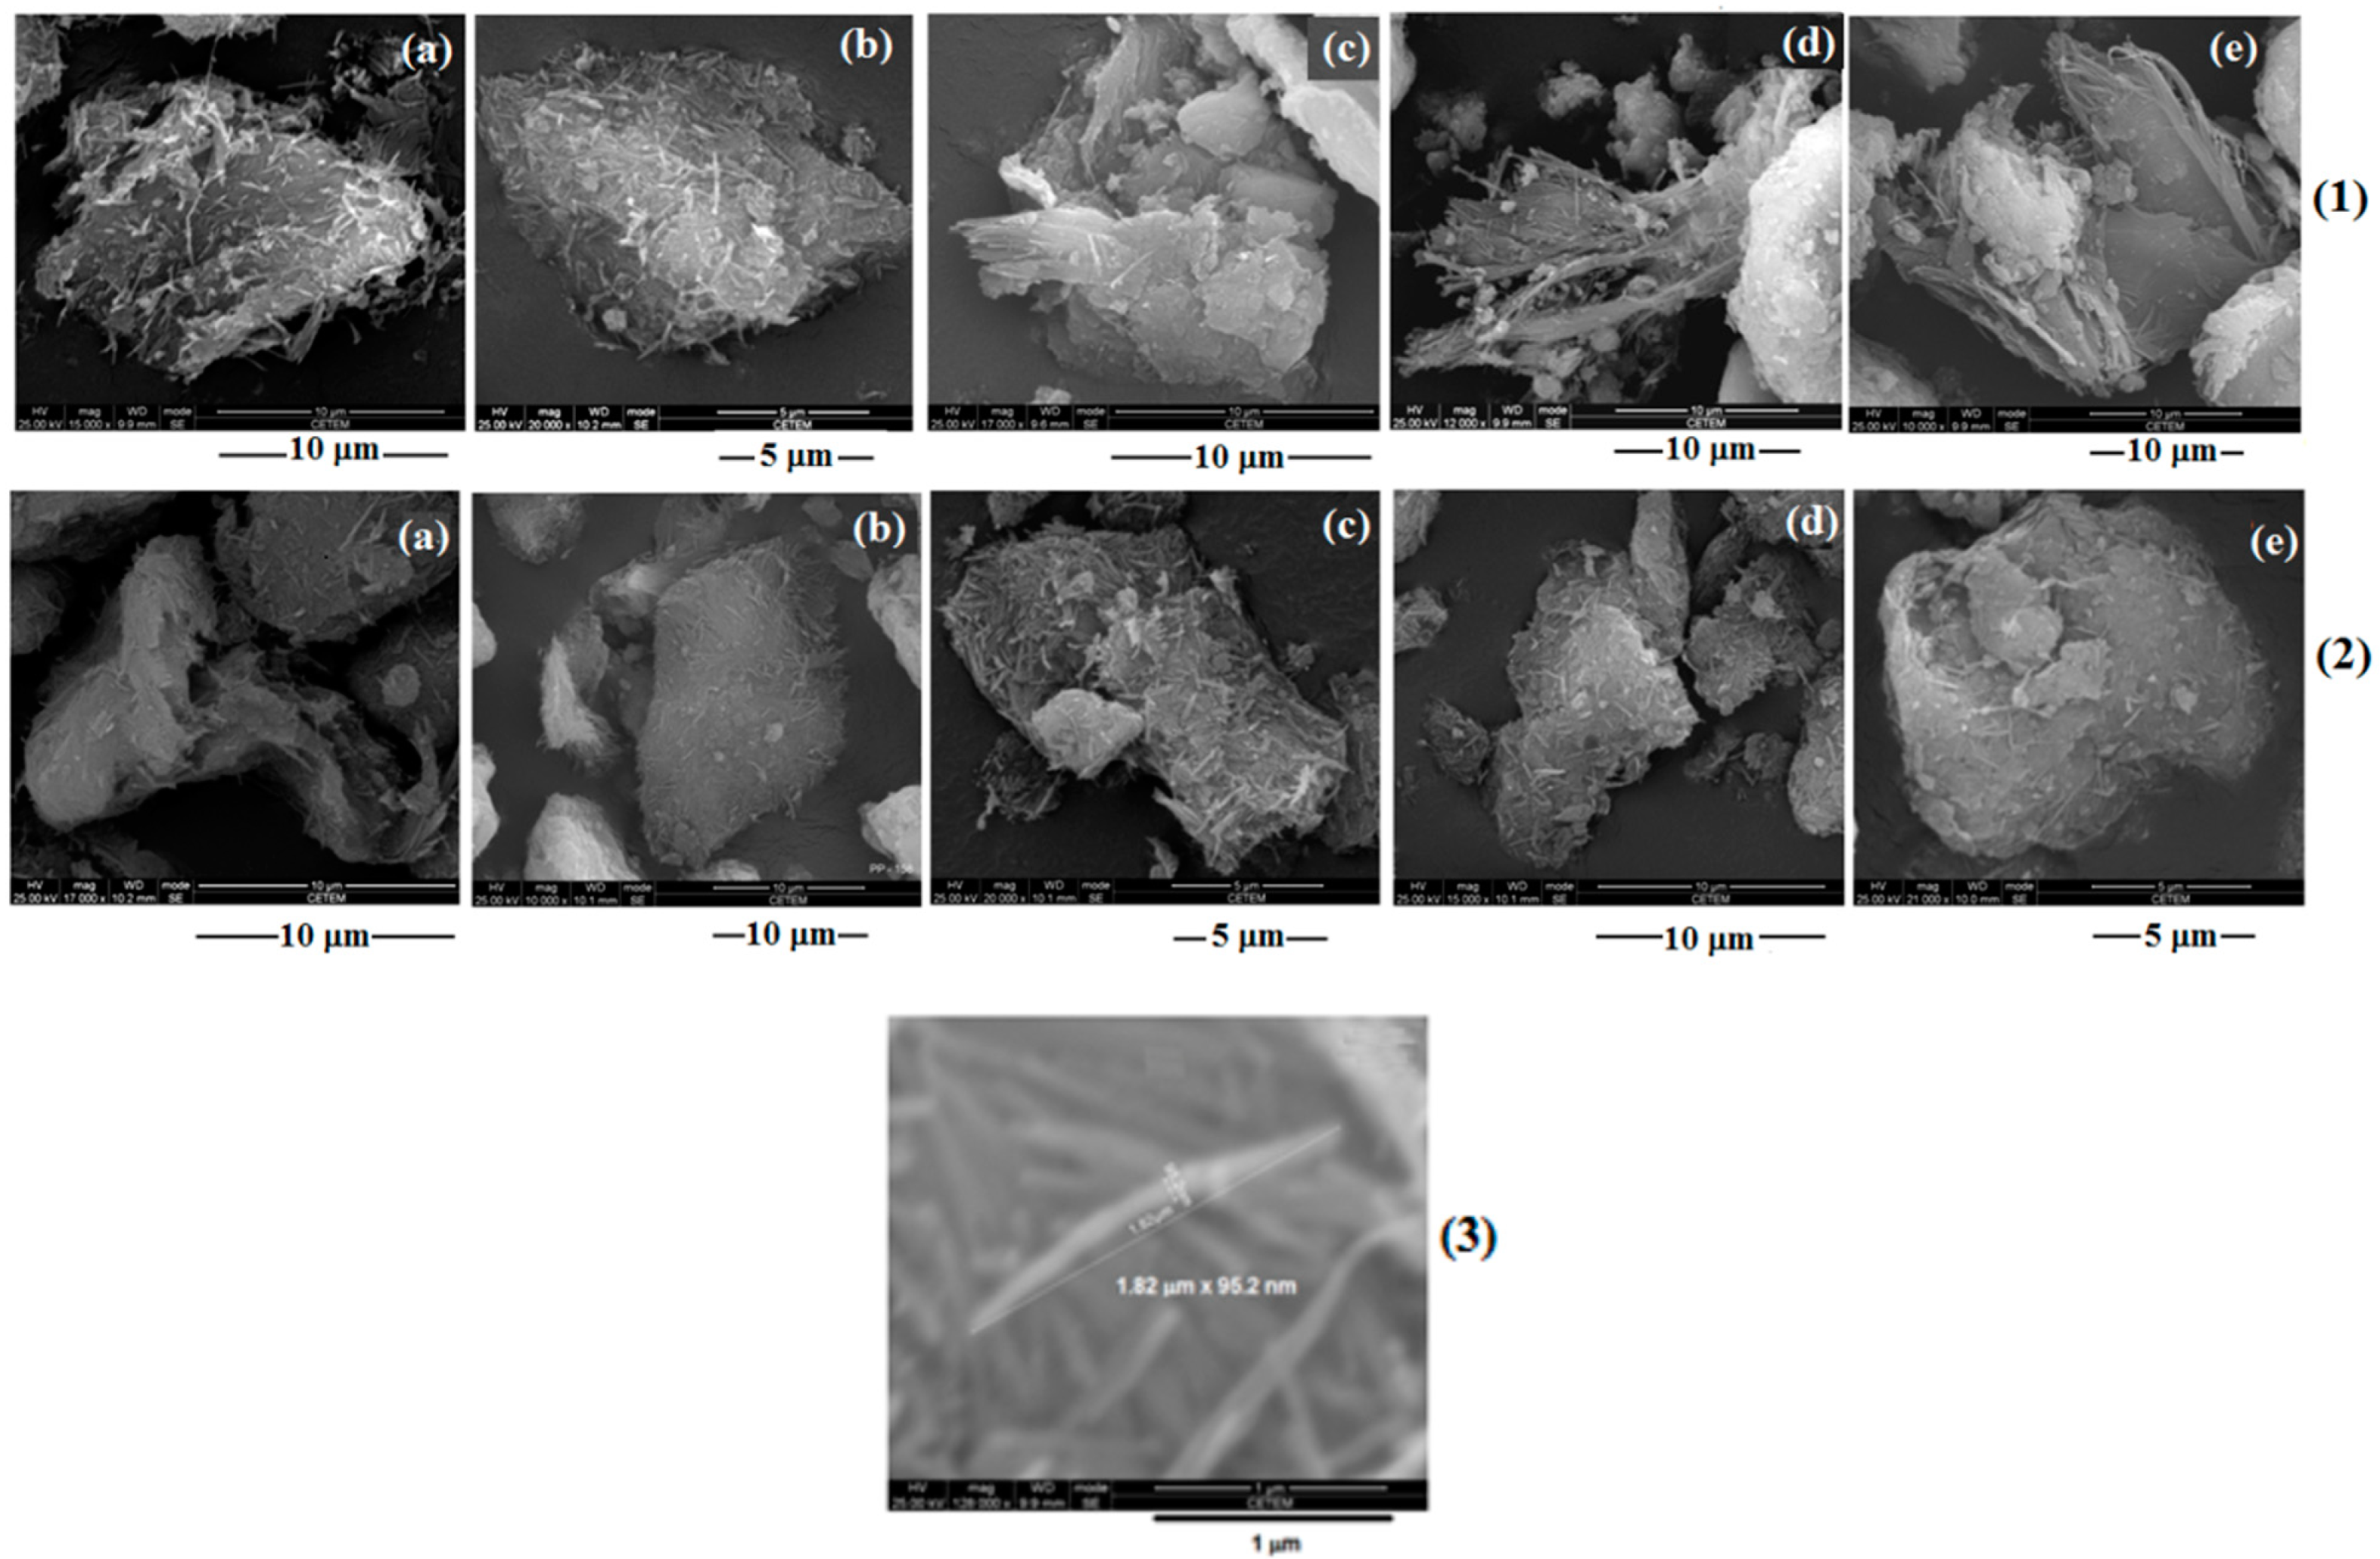
3.2.2. Microtexture Studies—SEM

The SEM observations verified the characteristic morphology for the five Palys and Palys-Fe3+. The Paly fibers are depicted in Figure 4. Unmodified Palys (Figure 4(1)) show typical fibers, with variable thicknesses and lengths, with randomly oriented shapes in aggregates, as shown in several previous studies [47,48,49,50]. This was probably due to strong physical and hydrogen bonding interactions between OH groups of Paly fibers. A large number of crystal beams and a few single needle-like crystals were also observed. The fiber bundles were usually assembled by an individual needle. The morphological differences between the unmodified Palys and Palys-Fe3+ can be observed in Figure 4(2), where there were no significant differences after Fe3+ adsorption on Paly surfaces. Finally, Figure 4(3) shows a detailed image of a Paly sample (Paly I), where an individual needle measuring 1.82 µm versus 95.2 nm can be observed.

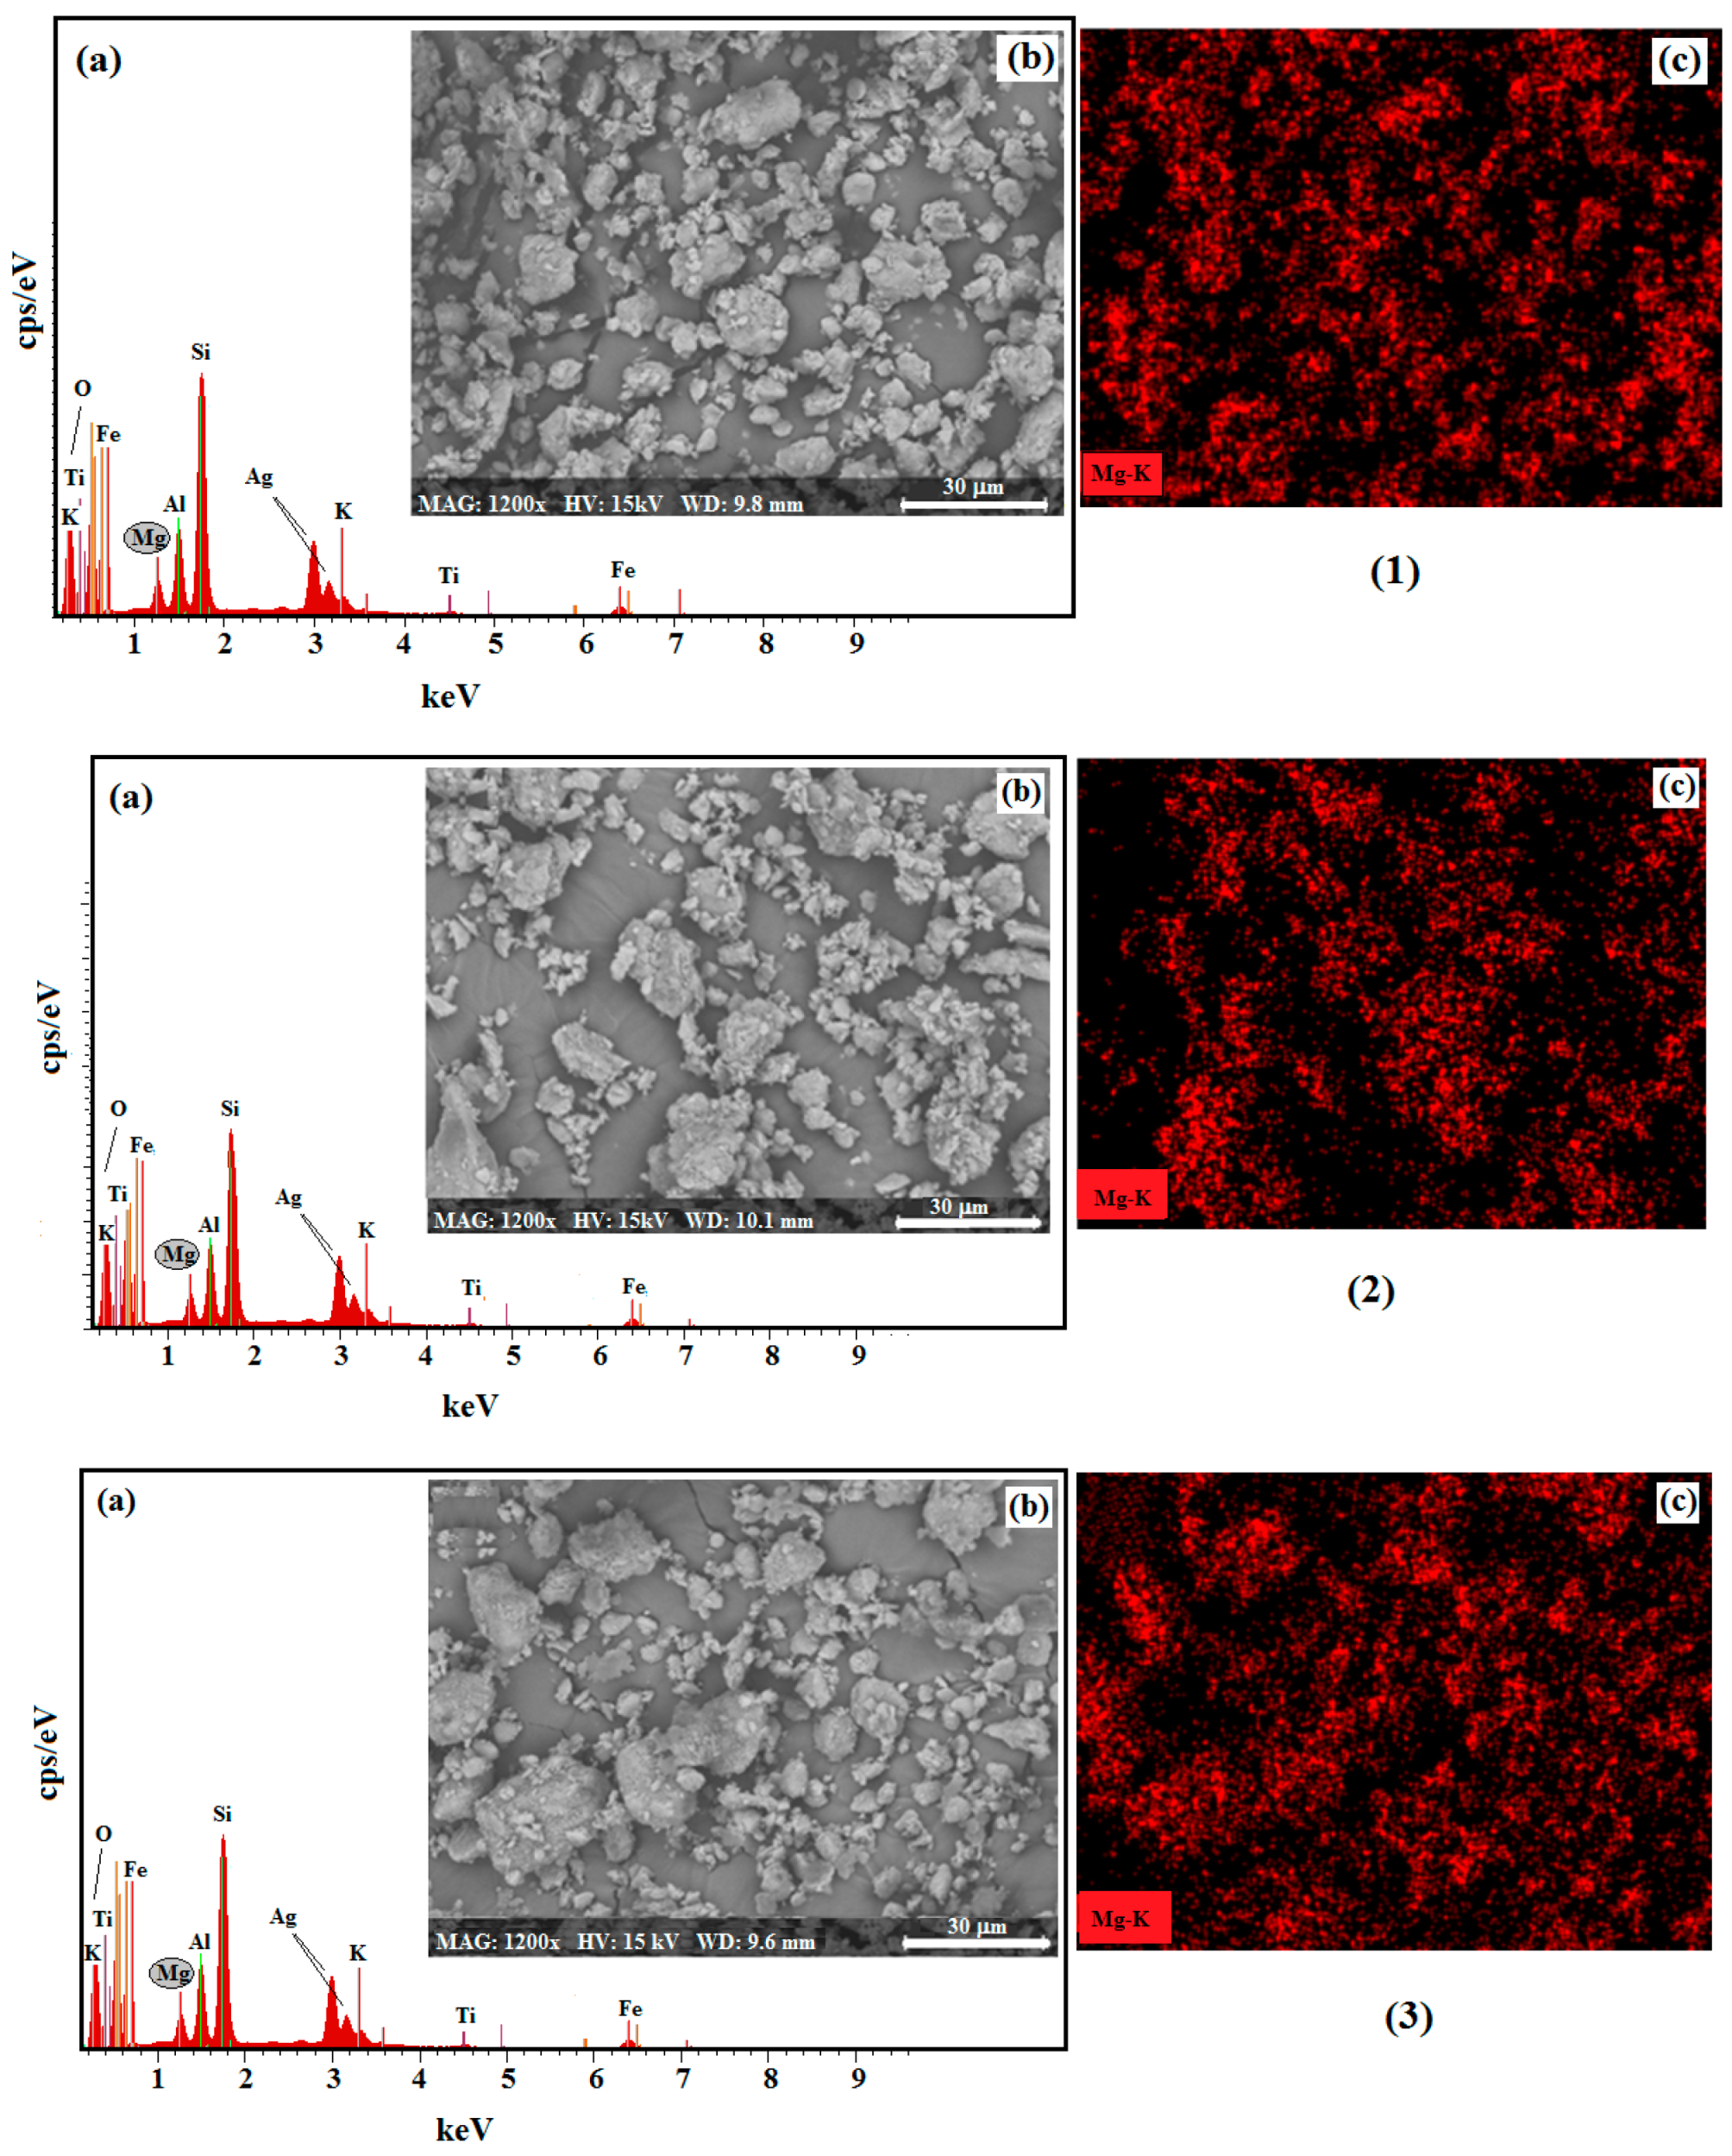
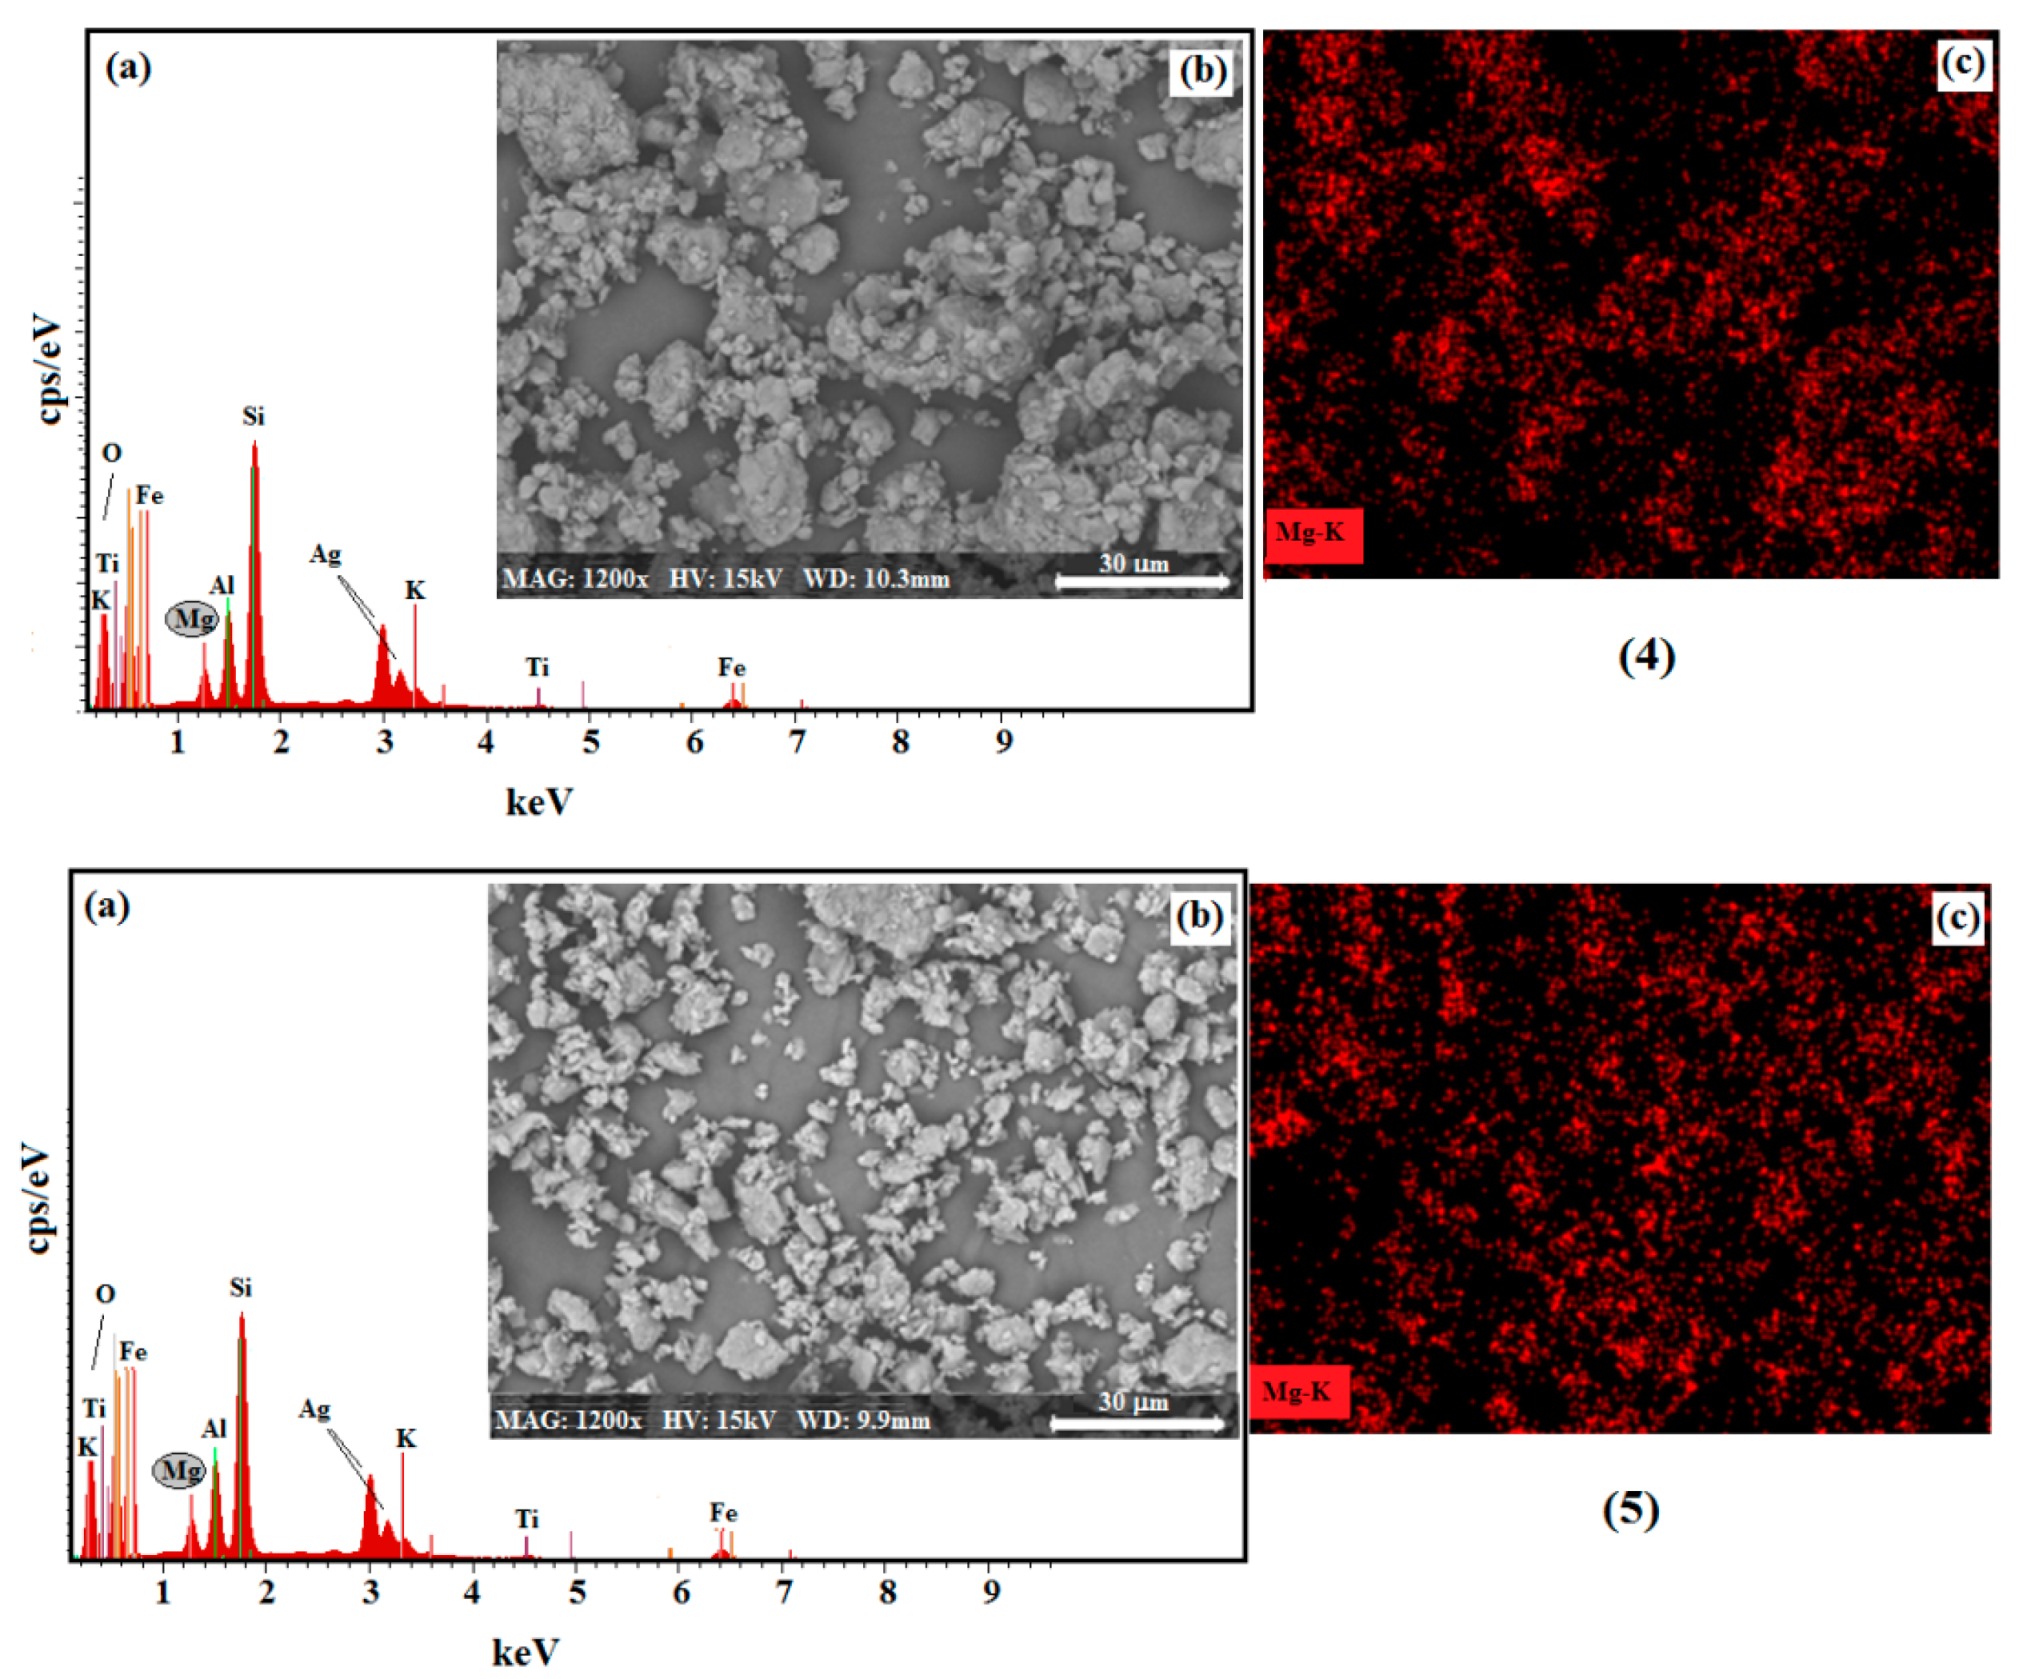
3.2.3. SEM/EDS Mappings—Mg Distribution

Figure 5 presents the acquired EDS spectra (Figure 5(1a)–(5a)) with the corresponding BSE images (Figure 5(1b)–(5b)), as well the X-ray maps showing the distribution of Mg in Palys before Fe3+ adsorption (Figure 5(1c)–(5c)). The chemical elements observed were Si, Mg, Al, Fe, Ti and K, corroborating the findings by XRF (Table 1). Additionally, it can be seen that Mg was evenly distributed over the entire surface, revealing a uniform and homogeneous distribution of Mg on all five Paly samples’ surfaces. Thus, we can assume that the adsorption of Fe3+ also followed the same behavior and occurred uniformly on all Paly surfaces.
The results of the semi-quantitative chemical analyses of Palys and Palys-Fe3+ are summarized in Table 2. For this purpose, the average of three measurements was calculated in three different areas of the samples and normalized to 100%.
As can be seen, Mg presented a value of around 3% before Fe3+ adsorption, whereas Paly III had a slightly higher value of around 4% Mg. In relation to Fe, there was an increase of approximately twice the initial value.
The EDS chemical analyses of Palys and Palys-Fe3+ confirmed the previous results obtained by XRF (Table 1) and XRD (Figure 3), suggesting that the Paly samples had very similar characteristics.

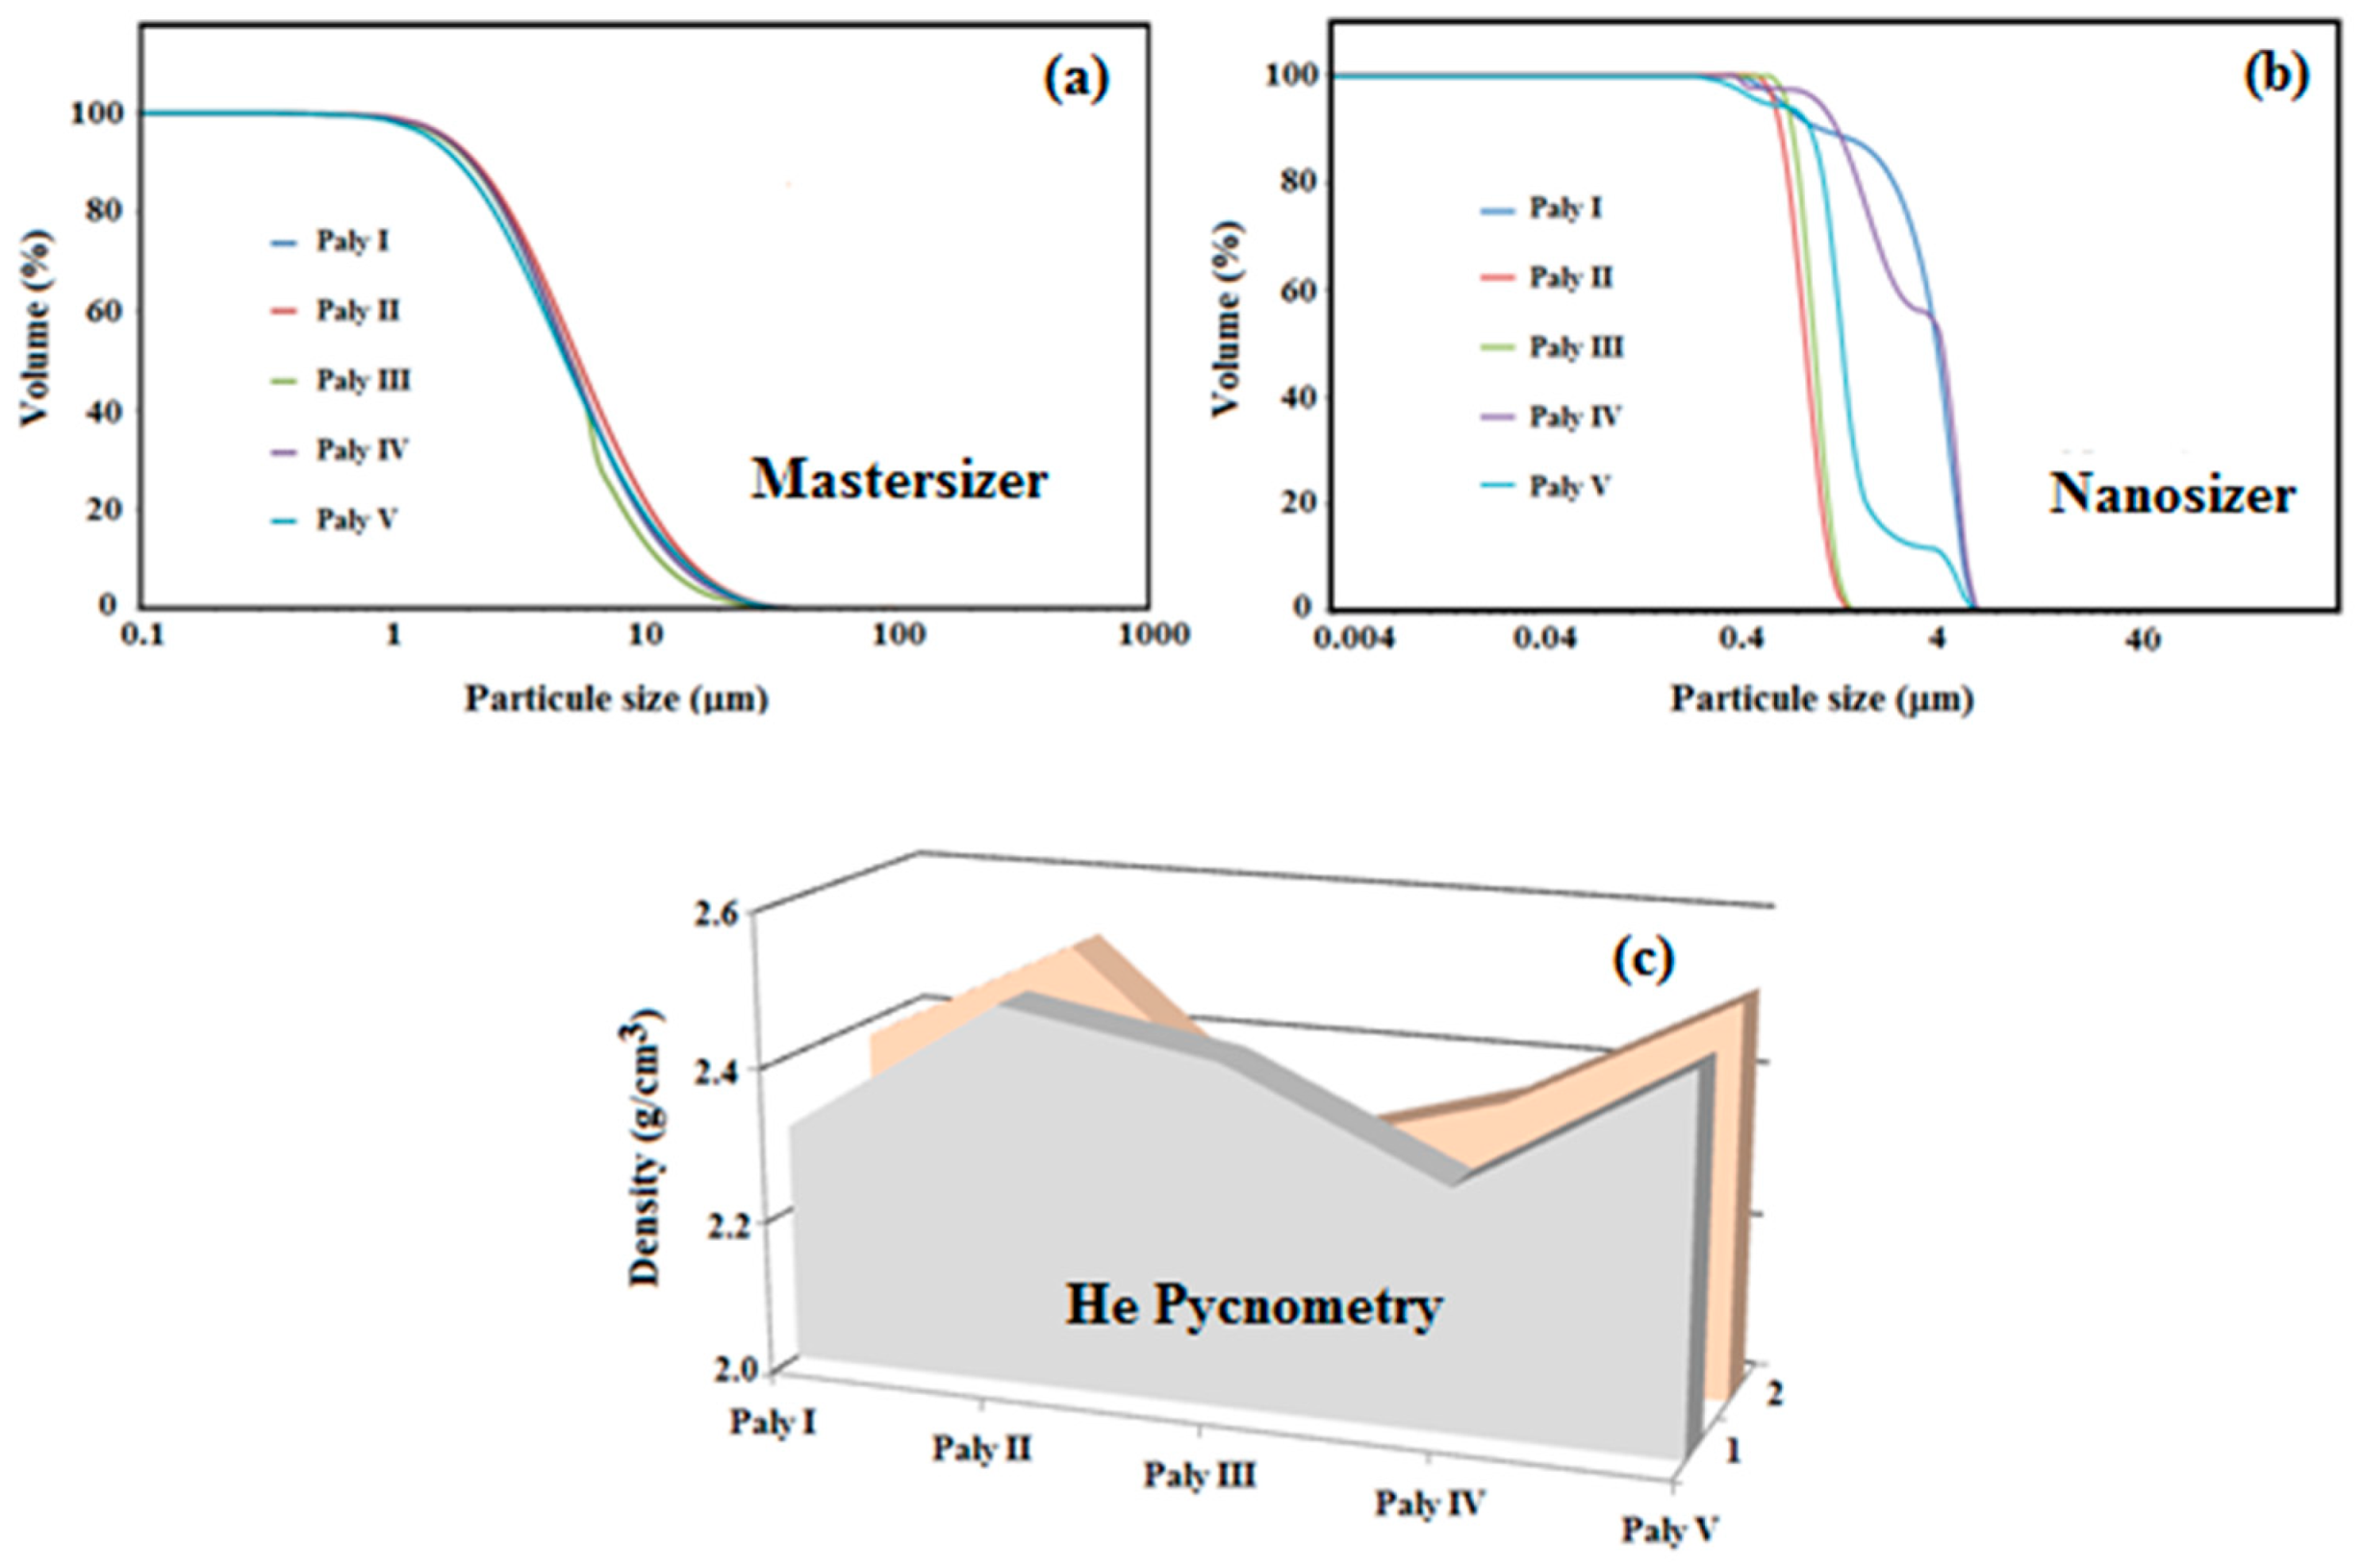
3.2.4. Particle Size Distribution

Figure 6 presents the size distribution of the Palys and Palys-Fe3+ using laser diffraction with a Malvern Mastersizer 2000 (see Figure 6a) and dynamic light scattering with a Zetasizer Nano ZS (Figure 6b), respectively. The Palys and Palys-Fe3+ presented similar behavior, where no size distribution variation was observed by the two techniques employed, around 2.0 μm with the Masterzizer and 0.4 μm with the Nanosizer, showing no increase in size distribution after adsorption along with nanometer sizes, as expected. Additionally, Paly and Paly-Fe3+ density measurements by He pycnometry are shown in Figure 6c, where it can also be seen that no important changes occurred in their densities, which remained around 2.5 g/cm3.

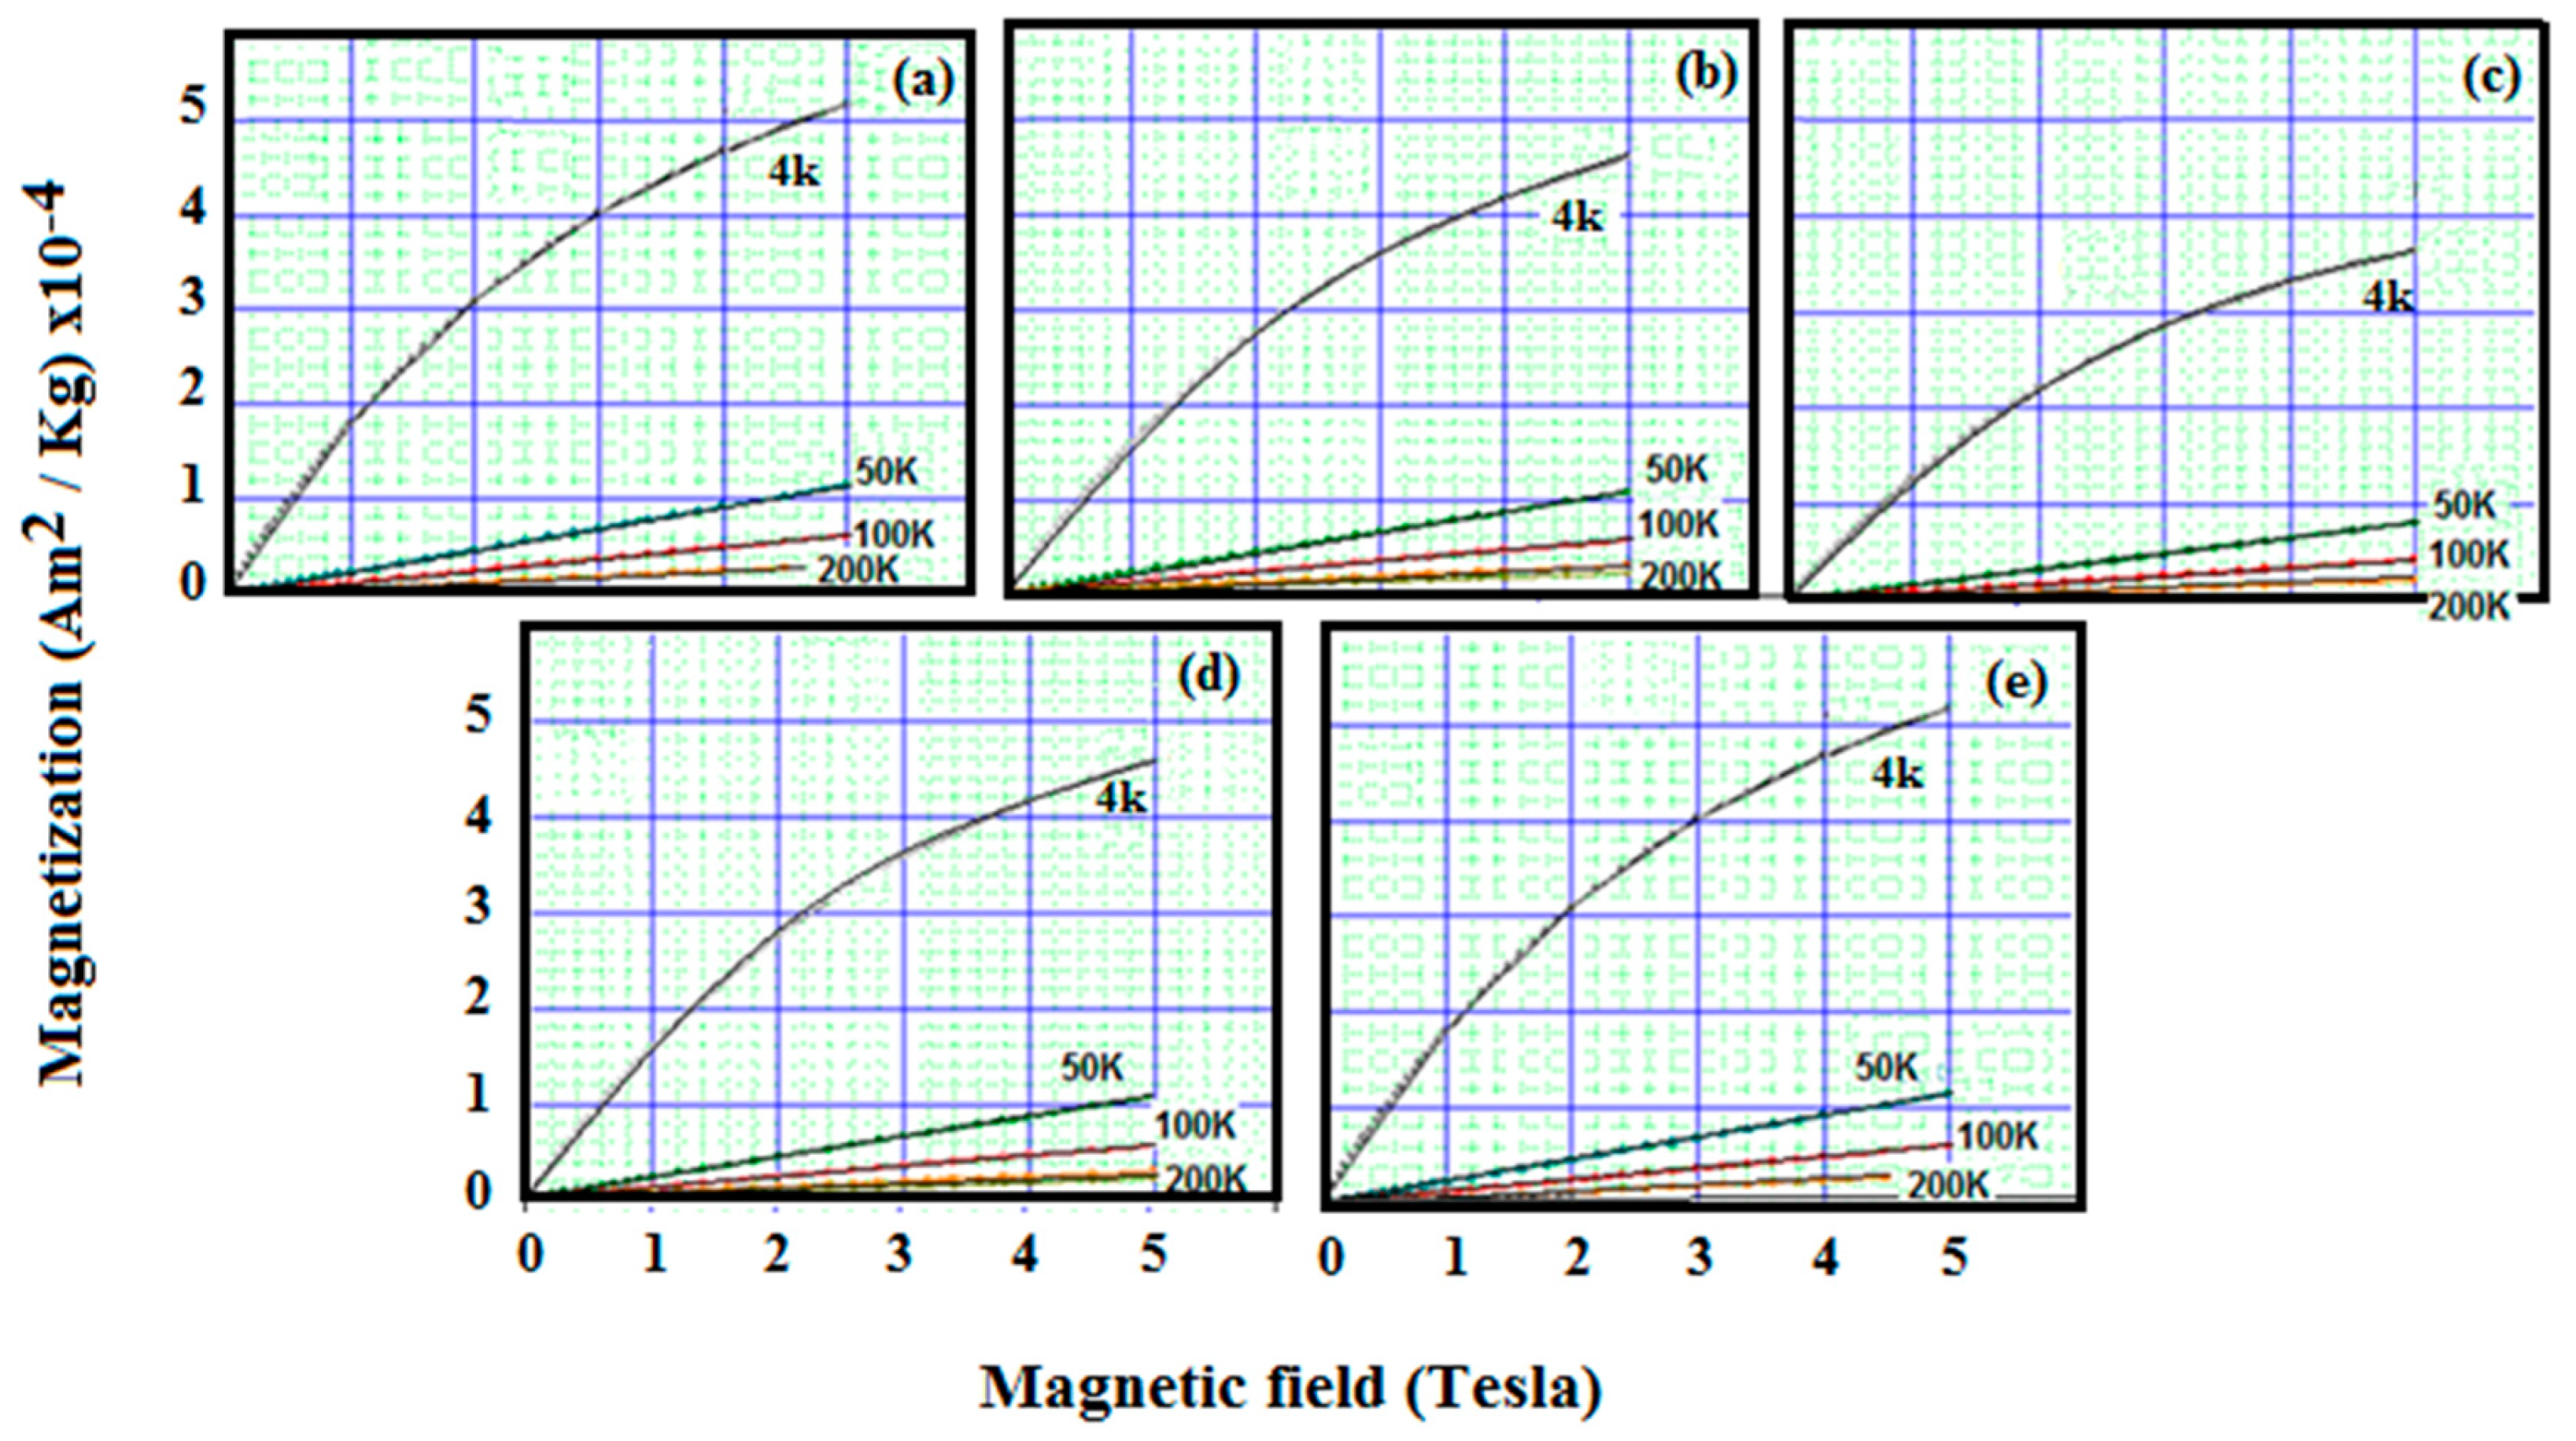
3.2.5. SQUID—Magnetic Properties

The magnetic properties measured by the SQUID method as a function of applied magnetic field strength of 4 K, 50 K, 100 K and 200 K for Paly samples are shown in Figure 7. The results indicate typical behavior of non-magnetic materials [33,51,52] since the samples showed low magnetization saturation despite the low temperatures. The maximum observed magnetization was about 0.0004 Am2/kg for magnetic fields of 5 Tesla and temperature of 4 K. This non-magnetic behavior suggests the possibility that the Fe2O3 concentration results presented by XRF (Table 1) refer to clinochlore impurity [Fe6Si4O10(OH)8], shown in Figure 3.

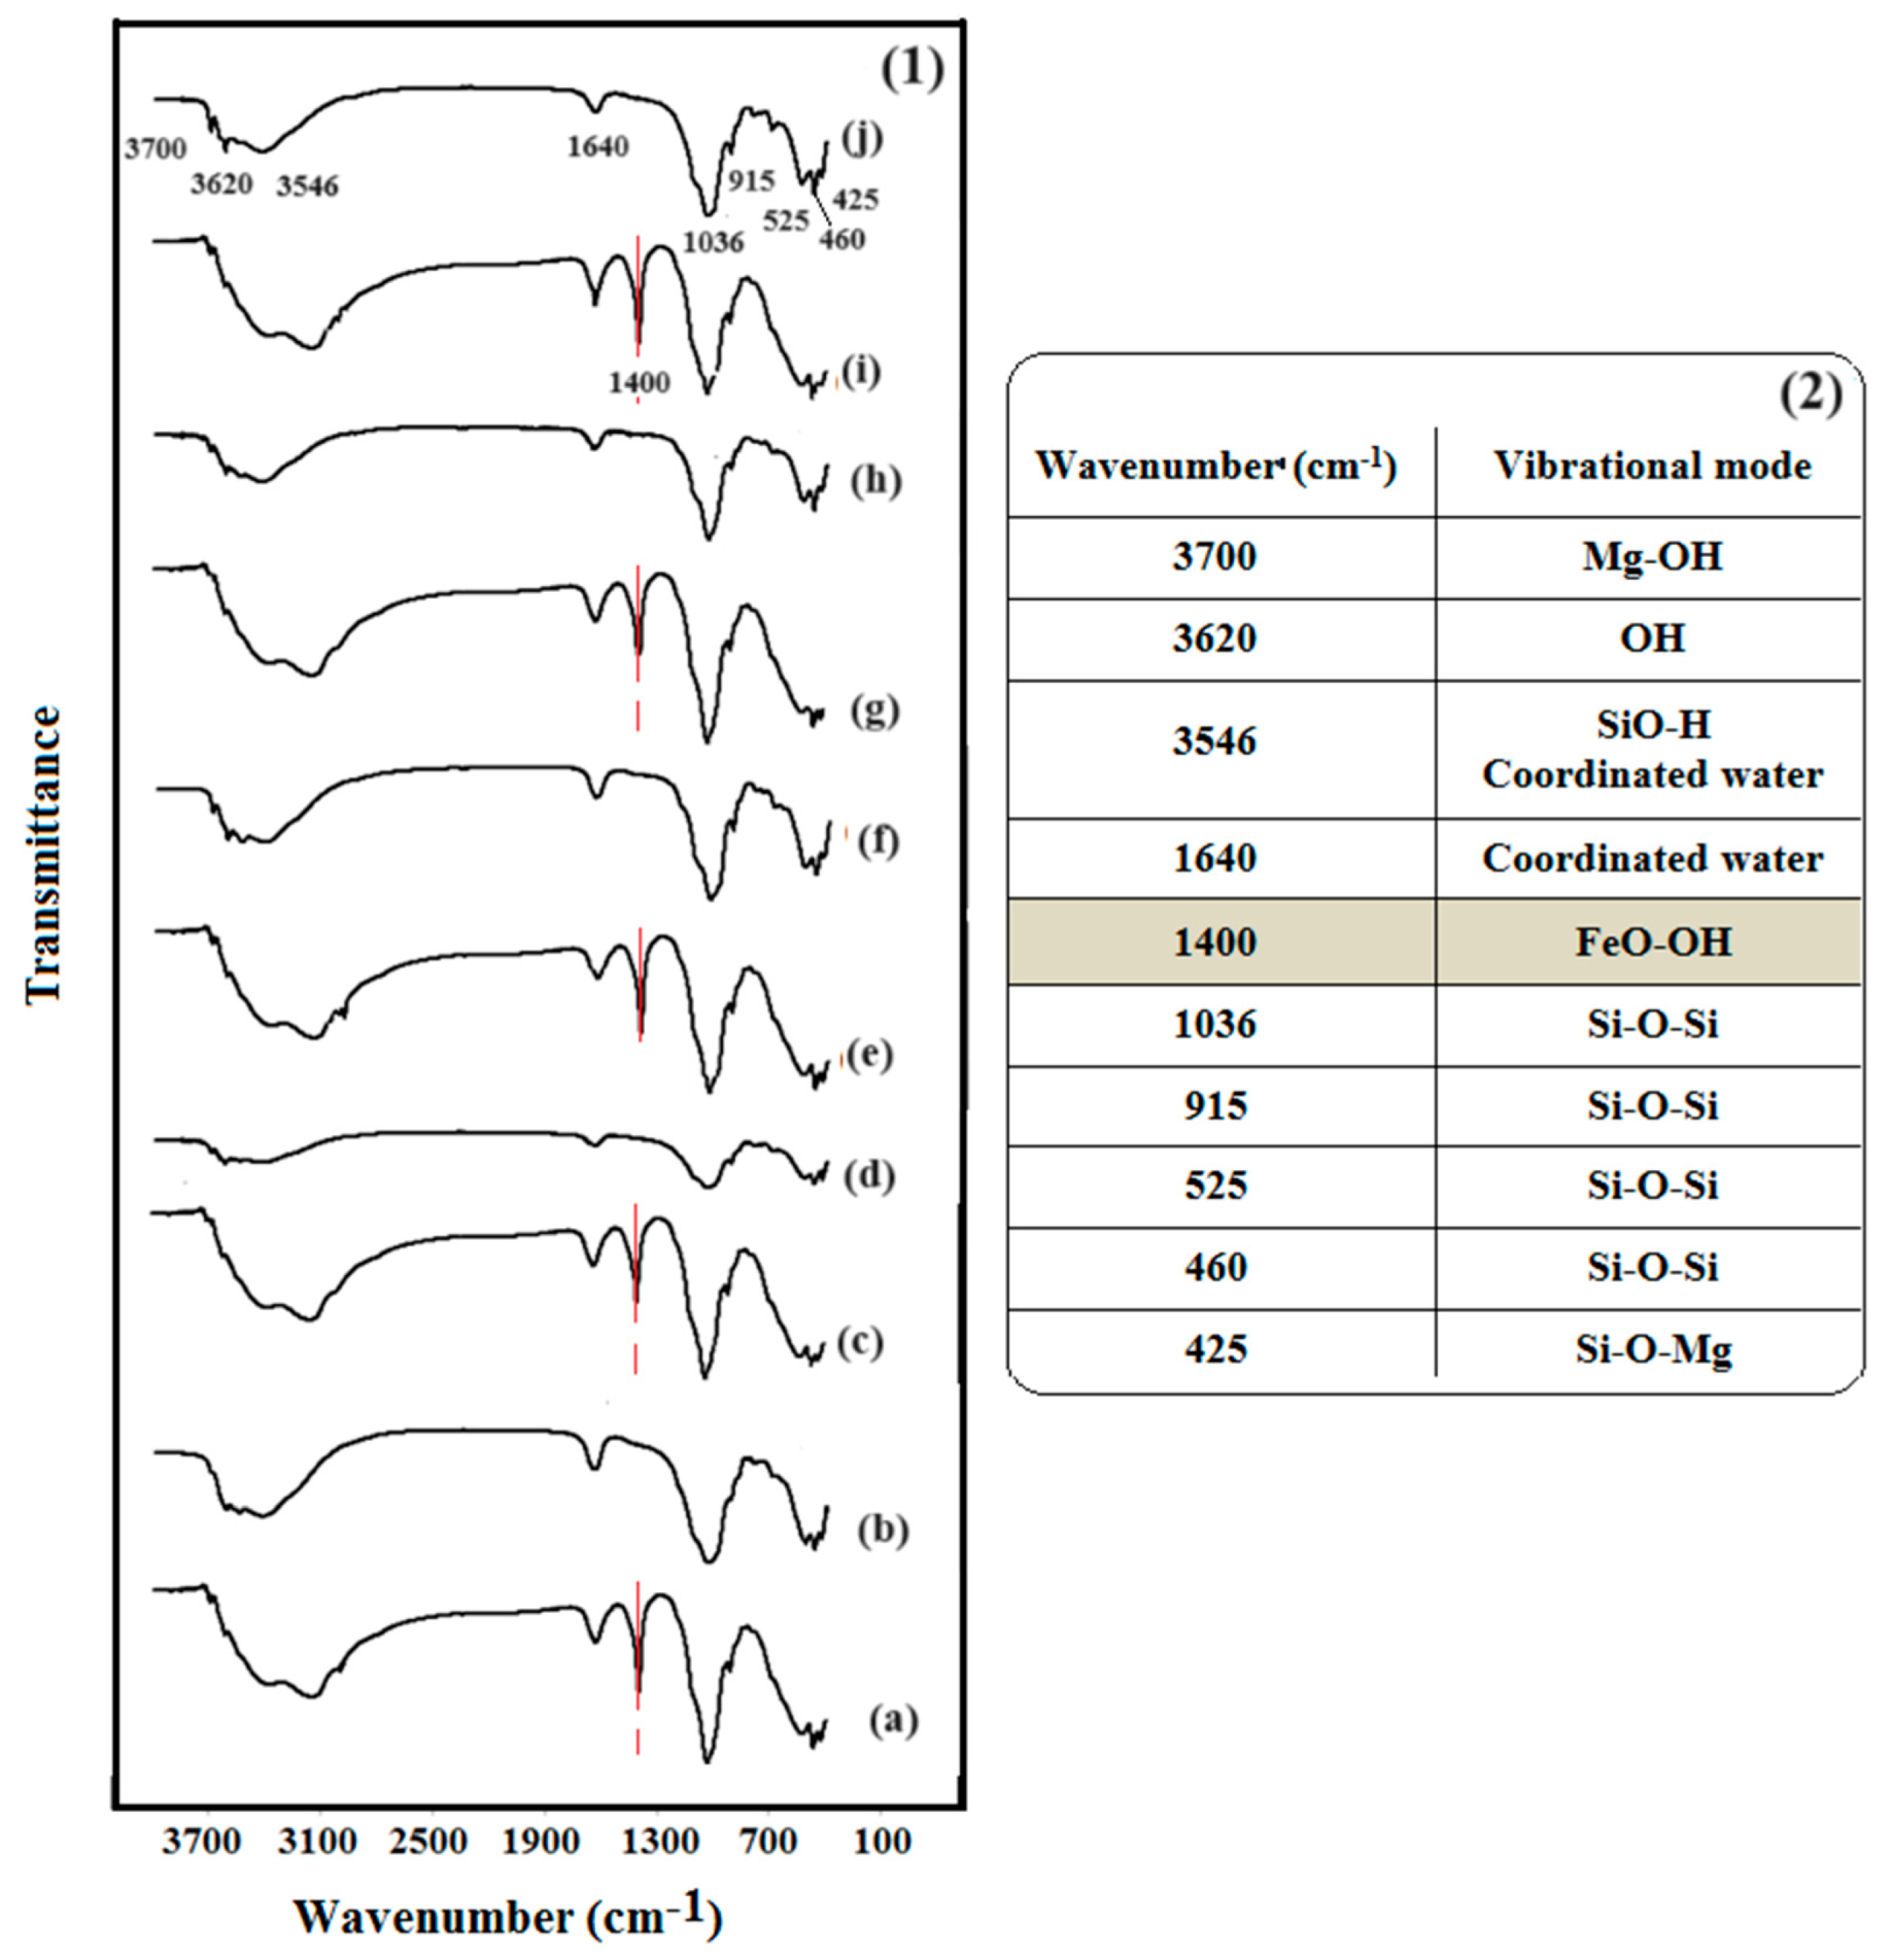
3.2.6. FTIR Analysis

Figure 8 shows the FTIR spectra of Palys and Palys-Fe3+. As can be seen from Figure 8(1), the absorption bands at 3700 cm-1 may be related to the stretching vibration of the Mg-OH group present in the samples. Likewise, characteristic absorption bands of Palys at 3620 cm−1 and 3546 cm−1 (hydroxyl vibration of water on the surface of palygorskite or in tunnels and channels) were found [9,53,54,55,56].
The band at 1640 cm−1 can be attributed to the vibration band of coordinated water and absorbed water molecules. In addition, the characteristic bands of Si-O-Si observed around 1036 cm−1 and the peaks at 915 cm−1, 525 cm−1 and 460 cm−1 can also be attributed to Si-Si bonds [55,57,58,59,60]. Finally, the bands at 425 cm−1 can correspond to vibration of the Si-O-Mg band [61,62].
Additionally, the FTIR spectra of Palys-Fe3+ presented bands at 1400 cm−1, related to FeO-OH stretching vibration, indicating the presence of iron oxide. This confirmed that the Paly samples’ surfaces were successfully modified after Fe3+ adsorption [9,59].

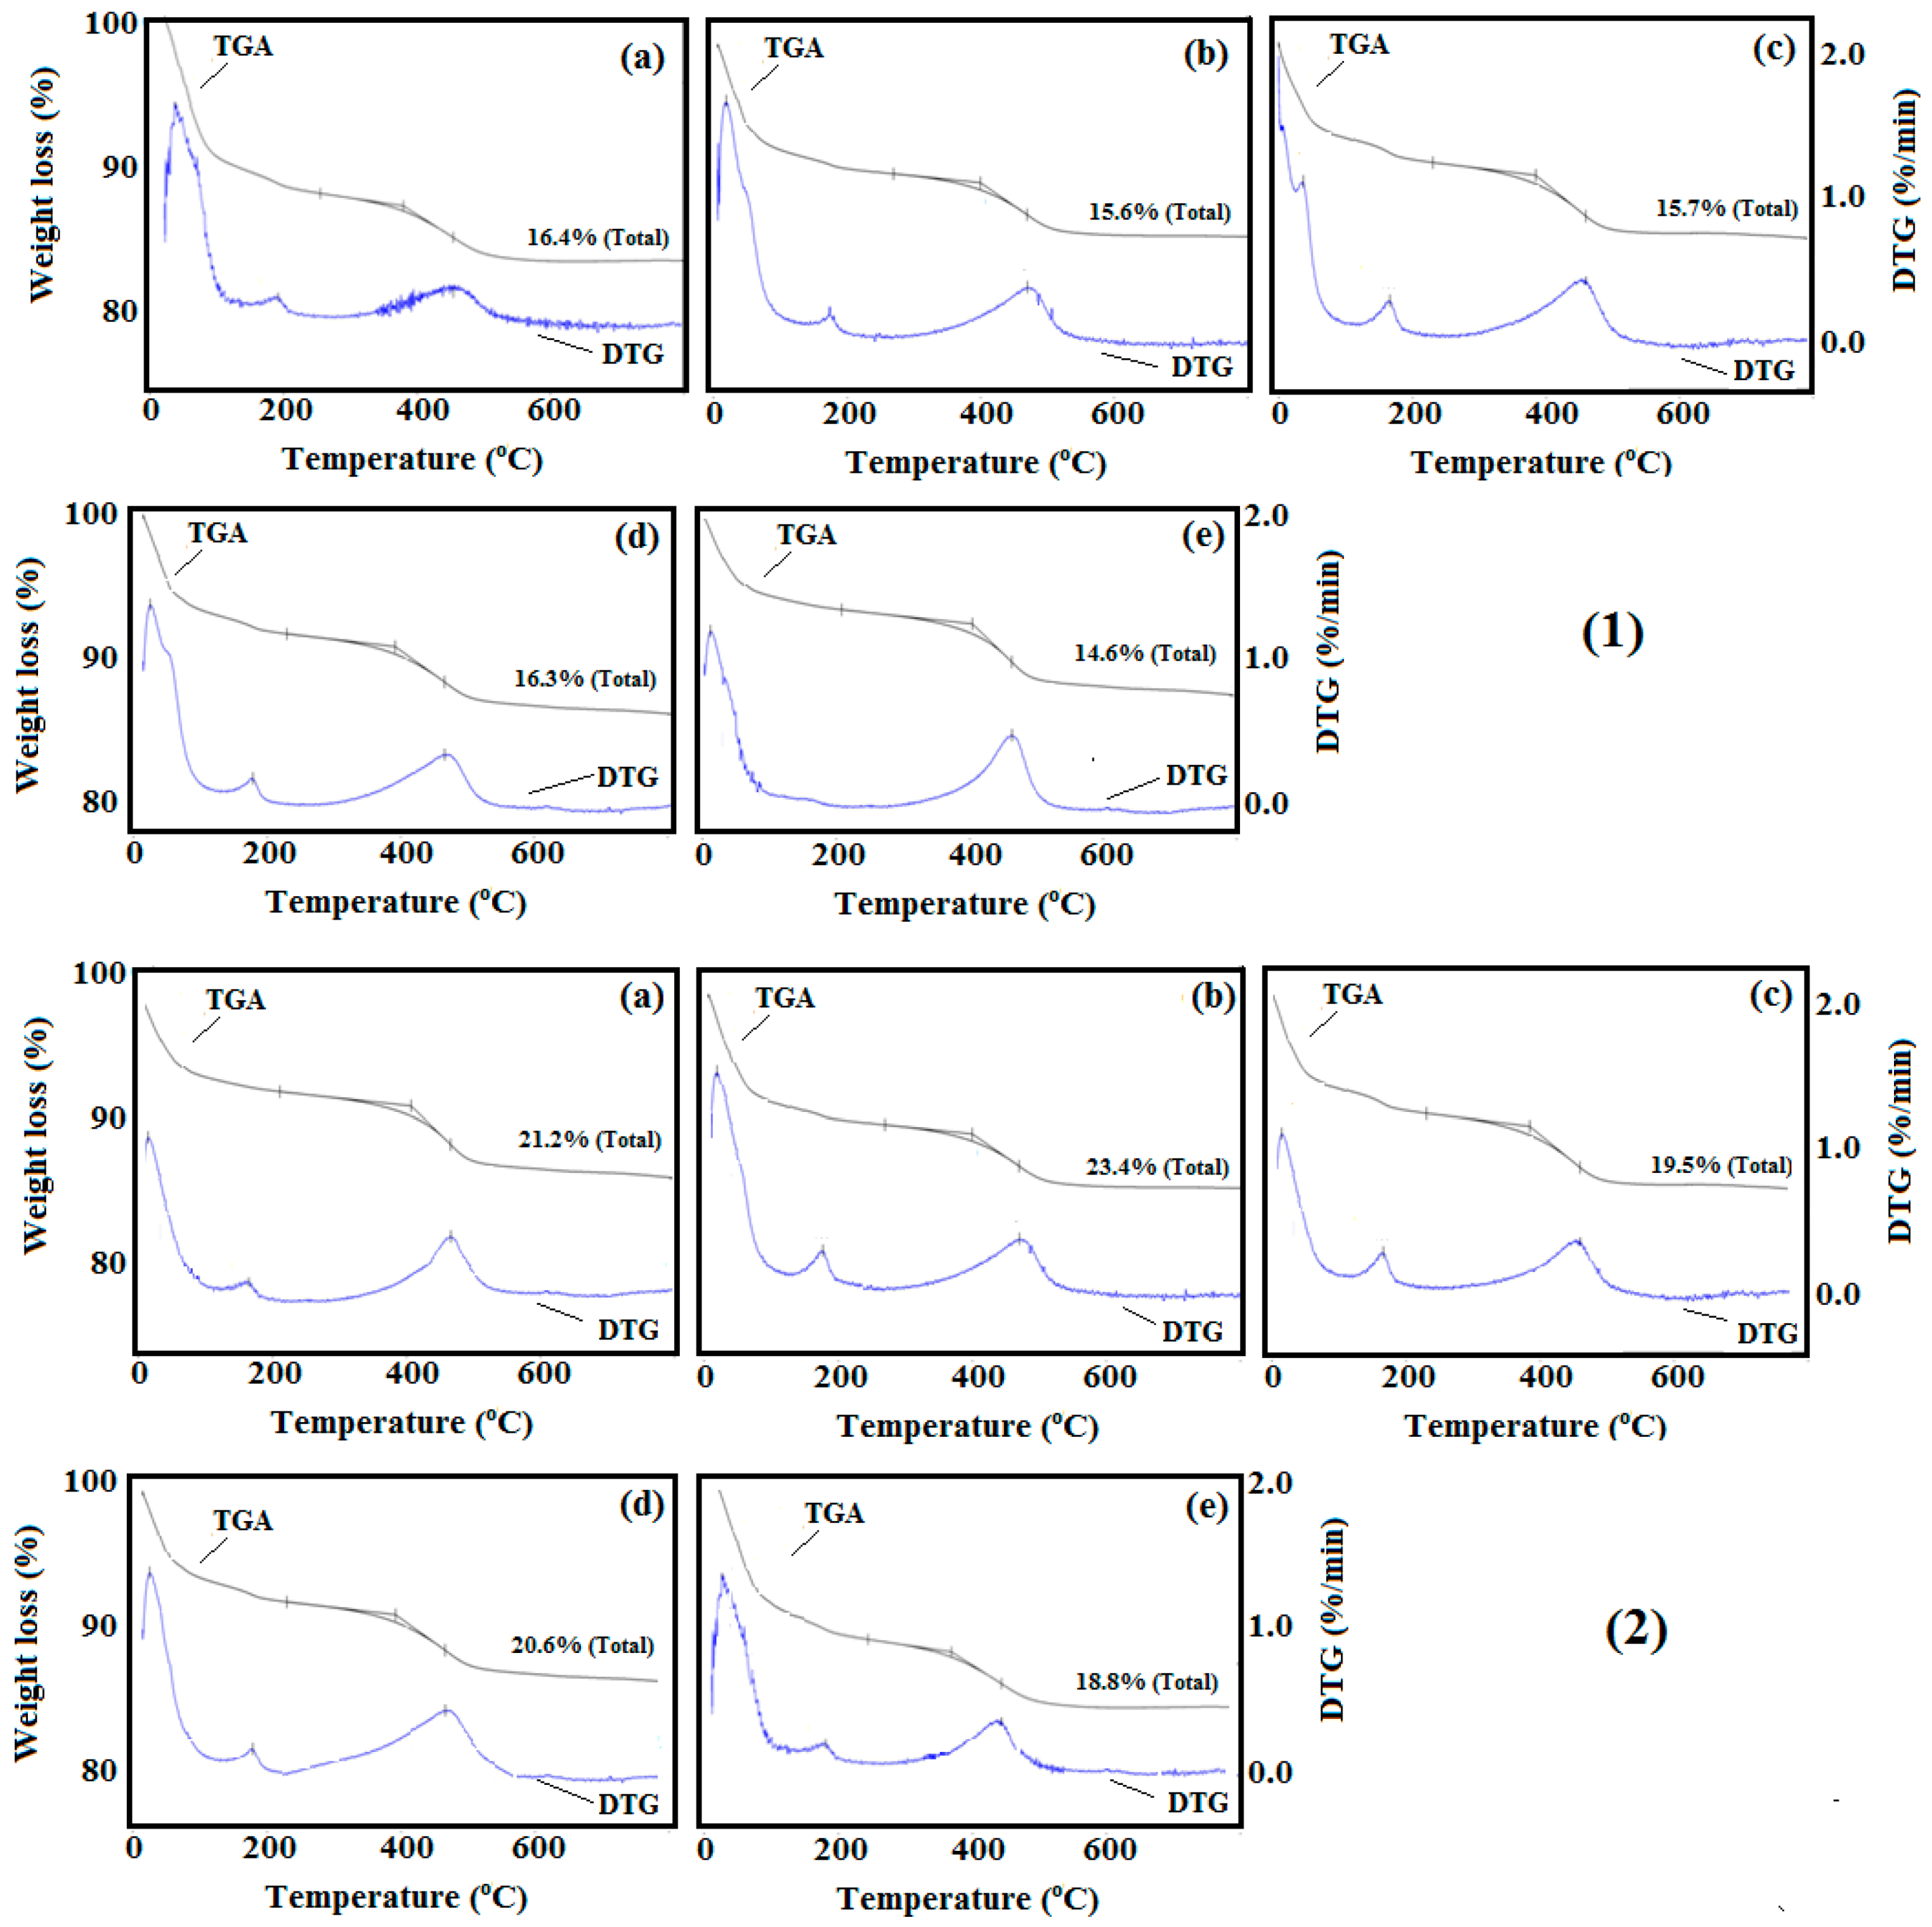
3.2.7. Thermal Stability

Three similar weight-loss steps were observed according to the TGA/DTA results for the five Palys and Palys-Fe3+, as shown in Figure 9 and summarized in Table 3. The first event was related to the evaporation of water physically adsorbed on the surface [63,64,65] of the Palys and Palys-Fe3+ and occurred at about 35.2–69.1 °C for Palys and 56.3–83.4 °C for Palys-Fe3+, with mass losses of 5.3–9.7% and 8.3–13.2%, respectively. The second event, around 189.3–191.9 °C (Palys) and 221.3–246.5 °C (Palys-Fe3+), presented mass losses of 2.3–2.8% and 5.8–8.2% for Palys and Palys-Fe3+, respectively, related to the loss of zeolitic water molecules located in the Paly channels [9,66]. The third event, observed between 454.2 and 475.4 °C for Palys and 478.9 and 495.7 °C for Palys-Fe3+, was attributed to coordinated water loss and condensation of silanol and aluminol groups, which resulted in mass losses of 3.6–7.5% (Palys) and 2.3–2.8% (Palys-Fe3+) [67,68]. Finally, Table 3 also shows that the total mass-loss ratios were around 14.6–16.4% and 18.8–23.4% for Palys and Palys-Fe3+, respectively.

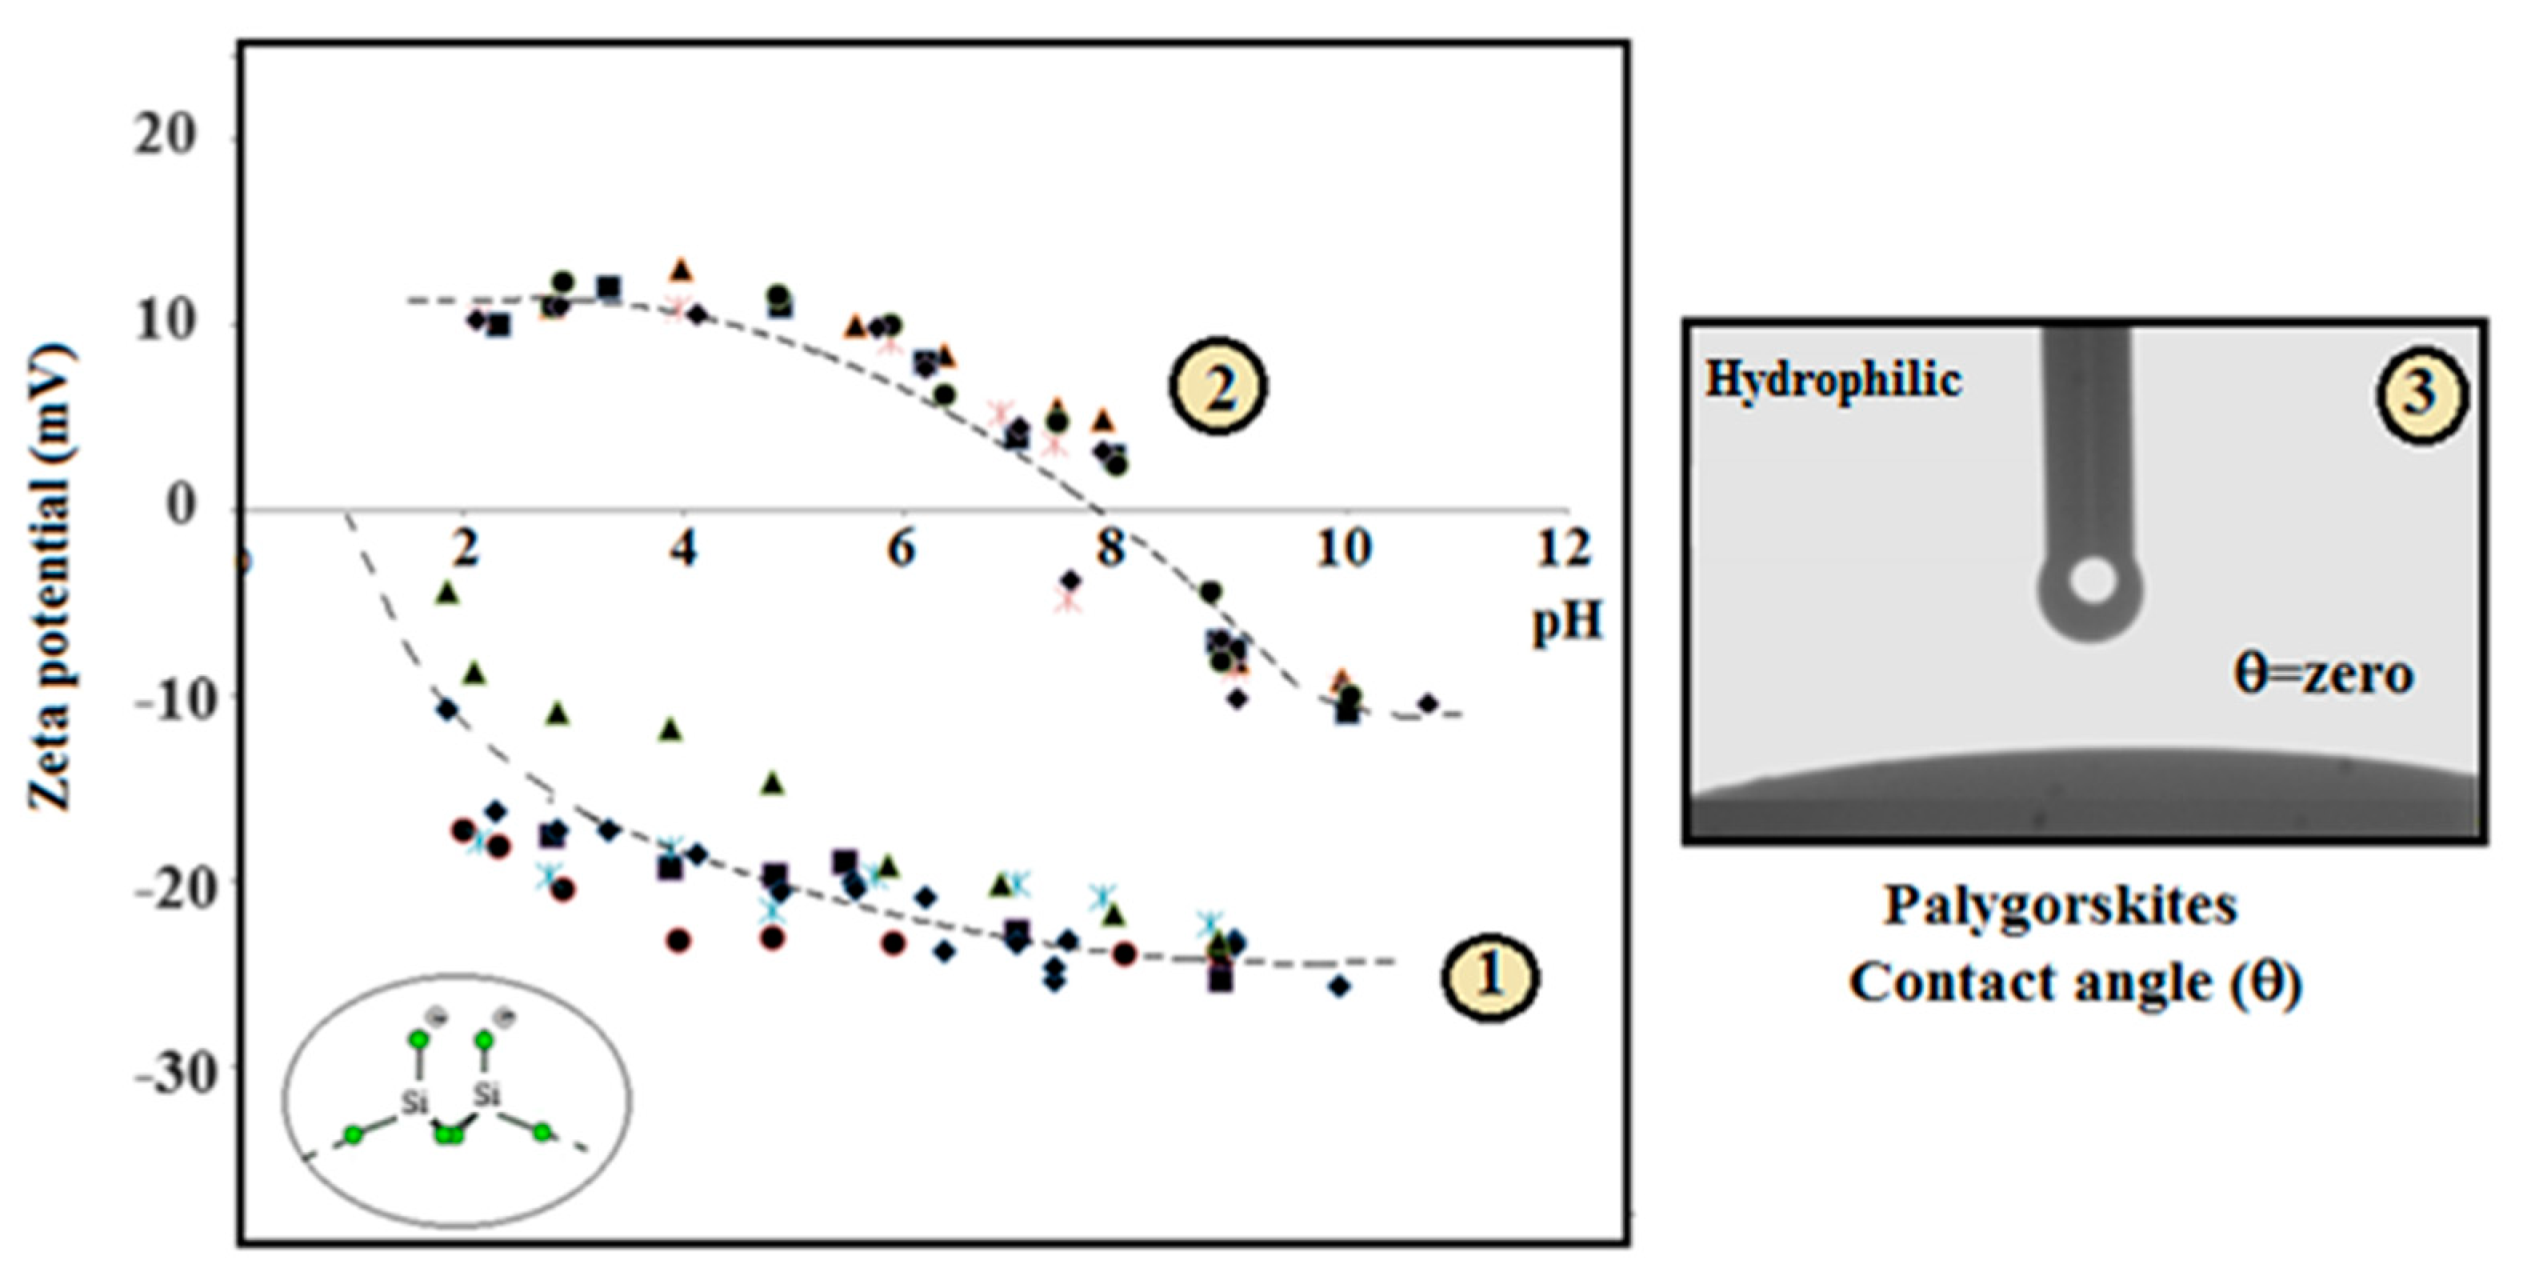
3.2.8. Surface Charge—Hydrophobicity

The variations of the zeta potential of Palys and Palys-Fe3+ with changes in pH are shown in Figure 10(1) and (2), respectively. In the pH range of 1–12, the values of Paly zeta potential increased with the increase in pH, since concentrations of hydroxide ions in the solution also increased and the mineral surface adsorbed a large number of free ions with negative charge, as expected [9,69,70]. The maximum value reached was −25 mV at pH 9.0, and it remained stable in the suspension system with higher pH values. This behavior favors good adsorption on cationic compounds. On the other hand, Palys-Fe3+ showed a change in its charges at around pH 8.0 due to the positive charge of the Fe3+ adsorbed on the Paly surfaces, which becomes positive below this pH value and negative above it, evidencing the change in Paly surfaces after Fe3+ adsorption. Additionally, Figure 10(3) shows the results of the contact angle measurements for Palys and Palys-Fe3+, providing important data on the wettability of the samples before and after Fe3+ adsorption. The sessile drop method was used to evaluate the hydrophobicity of pressed surfaces, as in a previous study [64]. The contact angles for all samples were zero, referring to hydrophilic surfaces with high wettability by water. This behavior is expected for silicon oxides [71].

3.3. Adsorption Studies: Evaluation of Fe3+ Adsorption on Five Paly Surfaces

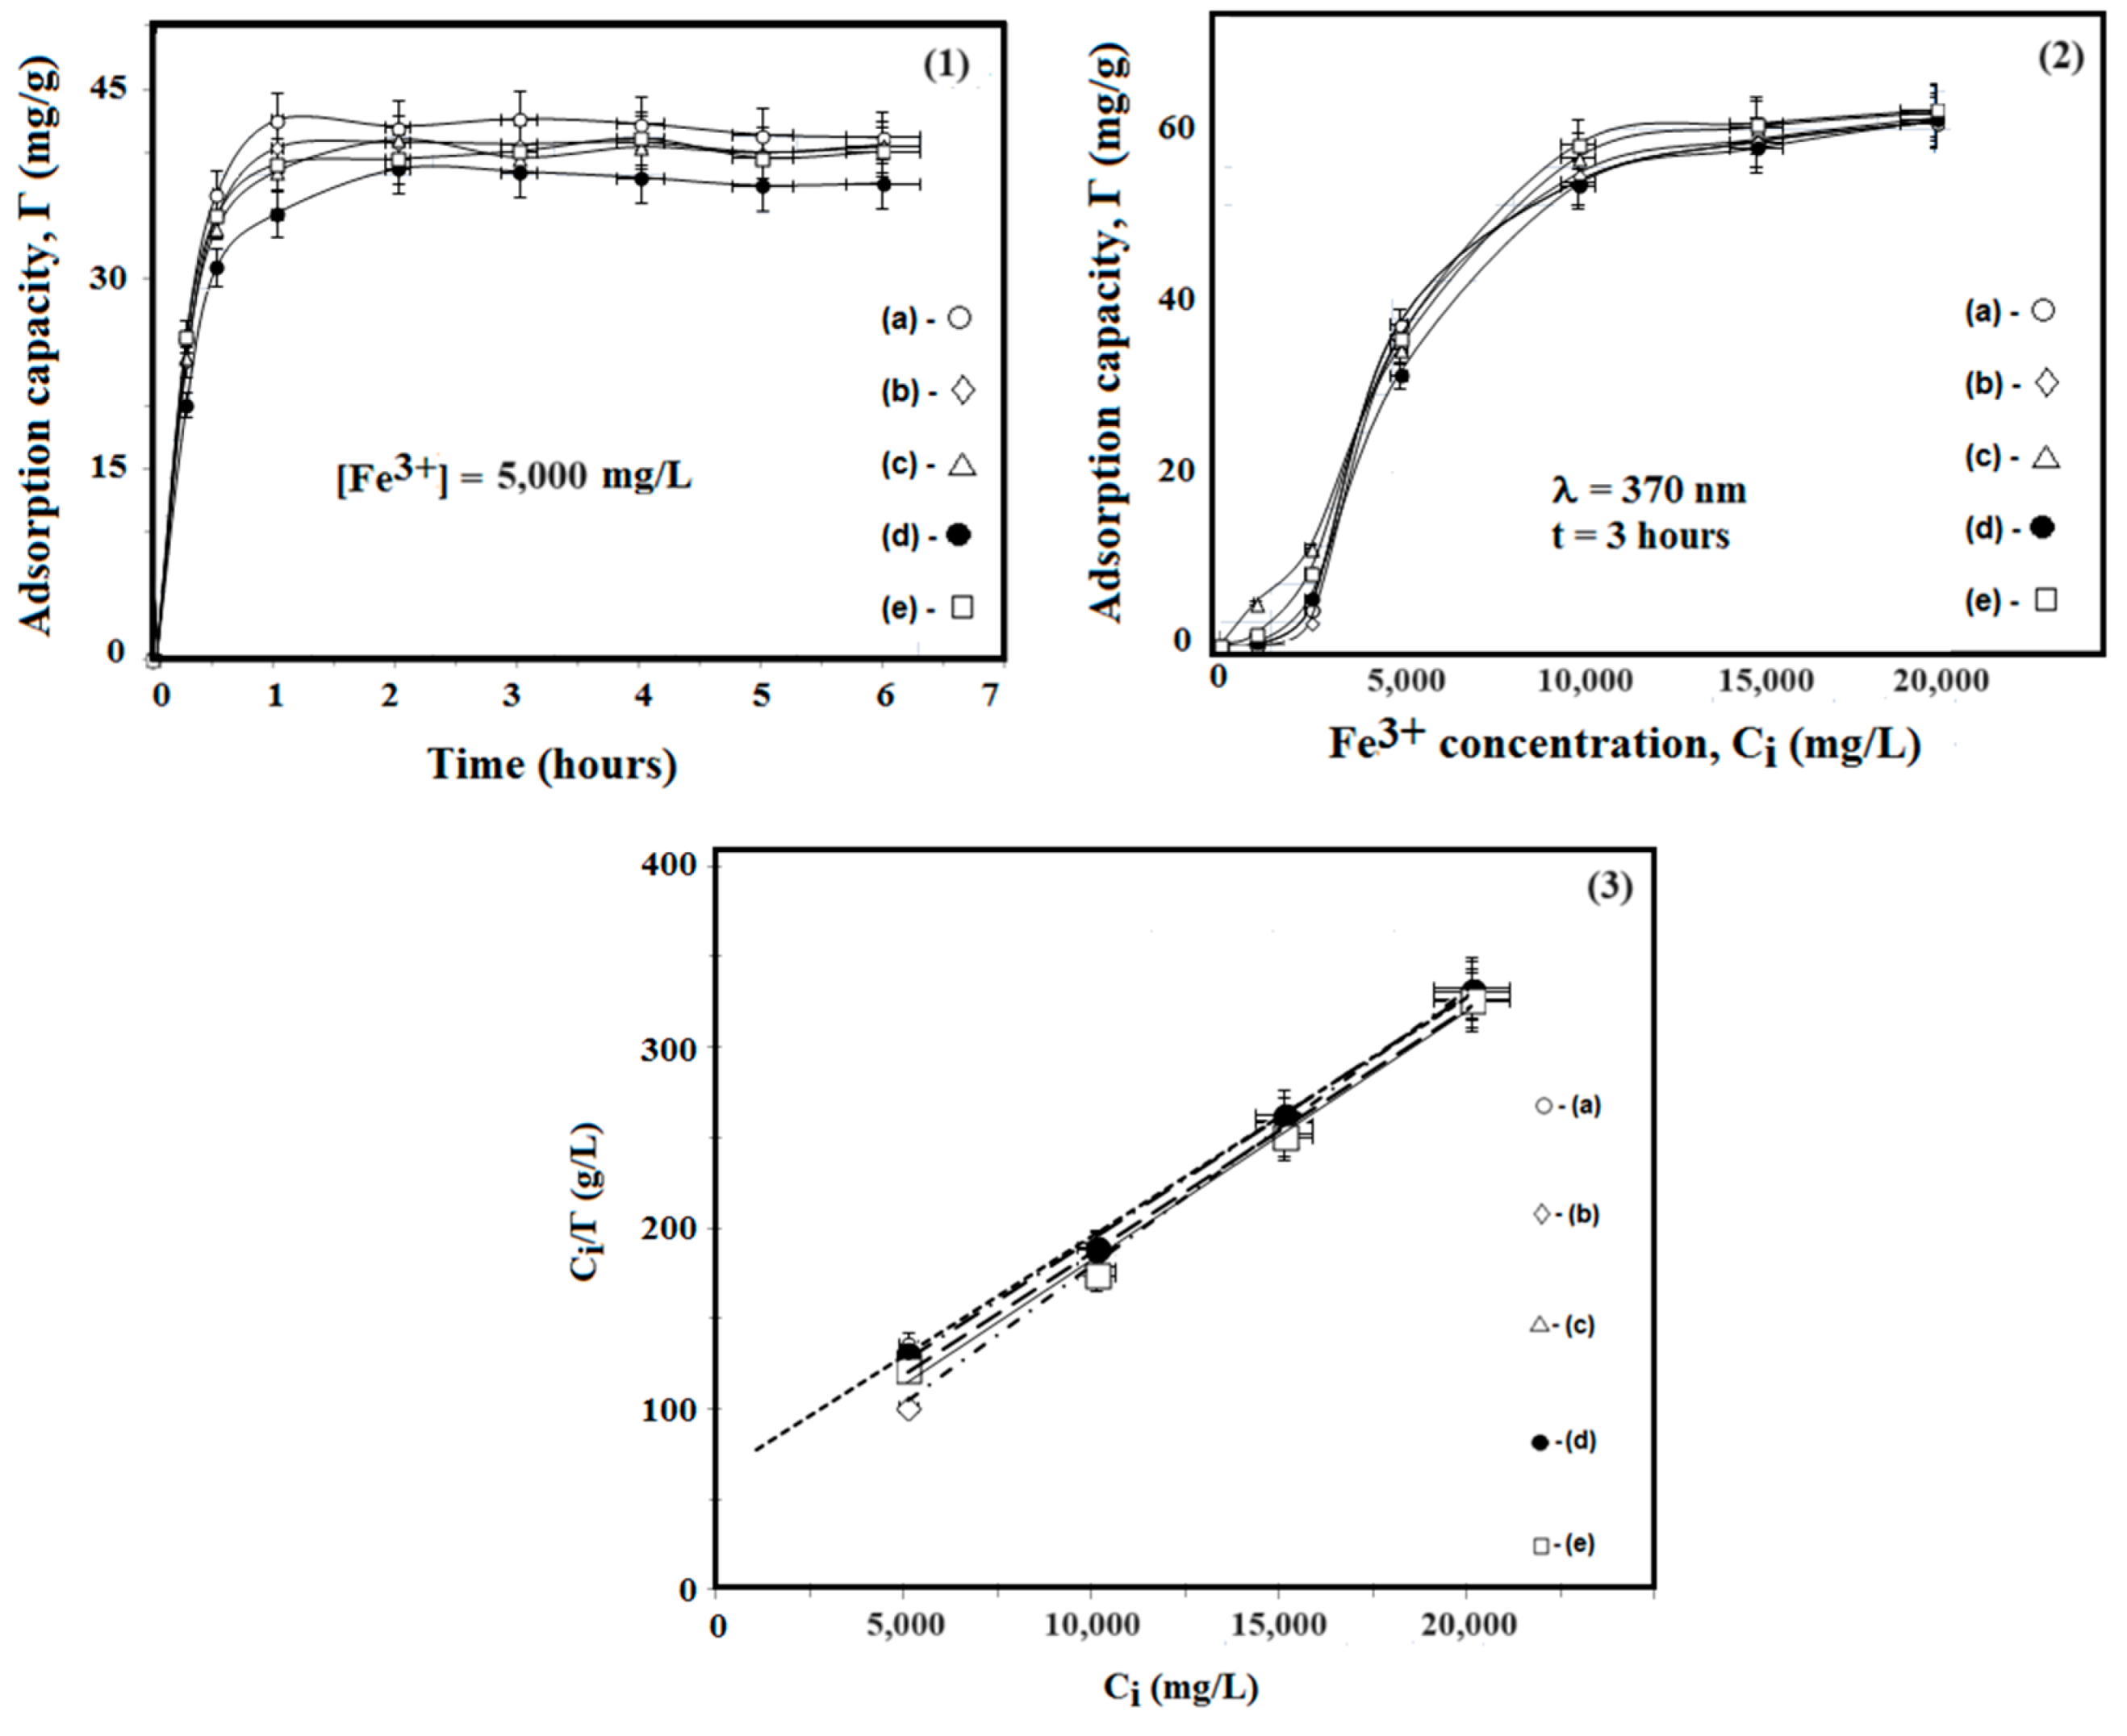
3.3.1. Adsorption Kinetics

The adsorption kinetics of the five Palys studied in this work is shown in Figure 11. The effect of contact time of Fe3+ onto Palys surfaces was investigated at various time intervals in the range 0–6 h (Figure 11(1)). As can be seen, the Fe3+ adsorption capacity increased very rapidly in the first 30 min and reached around 44 mg/g (the maximum Fe3+ equilibrium adsorption capacity) at 1 h then remained constant. This behavior was similar for all Palys, mainly due to the active sites on the Paly surfaces that were available at the beginning of the adsorption process. For the adsorption isotherm studies, a contact time of three hours was used to ensure complete adsorption.

3.3.2. Adsorption Isotherm

The equilibrium adsorption capacity of Fe3+ onto Palys and the corresponding adsorption isotherms are plotted in Figure 11(2). It is clear that the adsorption capacity of the Fe3+ onto Palys increased with an increase in the Fe3+ concentration in solution and reached saturation gradually.
The maximum equilibrium adsorption capacity of around 60 mg/g was observed at an initial Fe3+ concentration of 10,000 mg/L. According to the classification of Giles et al. [72], the isotherm was supposedly of the Langmuir type, indicating that the Fe3+ has a high affinity for the Paly surfaces.
The Langmuir adsorption isotherm assumes that adsorption occurs at specific homogeneous sites within the adsorbent, and it has been successfully applied in many studies of monolayer adsorption. The linear form of the Langmuir isotherm equation is written as:
Ci/Γ = 1/K·Γm + 1/Γm·Ci
where Γ is the equilibrium capacity of Fe3+ on the adsorbent (mg/g), Ci is the initial concentration of the Fe3+ solution (mg/L), Γm is the monolayer adsorption capacity of the adsorbent (mg/g) and k is the Langmuir adsorption constant (L/mg), related to the free energy of adsorption.
The adsorption equation was obtained from experimental data (Equation (2)). The isotherm constants and correlation coefficients were calculated from the linear Langmuir plots by plotting Ci/Γ vs. Ci (see Figure 11(3)) and are presented in Table 4. The Langmuir equation represented the adsorption process very well, as can be seen by the R2 values. This may have been due to the homogeneous distribution of active sites on the palygorskite surface, as reported by some authors who have stated that the adsorption of Fe3+ on palygorskite is supposedly described by the Langmuir equation [9,64,73,74]. This result indicates that the studied Palys possess a very high adsorption capacity, so the mineral is very useful in removing Fe3+ from aqueous solutions.
The values of ΔG for Palys were all negative and close to each other. The negative ΔG values indicate that the process of Fe3+ adsorption was spontaneous. The absolute value of ΔG was highest for Paly III (11.16 KJ/mol), indicating that this sample was more conducive to Fe3+ adsorption.

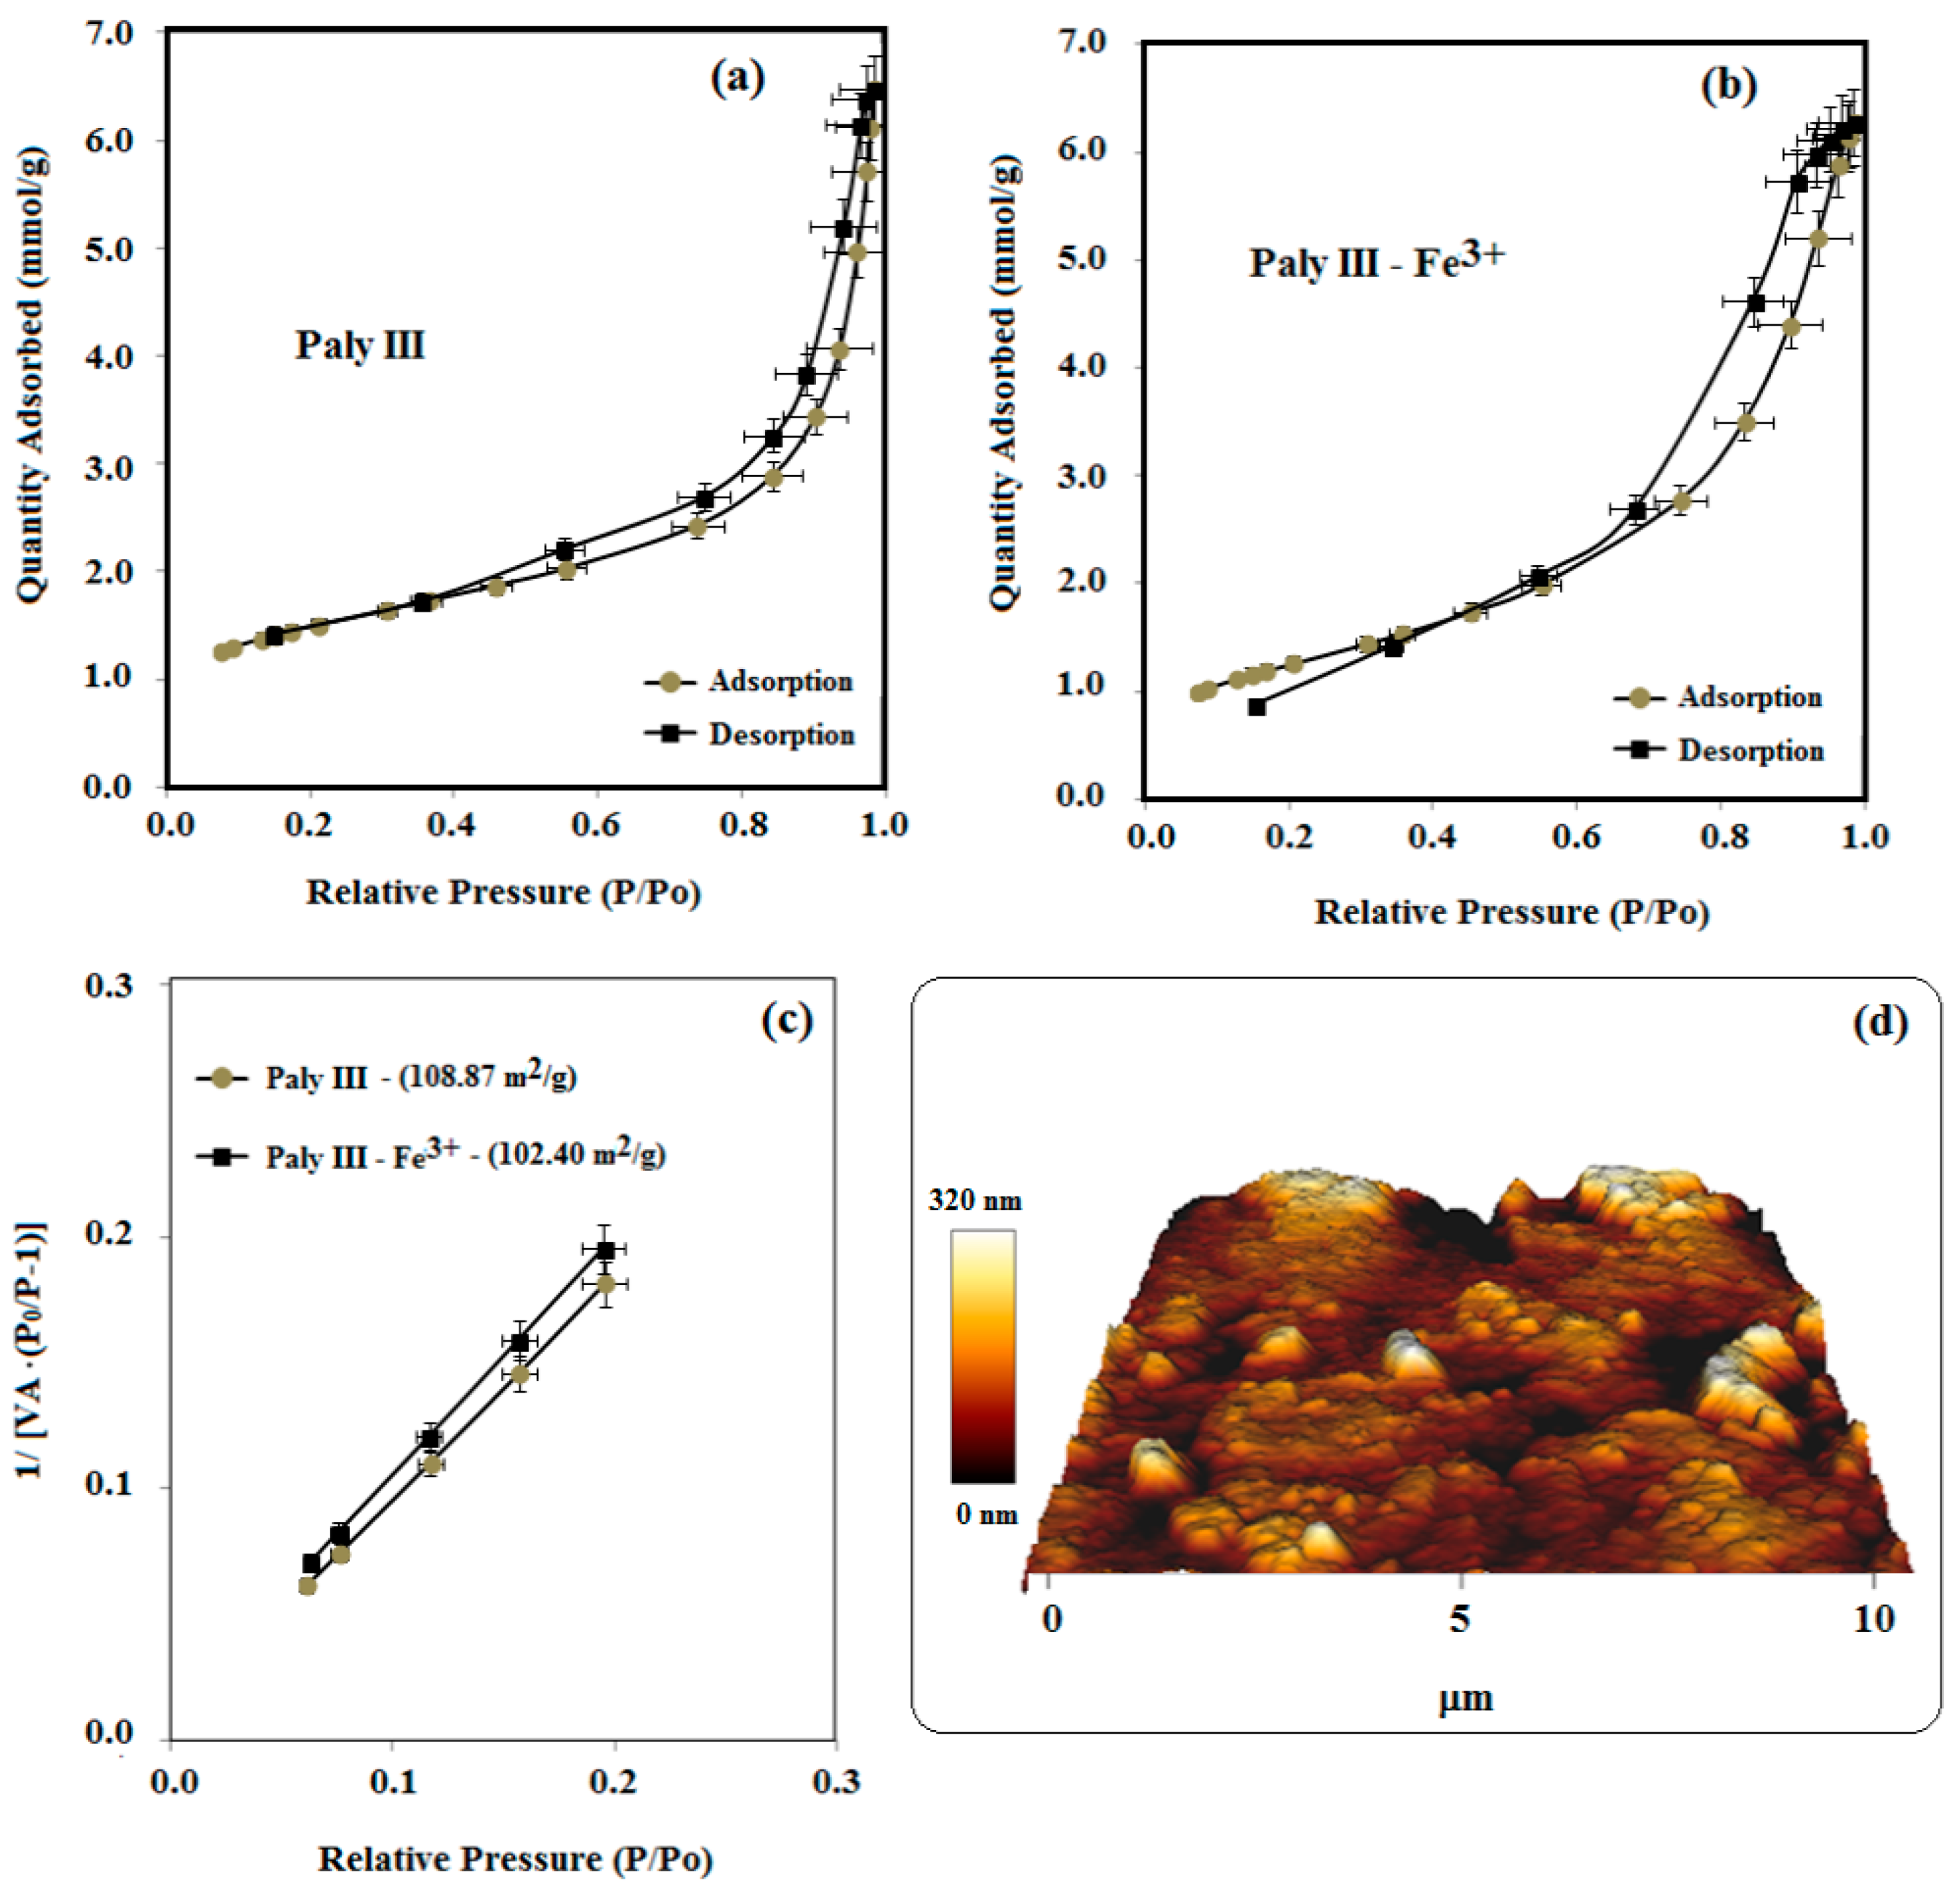
3.4. Additional Characterizations of Paly III (BET Surface Area Analysis/AFM)

The five Palys studied had very similar characteristics, so we chose the Paly III sample, which had the highest negative ΔG value, for evaluation in relation to its porosity by BET and AFM. It will certainly represent the others.

BET—AFM

The specific surface areas and porous parameters of Paly III alone and with Fe3+ adsorbed (Paly III-Fe3+) are shown in Table 5, Table 6 and Table 7 and Figure 12. The nitrogen adsorption–desorption isotherms of the Paly III and Paly III-Fe3+ (see Figure 12a,b) were classified as typical type II isotherms that yield nonporous or macroporous adsorbents according to the IUPAC classification [75]. The hysteresis loops of Paly III and Paly III-Fe3+ were similar, indicating that the adsorption of Fe3+ onto Paly III did not change the former’s porous structure. The amount of N2 adsorbed gradually increased with rising relative pressure, and the adsorption and desorption lines completely overlap each other, suggesting a monolayer adsorption [45]. The BET specific surface area of 108.9 m2/g for Paly III decreased to 102.4 m2/g for Paly III-Fe3+ (Table 5 and Figure 12c), which might be due to the increase of steric hindrance leading to a smaller Paly III-Fe3+ surface area. The average pore diameters from the BJH pore-size distribution pattern were 94.84 Å and 77.08 Å, respectively, indicating nonporous or macroporous adsorbents (Table 7). The external surface areas and micropore volumes (Table 5 and Table 6) were calculated by using the t-plot method. For Paly III, a micropore volume of 0.01097 cm3/g was measured, with a micropore area of 25.89 m2/g and a larger external surface area of 82.98 m2/g. For Paly III-Fe3+, the micropore volume and micropore area values decreased to 0.002416 cm3/g and 7.42 m2/g, respectively, which can be explained by the decrease of ordered degree of the macroporous structure due to Fe3+ adsorbed onto Paly III.
As observed from Figure 12, the major contribution to specific surface area of the samples came from the external surface. The surface area decreased with the Fe3+ adsorption on Paly III, and the pores had width between 70–95 Å (Table 7). Thus, it can be stated that having a porous structure and large specific surface areas is very favorable for the adsorption and removal of Fe3+ from water.
This behavior was confirmed by observing Paly III’s high-resolution AFM image, showing its texture (Figure 12d) and spherical particles with different mean sizes in the range of 0–10 µm. Various grain sizes distributed over the entire surface of Paly III can be observed. These grains are formed by smaller grains with a diameter of approximately 150 nm. The maximum height of the largest cluster of grains was approximately 320 nm, with RMS roughness of approximately 74 nm. Furthermore, a variety of colors is present, indicating that the Paly sample has other components, as observed by the characterization by XRF, XRD, FTIR and EDS.

4. Conclusions

The removal of Fe3+ ions from aqueous solutions by adsorption on five natural eco-friendly Brazilian palygorskites for environmental applications was investigated and characterized by various analyses after quartz-reduced efficiency of around 80% was shown by XRD.
The five Paly samples presented very similar characteristics, probably due to the proximity of the geological formation and the extraction location. The impurities found by XRF and XRD were clinochlore, kaolinite, quartz, anatase and diaspore, while SiO2 was the main component found, around 50% (w/w), due to the presence in the composition of palygorskite and quartz minerals. The Palys had a fibrous aspect according to SEM observation and formed aggregates, typical behavior of nanometric particles, as confirmed by the particle size distribution techniques. In general, the characterization methods used in this work indicated that the samples had typical characteristics of palygorskite minerals, such as no magnetism, negative charge and hydrophilicity.
Paly surface modification after Fe3+ adsorption was evidenced by the increase in iron concentration observed by XRF and EDS, by the appearance of the band at 1400 cm−1 in the FTIR spectrum and by the charge change from negative to positive around pH 8.0 in the zeta potential curve.
Regarding the adsorption studies, we observed that the Fe3+ adsorption capacity on Palys increased very rapidly in the first 30 min, reaching a maximum Fe3+ equilibrium adsorption capacity of around 44 mg/g at 1 h, after which it remained constant. The maximum equilibrium adsorption capacity, around 60 mg/g, was observed at an initial Fe3+ concentration of 10,000 mg/L. The Langmuir model supposedly represented the adsorption process, indicating that the Fe3+ has high affinity for the Paly surfaces.
Finally, the values of ΔG for Palys were all negative, meaning that the process of Fe3+ adsorption was spontaneous and very promising for the removal of Fe3+ from wastewater.

Author Contributions

Conceptualization: L.d.S.S., R.N., F.G.d.S.J. and O.d.F.M.G.; Methodology: A.M., T.d.L.A.P.F., L.C.d.L. and V.M.T.S.B.; Validation: A.M., L.d.S.S., R.N., F.G.d.S.J. and O.d.F.M.G.; Formal Analysis: A.M., T.d.L.A.P.F., L.C.d.L. and V.M.T.S.B.; Investigation: A.M., R.N. and F.G.d.S.J. Writing—Original Draft Preparation: A.M.; Supervision: L.d.S.S., R.N., F.G.d.S.J. and O.d.F.M.G.; Project Administration: R.N. and L.d.S.S. All authors have read and agreed to the published version of the manuscript.

Funding

This research received no external funding.

Data Availability Statement

The data presented in this study are openly available in article.

Acknowledgments

The authors acknowledge the support of the Center for Mineral Technology (CETEM), Federal University of Rio de Janeiro/Institute of Macromolecules (UFRJ/IMA), Federal University of Rio de Janeiro/COPPE Nanotechnology Engineering Program (UFRJ/COPPE) and Federal University of Rio de Janeiro/Physics Institute UFRJ/IF), along with Colorminas Colorífico e Mineração for supplying the palygorskite samples.

Conflicts of Interest

The authors declare no conflicts of interest.

References

  1. Ostroski, I.C.; Barros, M.A.S.D.; Silva, E.A.; Dantas, J.H.; Arroyo, P.A.; Lima, C.O.M. The Removal of Fe (III) Ions by Adsorption onto Zeolite Columns. Adsorpt. Sci. Technol. 2007, 25, 757–768. [Google Scholar] [CrossRef]
  2. Aksu, Z. Application of biosorption for the removal of organic pollutants: A review. Process Biochem. 2005, 40, 997–1026. [Google Scholar] [CrossRef]
  3. Sheibani, A.; Shishehbor, M.R.; Alaei, H. Removal of Fe (III) ions from aqueous solution by hazelnut hull as an adsorbent. Int. J. Ind. Chem. 2012, 3, 4. [Google Scholar] [CrossRef]
  4. Liang, X.; Xu, Y.; Tan, X.; Wang, L.; Sun, Y.; Lin, D.; Sun, Y.; Qin, X.; Wang, Q. Heavy metal adsorbents mercapto and amino functionalized palygorskite: Preparation and characterization. Colloids Surfaces A Physicochem. Eng. Asp. 2013, 426, 98–105. [Google Scholar] [CrossRef]
  5. Shaheen, S.M.; Eissa, F.I.; Ghanem, K.M.; El-Din, H.M.G.; Al Anamy, F.S. Heavy metals removal from aqueous solutions and wastewaters by using various byproducts. J. Environ. Manag. 2013, 128, 514–521. [Google Scholar] [CrossRef] [PubMed]
  6. Qian, G.; Li, M.; Wang, F.; Liu, X. Removal of Fe3+ from Aqueous Solution by Natural Apatite. J. Surf. Eng. Mater. Adv. Technol. 2014, 4, 14–20. [Google Scholar] [CrossRef]
  7. Zhu, Y.; Chen, T.; Liu, H.; Xu, B.; Xie, J. Kinetics and thermodynamics of Eu (III) and U (VI) adsorption onto palygorskite. J. Mol. Liq. 2016, 219, 272–278. [Google Scholar] [CrossRef]
  8. Al-Anber, Z.A.; Al-Anber, M.A.S. Thermodynamics and Kinetic Studies of Iron (III) Adsorption by Olive Cake in a Batch System. J. Mex. Chem. Soc. 2008, 52, 108–115. Available online: https://www.jmcs.org.mx/index.php/jmcs/article/view/1055/867 (accessed on 14 July 2022).
  9. Middea, A.; Fernandes, T.L.A.P.; Neumann, R.; Gomes, O.F.M.; Spinelli, L.S. Evaluation of Fe (III) adsorption onto palygorskite surfaces. Appl. Surf. Sci. 2013, 282, 253–258. [Google Scholar] [CrossRef]
  10. Perlatti, F.; Ruiz, F.; Otero, X.L.; Ferreira, T.O. Adsorption and Sequential Extraction of Copper in Technosols Prepared from Unconsolidated Mining Wastes Rich in Limestone, Bentonite, and Organic Matter. Mining 2023, 3, 151–162. [Google Scholar] [CrossRef]
  11. Hassanin, M.A.; Negm, S.H.; Youssef, M.A.; Sakr, A.K.; Mira, H.I.; Mohammaden, T.F.; Al-Otaibi, J.S.; Hanfi, M.Y.; Sayyed, M.I.; Cheira, M.F. Sustainable Remedy Waste to Generate SiO2 Functionalized on Graphene Oxide for Removal of U(VI) Ions. Sustainability 2022, 14, 2699. [Google Scholar] [CrossRef]
  12. Xuan, G.X.; Zhang, G.H.; Cheng, W.C.; Ma, C.Y.; Li, Q.R.; Liu, E.T.; He, W.G.; Dong, F.Q.; Li, X.A.; Chen, Z.G.; et al. Uranium Speciation and Distribution on the Surface of Shewanella Putrefaciens in the Presence of Inorganic Phosphate and Zero-Valent Iron under Anaerobic Conditions. Sci. Total Environ. 2024, 912, 169438. [Google Scholar] [CrossRef]
  13. Murray, H.H. Traditional and new applications for kaolin, smectite and palygorskite: A general overview. Appl. Clay Sci. 2000, 17, 207–221. [Google Scholar] [CrossRef]
  14. Neaman, A.; Singer, A. Possible use of the Sacalum (Yucatan) palygorskite as drilling muds. Appl. Clay Sci. 2004, 25, 121–124. [Google Scholar] [CrossRef]
  15. Neaman, A.; Singer, A. The effects of palygorskite on chemical and physico-chemical properties of soils: A review. Geoderma 2004, 123, 297–303. [Google Scholar] [CrossRef]
  16. Deng, Y.; Gao, Z.; Liu, B.; Hu, X.; Wei, Z.; Sun, C. Selective removal of lead from aqueous solutions by ethylenediamine-modified attapulgite. Chem. Eng. J. 2013, 223, 91–98. [Google Scholar] [CrossRef]
  17. Bourliva, A.; Sikalidis, A.K.; Papadopoulou, L.; Betsiou, M.; Michailidis, K.; Sikalidis, C.; Filippidis, A. Removal of Cu2+ and Ni2+ ions from aqueous solutions by adsorption onto natural palygorskite and vermiculite. Clay Miner. 2018, 53, 1–15. [Google Scholar] [CrossRef]
  18. Suárez, M.; García-Rivas, J.; Morales, J.; Lorenzo, A.; García-Vicente, A.; García-Romero, E. Review and new data on the surface properties of palygorskite: A comparative study. Appl. Clay Sci. 2022, 216, 106311. [Google Scholar] [CrossRef]
  19. Bailey, S.W. Structures of Layer Silicates. In Crystal Structures of Clay Minerals and their X-ray Identification; Brindley, G.W., Brown, G., Eds.; Mineralogical Society of Great Britain and Ireland: Twickenham, UK, 1980; pp. 1–123. [Google Scholar] [CrossRef]
  20. Yan, W.; Liu, D.; Tan, D.; Yuan, P.; Chen, M. FTIR spectroscopy study of the structure changes of palygorskite under heating. Spectrochim. Acta Part A Mol. Biomol. Spectrosc. 2012, 97, 1052–1057. [Google Scholar] [CrossRef]
  21. Fraser, M.B.; Churchman, G.J.; Chittleborough, D.J.; Rengasamy, P. Effect of plant growth on the occurrence and stability of palygorskite, sepiolite and saponite in salt-affected soils on limestone in South Australia. Appl. Clay Sci. 2016, 124–125, 183–196. [Google Scholar] [CrossRef]
  22. Oliveira, A.M.B.M.; Coelho, L.F.O.; Gomes, S.S.S.; Costa, I.F.; Fonseca, M.G.; Souza, K.S.; Espínolo, J.G.P.; Filho, E.C.S. Brazilian palygorskite as adsorbent for metal; ions from aqueous solution—Kinetic and equilibrium studies. Water Air Soil Pollut. 2013, 224, 1687. [Google Scholar] [CrossRef]
  23. Oliveira, R.N.; Acchar, W.; Soares, G.D.A.; Barreto, L.S. The increase of surface area of a Brazilian palygorskite clay activated with sulfuric acid solutions using a factorial design. Mater. Res. 2013, 16, 924–928. [Google Scholar] [CrossRef]
  24. Xavier, K.C.M.; Santos, M.S.F.; Osajima, J.A.; Luz, A.B.; Fonseca, M.G.; Filho, E.C.S. Thermally activated palygorskites as agents to clarify soybean oil. Appl. Clay Sci. 2016, 119, 338–347. [Google Scholar] [CrossRef]
  25. Assis, T.C.; Cerqueda, M.; Souza, C.G.; Jesus, T.C.; Marçano, G.B.; Simões, K.M.A.; Rodrigues, P.V.; Furlanetto, R.P.P.; Anjos, N.O.A.; Nascimento, L.C.S.; et al. Comparative Analysis of Palygorskite Samples From Different Occurrences in Guadalupe (Piauí, Brazil). J. Aerosp. Technol. Manag. 2019, 11, 62–65. [Google Scholar] [CrossRef]
  26. Souza, C.G.; Jesus, T.C.L.; Santos, R.C.; Bomfim, L.M.; Bertolino, L.C.; Andrade, D.F.; d’Avila, L.A.; Spinelli, L.S. Characterization of Brazilian palygorskite (Guadalupe region) and adsorptive behaviour for solvatochromic dyes. Clay Miner. 2021, 56, 55–64. [Google Scholar] [CrossRef]
  27. Meirelles, L.M.A.; Barbosa, R.d.M.; Sanchez-Espejo, R.; García-Villén, F.; Perioli, L.; Viseras, C.; Moura, T.F.A.d.L.e.; Raffin, F.N. Investigation into Brazilian Palygorskite for Its Potential Use as Pharmaceutical Excipient: Perspectives and Applications. Materials 2023, 16, 4962. [Google Scholar] [CrossRef] [PubMed]
  28. Carretero, M.I.; Pozo, M. Clay and non-clay minerals in the pharmaceutical and cosmetic industries Part II. Active ingredients. Appl. Clay Sci. 2010, 47, 171–181. [Google Scholar] [CrossRef]
  29. Celik, H. Technological characterization and industrial application of two Turkish clays for the ceramic industry. Appl. Clay Sci. 2010, 50, 245–254. [Google Scholar] [CrossRef]
  30. Li, W.; Adams, A.; Wang, J.; Blümich, B.; Yang, Y. Polyethylene/palygorskite nanocomposites: Preparation by in situ polymerization and their characterization. Polymer 2010, 51, 4686–4697. [Google Scholar] [CrossRef]
  31. Abdo, J.; Haneef, M.D. Clay nanoparticles modified drilling fluids for drilling of deep hydrocarbon wells. Appl. Clay Sci. 2013, 86, 76–82. [Google Scholar] [CrossRef]
  32. Soares, D.S.; Fernandes, C.S.; Costa, A.C.S.; Raffin, F.N.; Acchar, W.; Moura, T.F.A.L. Characterization of palygorskite clay from Piauí, Brazil and its potential use as excipient for solid dosage forms containing anti-tuberculosis drugs. J. Therm. Anal. Calorim. 2013, 113, 551–558. [Google Scholar] [CrossRef]
  33. Middea, A.; Spinelli, L.S.; Souza Junior, F.G.; Neumann, R.; Gomes, O.F.M.; Fernandes, T.L.A.P.; Lima, L.C.; Barthem, V.M.T.S.; Carvalho, F.V. Synthesis and characterization of magnetic palygorskite nanoparticles and their application on methylene blue remotion from water. Appl. Surf. Sci. 2015, 346, 232–239. [Google Scholar] [CrossRef]
  34. Oliveira, M.E.R.; Santos, L.M.; Silva, M.L.G.; Cunha, H.N.; Filho, E.C.S.; Leite, C.M.S. Preparation and characterization of composite polyaniline/poly(vinyl alcohol)/palygorskite. J. Therm. Anal. Calorim. 2015, 119, 37–46. [Google Scholar] [CrossRef]
  35. Zhongwei, L.; Pengxiang, L.; Zigong, N.; Yang, X.; Chengzhi, W.; Yunkai, L. A modified attapulgite clay for controlling infiltration of reclaimed water riverbed. Environ. Earth Sci. 2015, 73, 3887–3900. [Google Scholar] [CrossRef]
  36. Morozov, I.A.; Garishin, O.K.; Shadrin, V.V.; Gerasin, V.A.; Guseva, M.A. Atomic force microscopy of structural-mechanical properties of polyethylene reinforced by silicate needle-shaped filler. Adv. Mater. Sci. Eng. 2016, 2016, 8945978. [Google Scholar] [CrossRef]
  37. Eloussaief, M.; Kallel, N.; Yaacoubi, A.; Benzina, M. Mineralogical identification, spectroscopic characterization, and potential environmental use of natural clay materials on chromate removal from aqueous solutions. Chem. Eng. J. 2011, 168, 1024–1031. [Google Scholar] [CrossRef]
  38. He, M.; Zhu, Y.; Yang, Y.; Han, B.; Zhang, Y. Adsorption of cobalt (II) ions from aqueous solutions by palygorskite. Appl. Clay Sci. 2011, 54, 292–296. [Google Scholar] [CrossRef]
  39. Guo, N.; Wang, J.S.; Li, J.; Teng, Y.G.; Zhai, Y.Z. Dynamic adsorption of Cd2+ onto acid-modified attapulgite from aqueous solution. Clays Clay Miner. 2014, 62, 415–424. [Google Scholar] [CrossRef]
  40. Zhang, Z.; Wang, W.; Wang, A. Effects of solvothermal process on the physicochemical and adsorption characteristics of palygorskite. Appl. Clay Sci. 2015, 107, 230–237. [Google Scholar] [CrossRef]
  41. Post, J.L.; Crawford, S. Varied forms of palygorskite and sepiolite from different geologic systems. Appl. Clay Sci. 2007, 36, 232–244. [Google Scholar] [CrossRef]
  42. Xie, Q.; Chen, T.; Zhou, H.; Xu, X.; Xu, H.; Ji, J.; Lu, H.; Balsam, W. Mechanism of palygorskite formation in the red clay formation on the Chinese loess plateau, northwest China. Geoderma 2013, 192, 39–49. [Google Scholar] [CrossRef]
  43. Nasedkin, V.V.; Vasiliev, A.L.; Boeva, N.M.; Belousov, P.E. Geology, mineralogy, and genesis of palygorskite clay from Borshchevka deposit in the Kaluga region and outlook for its technological use. Geol. Ore Depos. 2014, 56, 208–227. [Google Scholar] [CrossRef]
  44. Mehdilo, A.; Irannajad, M.; Hojjati-rad, M.R. Characterization and beneficiation of iranian low-grade manganese ore. Physicochem. Probl. Miner. Process. 2013, 49, 725–741. [Google Scholar] [CrossRef]
  45. Passe-Coutrin, N.; Altenor, S.; Cossement, D.; Jean-Marius, C.; Gaspard, S. Comparison of parameters calculated from the BET and Freundlich isotherms obtained by nitrogen adsorption on activated carbons: A new method for calculating the specific surface area. Microporous Mesoporous Mater. 2008, 111, 517–522. [Google Scholar] [CrossRef]
  46. García-Romero, E.; Suárez, M.; Santarén, J.; Alvaréz, A. Crystallochemical characterization of the palygorskite and sepiolite from the Allou Kagne deposit, Senegal. Clays Clay Miner. 2007, 55, 606–617. [Google Scholar] [CrossRef]
  47. Presciutti, F.; Capitani, D.; Sgamellotti, A.; Brunetti, B.G.; Costantino, F.; Viel, S.; Segre, A. Electron paramagnetic resonance, scanning electron microscopy with energy dispersion x-ray spectrometry, X-ray powder diffraction, and NMR characterization of iron-rich fired clays. J. Phys. Chem. B 2005, 109, 22147–22158. [Google Scholar] [CrossRef] [PubMed]
  48. Stefaniak, E.A.; Alsecz, A.; Frost, R.; Máthé, Z.; Sajó, I.E.; Török, S.; Worobiec, A.; Grieken, R.V. Combined SEM/EDX and micro-Raman spectroscopy analysis of uranium minerals from a former uranium mine. J. Hazard. Mater. 2009, 168, 416–423. [Google Scholar] [CrossRef]
  49. Worobiec, A.; Vermaak, S.P.; Brooker, A.; Darchuk, L.; Stefaniak, E.; Grieken, R.V. Interfaced SEM/EDX and micro-Raman Spectrometry for characterization of heterogeneous environmental particles—Fundamental and practical challenges. Microchem. J. 2010, 94, 65–72. [Google Scholar] [CrossRef]
  50. Yang, F.; Sun, S.; Chen, X.; Chang, Y.; Zha, F.; Lei, Z. Mg-Al layered double hydroxides modified clay adsorbents for efficient removal of Pb2+, Cu2+ and Ni2+ from water. Appl. Clay Sci. 2016, 123, 134–140. [Google Scholar] [CrossRef]
  51. Schuette, R.; Goodman, B.A.; Stucki, J.W. Magnetic properties of oxidized and reduced smectites. Phys. Chem. Miner. 2000, 27, 251–257. [Google Scholar] [CrossRef]
  52. Mashlan, M.; Bartonkova, H.; Jancik, D.; Tucek, J.; Martinec, P. Iron oxide modified minerals. Hyperfine Interact. 2009, 191, 151–157. [Google Scholar] [CrossRef]
  53. Suárez, M.; García-Romero, E. FTIR spectroscopic study of palygorskite: Influence of the composition of the octahedral sheet. Appl. Clay Sci. 2006, 31, 154–163. [Google Scholar] [CrossRef]
  54. Cheng, H.; Frost, R.L.; Yang, J.; Liu, Q.; He, J. Infrared and infrared emission spectroscopic study of typical Chinese kaolinite and halloysite. Spectrochim. Acta Part A Mol. Biomol. Spectrosc. 2010, 77, 1014–1020. [Google Scholar] [CrossRef]
  55. Lu, Y.; Dong, W.; Wang, W.; Wang, Q.; Hui, A.; Wang, A. A comparative study of different natural palygorskite clays for fabricating cost-efficient and eco-friendly iron red composite pigments. Appl. Clay Sci. 2019, 167, 50–59. [Google Scholar] [CrossRef]
  56. Wang, C.; Wang, Z.; Li, C.; Zhen, W.; Wang, S.; Huang, S. Effects of modified palygorskite on performance, crystallization and rheology of polyphenylene sulfide. Appl. Clay Sci. 2023, 240, 106967. [Google Scholar] [CrossRef]
  57. Madejová, J. FTIR techniques in clay mineral studies. Vib. Spectrosc. 2003, 31, 1–10. [Google Scholar] [CrossRef]
  58. Alkan, M.; Tekin, G.; Namli, H. FTIR and zeta potential measurements of sepiolite treated with some organosilanes. Microporous Mesoporous Mater. 2005, 84, 75–83. [Google Scholar] [CrossRef]
  59. Bashir, S.; McCabe, R.W.; Boxall, C.; Leaver, M.S.; Mobbs, D. Synthesis of α- and β-FeOOH iron oxide nanoparticles in non-ionic surfactant medium. J. Nanoparticle Res. 2009, 11, 701–706. [Google Scholar] [CrossRef]
  60. Cheng, H.; Yang, J.; Frost, R.L.; Wu, Z. Infrared transmission and emission spectroscopic study of selected Chinese palygorskites. Spectrochim. Acta Part A Mol. Biomol. Spectrosc. 2011, 83, 518–524. [Google Scholar] [CrossRef]
  61. Lazarevié, S.; Jankovié-Castvan, I.; Djokié, V.; Radovanovié, Z.; Janaékovié, D.; Petrovié, R. Iron-modified sepiolite for Ni2+ sorption from aqueous solution: An equilibrium, kinetic, and thermodynamic study. J. Chem. Eng. Data 2010, 55, 5681–5689. [Google Scholar] [CrossRef]
  62. Liu, Q.; Yao, X.; Cheng, H.; Frost, R.L. An infrared spectroscopic comparison of four Chinese palygorskites. Spectrochim. Acta Part A Mol. Biomol. Spectrosc. 2012, 96, 784–789. [Google Scholar] [CrossRef]
  63. Liu, H.; Chen, T.; Chang, D.; Chen, D.; Qing, C.; Xie, J.; Frost, R.L. The difference of thermal stability between Fe-substituted palygorskite and Al-rich palygorskite. J. Therm. Anal. Calorim. 2013, 111, 409–415. [Google Scholar] [CrossRef]
  64. Middea, A.; Spinelli, L.S.; Souza Jr, F.G.; Neumann, R.; Fernandes, T.L.A.P.; Gomes, O.F.M. Preparation and characterization of an organo-palygorskite-Fe3O4 nanomaterial for removal of anionic dyes from wastewater. Appl. Clay Sci. 2017, 139, 45–53. [Google Scholar] [CrossRef]
  65. Song, X.; Hao, Y.; Gao, Q.; Cheng, L. Preparation and performance of magnetic zirconium-iron oxide nanoparticles loaded on palygorskite in the adsorption of phosphate from water. Quim. Nova 2022, 45, 1214–1222. [Google Scholar] [CrossRef]
  66. Boudriche, L.; Calvet, R.; Hamdi, B.; Balard, H. Surface properties evolution of attapulgite by IGC analysis as a function of thermal treatment. Colloids Surfaces A Physicochem. Eng. Asp. 2012, 399, 1–10. [Google Scholar] [CrossRef]
  67. Ogorodova, L.; Vigasina, M.; Melchakova, L.; Krupskaya, V.; Kiseleva, I. Thermochemical study of natural magnesium aluminum phyllosilicate: Palygorskite. J. Chem. Thermodyn. 2015, 89, 205–211. [Google Scholar] [CrossRef]
  68. Silva, V.C.; Araújo, M.E.B.; Rodrigues, A.M.; Vitorino, M.B.C.; Cartaxo, J.M.; Menezes, R.R.; Neves, G.A. Adsorption Behavior of Crystal Violet and Congo Red Dyes on Heat-Treated Brazilian Palygorskite: Kinetic, Isothermal and Thermodynamic Studies. Materials 2021, 14, 5688. [Google Scholar] [CrossRef] [PubMed]
  69. Middea, A.; Spinelli, L.S.; Souza Junior, F.G.; Neumann, R.; Fernandes, T.; Faulstich, F.R.L.; Gomes, O. Magnetic polystyrene–palygorskite nanocomposite obtained by heterogeneous phase polymerization to apply in the treatment of oily waters. J. Appl. Polym. Sci. 2018, 135, 46162. [Google Scholar] [CrossRef]
  70. Cui, J.; Zhang, Z.; Han, F. Effects of pH on the gel properties of montmorillonite, palygorskite and montmorillonite-palygorskite composite clay. Appl. Clay Sci. 2020, 190, 105543. [Google Scholar] [CrossRef]
  71. Subrahmanyam, T.V.; Monte, M.B.M.; Middea, A.; Valdiviezo, E.; Lins, F.F. Contact angles of quartz by capillary penetration of liquids and captive bubble techniques. Miner. Eng. 1999, 12, 1347–1357. [Google Scholar] [CrossRef]
  72. Giles, C.H.; MacEwan, S.N.; Nakhwa, S.N.; Smith, D. Studies in Adsorption: Part XI. A System of Classification of Solution Adsorption Isotherms and Its Use in Diagnosis of Adsorption Mechanisms and in Measurement of Specific Surface AREAS of solids. J. Chem. Soc. 1960, 14, 3973–3993. [Google Scholar] [CrossRef]
  73. Al-Futaisi, A.; Jamrah, A.; Al-Rawas, A.; Al-Hanai, S. Adsorption capacity and mineralogical and physico-chemical characteristics of Shuwaymiyah palygorskite (Oman). Environ. Geol. 2007, 51, 1317–1327. [Google Scholar] [CrossRef]
  74. He, J.; Hong, S.; Zhang, L.; Gan, F.; Ho, Y.S. Equilibrium and thermodynamic parameters of adsorption of methylene blue onto rectorite. Fresenius Environ. Bull. 2010, 19, 2651–2656. Available online: http://dns2.asia.edu.tw/~ysho/YSHO-English/Publications/PDF/Fre%20Env%20Bul19,%202651.pdf (accessed on 25 May 2022).
  75. Cychosz, K.A.; Thommes, M. Progress in the Physisorption Characterization of Nanoporous Gas Storage Materials. Engineering 2018, 4, 559–566. [Google Scholar] [CrossRef]
Figure 1. Location of the Paly deposits in Guadalupe, Brazil.
Mining 04 00004 g001
Figure 2. X-ray diffraction patterns of Palys before (1) and after (2) reduction of the quartz concentration: (a) Paly I; (b) Paly II; (c) Paly III; (d) Paly IV and (e) Paly V. (f) Quartz XRD intensities of the most significant peak (d-spacing = 3.34 Å) before and after treatment.
Mining 04 00004 g002
Figure 3. X-ray diffraction patterns of Palys before (1) and after Fe3+ adsorption (2): (a) Paly I; (b) Paly II; (c) Paly III; (d) Paly IV and (e) Paly V. Mineral phases observed: C—clinochlore; P—palygorskite (circles highlighting the main peak of Palys); K—kaolinite; Q—quartz; A—anatase and D—diaspore. (f) Palys XRD intensities of the most significant peak (d-spacing = 10.5 Å) and (g) XRF MgO results from Table 1.
Mining 04 00004 g003
Figure 4. SEM images of Palys before (1) and after Fe3+ adsorption (2): (a) Paly I; (b) Paly II; (c) Paly III; (d) Paly IV and (e) Paly V, with different magnifications in order to better observe Palys’ morphologies. (3) Secondary electron image detail of Paly I.
Mining 04 00004 g004
Figure 5. (a) Acquired EDS spectra; (b) corresponding BSE images and (c) X-ray maps showing the distribution of Mg (in red) in Palys before Fe3+ adsorption: (1) Paly I; (2) Paly II; (3) Paly III; (4) Paly IV and (5) Paly V.
Mining 04 00004 g005aMining 04 00004 g005b
Figure 6. Cumulative oversize of the Palys’ size distributions before and after Fe3+ adsorption using (a) Mastersizer; (b) Nanosizer and (c) nanoparticle density measurements for (1) Palys and (2) Palys-Fe3+.
Mining 04 00004 g006
Figure 7. Magnetization curves of Palys at 4 K, 50 K, 100 K and 200 K: (a) Paly I; (b) Paly II; (c) Paly III; (d) Paly IV and (e) Paly V.
Mining 04 00004 g007
Figure 8. FTIR spectra of Palys (1) before (a,c,e,g,i) and after (b,d,f,h,j) adsorption of Fe3+: (a,b) Paly I; (c,d) Paly II; (e,f) Paly III; (g,h) Paly IV and (i,j) Paly V. (2) Summary of vibrational modes.
Mining 04 00004 g008
Figure 9. TGA weight loss and corresponding (1) DTG curves of Palys and (2) Palys-Fe3+: (a) Paly I; (b) Paly II; (c) Paly III; (d) Paly IV and (e) Paly V.
Mining 04 00004 g009
Figure 10. Zeta potential of Paly nanoparticles (1) before and (2) after Fe3+ adsorption: (Mining 04 00004 i001) Paly I; (Mining 04 00004 i002) Paly II; (Mining 04 00004 i003) Paly III; (Mining 04 00004 i004) Paly IV and (Mining 04 00004 i005) Paly V. (3) Paly contact angle (θ) before and after Fe3+ adsorption.
Mining 04 00004 g010
Figure 11. Adsorption studies: (1) influence of mixing time on the adsorption of Fe3+ by Palys; (2) Fe3+ adsorption capacity isotherms and their goodness of fit to the theoretical Langmuir equation; (3) Langmuir plot for the adsorption of Fe3+ onto Palys.
Mining 04 00004 g011
Figure 12. (a) Nitrogen adsorption–desorption isotherm for Paly III; (b) nitrogen adsorption–desorption isotherm for Paly III-Fe3+; (c) specific surface areas for Paly III and Paly III-Fe3+ and (d) three-dimensional AFM topographic image of Paly III crystals.
Mining 04 00004 g012
Table 1. Chemical composition of Palys before and after adsorption with Fe3+ by XRF (wt%).
Oxides (%)Paly IPaly IIPaly IIIPaly IVPaly V
BeforeAfterBeforeAfterBeforeAfterBeforeAfterBeforeAfter
SiO251.045.452.747.550.744.949.343.850.344.3
MgO3.73.73.53.34.14.13.43.42.72.6
Al2O313.111.215.711.916.412.717.213.117.813.8
Fe2O39.815.38.414.68.314.28.514.510.216.1
TiO21.11.11.21.21.70.81.11.01.01.1
K2O1.61.61.31.31.21.21.61.61.11.1
LOI *19.721.717.220.217.622.118.922.616.921.0
Total100100100100100100100100100100
* LOI (loss on ignition). Highlighted: MgO represents principal palygorskite content and Fe2O3 shows the increase in iron after adsorption.
Table 2. Semi-quantitative SEM/EDS (wt%) analyses of Palys before and after Fe3+ adsorption.
Elements (%)Paly IPaly IIPaly IIIPaly IVPaly V
BeforeAfterBeforeAfterBeforeAfterBeforeAfterBeforeAfter
O43.650.740.947.845.246.539.549.040.749.9
Si30.122.431.622.926.924.731.924.430.221.9
Mg3.92.03.62.44.02.33.61.72.52.5
Al9.16.910.67.310.27.312.46.712.16.5
Fe8.414.37.115.27.214.87.113.38.514.2
Ti0.70.50.81.21.31.11.00.60.70.9
K4.23.25.43,25.23.34.54.35.34.1
Total100100100100100100100100100100
Highlighted: MgO represents principal palygorskite content and Fe2O3 shows the increase in iron content after adsorption.
Table 3. TGA/DTA analysis of Palys and Palys-Fe3+.
PalysEvent 1 (°C)/Mass Loss (%)Event 2 (°C)/Mass Loss (%)Event 3 (°C)/Mass Loss (%)Total Mass Loss (%)
PalyPaly-Fe3+PalyPaly-Fe3+PalyPaly-Fe3+PalyPaly-Fe3+
Paly I37.6/9.783.4/12.6191.9/2.3246.5/5.8454.2/4.4495.7/2.816.421.2
Paly II35.2/5.374.8/13.2190.7/2.8237.9/7.4467.6/7.5487.1/2.815.623.4
Paly III69.1/9.672.4/11.1189.3/2.5221.3/6.1472.4/3.6478.9/2.315.719.5
Paly IV42.6/6.256.3/10.8190.2/2.7229.7/7.1466.3/7.4480.7/2.716.320.6
Paly V41.3/6.877.1/8.3190.5/2.3238.4/8.2475.4/5.5482.9/2.314.618.8
Table 4. Adsorption thermodynamic parameters.
Palys SampleR21/KΓm
(g/L)
1/Γm
(mg/g)
K
(L/mol)
ΔG
(KJ/mol)
Paly I0.993944.5000.013850.39−9.71
Paly II0.993552.0000.013542.19−9.27
Paly III0.998627.3450.015290.33−11.16
Paly IV0.998059.0500.013537.15−8.96
Paly V0.994362.7450.013234.19−8.75
Highlighted: Paly III showed more conducive to Fe3+ adsorption.
Table 5. Surface area (m2/g).
PalyBET
Single Point a
BETLangmuirt-Plot Microporet-Plot ExternalBJH Adsorption bBJH Desorption b
Paly III106.65108.87148.7925.8982.9891.27102.41
Paly III-Fe3+98.74102.40141.647.4294.98117.15117.51
a p/p0 = 0.199. b BJH (adsorption and desorption) cumulative surface area of pores between 17.000 Å and 3000.000 Å width.
Table 6. Pore volume (cm3/g).
PalySingle Point AdsorptionSingle Point Desorptiont-Plot MicroporeBJH Adsorption cBJH Desorption c
Paly III0.2098 a0.2187 b0.010970.21640.2212
Paly III-Fe3+0.2163 d0.2181 e0.0024160.22570.2068
a Total pore volume of pores less than 867.838 Å width at p/p0 = 0.9771. b Total pore volume of pores less than 699.660 Å width at p/p0 = 0.9715. c BJH (adsorption and desorption) cumulative volume of pores between 17.000 Å and 3000.000 Å width. d Total pore volume of pores less than 1098.150 Å width at p/p0 = 0.9820. e Total pore volume of pores less than 713.725 Å width at p/p0 = 0.9721.
Table 7. Pore size (Å).
PalyAdsorption aDesorption aBJH Adsorption bBJH Desorption b
Paly III77.0980.3494.8486.42
Paly III-Fe3+84.5185.1877.0870.40
a Average pore width (4 V/A by BET). b Average pore width (4 V/A).
Disclaimer/Publisher’s Note: The statements, opinions and data contained in all publications are solely those of the individual author(s) and contributor(s) and not of MDPI and/or the editor(s). MDPI and/or the editor(s) disclaim responsibility for any injury to people or property resulting from any ideas, methods, instructions or products referred to in the content.

