Article

Evaluation of Flow Liquefaction Susceptibility in Non-Plastic Silty Soils Using the Seismic Cone

by
Helena Paula Nierwinski
1,*,
Fernando Schnaid
2 and
Edgar Odebrecht
3
1
Department of Mobility Engineering, Federal University of Santa Catarina, Estr. Dona Francisca, 8300-Bloco U-Zona Industrial Norte, Joinville 89219-600, Santa Catarina, Brazil
2
Department of Civil Engineering, Engineering School, Federal University of Rio Grande do Sul, Av. Osvaldo Aranha, 99, Porto Alegre 90035-190, Rio Grande do Sul, Brazil
3
Department of Civil Engineering, University of State of Santa Catarina, R. Paulo Malschitzki, 200-Zona Industrial Norte, Joinville 89219-710, Santa Catarina, Brazil
*
Author to whom correspondence should be addressed.
Mining 2024, 4(1), 21-36; https://doi.org/10.3390/mining4010003
Submission received: 10 November 2023 / Revised: 9 December 2023 / Accepted: 3 January 2024 / Published: 5 January 2024

Abstract

:
The state parameter allows the evaluation of the in situ state of soils, which can be particularly useful in tailings impoundments where flow liquefaction is the most common failure model. Positive state parameter values characterize a contractive response during shearing and, for non-plastic soils, can indicate flow liquefaction susceptibility. This paper presents a methodology to classify and estimate the state parameter (Ψ) for non-plastic silty soils based on seismic cone penetration measurements. The method expands on a previous methodology developed for sands that use the ratio of the small strain shear modulus and the cone tip resistance G0/qt for classification and Ψ assessment. For non-plastic silty soils, drainage conditions during cone penetration must be accounted for and are used to allow soil classification and correct the cone tip resistance. An empirical formulation is proposed to correct qt for partial drainage measurements and predict Ψ for non-plastic silty soils. Mining tailings results of in situ and laboratory tests were used to validate the proposed methodology producing promising responses. The Ψ value estimated through the proposed methodology are in the range of those obtained from laboratory tests, indicating an adequate prediction of behavior for non-plastic silty soils.

1. Introduction

This article is a revised and expanded version of a paper entitled In-situ state parameter assessment of non-plastic silty soils using the seismic cone [1], which was presented at the 6th International Conference on Geotechnical and Geophysical Site Characterization. The conference was originally scheduled to be held in Budapest, Hungary in 2020, but due to the COVID-19 pandemic, it was held online from 26 September to 29 September 2021. The article presented at the conference presents a method for estimating the state parameter in silty materials. The present research enhanced the previous study to include a classification system for silt materials based on the SCPTu test results.
The term liquefaction can be used to describe different phenomena in soils. However, it is historically associated with excess pore pressure generated in saturated or nearly saturated granular soils by rapid loading (monotonic or cyclic) under undrained conditions.
Liquefaction of granular soils splits into two main groups: cyclic mobility and flow liquefaction. Cyclic mobility requires undrained cyclic loading and can occur in almost all granular soils, including dense sands that present strain-hardening behavior during the load. The requirement for cyclic mobility is a cyclic loading sufficiently large in size and duration. The deformations in cyclic mobility will stabilize after loading except in very loose soils, which may trigger flow liquefaction [2,3]. On the other hand, flow liquefaction often occurs in very loose soils that exhibit a strain-softening behavior in undrained conditions. Both static and cyclic loadings can trigger uncontrolled flow liquefaction and large deformations that can occur even after loading [4].
Considerable experience has been gathered in the evaluation of liquefaction associated with cyclic loading provided by large earthquakes [3,5,6]. In this case, for example, the susceptibility evaluation can be made using a CPT-based approach, relating the measured cone resistance to the cyclic shear stress ratio [7,8].
Flow liquefaction, however, received much less attention, despite the recognition of risks in activities such as reclaimed land and mining storage facilities. In the mining industry, there is an increasing demand for sustainable and adapted infrastructures, setting new challenges for geotechnical engineering concerning the need to store large volumes of disposed tailings in more extensive and higher storage facilities. Within the entire range of failure modes that have occurred at tailings impoundments, flow liquefaction is likely to be the most common and has already taken hundreds of lives [9,10]. One recent example is the 100 m height Fundão tailings dam failure in 2015 in Brazil, in a liquefaction flow slide that resulted in a complete loss of the material in the storage pit [11].
Saturated or near-saturated metastable loose cohesionless sands and silts can be susceptible to flow liquefaction [12] with various mechanisms that can trigger a collapse, involving both static and cyclic loading. In the former, slope instability, incremental impoundment raise construction, transient saturation of the downstream shell, and lateral movements of soft slurries in the dam can induce static loads. In the latter, equipment vibration, mine blasting, and even a seismic event can characterize cyclic loads.
As previously mentioned, as a requirement for flow liquefaction, the soil must exhibit a contractive behavior on undrained shear. Contractive soil behavior characterizes a volumetric strain decrease during shear; on the other hand, dilative soils present increased volumetric strains. Most of the studies on flow liquefaction use results from laboratory triaxial tests, aiming to understand the behavior of materials, define the critical state line, and calibrate parameters for constitutive models [13,14]. Based on the definition of the critical state line, it is possible to describe the behavior of the soil as contractile or dilatant through the so-called state parameter (Ψ). In the void ratio (e) and mean effective stress (p′ = (σ′1 + 2σ′3)/3) space, the state parameter Ψ is defined as the difference between the current void ratio (e) and critical state void ratio (ec), at the same mean stress [15]. The degree of contractiveness or dilatancy of soils is characterized by positive or negative Ψ values, respectively. In practice, a state parameter equal to −0.05 is considered a minimum state limit to ensure satisfactory engineering performance against flow liquefaction [16].
The stress state leading to flow liquefaction can be determined from consolidated undrained triaxial compression tests sheared with full saturation. Nevertheless, in the case of granular soils, there are difficulties in retrieving undisturbed samples by conventional methods and faithful reproduction of soil structure in the laboratory. For non-plastic silty grain-sized soils, even constitutive models and numerical implementation require studies and adaptations to adapt to the actual behavior of these materials [17]. Under these conditions, using in situ testing to predict granular and non-plastic silty soil behavior and flow liquefaction susceptibility is common and practical.
For sands, the state parameter Ψ can be assessed directly from cone tests [18,19] or, in a more robust approach, using the combination of measurements from independent tests. For instance, it is possible to use the ratio of elastic stiffness to cone resistance, G0/qt [20], or cone resistance to pressuremeter limit pressure, qc/pL [21].
The present paper focuses on the seismic cone (SCPTu) and the use of the G0/qt ratio to derive Ψ. Both the stiffness (G0) and the shear resistance (qt) are controlled (although differently) by void ratio, mean stresses, compressibility, and soil structure, and are therefore different functions of the same variables [22]. As a ratio, these two measurements can be useful in predicting the soil state [20,22,23,24].
The G0 value can be determined from in situ shear wave velocity measurements (Vs), as in Equation (1):
G 0 = ρ · V s 2
where ρ is the measured mass density (equal to the total unit weight divided by the acceleration of gravity) of the soil.
The theoretical correlation between Ψ and the G0/qt ratio is presented in Equation (2) [20]:
Ψ = α p p a β + χ G 0 q t
where, α = 0.520, β = 0.07, and χ = 0.180 are average coefficients obtained from calibration chamber data for clean sands [20]. The parameters p′ and pa are the mean effective stress, and the standard atmospheric pressure, respectively, and qc = qt is for sands with full drainage.
Schnaid et al. [25] proposed a two-stage methodology to classify and predict the state parameter for sandy soil based on the G0/qt ratio (Equation (2)) from SCPTu test data. Recognizing the importance of the state parameter in assessing susceptibility to flow liquefaction in mining tailings and knowing that this material is silty grain-sized, this paper aims to present an adaptation of an early method introduced by Schnaid et al. [25] for application in non-plastic silty soils. The first stage of the methodology is a classification system that was expanded to consider partial drainage, a common condition observed during in situ tests in mining tailings. New zones are explored to include parameter combinations that characterize non-plastic highly sensitive soils. The second stage of the methodology consists of defining the state parameter from Equation (2). In this situation, an empirical correction of qt was proposed to consider the partial drainage conditions during cone penetration in silty grain-sized soils. Adopting the correction, qt values were obtained for a drained condition, and the Ψ values could be calculated using Equation (2), previously proposed for granular soils with drained behavior. The results from the SCPTu tests were used to validate the expansion of the method. Values of the Ψ estimates from field tests using the proposed correction of qt mostly fell within the range of values obtained through laboratory tests.

2. Drainage Conditions on CPTu Tests

Geotechnical designs require the definition of drained or undrained conditions with respect to the soil response to a given imposed load. For example, when clay is subjected to loading, it doesn’t allow an immediate drainage of water. On the other hand, when sand receives loads, drainage occurs at a fast rate. Therefore, the design should consider undrained shear stress for clays and drained shear stress for sands. For transient soils in the intermediate permeability range (10−5 m/s < k < 10−8 m/s), such as silty soils and mining tailings, there are no consensual guidelines for correct testing and data interpretation [26,27]. The results of a standard cone penetration test (CPTu) (v = 20 mm/s) are affected by partial drainage during the penetration [28], which, may induce errors in the prediction of soil parameters.
Several studies aim to analyze the CPTu test results varying the penetration velocity, thus achieving full drainage conditions at low penetration velocities and completely undrained conditions at high penetration velocities [29,30,31,32]. This assessment is usually performed based on the normalized penetration velocity, as presented in Equation (3):
V = v · d c h
where v is the cone penetration rate; d is the penetrometer diameter; and ch is the coefficient of horizontal consolidation. According to Randolph and Hope [29], fully undrained penetration occurs when V values are higher than a value around 30–100, and fully drained penetration occurs when V values are less than a value around 0.03–0.01.
The reduction of the cone penetration velocity and V values, in normally consolidated soils (contractive behavior during shear), decreases the pore pressure generation caused by the cone penetration and consequently increases the cone tip resistance. The soil drainage characteristic curve allows a precise analysis of these conditions. In this representation, normalized values of resistance (Q/Qref) and pore pressure (∆u/∆uref) are plotted against V values. Often the drainage characteristic curve is adjusted from numerical and experimental data, and the reference parameters are those corresponding to the complete undrained condition [27,28,33].
Schnaid [34] emphasizes that each soil presents a unique drainage characteristic curve, and the transition between drained to totally undrained conditions has to be defined locally. Such a behavior is justified by the influence of the OCR and soil rigidity index. Dienstmann et al. [27] presented a set of theoretical and experimental drainage characteristic curves for different geomaterials, including gold mining tailing. The authors highlighted that the variation between drained and undrained resistance is lower in clays than in sands. In the above-mentioned study, drained-to-undrained resistance ratios around of 2 for clays, 8 to 10 for granular soils, and around 10 for gold mining tailings were reported.
In addition, the evaluation of drainage conditions from the piezocone pore pressure parameter Bq can be helpful; Bq greater than 0.5 is enough to characterize undrained conditions and lower values may indicate partial drainage [35].

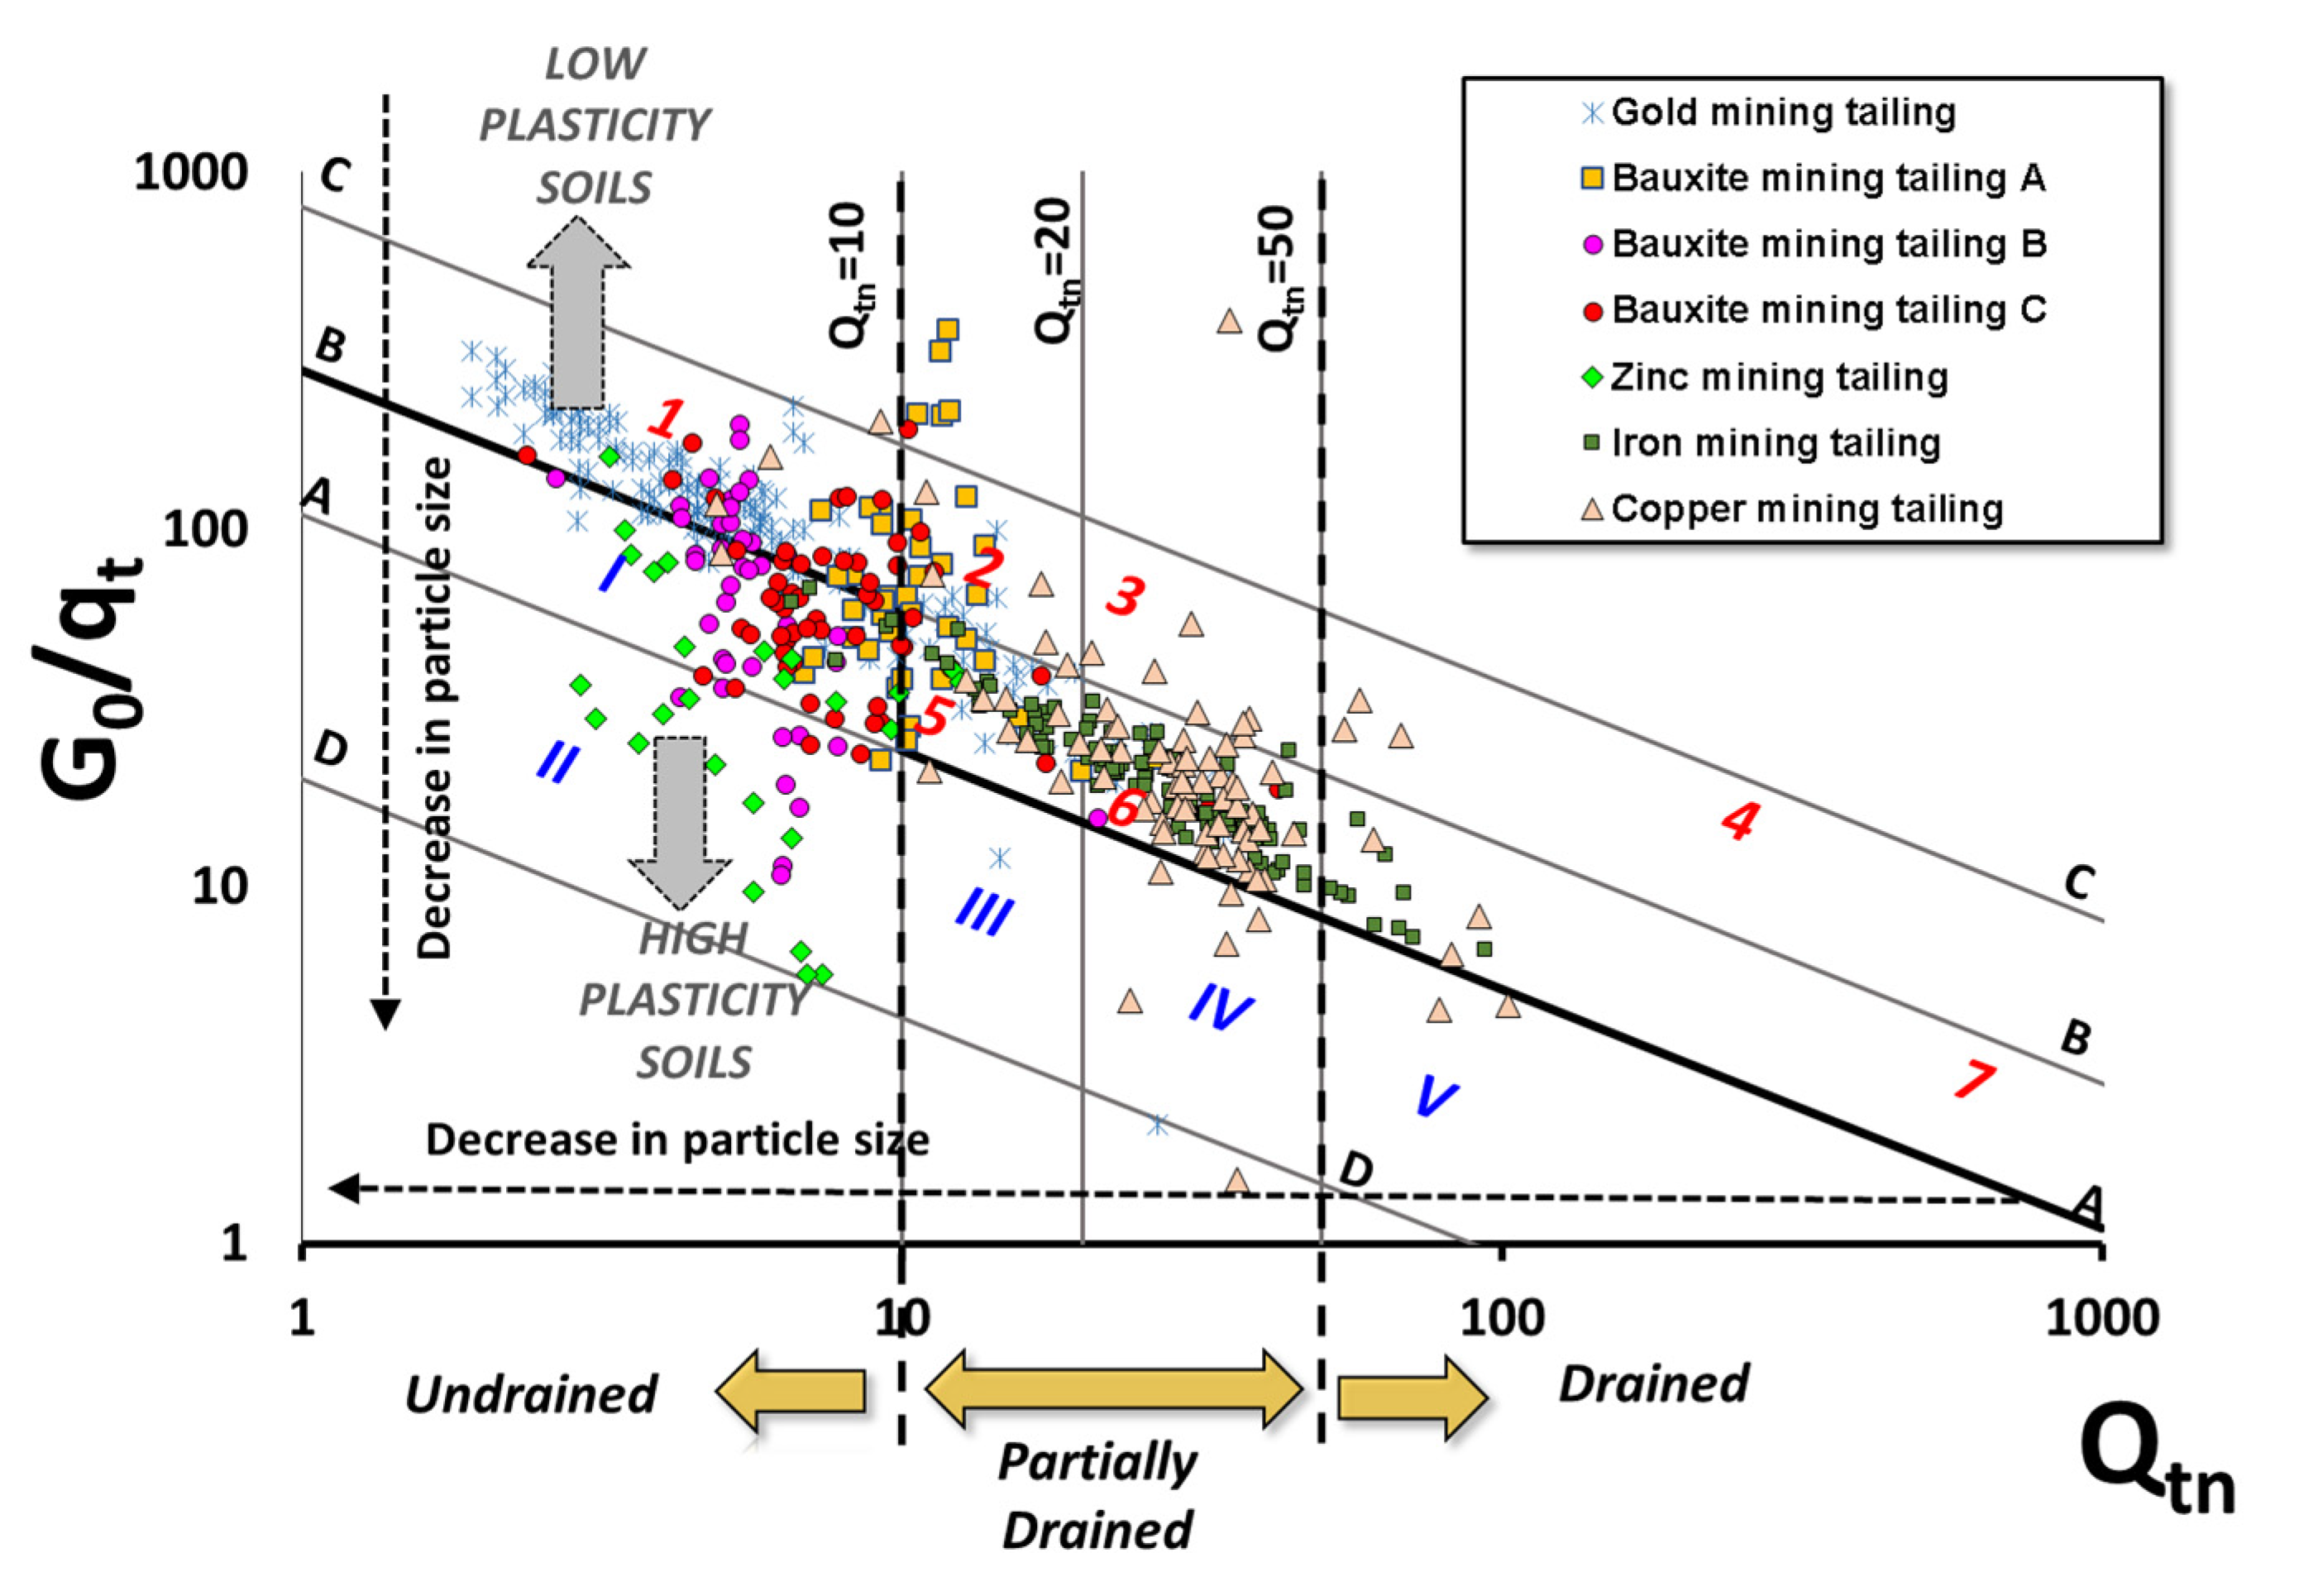
3. Classification and Flow Liquefaction Evaluation for Non-Plastic Silty Soils Based on Seismic Cone Tests

This section presents the developed methodology to classify soils, including non-plastic silty soils and sensitive soils, and estimate the state parameter for flow liquefaction evaluation in non-plastic silty soils using seismic cone test data.
The proposed methodology is an expansion of the two-stage system (Figure 1) proposed by Schnaid et al. [25] for granular soils. In this proposal, the authors initially classify the soils in the graph on the left and subsequently, with the help of Equation (2), define the value of the state parameter of these materials, classifying them as contractive or dilative. Our main challenge in expanding the method is including partial drainage conditions observed in situ tests conducted on non-plastic silty grain-sized soils. To better understand the behavior of non-plastic silty soils, an initial analysis based on laboratory results was carried out to support the proposed method, as discussed below.

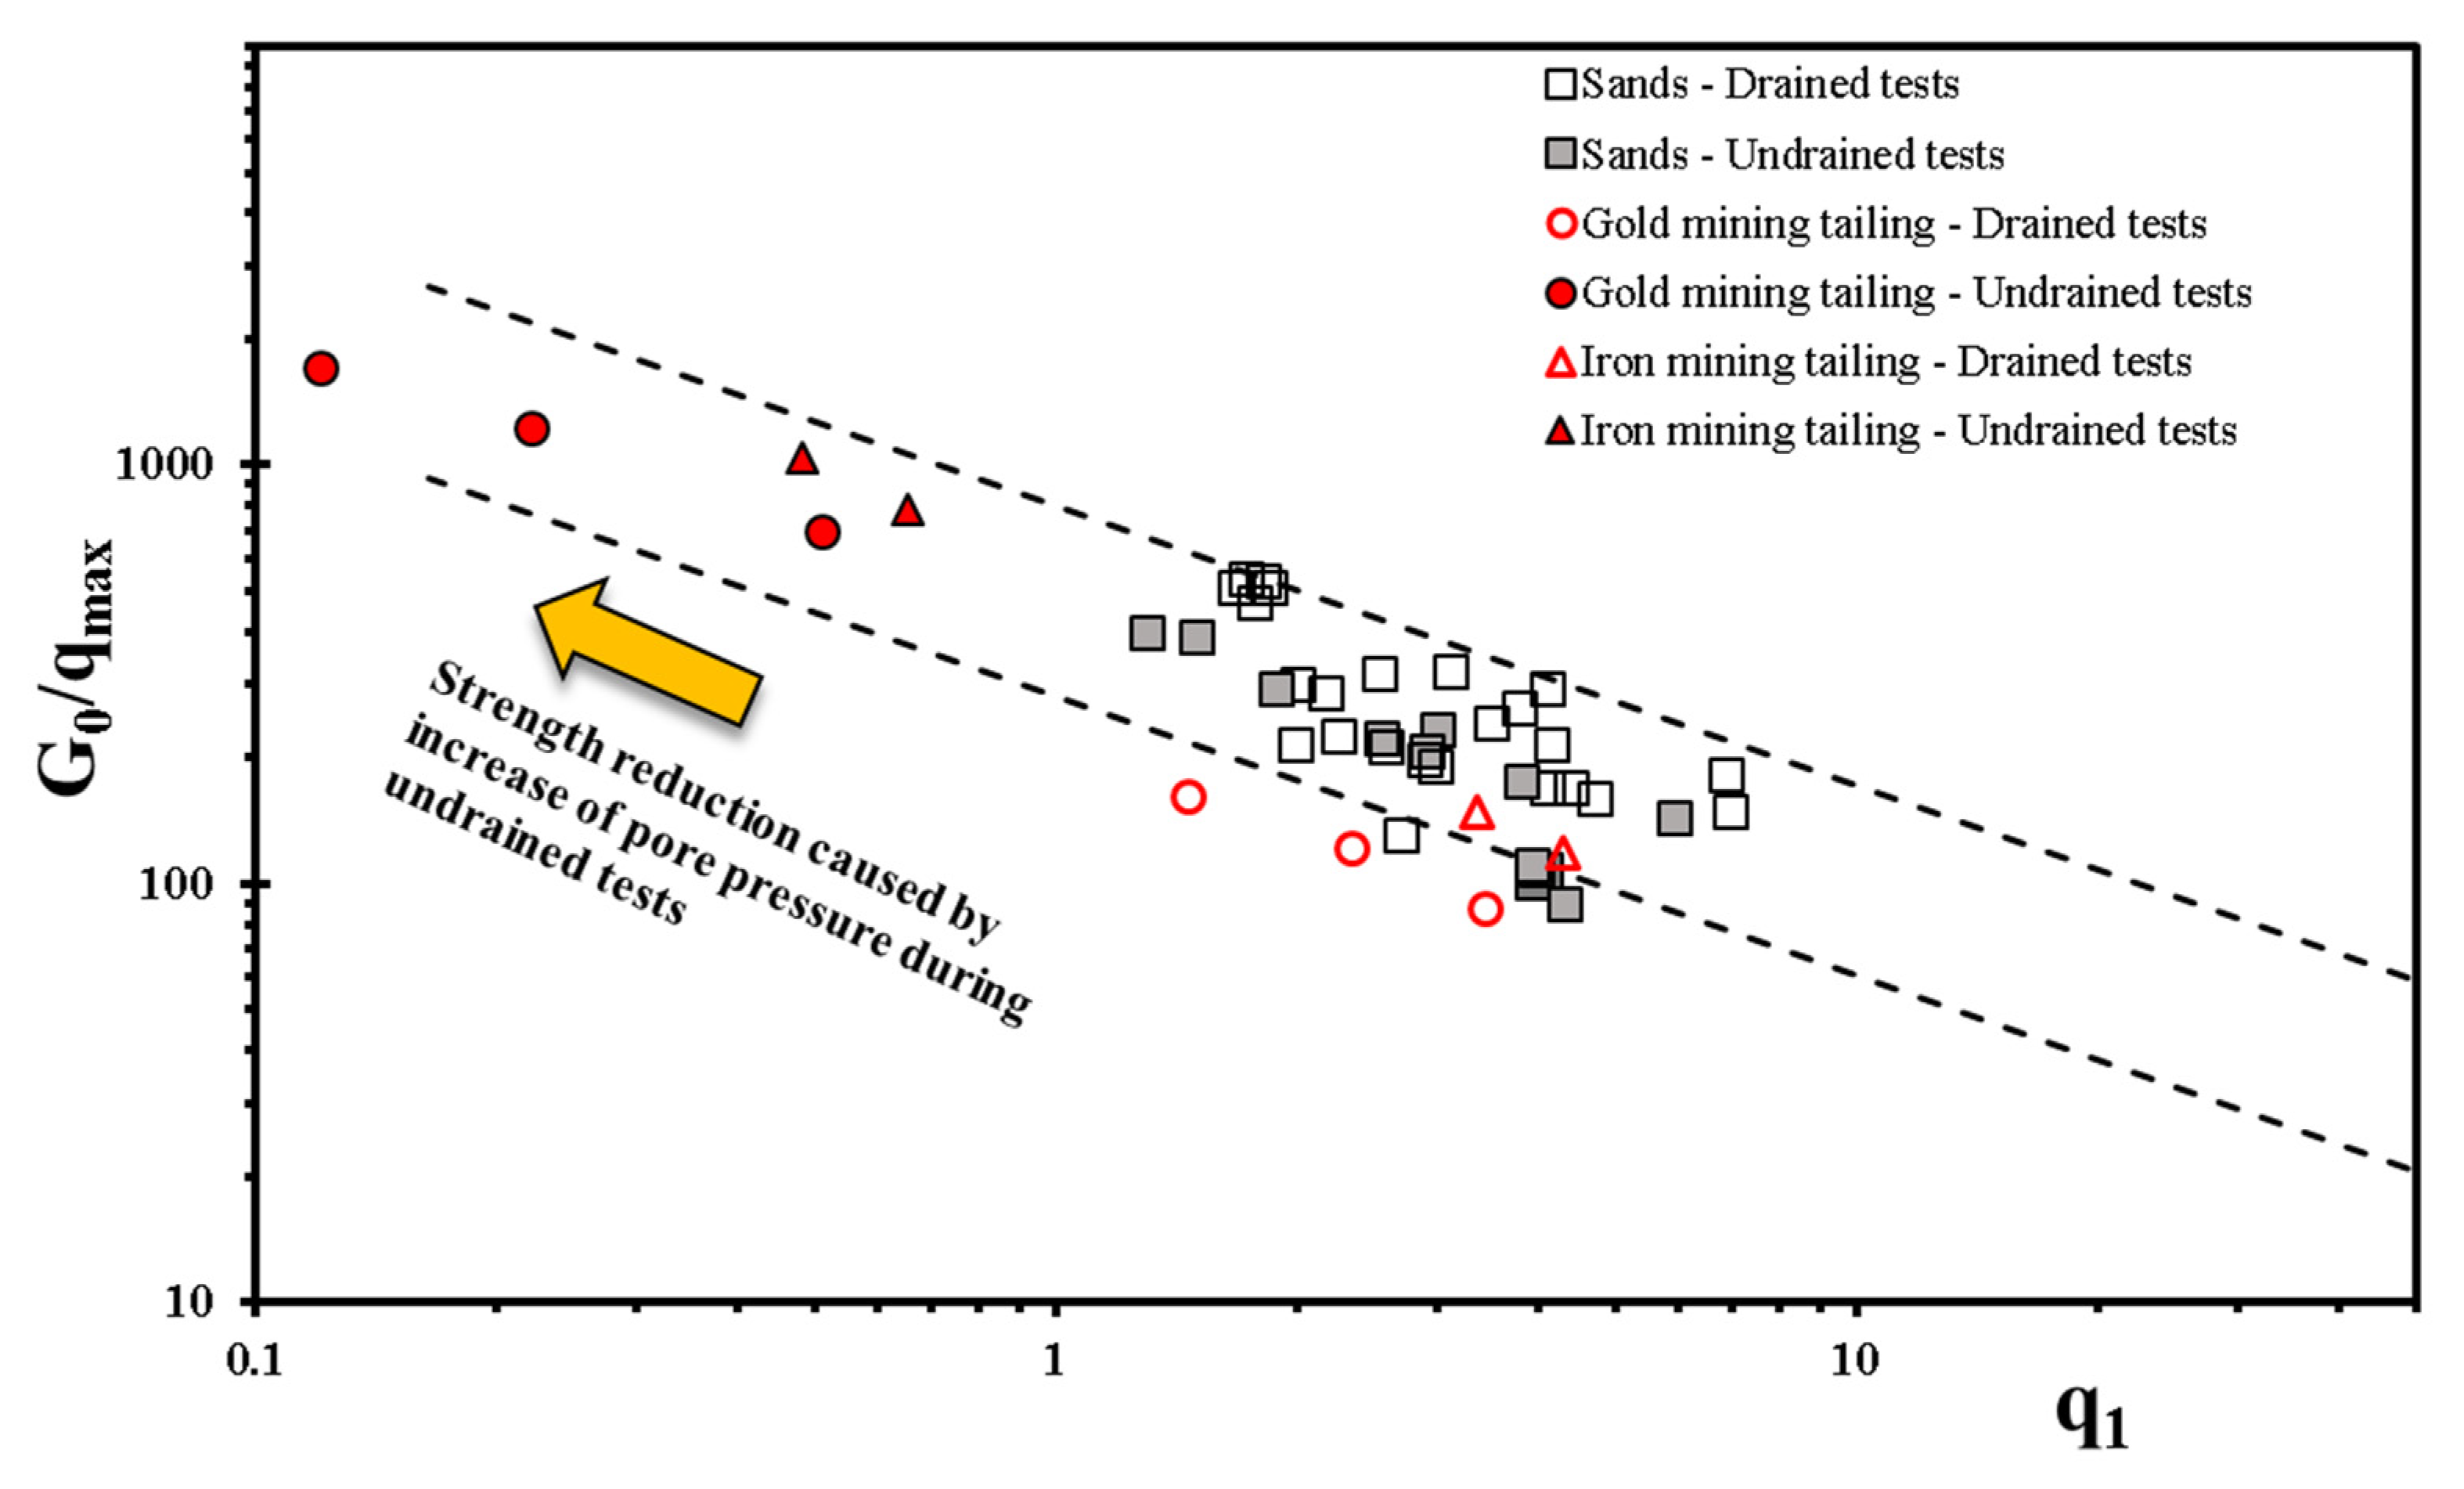
3.1. Laboratory Test Results Analysis

To understand the behavior of non-plastic silty soils, an initial comparison was made using laboratory test results from the literature performed on sands and mining tailings (non-plastic silty grain-sized materials). Drained and undrained triaxial test results combined with bender elements measurements were analyzed to identify the influence of drainage conditions on soil strength parameters.
Recognizing that the combination of independent variables is effective in field test results analysis [20], the stiffness and strength measurements obtained through drained and undrained triaxial tests were combined in Figure 2. The maximum shear resistance and shear modulus ratio (qmax/G0) were plotted against the normalized maximum shear resistance (q1), obtained through Equation (4).
q 1 = q m a x p a · p a σ 3 0.5
where σ3 is the triaxial confining stress.
Considering that stiffness measurements were obtained at the end of the consolidation step; the strength is the unique parameter in Figure 2 that is dependent on drainage conditions. Thus, it is possible to verify that a reduction in qmax values increases the G0/qmax ratio and decreases q1, positioning the combined data above and on the left in Figure 2, respectively.
The sand samples that generated the results in Figure 2 had relative densities varying between 15 and 85%, depending on the study. The mining tailings samples aimed to simulate the condition of hydraulic release of the material into the deposits, with a void index equal to or very close to the maximum (1.2 for gold mining tailings and 0.9 for iron mining tailings). The low density and mean grain size of mining tailing samples cause an increase in pore pressure generation during undrained shearing and reduce qmax values. Figure 1 illustrates the significant reduction in undrained shear resistance for mining tailing samples compared to sand samples. Similar results were found by Zhu et al. [44], who investigated the influence of the presence of fine particles in a granular matrix, verifying that there is a deleterious effect on the undrained shear strength with the increase of fine particles, in addition to facilitating the generation of excess pore pressures. Moreover, it is interesting to note that for drained conditions, the combination of results for both sands and mining tailings is quite similar in normalized maximum resistance (q1), with only the G0/qt ratio being lower in the case of tailings. This behavior supports the analysis of non-plastic silty soil behavior based on formulations employed to sands in drained conditions.

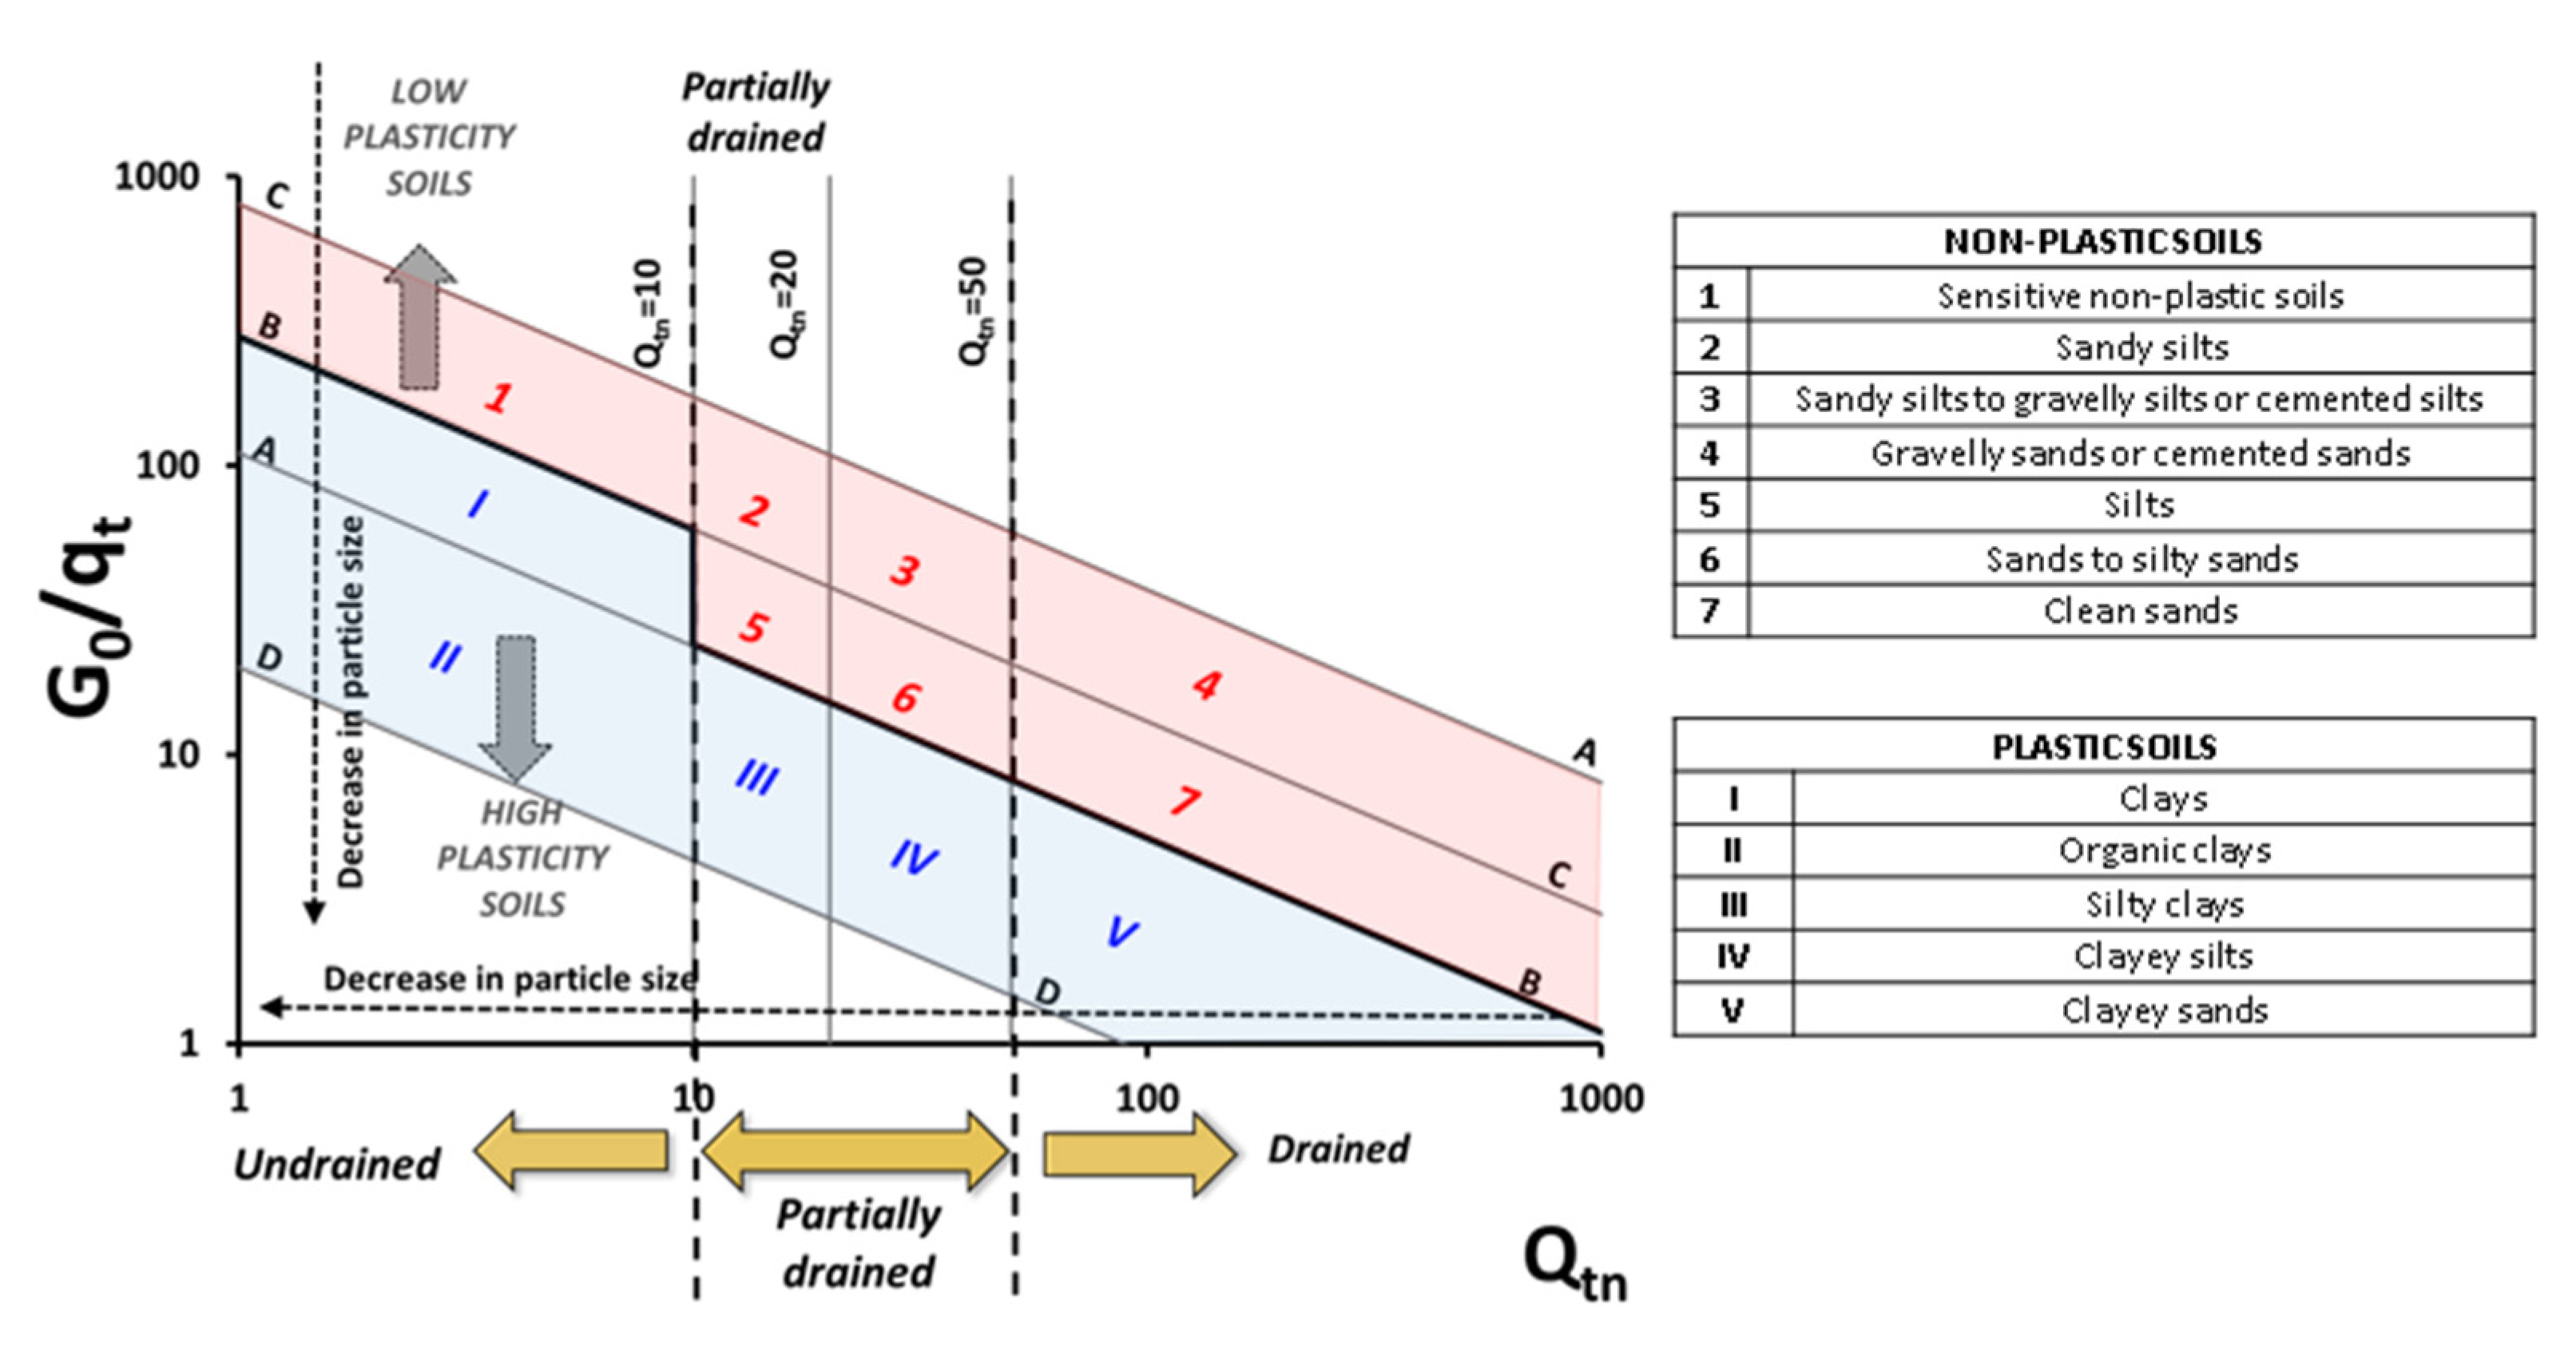
3.2. Developed Expansion on the Classification System

The behavior verified at the laboratory helps to analyze and interpret field test results. From the analysis of the data presented in Figure 2, in the present study, we propose an expansion of the soil classification system proposed by Schnaid et al. [25] to include silty and highly sensitive non-plastic soils. This classification method considers data from seismic cone tests, with the ratio between the small strain shear modulus and the cone tip resistance (G0/qt) expressed on the y-axis and the normalized cone resistance (Qtn) expressed on the x-axis. The expanded proposed method is shown in Figure 3. The auxiliary vertical lines, presented in the classification system, help define the type of material and drainage conditions during cone penetration. A vertical line for Qtn = 50 has already been recognized as a safe and conservative limit to separate sands from sand mixtures: soils above the A-A line with Qtn > 50 are granular, and cone penetration occurs in drained conditions [28]. At the same time, values of Qtn < 50 are representative of sand and silt mixtures where partial drainage may occur during cone penetration. The soils below line B-B, characterized by Qtn < 10, are typically clays, and cone penetration will occur in undrained conditions. Intermediate conditions are representative of mixtures of clays, silts, and sands, where cone penetration is likely to occur under partially drained conditions. In addition to the vertical lines of Qtn = 50 and Qtn = 10, a line was inserted to intermediate empirical Qtn = 20. This line presents a possible frontier between mixtures with a higher proportion of sand (on the right) and a higher proportion of silty fines (on the left).
As can be seen in Figure 3, the classification system also presents a central master line that aims to divide low-plasticity soils from high-plasticity soils. This line is defined by line A-A up to the value of Qtn = 10 and continues through line B-B for values lower than Qtn = 10. The definition of this master line was carried out based on the results of field trials. Another notable factor observed is that the granulometry of the soils evaluated in the system tends to reduce from right to left and from top to bottom in the graph.
Results of tests carried out on mining tailings were also evaluated for assembly of the classification system. It was found that, as they are thin materials, these results were concentrated further to the left of the graph, moving between regions of plasticity or non-plasticity, depending on their origin. It should be noted that the results of tests carried out in non-plastic waste reservoirs with high generation of excess pore pressure during cone driving tend to be concentrated to the left of the graph, although, in a more superior way (region 1). This is due to the low values of cone tip resistance, which causes an increase in the values of the G0/qt ratio.
Based on this evidence, the proposed classification is divided into classes ranging from 1 to 7 for low-plasticity soils (sands and sandy mixtures) and I to V for high-plasticity soils (clays and clay mixtures), in the dimensionless log-log space G0/qt versus Qtn, as illustrated in Figure 3.

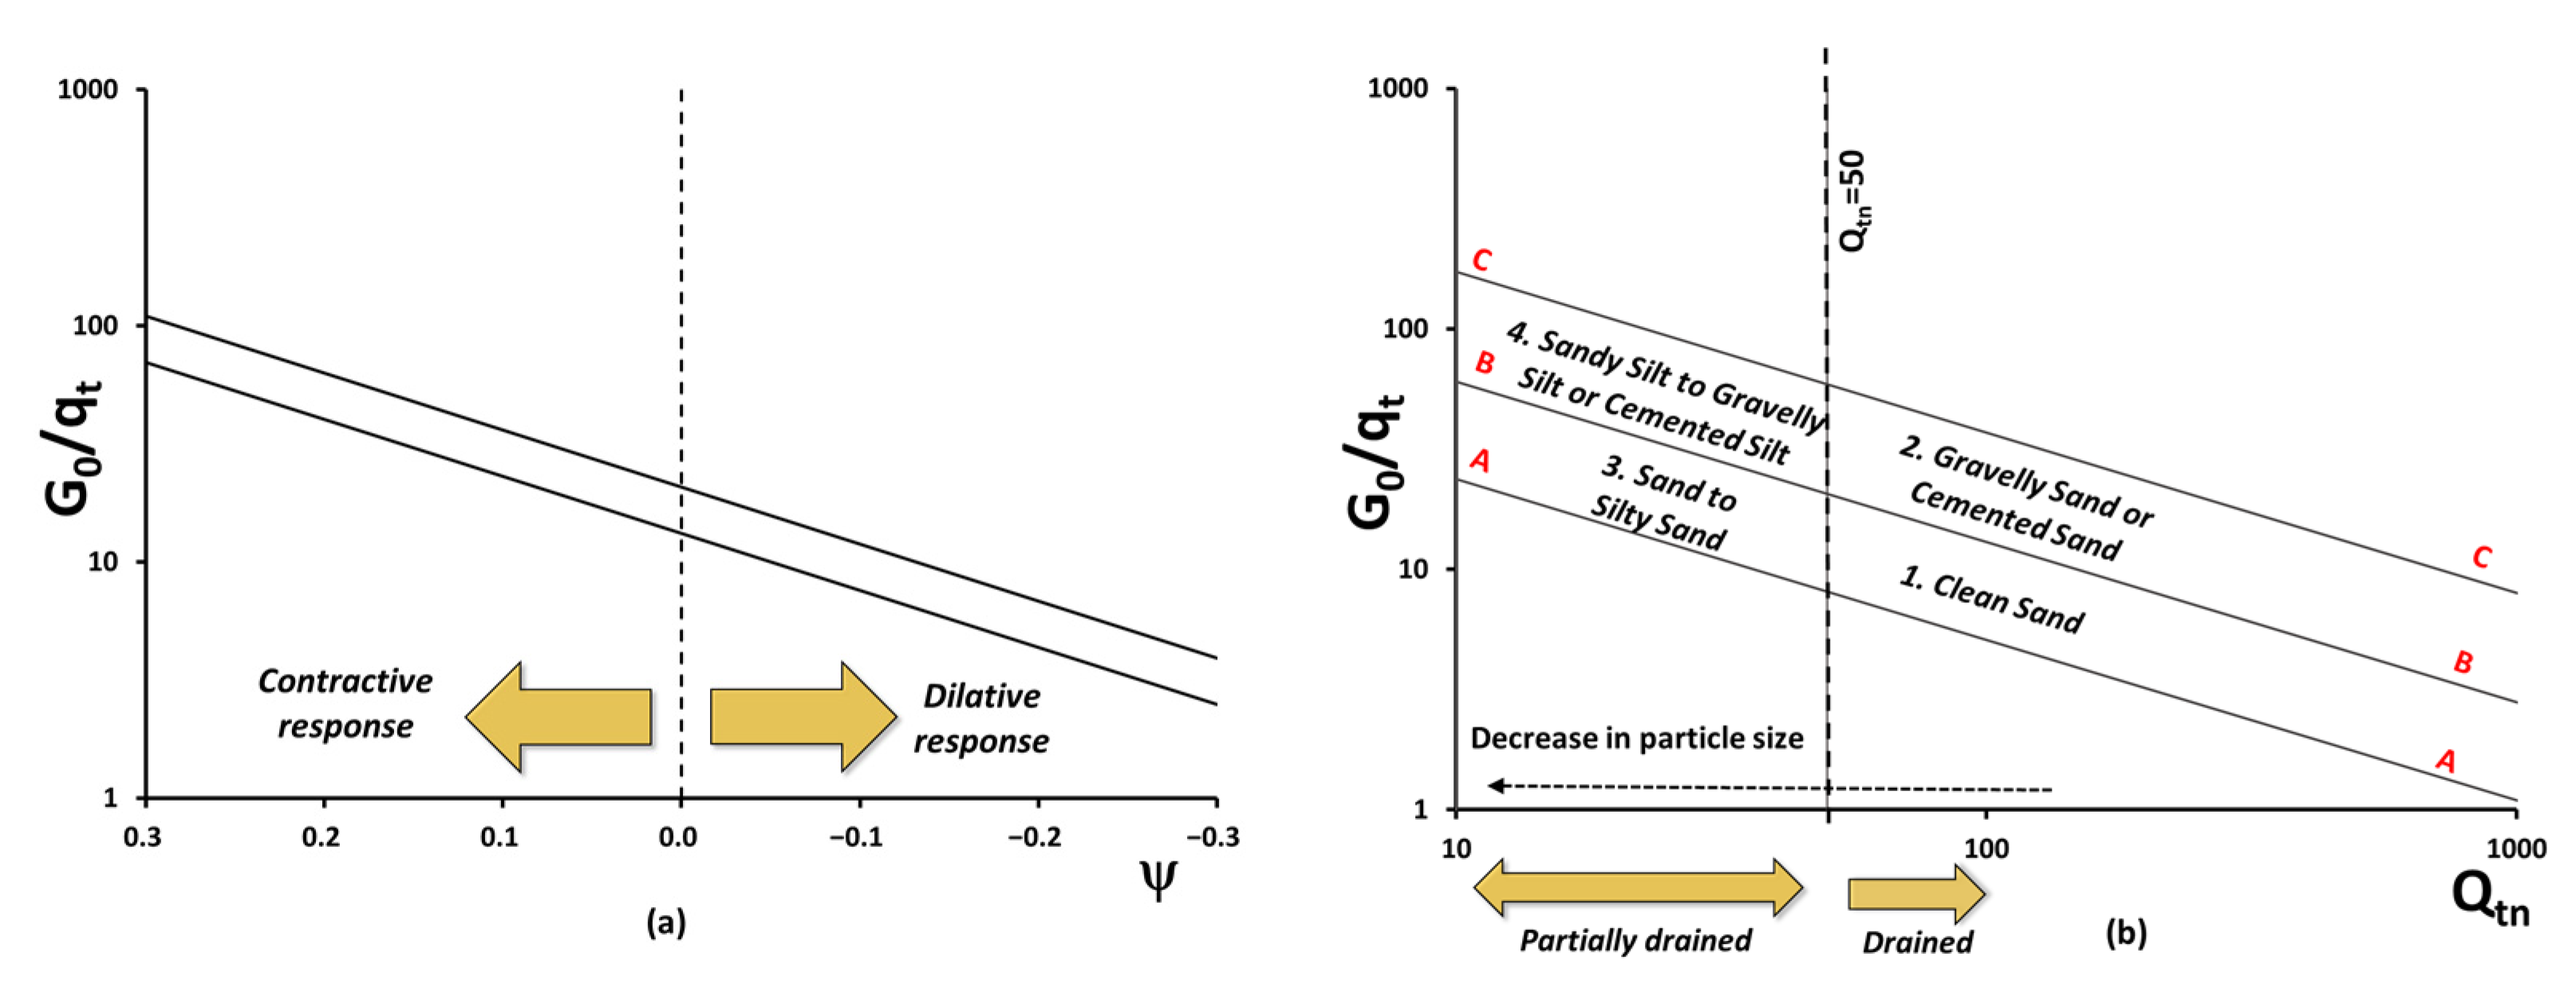
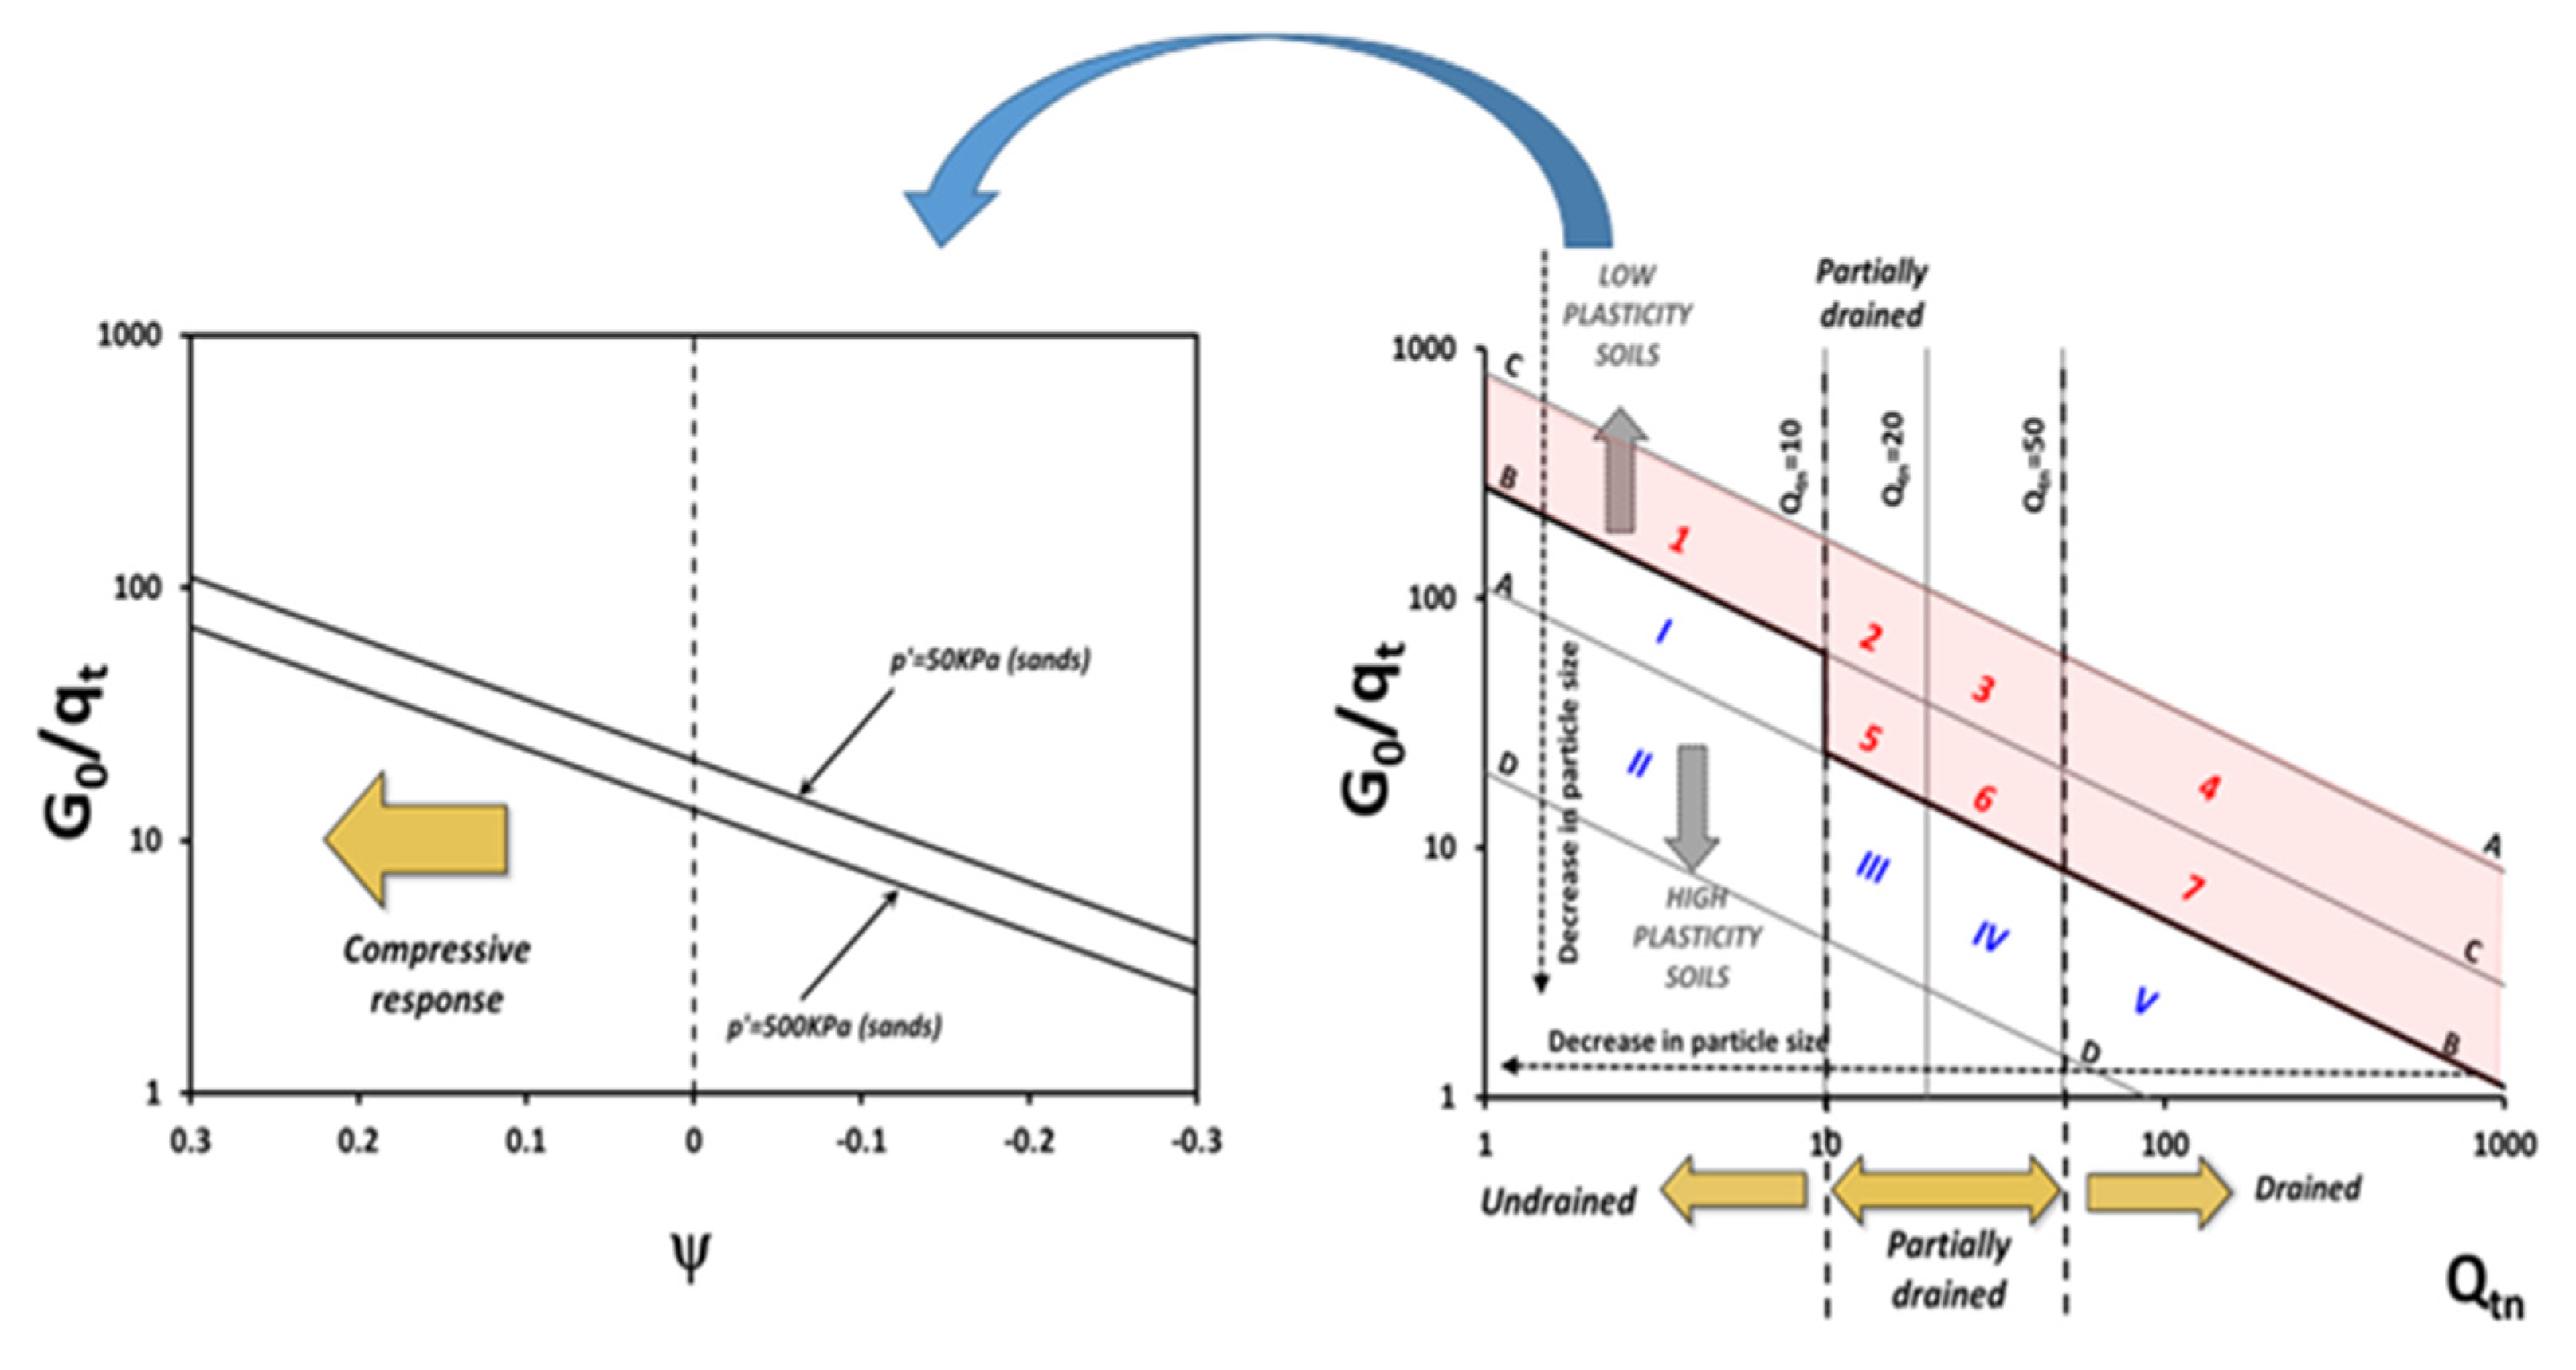
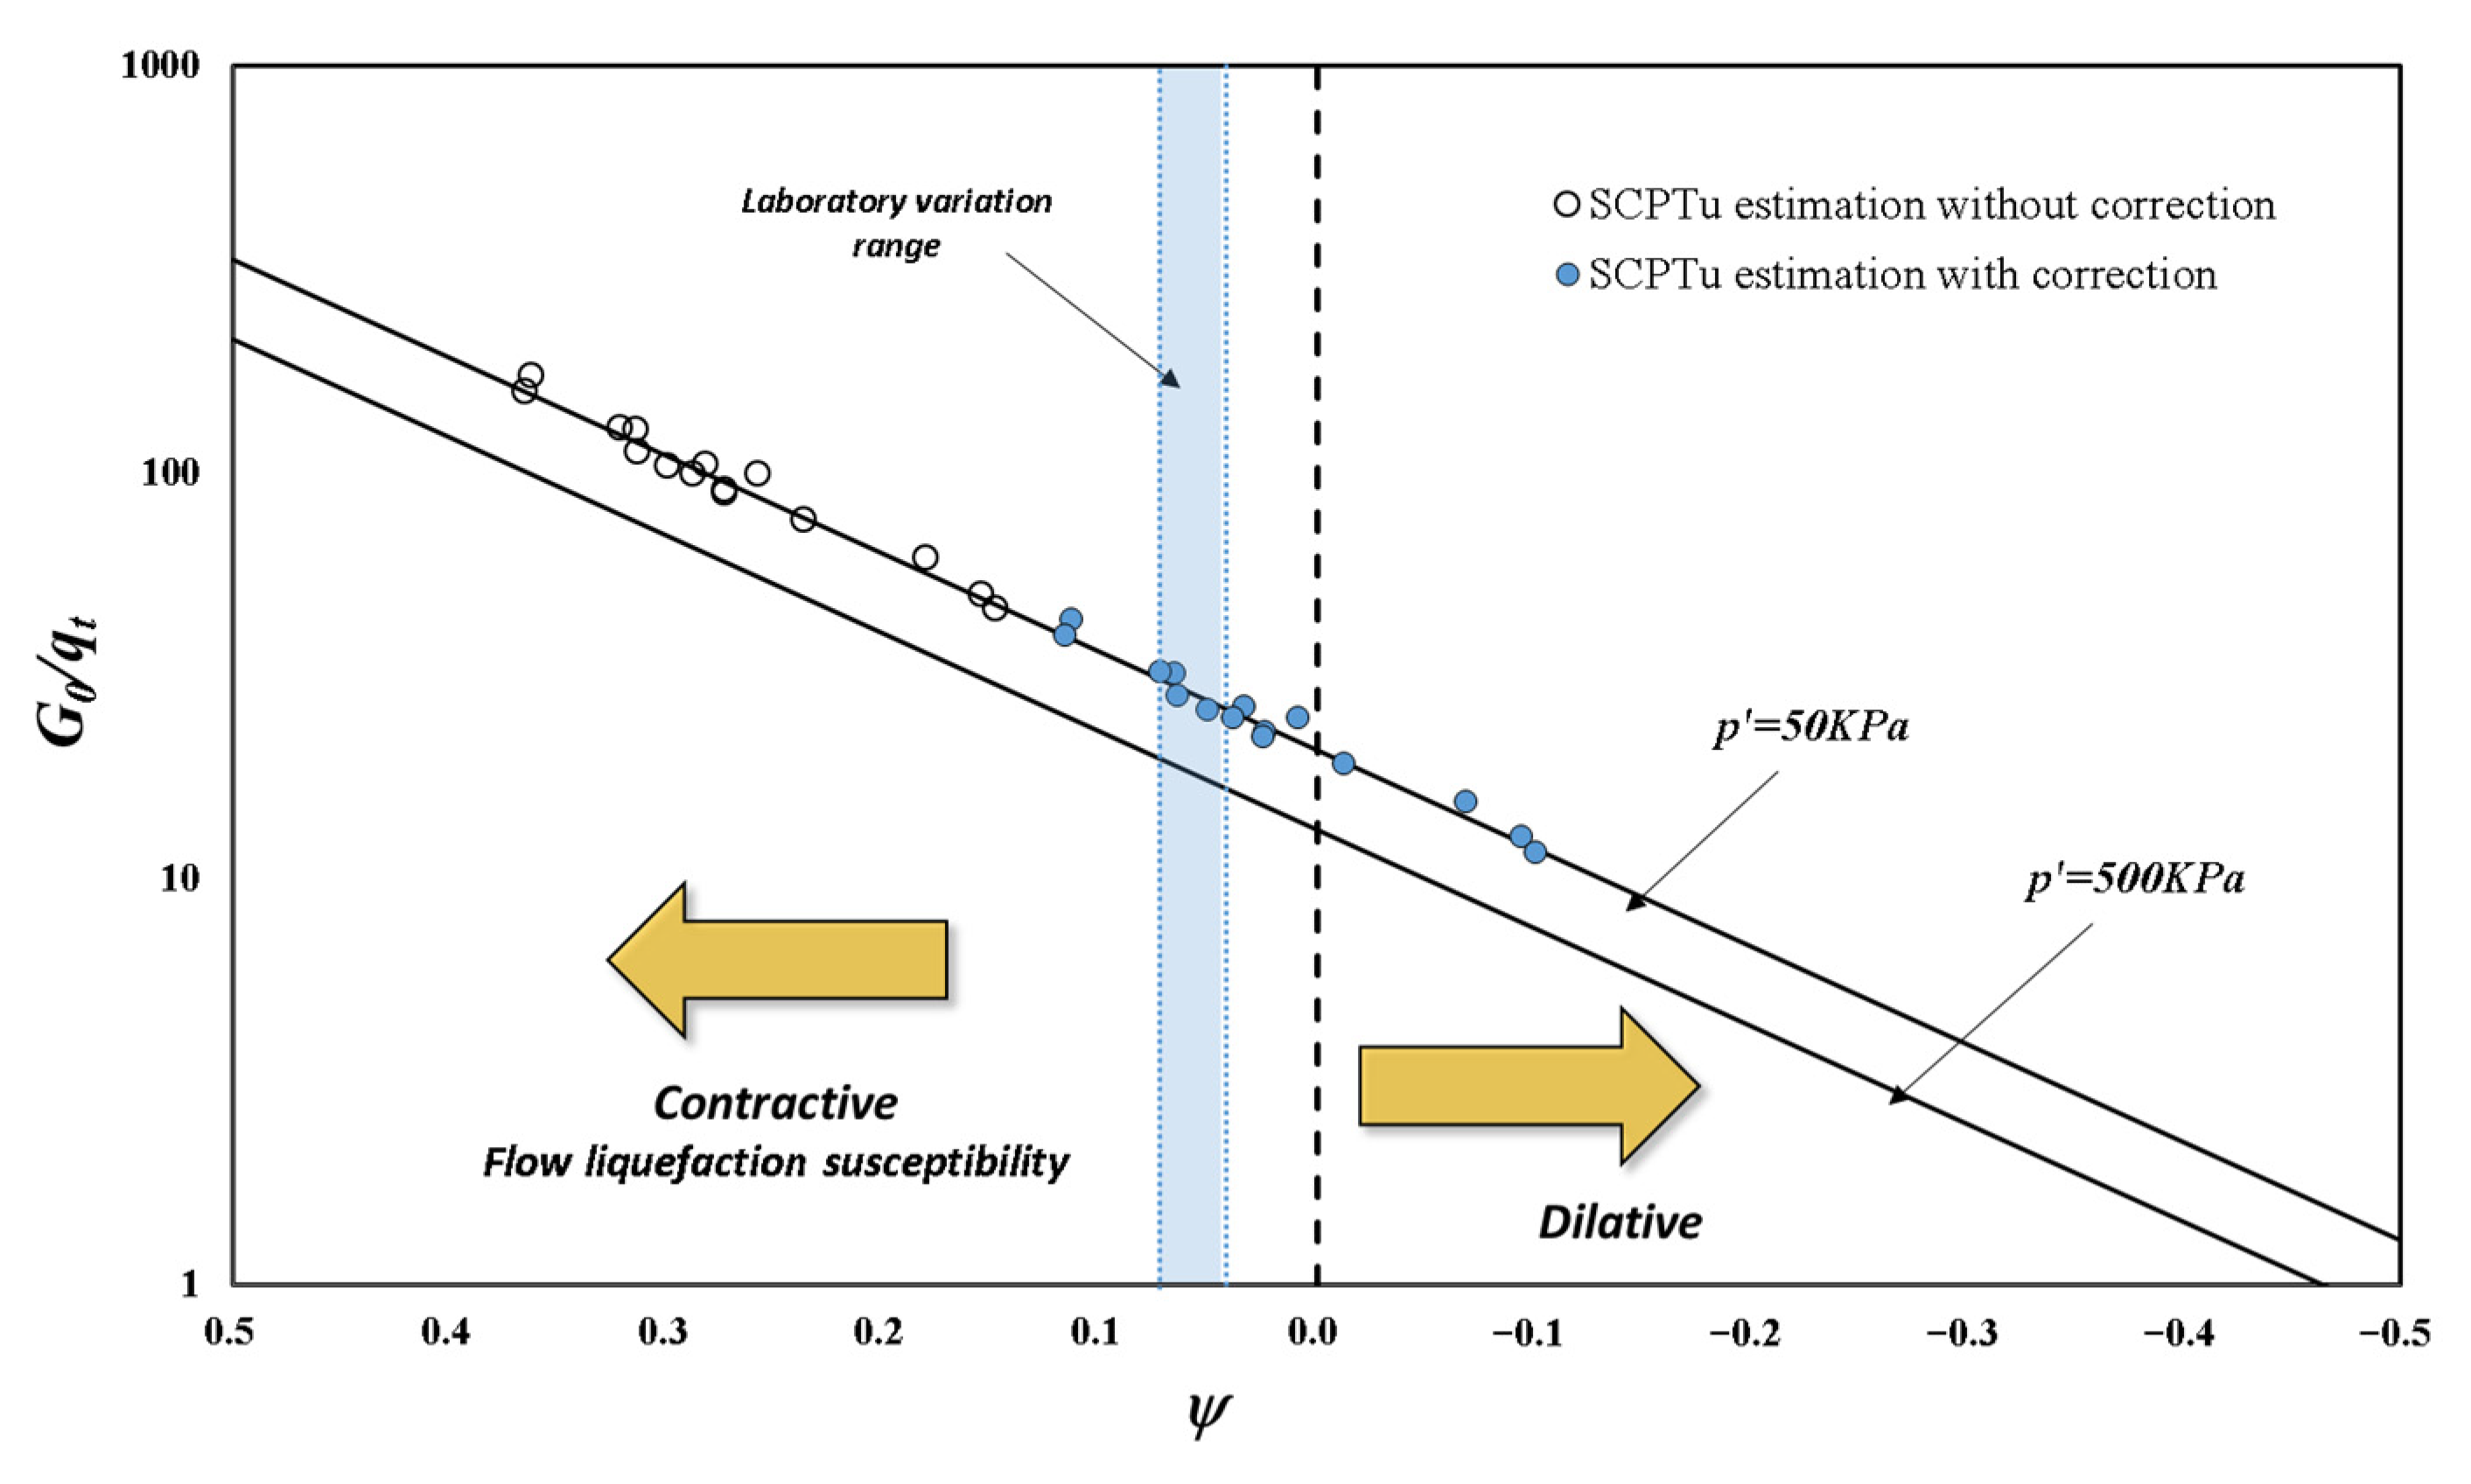
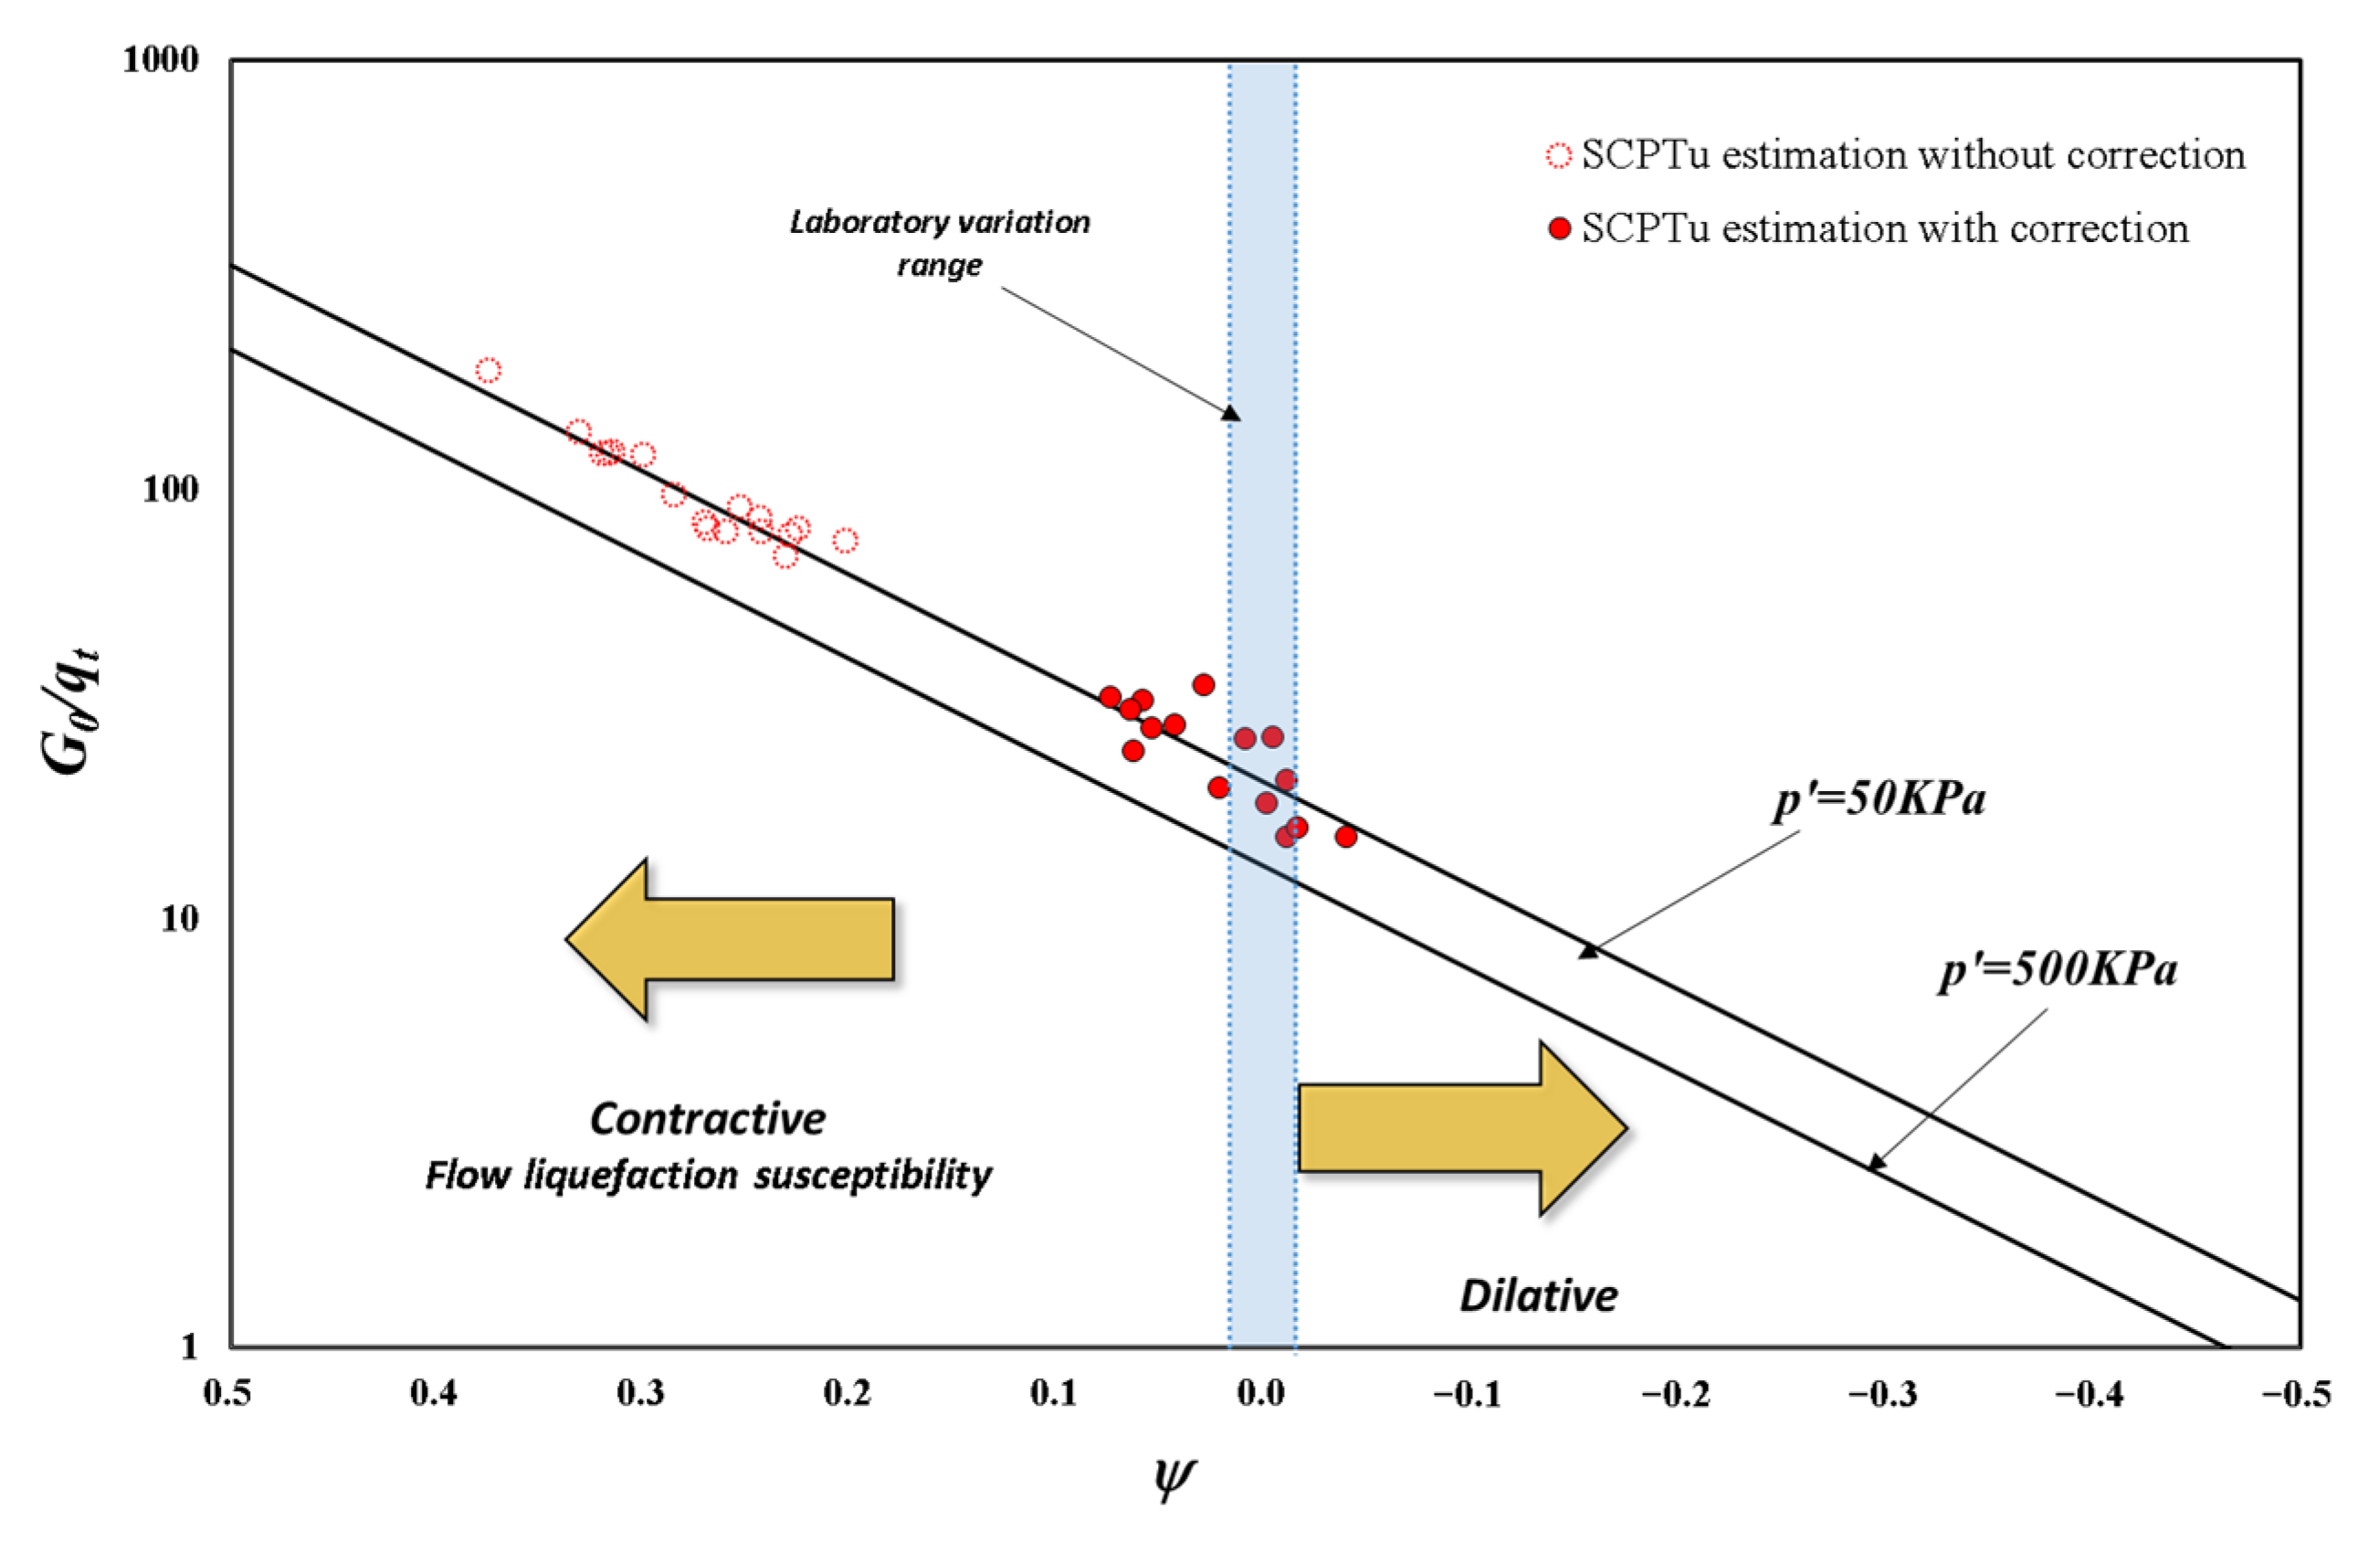
3.3. State Parameter Assessment for Non-Plastic Silty Soils and Flow Liquefaction Evaluation

As proposed by Schnaid et al. [25], a two-stage analysis is applied to assess susceptibility to flow liquefaction, with the first stage being the classification chart. Figure 4 illustrates the expansion of the original two-stage methodology for liquefaction flow assessment. Whenever soils are located in the upper region (non-plastic), the state parameter must be evaluated to determine whether drainage correction is necessary. Whenever the calculated value is positive, the material tends to have contractive behavior, which may present strain-softening behavior and susceptibility to liquefaction flow under specific loading conditions, saturation, and drainage.
As previously discussed, using a theoretical correlation of stiffness and strength, such as the G0/qt ratio, it is possible to estimate the Ψ value for sands. Therefore, for drained conditions, this correlation also can be used to estimate Ψ values for non-plastic silty soils, such as mining tailings. To allow this point of view, the cone tip resistance in Equation (2) must be a drained value and can be named as qtD, and Equation (2) can be rewritten as Equation (5):
Ψ = 0.520 p p a 0.07 + 0.180 G 0 q t D
Under these conditions, it can be stated that Equation (5) can be applied to determine Ψ values in non-plastic silty soils with partial drainage during cone penetration, provided that the qtD was obtained for these materials.
However, determining drained parameters in non-plastic silty soils is not trivial because the cone penetration is affected by partial drainage conditions. Geomaterials have distinct drainage characteristic curves, and variation in penetration velocities is required to obtain drained and undrained cone tip resistances [27]. Moreover, the relation between drained cone tip resistance (qtD) and undrained cone tip resistance (qtUD) is also a function of soil type.
One way to categorize each soil is through the effective friction angle (ϕ′). Senneset et al. [45] proposed a theoretical solution for determining the ϕ′ from CPTu test results after comparison and calibration with laboratory test results performed on a wide range of soils. In this solution, the pore pressure measurements provided by the CPTu allow the estimation of effective resistance parameters based on concepts of bearing capacity and plasticity theories, providing its application to all soils [46]. This solution results from years of study developed at the Norwegian Technology Institute (NTH). It correlates the cone resistance number (Nm = Q), the effective resistance parameters (c′ and ϕ′), the pore pressure parameter (Bq), and the angle of plastification (β), (Equation (6)):
N m = Q = q t σ v 0 σ v 0
where σv0 and σv0 are the total and effective vertical stresses, respectively.
The plastification angle (β) is associated with an idealized geometry from the failure zone around the cone. It is not easy to define the β value experimentally or theoretically. However, it is known that it depends on soil properties such as compressibility, aging, plasticity, and sensitivity [46]. Based on NTH theory, a simplified evaluation is presented in Figure 5, where the friction angle variation was provided as a function of Q and Bq, with c′ = 0 and β = 0.
Considering that total and effective stresses on Equation (6) are constant at a given depth, it can be stated that Q is directly proportional to qt. Therefore, Figure 5 allows us to estimate the drained (qtD) and undrained (qtUD) cone tip resistance for a specific friction angle value, which can be correlated to soil type. Drained conditions are associated with Bq = 0, and undrained conditions are characterized by Bq in the 0.6 to 1 interval [34,35].
The interpretation of Figure 5 directly correlates the drained and undrained cone tip resistance ratio (qtD/qtUD) and effective friction angle (ϕ′). This correlation is shown in Figure 6, where the variation range of qtD/qtUD has been established by two curves obtained from Senesset et al. [45]. In addition, results from the literature plotted in Figure 6 demonstrate that the method can reasonably describe experimental measurements. Figure 6 demonstrates that the qtD/qtUD ratio varies from 3 (for effective friction angles around 20°) to about 10 (for effective friction angles around 38° and 40°).
Two boundary conditions can be set to correlate the drained cone tip resistance (qtD) and standard cone tip resistance (qt20), (Equation (7)):
q t D q t 20 = 1 ,   i f   B q = 0 q t D q t U D ,   i f   B q = 1
Knowing the boundary conditions, an empirical equation was proposed to describe the variation of the qtD/qt20 ratio for partial drainage conditions. The proposed empirical equation is dependent on the qtD/qtUD ratio (provided by Figure 6) and Bq (Equation (8)):
q t D q t 20 = 1 + 1 + q t D q t U D · B q α
where qtD/qtUD assumes a fixed value, depending on the estimated soil friction angle (Figure 6), and α is a parameter dependent on the material stiffness, ranging from 0 to 1. An initial simplified evaluation adopts an average value of α = 0.5, although this parameter depends on soil type and should be calibrated. It should also be noted that the proposed empirical proposal (Equation (8)) was developed considering extreme values of Bq, which could be calibrated in future work according to the behavior of each material. In general, the equation proposed in this study can be used to obtain qtD values in different types of non-plastic silty soils, in which cone tests at standard speed provide results under partial drainage conditions, which makes their adequate interpretation difficult.
Figure 7 is a graphical representation of the different values of qtD/qtUD ratios calculated from Equation (8). Once qtD values are estimated from the proposed correction, Equation (2) can be used to determine the Ψ values for non-plastic silty soils, which allows the flow liquefaction susceptibility evaluation.
Figure 8 presents a result of a cone test carried out in a gold mining tailings deposit. Results for standard speed (20 mm/s) and variable speed are plotted. This variable speed was due to equipment limitations, meaning that obtaining a constant speed throughout the depth was impossible. However, it is observed that even at very low speeds (1 mm/s), it was not possible to obtain parameters in drained conditions, resulting in the generation of excess pore pressures. At some specific depths, such as 5.1 and 6.1 m, where the pore pressures coincide with the hydrostatic pressure, it is observed that the qtD values obtained through empirical equations coincide or are very close to the qt values measured in the test. Therefore, we can conclude that the empirical equation provides a quick and simplified solution to obtain an estimation of qtD from which constitutive parameters can be assessed.
The value of Ψ obtained from qtD can be utilized in the two-stage classification soil system based on seismic cone penetration measurements, presented previously in Figure 4.

3.4. Validation and Calibration

The development of the expanded classification system proposed in this study was based on plotting several databases of different materials and evaluating the behavior of the combination of the parameters. Since this research focuses on studying non-plastic silt materials, it was decided to present the data distribution referring to different mining tailings. Results from seismic cone tests carried out in Brazilian mining tailings deposits (gold, bauxite, zinc, iron, and copper) were selected to validate and calibrate the classification chart applied to non-plastic silty soils. Such materials are silty to clayey grain size and have low or no plasticity, for the most part (except zinc tailing). Table 1 summarizes the variation of the main physical characteristics of the evaluated mining tailings.
Regarding in situ tests, four vertical SCPTu tests were evaluated for gold mining tailings, carried out in the same deposit with an average depth of 10 m for each vertical and 157 Vs records in the four verticals. Data from the SCPTu tests carried out in three different deposits were evaluated for bauxite mining tailings. For the bauxite mining tailings deposit “A”, seven verticals of seismic cone tests were evaluated, with an average depth of 14 m and a total of 41 Vs. records in all verticals. Five vertical seismic cone tests were evaluated for the “B” bauxite mining tailings deposit, with an average depth of 8 m and a total of 23 Vs records. For the bauxite mining tailings deposit “C”, 14 SCPTu test verticals were evaluated with an average depth of 12 m and a total of 57 Vs records for all verticals. For zinc mining tailings, three vertical seismic cone tests were evaluated and carried out in the same deposit, with an average depth of 12 m for each vertical and a total of 21 Vs records. Five vertical seismic tests were evaluated for iron mining tailings, carried out in the same deposit, with an average depth of 22 m each and a total of 131 Vs records. Lastly, three SCPTu test verticals were evaluated for copper mining tailings, with an average depth of 30 m for each vertical and a total of 87 Vs records.
The test results in Figure 9 mainly cover regions characterized by silty-sandy, silty, or sandy-silty materials, following the physical characteristics of the tailings studied. It is interesting to note that some points relating to bauxite and zinc tailings, which have a certain plasticity, were positioned below line A, which indicates materials with plasticity. Furthermore, most of the tailings are located in a partially drained to undrained region, and some materials are in the classification zone of highly sensitive materials, as is the case with most data relating to gold mining tailings. In this sense, it is verified that there is a good coherence between the characteristics of the material and those delivered by the system.
The second stage is the flow liquefaction susceptibility analysis, evaluating the occurrence of contractive behavior under loading. In this step, all materials above the central guideline should undergo a subsequent assessment of the state parameter value.
Calibration of the proposed correction for standard cone tip resistance (qt20) into an equivalent drained one (qtD) is provided by results in gold, iron, and bauxite mining tailings (no or low plastic silts). This database was selected for evaluation of this stage, as drained and undrained triaxial tests, using bender elements, were available for these materials, which allowed comparison between the Ψ values estimated from the SCPTu tests and those measured in the laboratory.
Figure 10 demonstrates the Ψ estimation from SCPTu tests compared to the laboratory range for iron mining tailings. The results from the mining iron tailings were reported by Morgenstern et al. [11] and offer a good reference for predictions. In this case, the CPTu data yielded Bq values close to zero, and the proposed correction is marginal. The Ψ values calculated from the SCPTu are spread across a wide range, from −0.15 to about 0.2, whereas laboratory tests fall into a much narrower range (from +0.05 to +0.08) (Figure 10). This may indicate that the methods proposed originally by Schnaid and Yu [20] need to be more accurate or that field data is scattered due to the actual spatial variation of tailings. However, it is interesting to observe that laboratory and field data indicate that these tailings can flow liquefaction for the Fundão Dam.
In the case of gold mining tailings, the SCPTu tests performed at standard penetration velocity generated considerable excess pore pressure, with the Bq values indicating partial drainage. The friction angle of the gold mining tailings measured by the laboratory tests is 32° [43]. The qtD/qtUD ratio was adopted as 7, considering the Senneset et al. [45] approach. This value is also very close to the response obtained when analyzing the poroelastic theory results [27]. A good fit between laboratory and field Ψ values prediction is obtained for α close to unity (Figure 11).
To evaluate the gold mining tailings Ψ values estimated from SCPTu tests, Figure 11 compares the estimation of Ψ values using qt20 values to the qtD values obtained by the proposed correction. The estimated Ψ values from qt20 were verified. However, it was shown that the material presents contractive behavior and susceptibility to the flow liquefaction, generating high Ψ values compared to the range defined by laboratory test results. However, applying the tip resistance correction for drained conditions, the estimated Ψ values are very close to the range defined by the laboratory test results.
The bauxite mining tailings SCPTu test results also indicate excess pore pressure generation, which provides typical Bq values for a partial drainage condition. In this case, the correction of qt20 was already necessary for Ψ estimation. To apply the empirical equation to correct the qt20 value for drained conditions, a qtD/qtUD ratio was adopted equal to 7. This value is defined in Figure 6 for a friction angle of 32.4°, which was obtained by triaxial tests. In this analysis, a good fit between laboratory and field Ψ values prediction is obtained for α close to 0.5 (Figure 12).
According to the Ψ values evaluation, all the mining tailings evaluated in this paper may present contractive behavior during shearing and may be susceptible to flow liquefaction occurrences. However, the bauxite mining tailing evaluated in this paper presented values closer to zero than gold and iron tailings, which presented higher positive values obtained through field and laboratory test results.

4. Conclusions

This paper proposes expanding a previous two-stage soil classification and state parameter evaluation system based on data from the SCPTu test. The proposed methodology aims to expand the method developed for application to sands and non-plastic silty soils. First, a classification chart was proposed to identify different classes of fine soils with different drainage conditions and sensitive structures. An extensive database of SCPTu tests on mining tailings was used for validation and confidentiality of the classification chart, demonstrating good behavioral responses through the proposed methodology.
In the second stage, an empirical equation was proposed to correct cone tip resistances obtained from CPTU tests performed at the standard penetration rate of 20 mm/s on transient soils. The classification chart, in conjunction with estimating state parameters from corrected cone tip resistance, allows the evaluation of the susceptibility to flow liquefaction of non-silty soils. In situ and laboratory tests performed on mining tailings provided a database for calibrating and validating the proposed methodology and values of y derived from field SCPTU tests, which generally agree with laboratory measurements.
Notably, the proposal presented aims to compose a practical tool for evaluating susceptibility to liquefaction flow in non-plastic silty soils. The empirical equation proposed to correct the cone tip resistance is an initial proposition and requires more accurate calibration for extensive application in other databases.

Author Contributions

Conceptualization: H.P.N., F.S. and E.O.; methodology: H.P.N.; validation, H.P.N.; formal analysis: H.P.N., F.S. and E.O.; investigation: H.P.N. and E.O.; resources: F.S. and E.O.; data curation: H.P.N.; writing—original draft preparation: H.P.N.; writing— review and editing: H.P.N., F.S. and E.O.; visualization: H.P.N.; supervision: F.S.; funding acquisition: F.S. All authors have read and agreed to the published version of the manuscript.

Funding

This study was financed in part by the Coordenação de Aperfeiçoamento de Pessoal de Nível Superior–Brasil (CAPES)–Finance Code 001 and National Council for Scientific and Technological Development (CNPq).

Data Availability Statement

The data presented in this study are available on request from the corresponding author. The data are not publicly available due to the privacy of the patients who assisted in the research.

Acknowledgments

The authors would like to thank the PROAP Program for financial support for providing the textual and grammatical review of the text.

Conflicts of Interest

The authors declare no conflicts of interest.

References

  1. Nierwinski, H.P.; Schnaid, F.; Odebrecht, E. In-situ state parameter assessment of non-plastic silty soils using the seismic cone. In Proceedings of the 6th International Conference on Geotechnical and Geophysical Site Characterization, Online, 26–29 September 2021. [Google Scholar]
  2. Robertson, P.K.; Fear, C.E. Liquefaction of sands and its evaluation. In Proceedings of the IS-Tokyo ’95: The First International Conference on Earthquake Geotechnical Engineering, Tokyo, Japan, 14–16 November 1995; Ishihara, K., Ed.; Balkema: Rotterdam, The Netherlands, 1995; pp. 1253–1289. [Google Scholar]
  3. Seed, H.B. Soil liquefaction and cyclic mobility evaluation for level ground during earthquakes. J. Geotech. Eng. Div. ASCE 1979, 105, 201–255. [Google Scholar] [CrossRef]
  4. Castro, G. Liquefaction and cyclic mobility of saturated sands. J. Geotech. Eng. Div. ASCE 1975, 101, 551–569. [Google Scholar] [CrossRef]
  5. Finn, W.D.L. Liquefaction potential: Developments since 1976. In Proceedings of the 1st International Conference on Recent Advances in Geotechnical Earthquake Engineering and Soil Dynamics, St. Louis, MO, USA, 28 April 1981; Prakash, S., Ed.; University of Missouri-Rolla: Rolla, MO, USA, May 1981; Volume 2, pp. 655–681. [Google Scholar]
  6. Ishihara, K. Liquefaction and flow failure during earthquakes. Géotechnique 1993, 43, 351–415. [Google Scholar] [CrossRef]
  7. Seed, H.B.; Idriss, I.M. Simplified procedure for evaluating soil liquefaction potential. J. Geotech. Eng. ASCE 1971, 97, 1249–1273. [Google Scholar] [CrossRef]
  8. Robertson, P.K.; Wride, C.E. Evaluating cyclic liquefaction potential using the CPT. Can. Geotech. J. 1998, 35, 442–459. [Google Scholar] [CrossRef]
  9. Davies, M.P.; McRoberts, E.C.; Martin, T.E. Static Liquefaction of Tailings–Fundamentals and Case Histories. In Proceedings Tailings Dams ASDSO/USCOLD; Association of State Dam Safett Official: Las Vegas, NV, USA, 2002. [Google Scholar]
  10. Jefferies, M.G.; Been, K. Soil Liquefaction: A Critical State Approach; CRC Press, Taylor & Francis: Boca Raton, FL, USA, 2016; 690p, ISBN 978-1-4822-1368-3. [Google Scholar]
  11. Morgenstern, N.R.; Vick, S.G.; Viotti, C.B.; Watts, B.D. Fundão Tailings Dam Review Panel. Report on the Immediate Causes of the Failure of the Fundão Dam. August 2016. Available online: https://www.resolutionmineeis.us/documents/fundao-2016 (accessed on 15 April 2022).
  12. Robertson, P.K. Evaluation of flow liquefaction and liquefied strength using the Cone Penetration Test. J. Geotech. Geoenviron. Eng. 2010, 136, 842–853. [Google Scholar] [CrossRef]
  13. Yang, J.; Liang, L.B.; Chen, Y. Instability and liquefaction flow slide of granular soils: The role of initial shear stress. Acta Geotech. 2022, 17, 65–79. [Google Scholar] [CrossRef]
  14. Zhu, Z.; Cheng, W. Parameter Evaluation of Exponential-Form Critical State Line of a State-Dependent Sand Constitutive Model. Appl. Sci. 2020, 10, 328. [Google Scholar] [CrossRef]
  15. Been, K.; Jefferies, M.G. A state parameter for sands. Géotechnique 1985, 35, 99–112. [Google Scholar] [CrossRef]
  16. Shuttle, D.A.; Cunning, J. Liquefaction potential of silts from CPTu. Can. Geotech. J. 2007, 44, 1–19. [Google Scholar] [CrossRef]
  17. Ledesma, O.; Manzanal, D.; Sfriso, A. Formulation and numerical implementation of a state parameter-based generalized plasticity model for mine tailings. Comput. Geotech. 2021, 135, 104158. [Google Scholar] [CrossRef]
  18. Robertson, P.K. Estimating in situ state parameter and friction angle in sandy soils from CPT. In Proceedings of the 2nd International Symposium on Cone Penetration Testing, Huntington Beach, CA, USA, 9–11 May 2010. [Google Scholar]
  19. Been, K.; Crooks, J.H.A.; Becker, D.E.; Jefferies, M.G. The cone penetration test in sands: Part I, State parameter interpretation. Géotechnique 1986, 36, 239–249. [Google Scholar] [CrossRef]
  20. Schnaid, F.; Yu, H.S. Interpretation of the seismic cone test in granular soils. Géotechnique 2007, 57, 265–272. [Google Scholar] [CrossRef]
  21. Yu, H.; Schnaid, F.; Collins, I. Analysis of Cone Pressuremeter Tests in Sands. J. Geotech. Eng. 1996, 122, 623–632. [Google Scholar] [CrossRef]
  22. Schnaid, F. Geocharacterisation and properties of natural soils by in situ tests. In Proceedings of the International Conference on Soil Mechanics and Geotechnical Engineering; AA Balkema Publishers: Rotterdam, The Netherlands, 2005; Volume 16, p. 3. [Google Scholar]
  23. Schneider, J.A.; Moss, R.E.S. Linking cyclic stress and cyclic strain based methods for assessment of cyclic liquefaction triggering in sands. Géotechnique Lett. 2011, 1, 31–36. [Google Scholar] [CrossRef]
  24. Robertson, P.K. Cone Penetration Test (CPT)-Based Soil Behaviour Type (SBT) Classification System–An Update. Can. Geotech. J. 2016, 53, 1910–1927. [Google Scholar] [CrossRef]
  25. Schnaid, F.; Nierwinski, H.P.; Odebrecht, E. Classification and state parameter assessment of granular soils using the seismic cone. J. Geotech. Geoenviron. Eng. ASCE 2020, 146, 06020009. [Google Scholar] [CrossRef]
  26. Holmsgaard, R.; Nielsen, B.N.; Ibsen, L.B. Interpretation of Cone Penetration Testing in Silty Soils Conducted under Partially Drained Conditions. J. Geotech. Geoenviron. Eng. 2015, 14, 204015064. [Google Scholar] [CrossRef]
  27. Dienstmann, G.; Schnaid, F.; Maghous, S.; Dejong, J. Piezocone Penetration Rate Effects in Transient Gold Tailings. J. Geotech. Geoenviron. Eng. 2018, 144, 04017116. [Google Scholar] [CrossRef]
  28. DeJong, J.T.; Randolph, M.F. Influence of partial consolidation during cone penetration on estimated soil behavior type and pore pressure dissipation measurements. J. Geotech. Geoenviron. Eng. 2012, 138, 777–788. [Google Scholar] [CrossRef]
  29. Randolph, M.F.; Hope, S.N. Effect of cone velocity on cone resistance and excess pore pressure. In Proceedings of the IS Osaka–Engineering Practice and Performance of Soft Deposits; Yodogawa Kogisha Co. Ltd.: Osaka, Japan, 2004; pp. 147–152. [Google Scholar]
  30. Chung, S.F.; Randolph, M.F.; Schneider, J.A. Effect of penetration rate on penetrometer resistance in clay. J. Geotech. Geoenviron. Eng. 2006, 132, 1188–1196. [Google Scholar] [CrossRef]
  31. Kim, K.; Prezzi, M.; Salgado, R.; Lee, W. Effect of penetration rate on cone penetration resistance in saturated clayey soils. J. Geotech. Geoenviron. Eng. 2008, 134, 1142–1153. [Google Scholar] [CrossRef]
  32. Paniagua, P.; Carroll, R.; L’Heureux, J.-S.; Nordal, S. Monotonic and Dilatory Excess Pore Water Dissipations in Silt Following CPTU at Variable Penetration Rate. In Proceedings of the 5th Intern. Conf. on Geotechn. and Geophys. Site Characterisation, ISC’5, Queensland, Australia, 5–10 September 2016; pp. 509–514. [Google Scholar]
  33. Suzuki, Y.; Lehane, B.M. Rate dependence of qc in two clayey sands. In Proceedings of the 3rd International Symposium on Cone Penetration Testing, Madison, WI, USA, 13–14 May 2014; Volume 1. [Google Scholar]
  34. Schnaid, F. In Situ Testing in Geomechanics: The Main Tests; Taylor e Francis: London, UK, 2009; 329p. [Google Scholar]
  35. Hight, D.W.; Georgiannou, V.N.; Ford, C.J. Characterization of clayey sand. In Proceedings of the 7th International Conference on Behavior of Offshore Structures, Cambridge, MA, USA, 12–15 July 1994; Volume 1, pp. 321–340. [Google Scholar]
  36. Santos, J.A.; Gomes, R.C.; Lourenço, J.C.; Marquer, F.; Coelho, P.; Azeiteiro, R.; Santos, L.A.; Marques, V.; Viana da Fonsceca, A.; Soares, M.; et al. Coimbra Sand Round Robin Tests to Evaluate Liquefaction Resistance. In Proceedings of the 15th World Conference on Earthquake Engineering 15 WCEE, Lisbon, Portugal, 24–28 September 2012. [Google Scholar]
  37. Sharma, R.; Baxter, C.; Jander, M. Relationship between shear wave velocity and stresses at failure for weakly cemented sands during drained triaxial compression. Soils Found. 2011, 51, 761–771. [Google Scholar] [CrossRef]
  38. Carraro, J.A.H.; Prezzi, M.; Salgado, R. Shear Strength and Stiffness of Sands Containing Plastic or Nonplastic Fines. J. Geotech. Geoenviron. Eng. 2009, 135, 1167–1178. [Google Scholar] [CrossRef]
  39. Salgado, R.; Bandini, P.; Karim, A. Shear strength and stiffness of silty sand. J. Geotech. Geoenviron. Eng. 2000, 126, 451–462. [Google Scholar] [CrossRef]
  40. Huang, Y.T.; Huang, A.B.; Kuo, Y.C.; Tsai, M.D. A laboratory study on the undrained strength of a silty sand from Central Western Taiwan. Soil Dyn. Earthq. Eng. 2004, 24, 733–743. [Google Scholar] [CrossRef]
  41. Nyunt, T.T.; Leong, E.C.; Rahardjo, H. Strength and Small-Strain Stiffness Characteristics of Unsaturated Sand. Geotech. Test. J. 2011, 34, 551–561. [Google Scholar]
  42. Prashant, A.; Bhattacharya, D.; Gundlapalli, S. Stress-state dependency of small-strain shear modulus in silty sand and sandy silt of Ganga. Géotechnique 2018, 69, 42–56. [Google Scholar] [CrossRef]
  43. Bedin, J. Study of the Geomechanical Behavior of Tailings. Ph.D. Thesis, Federal University of Rio Grande do Sul, Porto Alegre, Brazil, 2010. (In Portuguese). [Google Scholar]
  44. Zhu, Z.; Zhang, F.; Dupla, J.-C.; Canou, J.; Foerster, E. Investigation on the undrained shear strength of loose sand with added materials at various mean diameter ratios. Soil Dyn. Earthq. Eng. 2020, 137, 106276. [Google Scholar] [CrossRef]
  45. Senneset, K.; Sandven, R.; Janbu, N. Evaluation of Soil Parameters from Piezocone Tests; Transportation Research Record 1235; Geotechnical Division, The Norwegian Institute of Technology: Trondheim, Norway, 1989. [Google Scholar]
  46. Sandven, R. Strength and Deformation Properties Obtained from Piezocone Tests. Ph.D. Thesis, Norwegian University of Science and Technology, Trondheim, Norway, 1990; 342p. [Google Scholar]
  47. Lehane, B.M.; O’Loughlin, C.D.; Gaudin, C.; Randolph, M.F. Rate effects on penetrometer resistance in kaolin. Geotechnique 2009, 59, 41–52. [Google Scholar] [CrossRef]
  48. Ouyang, Z.; Mayne, P.W. Effective friction angle of clays and silts from piezocone penetration tests. Can. Geotech. J. 2019, 1, 1230–1247. [Google Scholar] [CrossRef]
Figure 1. The methodology proposed and explained by Schnaid et al. [25] for classifying (a) and evaluating the state parameter value (b) of sands using SCPTu tests.
Mining 04 00003 g001
Figure 2. Drainage effects on the stiffness and strength parameters obtained by triaxial tests conducted on sands and mining tailings. Data: Sands—Drained tests [36,37,38,39]; Sands—Undrained tests [40,41,42]; Gold mining tailings—Drained and Undrained tests [43]; Iron mining tailings—Drained and Undrained tests [11].
Mining 04 00003 g002
Figure 3. An expanded classification system based on CPTu tests data derived from the study by Schnaid et al. [25].
Mining 04 00003 g003
Figure 4. Expanded two-stage flow liquefaction chart evaluation based on CPTu tests data, derived from a study by Schnaid et al. [25].
Mining 04 00003 g004
Figure 5. Theoretical solution for effective friction angle (ϕ′) in terms of Q and Bq for the simplified case of c′ = 0 and β = 0 (adapted from Senneset et al. [44], also presented in Nierwinski et al. [1]).
Mining 04 00003 g005
Figure 6. Variation of qtD/qtUD ratio obtained from Senneset et al. [45] solution, and test results for different materials. Data from: Sennesset et al. [45], Dienstman et al. [27], Lehane et al. [47], Kim et al. [31], Chung et al. [30], Ouyang and Mayne [48], and Morgentern et al. [11]. (figure presented in Nierwinski et al. [1]).
Mining 04 00003 g006
Figure 7. A proposed empirical correlation for cone tip resistance correction for standard tests performed on intermediate drainage materials (α = 0.5) (presented in Nierwinski et al. [1]).
Mining 04 00003 g007
Figure 8. A proposed empirical correlation for cone tip resistance correction for standard tests performed on intermediate drainage materials (α = 0.5) (presented in Nierwinski et al. [1]).
Mining 04 00003 g008
Figure 9. Expanded soil classification system applied to mining tailings.
Mining 04 00003 g009
Figure 10. Estimation of Ψ from SCPTu tests compared to laboratory range for iron mining tailings (presented in Nierwinski et al. [1]).
Mining 04 00003 g010
Figure 11. Estimation of Ψ from SCPTu tests, considering or not the correction of qt values, compared to laboratory range for gold mining tailings (presented in Nierwinski et al. [1]).
Mining 04 00003 g011
Figure 12. Estimation of Ψ from SCPTu tests, considering the correction of qt values, compared to laboratory range for bauxite mining tailings (presented in Nierwinski et al. [1]).
Mining 04 00003 g012
Table 1. Summary of the variation of the geotechnical physical characteristics of the evaluated mining tailings.
Mining TailingD50 (mm)γn (kN/m³)wnat (%)GLiquid Limit (LL)Plastc Index (IP)
Gold0.03218.6–20.531–392.86–3.15-NP
Bauxite A0.002315.9–20.123–892.72–3.2734–531–17.3
Bauxite B0.0315.8–17.855–703.0–3.1531–395–14
Bauxite C0.00317.5–18.840–473.01–3.07383
Zinc0.01511.3–14.990–2103.28–3.3761–10125–54
Iron0.07515.7–19.06–152.92–3.06-NP
Copper0.07514.2–16.550–632.82–2.85-NP
Disclaimer/Publisher’s Note: The statements, opinions and data contained in all publications are solely those of the individual author(s) and contributor(s) and not of MDPI and/or the editor(s). MDPI and/or the editor(s) disclaim responsibility for any injury to people or property resulting from any ideas, methods, instructions or products referred to in the content.

