
Impacts from Topsoil Stockpile Height on Soil Geochemical Properties in Two Mining Operations in British Columbia: Implications for Restoration Practices

Abstract
:1. Introduction
2. Materials and Methods
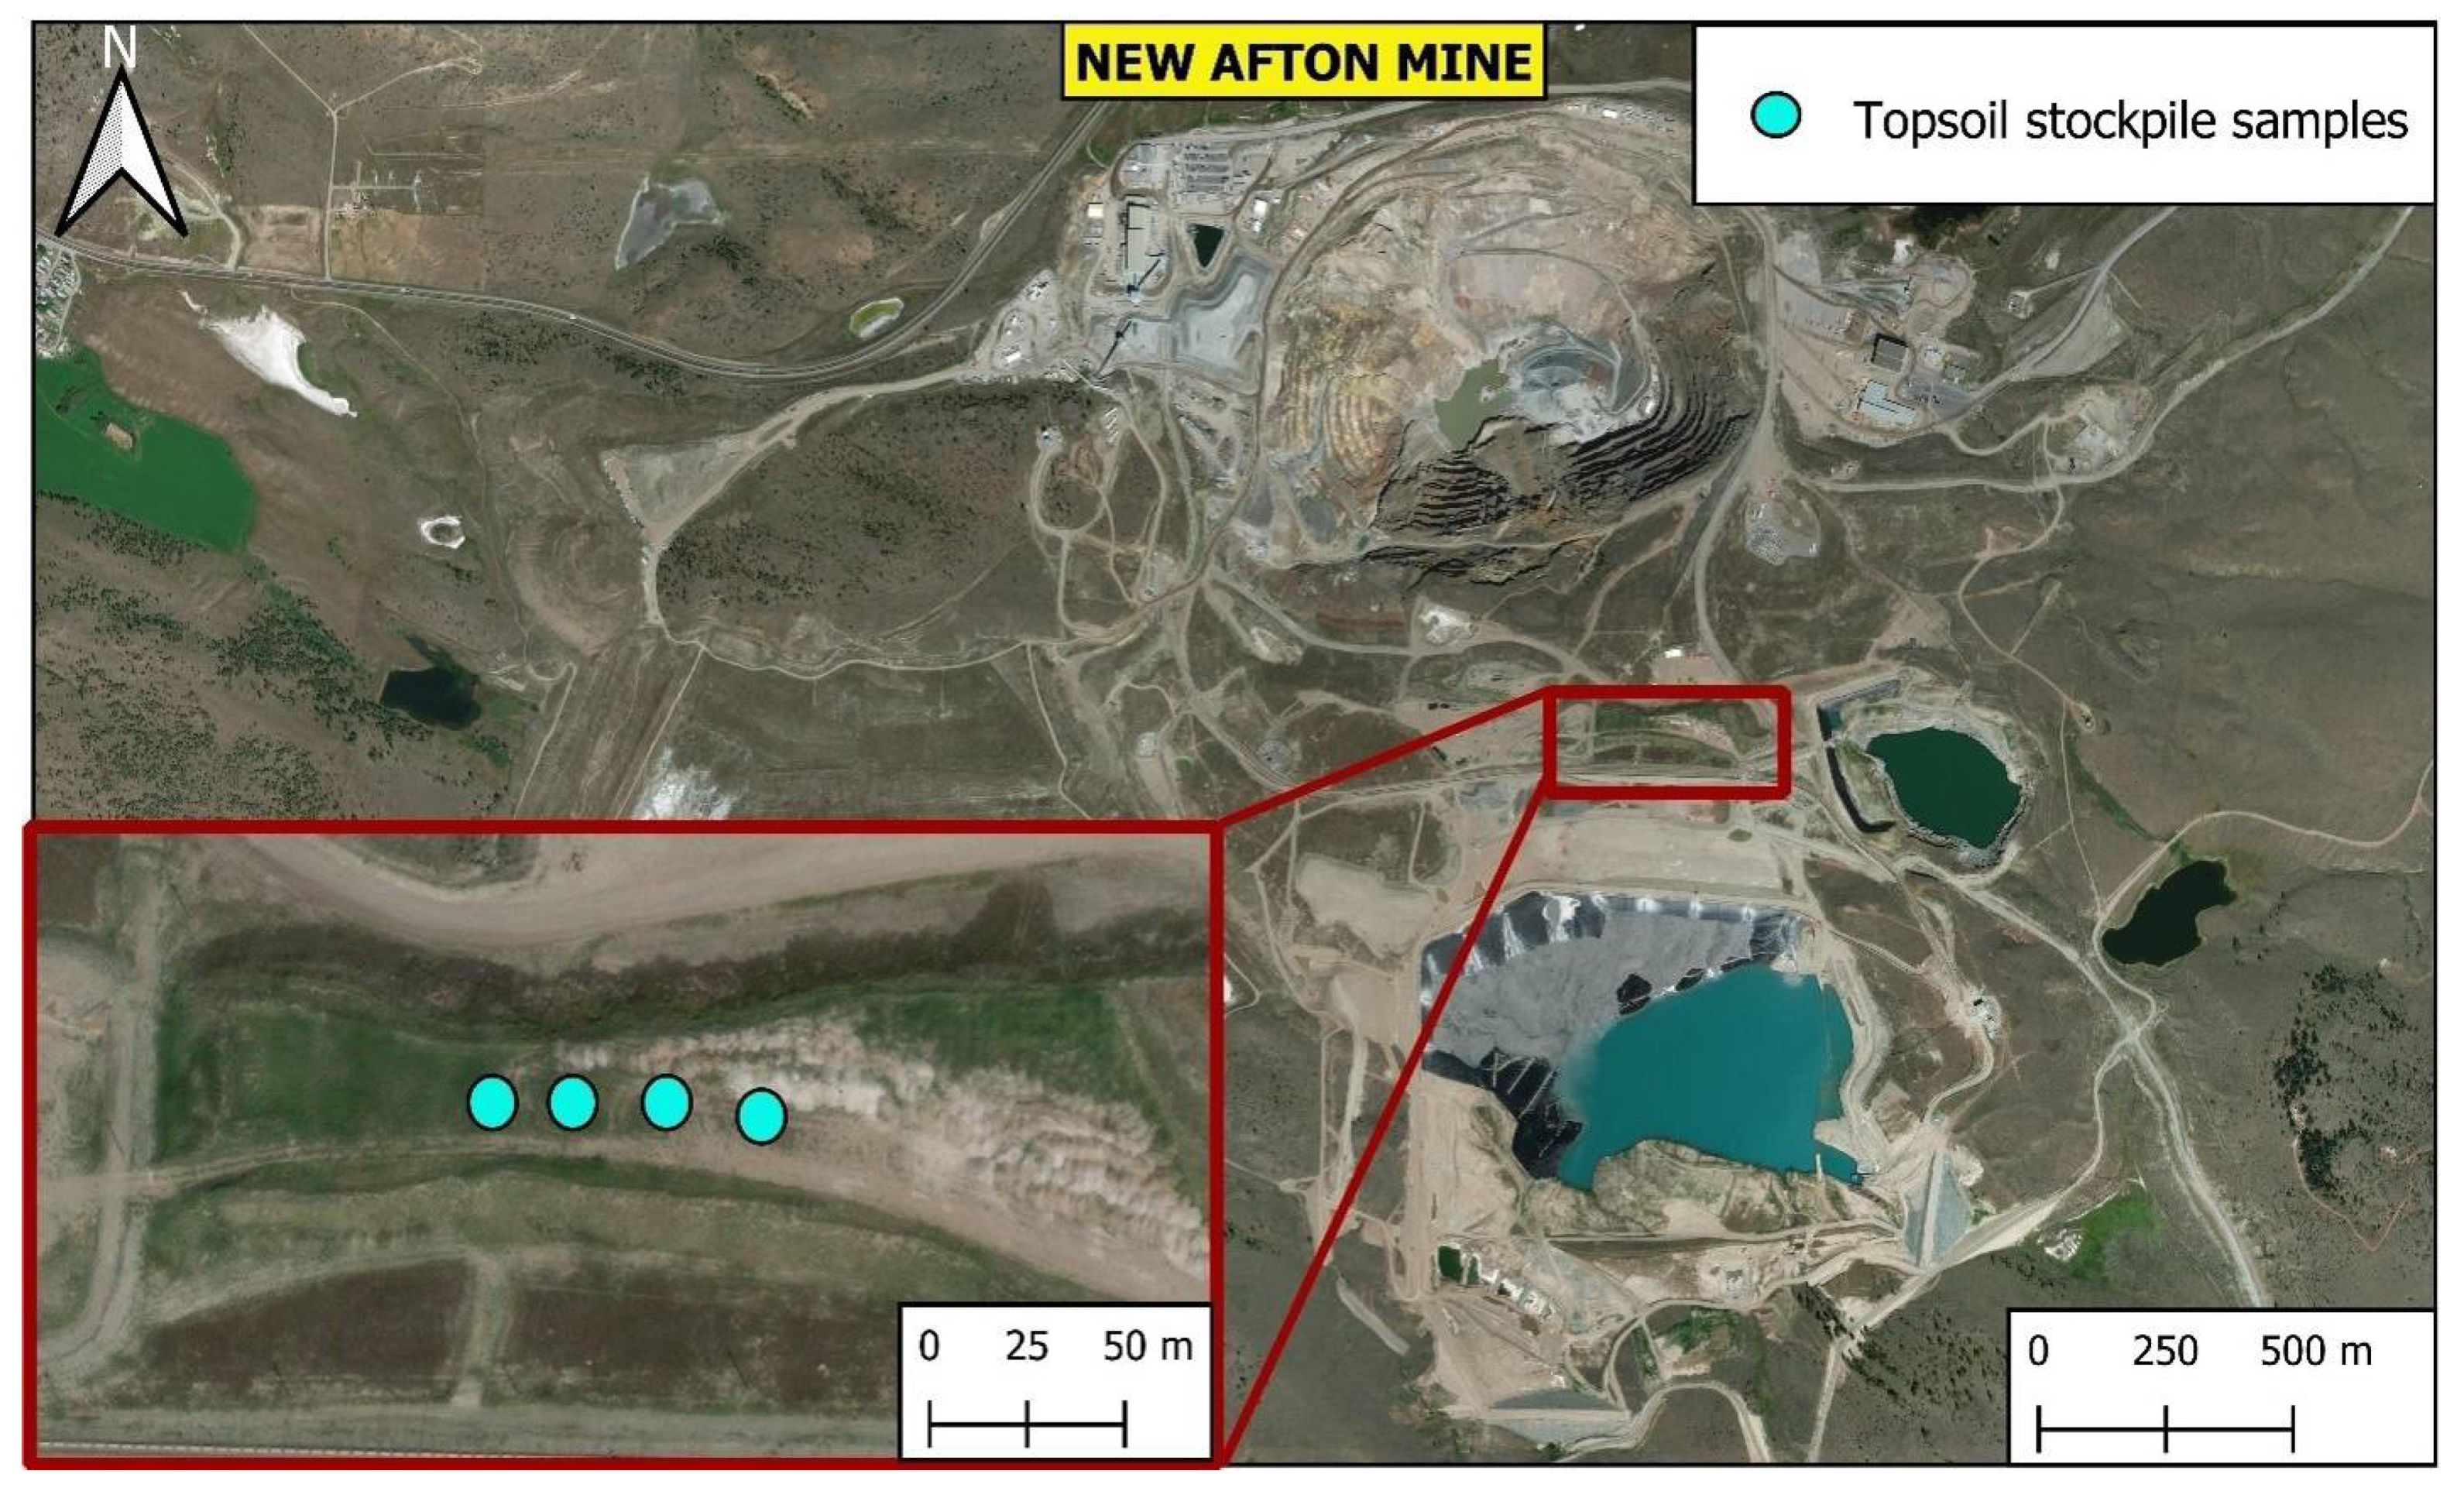
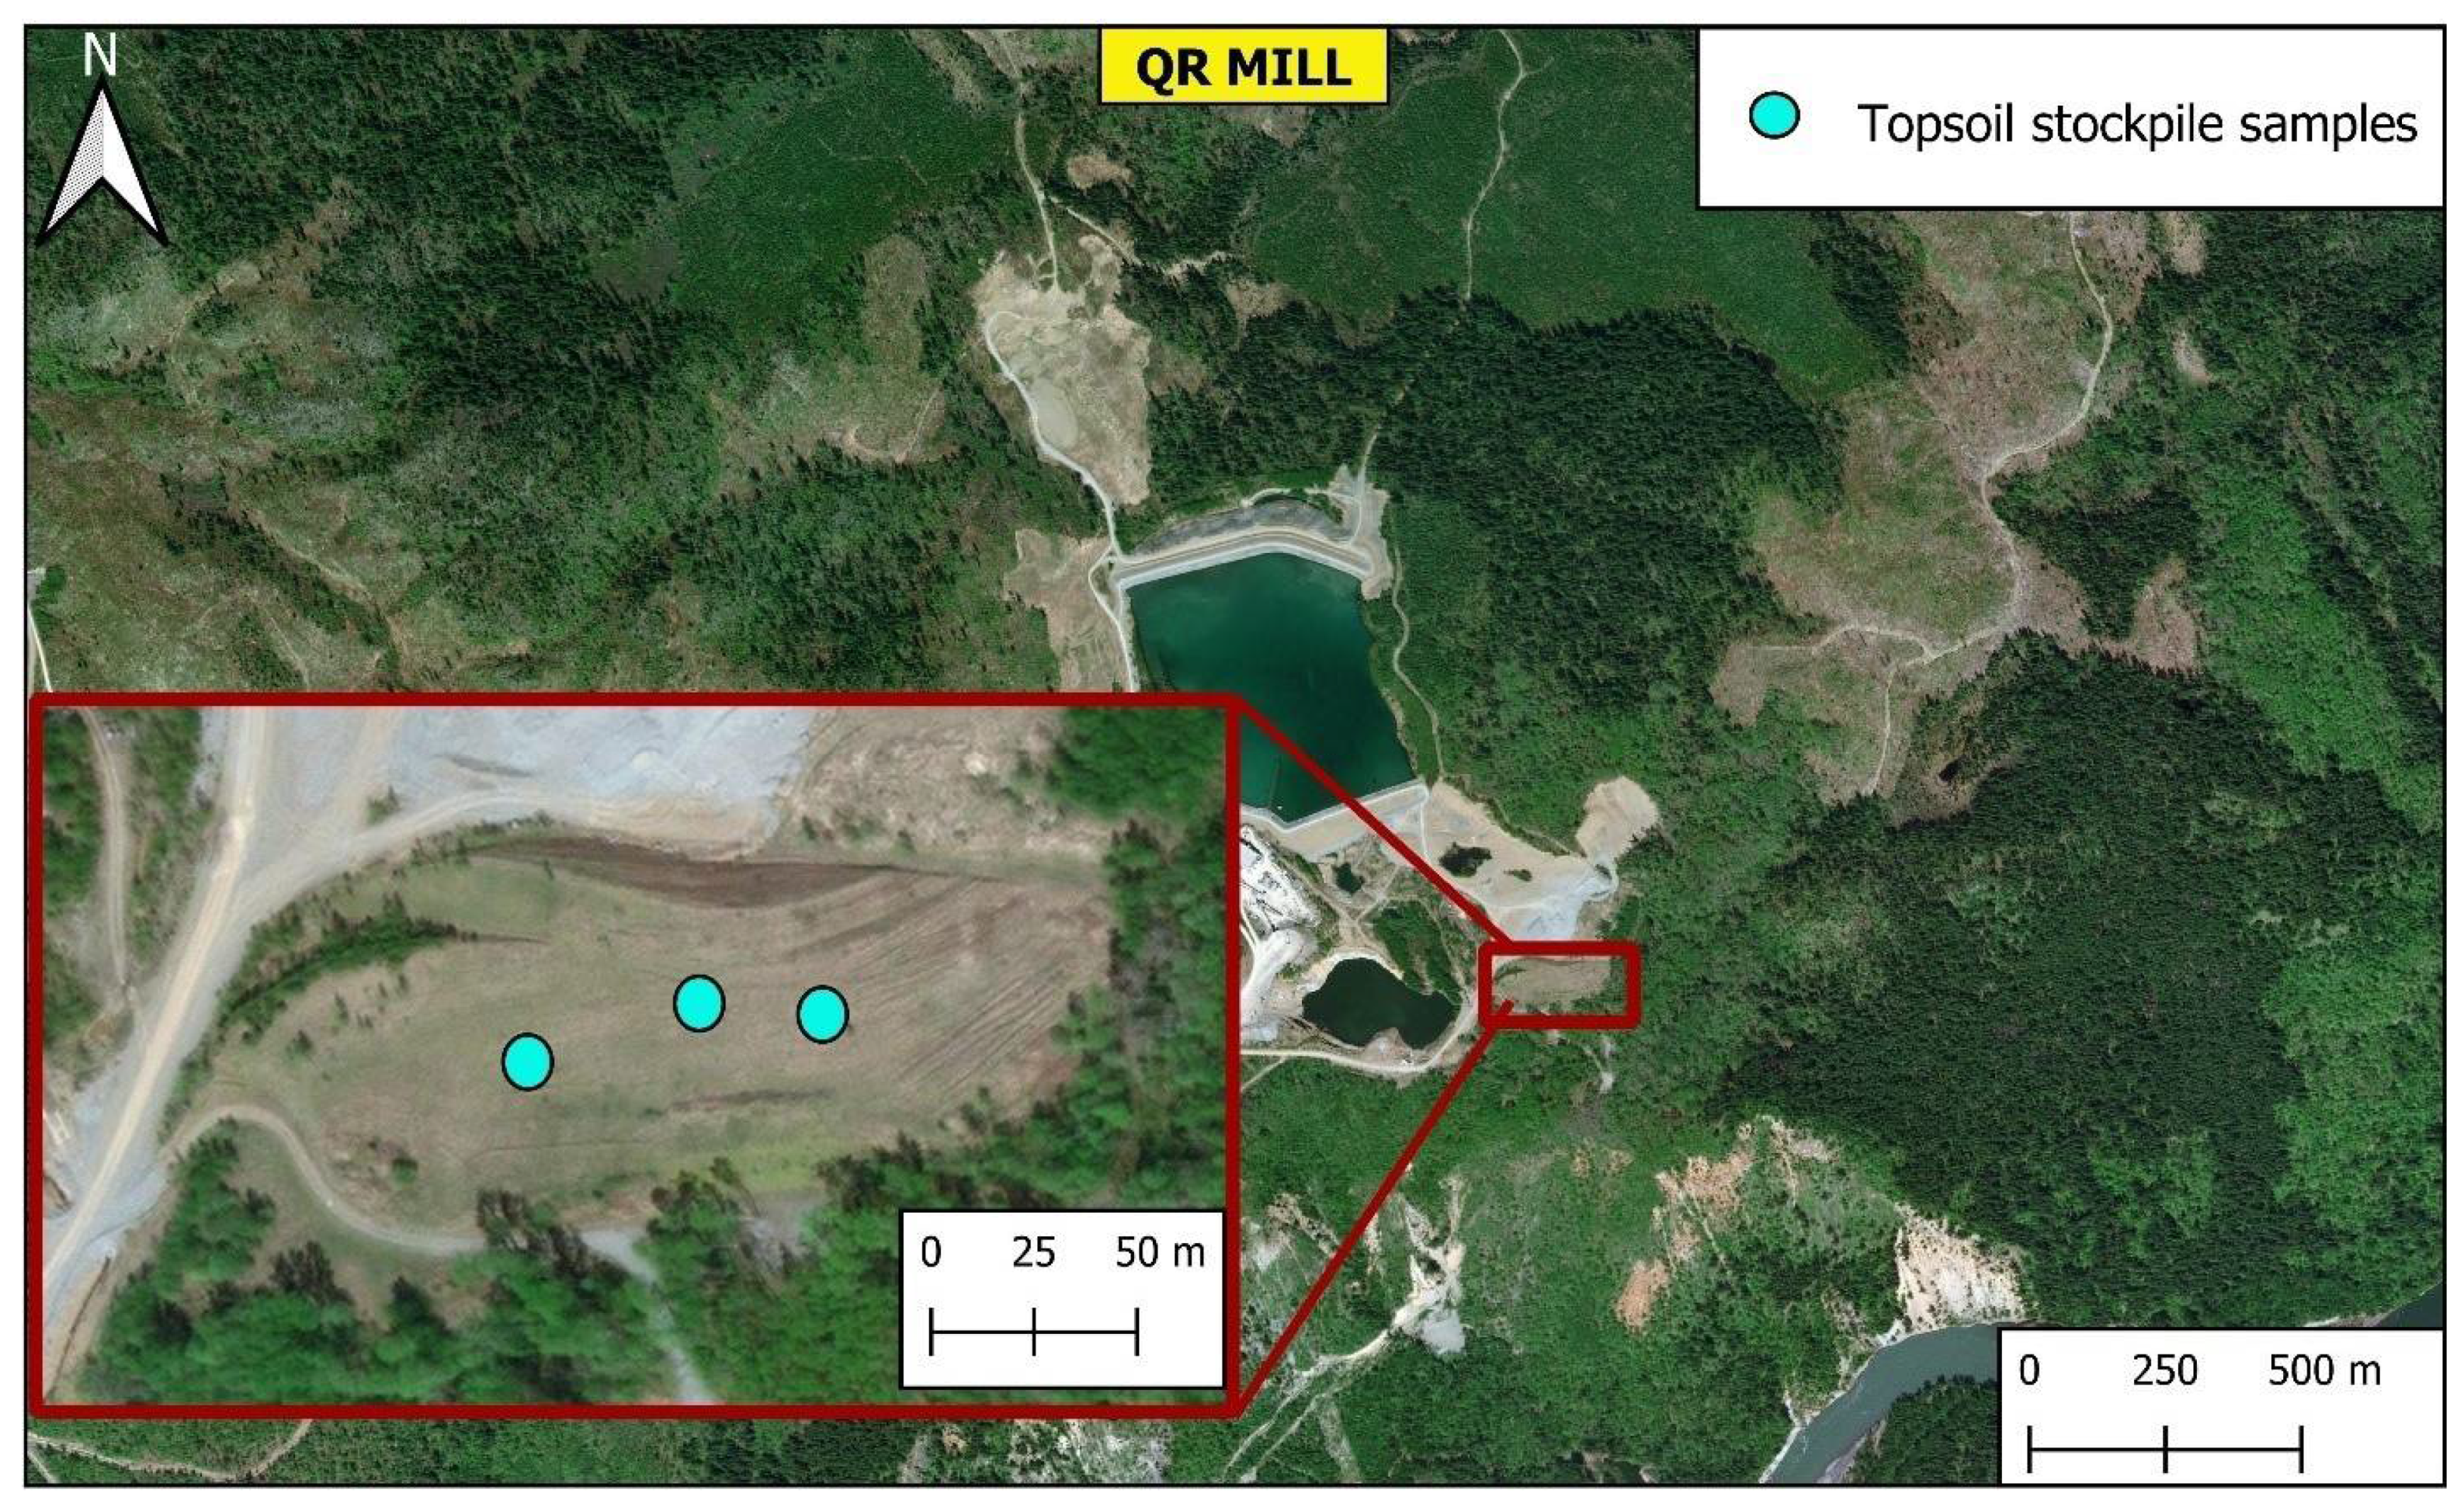
2.1. Soil Sampling
2.2. Soil Tests
2.3. Data Analysis
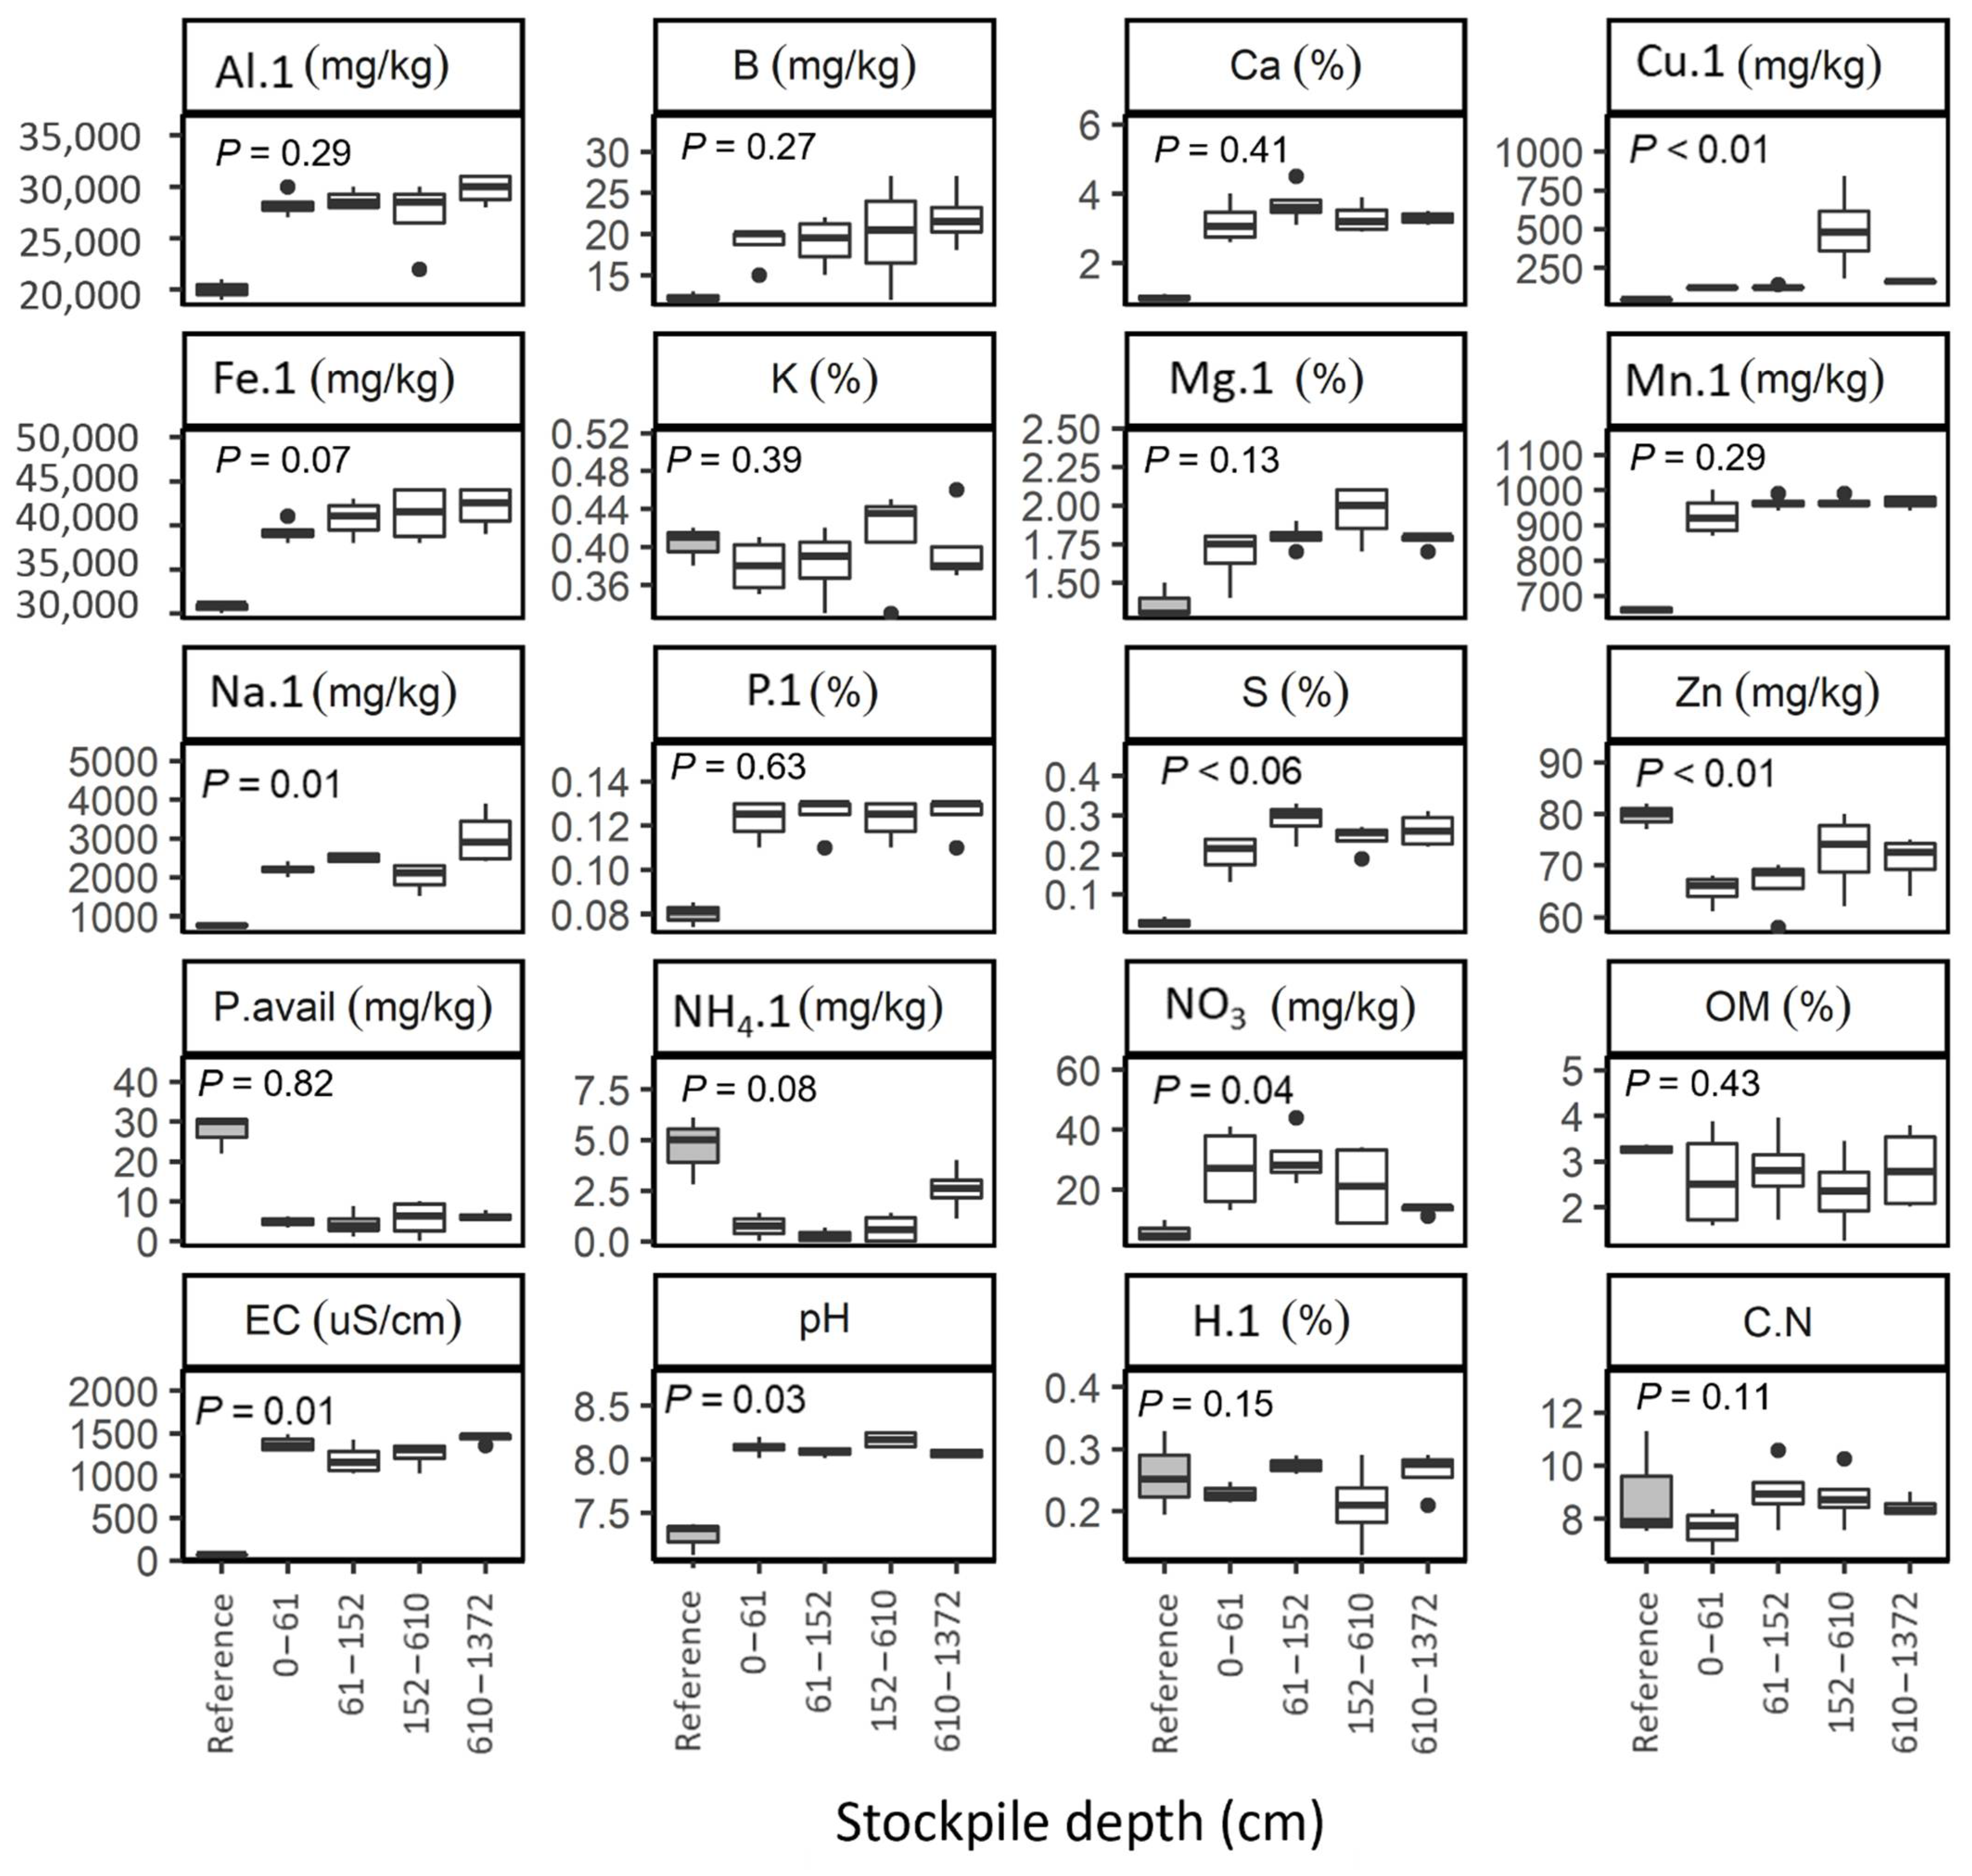
3. Results
3.1. Macronutrients
3.2. Micronutrients
3.3. Salt Content
3.4. PH
3.5. Organic Matter
4. Discussion
4.1. Macronutrients
4.2. Micronutrients
4.3. Salt Content
4.4. PH
4.5. Organic Matter
5. Conclusions
Supplementary Materials
Author Contributions
Funding
Data Availability Statement
Conflicts of Interest
References
- Hall, S.L.; Barton, C.D.; Baskin, C.C. Topsoil Seed Bank of an Oak-Hickory Forest in Eastern Kentucky as a Restoration Tool on Surface Mines. Restor. Ecol. 2010, 18, 834–842. [Google Scholar] [CrossRef]
- Holmes, P.M. Shrubland Restoration Following Woody Alien Invasion and Mining: Effects of Topsoil Depth, Seed Source, and Fertilizer Addition. Restor. Ecol. 2001, 9, 71–84. [Google Scholar] [CrossRef]
- Abdul-Kareem, A.W.; McRae, S.G. The Effects on Topsoil of Long-Term Storage in Stockpiles. Plant Soil 1984, 76, 357–363. [Google Scholar] [CrossRef]
- Ghose, M.K.; Kundu, N.K. Deterioration of Soil Quality Due to Stockpiling in Coal Mining Areas. Int. J. Environ. Stud. 2004, 61, 327–335. [Google Scholar] [CrossRef]
- Golos, P.J.; Dixon, K.W. Waterproofing Topsoil Stockpiles Minimizes Viability Decline in the Soil Seed Bank in an Arid Environment. Restor. Ecol. 2014, 22, 495–501. [Google Scholar] [CrossRef]
- Harris, J.A.; Birch, P. Soil Microbial Activity in Opencast Coal Mine Restorations. Soil Use Manag. 1989, 5, 1006–1009. [Google Scholar] [CrossRef]
- Stahl, P.D.; Perryman, B.L.; Sharmasarkar, S.; Munn, L.C. Topsoil Stockpiling Versus Exposure to Traffic: A Case Study on in situ Uranium Wellfields. Restor. Ecol. 2002, 10, 129–137. [Google Scholar] [CrossRef]
- Thurber Consultants Ltd.; Land Resources Network Ltd.; Norwest Soil Research Ltd. Review of the Effects of Storage on Topsoil Quality; Alberta Land Conservation and Reclamation Council: Athabasca, AB, Canada, 1990; pp. 1–128. [Google Scholar]
- Wick, A.F.; Stahl, P.D.; Ingram, L.J.; Vicklund, L. Soil Aggregation and Organic Carbon in Short-Term Stockpiles. Soil Use Manag. 2009, 25, 2–7. [Google Scholar] [CrossRef]
- Boyer, S.; Wratten, S.; Pizey, M.; Weber, P. Impact of Soil Stockpiling and Mining Rehabilitation on Earthworm Communities. Pedobiologia 2011, 54, S99–S102. [Google Scholar] [CrossRef]
- Buresh, R.J.; Patrick, W.H. Nitrate Reduction to Ammonium in Anaerobic Soil1. Soil Sci. Soc. Am. J. 1978, 42, 913. [Google Scholar] [CrossRef]
- Birnbaum, C.; Bradshaw, L.E.; Ruthrof, K.X.; Fontaine, J.B. Topsoil Stockpiling in Restoration: Impact of Storage Time on Plant Growth and Symbiotic Soil Biota. Ecol. Restor. 2017, 35, 237–245. [Google Scholar] [CrossRef]
- Larney, F.J.; Angers, D.A. The Role of Organic Amendments in Soil Reclamation: A Review. Can. J. Soil Sci. 2012, 92, 19–38. [Google Scholar] [CrossRef]
- Gardner, W.C.; Anne Naeth, M.; Broersma, K.; Chanasyk, D.S.; Jobson, A.M. Influence of Biosolids and Fertilizer Amendments on Element Concentrations and Revegetation of Copper Mine Tailings. Can. J. Soil Sci. 2012, 92, 89–102. [Google Scholar] [CrossRef] [Green Version]
- Carter, M.R.; Gregorich, E.G. Soil Sampling and Methods of Analysis, 2nd ed.; Taylor & Francis Group: Boca Raton, FL, USA, 2007. [Google Scholar] [CrossRef]
- Sandroni, V.; Smith, C.M.M.; Donovan, A. Microwave Digestion of Sediment, Soils and Urban Particulate Matter for Trace Metal Analysis. Talanta 2003, 60, 715–723. [Google Scholar] [CrossRef]
- Bray, R.H.; Kurtz, L.T. Determination of Total, Organic, an Available Forms of Phosphorus in Soils. Soil Sci. 1945, 59, 39–46. [Google Scholar] [CrossRef]
- Kachurina, O.M.; Zhang, H.; Raun, W.R.; Krenzer, E.G. Simultaneous Determination of Soil Aluminum, Ammonium- and Nitrate-nitrogen Using 1 M Potassium Chloride Extraction. Commun. Soil Sci. Plant Anal. 2000, 31, 893–903. [Google Scholar] [CrossRef]
- LacCore. Loss-on-Ignition Standard Operating Procedure; National Lacustrine Core Facility: Minneapolis, MN, USA, 2013; pp. 1–5. [Google Scholar]
- Macyk, T.M.; Brocke, L.K.; Hermans, J.C.; McCoy, D. Soil Quality Criteria Relative to Disturbance and Reclamation; Alberta Soils Advisory Committee: Edmonton, AB, Canada, 2004. [Google Scholar]
- Hachiya, T.; Sakakibara, H. Interactions between Nitrate and Ammonium in Their Uptake, Allocation, Assimilation, and Signaling in Plants. J. Exp. Bot. 2017, 68, 2501–2512. [Google Scholar] [CrossRef]
- Williamson, J.C.; Johnson, D.B. Mineralisation of Organic Matter in Topsoils Subjected to Stockpiling and Restoration at Opencast Coal Sites. Plant Soil 1990, 128, 241–247. [Google Scholar] [CrossRef]
- Hsiao, C.J.; Sassenrath, G.F.; Zeglin, L.H.; Hettiarachchi, G.M.; Rice, C.W. Vertical Changes of Soil Microbial Properties in Claypan Soils. Soil Biol. Biochem. 2018, 121, 154–164. [Google Scholar] [CrossRef]
- Government of British Columbia. Interpretations for Soil Test Phosphorus and Potassium: Guidelines for Southern British Columbia; 2010. Available online: https://www2.gov.bc.ca/gov/content/industry/agriculture-seafood/agricultural-land-and-environment/soil-nutrients/nutrient-management/what-to-apply/soil-nutrient-testing/soil-test-phosphorus-and-potassium (accessed on 6 January 2022).
- Smith, J.L.; Doran, J.W. Measurement and Use of PH and Electrical Conductivity for Soil Quality Analysis. Methods Assess. Soil Qual. 1996, 49, 169–185. [Google Scholar] [CrossRef]
- Baer, S.G. Nutrient Dynamics as Determinants and Outcomes of Restoration. In Foundations of Restoration Ecology; Island Press: Washington, DC, USA, 2016. [Google Scholar]
- Canadian Council of Ministers of the Environment (CCME). Canadian Soil Quality Guidelines for the Protection of Environmental and Human Health—Copper (1999); Canadian Environmental Quality Guidelines: Winnipeg, MB, Canada, 1999; p. 7. [Google Scholar]
- Brown, K.A. Sulphur in the Environment: A Review. Environ. Pollut. Ser. B Chem. Phys. 1982, 3, 47–80. [Google Scholar] [CrossRef]
- Yan, B.; Hou, Y. Effect of Soil Magnesium on Plants: A Review. IOP Conf. Ser. Earth Environ. Sci. 2018, 170, 022168. [Google Scholar] [CrossRef]
- Naeem, M.; Ansari, A.A.; Gill Singh, S. Essential Plant Nutrients: Uptake, Use Efficiency, and Management; Springer: Cham, Switzerland, 2017; ISBN 9783319588407. [Google Scholar]
- Horneck, D.A.; Sullivan, D.M.; Owen, J.S.; Hart, J.M. Soil Test Interpretation Guide. Organ State Univ. Ext. Cat. 2011, 7, 1–8. [Google Scholar] [CrossRef]
- BC Reg 375/96 Contaminated Sites Regulation. 2021. Available online: https://www.bclaws.gov.bc.ca/civix/document/id/loo64/loo64/375_96sch5 (accessed on 11 February 2022).
- Kumaragamage, D.; Warren, J.; Graeme, S. Soil Chemistry. In Digging into Canadian Soils: An Introduction to Soil Science; Canadian Society of Soil Science: Pinawa, MB, Canada, 2021. [Google Scholar]
- Smith, S.; Read, D. Mycorrhizal Symbiosis; Elsevier: Amsterdam, The Netherlands, 2008. [Google Scholar]
- Government of Canada Description of Soil BCTRP~~~~~N (TRAPP LAKE). Available online: https://sis.agr.gc.ca/cansis/soils/bc/TRP/~~~~~/N/description.html (accessed on 8 November 2021).
- Salehi, M.H.; Beni, O.H.; Harchegani, H.B.; Borujeni, I.E.; Motaghian, H.R. Refining Soil Organic Matter Determination by Loss-on-Ignition. Pedosphere 2011, 21, 473–482. [Google Scholar] [CrossRef]
- Suter, G.W.; Norton, S.B. Ecological Risk Assessment: Three Approaches to Define Desired Soil Organic Matter Contents. Encycl. Ecol. 2003, 1, 402–406. [Google Scholar] [CrossRef]
- Ezeokoli, O.T.; Mashigo, S.K.; Paterson, D.G.; Bezuidenhout, C.C.; Adeleke, R.A. Microbial Community Structure and Relationship with Physicochemical Properties of Soil Stockpiles in Selected South African Opencast Coal Mines. Soil Sci. Plant Nutr. 2019, 65, 332–341. [Google Scholar] [CrossRef]
- Harris, J.A. Soil Microbial Communities and Restoration Ecology: Facilitators or Followers? Science 2009, 325, 6. [Google Scholar] [CrossRef]
- Golos, P.J.; Dixon, K.W.; Erickson, T.E. Plant Recruitment from the Soil Seed Bank Depends on Topsoil Stockpile Age, Height, and Storage History in an Arid Environment. Restor. Ecol. 2016, 24, S53–S61. [Google Scholar] [CrossRef]
- Harris, J.A.; Birch, P.; Short, K.C. Changes in the Microbial Community and Physico-chemical Characteristics of Topsoils Stockpiled during Opencast Mining. Soil Use Manag. 1989, 5, 161–168. [Google Scholar] [CrossRef]
- Natural Resources Canada. A Guide to Soil Salvage; Canadian Forest Service: Ottawa, ON, Canada, 2017.
- The City of Calgary Parks. Soil Handling Recommendations: Best Practices to Improve Restoration Work; The City of Calgary Parks: Calgary, AB, Canada, 2018. [Google Scholar]


| Depth (cm) | pH | EC | SAR 1,2 |
|---|---|---|---|
| New Afton | |||
| 0–61 | F | G | P/U |
| 61–152 | F | G | P/U |
| 152–610 | F | G | P/U |
| 610–1372 | F | G | P/U |
| Reference | G | G | F |
| QR mill | |||
| 0–10 | F | G | F |
| 10–20 | G | G | F |
| 60–120 | F | G | F |
| 200–260 | G | G | F |
| 350–390 | G | G | F |
| 500–575 | F | G | F |
| Reference | G | G | F |
Publisher’s Note: MDPI stays neutral with regard to jurisdictional claims in published maps and institutional affiliations. |
© 2022 by the authors. Licensee MDPI, Basel, Switzerland. This article is an open access article distributed under the terms and conditions of the Creative Commons Attribution (CC BY) license (https://creativecommons.org/licenses/by/4.0/).
Share and Cite
Fischer, A.M.; Van Hamme, J.D.; Gardner, W.C.; Fraser, L.H. Impacts from Topsoil Stockpile Height on Soil Geochemical Properties in Two Mining Operations in British Columbia: Implications for Restoration Practices. Mining 2022, 2, 315-329. https://doi.org/10.3390/mining2020017
Fischer AM, Van Hamme JD, Gardner WC, Fraser LH. Impacts from Topsoil Stockpile Height on Soil Geochemical Properties in Two Mining Operations in British Columbia: Implications for Restoration Practices. Mining. 2022; 2(2):315-329. https://doi.org/10.3390/mining2020017
Chicago/Turabian StyleFischer, Ashley M., Jonathan D. Van Hamme, Wendy C. Gardner, and Lauchlan H. Fraser. 2022. "Impacts from Topsoil Stockpile Height on Soil Geochemical Properties in Two Mining Operations in British Columbia: Implications for Restoration Practices" Mining 2, no. 2: 315-329. https://doi.org/10.3390/mining2020017