Article

Metabolic Effects on Mouse Embryonic Stem Cells and the Canonical Mammalian Target of Rapamycin Pathway

by
Bibiana Correia
1,2,
Maria Inês Sousa
1,2 and
João Ramalho-Santos
1,2,*
1
Department of Life Sciences, University of Coimbra, Calçada Martim de Freitas, 3000-456 Coimbra, Portugal
2
CNC-Center for Neuroscience and Cell Biology, CIBB, University of Coimbra, Azinhaga de Santa Comba, Polo 3, 3000-370 Coimbra, Portugal
*
Author to whom correspondence should be addressed.
BioChem 2023, 3(4), 170-181; https://doi.org/10.3390/biochem3040012
Submission received: 25 July 2023 / Revised: 18 September 2023 / Accepted: 24 October 2023 / Published: 9 November 2023

Abstract

:
Diapause-like features can be extended to naïve mouse embryonic stem cells (mESCs) to induce paused pluripotency by using INK128 (mTi), a mammalian target of rapamycin (mTOR) inhibitor. As a core integrative pathway, mTOR senses diverse stimuli and translates these cues to coordinate several processes. We have previously shown that the withdrawal of leucine and arginine from the culture medium of naïve mESCs can induce features of a paused-pluripotent state, including reduced cell proliferation, cell cycle arrest, and reductions in glycolytic and oxidative metabolism. However, surprisingly, although mTi did indeed provoke a paused-like state, this was distinct from and less pronounced than what resulted from leucine and arginine removal, and, according to our results, these features did not seem to necessarily be mTOR-driven. Therefore, this possibility should be considered in further experiments, and mTOR inhibition when using INK128 should always be confirmed and not merely assumed when INK128 is present in the culture medium.

1. Introduction

Diapause preserves reproductive potential by delaying development if environmental conditions are not favorable until the optimal conditions are met. Although it does not occur equally in all species, it is characterized by very slow development or even developmental arrest until favorable conditions ensure proper embryo development, safeguarding offspring survival [1].
During pre-implantation development, zygotes develop into blastocysts, the stage at which development is arrested, with embryos showing decreased growth and proliferation, cell cycle arrest, and decreased rates of biosynthetic processes and displaying a hypometabolic state [2,3,4]. Experimentally, it is possible to induce diapause through ovariectomy, given that ovarian removal triggers embryonic diapause (ED) due to the lack of estrogen production, which regulates uterine receptivity [5,6]. Although the role of ovarian hormones in the regulation of ED in mice is well established, more recently, the mTOR pathway was pinpointed as a critical regulator [4]. It was reported that embryo development is arrested at the blastocyst stage by pharmacologically inhibiting mTOR kinase activity; therefore, its pathway uses INK128, and this phenomenon is reversible upon removal of the inhibitor. Moreover, the authors extended this reversible inhibition of development to cultured mouse embryonic stem cells (mESCs), thus characterizing a novel paused-pluripotent state [4].
As a central cellular sensor, the mTOR pathway is essential for regulating cellular activity in response to diverse signals [7,8]. mTOR activity, in turn, integrates these signals by regulating various cellular processes, from autophagy to metabolism, translation, and cell survival [7,8]. Among all nutrients, leucine and arginine are two amino acids that have been described as potent modulators of mTOR activity [7,8]. Our recent work showed that the withdrawal of leucine and arginine from naïve mESC culture reduced cell proliferation by causing cell cycle arrest in the G1 phase and reduced both glycolytic and oxidative metabolism without affecting the pluripotent status of the cells [9]. While the intracellular production of metabolites cannot be excluded, these results suggest that cells cultured in the absence of leucine and arginine share some similarities with paused-pluripotency cells and diapause embryos. Given that leucine and arginine are linked to mTOR activity, we aimed to determine whether these effects could be mTOR-driven.

2. Materials and Methods

2.1. Cell Culture

Mouse embryonic stem cells (mESCs strain E14TG2a: ATCC CRL-1821) were placed on culture dishes coated with 0.1% gelatin (Sigma-Aldrich, St. Louis, MO, USA) at 37 °C, 5% CO2. To culture the cells, an N2B27—based medium of DMEM–F12 (Gibco Invitrogen, Waltham, MA, USA) and Neurobasal (Gibco Invitrogen, Waltham, MA, USA) in a 1:1 ratio was used. This medium was supplemented with 0.75 mM L-glutamine (Gibco Invitrogen, Waltham, MA, USA), 100 U/mL penicillin/streptomycin (Gibco Invitrogen, Waltham, MA, USA), 01× B27 supplement (Gibco Invitrogen, Waltham, MA, USA), 0.1 mM 2-mercaptoethanol (Sigma-Aldrich, St. Louis, MO, USA), 0.5× N2 supplement (Gibco Invitrogen, Waltham, MA, USA), 1 μM PD0325901 (Axon Medchem, Groningen, The Netherlands), 3 μM CHIR99021 (Axon Medchem, Groningen, The Netherlands), and 1 × 10³ U/mL of leukemia inhibitory factor (LIF; Gibco Invitrogen, Waltham, MA, USA). This medium will be called 2i/LIF throughout this manuscript.
Passage was performed by dissociating colonies with StemPro Accutase Cell Dissociation Reagent (Merck-Millipore, Darmstadt, Germany), followed by a centrifugation step at 300× g for 5 min. In order to determine cell numbers, trypan blue (Sigma-Aldrich, St. Louis, MO, USA) was used in a Neubauer chamber, after which the cells were plated in gelatin-coated culture dishes. The experiments were performed with an initial density of 8000 cells/cm2 in 2i/LIF. After 12 h, cells were properly adhered and were washed with PBS before fresh media were added. To culture cells in the absence of leucine and arginine (xAA and xAAxLIF conditions), previous conditions were used [9] with or without adding LIF, respectively. For mTOR-inhibiting conditions (mTi), the 2i/LIF media were supplemented with 100 nM INK28 (MedChem Express, Monmouth Junction, USA) according to previous experience with several other concentrations of the drug [9].
Recovery experiments were performed 48 h after the cells’ exposure to the different culture treatments, as previously described [9].

2.2. Cell Proliferation Assay

A cell proliferation assay was performed by counting cells every 24 h. Colonies in 48-well plates were washed in PBS, and StemPro Accutase Cell Dissociation Reagent (Merck-Millipore, Darmstadt, Germany) was used to separate the cells. Then, medium was added to a defined final volume to inactivate the enzyme through dilution. Afterward, the samples were counted in a Neubauer chamber after mixing 10 μL of cell suspension with 10 μL of trypan blue (Sigma-Aldrich, St. Louis, MO, USA).

2.3. Flow Cytometry

Annexin V/PI staining (Immunostep, Salamanca, Spain) was performed as described previously [9]. After 48 h of culture in each condition, according to the experimental design, cells were detached and dissociated as noted above, and the experiment was conducted with a cell suspension sample at a final concentration of 1 × 10⁶ live cells. Samples were then incubated with 5 μL of Annexin V-FITC and 2.5 μM PI and analyzed with flow cytometry. For the positive control, cells previously incubated with 0.25% H2O2 (Sigma-Aldrich, St. Louis, MO, USA) were used, and the negative control consisted of unstained samples of live cells.
Mitochondrial mass was assessed using Mitotracker Green (Thermo Fisher, Pierce, Rockford, IL, USA) and a flow cytometer. After detachment, cells were centrifuged, resuspended in Mitotracker Green staining solution (100 nM Mitotracker Green in cell culture medium of the respective treatment), and incubated in the dark for 30 min at 37 °C. The suspension was then centrifuged, resuspended in PBS, and analyzed in a Becton Dickinson BD FACSCalibur cytometer while using the appropriate settings. A total of 20,000 events per condition were gated, while non-stained cells were used as a control for false-positive measurements. The measurements were performed with a BD FACSCalibur cytometer and the Cell Quest Pro Acquisition Software version 5.1 (BD Biosciences).

2.4. Immunocytochemistry

For immunocytochemistry, 4% paraformaldehyde (Sigma-Aldrich, St. Louis, MO, USA) was used as a fixing agent for 15 min at RT. Cells were then permeabilized for 10 min with ice-cold 100% Methanol (Sigma-Aldrich, St. Louis, MO, USA) at −20 °C and blocked in a solution consisting of 5% BSA and 1% Triton X-100 (Sigma-Aldrich, St. Louis, MO, USA) for 1 h. To dilute and incubate the antibodies, a solution of 1% BSA but containing only 0.25% Triton X-100 in PBS was used. Primary antibodies, anti-GLUT1 (Cat. No: PA1-46152, Invitrogen, Waltham, MA, USA; 1:150; rabbit) and anti-Oct4 antibodies (Cat. No: #701756; Thermo Fisher, Pierce, Rockford, IL, USA, 1:250; rabbit), were incubated with the samples overnight at 4 °C. The secondary antibody Texas Red-X goat anti-rabbit IgG (Cat. No: #T6391, Thermo Fisher, Pierce, Rockford, IL, USA) was then added, and incubation proceeded at RT in the dark for 45 min, followed by DNA staining with Hoechst 33342 Trihydrochloride (Invitrogen, Waltham, MA, USA) in a 10-min incubation. Imaging was performed by microscopy using a phase-contrast microscope (Leica DMI3000B) with a 10× objective and a Leica DFC425C camera. Image analysis was performed using the Image J 1.52a software (Wayne Rasband National Institute of health, USA, Java 1.8.0_172).

2.5. Quantitative Real-Time PCR (qRT-PCR)

Cells were collected and nucleic acids were extracted after 48 h of treatment using the TRIzol reagent (Invitrogen, Waltham, MA, USA), which was thoroughly mixed with the samples. Afterward, 200 μL of chloroform (Sigma-Aldrich, St. Louis, MO, USA) was added, and samples were thoroughly mixed again before they were centrifuged at 12,000× g for 15 min at 4 °C. The chloroform aqueous phase was collected, and RNA was precipitated by adding 2-propanol (Sigma-Aldrich, St. Louis, MO, USA) at a 1:1 ratio. RNA was preserved at −20 °C. After centrifugation, thawed samples were incubated in 600 μL of 75% ethanol and air-dried before dissolving in nuclease-free water. A DNA-free kit (Ambion, Invitrogen, Waltham, MA, USA) was used for DNA cleanup. The concentration and quality of the RNA samples were determined using a NanoDrop 2000 (Thermo Scientific, Waltham, MA, USA), and samples with a 260/280 ratio at least equal to 1.8 were kept at −80 °C until used. To convert 1 μg of RNA into cDNA, the iScript cDNA Synthesis Kit (BioRad, Hercules, CA, USA) was used in a C1000 Thermal Cycler (BioRad, Hercules, CA, USA).
RT-PCR assays involved mouse-specific primers from a primer bank database (http://pga.mgh.harvard.edu/primerbank/as (accessed on 4 July 2021)). Oct4—forward primer (FP): CGGAAGAGAAAGCGAACTAGC/reverse primer (RP): ATTGGCGATGTGAGTGATCTG; Nanog—FP: TCTTCCTGGTCCCCACAGTTT/RP: GCAAGAATAGTTCTCGGGATGAA; Essrb—FP: GCACCTGGGCTCTAGTTGC/RP: TACAGTCCTCGTAGCTCTTGC; mTOR—FP: ACCGGCACACATTTGAAGAAG/RP: CTCGTTGAGGATCAGCAAGG; S6K1—FP: TTGACTTTCCAGTTCCCAAGGT/RP: AAAAGGCGAATAGGAGGGCAG; Raptor—FP: CAGTCGCCTCTTATGGGACTC/RP: GGAGCCTTCGATTTTCTCACA; 4EBP1—FP: GGGGACTACAGCACCACTC/RP: CTCATCGCTGGTAGGGCTA. The assay was carried out as previously described [9].

2.6. Western Blotting

Proteins were extracted by lysing cells with 100 μL of RIPA buffer (Sigma-Aldrich, St. Louis, MO, USA) supplemented with 2 mM PMSF (phenylmethylsulphonyl fluoride; Sigma Aldrich, St. Louis, MO, USA), 2× Halt phosphatase inhibitor cocktail (Thermo Fisher, Pierce, Rockford, IL, USA), and protease inhibitor cocktail CLAP (Sigma-Aldrich, St. Louis, MO, USA) for 5 min on ice after roughly mixing. Duplicates were used for quantification with the Pierce BCA (Bicinchonic Acid) Protein Assay Kit (Thermo Fisher, Pierce, Rockford, IL, USA) following the manufacturer’s protocol and a BioTek Synergy HT multi-detection microplate reader (BioTek Instruments, Winooski, VT, USA). Protein samples were prepared for electrophoresis by denaturing 30 μg of protein extract in Laemmeli sample buffer (BioRad, Hercules, CA, USA) for 10 min at 75 °C. Samples were loaded in 7.5% or 12% Acrilamide gels, and electrophoresis was carried out in a Mini Protean Tetra Cell (BioRad, Hercules, CA, USA) system. Samples were transferred to polyvinylidene difluoride (PVDF) membranes (BioRad, Hercules, CA, USA), which were blocked for 1 h at RT in 5% milk or 5% BSA in a buffer composed of 5 mM Tris, 15 mM NaCl (Sigma-Aldrich, St. Louis, MO, USA), and 0.1% Tween 20 (TBS-T; Sigma-Aldrich, St. Louis, MO, USA). Membranes were then labeled with the following primary antibodies at 4 °C overnight: rabbit anti-p-AKT (Ser473) (Cat. No: #4058, Cell Signaling, Danvers, MA, USA; 1:1000), rabbit anti-AKT (Cat. No: #4691, Cell Signaling, Danvers, MA, USA; 1:200), rabbit anti-4EBP1 (Cat. No: #9644, Cell Signaling, Danvers, MA, USA; 1:1000), rabbit anti-phospho-4EBP1 (Thr37/46) (Cat. No: #9459, Cell Signaling, Danvers, MA, USA; 1:1000), rabbit anti-p-S6K1 (Thr389) (Cat. No: #9234; Cell Signaling, Danvers, MA, USA, 1:750), rabbit anti-S6K1 (Cat. No: #2708; Cell Signaling, Danvers, MA, USA, 1:1000), goat anti-CANX (Cat. No: ab0041, SICGEN, Cantanhede, PT; 1:2500), mouse anti-TFAM (Cat. No: #SC-166965; Santa Cruz, Dallas, TX, USA; 1:1000), mouse anti-TOM20 (Cat. No: #SC-17764; Santa Cruz, Dallas, TX, USA; 1:1000), anti-ACTIN (Cat. No: A2228; Sigma-Aldrich, St. Louis, MO, USA), rabbit anti-GLUT3 (Cat. No: #OSG00013G; Invitrogen, Waltham, MA, USA, 1:1000), and rabbit anti-GLUT1 (Cat. No: PA1-46152, Invitrogen, Waltham, MA, USA; 1:1000). For the secondary antibodies, labeled antibodies were diluted in 5% BSA in TBS-T, with the exception of Calnexin, where secondary antibodies were diluted in 5% and 2.5% milk in TBS-T (BioRad, Hercules, CA, USA). A 1:1 solution of enhancer reagent and oxidizing reagent of either ImmunoStar ECL substrate (BioRad, Hercules, CA, USA) or Western Bright Sirius (Advansta, San Jose, CA, USA) was used to detect the secondary antibodies signal. Membranes were developed using a VersaDoc Imaging system (BioRad, Hercules, CA, USA), and quantification was performed with ImageJ 1.52a (US National Institutes of Health). Protein levels were normalized in relation to Calnexin.

2.7. Statistical Analysis

SPSS 21.0 (SPSS Inc., Chicago, IL, USA) was used for statistical analysis. Normality and homoscedasticity were determined by the Shapiro–Wilk and Levene tests, respectively. A one-way ANOVA or independent t-Student Test was performed whenever data had a normal distribution, followed by Bonferroni or Dunnett T3 post hoc tests (after one-way ANOVA test), to determine statistical significance. If the data were non-normal, the Kruskal–Wallis non-parametric test was performed, followed by the Mann–Whitney test. The threshold for statistical significance was p ≤ 0.05. Data are expressed as means ± standard error of the mean (SEM). Statistical significance is displayed as * p < 0.05, ** p < 0.01, and *** p < 0.001.

3. Results

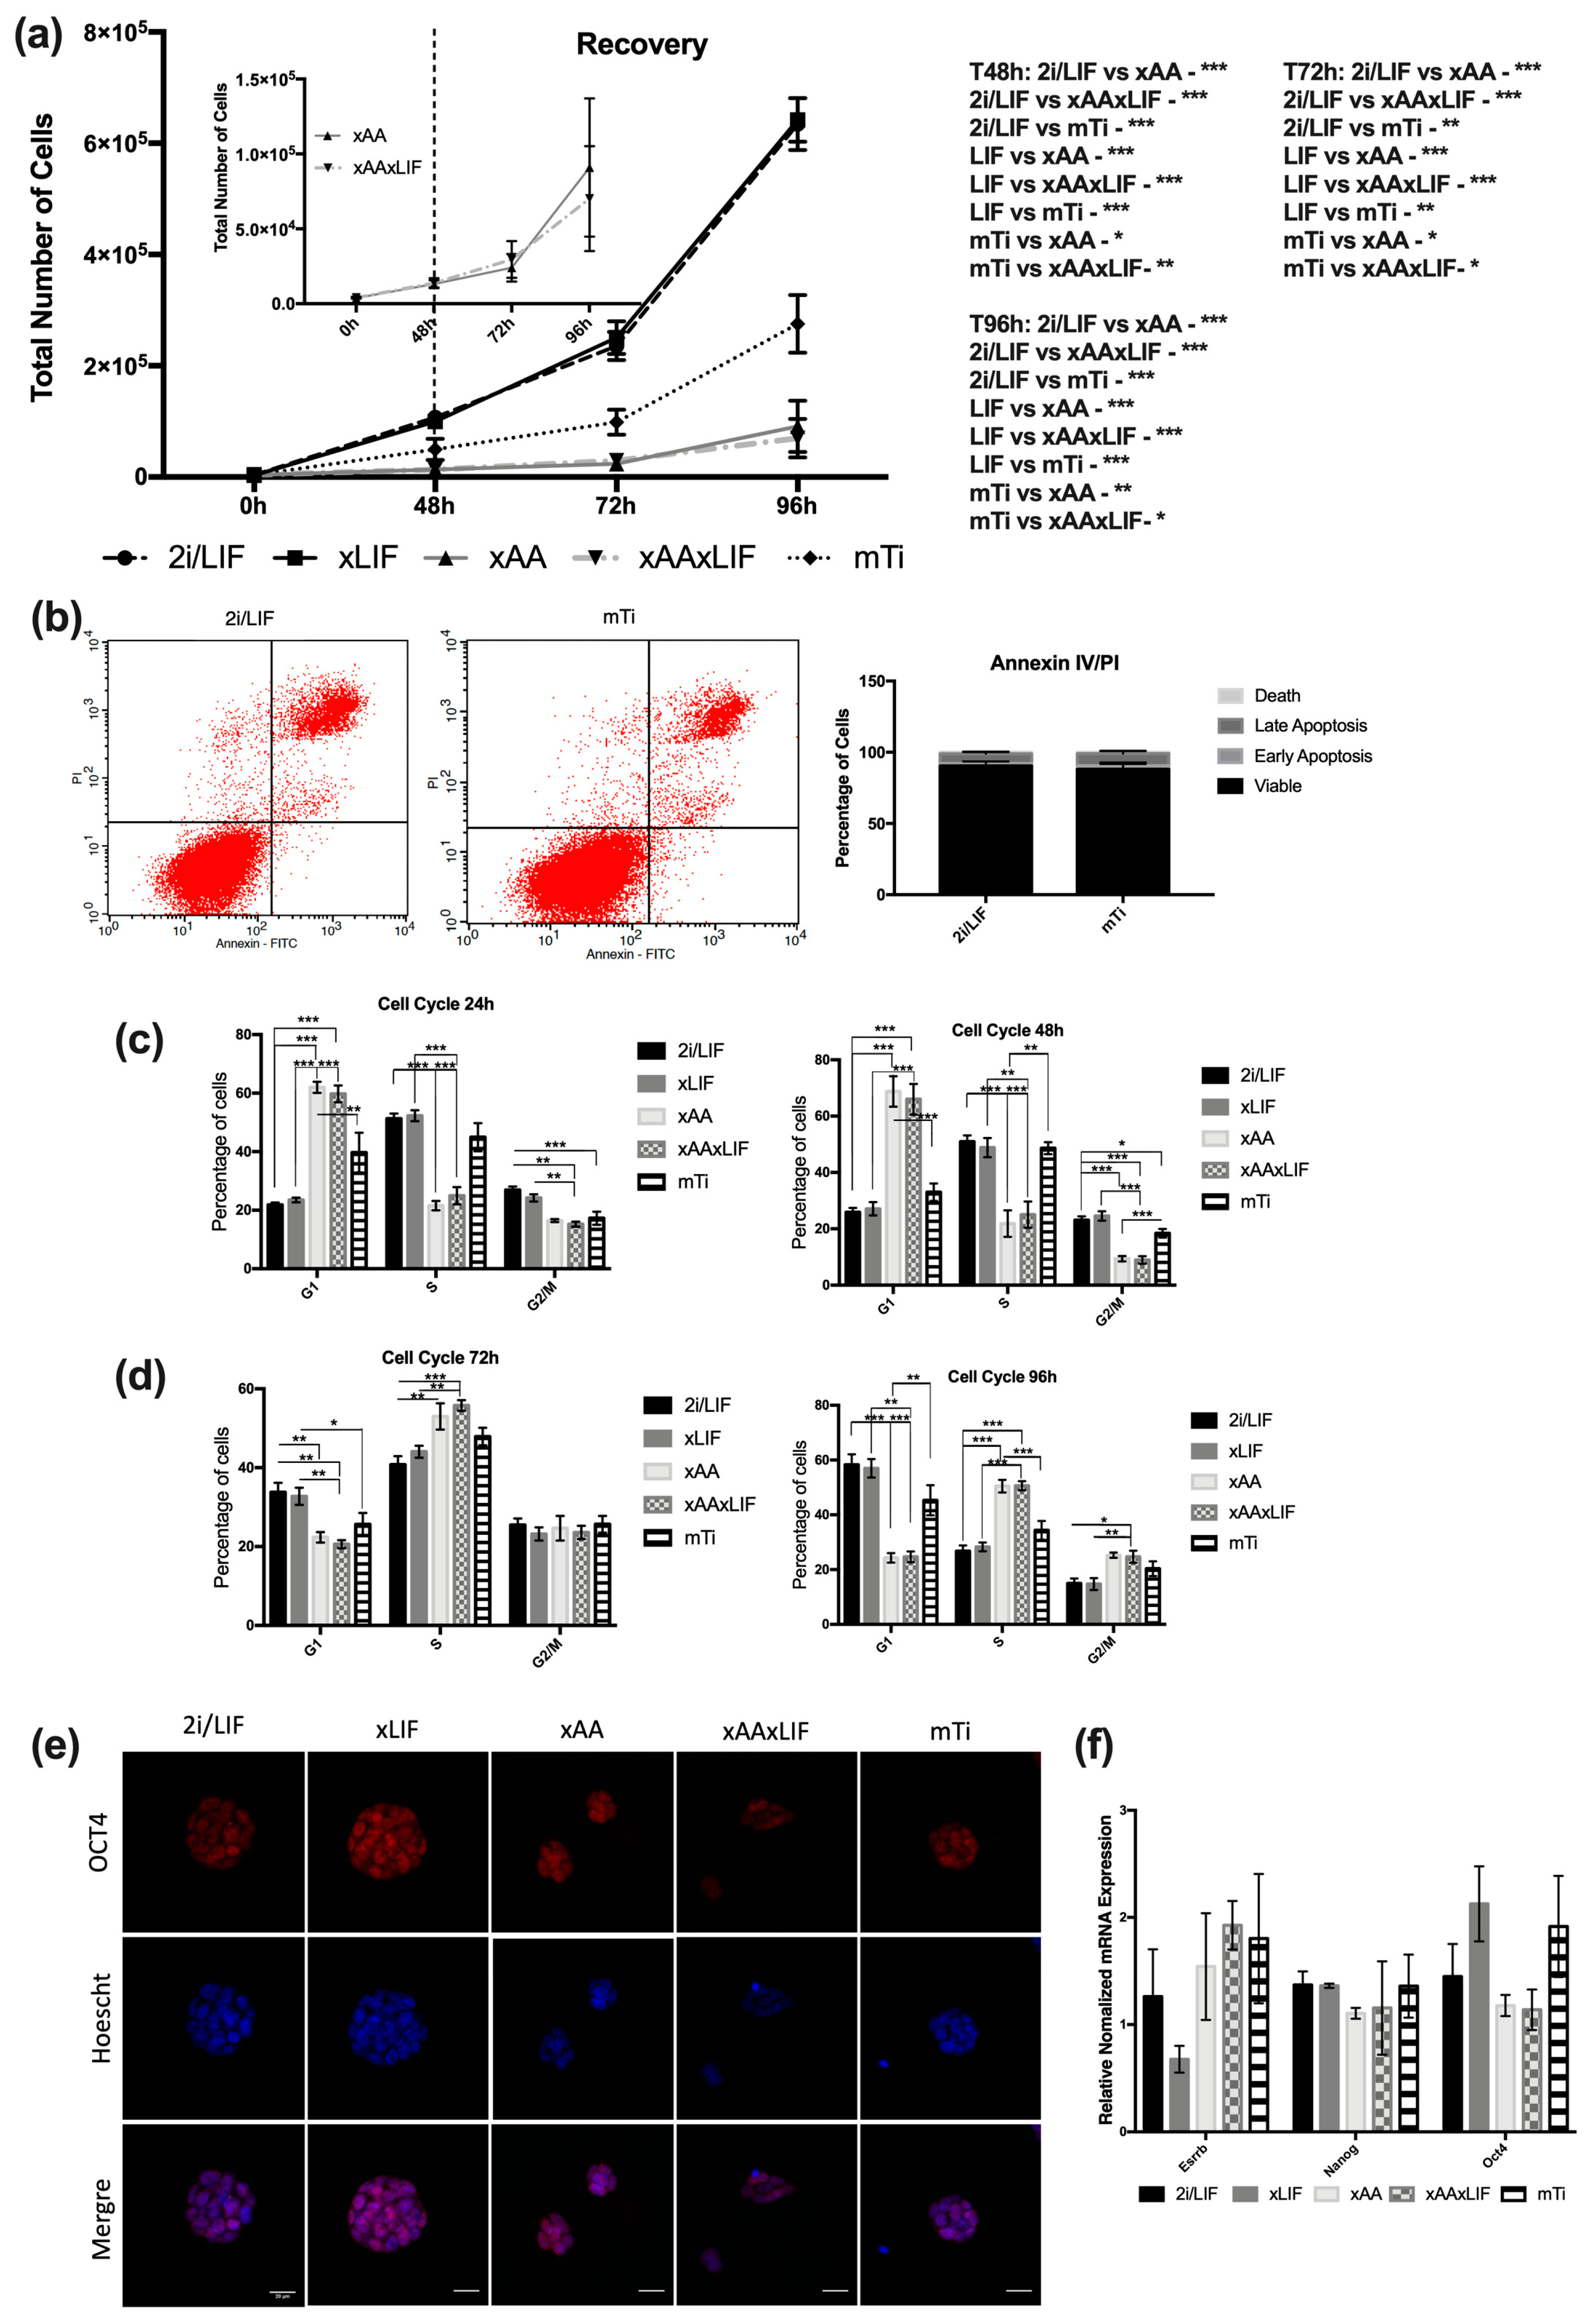
3.1. Leucine and Arginine Withdrawal Is More Efficient in Downregulating Pluripotent Stem Cell Proliferation Than mTi (INK128)

The mTOR pathway is sensitive to growth factors such as LIF, acting through the PI3K pathway [10]. Furthermore, it is also sensitive to amino acids, especially leucine (Leu) and arginine (Arg), as the absence of these specific amino acids reduces mTOR activity by 70–90%, an effect that is modulated by mTORC1 [11]. Thus, we sought to understand whether leucine and arginine withdrawal from mESCs cultured in a 2i-containing medium affected the mTOR pathway and whether the effect was modulated via mTORC1 targets. For this purpose, cells were cultured in a 2i/LIF medium, xLIF medium, xAA medium, xAAxLIF medium, and, as a positive control, 2i/LIF medium with the mTOR inhibitor INK128, which was labeled as the mTi condition. We performed a growth curve assay, and cells cultured in the presence of INK128 (the mTi condition) proliferated significantly less when compared to the 2i/LIF and xLIF conditions (Figure 1a). Moreover, as previously shown [9], cells cultured in the xAA and xAAxLIF conditions proliferated less than cells in the 2i/LIF and xLIF conditions. Interestingly, leucine and arginine removal caused a greater effect on proliferation than mTi (Figure 1a). Next, the Annexin V/PI apoptosis assay was carried out to rule out cell death as the cause of the decreased number of cells, and no differences were found (Figure 1b). We then focused on determining whether our experimental conditions affected the cell cycle. In accordance with previous data [9], after 24 h and 48 h, the percentage of cells in the G1 phase was higher in the xAA and xAAxLIF conditions than in all other conditions (Figure 1c), concomitant with a decrease in the number of cells in the S and G2/M phases (Figure 1c). In addition, although 24 h of mTi treatment promoted a higher percentage of cells in the G2 phase, this was only significant after 48 h, while the xLIF and 2i/LIF conditions share similarities not only in terms of proliferation but also in terms of cell cycle distribution at both time points (Figure 1c). Thus, a lack of leucine and arginine affects progression from the G1 phase, while mTi seems to interfere with progression from the S phase to the G2/mitotic phase. During recovery, we found that cells in the S and G2/M phases had increased at both 72 h and 96 h (Figure 1d), showing that the cell cycle indeed recovers following leucine and arginine replenishment. To evaluate whether cells in each condition still expressed the pluripotency marker OCT4, we performed immunostaining and observed a nuclear staining pattern typical of pluripotent mESCs (Figure 1e). Additionally, the mRNA expression of the core pluripotency markers OCT4 and NANOG, as well as the naïve pluripotency marker ESRRB, remained unaltered in all conditions, suggesting that none of our experimental conditions affect pluripotency (Figure 1f). In summary, leucine and arginine withdrawal induces an arrest in cell proliferation at the G1 phase, which seems more intense than the effects promoted by mTi. On the other hand, LIF removal seemingly has no effect on this parameter.

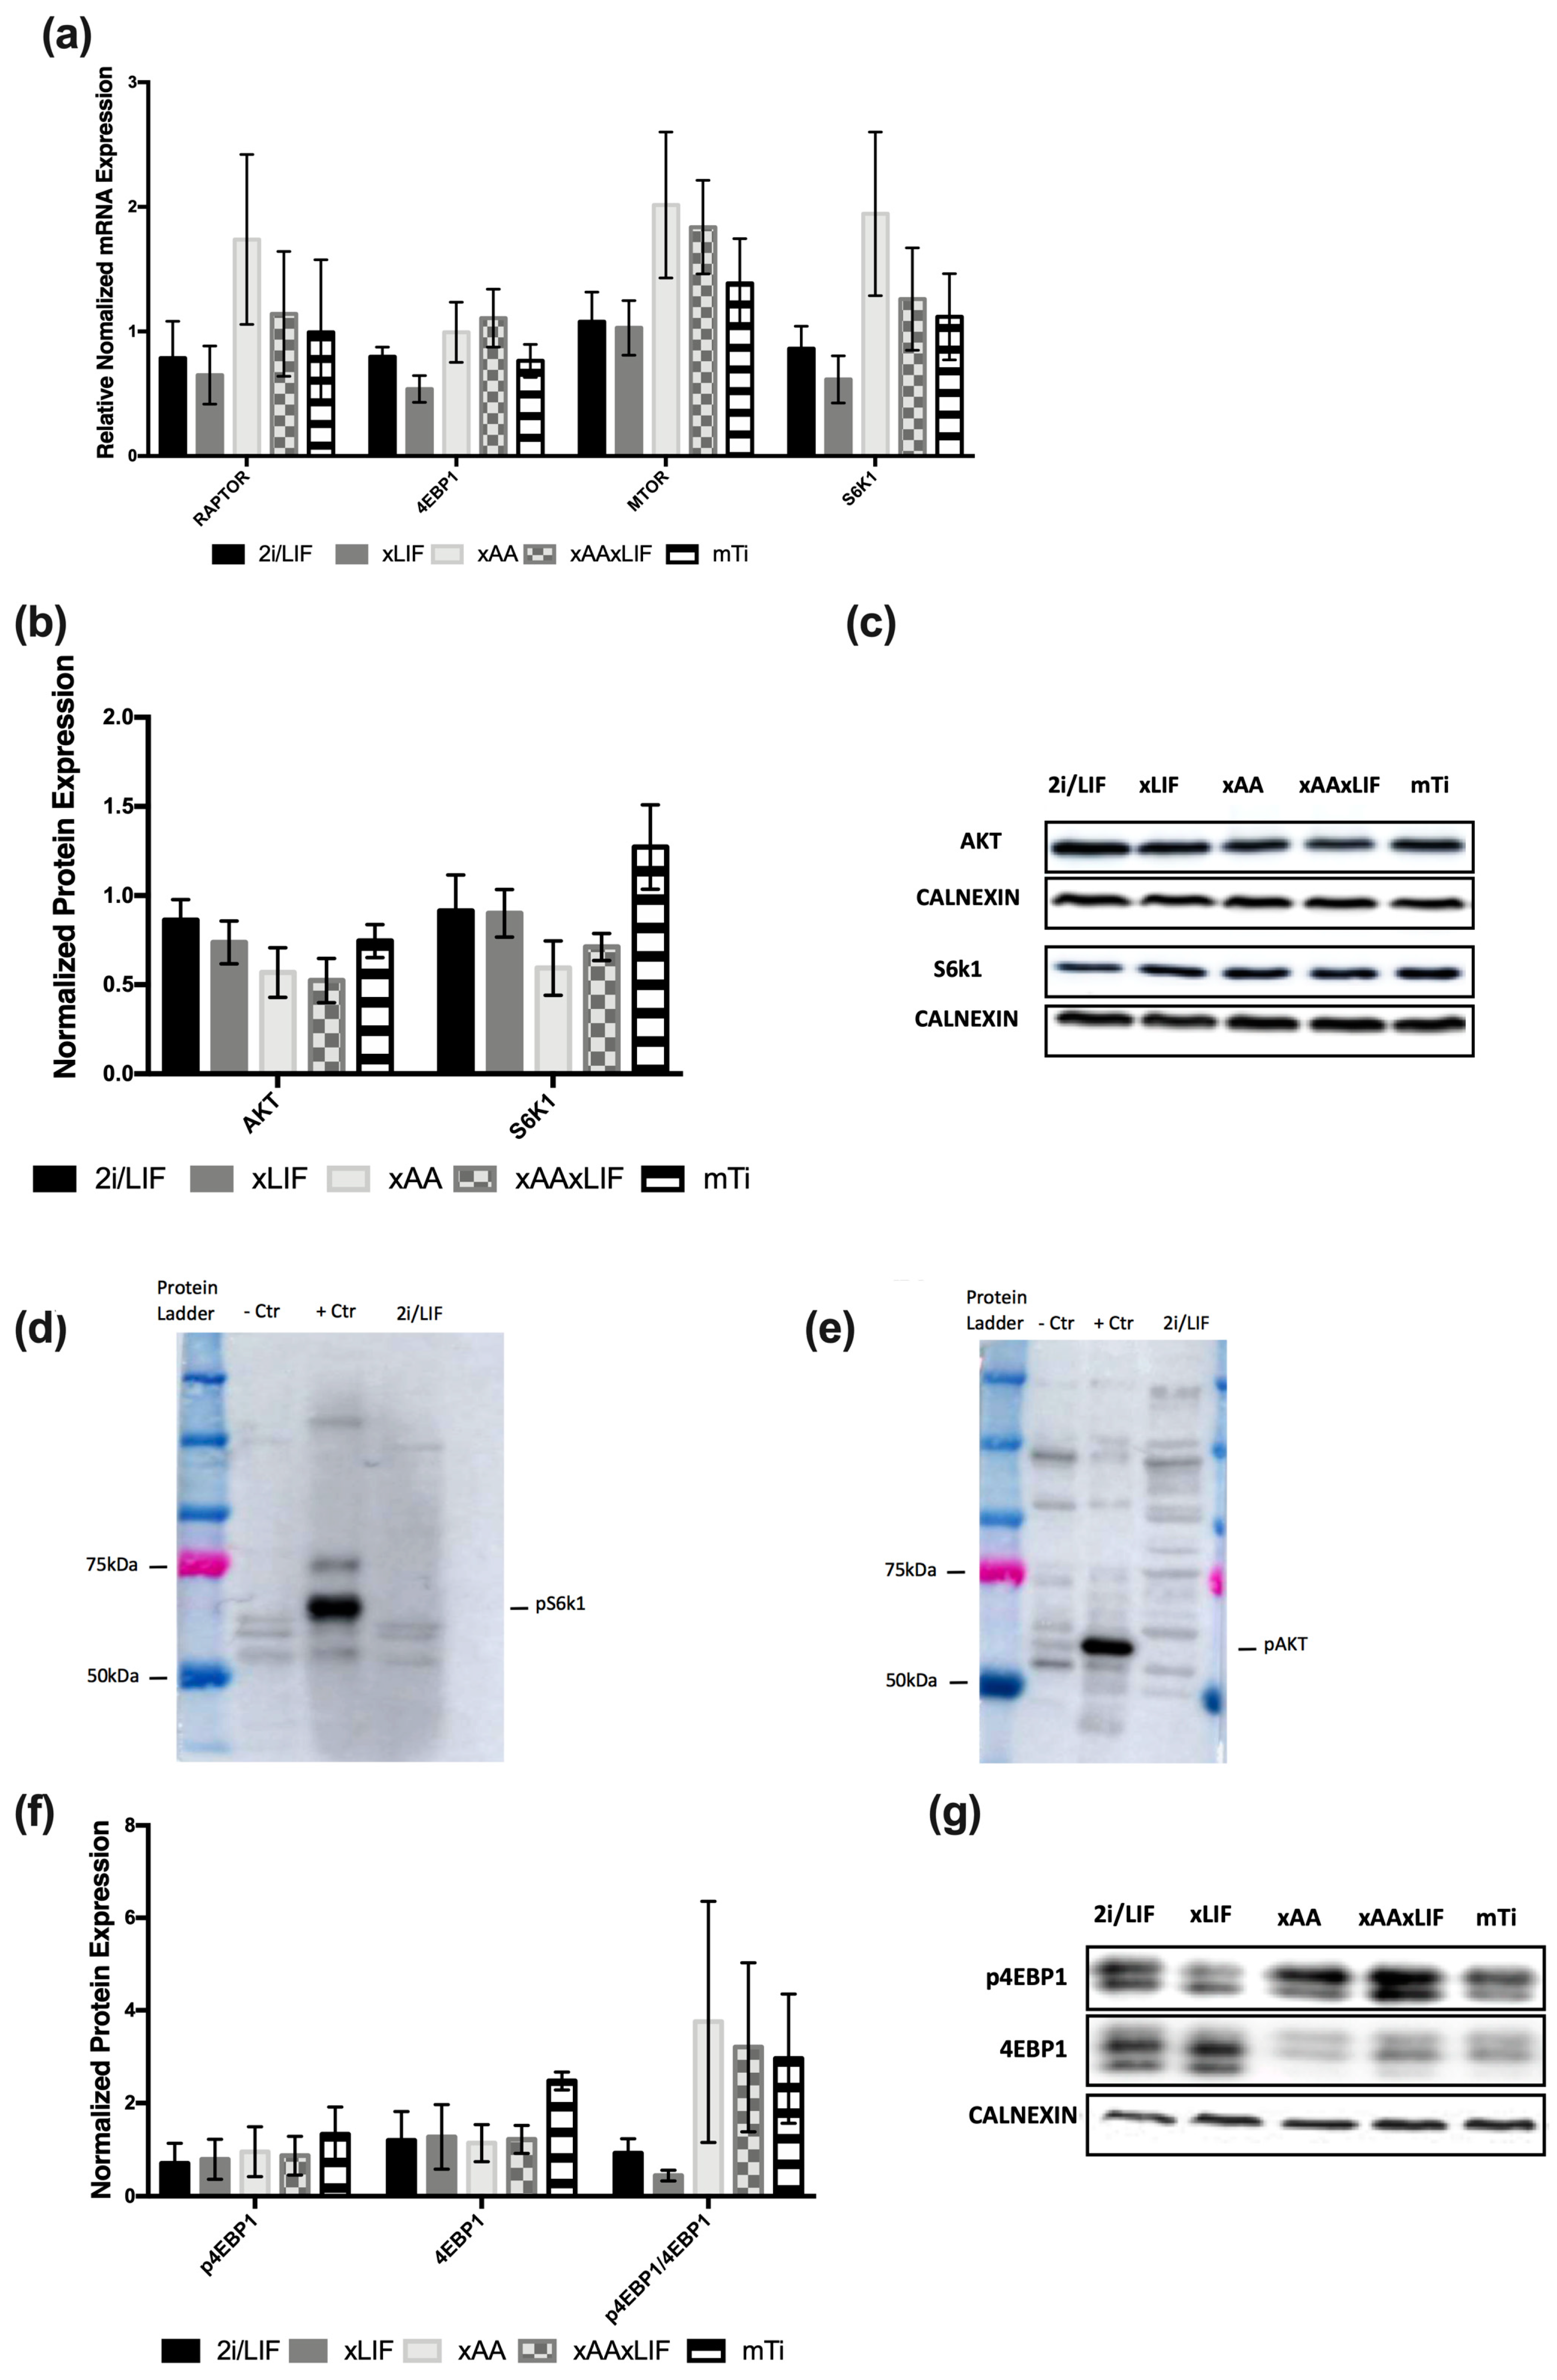
3.2. Leucine and Arginine Removal and mTi Induce a Paused-Pluripotency-Like State Independently of Canonical mTOR Signaling

To determine whether and how the mTOR pathway was modulated in the absence of leucine and arginine, we assessed the mRNA and protein expression of mTORC1 and its downstream targets 4EBP1 and S6K1. Interestingly, the mRNA levels of RAPTOR (an indispensable protein for the assembly of mTORC1), mTOR, 4EBP1, and S6K1 were not affected in any of our experimental conditions (Figure 2a). Moreover, the protein levels of the total S6K1 form were similar in all cases (Figure 2b,c), although the phosphorylated form was undetected, even in the 2i/LIF condition (Figure 2d). Remarkably, in our hands, neither the phosphorylated nor the total levels of 4EBP1 were affected (Figure 2f,g). Furthermore, the protein level of AKT, an mTORC2 downstream target, was also unaffected (Figure 2b,c,e). These results suggest that overall translation in naïve ESCs is affected independently of S6K1 and 4EBP1 signaling. Moreover, our results suggest that the phosphorylated forms of AKT and S6K1 at mTOR-specific sites may not be fundamental for naïve pluripotent stem cells, and that effects beyond the mTOR pathway may be involved in the behavior of mESCs following leucine and arginine removal.

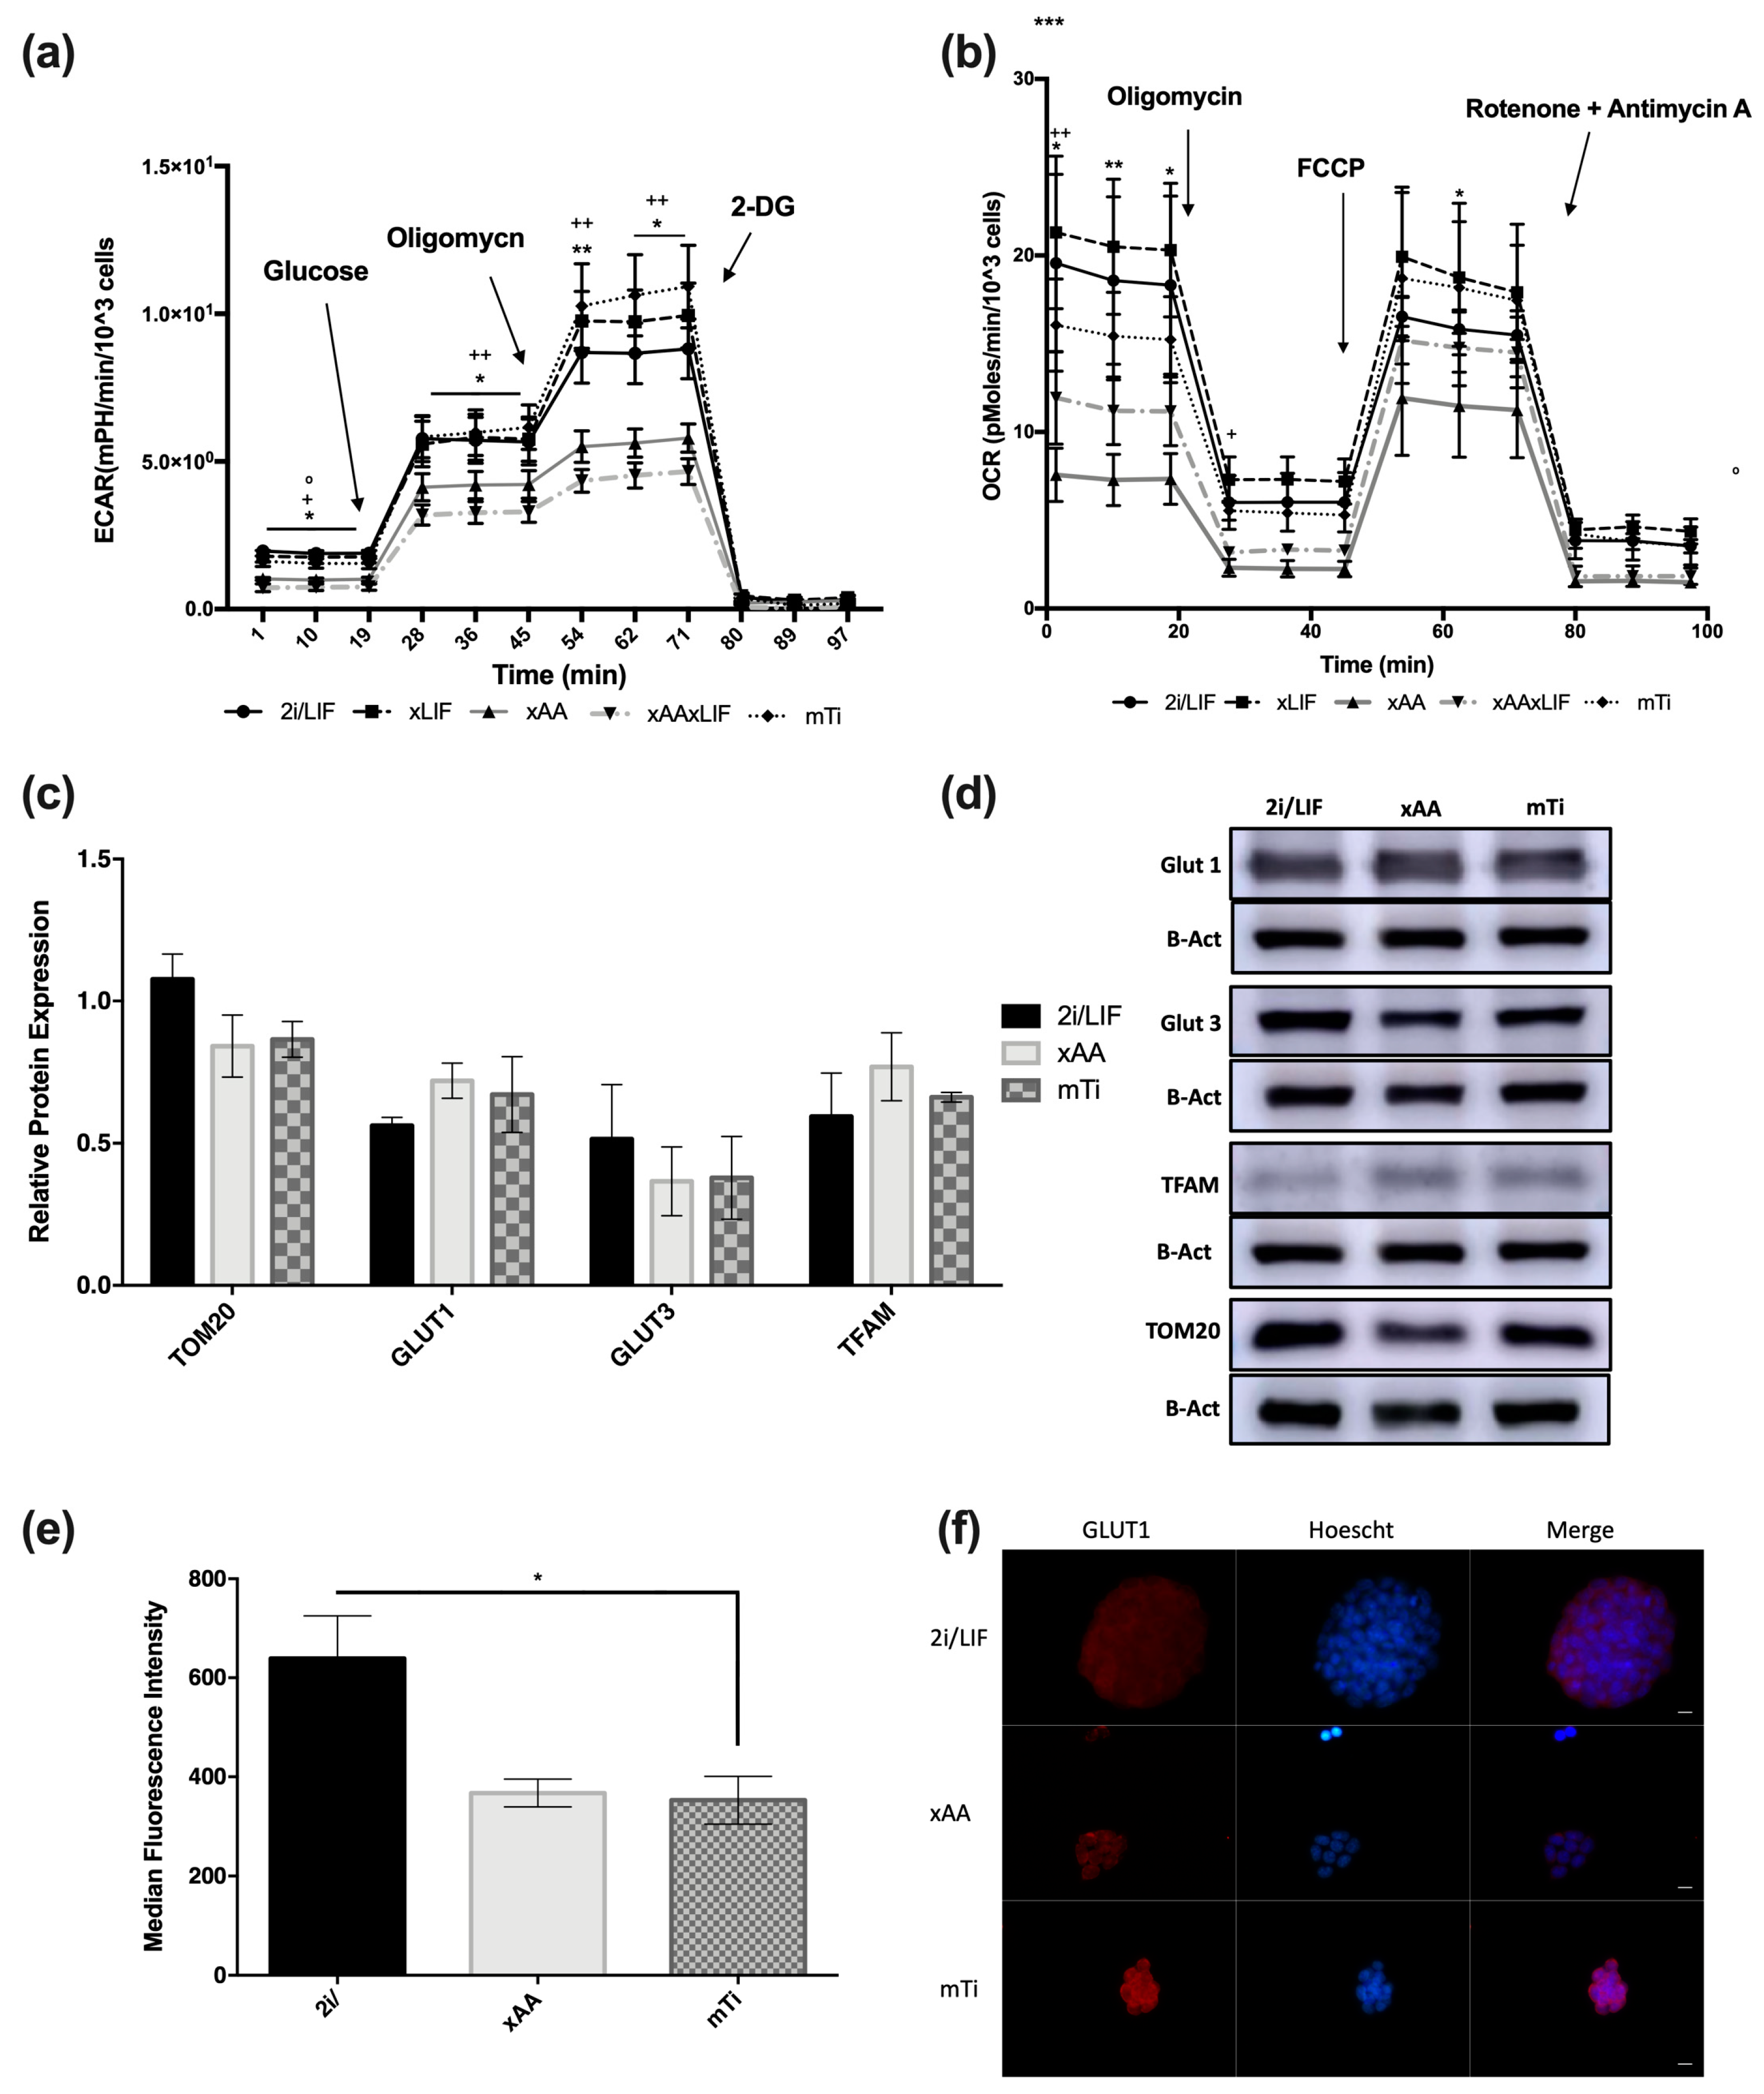
3.3. Leucine and Arginine Removal and INK128 Do Not Affect GLUT1 and GLUT3 Expression or Mitochondrial Mass but Affect GLUT1 Cellular Distribution

Metabolism is one of the key cellular processes regulated by the mTOR pathway [7,8]. In our previous work [9], we showed that the absence of arginine and leucine decreased metabolic activity in terms of both glycolysis and oxidative respiration [12]. In order to compare the 2i/LIF, xLIF, xAAxLIF, and mTi conditions used in this work, we used a Seahorse XF assay to measure the extracellular acidification rate (ECAR) and the cell respiration oxidative assay to measure the oxygen consumption rate (OCR). As expected, the overall glycolysis profiles of xAA and xAAxLIF cells were clearly decreased in comparison with cells in 2i/LIF and xLIF, while the glycolytic profile of mTi cells was similar to cells cultured in the 2i/LIF and xLIF conditions (Figure 3a). Furthermore, the global OXPHOS of cells cultured in the absence of arginine and leucine was decreased, and a similar trend was observed in cells incubated with INK128 (Figure 3b), consistent with published data [9,12]. In fact, leucine- and arginine-starved cells displayed low pyruvate uptake, accompanied by low lactate production [9], which was also observed in the mTi condition, including a low glucose uptake by naïve mESCs when incubated with mTi [12]. Given that the glucose transporter (GLUT) content and turnover in the cell plasma membrane can be dependent on mTOR activity according to leucine availability [13,14], as well as mitochondrial turnover [14], we assessed whether our experimental conditions caused an imbalance in the protein expression of GLUT1 and GLUT3, the predominant isoforms of GLUTs in mESCs [15,16], and whether mitochondrial mass was affected. To determine the mitochondrial mass, we evaluated the protein expression of TOM20 and TFAM and found it to be similar in all conditions (Figure 3c,d), although there was a decreased signal in the fluorescence-based Mitotracker Green assay for the mTi and xAA conditions (Figure 3e). The protein expression of GLUT1 and GLUT3 did not change (Figure 3c,d); however, a dotted staining pattern for GLUT1 was observed surrounding the nuclei of cells cultured under the xAA and mTi conditions, suggesting transporter internalization, while the staining in 2i/LIF suggests a plasma membrane location (Figure 3f). Altogether, our data suggest that the metabolic effects caused by the absence of leucine and arginine may be due to changes in glucose transporter location rather than their expression. Furthermore, these culture conditions did not significantly alter mitochondrial mass.

4. Discussion

Inhibition of the mTOR pathway with INK128 was previously shown to mimic embryonic diapause induction in both mouse embryos and mESCs, triggering a paused-pluripotency-like state in mESC in vitro [4]. Diapause is a naturally reversible process, and exiting from this state occurs when proper conditions for further embryo development are present [17], which is also a characteristic of paused-pluripotent stem cells upon the removal of the mTOR inhibitor [4]. Moreover, leucine and arginine availability has been linked to the regulation of diapause, given that the withdrawal of these amino acids from embryo culture media arrests embryo development in vitro in an mTOR-dependent fashion. However, these studies focused on trophoblast outgrowth [18,19,20,21], not pluripotent stem cells. In fact, data from our previous work showed that leucine and arginine withdrawal from the naïve mESC culture medium does not affect pluripotency, although it is able to induce some of the features observed in paused pluripotency [9]. The question remaining from this previous study concerned the involvement of the mTOR pathway, as inhibited by INK128, and this issue was the goal of the present work.
INK128 (mTi) directly inhibits mTOR by competing for its ATP-binding site [22] and, as noted above, has been suggested to induce the paused-pluripotent state [4,23]. Its impact on cell proliferation and the cell cycle was noticeable, mainly resulting in fewer cells in the G2/M phase, as previously reported [4]. When directly comparing the effect of the mTOR inhibitor and the absence of leucine and arginine, the latter condition was clearly more effective in inducing quiescence. Recently, amino-acid-starved mESCs showed paused pluripotency through mTOR modulation via the LKB1/AMP/AMPK axis [23]. In this work, cells cultured with the INK128 inhibitor displayed similar patterns to cells grown in a regular medium or without LIF in terms of glycolytic function, in accordance with what has been previously reported [16]. Moreover, the glucose transporter content and turnover in the cell plasma membrane can be dependent on mTOR activity [13,14]. Although the protein content of the predominant isoforms of GLUTs, GLUT1 and GLUT3, was not affected in mESCs [15,16], the dotted pattern of GLUT1 staining suggested that its location within the cell is cytoplasmic, stressing the notion that metabolism is a central part in the effects of mTi and leucine and arginine removal in mESCs, as previously suggested [9].
LIF has been shown to downregulate the mTOR pathway in pluripotent stem cells [24]. However, naïve mESCs are optimally cultured in a medium containing 2i/LIF, and LIF is critical for embryo implantation, as well as for restarting development after diapause [25,26]. Therefore, we intended to determine whether LIF has a role in either the entry into a paused-pluripotent state or in its exit. In our culture system, LIF does not seem to be essential for cell proliferation or viability, consistent with the previous literature [6,27,28]. Interestingly, it also does not seem to play any relevant role in the effects induced by leucine and arginine withdrawal.
Finally, we were interested in evaluating the status of the mTOR pathway in response to the absence of leucine and arginine. For this purpose, the direct downstream targets of mTORC, 4EBP1, and S6K1, as well as the direct downstream target of mTORC2, AKT, were analyzed, as were their phosphorylated forms [29]. Interestingly, in our hands, the mRNA expression of mTOR, 4EBP1, S6K1, and Raptor did not change in the absence of leucine and arginine. The same was true for the protein content of 4EBP1 and its phosphorylated form, even in the presence of INK128. These results suggest that the paused-pluripotency features observed in the absence of leucine and arginine are independent of canonical INK128-driven mTOR signaling. Therefore, this possibility should be considered in further experiments, and mTOR inhibition when using INK128 should always be confirmed and not merely assumed when INK128 is present in the culture medium. In our previous work, the inhibitor was tested in a different pluripotency culture system, and the concentration used was also twice as high as the one used in this study [4,23]; thus, the effect of INK128 on mTOR inhibition may be dose-independent [12]. Interestingly, the protein levels of S6K1 and AKT were also similar in both conditions. However, the phosphorylated forms of these targets were not detected in our protein extracts. Given that the positive controls used were indeed positive for each target, this seems to suggest that this signaling mechanism may not be essential for naïve ESCs’ paused pluripotency. In fact, in naïve human ESCs, S6K1 levels are reduced, and they increase during differentiation [30,31], possibly as a mechanism to decrease translation, preventing the loss of cell identity. These are interesting, if unexpected, results that should be further explored in future work. Moreover, the potential role of additional amino acids besides leucine and arginine in inducing and regulating paused pluripotency could be studied, as this process still remains, to some extent, a biochemical black box. We believe that this constitutes a promising approach for unveiling the powerful potential of nutrients as molecular modulators of cell status.

Author Contributions

Conceptualization, B.C. and J.R.-S.; methodology, B.C.; formal analysis, B.C. and M.I.S., investigation, B.C. and M.I.S.; resources, J.R.-S.; writing—original draft preparation, B.C.; writing—review and editing, J.R.-S.; visualization, J.R.-S.; supervision, J.R.-S.; project administration, J.R.-S.; funding acquisition, J.R.-S. All authors have read and agreed to the published version of the manuscript.

Funding

This work was supported by Fundação para a Ciência e Tecnologia (FCT), Portugal, for the PhD scholarships attributed to B.C. (SFRH/BD/144150/2019) and M.I.S. (SFRH/BPD/119367/2016). Funding was also provided by the STEM@REST Project (CENTRO-01-0145-FEDER-028871). Additional funding was provided by the European Regional Development Fund (ERDF) through the Centro 2020 Regional Operational Programme: project CENTRO-01-0145-FEDER-000012-HealthyAging2020, the COMPETE 2020—Operational Programme for Competitiveness and Internationalisation, and the Portuguese national funds via FCT—Fundação para a Ciência e a Tecnologia, I.P.: project POCI-01-0145-FEDER-007440.

Institutional Review Board Statement

Not applicable.

Informed Consent Statement

Not applicable.

Data Availability Statement

Data is contained within the article.

Acknowledgments

The authors would like to acknowledge the members of the Biology of Reproduction and Stem Cells research group at the Center for Neuroscience and Cell Biology for the discussion and constructive feedback related to this work. We also thank Luís Mesquita and Henriqueta Silva from the Central Laboratory for Sequencing and Functional Genomics at the Faculty of Medicine of the University of Coimbra for kindly providing the CFX96 Touch Real-Time PC Detection System that was used throughout this work.

Conflicts of Interest

The authors declare no conflict of interest.

References

  1. Renfree, M.B.; Fenelon, J.C. The enigma of embryonic diapause. Development 2017, 144, 3199–3210. [Google Scholar] [CrossRef] [PubMed]
  2. Fu, Z.; Wang, B.; Wang, S.; Wu, W.; Wang, Q.; Chen, Y.; Kong, S.; Lu, J.; Tang, Z.; Ran, H.; et al. Integral Proteomic Analysis of Blastocysts Reveals Key Molecular Machinery Governing Embryonic Diapause and Reactivation for Implantation in Mice1. Biol. Reprod. 2014, 90, 52. [Google Scholar] [CrossRef] [PubMed]
  3. Scognamiglio, R.; Cabezas-Wallscheid, N.; Thier, M.C.; Altamura, S.; Reyes, A.; Prendergast, M.; Baumgärtner, D.; Carnevalli, L.S.; Atzberger, A.; Haas, S.; et al. Myc Depletion Induces a Pluripotent Dormant State Mimicking Diapause. Cell 2016, 164, 668–680. [Google Scholar] [CrossRef]
  4. Bulut-Karslioglu, A.; Biechele, S.; Jin, H.; Macrae, T.A.; Hejna, M.; Gertsenstein, M.; Song, J.S.; Ramalho-Santos, M. Inhibition of mTOR induces a paused pluripotent state. Nature 2016, 540, 119–123. [Google Scholar] [CrossRef] [PubMed]
  5. Chen, J.R.; Cheng, J.-G.; Shatzer, T.; Sewell, L.; Hernandez, L.; Stewart, C.L. Leukemia Inhibitory Factor Can Substitute for Nidatory Estrogen and Is Essential to Inducing a Receptive Uterus for Implantation but Is Not Essential for Subsequent Embryogenesis. Endocrinology 2000, 141, 4365–4372. [Google Scholar] [CrossRef] [PubMed]
  6. Stewart, C.L.; Kaspar, P.; Brunet, L.J.; Bhatt, H.; Gadi, I.; Köntgen, F.; Abbondanzo, S.J. Blastocyst implantation depends on maternal expression of leukaemia inhibitory factor. Nature 1992, 359, 76–79. [Google Scholar] [CrossRef] [PubMed]
  7. Laplante, M.; Sabatini, D.M. mTOR Signaling in Growth Control and Disease. Cell 2012, 149, 274–293. [Google Scholar] [CrossRef] [PubMed]
  8. Correia, B.; Sousa, M.I.; Ramalho-Santos, J. The mTOR pathway in reproduction: From gonadal function to developmental coordination. Reproduction 2020, 159, R173–R188. [Google Scholar] [CrossRef]
  9. Correia, B.; Sousa, M.I.; Branco, A.F.; Rodrigues, A.S.; Ramalho-Santos, J. Leucine and Arginine Availability Modulate Mouse Embryonic Stem Cell Proliferation and Metabolism. Int. J. Mol. Sci. 2022, 23, 14286. [Google Scholar] [CrossRef]
  10. Nicola, N.A.; Babon, J.J. Leukemia inhibitory factor (LIF). Cytokine Growth Factor Rev. 2015, 26, 533–544. [Google Scholar] [CrossRef]
  11. Hara, K.; Yonezawa, K.; Weng, Q.-P.; Kozlowski, M.T.; Belham, C.; Avruch, J. Amino Acid Sufficiency and mTOR Regulate p70 S6 Kinase and eIF-4E BP1 through a Common Effector Mechanism. J. Biol. Chem. 1998, 273, 14484–14494. [Google Scholar] [CrossRef] [PubMed]
  12. Sousa, M.I.; Correia, B.; Rodrigues, A.S.; Ramalho-Santos, J. Metabolic characterization of a paused-like pluripotent state. Biochim. Biophys. Acta (BBA) Gen. Subj. 2020, 1864, 129612. [Google Scholar] [CrossRef] [PubMed]
  13. Tian, Y.; Ding, Y.; Liu, J.; Heng, D.; Xu, K.; Liu, W.; Zhang, C. Nitric Oxide–Mediated Regulation of GLUT by T3 and Follicle-Stimulating Hormone in Rat Granulosa Cells. Endocrinology 2017, 158, 1898–1915. [Google Scholar] [CrossRef]
  14. Schnuck, J.K.; Sunderland, K.L.; Gannon, N.P.; Kuennen, M.R.; Vaughan, R.A. Leucine stimulates PPARβ/δ-dependent mitochondrial biogenesis and oxidative metabolism with enhanced GLUT4 content and glucose uptake in myotubes. Biochimie 2016, 128–129, 1–7. [Google Scholar] [CrossRef] [PubMed]
  15. Na Suh, H.; Han, H.J. Fibronectin-induced VEGF receptor and calcium channel transactivation stimulate GLUT-1 synthesis and trafficking through PPARγ and TC10 in mouse embryonic stem cells. Stem Cell Res. 2013, 10, 371–386. [Google Scholar] [CrossRef] [PubMed]
  16. Tonack, S.; Rolletschek, A.; Wobus, A.M.; Fischer, B.; Santos, A.N. Differential expression of glucose transporter isoforms during embryonic stem cell differentiation. Differentiation 2006, 74, 499–509. [Google Scholar] [CrossRef] [PubMed]
  17. Fenelon, J.C.; Renfree, M.B. The history of the discovery of embryonic diapause in mammals. Biol. Reprod. 2018, 99, 242–251. [Google Scholar] [CrossRef] [PubMed]
  18. Smith, E.M.; Finn, S.G.; Tee, A.R.; Browne, G.J.; Proud, C.G. The Tuberous Sclerosis Protein TSC2 Is Not Required for the Regulation of the Mammalian Target of Rapamycin by Amino Acids and Certain Cellular Stresses. J. Biol. Chem. 2005, 280, 18717–18727. [Google Scholar] [CrossRef] [PubMed]
  19. Murakami, M.; Ichisaka, T.; Maeda, M.; Oshiro, N.; Hara, K.; Edenhofer, F.; Kiyama, H.; Yonezawa, K.; Yamanaka, S. mTOR Is Essential for Growth and Proliferation in Early Mouse Embryos and Embryonic Stem Cells. Mol. Cell. Biol. 2004, 24, 6710–6718. [Google Scholar] [CrossRef]
  20. Boroviak, T.; Loos, R.; Bertone, P.; Smith, A.; Nichols, J. The ability of inner-cell-mass cells to self-renew as embryonic stem cells is acquired following epiblast specification. Nat. Cell Biol. 2014, 16, 513–525. [Google Scholar] [CrossRef]
  21. Gwatkin, R.B.L. Amino acid requirements for attachment and outgrowth of the mouse blastocystin vitro. J. Cell. Physiol. 1966, 68, 335–343. [Google Scholar] [CrossRef]
  22. Naeslund, G. The Effect of Glucose-, Arginine- and Leucine-deprivation on Mouse Blastocyst Outgrowth In Vitro. Upsala J. Med. Sci. 1979, 84, 9–20. [Google Scholar] [CrossRef] [PubMed]
  23. Martin, P.M. Amino Acid Transport Regulates Blastocyst Implantation. Biol. Reprod. 2003, 69, 1101–1108. [Google Scholar] [CrossRef] [PubMed]
  24. González, I.M.; Martin, P.M.; Burdsal, C.; Sloan, J.L.; Mager, S.; Harris, T.; Sutherland, A.E. Leucine and arginine regulate trophoblast motility through mTOR-dependent and independent pathways in the preimplantation mouse embryo. Dev. Biol. 2012, 361, 286–300. [Google Scholar] [CrossRef] [PubMed]
  25. Guo, Y.; Kwiatkowski, D.J. Equivalent Benefit of Rapamycin and a Potent mTOR ATP-Competitive Inhibitor, MLN0128 (INK128), in a Mouse Model of Tuberous Sclerosis. Mol. Cancer Res. 2013, 11, 467–473. [Google Scholar] [CrossRef] [PubMed]
  26. Hussein, A.M.; Wang, Y.; Mathieu, J.; Margaretha, L.; Song, C.; Jones, D.C.; Cavanaugh, C.; Miklas, J.W.; Mahen, E.; Showalter, M.R.; et al. Metabolic Control over mTOR-Dependent Diapause-like State. Dev. Cell 2020, 52, 236–250.e7. [Google Scholar] [CrossRef] [PubMed]
  27. Cherepkova, M.Y.; Sineva, G.S.; A Pospelov, V. Leukemia inhibitory factor (LIF) withdrawal activates mTOR signaling pathway in mouse embryonic stem cells through the MEK/ERK/TSC2 pathway. Cell Death Dis. 2016, 7, e2050. [Google Scholar] [CrossRef]
  28. Nichols, J.; Chambers, I.; Taga, T.; Smith, A. Physiological rationale for responsiveness of mouse embryonic stem cells to gp130 cytokines. Development 2001, 128, 2333–2339. [Google Scholar] [CrossRef]
  29. Ying, Q.-L.; Wray, J.; Nichols, J.; Batlle-Morera, L.; Doble, B.; Woodgett, J.; Cohen, P.; Smith, A. The ground state of embryonic stem cell self-renewal. Nature 2008, 453, 519–523. [Google Scholar] [CrossRef]
  30. Wray, J.; Kalkan, T.; Smith, A.G. The ground state of pluripotency. Biochem. Soc. Trans. 2010, 38, 1027–1032. [Google Scholar] [CrossRef]
  31. Wray, J.; Kalkan, T.; Gomez-Lopez, S.; Eckardt, D.; Cook, A.; Kemler, R.; Smith, A. Inhibition of glycogen synthase kinase-3 alleviates Tcf3 repression of the pluripotency network and increases embryonic stem cell resistance to differentiation. Nat. Cell Biol. 2011, 13, 838–845. [Google Scholar] [CrossRef] [PubMed]
Figure 1. mTi and leucine and arginine absence do not interfere with pluripotency while affecting naïve mESC proliferation. (a) Growth of mESCs cultured in 2i/LIF, xLIF, xAA, xAAxLIF, and mTi (INK128). Cell counting was performed every 24 h. Recovery started after 48 h time point when medium was replaced (2i/LIF: n = 10); (xLIF: n = 8); (xAAxLIF: n = 8). (b) Viability/cell death was assessed for 2i/LIF and mTi after 48 h of culture using Annexin V and PI and analyzed by flow cytometry. Data displaying a representative dot plot from Annexin V/PI data obtained by flow cytometry and the graph of the mean percentage of cells gated (n = 3/group). (c) Cell cycle analysis with PI of naïve mouse embryonic stem cells after 24 and 48 h of culture in each treatment (2i/LIF 24 h: n = 6/phase; 2i/LIF 48 h: n = 9/phase); (xLIF: n = 8/phase); (xAA: n = 9/phase); (xAAxLIF 24 h: n = 8/phase; xAAxLIF 48 h: n = 9/phase); (mTi 24 h: n = 8/phase; mTi 48 h: n = 9/phase). (d) Cell cycle analysis of naïve mouse embryonic stem cells during recovery at 72 h and 96 h, when the regular culture conditions were reestablished (see Materials and Methods) (2i/LIF 72 h: n = 9/phase; 2i/LIF 96 h: n = 8/phase); (xLIF 72 h: n = 9/phase; xLIF 96 h: n = 8/phase); (xAA 72 h: n = 9/phase; xAA 96 h: n = 8/phase); (xAAxLIF 72 h: n = 9/phase; xAAxLIF 96 h: n = 8/phase); (mTi 72 h: n = 9/phase; mTi 96 h: n = 8/phase). (e) Panel of fluorescence microscopy for OCT4-stained colonies after 48 h culture in each experimental condition (magnification 630×). (f) RT-PC evaluation of markers of mESC pluripotency, such as Esrrb, Nanog, Oct4, and Rex1 (2i/LIF, xLIF, xAA, xAAxLIF, and mTi). Gene expression levels were normalized to beta-Actin (Rex1: n = 3/group; Esrrb, Nanog, Oct4: n = 4/gene/group). Results are presented as mean ± SEM. Data were considered statistically significant when * p < 0.05, ** p < 0.01, and *** p < 0.001.
Biochem 03 00012 g001
Figure 2. Effects of leucine and arginine withdrawal are independent of mTORC1 signaling. (a) RT-PCR evaluation of mRNA levels of mTORC1-related gene expression of Raptor, 4EBP1, MTOR, and S6K1 during the recovery period. Gene expression was normalized to the respective beta-Actin level. (Raptor: n = 4/group; 4EBP1, MTOR, and S6K1: n = 3/group). (b) Quantification of protein expression of AKT and S6K1 after 48 h treatments. Results are normalized to CALNEXIN levels (AKT: n = 4/group; S6K1: n = 6/group). (c) A representative immunoblot membrane for AKT, S6K1, and CALNEXIN expression is shown. (d) Western blot analysis of extracts from Jurkat cells + Calcyculin A (+Ctr) and Jurkat cells + LY29400 (-Ctr) and naïve mouse ESCs cultured in regular medium using the rabbit anti-p-S6K1 antibody (Thr389) (Cat. No: #9234; Cell Signaling, 1:750), as indicated. (e) Western blot analysis of extracts from Jurkat cells + Calcyculin A (+Ctr) and Jurkat cells + LY29400 (-Ctr) and naïve mouse ESCs cultured in regular medium using the rabbit anti-p-AKT antibody (Ser473) (Cat. No: #4058, Cell Signaling; 1:1000), as indicated. (f) Quantification of protein expression of 4EBP1 and phosphorylated 4EBP1 (pThr37/46) after 48 h treatments. Results are normalized to CALNEXIN levels, and the p4EBP1/4EBP1 ratio was calculated after normalization of both targets to the loading control (n = 4/protein/group). (g) Representative membrane images for 4EBP1, p4EBP1, and CALNEXIN. Results are presented as mean ± SEM.
Biochem 03 00012 g002
Figure 3. GLUT1 and GLUT3 expression is unchanged after mTi or removal of arginine and leucine, but GLUT1 distribution is altered. (a) Glycolytic metabolism analysis with three ECAR measurements before and after each compound injection using the Seahorse FX analyzer on cells pre-conditioned in 2i/LIF, xLIF, xAA, xAAxLIF, and mTi conditions. The compound injections started with glucose (10 mM), then Oligomycin (1 μM), and ended with 2-deoxyglucose (100 mM) (n = 4/group). Statistical significance: * differences between 2i/LIF and xAA; + differences between 2i/LIF and xAAxLIF; ° differences between 2i/LIF and mTi. (b) Oxidative profile analysis with three OCR measurements before and after each compound injection using the Seahorse FX analyzer. The compound injections were initiated by adding Oligomycin (5 μM), followed by FCCP (2.5 mM) and finally Rotenone + Antimycin A (2.5 mM) (n = 3/group). * Differences between 2i/LIF and xAA; + differences between 2i/LIF and xAAxLIF. (c) Quantification of protein expression of TOM20, GLUT1, GLUT3, and TFAM was carried out using Western blot after 48 h. Results are normalized to b-ACTIN levels (n = 4/group). (d) Immunoblot membrane images for TOM20, GLUT1, GLUT3, and TFAM, as well as beta-ACTIN for control purposes, are shown, representing typical data obtained. (e) Mitotracker Green median fluorescence intensity measures by flow cytometry after 48 h incubation in each experimental condition. (f) Panel of fluorescence microscopy for GLUT1-stained colonies after 48 h culture in each experimental condition (scale bar 10 um, magnification 630×). Results are presented as mean ± SEM, and statistical significance is considered when * p < 0.05, ** p < 0.01, and *** p < 0.001.
Biochem 03 00012 g003
Disclaimer/Publisher’s Note: The statements, opinions and data contained in all publications are solely those of the individual author(s) and contributor(s) and not of MDPI and/or the editor(s). MDPI and/or the editor(s) disclaim responsibility for any injury to people or property resulting from any ideas, methods, instructions or products referred to in the content.

