Article

DoseMRT: A Software Package for Individualised Monte Carlo Dose Calculations of Synchrotron-Generated Microbeam Radiation Therapy

1
Centre for Medical Radiation Physics, University of Wollongong, Wollongong, NSW 2522, Australia
2
Illawarra Health and Medical Research Institute, University of Wollongong, Wollongong, NSW 2522, Australia
3
Imaging and Medical Beamline, Australian Nuclear Science and Technology Organisation-Australian Synchrotron, Kulin Nation, Clayton, VIC 3168, Australia
4
Molecular Horizons, School of Chemistry and Molecular Bioscience, University of Wollongong, Wollongong, NSW 2522, Australia
5
Department of Radiation Oncology, Prince of Wales Hospital, Randwick, NSW 2031, Australia
*
Author to whom correspondence should be addressed.
Radiation 2023, 3(2), 123-137; https://doi.org/10.3390/radiation3020011
Submission received: 11 April 2023 / Revised: 16 June 2023 / Accepted: 16 June 2023 / Published: 20 June 2023

Abstract

:

Simple Summary

A new software package, DoseMRT has been developed and validated for use in synchrotron-generated broad beam and microbeam radiation treatment fields. This package uses Geant4 Monte Carlo dose calculations at the core of a novel integrated workflow intended for use in a pre-clinical workflow. DoseMRT allows for rudimentary treatment planning and dose calculations in geometry defined by individual patient computed tomography scans. This software is validated in anatomically complex phantoms and demonstrated as used in an in vivo animal trail at the Australian Synchrotron.

Abstract

This work describes the creation and experimental validation of D o s e M R T , a new software package, and its associated workflow for dose calculations in synchrotron-generated broad beam and microbeam radiation treatment fields. The D o s e M R T software package allows users to import CT DICOM datasets into Geant4 for Monte Carlo dose calculations. It also provides basic treatment planning capabilities, simplifying the complexity of performing Geant4 simulations and making our Monte Carlo dose calculation algorithm accessible to a broader range of users. To demonstrate the new package, dose calculations are validated against experimental measurements performed in homogeneous water tank phantoms and the anatomically complex Alderson Radiotherapy Phantom for both broad-beam and microbeam configurations. Additionally, D o s e M R T is successfully utilised as the primary method for patient-specific treatment prescription in an in vivo experiment involving tumour-bearing rats at the Imaging and Medical Beamline of the Australian Synchrotron.

1. Introduction

Synchrotron microbeam radiation therapy (MRT) is a next-generation radiation treatment modality currently under preclinical development. The use of spatially fractionated radiation at extremely high dose rates has been proven to increase the dose tolerance of healthy tissue over that of cancerous tissue [1], greatly extending the scope of treatment options, particularly near radiosensitive tissues. As synchrotron facilities continue to see increased use for in vitro and in vivo experiments [2], it is essential to perform dose calculations in models with a geometry that matches the anatomical complexity of the target. Quality assurance and the development of treatment protocols [3] must continue to converge on the best clinical practice if MRT is to progress toward human clinical trials.
Due to the steep dose gradients on a micrometer scale and relatively low beam energy, no commercial treatment planning system (TPS) is suitable for MRT dose calculations without additional modification. Some research groups have successfully implemented customised dose calculation engines into commercial treatment planning systems, such as Eclipse (v11.0.31) [4,5,6], VIRTUOS [7], and 3DSlicer [8]. Other groups have used the PENELOPE Monte Carlo code system to develop dose engines in the absence of a commercial TPS [9,10]. As none of these have been made available to the community, each group must develop its own software package and methodology for synchrotron-generated treatments.
In this work, we describe D o s e M R T , a new software package that performs dose calculations in realistic geometries, based on the Monte Carlo simulation code Geant4 [11,12,13].
The D o s e M R T software package allows users to import CT DICOM datasets, segment the volume into unique materials, and import the segmented volume into Geant4 for dose calculations. The package, built specifically for the Imaging and Medical Beamline (IMBL) of the Australian Synchrotron, allows for simulations anywhere along the beamline, with all interactions from the generation of synchrotron radiation, to energy deposition, handled entirely within Geant4. The inclusion of a custom graphical user interface (GUI) assists the user in defining the simulation setup, without the need for in-depth Geant4 specific knowledge. The software package builds upon the comprehensive G4IMBL beamline model from Dipuglia et al. [14] for synchrotron radiation photon production and transport, and performs dose simulations in a 3D voxelised target as demonstrated by Large et al. [15]. D o s e M R T is designed to work within the clinical imaging workflow previously described by Paino et al. [16] and interface with the existing software package S y n c M R T [17] for image guidance and treatment delivery.
A review by Keshmiri et al. [10] highlights many limitations of existing simulation solutions, including a lack of multi-directional treatment fields [9], restricted field shapes [9], lack of photon polarisation [7] and limited scoring resolution [5]. D o s e M R T and its entirely Geant4 calculation approach are not subject to any of these limitations.
The D o s e M R T is first validated against standard clinical dosimeters in a homogeneous water tank phantom, then in an Alderson Radiation Therapy Phantom (RSD, United States), which is a more complex, realistic approximation of a human head.
Finally, D o s e M R T is applied to an in vivo experiment involving the treatment of tumour-bearing rats. This paper demonstrates D o s e M R T working within a pre-clinical trial, encompassing CT imaging, Geant4-based dose calculations, dose prescription, and image-guided patient alignment, calculating individualised treatment plans for each rat patient in the study.
The software package also produces an analysis of the treatment plan for review prior to treatment. Excerpts from an exemplary treatment analysis report are presented.

2. Methods

2.1. Simulation Configuration

Figure 1 shows the D o s e M R T software package. Synchrotron radiation production and transport in the beam line, and dose calculation in the target are performed with the Monte Carlo code Geant4 (version 10.6 patch 2). The EM physics list E m S t a n d a r d P h y s i c s O p t i o n 4 was activated, enabling the cross sections for polarised photons [18]. The dose is calculated in digital phantoms produced from patient-specific CT DICOM datasets. The Geant4-based dose engine is interfaced with other software packages responsible for image-guided patient alignment [17], and for treatment delivery [17]. D o s e M R T is designed to work within the existing workflow of in vivo MRT treatment delivery as described in [16,19].

2.1.1. Stage I: Synchrotron Radiation Production

Synchrotron radiation production and photon transport are simulated utilizing the previously validated G4IMBL simulation [14]. This stage begins with high-energy electrons in a storage ring and follows the production of synchrotron radiation as electrons traverse the strong magnetic field of the wiggler. Photons are then transported through all beamline optics and filtration up to a scoring plane approximately 10 cm before the surface of the target on the treatment stage. For MRT treatments, a tungsten multi-slit collimator (MSC) is constructed to intercept the beam, dividing it into an array of quasi-parallel, spatially fractionated microbeams. For broad-beam treatments, the MSC is removed, and the beam propagates undisturbed [14,20].
The position, momentum, polarisation, and energy of all photons that traverse the scoring plane are stored in a 2D phase space file (PSF) for later use. By simulating the entire beamline, the incident beam can be sampled at any point between the photon source and the end of Hutch 3B [21], 136 m away. After selecting the experimental parameters including the location of the treatment stage, wiggler field strength, and filtration modality, a single PSF is produced and used for all patient simulations thereafter. A user may also import a PSF created by other means, or use the Geant4 native particle gun for the photon source. To simulate the complexity of an anatomical target, more complex geometry is implemented in Stage II of the Simulation, described in Section 2.1.2.

2.1.2. Stage II: Dose Calculation

Stage II of the simulation is built upon the Geant4 ICRP110 HumanPhantoms Advanced Example [15]. This stage defines the final shape dimensions of the treatment field and the calculation of the dose distribution in the digital phantom. The ICRP110 HumanPhantoms Advanced Example was used to provide the framework to import a voxelised digital phantom and record the dose with the phantom, both in a voxelised scoring mesh, as well as the total dose delivered to each tissue defined in the digital phantom [15].
The voxel resolution of the resulting digital phantoms tissues is dependent upon the resolution of the original CT scan; however, the dose scoring resolution can be chosen independently. This allows for the creation of 3D dose maps at any spatial resolution, despite the conventional CT resolution being larger than the width of a microbeam (approximately 50 μ m), accommodating the steep dose gradients characteristic of MRT. The output allows for the evaluation of peak and valley regions as well as the penumbra region of each peak in a resolution as fine as the user requires (typically ≤ 10 μ m). Using the 3D array of phantom geometry organ IDs and the resulting dose map, it is possible to extract dose only in one region, or organ of interest, and produce histograms of dose per volume.
Stage I and Stage II Geant4 simulations were performed on the NCI GADI cluster. Each node on this cluster has 192 GB of ram and 2 × 24-core Intel Xenon Platinum 8274 3.2 GhZ CPUs.

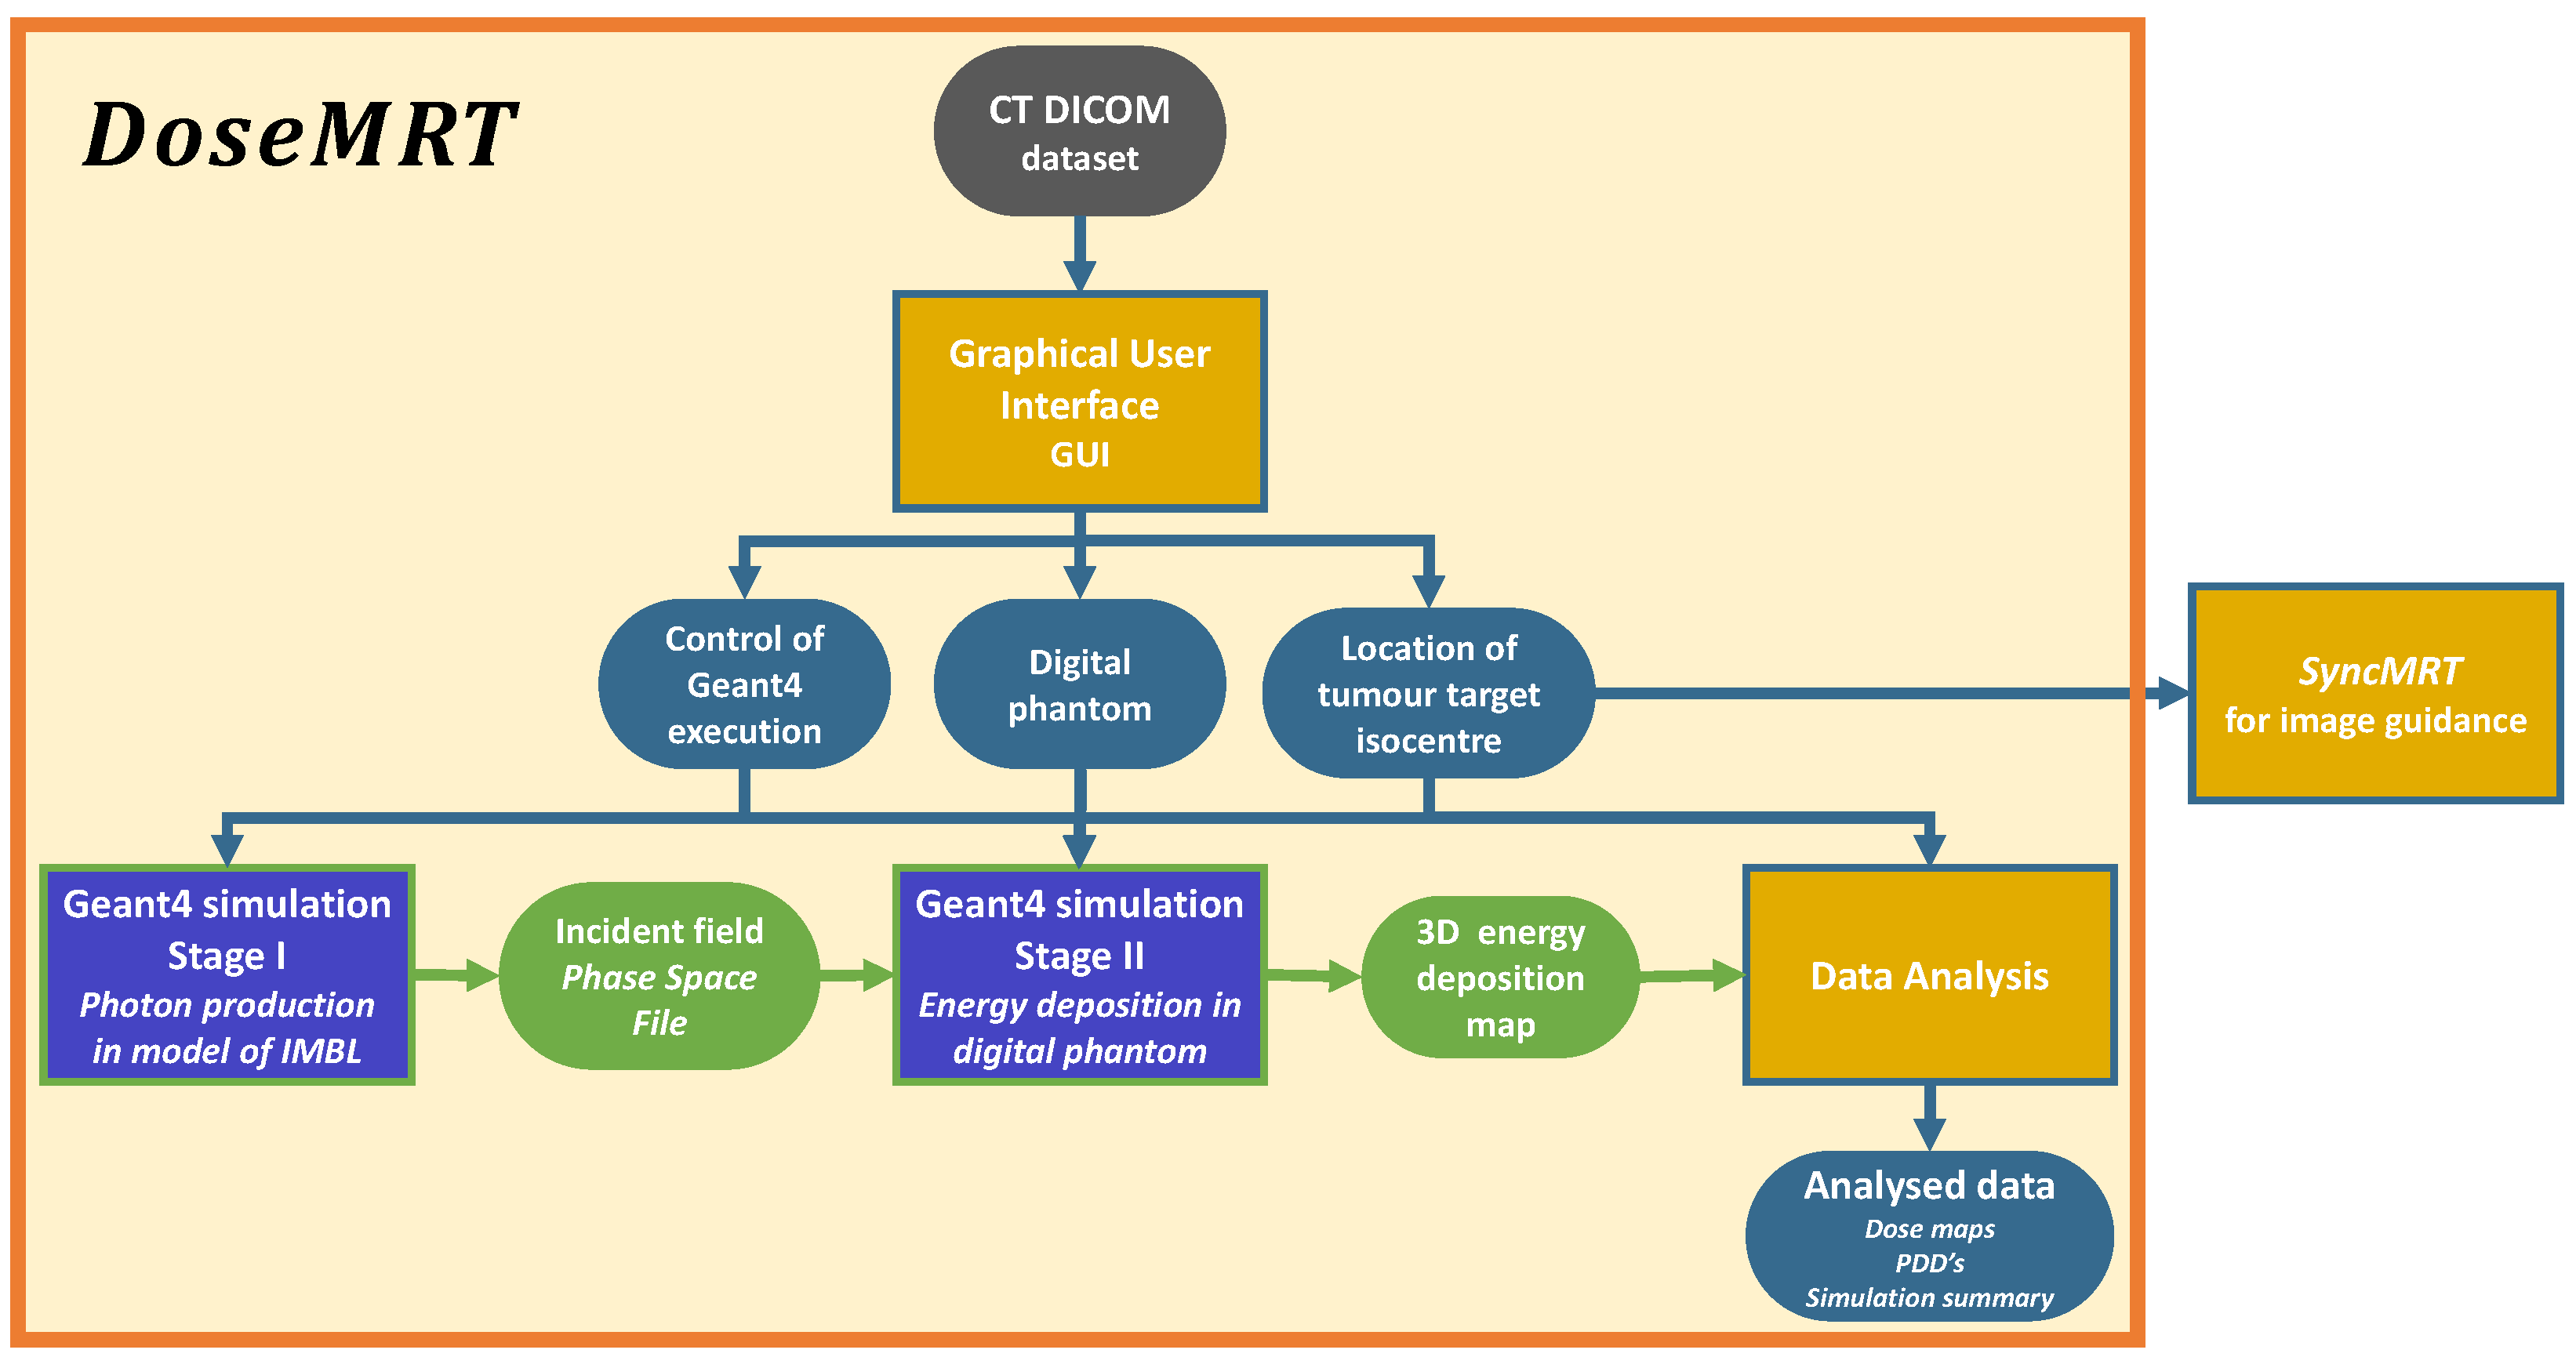
2.1.3. Graphical User Interface

The Python3 (version 3.9.7) [22] based graphical user interface (GUI) assists the user with setting up the Geant4 Stage II simulation. The GUI serves three main functions:
  • To implement the Geant4 simulation geometry based on the CT DICOM dataset.
  • To select the treatment modality and treatment angle, identify the target isocentre from two orthogonal images, threshold all unique tissues, and apply treatment margins.
  • Produce all files needed to execute the individual Geant4 dose calculation.
The treatment isocentre identified in the GUI is used as the target location in software package S y n c M R T that has become the standard for image-guided radiotherapy treatment at the Imaging and Medical Beamline (IMBL) of the Australian Synchrotron. Details of S y n c M R T are described by Barnes et al. [17], and a description of how it fits within the treatment workflow is described by Paino et al. [16].

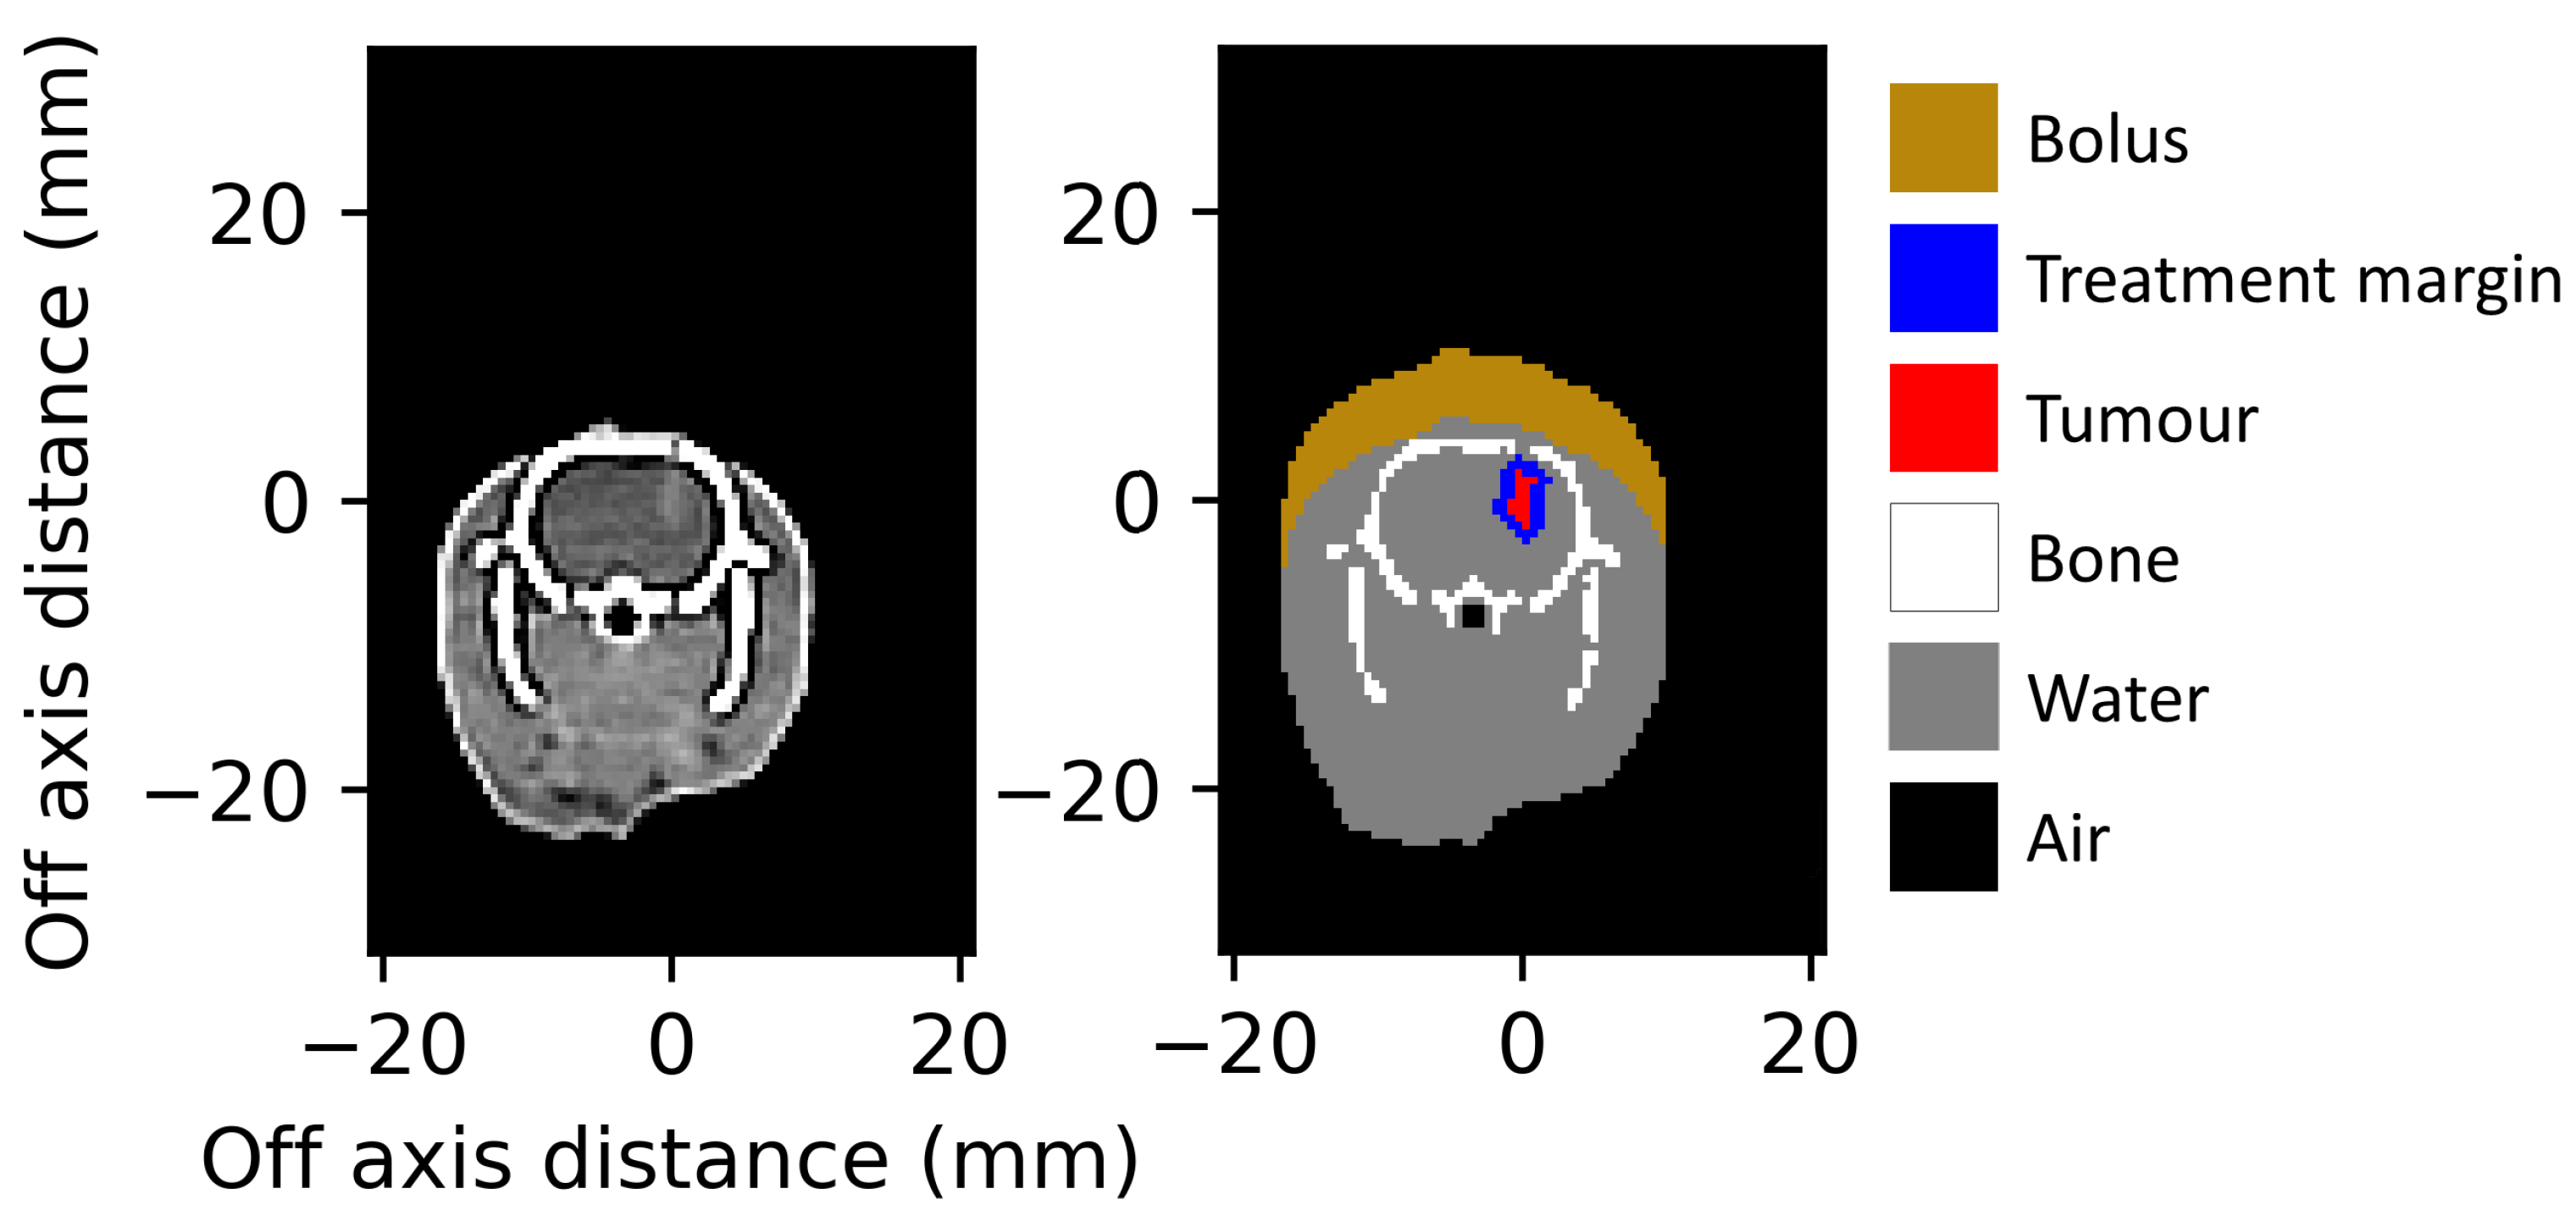
2.1.4. Tissue Segmentation

When converting the CT dataset into a digital phantom for Geant4 simulations, each voxel is assigned a unique material. D o s e M R T allows users to select from any of the 53 anatomical media (tissues) defined in the ICRP Publication 110 [23] and used in the I C R P 110 H u m a n P h a n t o m s advanced example [15]. Users may also choose to use definitions from the Geant4 Material Database, which includes a wide range of elements and NIST-defined compounds [24]. For tissues that are distinctly different and can be separated by the HU value, segmentation is performed using user-defined threshold windows (as seen in Figure 2. However, when performing in vitro experiments, even with the use of contrast agent injection before CT imaging (delivered as described in Engels et al. [19]), the distinction between the tumour and surrounding brain tissue was low (as seen in Figure 3).To facilitate the segmentation process, a custom region growing algorithm [25] was implemented. The user manually identifies the target volume (any part of the tumour) in two orthogonal slices. This point acts as the starting location (seed) for the 3D region growing algorithm. The six adjacent neighbouring voxels to the seed are checked. If they are of similar value to the seed, within a user-defined Hounsfield unit (HU) tolerance, then they are added to the identified target volume. The search over adjacent neighbours is repeated for each new voxel added to the target volume. With each new addition to the target volume, the average HU value is updated, so is not strictly limited to the value of the starting seed. By using this method, the resultant volume is guaranteed to be a single continuous volume—as one would expect given the tumour implantation method of a single direct injection (described by Engels et al. [19]).
Examples of the conversion from CT DICOM dataset to Geant4 digital phantoms are shown in Figure 2 for the conversion of the Alderson Radiotherapy Phantom, and Figure 3 for the conversion of a rat from the in vivo study demonstrating the region growing tumour segmentation.

2.1.5. Alderson Radiation Therapy DICOM Conversion to Digital Phantoms

The Alderson Radiation Therapy Phantom was imaged using a Philips Brilliance Big Bore CT scanner (at Monash Biomedical Imaging, Clayton Victoria) at 120 kVp with a slice thickness of 1.0 mm and a reconstructed voxel spacing of 0.81 × 0.81 × 1.00 mm (x, y, z axis). The CT dataset was then converted into a digital phantom for importing into Geant4. It was segmented into four materials—air, water, bone marrow, and cortical bone—each with an elemental composition and physical density as defined in the ICRP Publication 110 [23].
After converting the CT dataset into a digital phantom, the user is provided a figure such as Figure 2 for visual inspection of the digital phantom.

2.1.6. In Vivo Rat DICOM Conversion to Digital Phantoms

Rats were implanted with gliosarcoma cells as detailed by Engels et al. [19]. On day 14 after implantation, the rats were imaged using a Siemens SOMATOM go.Up CT scanner (at Monash Biomedical Imaging, Clayton Victoria) at 110 kVp with a slice thickness of 0.60 mm and a reconstructed voxel spacing of 0.52 × 0.52 × 0.30 mm3 (x, y, z axis) [16,19]. Creation of the treatment plan and Geant4 simulations using D o s e M R T must be performed in the 24 h window between imaging and image-guided MRT treatment.
The CT DICOM dataset for each rat was converted into 6 unique tissue IDs with a resolution matching that of the CT. The physical density and elemental composition assigned to the bolus, the tumour, treatment margin, and water equivalent soft tissue are all identical. When calculating dose maps, the dose to any region of interest can be separated based on tissue ID. When prescribing a dose to the tumour, the entire tumour volume including the treatment margin (here defined by user selection as 1 mm) is used.
CT DICOM datasets were acquired the day before treatment, then processed and simulated on the day of treatment. A single user was able to import and prepare each dataset for simulation in less than 10 min. Figure 3 shows a slice of the input CT DICOM dataset, and a slice of the digital phantom prepared for Geant4 simulations as presented to the user for verification before beginning dose simulations.

2.2. Experimental Dosimetry

2.2.1. Radiation Detectors

Reference dosimetry was performed using a PTW PinPoint 3D Ion Chamber (31022, Freiburg, Germany), following the IAEA TRS-398 (International Atomic Energy Agency code of practice [26]) as closely as possible. The PTW PinPoint 3D Ion Chamber has a sensitive volume of 0.016 cm3 and is certified for broad-beam field sizes as small as 20 × 20 mm2 with evidence to support its use in fields as small as 10 × 10 mm2, making it the ideal candidate for small field and small animal irradiation [27]. Measurements with the PTW PinPoint detector are corrected for the influence of temperature and pressure, polarisation, calibration of the electrometer, and ion recombination. Finally, the beam quality correction factor most similar in energy to the treatment beam (TH200 for the case of validation data in this work) supplied by the manufacturer is applied [27,28,29].
For microbeam characterisation, the PTW microDiamond (60019, Freiburg, Germany) detector was chosen and cross-calibrated to the PTW PinPoint chamber. The microDiamond has a sensitive volume of 0.004 mm3 and a minimum cross sectional area of 1.1 × 0.001 mm2 [20,30].

2.2.2. Phantom Dosimetry

Validation of the Geant4-based dose engine was first performed in a homogeneous phantom. Percentage depth dose (PDD) curves were measured using a 14 × 17 × 12 cm3 liquid water tank with the PTW PinPoint detector attached to a motorised arm, then repeated with the PTW microDiamond [2]. The space needed for the detector cable and mounting apparatus limited the depths at which each detector could be placed. PTW PinPoint detector measurements were taken from 5 to 100 mm, and PTW microDiamond measurements were taken from 5 to 55 mm depth. Geant4 simulations were executed for the entire 140 mm depth of the water tank.
Validation was then performed in the Alderson Radiation Therapy Phantom: an anatomically complex phantom transected into 25 mm thick slices. Each slice has holes that allow for the insertion of a detector, or tissue equivalent plug. Two adjacent 25 mm slices of the Alderson Radiation Therapy Phantom were used to validate the dose calculations realistically anatomically with heterogeneous tissues. Figure 4 shows the Alderson Radiation Therapy Phantom on the dynMRT treatment stage.
Following the method recommended in Paino et al. [16], an experimental dose measured at 20 mm depth in the water tank was used to calibrate all subsequent measurements and dose simulations performed in the Alderson Radiation Therapy Phantom, in both broad-beam and MRT delivery modalities.
All dosimetric measurements for the Alderson Radiation Therapy Phantom and water tank phantom were performed using a 3 T wiggler field strength and 200 mA storage-ring current. Attenuating the beam with two filtration paddles, each of 1.41 mm copper, the filtered beam had a mean energy of 92 keV at the target surface [14,31].

2.3. In Vivo Animal Studies

After validating the D o s e M R T software package in the water tank and Alderson Radiation Therapy Phantoms, it was used for dose calculations in an in vivo animal study involving the treatment of tumour-bearing rats.
Treatment simulations performed in this work are an improved method of dose calculations replacing the old Geant4 methodology presented by Engels et al. [19].
Rats were imaged without bolus material in place but were to be treated with a 5 mm water-equivalent material bolus. D o s e M R T contains the function to digitally add the bolus to the exterior of the rat body in the direction of the beam.
To achieve a higher dose rate, as required by the prescribing biological team, in vivo irradiation used a 4 T wiggler field and 200 mA storage-ring current. The beam was attenuated with two filtration paddles, each of 2.83 mm aluminium, and produced a filtered beam with a mean energy of 57 keV. Further explanation of the choice of the treatment field conditions can be found by Engels et al. [19].
Reference dosimetry was performed using a 20 × 20 mm2 square field at 12.5 mm depth in a 25 × 25 × 50 mm3 solid water® phantom, designed to replicate the rat geometry. Measurements with the PTW PinPoint 3D IC (PTW, Freiburg, Germany) were used to calibrate Geant4 simulations under matching irradiation conditions.

2.3.1. Definition of Treatment Margin

The user may define a treatment margin to apply around the identified tumour volume. This margin is applied as a region of uniform thickness around the tumour volume by iterating over the same growth algorithm that was used to identify the tumour volume as described in Section 2.1.4. The restriction on HU similarity is removed; however, the treatment margin is prevented from extending into tissues with different densities (among the 6 materials modelled in this work). The composition and physical density assigned to the treatment margin are identical to those of the surrounding brain tissue.
The centre of the identified target volume (tumour plus treatment margin) is then saved in terms of the CT coordinate system. This coordinate is then used as the target in the software package S y n c M R T [17] used for image-guided alignment on the treatment stage, ensuring that the location of the treatment field delivered matches what was simulated in the Geant4 calculations.

2.3.2. Geant4 Dose Calculations

As the CT resolution and digital phantoms material resolution are too large to resolve microbeams, tissues were sub-divided into smaller scoring voxels to achieve a 10 μ m energy-scoring resolution in the direction of microbeam spatial fractionation. The scoring resolution in the remaining two axes was kept as the CT resolution of 0.52 × 0.30 mm2. Sub-dividing each tissue voxel with an integer number of scoring voxels in this way ensures that each scoring voxel contains only a single material, and there are no partial volume-averaging effects within a given voxel. During simulation, the number of primary electrons traversing the wiggler are recorded; given this and the known synchrotron storage-ring current, it is possible to calculate the real-world time simulated and with it, the dose rate at any point in the digital phantom. The digital phantom reconstructs patient geometry only and does not include the geometry of the dosimeter used for verification. The simulation results output 3D arrays of the dose rate, which may then be used to calculate the exposure time needed to achieve a desired dose in the target volume. Some examples of the analysis that can be applied to the dose calculations are presented in Section 3.2.

3. Results

3.1. Phantom Dosimetry

3.1.1. Validation of Broad Beam Geant4 Calculations in the Water Tank Phantom

Experimental and simulated dose distributions in a water phantom are shown in Figure 5, with dose normalised at 20 mm depth.
For all depths where experimental dose measurements can be performed, the Geant4 simulation results agree within uncertainty to experimental measurements with the PTW PinPoint IC and the PTW microDiamond detectors. The calibration factor for Geant4 simulations used in Figure 5 ( D e x p / D G e a n t 4 at 20 mm depth) was applied to all subsequent Geant4 results for the Alderson Radiation Therapy Phantom. The uncertainty of experimental measurements using the microDiamond detector ( σ = 3.7 % ) was then applied to all calibrated Geant4 simulations in the Alderson Radiation Therapy Phantom.

3.1.2. Validation of Broad Beam Geant4 Calculations in the Alderson Radiation Therapy Phantom

Geant4 dose simulations were scored in the entire head phantom and validated against the PTW microDiamond detector measurements taken along the beam’s central axis, in the ‘brain’ region, between the skull (bone) layers.
Broad beam dose in the Alderson Radiotherapy Phantom presented in Figure 6 shows agreement between the Geant4 simulation and experimental measurements, with all measured depths agreeing, within uncertainty. The large increases in dose at 10 mm and 115 mm depth are caused by the bone layers of the phantom. Although the simulation statistical uncertainty in any one voxel is below 1 % , at the tissue interfaces, the standard deviations become relatively larger (up to 68%) when calculating the average dose over all voxels in the 2.5 × 2.5 mm2 region, which may contain two or more tissues.
The process of importing CT DICOM images, creating a basic treatment plan, and exporting the plan to Geant4 for dose calculation takes approximately 5 min and can be performed on a consumer-grade computer with 16 GB of ram and a single Intel Core i7 2.3 Ghz CPU.

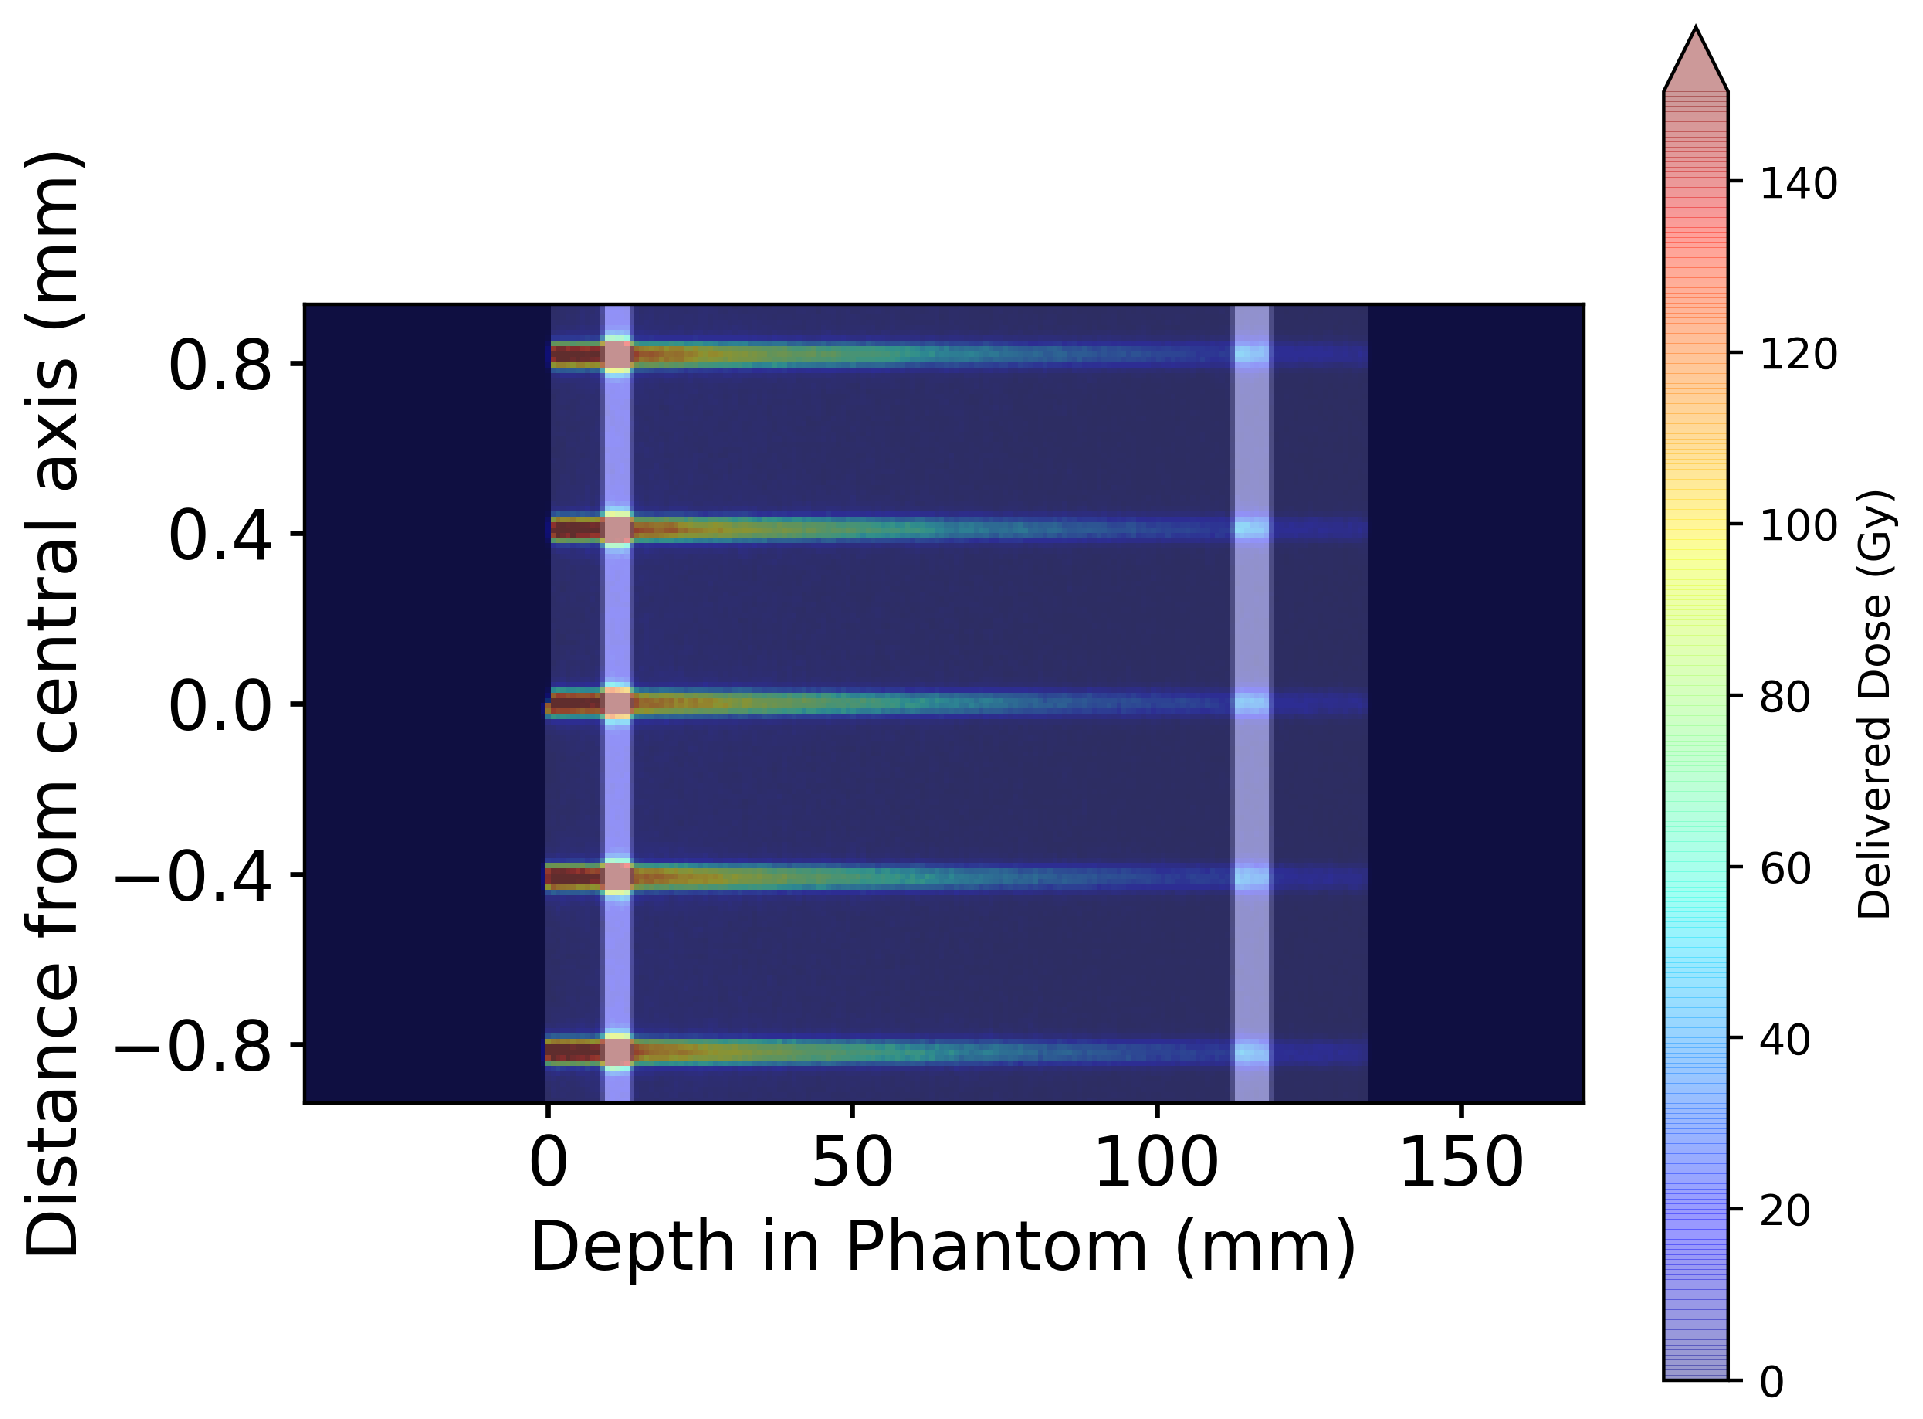
3.1.3. Validation of Microbeam Geant4 Calculations in the Alderson Radiation Therapy Phantom

The entire Alderson Radiation Therapy Phantom was used for simulation, but dose scoring was restricted to a central region encompassing 5 microbeams (a volume of 21.2 × 19.4 × 2.4 cm3 at a resolution of (0.81 × 0.81 × 0.01 mm3).
Averaging the dose simulated in the central five microbeam peaks, or four microbeam valleys, Figure 7 is used to produce Figure 8.
Similar to the broad beam results, the large increases in microbeam peak and valley dose at 10 mm and 115 mm depth of Figure 8 are caused by the bone layers of the phantom. Figure 8 also shows Geant4 simulations of microbeam peaks in the Alderson Radiation Therapy Phantom agree well with experimental results for shallow depths (<35 mm) but overestimate dose deeper in the phantom (approximately 29% beyond 60 mm depth). There is an agreement within two standard deviations for all depths in the phantom.
Geant4 simulations of microbeam valleys show deviation from experimental results at all depths. Over the five depths measured, the Geant4 simulation underestimates microbeam valley doses by an average of about 19 % . Just as with the microbeam peaks, there is an agreement within two standard deviations for all valley measurements in the phantom.

3.2. In Vivo Treatment Simulations

For presentation, all dosimetric results in the rat phantoms are scaled to an arbitrary minimum dose of 10 Gy in the tumour volume. One common way of analysing a treatment simulation is a cumulative distribution function of dose per volume (CDF), also commonly referred to as a dose volume histogram (DVH).
In conventional radiotherapy, a CDF is typically used to show uniformity of dose coverage within a region of interest. Given the unconventional dose distribution of microbeam irradiation, one should not expect a conventional-looking distribution. Figure 9 shows the CDF over the entire target region of interest as a result of the spatial fractionation characteristic of MRT. From the plot, it can be inferred that ≈15% of the tumour volume is directly affected by microbeam peaks, with high doses (above 200 Gy), while the entire tumour volume receives at least 10 Gy. These results are obtained with a microbeam geometry of 50 μ m peaks with 400 μ m peak-to-peak spacing.
Given the convention of most research in MRT to prescribe dose only to the peak or to the valley, the ability to display dose only in a peak or valley region is also provided. To produce Figure 10, the beam geometry of 50 μ m microbeams spaced 400 μ m centre-to-centre is considered. Peak regions are scored as the central 30 μ m of each peak, and valley regions are scored in 100 μ m wide region at least 150 μ m from the nearest peak.
Another insightful way to visualise the dose distribution is to present depth dose profiles for microbeam peaks and valleys. The central eight microbeam peaks and nine valleys were selected for analysis, as these are the peaks and valleys that pass through the target ROI.
Figure 11 shows Geant4 simulations of the MRT beam traversing the rat head, centred on the tumour volume. The large increases in uncertainty at material interfaces occur when the treatment field covers two or more materials, with some of the peaks or valleys passing through bone and some passing through soft tissue. In these regions, every scoring voxel is comprised only of one material and within a voxel, uncertainty remains low. Increases in uncertainty are due to the averaging effects of the dose when considering voxels with different tissues.

4. Discussion

The Geant4 simulation execution times used in this work are summarised in Table 1 in terms of CPU hours and real-time. Executing the Geant4 simulations in parallel mode on the NCI GADI cluster allows dose calculations to be performed in less than 10 min of real-world time, which is deemed adequate for a pre-clinical in vivo trial with a large number of patients and individualised treatments required for each patient [19].
In broad-beam configuration, the Geant4 simulation results agree with the experimental measurements within uncertainties (see Figure 6). In the MRT modality, the Geant4 simulation shows a systematic underestimation in the valley dose of a few percent (average 18.7%) when compared to the experimental measurements (see Figure 8). This may be caused by wave-based interactions, which are not modelled in Geant4. These wave phenomena happen in the case of shallow angle total external reflection [32] off the MSC tungsten blades, producing so-called ‘satellite peaks’ increasing the valley dose [33]. The spatial- and energy-dependent response of the PTW microDiamond detector used in this experiment could also, at least partially, explain the discrepancy between simulation and measurements [20,34]. Experimental measurements may be repeated with detectors, such as Gafchromic films [35,36], to investigate this source of possible disagreement.
It should be noted that the experimental and Geant4 simulation results in the Alderson Radiation Therapy Phantom are only calibrated to results in the homogeneous water tank phantom. Performing the experiment in this way tests the predictive capability of the Geant4 simulation, as it will be used for in vivo experiments, where no dosimetric data can be acquired.
The process of calibrating Geant4 simulations in the Alderseon Radiation Therapy Phantom, using experimental results in the homogeneous water tank phantom, contributes the largest source of uncertainty to the Geant4 results. An experimental uncertainty of ± 3.7 % in the calibration factor limits the accuracy of predictions made with the Geant4 simulation. Error from standard deviation in the Geant4 simulations before calibration is kept relatively small, with average uncertainty in microbeam peaks <1% and in microbeam valleys <5%.
Sources of uncertainty in this work arise from the exact composition and density of materials in the phantom, which are not precisely known. It is possible that the composition of bone and or water defined in the ICRP110 report are not a perfect match for the corresponding material of the physical phantoms considered in this work (Alderson Radiation Therapy Phantom head, and the digital rat phantoms). The anatomical accuracy of the Geant4 simulation could be further improved by accounting for variations in the density of each tissue simulated. Future improvements to implement automated tissue assignment based on a CT HU value lookup table are underway and may be included in future versions.
For both broad-beam and microbeam irradiation of the Alderson Radiation Therapy Phantom (seen in Figure 6, Figure 7 and Figure 8), there is an increase in uncertainty at the experimental measurement locations. This is a result of the plugs that occupy the insert locations not filling the hole perfectly. The CT registers these regions as having lower electron density, which after threshold and conversion into Geant4 digital phantoms results in some voxels converting to air. The average dose is then taken over a region containing voxels of tissue and air, resulting in increased standard deviation.
As presented, D o s e M R T is viable for treatment simulation, where many delivery parameters (treatment angle, patient position, and beam modality) are pre-selected. However, removing these restrictions and performing comprehensive treatment planning optimisation requires the calculation of many plan configurations, with each perturbation requiring a new dose calculation. The total process may require thousands of iterations. To achieve this, much faster dose calculation methods would be needed. To this end, this simulation and its earlier versions have been used to train deep-learning models [37,38].

5. Conclusions

In this study, the software package D o s e M R T is presented and experimentally validated in broad beam and microbeam synchrotron radiotherapy fields. D o s e M R T is a novel integrated workflow, supporting pre-clinical research in MRT, which implements a Geant4-based dose engine to provide a rudimentary treatment planning system for broad-beam and MRT treatment at the Imaging and Medical Beamline of the Australian Synchrotron. This work is the first to perform patient-specific dose calculation using anatomically accurate, voxelised digital phantoms, derived from CT DICOM datasets for an in vivo study using numerous animals. The D o s e M R T software and workflow presented in this work are and will continue to be used to support in vivo studies on the Imaging and Medical Beamline of the Australian Synchrotron.

Author Contributions

Conceptualisation, J.P., S.G., M.T. and M.L. (Michael Lerch); methodology, J.P., S.G., M.L. (Matthew Large), M.C. and M.L. (Michael Lerch); software, J.P., M.C., M.L. (Matthew Large), M.B. and S.G.; validation, J.P. and M.C.; formal analysis, J.P.; investigation, J.P., M.C., E.E., S.V. and M.L. (Matthew Large); data curation, J.P.; writing—original draft preparation, J.P.; writing—review and editing, J.P., M.C., M.L. (Matthew Large), M.B., E.E., S.V., M.T., S.C., S.G. and M.L. (Michael Lerch); supervision, M.L. (Michael Lerch), S.G., S.C., A.R. and M.T.; project administration, M.T. and M.L. (Michael Lerch); funding acquisition, J.P., M.T., A.R. and M.L. (Michael Lerch) All authors have read and agreed to the published version of the manuscript.

Funding

This research was supported by an Australian Government Research Training Program Scholarship and the Australian National Health & Medical Research Council (APP1084994 and APP1093256). This research was undertaken on the Imaging and Medical Beamline at the Australian Synchrotron, part of ANSTO (IMBL/18843; 18204; 17611).

Institutional Review Board Statement

All animal procedures were performed within the guidelines of the National Health and Medical Research Council (2013) Australian code for the care and use of animals for scientific purposes and under the approval of the University of Wollongong and Australian Synchrotron animal ethics committees (AE17/05 and AS-2017-001).

Informed Consent Statement

Not applicable.

Data Availability Statement

Data supporting the findings of this study are available within the article.

Acknowledgments

The authors acknowledge the facilities and scientific and technical assistance of the National Imaging Facility (NIF), a National Collaborative Research Infrastructure Strategy (NCRIS) capability at Monash Biomedical Imaging (MBI), a Technology Research Platform at Monash University; the Illawarra Health and Medical Research Institute (IHMRI), Wollongong, Australia; the Australian Synchrotron, Melbourne, Australia; the Australian Nuclear Science and Technology Organisation. This research/project was undertaken with the assistance of resources and services from the National Computational Infrastructure (NCI), which is supported by the Australian Government. We are grateful to all assisting personnel, including IMBL staff, Beamline Veterinary Scientist Mitzi Klein, MBI Preclinical Facility Scientist Tara Sepehrizadeh, UOW animal research staff, and UOW Animal Welfare Officer Dr Sarah Toole. We acknowledge the support of the Australian Nuclear Science and Technology Organisation Australian Synchrotron and UOW Animal Ethics Committees.

Conflicts of Interest

The authors declare no conflict of interest.

References

  1. Crosbie, J.C.; Anderson, R.L.; Rothkamm, K.; Restall, C.M.; Cann, L.; Ruwanpura, S.; Meachem, S.; Yagi, N.; Svalbe, I.; Lewis, R.A.; et al. Tumor Cell Response to Synchrotron Microbeam Radiation Therapy Differs Markedly From Cells in Normal Tissues. Int. J. Radiat. Oncol. Biol. Phys. 2010, 77, 886–894. [Google Scholar] [CrossRef] [PubMed]
  2. Livingstone, J.; Adam, J.F.; Crosbie, J.C.; Hall, C.J.; Lye, J.E.; McKinlay, J.; Pelliccia, D.; Pouzoulet, F.; Prezado, Y.; Stevenson, A.W.; et al. Preclinical radiotherapy at the Australian Synchrotron’s Imaging and Medical Beamline: Instrumentation, dosimetry and a small-animal feasibility study. J. Synchrotron Radiat. 2017, 24, 854–865. [Google Scholar] [CrossRef] [PubMed]
  3. Davis, J.A.; Engels, E.; Petasecca, M.; Paino, J.; Tehei, M.; Corde, S.; Stevenson, A.; Hausermann, D.; Guatelli, S.; Rosenfeld, A.; et al. X-TREAM protocol for in vitro microbeam radiation therapy at the Australian Synchrotron. J. Appl. Phys. 2021, 129, 244902. [Google Scholar] [CrossRef]
  4. Poole, C.M.; Day, L.R.; Rogers, P.A.; Crosbie, J.C. Synchrotron microbeam radiotherapy in a commercially available treatment planning system. Biomed. Phys. Eng. Express 2017, 3, 025001. [Google Scholar] [CrossRef]
  5. Donzelli, M.; Bräuer-Krisch, E.; Oelfke, U.; Wilkens, J.J.; Bartzsch, S. Hybrid dose calculation: A dose calculation algorithm for microbeam radiation therapy. Phys. Med. Biol. 2018, 63, 045013. [Google Scholar] [CrossRef]
  6. Day, L.R.J.; Donzelli, M.; Pellicioli, P.; Smyth, L.M.; Barnes, M.; Bartzsch, S.; Crosbie, J.C. A commercial treatment planning system with a hybrid dose calculation algorithm for synchrotron radiotherapy trials. Phys. Med. Biol. 2021, 66, 055016. [Google Scholar] [CrossRef]
  7. Debus, C.; Oelfke, U.; Bartzsch, S. A point kernel algorithm for microbeam radiation therapy. Phys. Med. Biol. 2017, 62, 8341. [Google Scholar] [CrossRef] [Green Version]
  8. Kraus, K.M.; Winter, J.; Zhang, Y.; Ahmed, M.; Combs, S.E.; Wilkens, J.J.; Bartzsch, S. Treatment planning study for microbeam radiotherapy using clinical patient data. Cancers 2022, 14, 685. [Google Scholar] [CrossRef]
  9. Martínez-Rovira, I.; Sempau, J.; Prezado, Y. Monte Carlo-based treatment planning system calculation engine for microbeam radiation therapy. Med. Phys. 2012, 39, 2829–2838. [Google Scholar] [CrossRef]
  10. Keshmiri, S.; Brocard, S.; Serduc, R.; Adam, J.F. A high-resolution dose calculation engine for X-ray microbeams radiation therapy. Med. Phys. 2022, 49, 3999–4017. [Google Scholar] [CrossRef]
  11. Agostinelli, S.; Allison, J.; Amako, K.a.; Apostolakis, J.; Araujo, H.; Arce, P.; Asai, M.; Axen, D.; Banerjee, S.; Barrand, G.; et al. GEANT4—A simulation toolkit. Nucl. Instrum. Methods Phys. Res. Sect. A Accel. Spectrom. Detect. Assoc. Equip. 2003, 506, 250–303. [Google Scholar] [CrossRef] [Green Version]
  12. Allison, J.; Amako, K.; Apostolakis, J.; Araujo, H.; Dubois, P.A.; Asai, M.; Barrand, G.; Capra, R.; Chauvie, S.; Chytracek, R.; et al. Geant4 developments and applications. IEEE Trans. Nucl. Sci. 2006, 53, 270–278. [Google Scholar] [CrossRef] [Green Version]
  13. Allison, J.; Amako, K.; Apostolakis, J.; Arce, P.; Asai, M.; Aso, T.; Bagli, E.; Bagulya, A.; Banerjee, S.; Barrand, G.; et al. Recent developments in Geant4. Nucl. Instrum. Methods Phys. Res. Sect. A Accel. Spectrom. Detect. Assoc. Equip. 2016, 835, 186–225. [Google Scholar] [CrossRef]
  14. Dipuglia, A.; Cameron, M.; Davis, J.A.; Cornelius, I.M.; Stevenson, A.W.; Rosenfeld, A.B.; Petasecca, M.; Corde, S.; Guatelli, S.; Lerch, M.L.F. Validation of a Monte Carlo simulation for Microbeam Radiation Therapy on the Imaging and Medical Beamline at the Australian Synchrotron. Sci. Rep. 2019, 9, 17696. [Google Scholar] [CrossRef] [Green Version]
  15. Large, M.; Malaroda, A.; Petasecca, M.; Rosenfeld, A.; Guatelli, S. Modelling ICRP110 adult reference voxel phantoms for dosimetric applications: Development of a new Geant4 advanced example. In Proceedings of the Journal of Physics: Conference Series; IOP Publishing: Bristol, UK, 2020; Volume 1662, p. 012021. [Google Scholar]
  16. Paino, J.; Barnes, M.; Engels, E.; Davis, J.; Guatelli, S.; de Veer, M.; Hall, C.; Häusermann, D.; Tehei, M.; Corde, S.; et al. Incorporating clinical imaging into the delivery of microbeam radiation therapy. Appl. Sci. 2021, 11, 9101. [Google Scholar] [CrossRef]
  17. Barnes, M.; Paino, J.; Day, L.; Butler, D.; Häusermann, D.; Pelliccia, D.; Crosbie, J. SyncMRT: A solution to image-guided synchrotron radiotherapy for quality assurance and pre-clinical trials. J. Synchrotron Radiat. 2022, 29, 1074–1084. [Google Scholar] [CrossRef]
  18. Geant4 Collaboration. Geant4, version 10.4; Physics Reference Manual; Geant4 Collaboration, 2020; Volume 9. [Google Scholar]
  19. Engels, E.; Li, N.; Davis, J.; Paino, J.; Cameron, M.; Dipuglia, A.; Vogel, S.; Valceski, M.; Khochaiche, A.; O’Keefe, A.; et al. Toward personalized synchrotron microbeam radiation therapy. Sci. Rep. 2020, 10, 8833. [Google Scholar] [CrossRef]
  20. Livingstone, J.; Stevenson, A.W.; Butler, D.J.; Häusermann, D.; Adam, J.F. Characterization of a synthetic single crystal diamond detector for dosimetry in spatially fractionated synchrotron X-ray fields. Med. Phys. 2016, 43, 4283–4293. [Google Scholar] [CrossRef]
  21. Stevenson, A.W.; Crosbie, J.C.; Hall, C.J.; Livingstone, J.; Lye, J.E. Quantitative characterisation of the X-ray beam at the Australian Synchrotron Imaging and Medical Beamline (IMBL). J. Synchrotron Radiat. 2016, 24, 110–141. [Google Scholar] [CrossRef]
  22. Van Rossum, G.; Drake, F.L. Python 3 Reference Manual; CreateSpace: Scotts Valley, CA, USA, 2009. [Google Scholar]
  23. ICRP. Adult Reference Computational Phantoms; ICRP Publication 110, Annals of ICRP; ICRP: Amsterdam, The Netherlands, 2009; Volume 39, p. 1. [Google Scholar]
  24. Geant4 Collaboration. Book for Application Developers; Geant4 Collaboration, 2019; Volume 10, pp. 5–12. Available online: http://geant4-userdoc.web.cern.ch/geant4-userdoc/UsersGuides/ForApplicationDeveloper/BackupVersions (accessed on 1 February 2023).
  25. Pal, N.R.; Pal, S.K. A review on image segmentation techniques. Pattern Recognit. 1993, 26, 1277–1294. [Google Scholar] [CrossRef]
  26. IAEA. Absorbed Dose Determination in External Beam Radiotherapy: An International Code of Practice for Dosimetry Based on Standards of Absorbed Dose to Water; Technical Report Series No. 398; Vienna International Atomic Energy Agency: Vienna, Austria, 2000. [Google Scholar]
  27. Patallo, I.S.; Carter, R.; Maughan, D.; Nisbet, A.; Schettino, G.; Subiel, A. Evaluation of a micro ionization chamber for dosimetric measurements in image-guided preclinical irradiation platforms. Phys. Med. Biol. 2021, 66, 245012. [Google Scholar] [CrossRef] [PubMed]
  28. Andreo, P.; Huq, M.S.; Westermark, M.; Song, H.; Tilikidis, A.; DeWerd, L.; Shortt, K. Protocols for the dosimetry of high-energy photon and electron beams: A comparison of the IAEA TRS-398 and previous international Codes of Practice. Phys. Med. Biol. 2002, 47, 3033. [Google Scholar] [CrossRef]
  29. Fournier, P.; Crosbie, J.C.; Cornelius, I.; Berkvens, P.; Donzelli, M.; Clavel, A.H.; Rosenfeld, A.B.; Petasecca, M.; Lerch, M.L.F.; Bräuer-Krisch, E. Absorbed dose-to-water protocol applied to synchrotron-generated x-rays at very high dose rates. Phys. Med. Biol. 2016, 61, N349–N361. [Google Scholar] [CrossRef] [PubMed]
  30. Davis, J.; Petasecca, M.; Cullen, A.; Paino, J.; Archer, J.; Rosenfeld, A.; Lerch, M. X-Tream dosimetry of synchrotron radiation with the PTW microDiamond. J. Instrum. 2019, 14, 10037. [Google Scholar] [CrossRef]
  31. Livingstone, J.; Stevenson, A.W.; Häusermann, D.; Adam, J.F. Experimental optimisation of the X-ray energy in microbeam radiation therapy. Phys. Med. 2018, 45, 156–161. [Google Scholar] [CrossRef] [Green Version]
  32. Vinogradov, A.; Zorev, N.; Kozhevnikov, I.; Yakushkin, I. Phenomenon of total external reflection of x rays. Zh. Eksp. Teor. Fiz. 1985, 89, 2124–2132. [Google Scholar]
  33. Fournier, P.; Cornelius, I.; Donzelli, M.; Requardt, H.; Nemoz, C.; Petasecca, M.; Bräuer-Krisch, E.; Rosenfeld, A.; Lerch, M. X-Tream quality assurance in synchrotron X-ray microbeam radiation therapy. J. Synchrotron Radiat. 2016, 23, 1180–1190. [Google Scholar] [CrossRef] [Green Version]
  34. Butler, D.J.; Beveridge, T.; Lehmann, J.; Oliver, C.P.; Stevenson, A.W.; Livingstone, J. Spatial response of synthetic microDiamond and diode detectors measured with kilovoltage synchrotron radiation. Med. Phys. 2018, 45, 943–952. [Google Scholar] [CrossRef] [Green Version]
  35. Butson, M.J.; Cheung, T.; Peter, K. Weak energy dependence of EBT gafchromic film dose response in the 50 kVp–10 MVp X-ray range. Appl. Radiat. Isot. 2006, 64, 60–62. [Google Scholar] [CrossRef]
  36. Rink, A.; Vitkin, I.A.; Jaffray, D.A. Energy dependence (to) of radiochromic films assessed using a real-time optical dosimeter. Med. Phys. 2007, 34, 458–463. [Google Scholar] [CrossRef]
  37. Mentzel, F.; Paino, J.; Barnes, M.; Cameron, M.; Corde, S.; Engels, E.; Kröninger, K.; Lerch, M.; Nackenhorst, O.; Rosenfeld, A.; et al. Accurate and fast deep learning dose prediction for a preclinical microbeam radiation therapy study using low-statistics Monte Carlo simulations. arXiv 2022, arXiv:2212.05659. [Google Scholar] [CrossRef]
  38. Mentzel, F.; Barnes, M.; Kröninger, K.; Lerch, M.; Nackenhorst, O.; Paino, J.; Rosenfeld, A.; Saraswati, A.; Tsoi, A.C.; Weingarten, J.; et al. A step towards treatment planning for microbeam radiation therapy: Fast peak and valley dose predictions with 3D U-Nets. arXiv 2022, arXiv:2211.11193. [Google Scholar]
Figure 1. The D o s e M R T simulation workflow. The user only needs to choose the treatment modality (broadbeam or MRT delivery, magnetic field intensity and filtering), input the patient digital phantom and the location of the tumour target isocentre through the Python GUI. The output of D o s e M R T is 3D dose maps in the tumour target. Software calculation stages are indicated by square boxes, whilst the data passed between each stage are indicated with rounded borders.
Radiation 03 00011 g001
Figure 2. Axial slice of the Alderson Phantom, comparing the imported CT DICOM dataset (left) and the digital phantom produced after segmentation (right). Dimensions are given relative to the centre of the incident treatment beam and the surface of the phantom.
Radiation 03 00011 g002
Figure 3. Axial slice of tumour-bearing rat with iodine contrast agent (left), and the segmented digital phantom (right) reduced to 6 tissues, input to the Geant4 simulations. Dimensions are given relative to the centre of the identified target volume.
Radiation 03 00011 g003
Figure 4. Alderson Radiation Therapy Phantom mounted on the dynamic MRT stage in Hutch 2B in the IMBL. The PTW microDiamond detector may be interchanged with any of the tissue-equivalent white plugs in the phantom. The blue region indicates the path of the incident radiation treatment beam.
Radiation 03 00011 g004
Figure 5. Percentage depth dose (PDD) measurements along the central axis of 20 × 20 mm2 field performed in a 14 × 17 × 12 cm3 liquid water tank with PTW PinPoint 3D IC (Black), PTW microDiamond (Red) detectors and Geant4 simulations (Blue) normalised at a depth of 20 mm. The lower plot shows the ratio between the Geant4 simulation and experimental measurements using the PTW microDiamond and PTW Pinpoin 3D detectors.
Radiation 03 00011 g005
Figure 6. (Left) Axial slice from the Geant4 simulated 3D dose map for a 20 × 20 mm2 broad beam treatment field simulated in the Alderson Radiation Therapy Phantom. (Right) Results comparing experimental results using the PTW microDiamond (red) with Geant4 simulations (blue) taken across the central 2.5 × 2.5 mm2 region of each depth. The lower plot shows the ratio between the Geant4 simulation and experimental measurements using the PTW microDiamond detector. The grey dashed lines indicate the combined uncertainty from experimental uncertainty and Geant4 simulation including calibration.
Radiation 03 00011 g006
Figure 7. Geant4-simulated 2D dose map for five microbeams at the centre of the MRT treatment field in the Alderson Radiation Therapy Phantom. Microbeam simulations were performed using the entire phantom depicted in Figure 6; however, only the central five microbeams are displayed here for visual clarity.
Radiation 03 00011 g007
Figure 8. Depth dose curves averaged over five microbeam peaks and four valleys at the centre of the treatment field in the Alderson Phantom depicted in Figure 7. Comparing experimental results using the PTW microDiamond (red) with Geant4 simulations (blue) for microbeam peaks (left) and valleys (right). The lower plots show the ratio between Geant4 simulation and experimental measurements using the PTW microDiamond detector. The grey dashed lines indicate the combined uncertainty from experimental and Geant4 simulation standard deviations, including the uncertainty deriving from the calibration.
Radiation 03 00011 g008
Figure 9. Cumulative distribution function of dose per unit volume over the entire planning target volume (tumour plus treatment margin), scaled to provide a minimum 10 Gy in the valley regions. The non-uniformity of dose distribution is characteristic of microbeam irradiation. The results were obtained with an MRT configuration of 50 μ m microbeams spaced with 400 μ m centre-to-centre.
Radiation 03 00011 g009
Figure 10. Geant4 simulation results for the cumulative frequency distribution of dose per volume scored in either peak regions (left) or valley regions (right) scaled to provide a minimum 10 Gy in valley regions.
Radiation 03 00011 g010
Figure 11. Geant4 simulated depth dose profiles for eight microbeam peaks and nine valleys at the centre of the treatment field in voxelised rat volume. The incident beam travels in the positive direction on the x-axis and traverses (A) air, (B) bolus and skin, (C) entry side skull, (D) brain and tumour, (E) exit side skull, soft tissue, and finally (F) air.
Radiation 03 00011 g011
Table 1. Computational resources and Geant4 simulation execution times to produce all dose simulation results presented. * : results reported for one computing node.
Section 3Simulation HistoriesPhantom VoxelsScoring VoxelsRAM UsageCPU Hours * Real Time
Section 3.1.2, BB Phantom60 × 10 67.5 × 10 67.5 × 10 6650 MB2 h6 min
Section 3.1.3, MB Phantom7.5 × 10 97.5 × 10 61.1 × 10 6610 MB50 h7 min
Section 3.2, MB in vivo750 × 10 62.5 × 10 60.7 × 10 6550 MB13 h6 min
Disclaimer/Publisher’s Note: The statements, opinions and data contained in all publications are solely those of the individual author(s) and contributor(s) and not of MDPI and/or the editor(s). MDPI and/or the editor(s) disclaim responsibility for any injury to people or property resulting from any ideas, methods, instructions or products referred to in the content.

