Article

In Vivo Dosimetry for Superficial High Dose Rate Brachytherapy with Optically Stimulated Luminescence Dosimeters: A Comparison Study with Metal-Oxide-Semiconductor Field-Effect Transistors

by
Alana Lopes
*,
Eric Sabondjian
and
Alejandra Rangel Baltazar
Trillium Health Partners, Mississauga, ON L5M 2N1, Canada
*
Author to whom correspondence should be addressed.
Radiation 2022, 2(4), 338-356; https://doi.org/10.3390/radiation2040026
Submission received: 30 September 2022 / Revised: 14 October 2022 / Accepted: 16 October 2022 / Published: 18 October 2022
(This article belongs to the Topic Cancer Biology and Radiation Therapy)

Abstract

:

Simple Summary

In vivo dosimetry is an important aspect of radiation treatments to monitor and validate the doses delivered to the target and surrounding tissues. Metal-oxide-semiconductor field-effect transistors are commonly used to measure surface doses in contact-based treatments for superficial high-dose-rate brachytherapy. However, this system is expensive, requires annual calibration, and burdens patients, which jeopardizes the quality of their treatment. In comparison, optically-stimulated luminescence dosimeters (OSLDs) are a newer technology that is more affordable, smaller in size, and easier on patients. There is currently a shift in the field of radiation dosimetry towards OSLDs, and it is of interest to compare the performance and accuracy of these two systems. As OSLDs are easy to use, their uptake in patient dosimetry compared to the previous system can lead to the perfection of therapy planning and enhancement of patient treatments and provide researchers with a better understanding of dose distribution in complex geometries.

Abstract

The purpose of the study was to calibrate and commission optically-stimulated luminescence dosimeters (OSLDs) for in vivo measurements in contact-based 192Ir treatments for superficial high dose rate (HDR) brachytherapy in place of metal-oxide-semiconductor field-effect transistors (MOSFETs). Dose linearity and dose rate dependence were tested by varying source-to-OSLD distance and dwell time. Angular dependence was measured using a solid water phantom setup for OSLD rotation. A group of OSLDs were readout 34 consecutive times to test readout depletion while OSLDs were optically annealed using a mercury lamp for 34.7 h. End-to-end tests were performed using a Freiburg flap and Valencia applicator. OSLD measurements were compared to MOSFETs and treatment planning system (TPS) doses. OSLD response was supralinear for doses above 275 cGy. They were found to be independent of dose rate and dependent on the incident angle in edge-on scenarios. OSLDs exhibited minimal readout depletion and were successfully annealed after 24 h of illumination. Freiburg flap measurements agreed well with the TPS. For the Valencia, OSLDs showed to be the more accurate system over MOSFETs, with a maximum disagreement with the TPS being 0.09%. As such, OSLDs can successfully be used in place of MOSFETs for in vivo dosimetry for superficial HDR brachytherapy.

1. Introduction

The occurrence of skin cancer worldwide has been on the rise for the past 30 years, making it the most common type of malignancy in many countries, including Canada, America, and Australia [1,2,3,4]. Skin cancer is often divided into two categories: melanoma and non-melanoma. For comparison, non-melanoma skin cancer (NMSC) occurs 18–20 times more often than melanoma [1]. Although there are several types of NMSC, the two most common that collectively make up 99% of all NMSCs are basal cell carcinoma (BCC) and squamous cell carcinoma (SCC) [1]. A recent study revealed that 1 in 8 Canadians will develop BCC in their lifetime, and 1 in 20 Canadians will develop SCC [3]. The usual treatment for skin cancer is the surgical removal of the lesion; however, this method relies on excising enough tissue to obtain cancer-free margins while minimizing the loss of healthy tissue. This especially becomes a concern when dealing with the head and neck, as both cosmetic and functional outcomes are at stake [5]. Additionally, surgical treatment for skin carcinomas poses a higher risk for elderly patients suffering from comorbidities [6].
As an alternative, radiation using high dose rate (HDR) brachytherapy can be used to treat and cure NMSC. However, HDR brachytherapy is not often used to treat melanoma as it is traditionally known as radioresistant cancer. However, several studies have shown that, given specific clinical circumstances, radiotherapy can be an effective treatment for melanoma [7]. HDR brachytherapy uses a radioactive seed to precisely deliver a high dose of radiation (>12 Gy/h) to the malignant cells via catheters connected to a custom-fitted applicator. The three most common applicators used are the Freiburg flab, Valencia, and Leipzig (Figure 1). Specifically, HDR brachytherapy uses a dose distribution with a steep dose gradient outside the axis of the applicator [8]. This, in turn, allows the prescribed dose to be localized within the target area while minimizing the dose to the surrounding healthy tissues. Additionally, nearly all HDR brachytherapy cases can be treated as outpatients as the treatments are quick (approximately 2 to 10 min), require minimal recovery time, and have few or no side effects [9]. Several studies have shown HDR brachytherapy to be a highly effective treatment for NMSC with excellent local control rates ranging from 85–100% as well as excellent and good cosmetic outcomes in 94–98% of participating patients [6,10,11,12]. To add to this, NMSC lesions that are at or just below (≤3 mm) the skin surface respond best to HDR brachytherapy [12].
The high doses used for HDR brachytherapy allow for hypofractionated treatments and excellent tumor coverage but also raise the need for a rigorous quality assurance program, including in vivo dosimetry. There have been several recent reviews concerning the need for in vivo dosimetry for brachytherapy. One such review by Fonseca et al. emphasized the correlation between unnoticed systematic errors and the lack of in vivo dosimetry [13]. Additionally, Kertzsher et al. reviewed the challenges that arise due to the limited practice of in vivo dosimetry in brachytherapy [14]. Overall, in vivo dosimetry provides efficient treatment verification and error detection and a way to track both the target and organ-at-risk (OAR) doses [15]. With the use of 3D image data, the doses to the tumor and OAR can be calculated by the treatment planning system (TPS). In comparison, the calculations assessed by the TPS are often more accurate than measurements obtained by in vivo dosimetry [16]. There are cases, however, where the TPS is unable to provide accurate dose calculations, such as organ movement between scan and treatment [16]. Additionally, there are some treatments that use lead shields over the OAR to reduce its absorbed dose, which cannot be accounted for by the TPS. In these cases, in vivo dosimetry can provide more accurate dose measurements. Over the past 30 years, the most common in vivo dosimeters are thermoluminescent dosimeters (TLDs) and silicon diodes. Additionally, metal-oxide-semiconductor field-effect transistors (MOSFETs) have become more widely used due to their immediate readout and high sensitivity [17]. However, a newer device gaining attention in the field of HDR in vivo dosimetry is the optically stimulated luminescence dosimeter (OSLD). OSLDs contain a small plastic disk infused with carbon-doped aluminum oxide (Al2O3:C). The main determinant of irradiation tolerance for this material is the accumulation of primary lattice point defects, which are caused by interstitial Frenkel pairs (F+ and F centers) and F2 dimers. Frankel pairs arise from an oxygen vacancy trapping one or two electrons, whereas an F2 dimer is two adjacent oxygen vacancies [18,19,20]. With exposure to ionizing radiation, the number of Frenkel pairs formed in the crystalline structure is proportional to the absorbed dose [21]. From this, the magnitude of the dose can be found by exposing the material to light of a particular wavelength (about 420–700 nm) to release the Frenkel pair trapped electrons [22,23]. These freed electrons will then recombine and release photons of corresponding energy. The luminescence from these photons of light is proportional to the OSLD’s absorbed dose [22]. Altogether, each OSLD is encased in a small light-tight plastic case (200 mm3) which allows for easy placement in small spaces.
The goal of this study was to calibrate and commission OSLD nanoDotsTM to be used in place of MOSFETs for in vivo dosimetry in contact-based treatments for superficial HDR brachytherapy. The test procedures used for calibration and commissioning are discussed. This study also compares the measurements made for OSLDs to those made with MOSFETs and discusses the main limitations of this study and potential solutions. Furthermore, this paper discusses the importance of in vivo dosimetry for HDR brachytherapy and the unique benefits that OSLDs bring to the table.

2. Materials and Methods

The OSLDs used for this study are screened Landauer nanoDotTM dosimeters (Figure 2), which are assigned a sensitivity of ± 5.5% by the manufacturer. As such, this study deems measurements that are within ±5.0% of the expected value clinically acceptable. These OSLDs consist of a circular disk of Al2O3:C that is 5 mm in diameter, 0.2 mm in thickness, and has a 0.05 mm thick cover layer of polyester film. Altogether, the disk is supported by an O-ring and enclosed in a 10 mm × 10 mm × 2 mm light-tight plastic case. The OSLDs themselves are radiolucent and are designed for single-point radiation measurements. It is known that after irradiation, the OSLDs release a transient signal that decays with a half-life of 48 s [24]. As such, each OSLD was kept in the dark for a minimum of 12 min after irradiation before readout to avoid detecting the transient signal. OSLDs were read with the Landauer microStarTM reader, which uses a one-second illumination period on clockwise (cw) mode. The reader was warmed up for 30 min and underwent quality assurance tests before each use.
The mobileMOSFET single-channel dose verification system shown in Figure 2 (Best Medical Canada©, Kanata, ON, Canada) was used for comparison in this study as it measures integrated radiation dose. This device consists of five wired channels, each individually capable of dosimetry measurements. At the end of each wire is a black epoxy bulb that encases a 1 mm2 silicon chip with an active area of 0.2 × 0.2 mm2. The system comes with a wall-mounted Bluetooth wireless receiver and remote monitoring dose verification software (Best Medical Canada©, mobileMOSFET 2.4.1, Ottawa, ON, Canada) which together allow the mobile MOSFET to provide immediate dose measurement readouts [25].
The HDR brachytherapy source used in this study was an 192Ir seed. 192Ir has a half-life of 73.83 days and emits gamma rays with an average energy of 380 keV [26]. The seed itself is 3.5 mm long and has a diameter of 0.6 mm and is encased in a stainless-steel capsule 4.6 mm long and 0.86 mm in diameter. The Nucletron Flexitron afterloader was used to deliver the prescribed doses, and the TPS used was Oncentra Brachytherapy (Elekta©, Version 4.6.2, Stockholm, Sweden). Prior to the start of this study, the TPS was validated and commissioned using a combination of hand calculations, a secondary dose calculation algorithm, and radiographic film measurements to ensure the system was accurate and precise enough for clinical use [14]. All results were well within 1.5% of the expected value. It is important to note that the TPS software accounts for the attenuation in signal after irradiation. Thus, given that each set of measurements in this study was made in the same TPS environment, no additional steps were needed to account for the attenuation in the signal. Furthermore, the phantoms used in this study were scanned using a Phillips Brilliance Big Bore CT machine.

2.1. Calibration

A solid water phantom was used to irradiate the OSLDs to known doses, and the setup is shown below in Figure 3. Solid water is a radiologically tissue-equivalent material manufactured by Sun Nuclear© (Melbourne, FL, USA) to simulate the buildup and scatter effects caused by the interaction of radiation with tissue. Specifically, each slab of solid water used in this study had a depth ionization relative to water of (1.000 ± 0.005) for both photons and electrons. Additionally, the mass density, electron density, and water electron density ratio were (1.032 ± 0.005) g/cm3, (0.557 ± 0.001) e/cm3NA, and (1.000 ± 0.005), respectively [27]. The total thickness of the phantom was 15 cm, which was sufficient to provide adequate backscattering and buildup. The catheters used were taped to the solid water, and the placement of the OSLDs was marked directly on the phantom. The bottom half of the phantom was taped together to prevent phantom movement between scan and plan delivery and to increase the overall reproducibility of the setup. The OSLDs were placed such that their QR code surface was facing the catheters.
Three calibration curves were made to cover a range of doses from 0 cGy to 1300 cGy. The points used to form each curve are given in Table 1. For each point, three OSLDs were irradiated to the given dose level and read out four times.
To verify the accuracy of each curve, validation doses were used to test against the curves. For each validation dose, a single OSLD was placed in the superior position on the calibration phantom as described in Figure 3, irradiated to the prescribed dose level, and read four times to obtain an average reading. The validation doses used were: 10 cGy, 200 cGy, 400 cGy, 650 cGy, and 900 cGy.

2.2. Dose Linearity

The phantom shown in Figure 3 was used to test the dose linearity of the OSLDs. Keeping the distance between the source and OSLD fixed at 4 cm, a single OSLD was placed in the middle position on the phantom while the dwell time was varied.

2.3. Dose Rate Dependence

To test dose rate dependence, the dwell time was held constant at 250 s while the source-to-OSLD distance was varied from {4,6,8,10,12} cm. A setup similar to the calibration was used where blocks of solid water were added to the middle of the phantom for each measurement until reaching a source-to-OSLD distance of 12 cm (Figure 4). Measurements were compared to theoretical values calculated using TG-43U1 as a reference [28].

2.4. Angular Dependence

A new phantom was designed to test the angular dependence of OSLDs, and the phantom is shown in Figure 5. The top slab of solid water was 1 cm thick and had a machined canal that led to a small circle 3 cm in diameter machined into the center of the slab. A piece of 1 cm thick superflab bolus was then cut to fit tightly in the center circle, and a slit was cut into the bolus for OSLD placement. A single catheter was used and sandwiched between superflab bolus within the canal to maintain a tissue-equivalent environment. The OSLD was rotated from 0° to 360° in 15° intervals along the x-axis and y-axis, as shown in Figure 5, each time using a new OSLD.

2.5. Readout Depletion

A group of nine previously irradiated OSLDs were optically annealed and arranged in a 3 × 3 array using the calibration phantom shown in Figure 3. The OSLDs were irradiated to a dose in a range from 46 cGy to 52 cGy. Each OSLD was readout 34 times, normalizing each set of 34 readings by the average of the first 4 readings of that OSLD to measure the depletion of signal due to multiple readouts.

2.6. Optical Annealing

A group of 40 pre-irradiated OSLDs was collected and read to obtain a baseline reading. The OSLDs were opened using a paperclip and placed on an X-ray light box from SourceOnce Healthcare Technologies (Model No: FS302FSS1DBWH). The light box used mercury daylight lamps from Sli Lighting (Model No: F15T8 DL) to provide an illumination of 60 Hz, 120 V, and 1.34 A. The OSLDs were placed approximately one centimeter apart and were covered with the reflective cover shown in Figure 6 once the light was turned on to maximize illumination exposure. The OSLDs followed the cycle of optical annealing, wait a minimum of four minutes, and then readout. The purpose of waiting for a minimum of four minutes between annealing and reading is to prevent the detection of phosphorescent light [21].

2.7. End-to-End Testing

Superficial HDR brachytherapy uses an applicator to bridge the 192Ir source to the target site being treated. Three common applicators are the Freiburg flap, Valencia, and Leipzig. Two scenarios were carried out for end-to-end testing in this study which utilized the Freiburg flap and Valencia (Figure 1). The Freiburg flap is a flexible mesh-like surface mold consisting of silicon spheres with a radius of 5 mm. The flap consists of a series of flexible catheters, each encased in a line of silicon spheres to prevent contact between the source and skin [29]. These flaps allow for the treatment of large and/or curved anatomies. Conversely, the Valencia is a non-invasive contact treatment option that produces a flat isodose line at a depth of 3 mm, which allows for controlled and homogeneous dose coverage of the target area. The applicator head is made of titanium with a steel channel welded to the side for the transport of the 192Ir seed.
The first case was to measure the dose received by a pacemaker when treating a skin lesion on the chest with a 10-catheter Freiburg flap molded to a curved surface. The phantom was a 1 cm thick sheet of superflab bolus, which was placed on the underside of the flap and held in the curved geometry by a roll of tape, as shown in Figure 7. Only six of the ten catheters were activated for treatment delivery. Two areas of interest were measured: the target and the pacemaker. A single OSLD was placed on the top rim of the center of the tape roll to measure the target dose, whereas another OSLD was placed in the position of the blue circle drawn directly on the flap. A single BB skin marker (Visionmark V-20, suremark) was placed on the superior end of the phantom to mark the position of the first catheter. This setup was then repeated with a 7 mm thick 12 MeV lead eye shield over the position of the pacemaker to measure the effect of lead shielding.
The second case was to measure the dose to the lens of the eye when treating a facial skin lesion with a 3 cm horizontal (H3) Valencia applicator. The phantom used is depicted in Figure 8. This test used both OSLDs and MOSFETs to measure the dose to three areas of interest, the target area, the OAR (lens), and the surface dose. The target area was located under 3 mm of solid water directly beneath the center of the Valencia. The hypothetical lens was positioned on the surface of the phantom 2 cm away from the applicator. The surface dose was measured 5 cm from the Valencia on the surface of the phantom. This setup was then repeated with a 7 mm thick 12 MeV lead eye shield over the position of the lens, one over the OSLD and one over the MOSFET, to measure the effect of lead shielding.

3. Results

3.1. Calibration

The average reading at each dose level was used to create three calibration curves: low dose linear, high dose linear, and high dose non-linear, which are shown below in Figure 9. The corresponding calibration factors for the low and high dose linear curves are 16,949 counts/cGy and 931.18 counts/cGy, respectively. Further, the accuracy of the curve was tested, and the validation results are shown in Table 2.

3.2. Dose Linearity

Using a single catheter (catheter 3 in Figure 3), the dwell times were {26.10, 52.30, 150.0, 250.0, 350.1, 450.1, 550.2, 679.9} seconds. The OSLD response to the absorbed dose is shown in Figure 10. The solid line displays the linear dependence on dose, and as expected, the OSLDs exhibit a linear behavior up to approximately 275 cGy, after which a supralinear behavior is observed. The supralinearity of OSLDs agrees well with previous findings [21,22,30] and further supports Landauer’s recommendation that a non-linear curve should be used for the readout of OSLDs that are expected to have an absorbed dose of 300 cGy or higher. The OSLD response is modeled by the following equation:
Dose (cGy) = − (1.68 × 10⁻¹⁰) (counts)2 + 0.001 (counts),
which is displayed as the dashed line in Figure 10. This model fits the data with a coefficient of variation (R2) of 0.9998, thus indicating an excellent fit. Single-factor analysis of variance (ANOVA) testing was performed to compare the effect of delivered dose to measured counts, which revealed that there was a statistically significant difference in delivered dose between at least two groups (F (1, 16) = [12.4], p = 2.81 × 10⁻³).

3.3. Dose Rate Dependence

Using a single catheter, a fixed dwell time of 250 s was used to deliver a dose of 213.6 cGy to the initial 4 cm source-to-OSLD distance. As the source-to-OSLD distance increased, the dwell time remained fixed. Figure 11 exhibits how OSLDs are independent of dose rate as the relationship between OSLD response (i.e., counts) and dose rate is linear, with an R2 of 0.9999, thus indicating an excellent fit. The OSLD response is modeled by the following equation:
Dose rate (cGy/min) = (3 × 10⁻⁴) (counts) – 0.7383,
which is displayed as the dashed line in Figure 11. Single-factor ANOVA testing comparing the effect of dose rate to measured counts revealed that there was a statistically significant difference in dose rate between at least two groups (F (1, 8) = [5.37], p = 4.91 × 10⁻²). Additionally, Table 3 compares the measurements obtained in this study to the theoretical dose calculated using TG-43U1 with an inverse square factor calculated using the setup described in the Methods section of this paper [28]. With the values normalized to the initial 4 cm position, it is evident that the measurements for this test and theoretical values agree well with a maximum error of 1.9% compared to the measurements made.

3.4. Angular Dependence

The angular dependence of the OSLDs was determined by irradiating them with 90 cGy using the geometry described in the previous section. Figure 12 demonstrates the OSLD’s signal as a function of the incident angle normalized to the dose obtained at 0°. The maximum deviations occurred at 90° for both axes, with deviations of 7% for the x-axis and 16% for the y-axis. Meanwhile, the minimum deviations were seen at 180° and 360° for the y-axis (0.5%) and x-axis (0.3%), respectively. Single-factor ANOVA testing comparing the effect of incident angle to normalized dose revealed that there was a statistically significant difference in incident angle along the x-axis between at least two groups (F (1, 48) = [65.7], p = 1.51 × 10⁻¹⁰). Using the same approach, a similar statistical difference was observed for the y-axis (F (1, 48) = [65.7], p = 1.52 × 10⁻¹⁰).

3.5. Readout Depletion

Nine OSLDs were irradiated to a dose in the range of 46 cGy to 52 cGy using the geometry described earlier in this paper and were then each readout 34 times. For a given OSLD, the set of 34 readings was normalized by the average of the first four readings for that OSLD. The normalized readings are shown in Figure 13 as a function of OSLD readout to demonstrate the depletion in signal for repeated readings. The fraction by which the signal decreases per reading slightly differs for each OSLD; however, the average is 0.9995. Thus, each readout reduces the OSLD signal by 0.05%. Single-factor ANOVA testing comparing the effect of readout number to normalized dose revealed that there was a statistically significant difference in readouts between at least two groups (F (1, 66) = [93.4], p = 2.90 × 10⁻¹⁴).

3.6. Optical Annealing

The initial dose of each OSLD ranged from 1.429 cGy to 769.1 cGy. The OSLDs were optically annealed for a total time of 2080 min, and readings were conducted periodically throughout. Each OSLD was closed and kept in the dark after each illumination period before readout to prevent the detection of phosphorescent light [21]. The relationship between optical annealing time and the remaining signal is displayed in Figure 14. It can be seen that 90% of the OSLD signal is removed in the first 10 min of light exposure. Further, the OSLD signal reaches a plateau around 1500 min (approximately 24 h) at a signal of 0.01%. This corresponds to a signal size of about 50 counts, which is equivalent to about 0.04 cGy and agrees with the results found by Jursinic [22]. Single-factor ANOVA testing comparing the effect of illumination time to relative signal revealed that there was a statistically significant difference in illumination time between at least two groups (F (1, 30) = [8.36], p = 7.08 × 10⁻³).

3.7. End-to-End Testing

Measurements were made to measure the effect of lead shielding over a pacemaker when treating skin lesions in the surrounding area. Three separate measurements were made, and the data is shown in Table 4. The target dose measurement was compared to the expected dose given by the TPS, and the percent differences were within ±5%. As expected, the absorbed dose to the pacemaker decreased in the presence of lead. Specifically, the lead reduced the dose delivered to the pacemaker by 2.6%.
Measurements were made using the Valencia applicator to measure the effect of lead shielding when treating a facial skin lesion. A dose of 600 cGy was delivered to the target area at a depth of 3 mm, and a total of four measurements were made. Table 5 compares the measurements made by the OSLDs and MOSFETs to each other as well as to the TPS for the target area. Both the OSLD and MOSFET agree very well with the TPS, as the two differ by only 0.09% and 0.33%, respectively. Similarly, Table 6 compares the OAR and surface measurements made by the OSLDs and MOSFETs to each other with and without the use of lead shielding over the OAR. The presence of lead shielding reduced the dose to the OAR for both detectors, where the reduction of the dose was 30% and 18% for the OSLD and MOSFET, respectively. Comparing the measurements made by the OSLDs and MOSFETs, a minimum deviation of 0.42% was observed for the target position, while a maximum deviation of 16% was observed while measuring the effect of lead shielding.

4. Discussion

The dosimetric characteristics of the commercially available OSLD nanoDotTM were studied. Further, the in vivo dosimetric accuracy of OSLDs was analyzed and compared to MOSFETs on the clinical level. The accuracy of each physical measurement was dependent on volume averaging [31]. This effect was minimized by ensuring that the OSLDs were placed with their face orthogonal to the expected dose gradient, which provides a resolution comparable to the width of the Al2O3:C disk (0.2 mm).

4.1. Calibration

This investigation began with the calibration of OSLDs for use in HDR brachytherapy. Three calibration curves were made to cover the range of doses one could measure during treatment. From the validation doses used to measure the accuracy of each curve, the largest deviation between the measured dose and expected dose for the low dose linear, high dose linear, and high dose non-linear calibrations were 2.3%, 1.9%, and 1.9%, respectively. As each of these validation results was well within ±5.0% of the expected dose, all three calibration curves were deemed acceptable for research and clinical use. One of the main difficulties in building these calibration curves was working with the steep dose gradient of HDR brachytherapy. To mitigate this challenge, the calibration phantom was redesigned to increase the source-to-OSLD distance. This allowed for OSLD measurements to be taken in an environment where the dose gradient was not as steep. The redesigned phantom is shown in Figure 3.

4.2. Dose Linearity

As part of this study, the dose linearity of OSLDs was investigated. As shown in Figure 10, the OSLDs exhibited a linear behavior up to approximately 275 cGy, after which a supralinear behavior was observed. These results agree well with previous findings [21,22,30,32] and support Landauer’s recommendation to use a non-linear calibration curve for readouts expected to be 300 cGy or higher. The supralinear behavior of an OSLD is the result of the extra luminescence emitted from the deeper electron traps of the OSLD during irradiation at higher doses [32,33]. In comparison, low dose irradiations fill very few deep electron traps. As a result, they compete for the luminescence centers for electrons formed during charge separation, thus giving a linear response [21]. As can be seen from Figure 10, the supralinear factor increases with increased dose and thus must be accounted for during readout.

4.3. Dose Rate Dependence

The dependence on instantaneous dose rate was tested in this study, and a linear relationship between counts and dose rate was observed (Figure 11). These results agree well with the findings of previous studies, which also found there to be no dose rate dependence for OSLDs when varying the source-to-OSLD distance with a constant dwell time [30,34]. Further, Table 3 demonstrates the level of agreement between the measurements made in this experiment to the expected theoretical values calculated using TG-43U1 as a reference [28]. As can be seen, the measurements made are consistent with the theoretical values, with a maximum divergence of 1.9%, which falls well below the clinically acceptable limit of 5.0% [28,35].

4.4. Angular Dependence

Angular dependence is an important characteristic to be aware of for any type of dosimeter. This comes as the angle at which the dose gradient is incident on the dosimeter may significantly affect the accuracy of dosimetric measurements. This OSLD characteristic has been well-tested and documented for OSLD use in external beam radiotherapy but has rarely been tested for use in HDR brachytherapy [36,37,38]. As such, the angular dependence of OSLDs was tested in this study, and it was discovered that angular dependence becomes significant in edge-on scenarios, as shown in Figure 12. The setup used for this experiment was designed to be as reproducible as possible to minimize setup errors between incident angles. The deviations observed are attested to the light-tight case of the OSLD and the position of the Al2O3:C disk. The thin and thick edges of the OSLD case present a challenge for accurate dosimetry when facing the 192Ir source. This effect is exacerbated by the off-center position of the Al2O3:C disk, which introduces positional uncertainties with regards to the source’s distance in edge-on scenarios. These results are supported by those of Sharma and Jursinic, who also observed deviations in OSLD signal in edge-on angulations [17]. Further, Rejab et al. reported an angular dependence as high as 16% for certain incident angles, which was attested to the Al2O3:C disk of the OSLD being off-centered [39].
Interestingly, the results of previous studies that tested OSLD angular dependence for use in external beam radiotherapy reported very low angular dependence, even in edge-on scenarios [36,37,38]. This, however, can be explained by the characteristic steep dose gradient of HDR brachytherapy. In other words, a small deviation in the distance between the source and OSLD-sensitive element will have a much more significant effect in a high dose gradient than a low dose gradient, as seen with HDR brachytherapy and external beam treatments, respectively. For this reason, OSLDs are reported to be more dependent on incident angle when measurements are made in an HDR brachytherapy environment, as shown in this study. From this study, an edge-on scenario would describe an angle of incidence of 90° ± 30° and 270° ± 30° where deviations were as large as 16% and 9%, respectively. As such, it is recommended that OSLDs should be positioned such that the face of the OSLD is orthogonal to the expected incident dose gradient to avoid angulation effects and volume-averaging corrections during readout. However, it is possible to derive an angular dependence correction factor in cases where edge-on cases are unavoidable, which is outside the scope of this study.

4.5. Readout Depletion

Both the readout and optical annealing processes of OSLDs expose the Al2O3:C part of the dosimeter to a certain amount of illumination. As such, OSLDs are subject to a depletion in signal with multiple readouts as each readout partially discharges the trapped charges. However, one of the attractive qualities of OSLDs is their ability to be readout multiple times with a minimal effect on the readout. Specifically, this study found that each readout reduces the OSLD signal by 0.05%, which is displayed in Figure 13. This provides one with the flexibility to readout OSLDs multiple times without sacrificing the accuracy of the readout, a quality that many other dosimeters do not have. In comparison to previous studies, these results lie comfortably between the range of signal depletion rates reported in the past as being 0.03–0.06% signal depletion per readout [21,40]. However, it is important to note that the rate of signal depletion with readout strongly relies on the mode in which the microStarTM reader is in. Most commonly, OSLDs are read out using a weak beam of light (which was performed in this study and by the work of past studies previously mentioned [21,40]). However, the work done by Scarboro et al. shows that OSLDs experience a readout depletion as high as 7% per readout when reading the OSLD with a strong beam of light, which exposes the sensitive element to seven seconds of illumination per readout [41].

4.6. Optical Annealing

One of the many interesting properties of OSLDs is their ability to be reused. The data displayed in Figure 14 shows that OSLDs can effectively be reused repeatedly as long as they are optically annealed and a baseline measurement is taken between radiation exposures. OSLDs can successfully be optically annealed by a minimum exposure of 24 h to a mercury-lamped X-ray lightbox. There are several other studies, however, that report success in optically annealing OSLDs using different light sources for different time intervals. One notable method is the use of a tungsten–halogen lamp and an illumination time of one minute [21]. Additionally, 1000 min of illumination by a 14 W compact fluorescent lamp was able to optically anneal OSLDs to a similar level [22]. The importance of taking a baseline reading after optical annealing and before radiation exposure is to isolate the added dose from the most recent irradiation. Specifically, studies have shown that OSLDs cannot be completely annealed by optical means [33,42]. The process of optical annealing frees electron traps in the Al2O3:C material, and it is the magnitude of these electron traps that is related to the dose. However, there are deep electron traps that can only be freed by thermal means reaching temperatures as high as 900 °C [43]. The Landauer OSLD nanoDotTM is not designed to withstand such high temperatures as its light-tight plastic case would melt. As such, these OSLDs can be optically annealed to reduce their signal to 0.01% of the original, which must be accounted for in the final readout of OSLDs that were annealed and subsequently irradiated. Additionally, optical annealing of OSLDs is important between radiation exposures because several studies have shown that the characteristics and dose-response of OSLDs become altered beginning at an accumulated dose of 15 Gy for a given OSLD [21,22,44].

4.7. End-to-End Testing

Two hypothetical clinical cases were tested in this study to measure the accuracy of OSLDs compared to the TPS as well as MOSFETs. For the first end-to-end test simulating treatment near a pacemaker, it was found that the OSLD measurement for the target and pacemaker agrees with the TPS to within ±5.0%, and the lead shielding reduces the absorbed dose to the pacemaker by 2.6%, as expected. A potential source of error for this test was the positioning of the OSLD on the phantom with respect to the point of measurement in the TPS. Specifically, measurements were performed near high-dose gradients, and the OSLD irradiation geometry did not well-simulate a unique point in the phantom. As such, there were slight positional differences between the points of measurement for the TPS and OSLD. Although the effect of this source of error was minimal, one way to better simulate a unique point in the phantom would be to use BB skin markers to mark each point of measurement on the phantom. As BB skin markers are radiolucent, they would be visible on the phantom in the TPS and allow one to position the OSLD such that the point of physical measurement coincides with the TPS point of calculation. OSLDs are commonly used to measure the absorbed dose to pacemakers for patients receiving external beam radiotherapy in that area [45,46,47]; however, OSLDs are not as commonly used for the same purpose in superficial HDR brachytherapy. Despite this, the importance of in vivo dosimetry for treatment quality assurance is needed to ensure each patient’s treatment is safe and effective. The use of OSLDs to monitor the OAR absorbed dose, in this case, acts like a second verification system for the dose being delivered to the target area and surrounding tissue.
The second case study measured the dose to the lens of the eye while treating a facial skin lesion. Table 5 and Table 6 show how the OSLD and MOSFET measurements compare to each other, with a maximum disagreement of 16%. The level of disagreement is attested to slight deviations in OSLD placement. Specifically, this test was run twice: once without lead shielding and once with lead shielding over the OAR. Before the next test was run, the irradiated OSLDs were switched out for new OSLDs in preparation for the next measurement, whereas the MOSFET channels remained taped in place on the phantom. As such, since the measurements were taken near high-dose gradients, it is reasonable to assume there were small deviations in OSLD placement between test runs that would account for the level of disagreement observed between OSLDs and MOSFETs. In comparison to the TPS, the OSLDs and MOSFETs have a disagreement of 0.09% and 0.33%, respectively. Although both systems have shown to be accurate well within clinical acceptance, this preliminary study indicates that OSLDs are the more accurate in vivo dosimetric system. As seen in the first case, the presence of lead decreases the OAR dose. The significance of OSLDs for dosimetric measurements, in this case, stems from the inability of the TPS to account for the presence of lead. The TPS assumes everything is water-equivalent and thus calculates site-specific absorbed doses accordingly. For when a lead shield is placed over an OAR, such as the lens, the TPS overestimates the OAR’s absorbed dose. Clinically, an overestimate of the dose for an OAR can serve as an abundance of caution. However, treatment plans can be optimized with a better understanding of the true OAR dose, which can be provided by OSLDs. Additionally, the Valencia and Leipzig applicators rely on calculations based on manufacturer-provided dwell times, which are specific to only the target dose at a depth of 3 mm. As such, OSLDs can be used to measure the dose delivered to a nearby OAR to help determine if lead shielding is required and/or if the treatment plan needs to be adjusted.

4.8. OSLDs vs. MOSFETs: Clinical Relevance

OSLDs and MOSFETs are an interesting set of systems to compare based on their properties, something that no other researcher has done to date. OSLDs rely on visible light emitted from the Al2O3:C material after exposure to ionizing radiation to measure the absorbed dose. Meanwhile, MOSFETs rely on a change in the threshold voltage needed to induce source-to-drain current flows following exposure to ionizing radiation, where it is the change in threshold voltage that is proportional to dose [25,48]. As seen from the results of this study, the clinical advantages of OSLDs are as follows: small size, reusable, allows multiple readouts, affordable, linear dose-response, and dose rate independence. Conversely, the clinical disadvantages of OSLDs are that they cannot be fully annealed optically, and their sensitivity changes with accumulated dose (>15 Gy) [21,22,44]. Together, these features make the use of OSLDs as an in vivo dosimeter an easy choice for medical physicists due to their reliability and minimal effect on patients during treatment. In comparison, MOSFETs have been used for in vivo dosimetry for several years, but many clinics and centers are switching to the newer technology that is OSLDs. The clinical benefits of MOSFETs are their small size, dose linearity, and immediate readouts. However, some major disadvantages of this system are its cost, limited lifespan, annual calibrations, dosimeter design, and temperature, dose rate, and directional dependence. Specifically, MOSFETs measure dose by gauging the level of damage caused by ionizing radiation. This, in turn, means that MOSFETs have a given lifespan of 20 V (200 Gy), after which they need to be replaced [49,50]. Further, this system involves many wires that are often taped to or lying on the patient during treatment. This causes an added level of stress and discomfort for the patient during their treatment and can even affect the quality of patient treatment if they suffer from claustrophobia.

5. Conclusions

The work done in this study successfully broadens the use of OSLDs to superficial HDR brachytherapy and determines that OSLDs can effectively replace MOSFETs for in vivo dosimetry. OSLDs provide a unique option for in vivo dosimetry as their small size allows them to avoid volume averaging and limited spatial resolution, a major problem many other HDR brachytherapy detectors face. The results of this study show that OSLDs exhibit supralinear behavior for absorbed doses surpassing 275 cGy and an angular dependence in edge-on scenarios. These are crucial factors to account for in practice to ensure the accuracy of OSLD readout regardless of its setup geometry and exposed dose. Additionally, OSLD independence on dose rate and minimal readout depletion offers the user peace of mind and flexibility in treatment planning and measurement verification. The use of an X-ray light box illuminated by mercury lamps offers a sufficient alternative optical annealing solution to reuse OSLDs. Further, the novel comparison between OSLDs and MOSFETs in this study proves that OSLDs can successfully replace MOSFETs for in vivo dosimetry in HDR brachytherapy. The significance of this comes as the convenience and reliability of OSLDs promotes and encourages more frequent in vivo dosimetric measurements. This, in turn, allows for a better understanding of the dose distribution for a given setup as well as more effective and safer treatment plans. Overall, for nanoDotsTM to provide accurate measurements in an 192Ir radiation field, the following conclusions must be accounted for.
  • Use of screened nanoDotsTM is recommended for building calibration curves.
  • The appropriate calibration must be selected before measurement.
  • Using a weak beam of light, OSLDs exhibit minimal signal depletion with multiple readouts (−0.05% per readout).
  • OSLDs exhibit angular dependence in edge-on cases which are 90° ± 30° and 270° ± 30° in incident angle. It is recommended to place OSLDs orthogonal or near orthogonal to the expected incident dose gradient to prevent angular dependence and volume-averaging corrections during readout.
  • Optical annealing of OSLDs is a viable way to reuse OSLDs for clinical and research purposes, permitting a baseline measurement to be made after the annealing period and before the next irradiation.
  • Using the light source described in this paper, OSLDs must be optically annealed for a minimum of 24 h and subsequently kept in the dark for a minimum of four minutes prior to a baseline readout.
  • Precise comparisons of OSLD, MOSFET, and TPS point doses are only recommended when OSLDs and MOSFETs are positioned in low-dose gradient regions or when the OSLD irradiation geometry closely matches the geometry of the tissue of interest. Otherwise, very large discrepancies are to be expected due to positional uncertainties.
  • In vivo dose measurements can successfully be made.

Supplementary Materials

The following supporting information can be downloaded at: https://www.mdpi.com/article/10.3390/radiation2040026/s1.

Author Contributions

Conceptualization, E.S. and A.R.B.; Data curation, A.L., E.S. and A.R.B.; Formal analysis, A.L. and E.S.; Investigation, A.L., E.S. and A.R.B.; Methodology, E.S. and A.R.B.; Project administration, A.L., E.S. and A.R.B.; Supervision, E.S. and A.R.B.; Validation, A.L., E.S. and A.R.B.; Writing—original draft, A.L.; Writing—review and editing, A.L., E.S. and A.R.B. All authors have read and agreed to the published version of the manuscript.
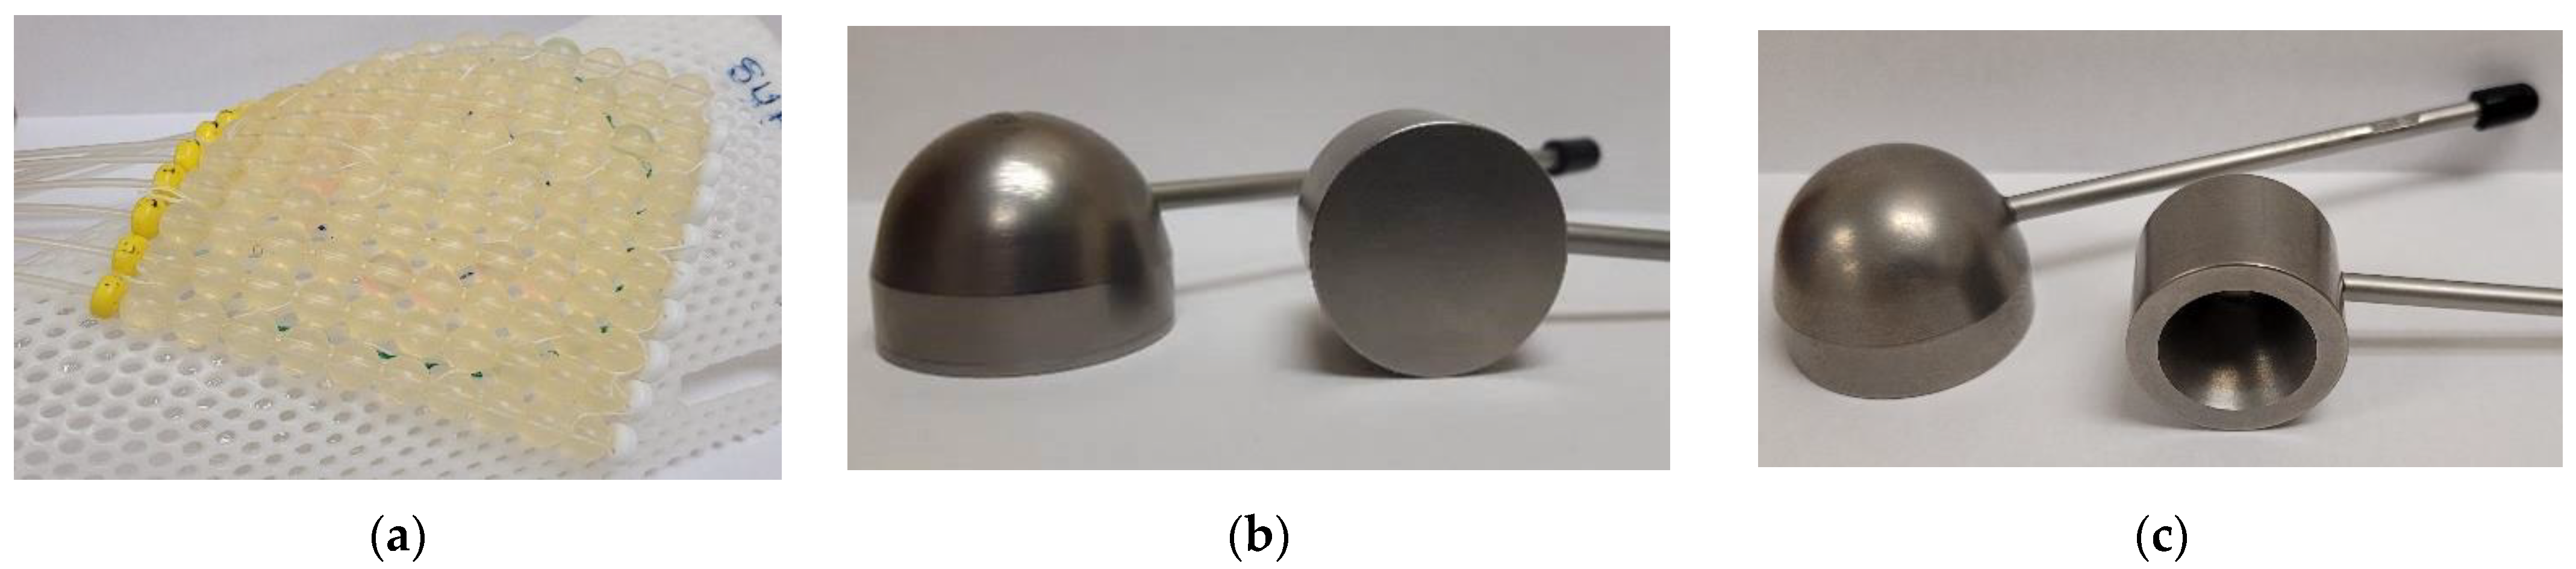
Funding

This research received no external funding.

Institutional Review Board Statement

Not applicable.

Informed Consent Statement

Not applicable.

Data Availability Statement

The data supporting these results can be found in the “Supplementary Materials” section.

Acknowledgments

Thank you to the Medical Physics department at the Carlo Fidani Regional Cancer Centre for the resources and opportunity to conduct this research project.

Conflicts of Interest

The authors declare no conflict of interest.

References

  1. Apalla, Z.; Lallas, A.; Sotiriou, E.; Lazaridou, E.; Ioannides, D. Epidemiological trends in skin cancer. Derm. Pr. Concept. 2017, 7, 1–6. [Google Scholar] [CrossRef] [PubMed] [Green Version]
  2. Centers for Disease Control and Prevention. Kinds of Cancer. Available online: https://www.cdc.gov/cancer/kinds.htm (accessed on 3 July 2022).
  3. Government of Canada. Non Melanoma Skin Cancer. Available online: https://www.canada.ca/en/public-health/services/chronic-diseases/cancer/non-melanoma-skin-cancer.html (accessed on 3 July 2022).
  4. Griffin, L.L.; Ali, F.R.; Lear, J.T. Non-melanoma skin cancer. Clin. Med. J. 2016, 16, 62–65. [Google Scholar] [CrossRef] [PubMed]
  5. Fahradyan, A.; Howell, A.C.; Wolfswinkel, E.M.; Tsuha, M.; Sheth, P.; Wong, A.K. Updates on the management of non-melanoma skin cancer (NMSC). Healthcare 2017, 5, 82. [Google Scholar] [CrossRef] [Green Version]
  6. Taylor, J.M.; Dasgeb, B.; Liem, S.; Ali, A.; Harrison, A.; Finkelstein, M.; Cha, J.; Anne, R.; Greenbaum, S.; Sherwin, W.; et al. High-dose-rate brachytherapy for the treatment of basal and squamous cell carcinomas on sensitive areas of the face: A report of clinical outcomes and acute and subacute toxicities. Adv. Radiat. Oncol. 2020, 6, 100616. [Google Scholar] [CrossRef] [PubMed]
  7. Luo, Y.M.; Xia, N.X.; Yang, L.; Li, Z.; Yang, H.; Yu, H.J.; Liu, Y.; Lei, H.; Zhou, F.X.; Xie, C.H.; et al. CTC1 increases the radioresistance of human melanoma cells by inhibiting telomere shortening and apoptosis. Int. J. Mol. Med. 2014, 33, 1484–1490. [Google Scholar] [CrossRef] [PubMed] [Green Version]
  8. Skowronek, J. Brachytherapy in the treatment of skin cancer: An overview. Postep. Derm. Alergol. 2015, 32, 326–367. [Google Scholar] [CrossRef] [Green Version]
  9. Delishaj, D.; Rembielak, A.; Manfredi, B.; Ursino, S.; Pasqualetti, F.; Laliscia, C.; Orlandi, F.; Morganti, R.; Fabrini, M.G.; Paiar, F. Non-melanoma skin cancer treated with high-dose-rate brachytherapy: A review of literature. J. Contemp. Brachytherapy 2016, 8, 533–540. [Google Scholar] [CrossRef] [Green Version]
  10. Amendola, B.E.; Perez, N.; Amendola, M.A.; Fowler, J. High-dose-rate (HDR) brachytherapy for facial non-melanoma skin cancer (NMSC) using custom-made molds and a shortened fractionation schedule. Int. J. Radiat. Oncol. Biol. Phys. 2013, 87, S616. [Google Scholar] [CrossRef]
  11. Laliscia, C.; Fuentes, T.; Coccia, N.; Mattioni, R.; Perrone, F.; Paiar, F. High-dose-rate brachytherapy for non-melanoma skin cancer using tailored custom moulds—A single center experience. Contemp. Oncol. 2021, 25, 12–16. [Google Scholar] [CrossRef]
  12. Casey, S.; Awotwi-Pratt, J.; Bahl, G. Surface mould brachytherapy for skin cancers: The British Columbia cancer experience. Cureus 2019, 11, e6412. [Google Scholar] [CrossRef]
  13. Fonseca, G.P.; Johansen, J.G.; Smith, R.L.; Beaulieu, L.; Beddar, S.; Kertzscher, G.; Verhaegen, F.; Tanderup, K. In vivo dosimetry in brachytherapy: Requirements and future directions for research, development, and clinical practice. Phys. Imaging Radiat. Oncol. 2020, 16, 1–11. [Google Scholar] [CrossRef] [PubMed]
  14. Granero, D.; Pérez-Calatayud, J.; Casal, E.; Ballester, F.; Venselaar, J. A dosimetryic study on the Ir-192 high dose rate Flexisource. Med. Phys. 2006, 33, 4578–4582. [Google Scholar] [CrossRef] [PubMed]
  15. Kertzscher, G.; Rosenfeld, A.; Tanderup, K.; Cygler, J.E. In vivo dosimetry: Trends and prospects for brachytherapy. Br. J. Radiol. 2014, 87, 206. [Google Scholar] [CrossRef] [Green Version]
  16. Tanderup, K.; Beddar, S.; Andersen, C.E.; Kertzscher, G.; Cygler, J.E. In vivo dosimetry in brachytherapy. Med. Phys. 2013, 40, 070902. [Google Scholar] [CrossRef] [PubMed] [Green Version]
  17. Sharma, R.; Jursinic, P.A. In vivo measurements for high dose rate brachytherapy with optically stimulated luminescent dosimeters. Med. Phys. 2013, 40, 071730. [Google Scholar] [CrossRef] [PubMed]
  18. Shablonin, E.; Popov, A.; Prieditis, G.; Vasil’Chenko, E.; Lushchik, A. Thermal annealing and transformation of dimer F centers in neutron-irradiated Al2O3 single crystals. J. Nucl. Mater. 2021, 543, 152600. [Google Scholar] [CrossRef]
  19. Evans, B.D.; Pogatshnik, G.J.; Chen, Y. Optical properties of lattice defects in α-Al2O3. Nucl. Instrum. Methods Phys. Res. Sect. B Beam Interact. Mater. At. 1994, 91, 258–262. [Google Scholar] [CrossRef]
  20. Lushchik, A.; Lushchik, C.; Schwartz, K.; Savikhin, F.; Shablonin, E.; Shugai, A.; Vasil’Chenko, E. Creation and clustering of Frenkel defects at high density of electronic excitations in wide-gap materials. Nucl. Instrum. Methods Phys. Res. Sect. B Beam Interact. Mater. At. 2012, 277, 40–44. [Google Scholar] [CrossRef]
  21. Jursinic, P.A. Characterization of optically stimulated luminescent dosimeters, OSLDs, for clinical dosimetric measurements. Med. Phys. 2007, 34, 4594–4604. [Google Scholar] [CrossRef]
  22. Jursinic, P.A. Changes in optically stimulated luminescent dosimeter (OSLD) dosimetric characteristics with accumulated dose. Med. Phys. 2010, 37, 132–140. [Google Scholar] [CrossRef]
  23. Ponmalar, Y.R.; Manickam, R.; Sathiyan, S.; Ganesh, K.M.; Arun, R.; Godson, H.F. Response of nanodot optically stimulated luminescence dosimeters to therapeutic electron beams. J. Med. Phys. 2017, 42, 42–47. [Google Scholar] [CrossRef] [PubMed]
  24. Kutcher, G.J.; Coia, L.; Gillin, M.; Hanson, W.F.; Leibel, S.; Morton, R.J.; Palta, J.R.; Purdy, J.A.; Reinstein, L.E.; Svensson, G.K.; et al. Comprehensive QA for radiation oncology: Report of AAPM radiation therapy committee Task Group 40. Med. Phys. 1994, 21, 581–618. [Google Scholar] [CrossRef] [PubMed]
  25. Kumar, A.S.; Sharma, S.D.; Ravindran, B.P. Characteristics of mobile MOSFET dosimetry system for megavoltage photon beams. J. Med. Phys. 2014, 39, 142–149. [Google Scholar] [CrossRef]
  26. Hsu, S.-M.; Wu, C.-H.; Lee, J.-H.; Hsieh, Y.-J.; Yu, C.-Y.; Liao, Y.-J.; Kuo, L.-C.; Liang, J.-A.; Huang, D.Y.C. A Study on the dose distributions in various materials from an Ir-192 HDR brachytherapy source. PLoS ONE 2012, 7, e44528. [Google Scholar] [CrossRef] [Green Version]
  27. Sun Nuclear: A Mirion Medical Company. Solid Water® HE. Available online: https://www.sunnuclear.com/products/solid-water-he (accessed on 10 October 2022).
  28. Rivard, M.J.; Coursey, B.M.; DeWerd, L.A.; Hanson, W.F.; Huq, M.S.; Ibbott, G.S.; Mitch, M.G.; Nath, R.; Williamson, J.F. Update of AAPM Task Group No. 43 Report: A revised AAPM protocol for brachytherapy dose calculations. Med. Phys. 2004, 31, 663–674. [Google Scholar] [CrossRef] [PubMed]
  29. Park, J.M.; Kim, I.H.; Ye, S.; Kim, K. Evaluation of treatment plans using various treatment techniques for the radiotherapy of cutaneous Kaposi’s sarcoma developed on the skin of feet. J. Appl. Clin. Med. Phys. 2014, 15, 4970. [Google Scholar] [CrossRef] [PubMed]
  30. Tien, C.J.; Ebeling, R.; Hiatt, J.R.; Curran, B.; Sternick, E. Optically stimulated luminescent dosimetry for high dose rate brachytherapy. Front. Oncol. 2012, 2, 91. [Google Scholar] [CrossRef] [Green Version]
  31. DeWerd, L.A.; Ibbott, G.S.; Meigooni, A.S.; Mitch, M.G.; Rivard, M.J.; Stump, K.E.; Thomadsen, B.R.; Venselaar, J.L.M. A dosimetric uncertainty analysis for photon-emitting brachytherapy sources: Report of AAPM Task Group No. 138 and GEC-ESTRO. Med. Phys. 2011, 38, 782–801. [Google Scholar] [CrossRef] [Green Version]
  32. Ponmalar, R.; Manickam, R.; Ganesh, K.M.; Saminathan, S.; Raman, A.; Godson, H.F. Dosimetric characterization of optically stimulated luminescence dosimeter with therapeutic photon beams for use in clinical radiotherapy measurements. J. Cancer Res. Ther. 2017, 13, 304–312. [Google Scholar] [CrossRef]
  33. Liu, K. Preliminary investigation into the regeneration of luminescent signal in nanoDot OSLDs. J. Appl. Clin. Med. Phys. 2020, 21, 256–262. [Google Scholar] [CrossRef]
  34. Raj, L.J.S.; Pearlin, B.; Peace, T.; Isiah, R.; Singh, I.R.R. Characterisation and use of OSLD for In vivo dosimetry in head and neck intensity-modulated radiation therapy. J. Radiother Pract. 2020, 20, 448–454. [Google Scholar] [CrossRef]
  35. Klein, E.E.; Hanley, J.; Bayouth, J.; Yin, F.-F.; Simon, W.; Dresser, S.; Serago, C.; Aguirre, F.; Ma, L.; Arjomandy, B.; et al. Task Group 142 report: Quality assurance of medical accelerators. Med. Phys. 2009, 36, 4197–7212. [Google Scholar] [CrossRef] [PubMed]
  36. Lehmann, J.; Dunn, L.; Lye, J.E.; Kenny, J.W.; Alves, A.D.C.; Cole, A.; Asena, A.; Kron, T.; Williams, I.M. Angular dependence of the response of the nanoDot OSLD system for measurements at depth in clinical megavoltage beams. Med. Phys. 2014, 41, 64712. [Google Scholar] [CrossRef] [PubMed] [Green Version]
  37. Kerns, J.R.; Kry, S.F.; Sahoo, N.; Followill, D.S.; Ibbott, G.S. Angular dependence of the nanoDot OSL dosimeter. Med. Phys. 2011, 38, 3955–3962. [Google Scholar] [CrossRef] [Green Version]
  38. Jursinic, P.A. Angular dependence of dose sensitivity of nanoDot optically stimulated luminescent dosimeters in different radiation geometries. Med. Phys. 2015, 42, 5633–5641. [Google Scholar] [CrossRef]
  39. Rejab, M.; Wong, J.H.D.; Jamalludin, Z.; Jong, W.L.; Malik, R.A.; Ishak, W.Z.W.; Ung, N.M. Dosimetric characterisation of the optically-stimulated luminescence dosimeter in cobalt-60 high dose rate brachytherapy system. Australas. Phys. Eng. Sci. Med. 2018, 41, 475–485. [Google Scholar] [CrossRef]
  40. Dunn, L.; Lye, J.; Kenny, J.; Lehmann, J.; Williams, I.; Kron, T. Commissioning of optically stimulated luminescence dosimeters for use in radiotherapy. Radiat. Meas. 2013, 51–52, 31–39. [Google Scholar] [CrossRef]
  41. Scarboro, S.B.; Cody, D.; Alvarez, P.; Followill, D.; Court, L.; Stingo, F.C.; Zhang, D.; Gray, M.M.N.I.; Kry, S.F. Characterization of the nanoDot OSLD dosimeter in CT. Med. Phys. 2015, 42, 1797–1807. [Google Scholar] [CrossRef] [Green Version]
  42. Yukihara, E.G.; Whitley, V.H.; McKeever, S.W.S.; Akselrod, A.E.; Akselrod, M.S. Effect of high-dose irradiation on the optically stimulated luminescence of Al2O3:C. Radiat. Meas. 2004, 38, 317–330. [Google Scholar] [CrossRef]
  43. Yukihara, E.G.; McKeever, S.W.S. Optically stimulated luminescence (OSL) dosimetry in medicine. Phys. Med. Biol. 2008, 53, R351. [Google Scholar] [CrossRef]
  44. Al-Senan, R.M.; Hatab, M.R. Characteristics of an OSLD in the diagnostic energy range. Med. Phys. 2011, 38, 4396–4405. [Google Scholar] [CrossRef] [PubMed]
  45. Yan, H.; Guo, F.; Zhu, D.; Stryker, S.; Trumpore, S.; Roberts, K.; Higgins, S.; Nath, R.; Chen, Z.; Liu, W. On the use of bolus for pacemaker dose measurement and reduction in radiation therapy. J. Appl. Clin. Med. Phys. 2018, 19, 125–131. [Google Scholar] [CrossRef] [PubMed] [Green Version]
  46. Peet, S.C.; Wilks, R.; Kairn, T.; Crowe, S.B. Measuring dose from radiotherapy treatments in the vicinity of a cardiac pacemaker. Phys. Med. 2016, 32, 1529–1536. [Google Scholar] [CrossRef] [PubMed]
  47. Chan, M.F.; Young, C.; Gelblum, D.; Shi, C.; Rincon, C.; Hipp, E.; Li, J.; Wang, D. A review and analysis of managing commonly seen implanted devices for patients undergoing radiation therapy. Adv. Radiat. Oncol. 2021, 6, 100732. [Google Scholar] [CrossRef] [PubMed]
  48. Gopiraj, A.; Billimagga, R.S.; Ramasubramanian, V. Performance characteristics and commissioning of MOSFET as an in-vivo dosimeter for high energy photon external beam radiation therapy. Rep. Pract. Oncol. Radiother. 2008, 13, 114–125. [Google Scholar] [CrossRef] [Green Version]
  49. Cheung, T.; Butson, M.J.; Yu, P.K.N. Energy dependence corrections to MOSFET dosimetric sensitivity. Australas. Phys. Eng. Sci. Med. 2009, 32, 16–20. [Google Scholar] [CrossRef]
  50. Consorti, R.; Petrucci, A.; Fortunato, F.; Soriani, A.; Marzi, S.; Iaccarino, G.; Landoni, V.; Benassi, M. In vivo dosimetry with MOSFETs: Dosimetric characterization and first clinical results in intraoperative radiotherapy. Int. J. Radiat. Oncol. Biol. Phys. 2005, 63, 952–960. [Google Scholar] [CrossRef]
Figure 1. Three common high dose rate (HDR) brachytherapy applicators. (a) A 10 catheter Freiburg flap applicator; (b) A horizontal 3 cm diameter (left) and horizontal 2 cm diameter (right) Valencia applicator; (c) A horizontal 3 cm diameter (left) and horizontal 2 cm diameter (right) Leipzig applicator.
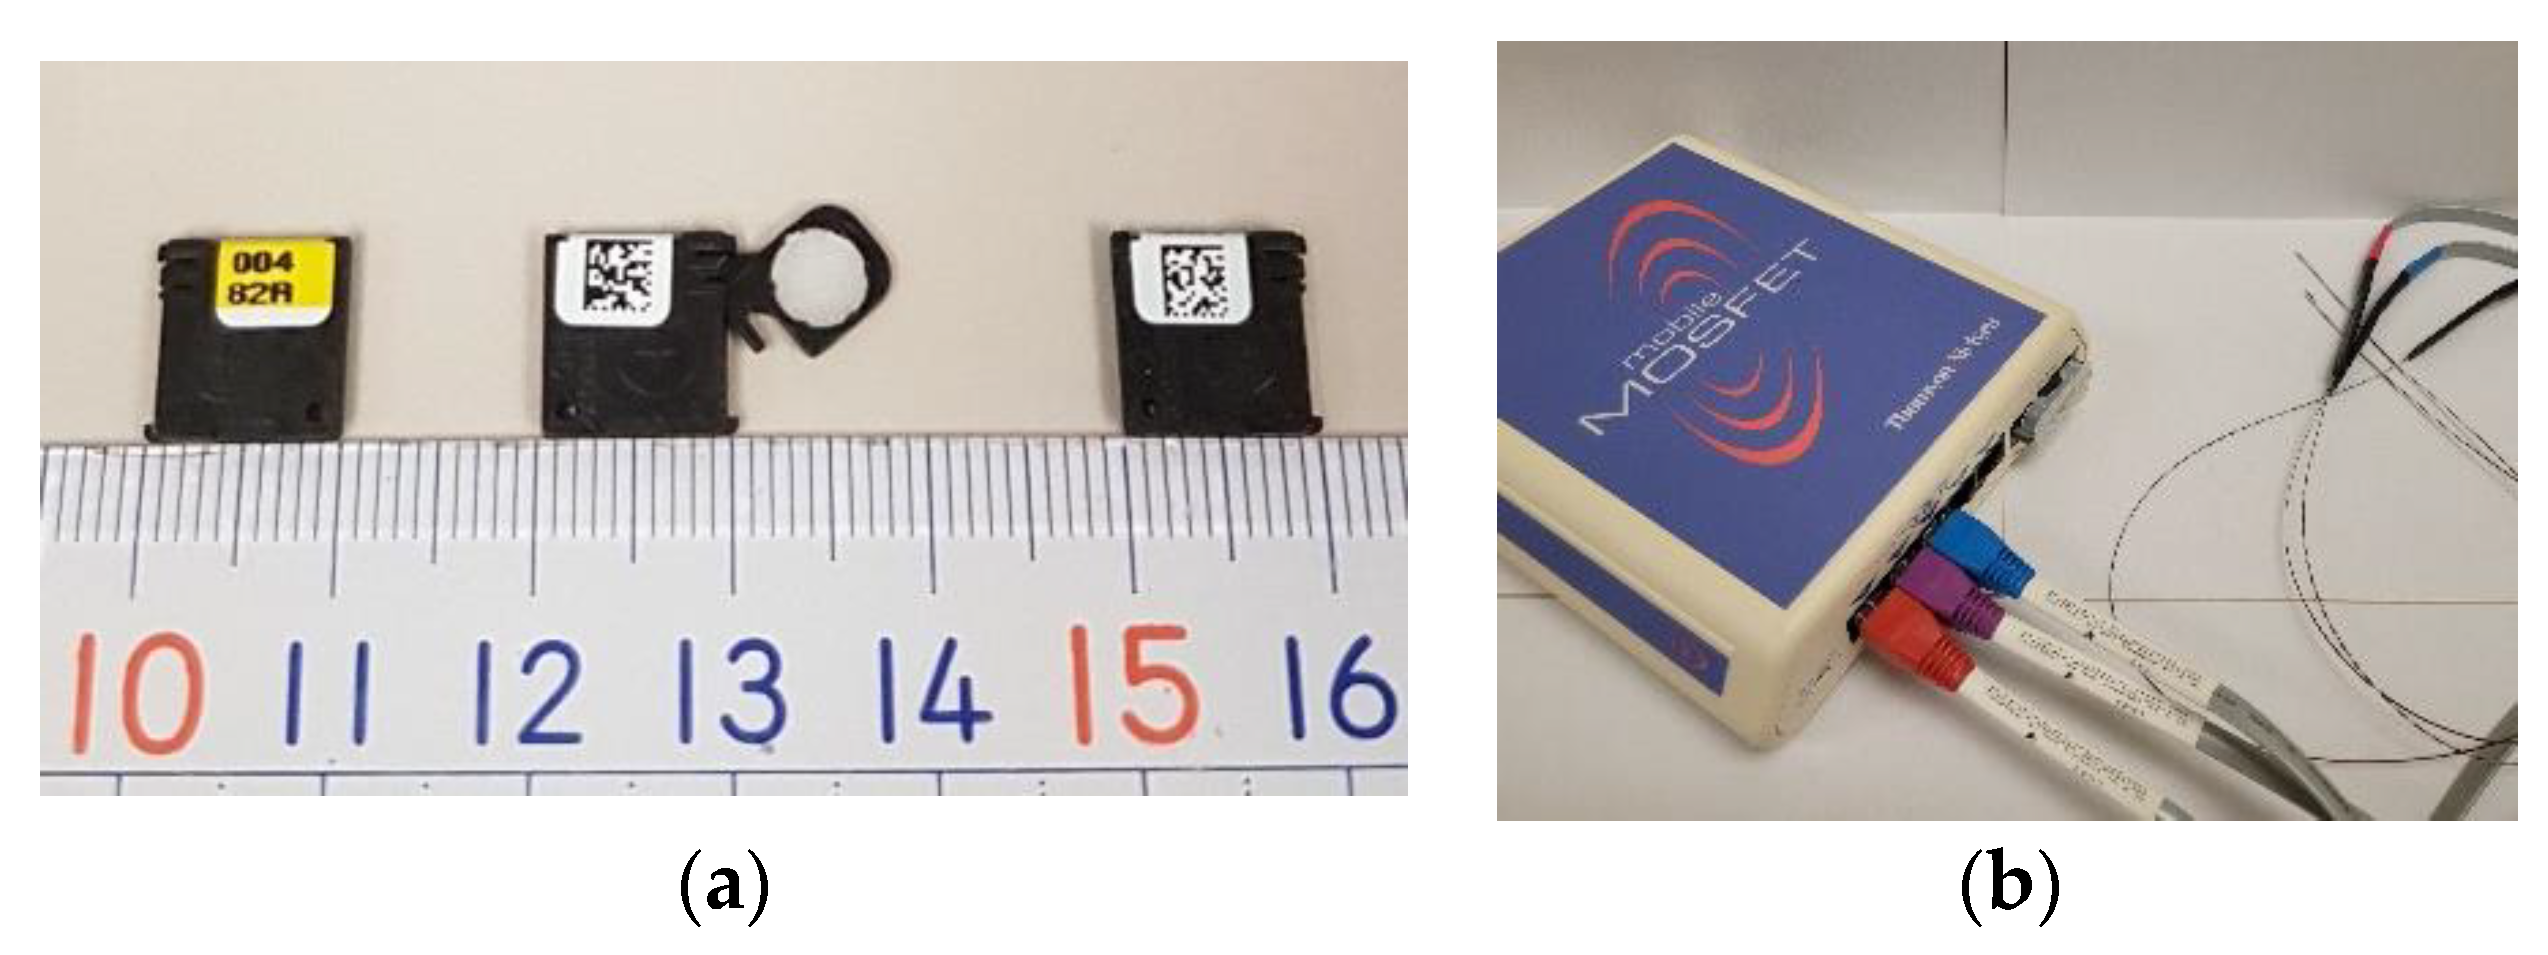
Radiation 02 00026 g001
Figure 2. Optically-stimulated luminescence dosimeter (OSLD) and metal-oxide-semiconductor field-effect transistor (MOSFET) system. (a) A nanoDot TM shown to display its lot number face in closed position (left), QR code face in open position (middle), and QR code face in closed position (right); (b) An image of a mobileMOSFET single channel dosimeter system with three of the five channels connected.
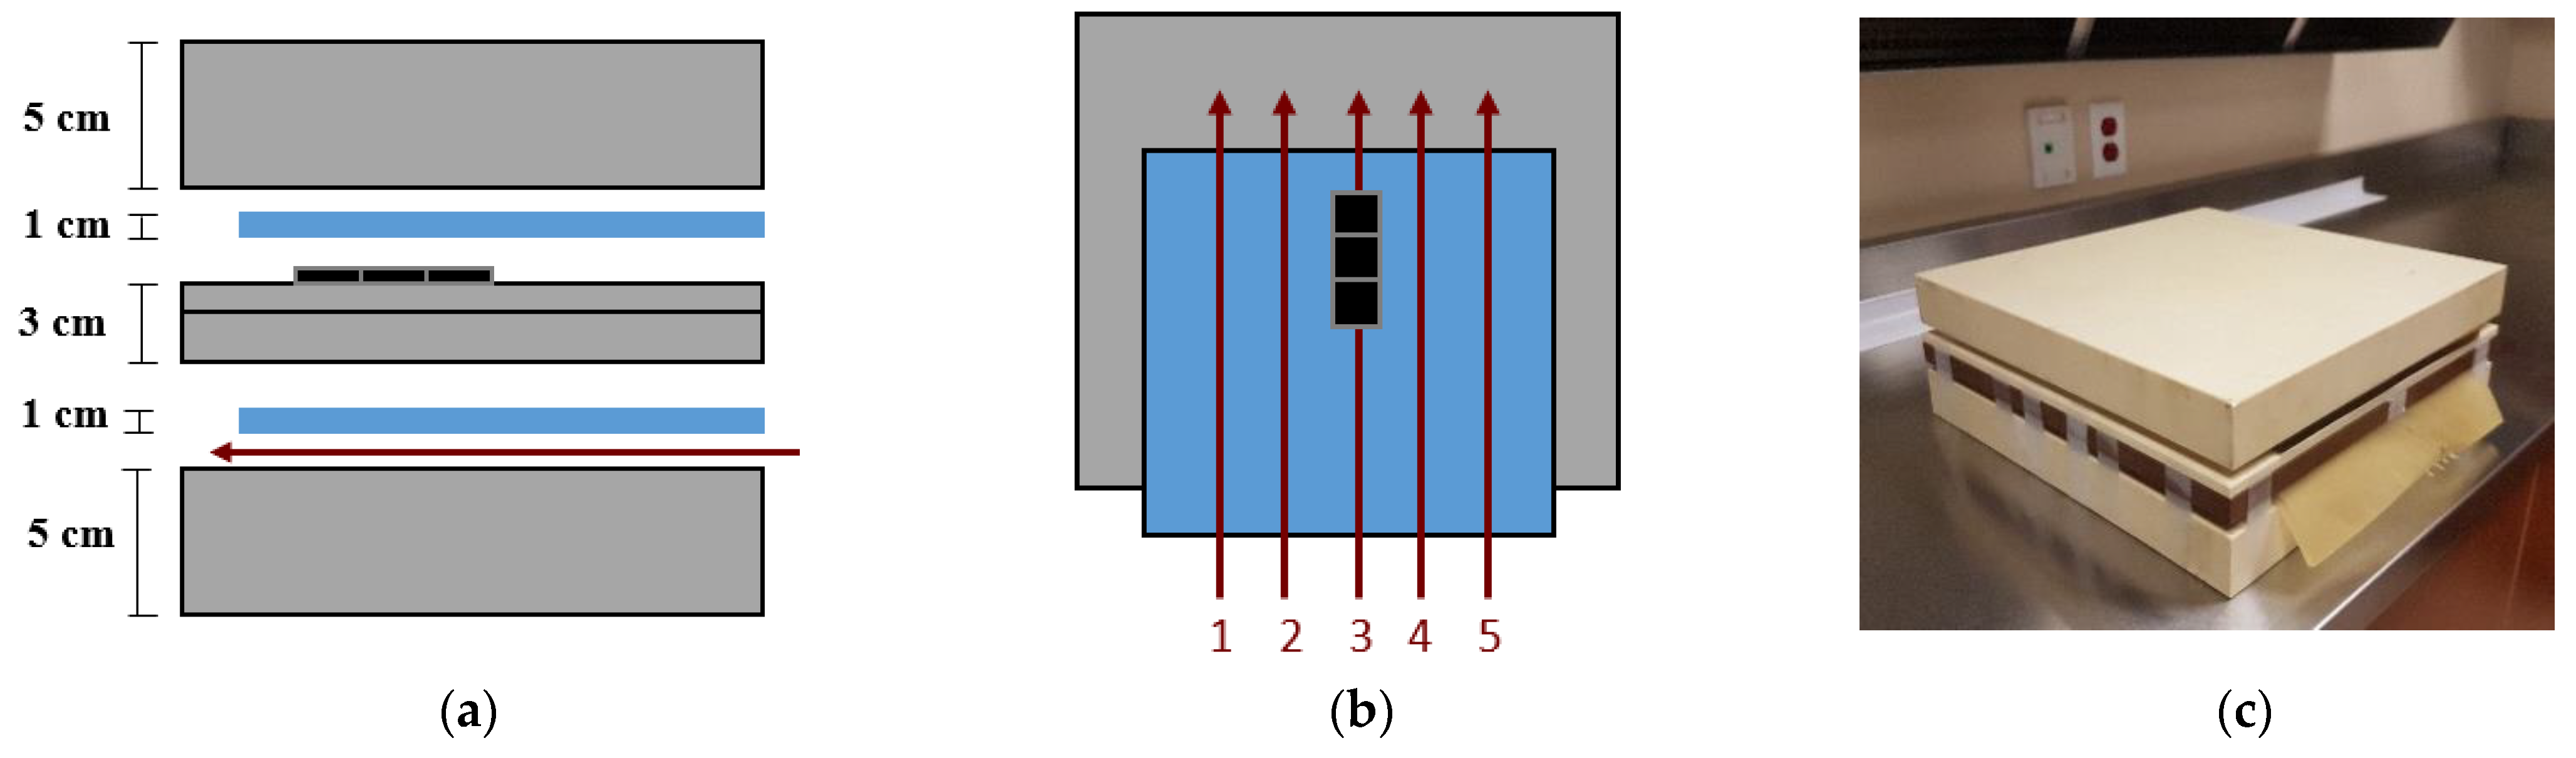
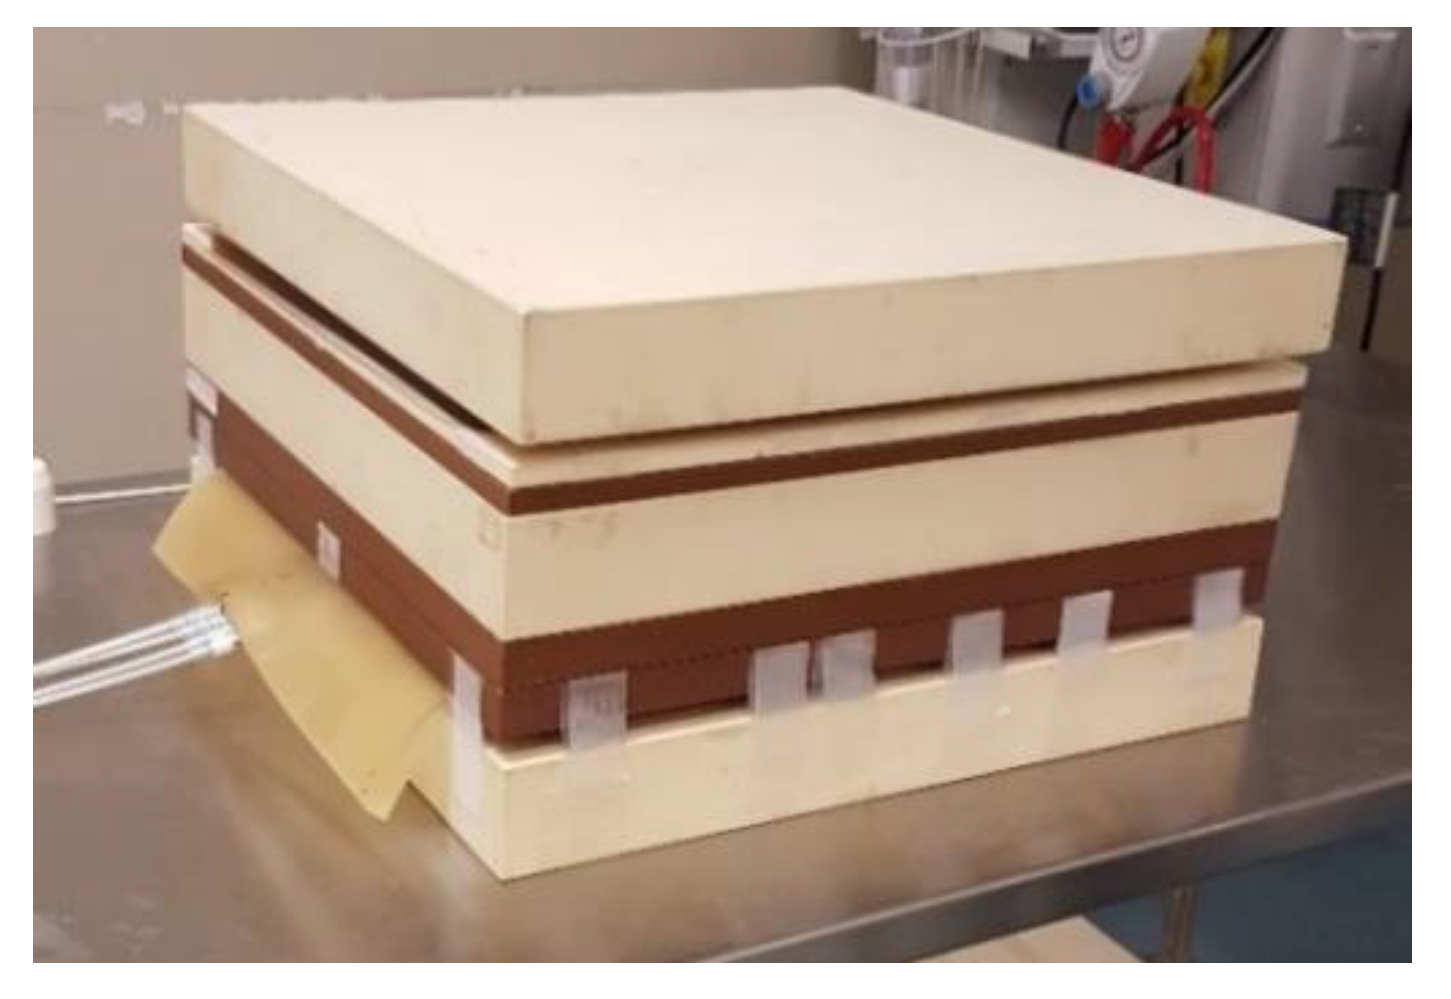
Radiation 02 00026 g002
Figure 3. Calibration set up. (a) A schematic interpretation of the calibration phantom in sagittal view. The slabs of solid water are represented by the grey blocks, and the superflab bolus is represented by the blue blocks. The OSLDs are represented by the black figures, and the catheters are the red arrows; (b) A top view schematic interpretation of the calibration phantom indicating the positions of catheters one to five. Three OSLDs are arranged, one on top of the other, in a superior, middle, and inferior position as shown in the image; (c) An image of the calibration phantom fully assembled.
Radiation 02 00026 g003
Figure 4. Dose rate dependence phantom. The phantom used to test OSLD dependence on dose rate. An additional 8 cm of solid water was added to the middle of the phantom to provide a total source-to-OSLD distance of 12 cm, as shown in this image.
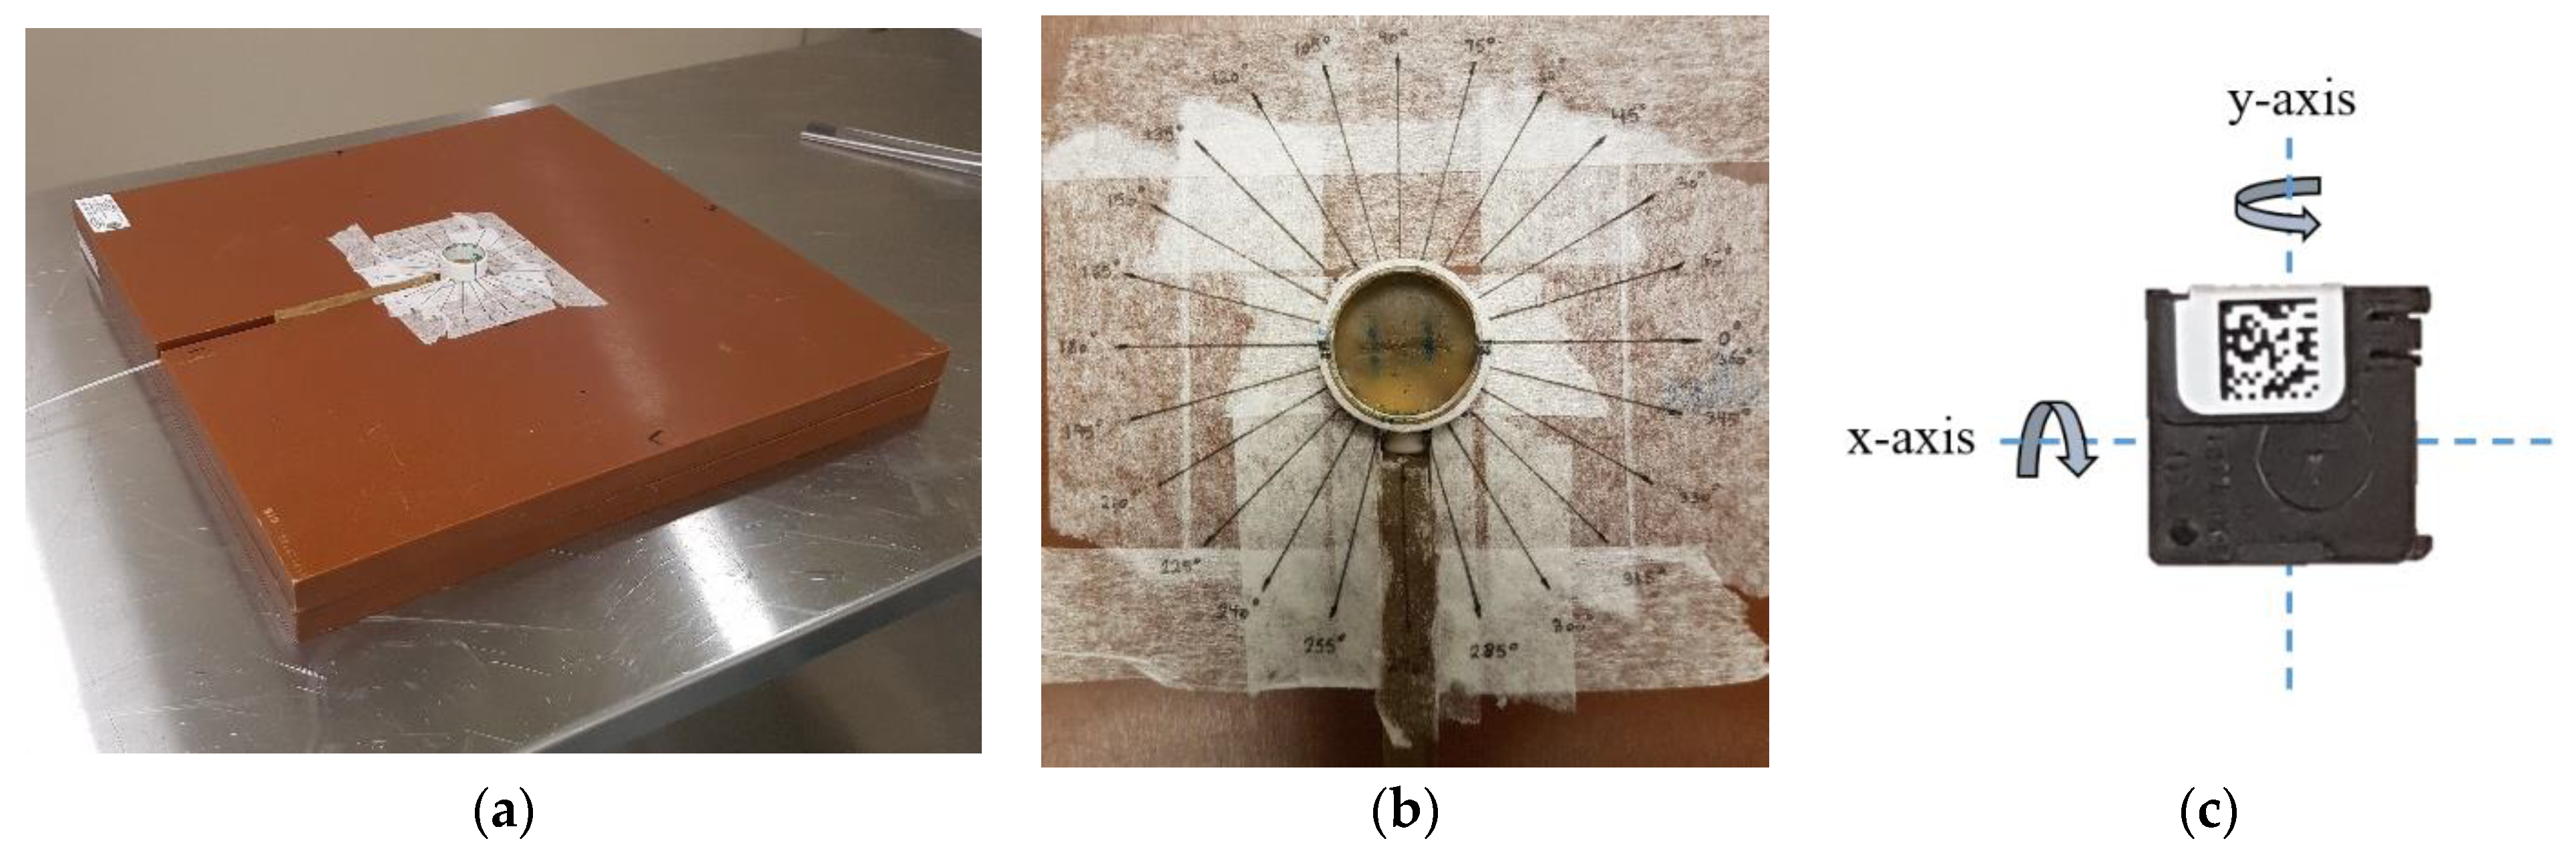
Radiation 02 00026 g004
Figure 5. Angular dependence phantom. (a) The phantom used to test OSLD angular dependence. Two 2 cm solid water slabs were used, with the top slab having the machined circle in the center and canal for the catheter as shown in the image; (b) A close-up of the top of the angular dependence phantom to show OSLD placement within the superflab bolus as well as the marked angles used for the experiment; (c) A depiction of how the OSLD was rotated along its x-axis and y-axis.
Radiation 02 00026 g005
Figure 6. X-ray lightbox. Optical annealing set up with an array of 40 open OSLDs arranged on the surface of an X-ray lightbox.
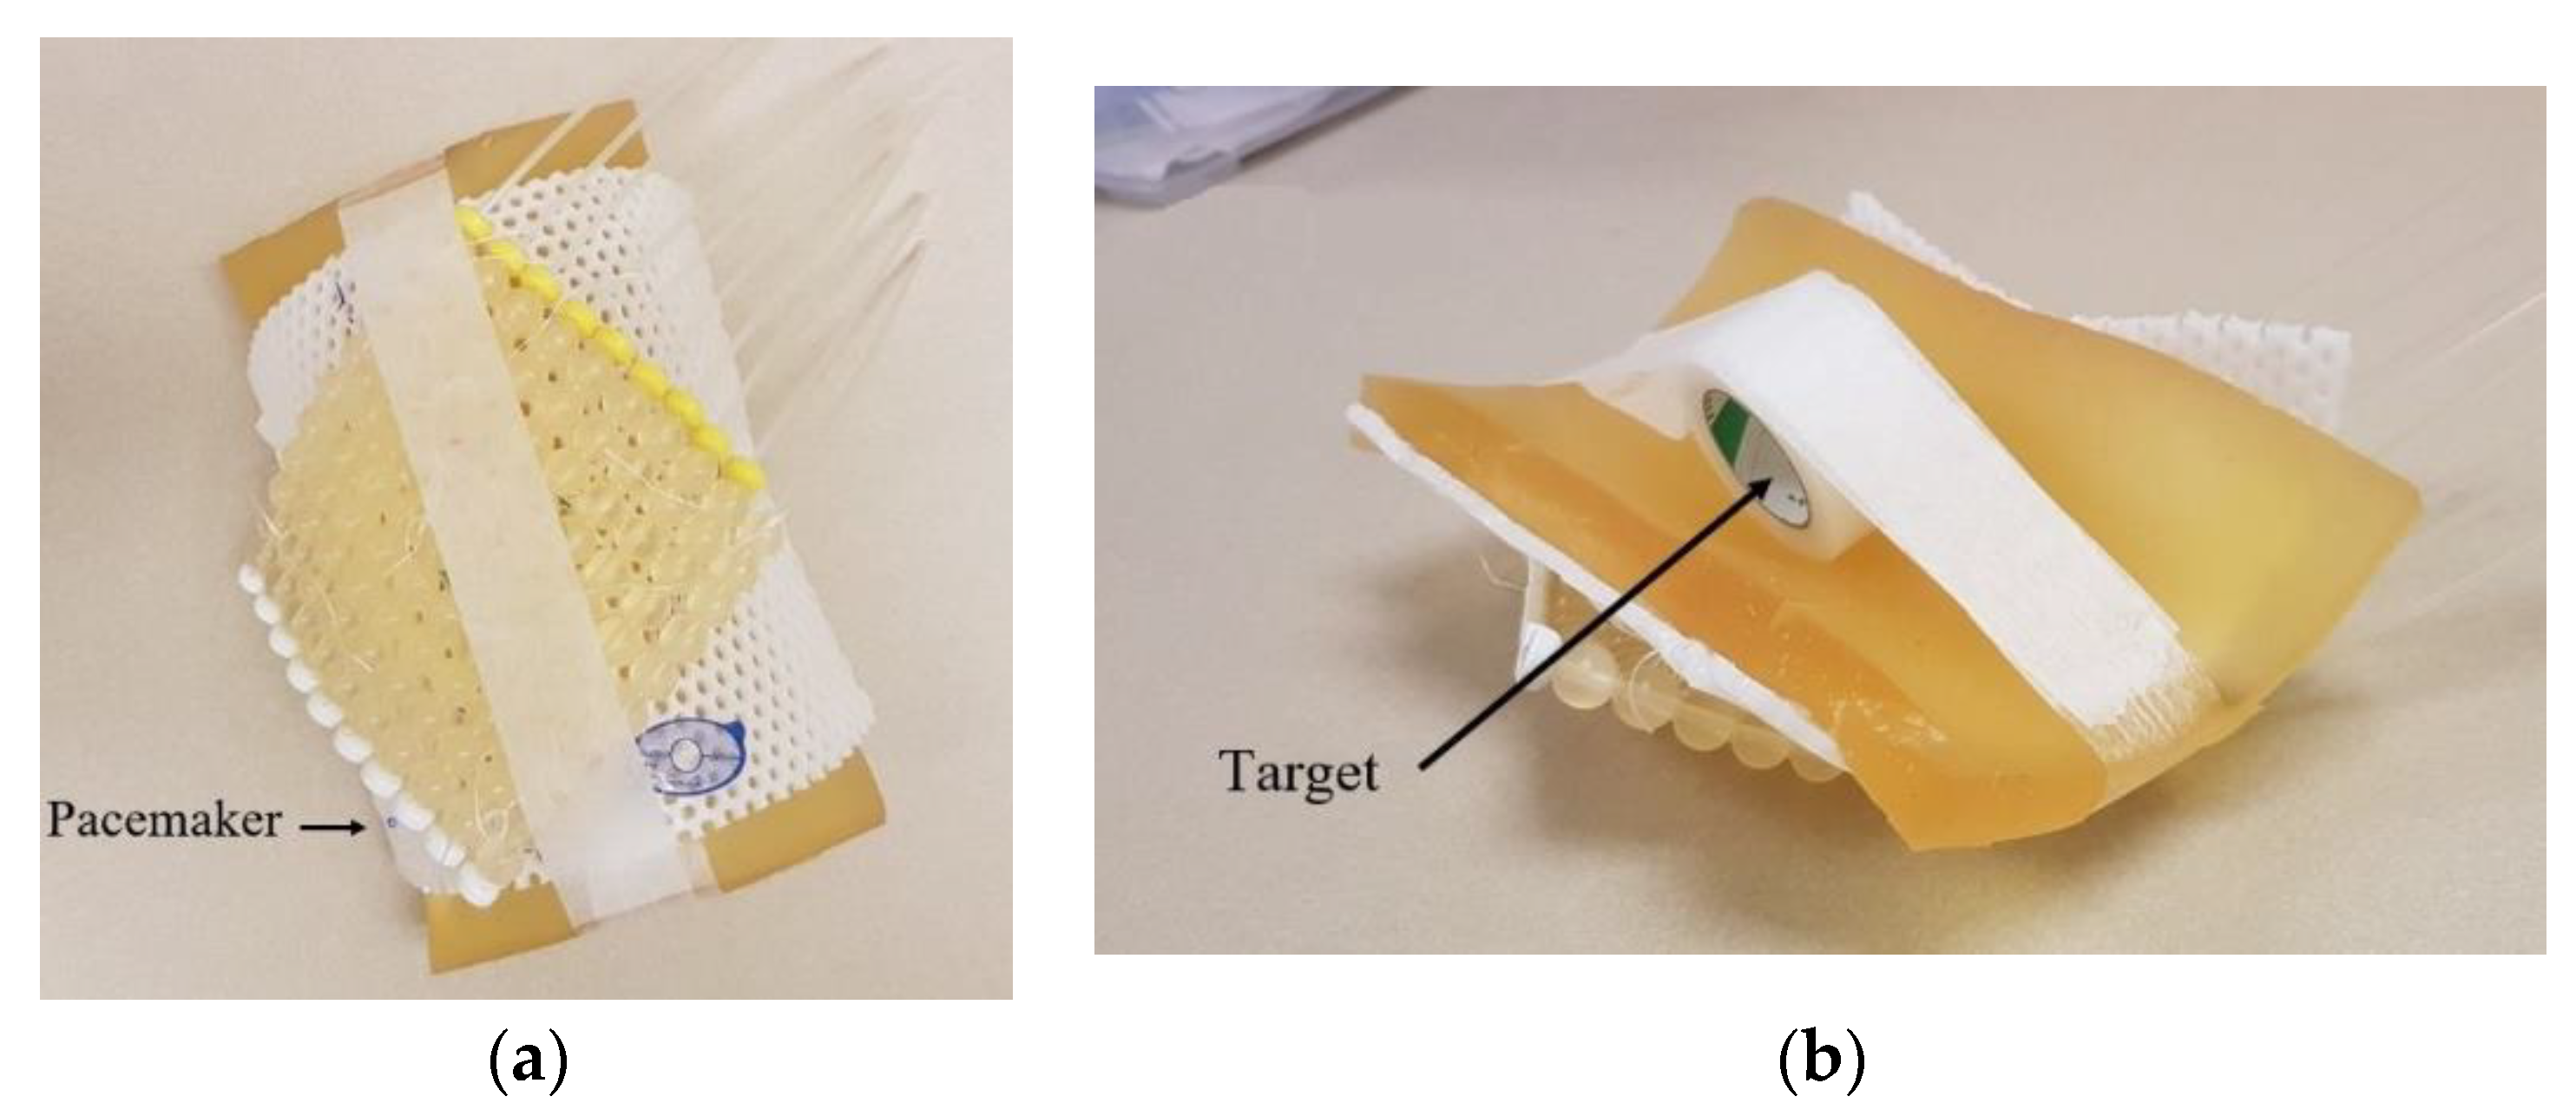
Radiation 02 00026 g006
Figure 7. The phantom used to test OSLDs using a Freiburg flap applicator. (a) Top view of the phantom indicating the position of the pacemaker; (b) Bottom view of phantom indicating the position of the target.
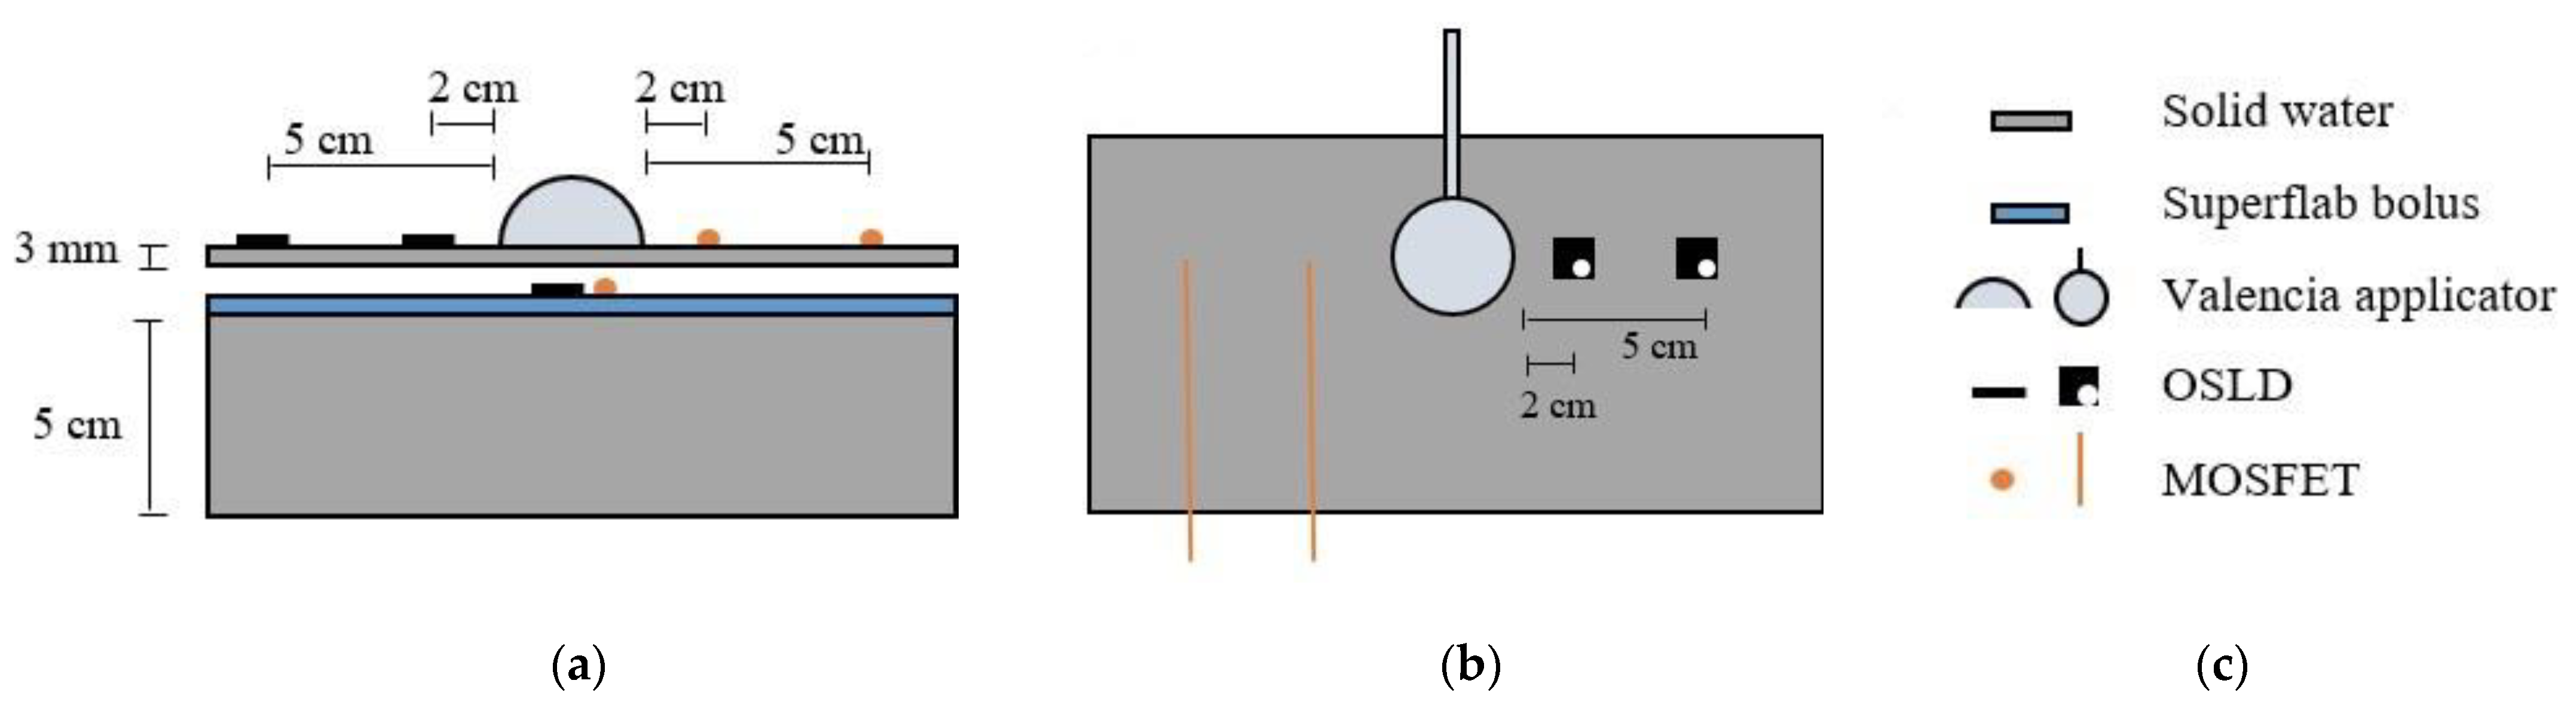
Radiation 02 00026 g007
Figure 8. An interpretation of the phantom used to test OSLDs using an H3 Valencia applicator. (a) Side view of the phantom indicating the positions of the Valencia, OSLDs, and MOSFETs; (b) Top view of phantom indicating the symmetric position of the OSLDs with the MOSFETs about the head of the Valencia; (c) A legend describing the components of the phantom depicted in (a,b).
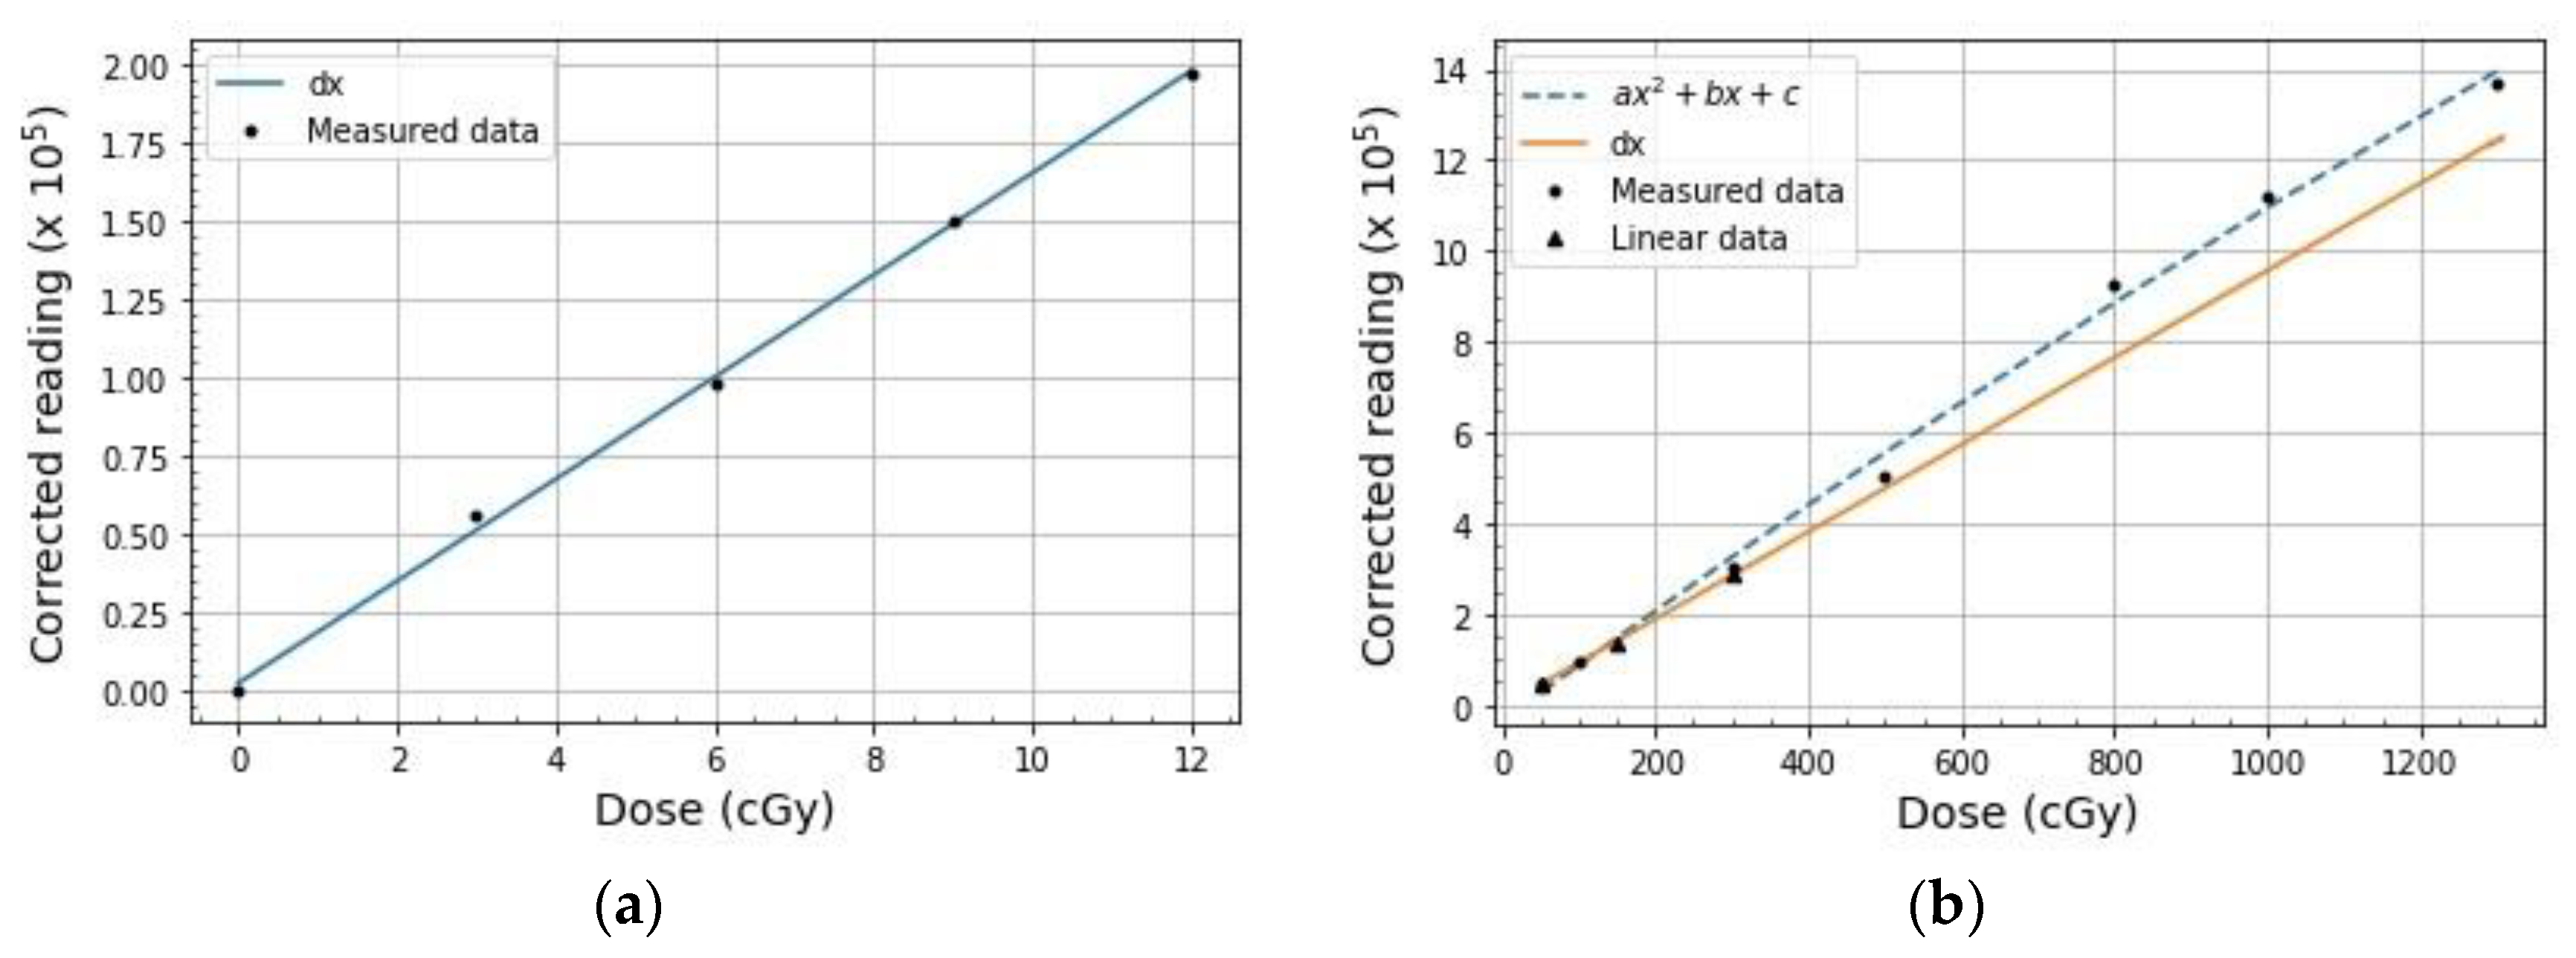
Radiation 02 00026 g008
Figure 9. Calibration results. (a) Low dose linear calibration curve where d = 0.163 ± 0.003; (b) The overlay of the high dose linear and non-linear calibration curves where a = (−1.01 ± 1.06) × 10−6, b = 0.012 ± 0.001, c = −0.35 ± 0.36, and d = (9.6 ± 0.2) × 10−3.
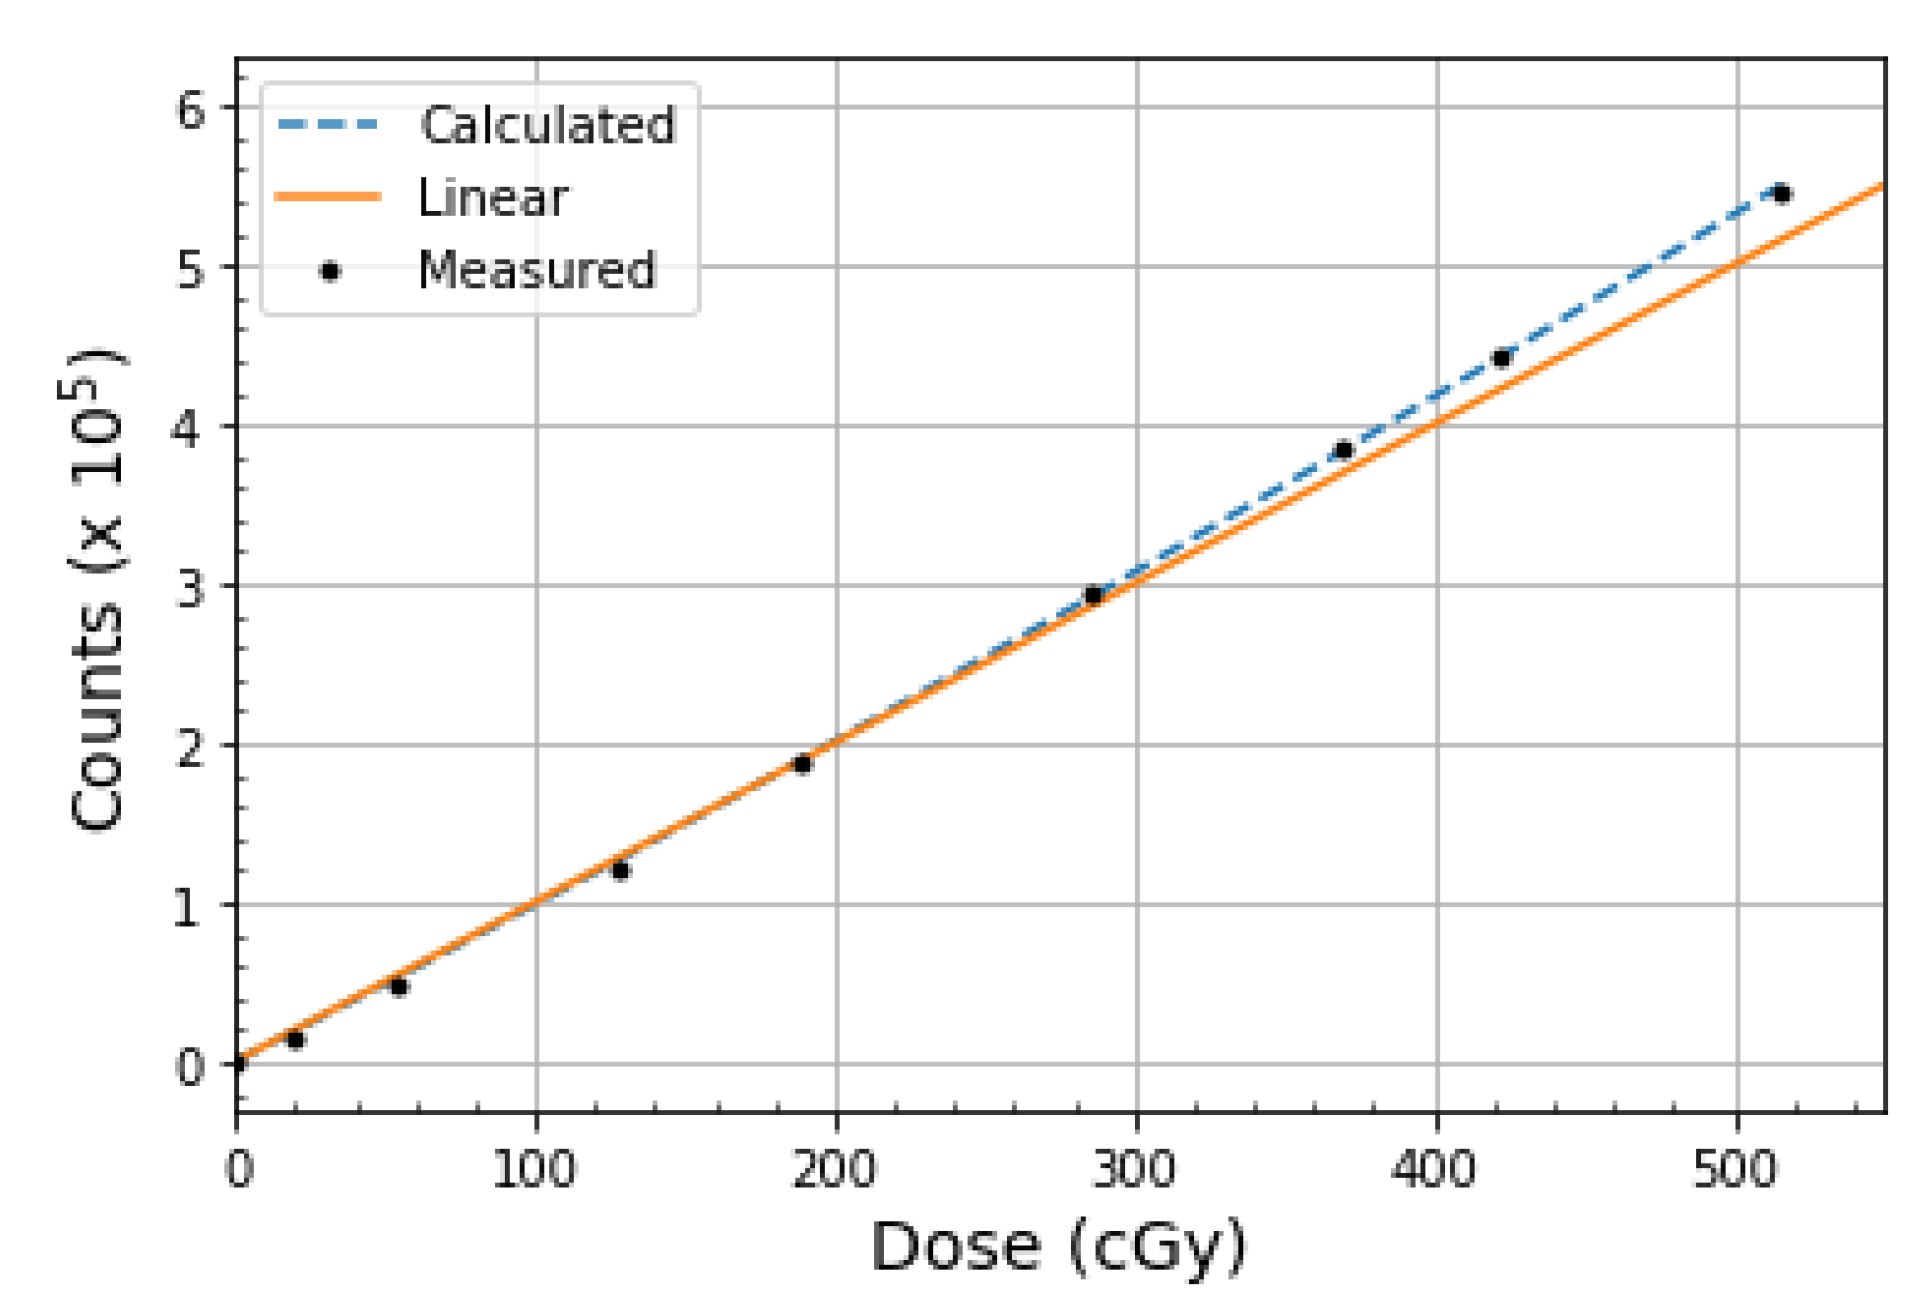
Radiation 02 00026 g009
Figure 10. Dose linearity results. The relationship between OSLD response and absorbed dose. For each data point, a single OSLD was irradiated, kept in the dark for a minimum of 10 min, and then readout. The solid orange line represents OSLD linear response to dose. Meanwhile, the blue dashed curve models the data obtained from this experiment and is described by Equation (1).
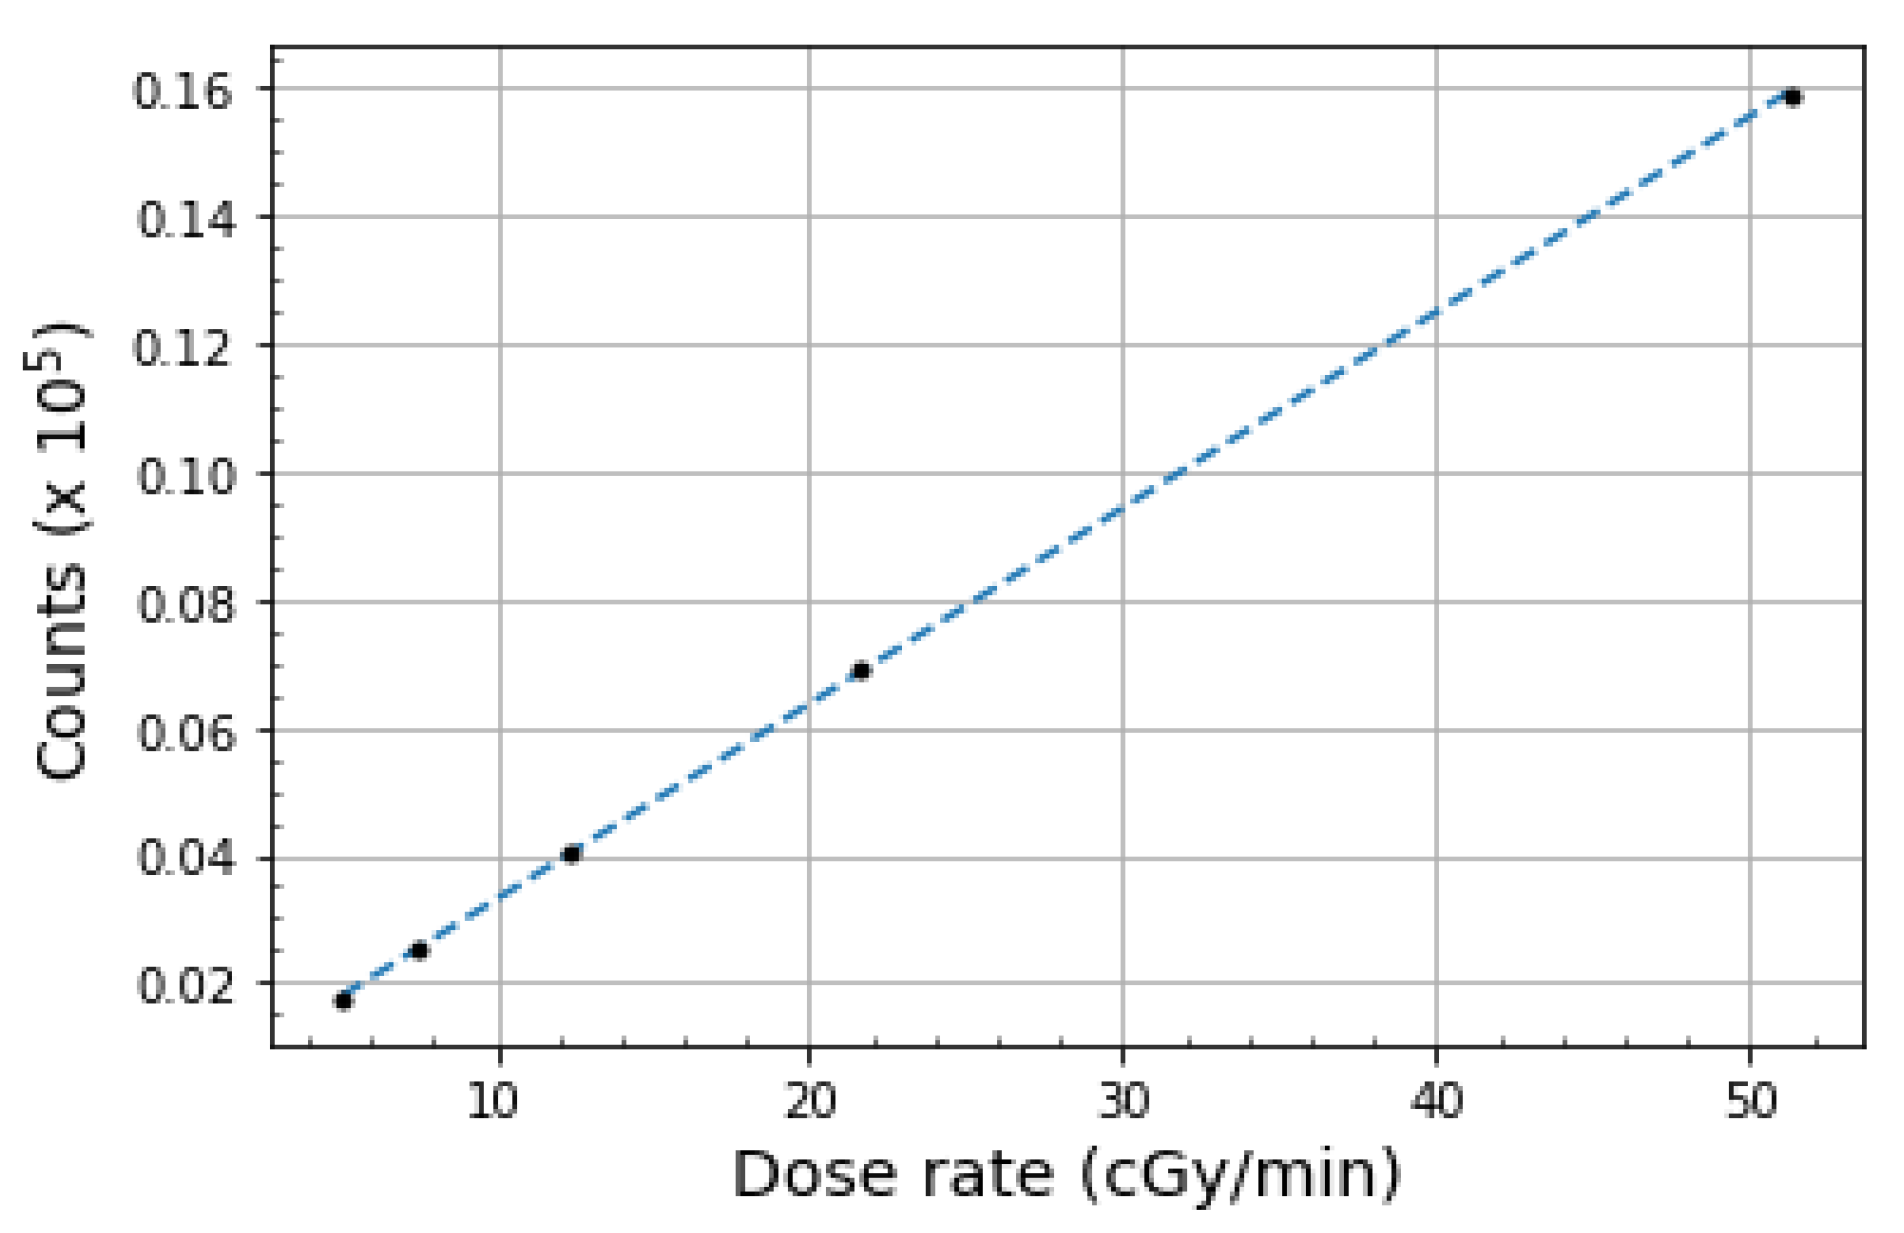
Radiation 02 00026 g010
Figure 11. Dose rate dependence results. The relationship between OSLD counts and absorbed dose with varying dose rates. The data can be modeled by Equation (2), which is represented by the dashed line.
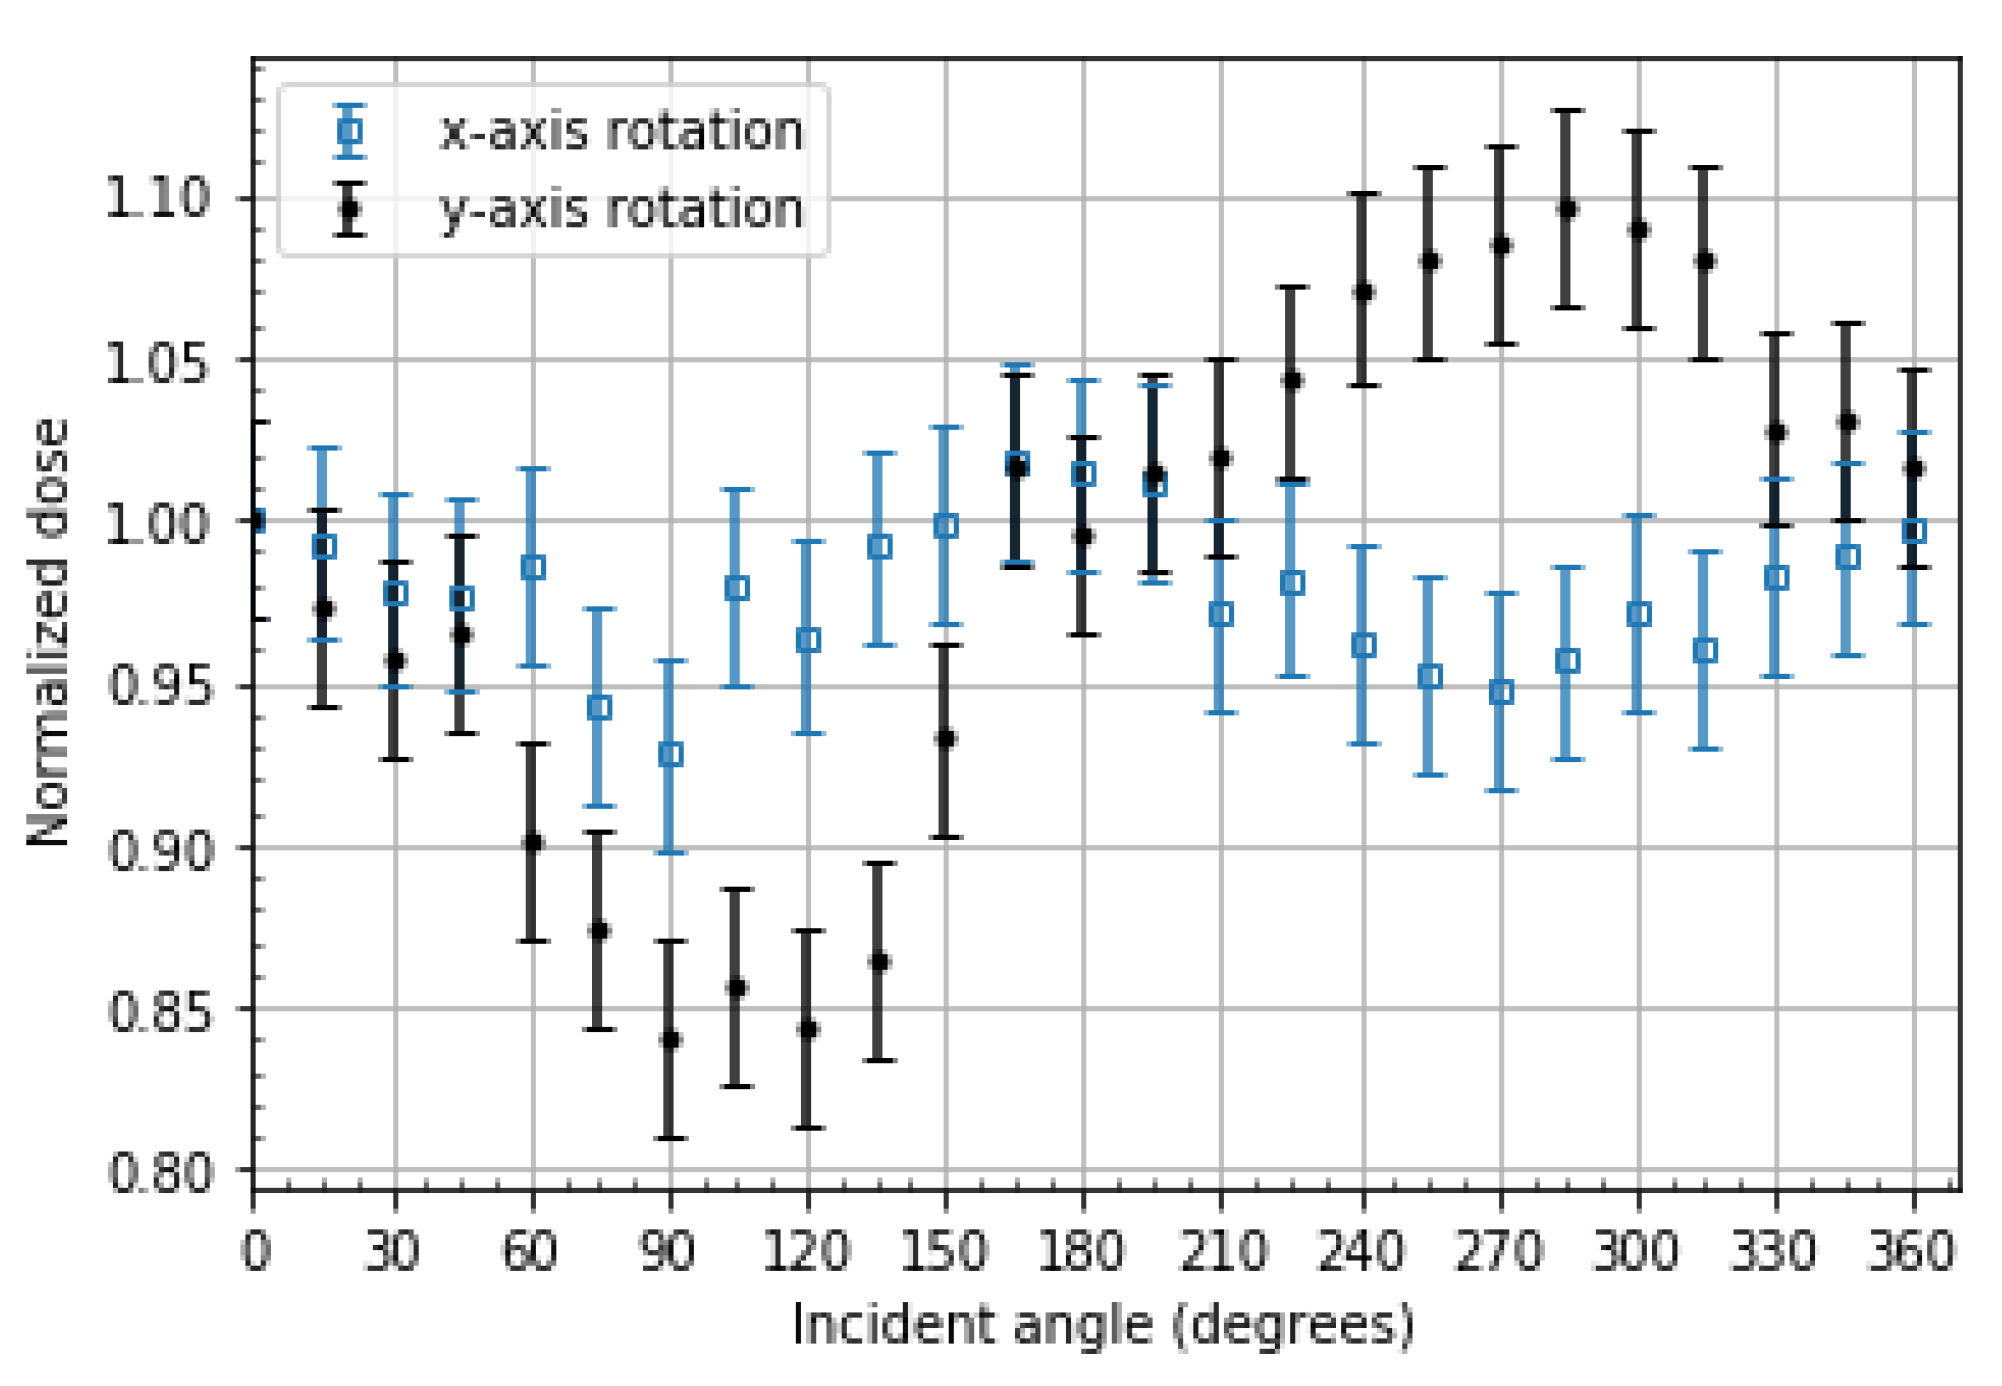
Radiation 02 00026 g011
Figure 12. Angular dependence results. The radiation sensitivity of OSLDs as a function of the incident angle of 192Ir gamma rays normalized to 0°. For both axes of rotation, the incident angle of 0° corresponds to the QR code face of the OSLD, 90° to the thin edge of the OSLD case, 180° to the OSLD lot number face, and 270° to the thick edge of the OSLD case. The error bars represent a standard deviation of four OSLD readouts.
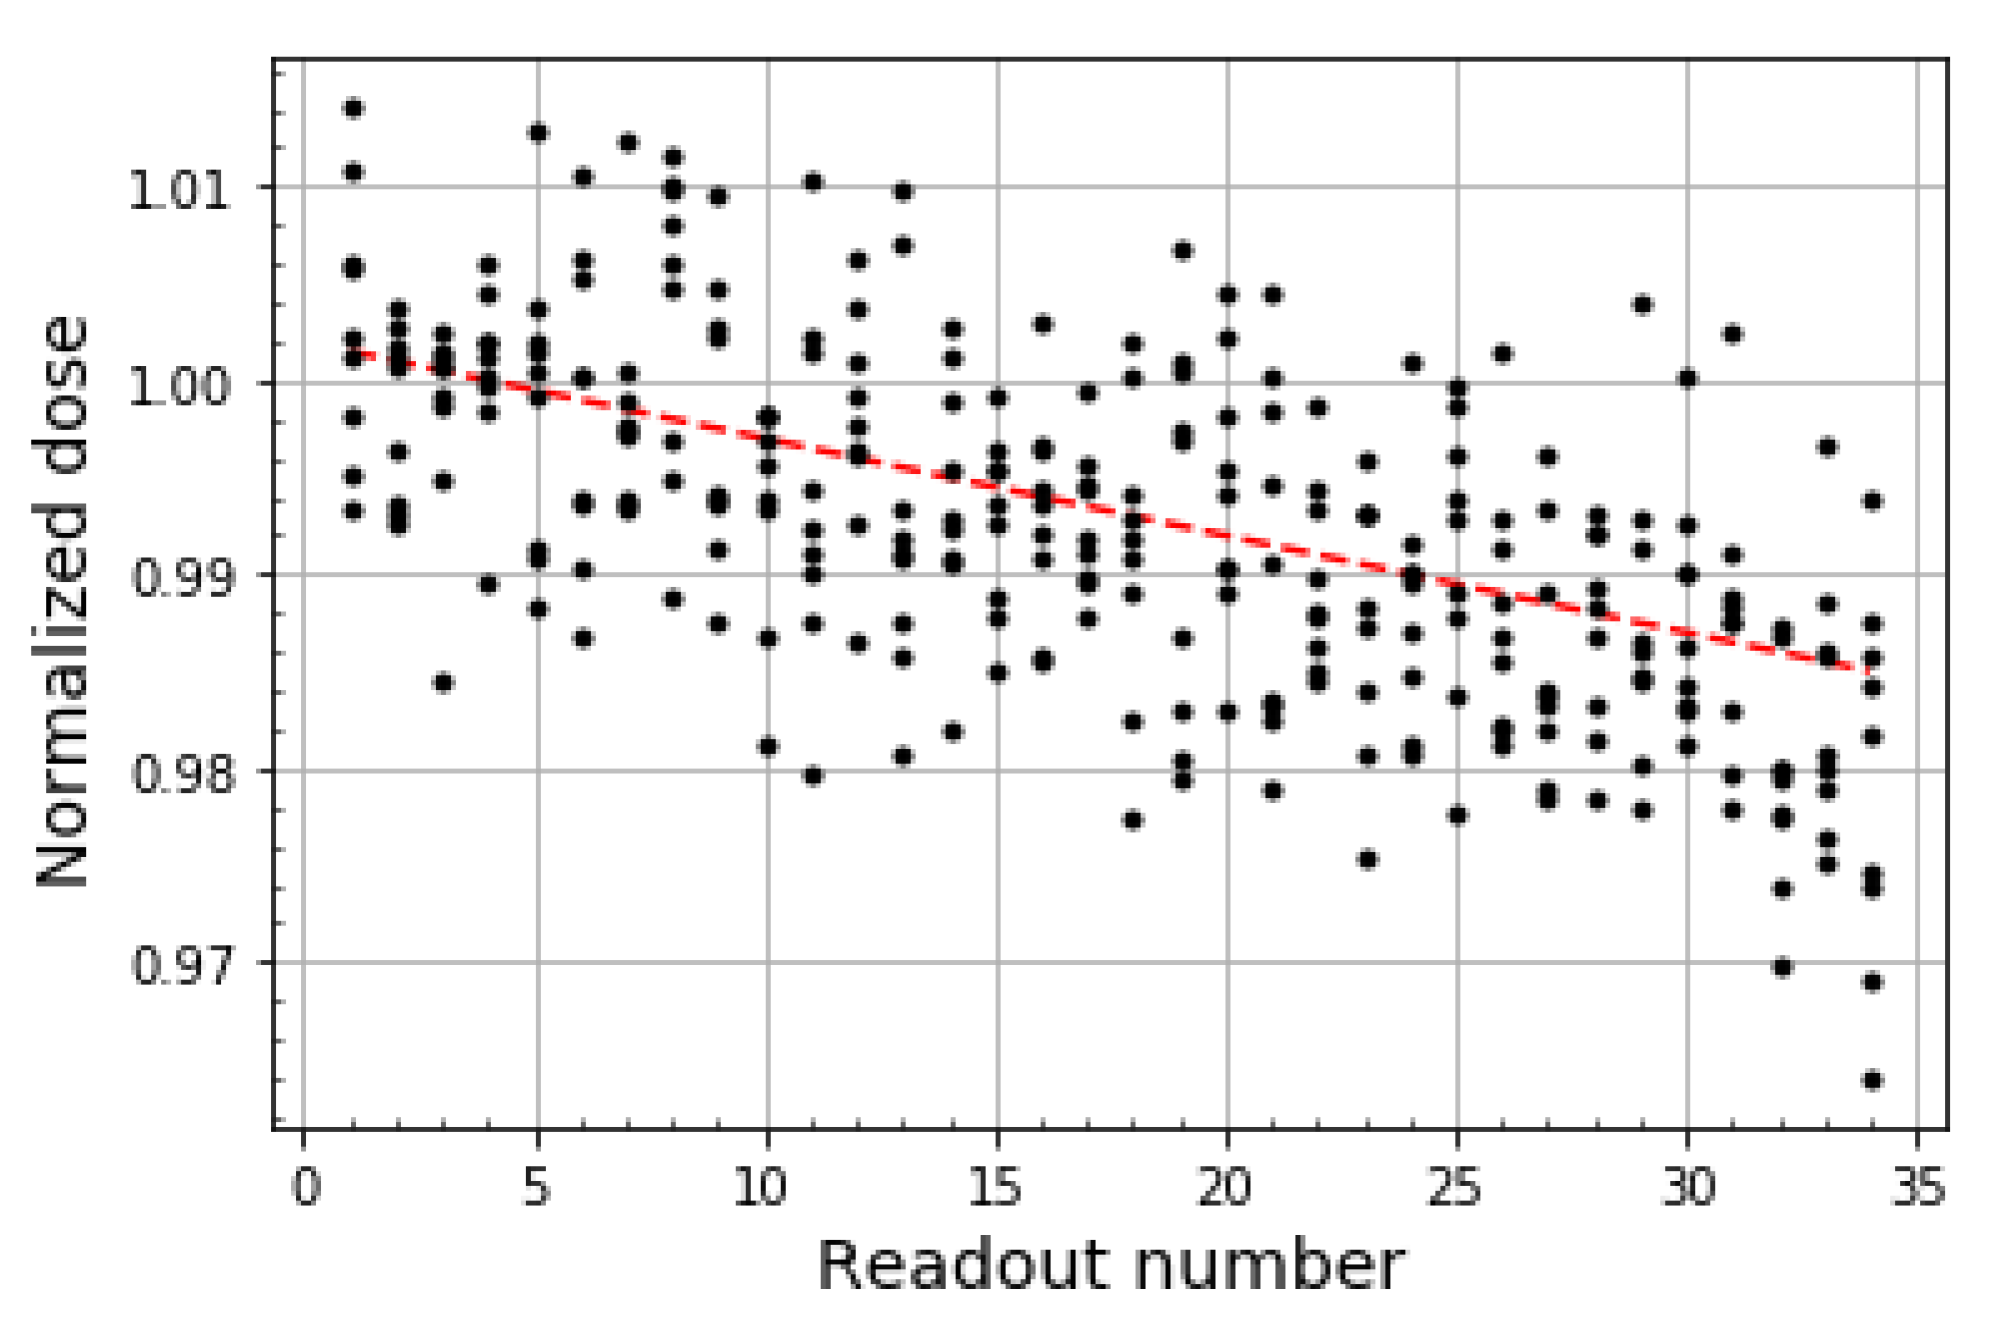
Radiation 02 00026 g012
Figure 13. Readout depletion results. The depletion of OSLD signal with consecutive readouts. The data from all nine irradiated OSLDs is overlayed, and the red dashed line represents the linear regression applied to the data, which has an intercept of 1.002, a slope of −0.0005/readout, and a standard deviation of the residuals of 0.00675.
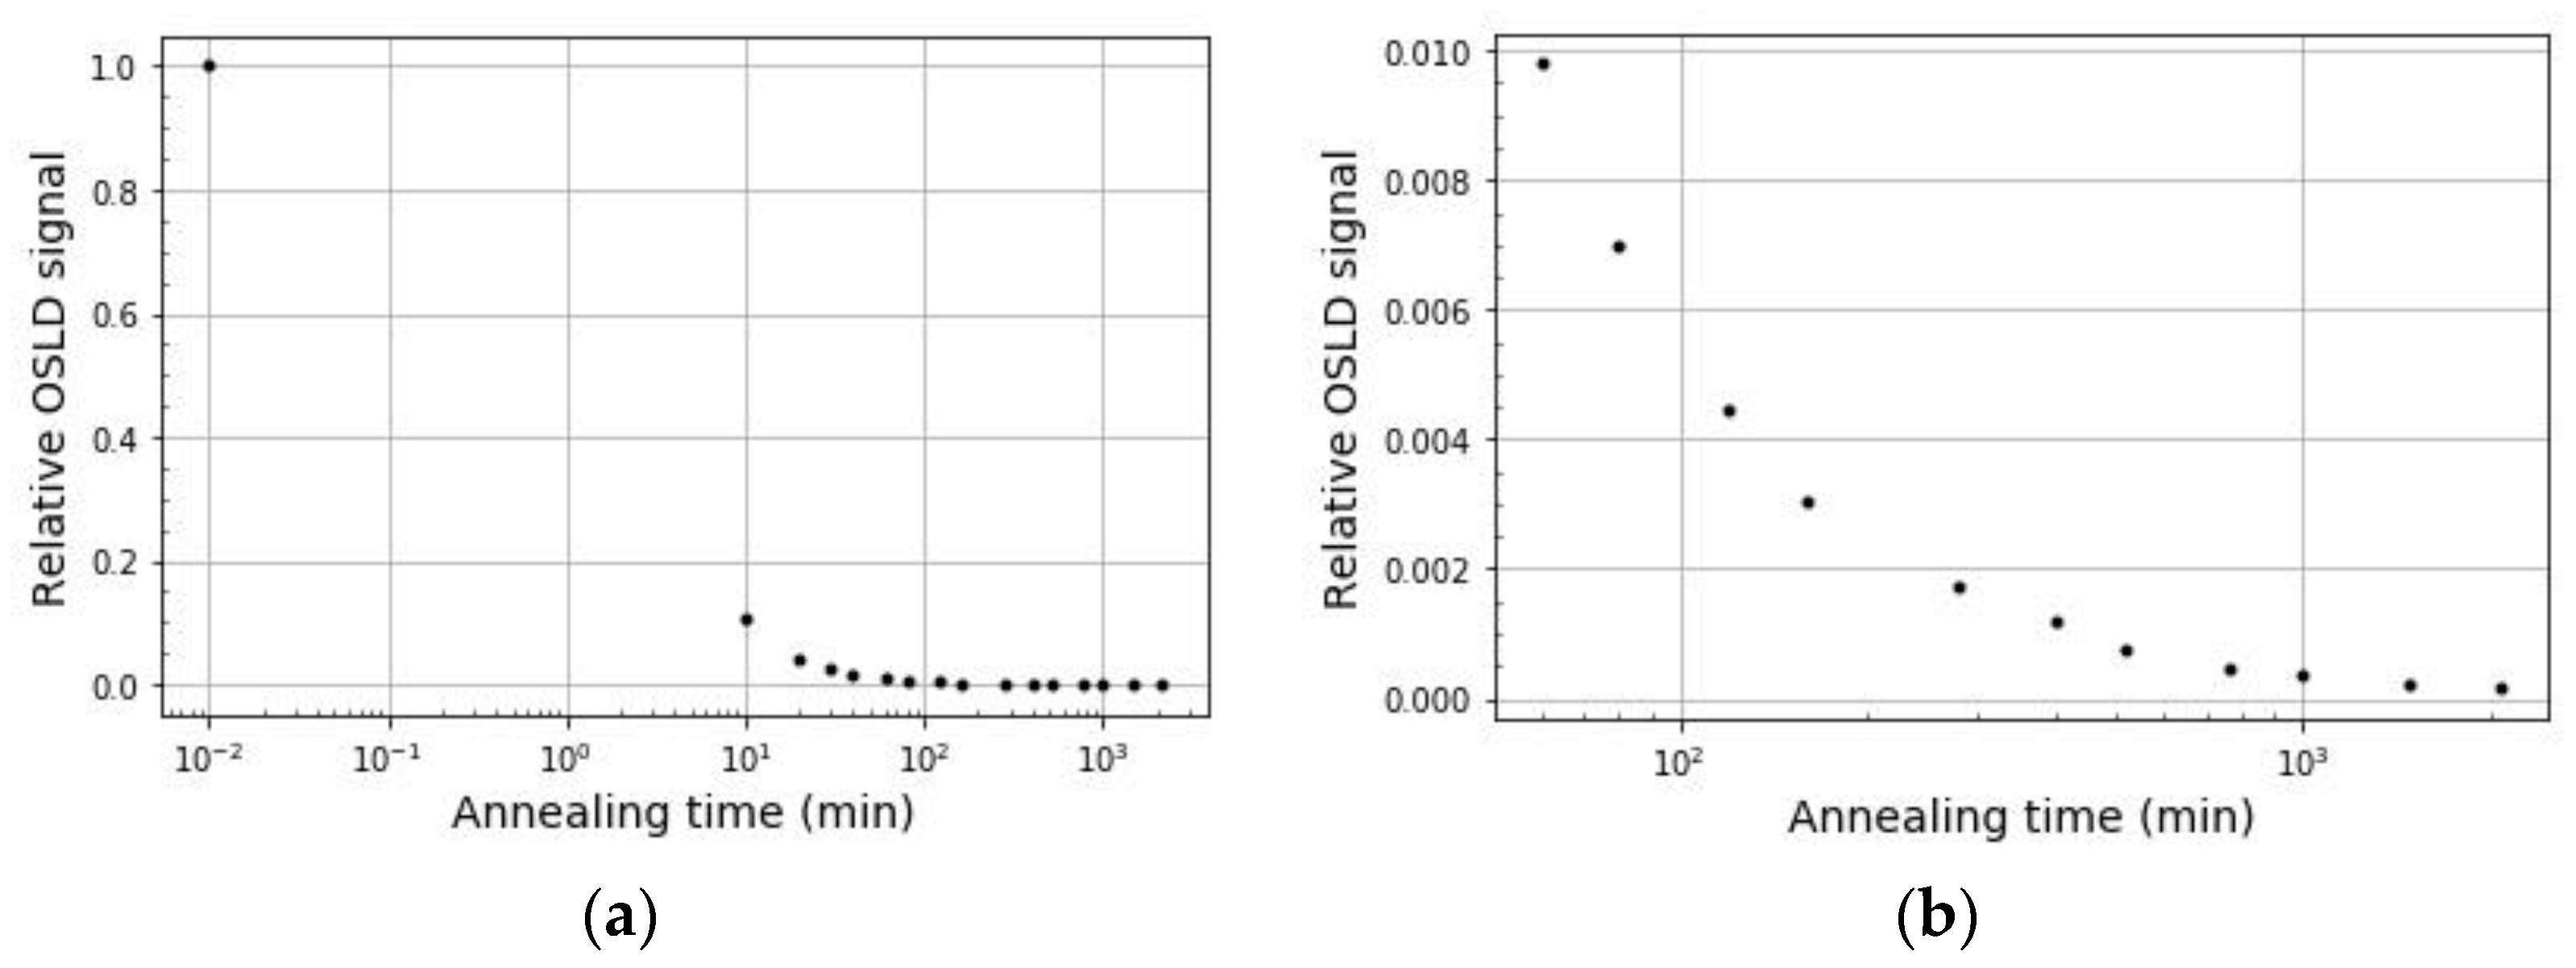
Radiation 02 00026 g013
Figure 14. Optical annealing results. (a) Reduction of OSLD signal with 2080 min of illumination exposure; (b) Reduction in OSLD signal from 60 min to 2080 min of illumination exposure.
Radiation 02 00026 g014
Table 1. Calibration levels. Dose levels used to build each calibration curve.
Calibration TypeDose Range (cGy)Doses Used to Build the Curve (cGy)
Low dose (linear)0–100, 3, 6, 9, 12
High dose (linear)10–30050, 150, 300
High dose (non-linear)>30050, 100, 300, 500, 800, 1000, 1300
Table 2. Calibration validation. This table displays the calibration validation results for all three curves.
Calibration CurveValidation Dose (cGy)Measured Dose (cGy)% Difference from Calibration Curve
Low dose (linear)1010.232.3
109.9981.2
High dose (linear)200203.01.5
200203.81.9
High dose (non-linear)400402.80.070
650637.71.9
900912.61.4
Table 3. Theoretical comparison. This table compares the dose rate between the measurements made and the theoretical calculations.
Distance (cm)Average Counts NormalizedInverse-Square% Difference
41.001.00-
60.4360.4441.8
80.2520.2500.8
100.1570.1601.9
120.1100.1110.9
Table 4. Freiburg flap measurements. This table displays the results of the Freiburg flap applicator end-to-end test.
Measurement SiteMeasured OSLD Dose (cGy)TPS Dose (cGy)OSLD/TPS % DifferenceOSLD/Lead % Difference
Target132.31352.0-
Pacemaker38.4040.34.7-
Pacemaker (with lead)37.42--2.6
Table 5. Valencia target measurements. Target dose measurement with H3 Valencia. A dose of 600 cGy was delivered to the target.
Measurement SiteMeasured OSLD Dose (cGy)Measured MOSFET Dose (cGy)OSLD/MOSFET % Difference
Target599.56020.42
Table 6. Valencia OAR and surface measurements. OAR and surface dose measurements with H3 Valencia. A dose of 600 cGy was delivered to the target.
Measurement SiteMeasured OSLD Dose (cGy)Measured MOSFET Dose (cGy)OSLD/MOSFET % Difference
OAR11.1511.42.17
OAR (with lead)7.8619.3616.0
Surface4.9465.5711.2
Publisher’s Note: MDPI stays neutral with regard to jurisdictional claims in published maps and institutional affiliations.

