Article

Radiation Treatment Timing and Dose Delivery: Effects on Bladder Cancer Cells in 3D in Vitro Culture

1
Department of Radiation Oncology, American University of Beirut Medical Center, Riad El Solh, Beirut 1107 2020, Lebanon
2
Department of Anatomy, Cell Biology and Physiological Sciences, Faculty of Medicine, American University of Beirut, Riad El-Solh, Beirut 1107 2020, Lebanon
3
Arkadi M. Rywlin M.D. Department of Pathology and Laboratory Medicine, Mount Sinai Medical Center, Miami Beach, FL 33140, USA
*
Authors to whom correspondence should be addressed.
These authors contributed equally to this work.
Radiation 2022, 2(4), 318-337; https://doi.org/10.3390/radiation2040025
Submission received: 2 September 2022 / Revised: 6 October 2022 / Accepted: 14 October 2022 / Published: 18 October 2022
(This article belongs to the Section Radiation-Induced DNA Damage Signaling and Repair)

Abstract

:

Simple Summary

The use of radiotherapy in bladder cancer treatment is increasing, which highlights the need for a better understanding of bladder cancer treatment with different radiation delivery protocols. The purpose of this study is to analyze the effect of treatment time, dose and fractionation on the number and sizes of grown three-dimensional (3D) bladder cancer spheres, and to assess the capacity of the linear-quadratic model in describing the response of three human bladder cancer cell lines: RT4, T24 and UM-UC-3. cultured in 3D. Three single dose radiation treatments were performed at different time points after plating, and sphere number and sizes were assessed. The radiosensitivity of spheres was dependent on the treatment timing after plating. Our results showed the importance of treatment timing on the radio-response of bladder cancer spheres. We also demonstrated that bladder cancer spheres are more resistant to dose-fractionation than the estimation from the theoretical linear-quadratic model.

Abstract

While radical cystectomy remains the primary treatment of choice for bladder cancer, increased evidence supports the use of bladder-preservation strategies based on adjuvant radiotherapy. This highlights the need for a better understanding of bladder cancer radiosensitivity to different types of treatment deliveries. The purpose of this study is to analyze the effect of treatment time, dose and fractionation on the number and sizes of grown three-dimensional (3D) bladder cancer spheres, and to assess the capacity of the linear-quadratic model in describing the response of cells cultured in 3D. 3D MatrigelTM-based cultures were employed to enrich for cancer stem cells (CSCs) from three human bladder cancer cell lines, RT4, T24 and UM-UC-3. Three single dose radiation treatments were performed at different time points after plating, and sphere number and sizes were assessed. Anti-CD44 immunofluorescence, clonogenic assay and anti-γH2AX staining were also performed to analyze the cell lines’ radiosensitivity. The radiosensitivity of spheres was dependent on the treatment timing after plating. Current linear quadratic dose fractionation models were shown to over-estimate radiosensitivity in 3D models. Our results showed the importance of treatment timing on the radio-response of bladder cancer spheres. We also demonstrated that bladder cancer spheres are more resistant to dose-fractionation than the estimation from the theoretical linear-quadratic model.

1. Introduction

Bladder cancer is the sixth most commonly diagnosed cancer in men worldwide [1,2,3]. It usually affects the older population with an average age at diagnosis of 73 years [1,2,3]. Although the standard treatment protocols in bladder cancer rely on radical cystectomy as a major therapeutic approach, its undesirable side effects prompted the development of bladder-preserving strategies such as radiotherapy (RT) and radio-chemotherapy (RT-CT) [4,5,6]. In fact, and in addition to a decrease in the patient’s quality of life caused by an external pouch in most cases, patients are at high risk of complications such as urinary tract infection, deterioration in renal function, calculi formation, metabolic complications, voiding dysfunction, and recurrence of disease [7,8]. Introducing RT as a treatment option highlighted the need for understanding bladder cancers’ response to ionizing radiation (IR). However, while many studies have focused on the in vitro response of bladder cancer cells, there is still no consensus on the best way to predict their radiosensitivity [4,9,10,11,12].
Intrinsic radiosensitivity is generally defined by the radio-induced loss of clonogenicity, and it is best correlated with the capacity of the cells to recognize and repair radio-induced DNA double-strand breaks (DSB), with the anti-γH2AX immunofluorescence (IF) being the most accurate DNA DSB biomarker [13,14,15]. Out of all the assays that have been developed to quantify cells’ radiosensitivity, the clonogenic assay remains the most utilized one. It is based on the capacity of irradiated cells to form colonies [16,17,18] and is best described mathematically by the linear-quadratic model (LQ) that is used in the daily clinical practice [19,20,21,22,23,24,25]. The α and β parameters of the LQ model are used to estimate the best dose fractionation for each tumor and each organ, mainly by calculating the biologically effective dose (BED) [26].
Newly developed cell culture techniques allow us today to study the effects of radiation and chemotherapy via three-dimensional (3D) cultures, such as spheres [27]. Indeed, recent studies have shown that when cells are irradiated or incubated with some reagents, their capacity to form spheres is reduced, and the size of spheres decreases when the treatment doses are increased [28]. For example, Tideglusib and curcumin were shown to radiosensitize glioblastomas and bladder cancer cells, respectively [29,30]. The importance of this 3D spheres formation cell culture model is that it enables the growth of cancer stem cells (CSCs) in a more physiologically relevant environment than conventional two-dimensional (2D) cell cultures [27]. CSCs are a subpopulation of cells within the tumor bulk that play a substantial role in tumor initiation and differentiation [31,32,33]. A number of stem cells biomarkers have already been identified, with CD44 being one of the most relevant for bladder cancer [34]. It has also been established that a strong correlation exists between these CSCs and tumor recurrence, as these cells may be resistant to the traditional treatments that are usually effective in eradicating the rest of the tumor [35,36,37]. Growing these cells in vitro provides us with a valuable opportunity to study their response to different treatments, including radiation [27,38,39]. In particular, the sphere-formation assay allows us to grow CSCs as multicellular 3D structures [27,38,39,40,41] and study cells in a setting that resembles their actual in vivo complex environment [42,43].
In a previous study from our group, three bladder cancer cell lines (RT4, UM-UC-3 and T24) were treated with different IR doses and their capacity to form spheres post-treatment was assessed [28]. The purpose of the current study is to better understand the effect of treatment time, dose and fractionation on the number and sizes of grown 3D spheres from the previously used human bladder cancer cell lines, and to validate the capacity of models developed in 2D in describing the response of cells cultured in 3D. When spheres were treated with single doses, we performed the irradiations at three different time points in order to mimic the development phases of a tumor. When the dose fractionation was performed, a dose of 2 Gy per session-which is the typical RT session in clinical practice-was applied to the spheres. The stemness was assessed by performing anti-CD44 IF on the spheres, and the effect of IR in was studied by analyzing the unrepaired DNA DSB via anti-γH2AX IF and the cell survival via the clonogenic assay.

2. Materials and Methods

2.1. Cell Culture

Three bladder cancer cell lines purchased from American Tissue Culture Collection (ATCC, Edina, MN, USA) were used: RT4 (RRID: CVCL_0036, transitional cell papilloma), UM-UC-3 (RRID: CVCL_1783) and T24 (RRID: CVCL_0554, transitional cell carcinoma/urothelial carcinoma). The characteristics of each cell line are outlined in Table 1. Cells were incubated in a humidified incubator at 37 °C and 5% CO2. Dulbecco’s Modified Eagle Media (DMEM) Ham’s F-12 (Sigma-Aldrich, St. Louis, MI, USA) with 10% heat-inactivated fetal bovine serum (FBS; Sigma-Aldrich), 1% Penicillin-Streptomycin (PS; Sigma-Aldrich) and 0.2% plasmocin prophylactic was used for the culture and maintenance. Table 2 summarizes all the experiments performed on these cell lines.

2.2. Irradiator

The irradiator used was a 225 kV Precision X-Ray (PXi) model No X-RAD 225. IR was done at a rate of 3 Gy.min1 and a 1.5 mm aluminum filter was used. The verification/calibration of the irradiator is performed twice a year by the Medical Engineering Department of the American University of Beirut Medical Center. Briefly, the dose is measured at different locations within the irradiation field with a UNIDOS E dosimeter. If the measured dose is different than the set by more than 1%, a calibration is performed. The dosimeter is calibrated by the Medical Engineering Department on a yearly basis. The doses used for irradiation are summarized in Table 2.

2.3. Clonogenic Assay

To assess the radiosensitivity of the three bladder cell lines, clonogenic assay was performed as before [44].
The equation used to calculate the surviving fraction was:
SF   = number   of   colonies   counted number   of   cells   seeded × ( PE / 100 )
PE: Plating Efficiency.

2.4. Sphere Formation Assay

Sphere formation assay was performed as previously described [44]. Please see Supplementary Materials and Methods.

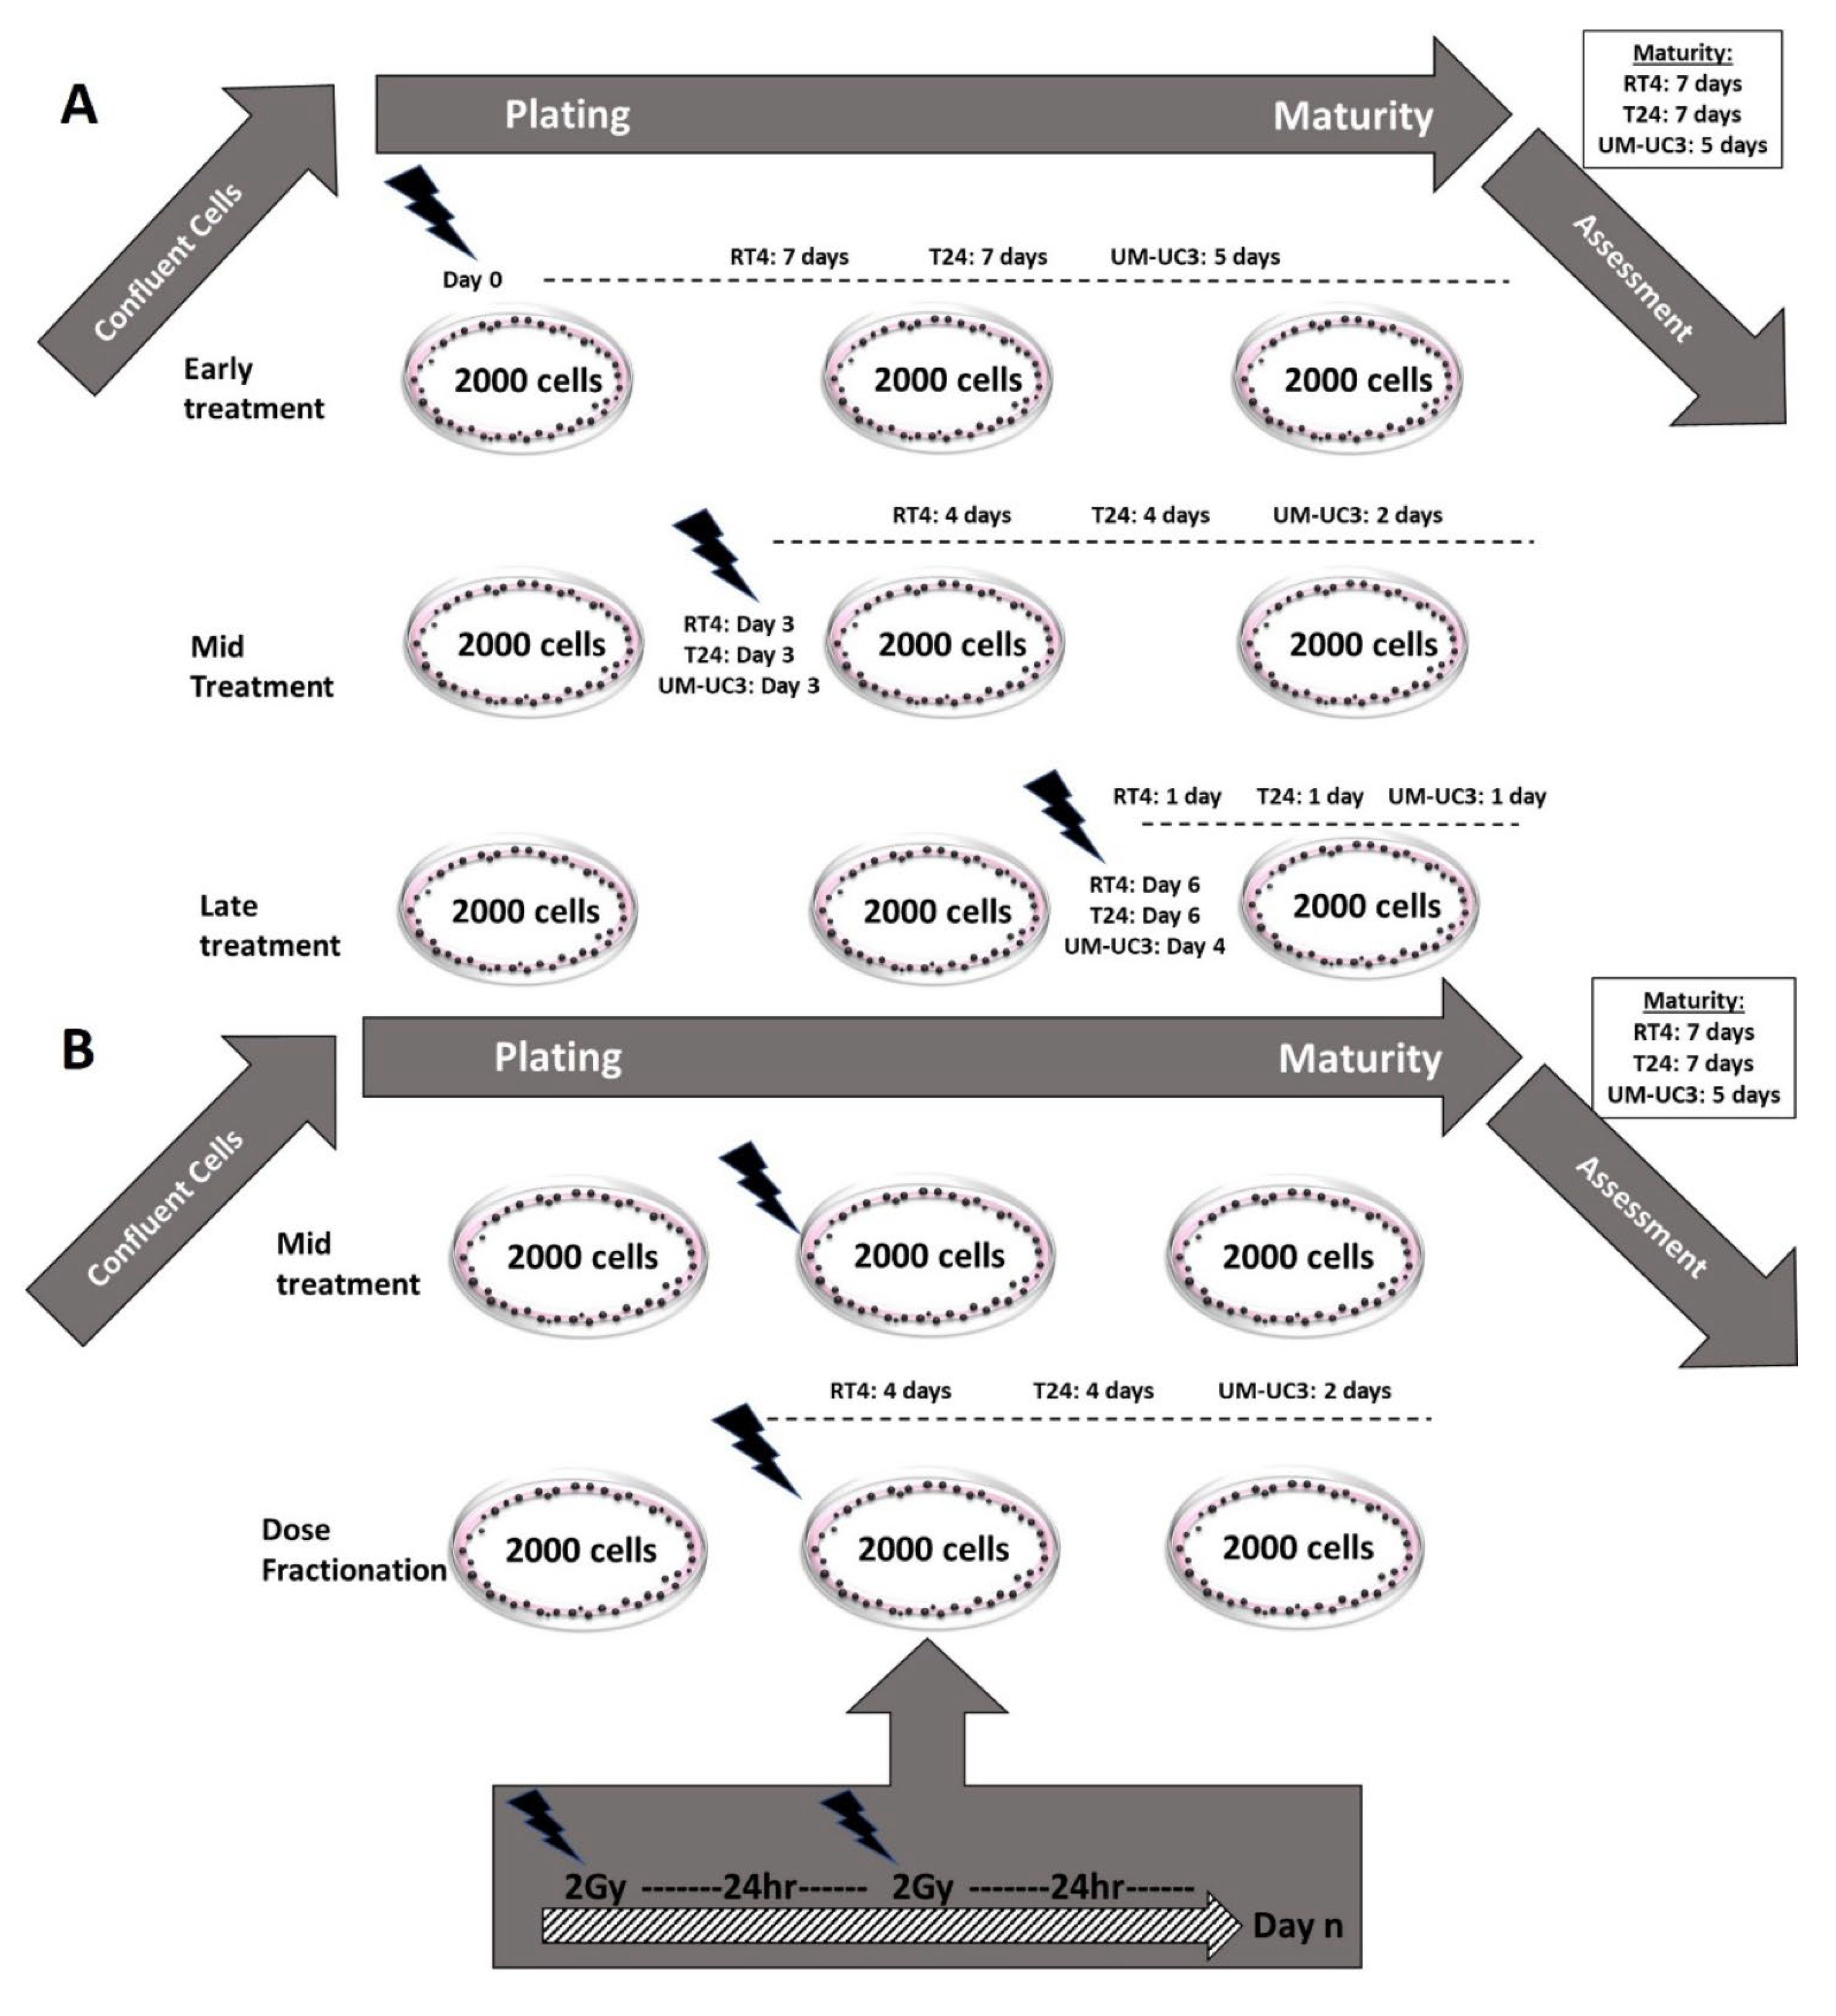
2.5. Sphere Irradiation

In order to assess the effect of IR timing and fractionation, spheres were subjected to four different irradiation protocols (Figure 1 and Table 2).
Early treatment: Cells were irradiated with a single dose (ranging between 0 and 10 Gy) immediately after embedding in Matrigel (day 0).
Late treatment: Spheres were irradiated with a single dose (ranging between 0 and 10 Gy) one day before ending the experiment. The experiment was ended at the specific maturity date for each cell line (Table 1)
Mid-treatment: Spheres were irradiated with a single dose (ranging between 0 and 10 Gy) halfway between plating and at the end of the experiment.
Dose fractionation (DF): Spheres were irradiated with a fractionated treatment that started the same day as the mid-treatment. The total dose (ranging between 0 and 10 Gy) was fractionated into 2 Gy/24 h.
Spheres were counted and bright-field images were acquired via a Zeiss Axio Vert.A1 (ZEISS, Jena South, Germany) microscope according to the time points of each experiment, and their sizes were measured with the Zen 2.3 lite blue edition software. The sizes were measured with a minimum diameter of 40 μm, as previously established [44,45,46,47]. For each experiment and condition, the diameter of 30 spheres was measured, and all experiments were repeated at least 3 times.
Sphere ratio (SR) was calculated using the following equation:
SR ( D ) = Number   of   spheres   at   dose   D Number   of   spheres   at   0   Gy
SR, as a function of the dose, was fitted to the LQ model:
SR ( D ) =   exp ( α D β D 2 )
with α (Gy−1) and β (Gy−2) being fitting parameters.
Sphere-forming unit (SFU) was calculated based on this formula:
SFU ( % ) = number   of   spheres   counted number   of   spheres   seeded     ×   100
Spheres’ volume was then calculated using the below equation:
V   = 4 π 3 × ( d 2 ) 3
with V being the spheres volume and d the spheres diameter
Volume reduction (VR) was calculated using the following equation:
VR ( D ) = V 0   V ( D ) V 0   ×   100
with V0 being the volume without exposure to IR, and V(D) the volume after treatment with a dose D in Gy.
VR, as a function of dose, was fitted to a curvilinear model:
VR ( D ) =   VR max ( 1 exp ( eD ) )
with VR being the percentage of volume reduction, VRmax being the maximal volume reduction, and e (Gy−1) being a fitting parameter.
LQ model for DF was used to predict the theoretical SRDF as a function of the dose
SR df ( D ) =   exp ( α D β dD )
with α (Gy1) and β (Gy2) being fitting parameters from Equation (1) and d (Gy) the dose per fraction.
Each experiment was performed 3 times. Results are shown as mean ± standard error of the mean (SEM).

2.6. Immunofluorescence and Confocal Microscopy Analysis

2.6.1. For Cells in 2D

Immunofluorescence staining of the phosphorylated form of H2AX was performed. Bladder cancer cells were seeded on 12 mm glass coverslips in 24-well plates. After incubation, cells were left untreated (control group—0 min) or treated with a dose of 2 Gy and fixed with 4% paraformaldehyde 24 h post-treatment. Cells were then permeabilized and blocked with 0.1% Triton-X 100, 10% NGS, and 3% BSA in PBS for 1 h at room temperature. Cells were then incubated with Anti-γH2AX (ser139) antibody (dilution 1:350, Millipore, Burlington, MA, USA; cat # 05636) for 1 h at 37 °C, then washed with PBS. Next, cells were incubated with the secondary antibody Alexa Fluor 488 goat anti-mouse IgG (dilution 1:100, ab150113) for 30 min at 37 °C. Coverslips were then mounted using Fluoroshield Mounting Medium with DAPI (4′,6′Diamidino-2-Phenyl-indole) (Abcam, Cambridge, UK; cat #ab104139). Images were taken with laser scanning confocal microscope Zeiss LSM 710 (Zeiss, Jena South, Germany), and were processed using Zen 2012 image analysis software (blue edition).
Each experiment was performed 3 times and the number of foci was scored in 30 nuclei per experiment, with a total of 90 nuclei. Results are shown as mean ± SEM.

2.6.2. For Spheres in 3D

Immunofluorescence staining was done on spheres in suspension. After sphere formation, cells embedded in Matrigel TM/DMEM Ham’s F-12 + 3% FBS were treated with a dose of 4 Gy (early treatment protocol) while others were left untreated (control group). Bladder spheres were collected using ice-cold media without FBS on the day of maturation, and were fixed with 4% paraformaldehyde. For immunofluorescence staining, spheres were incubated with 0.5% Triton-X 100 in PBS for 30 min, followed by two washes with PBS. Spheres were then blocked using 10% NGS, 0.2% Triton-X 100, 0.05% Tween-20 and 0.1% BSA for 2 h at room temperature. After blocking, spheres were incubated with mouse monoclonal anti-CD44 primary antibody (1:100 uL Santa-Cruz, CA, USA, cat # sc-7297) overnight at 4 °C. Spheres were washed twice with PBS and were incubated with secondary antibody Alexa Fluor 568 goat anti-mouse IgG antibody (1:200, Abcam, UK, cat # ab175473) for 1 h at room temperature. Finally, pelleted spheres were washed with PBS and mounted on Fluoroshield Mounting Medium with DAPI (4′,6′Diamidino-2-Phenyl-indole) (Abcam, UK; cat # ab104139). Images of at least 10 stained spheres were acquired using the confocal microscope Zeiss LSM 710 (Zeiss, Germany) and were then analyzed by Zen 2012 image analysis software (Blue Edition). Images were divided into lanes in which the intensity of separate fully formed spheres was measured (ZEN). Later, the average of the intensities measured per group (non-irradiated vs. irradiated at 4 Gy) was determined.
Each experiment was performed 3 times. Results are shown as mean ± SEM.

2.7. Statistical Analysis

Data and statistical analyses were done using MATLAB R2016a (MathWorks, Natick, MA, USA). ANOVA test was performed to validate the differences between volumes after irradiation. A Mann-Whitney-Wilcoxon non-parametric test was performed to compare two unpaired groups [48,49]. A Kruskal-Wallis test was performed when more than two groups were compared [50]. Differences were considered statistically significant when the p-value was lower than 0.05 (*), 0.01 (**), and 0.001 (***).
The data fit was obtained by minimizing the least squares residual. The data fit was obtained by minimizing the least squares residual. The algorithm used was the trust-region-reflective optimization, which is based on the interior-reflective Newton method [51]. The least squares calculations were obtained by using the lsqcurvefit command in Matlab2021 Software (The MathWorks, Natick, MA, USA), and were stopped when the final change in the sum of squares relative to its initial value became less than the default value of the function tolerance.
R2 values, also known as the coefficient of determination, were calculated automatically with the cited algorithm for all fits.

3. Results

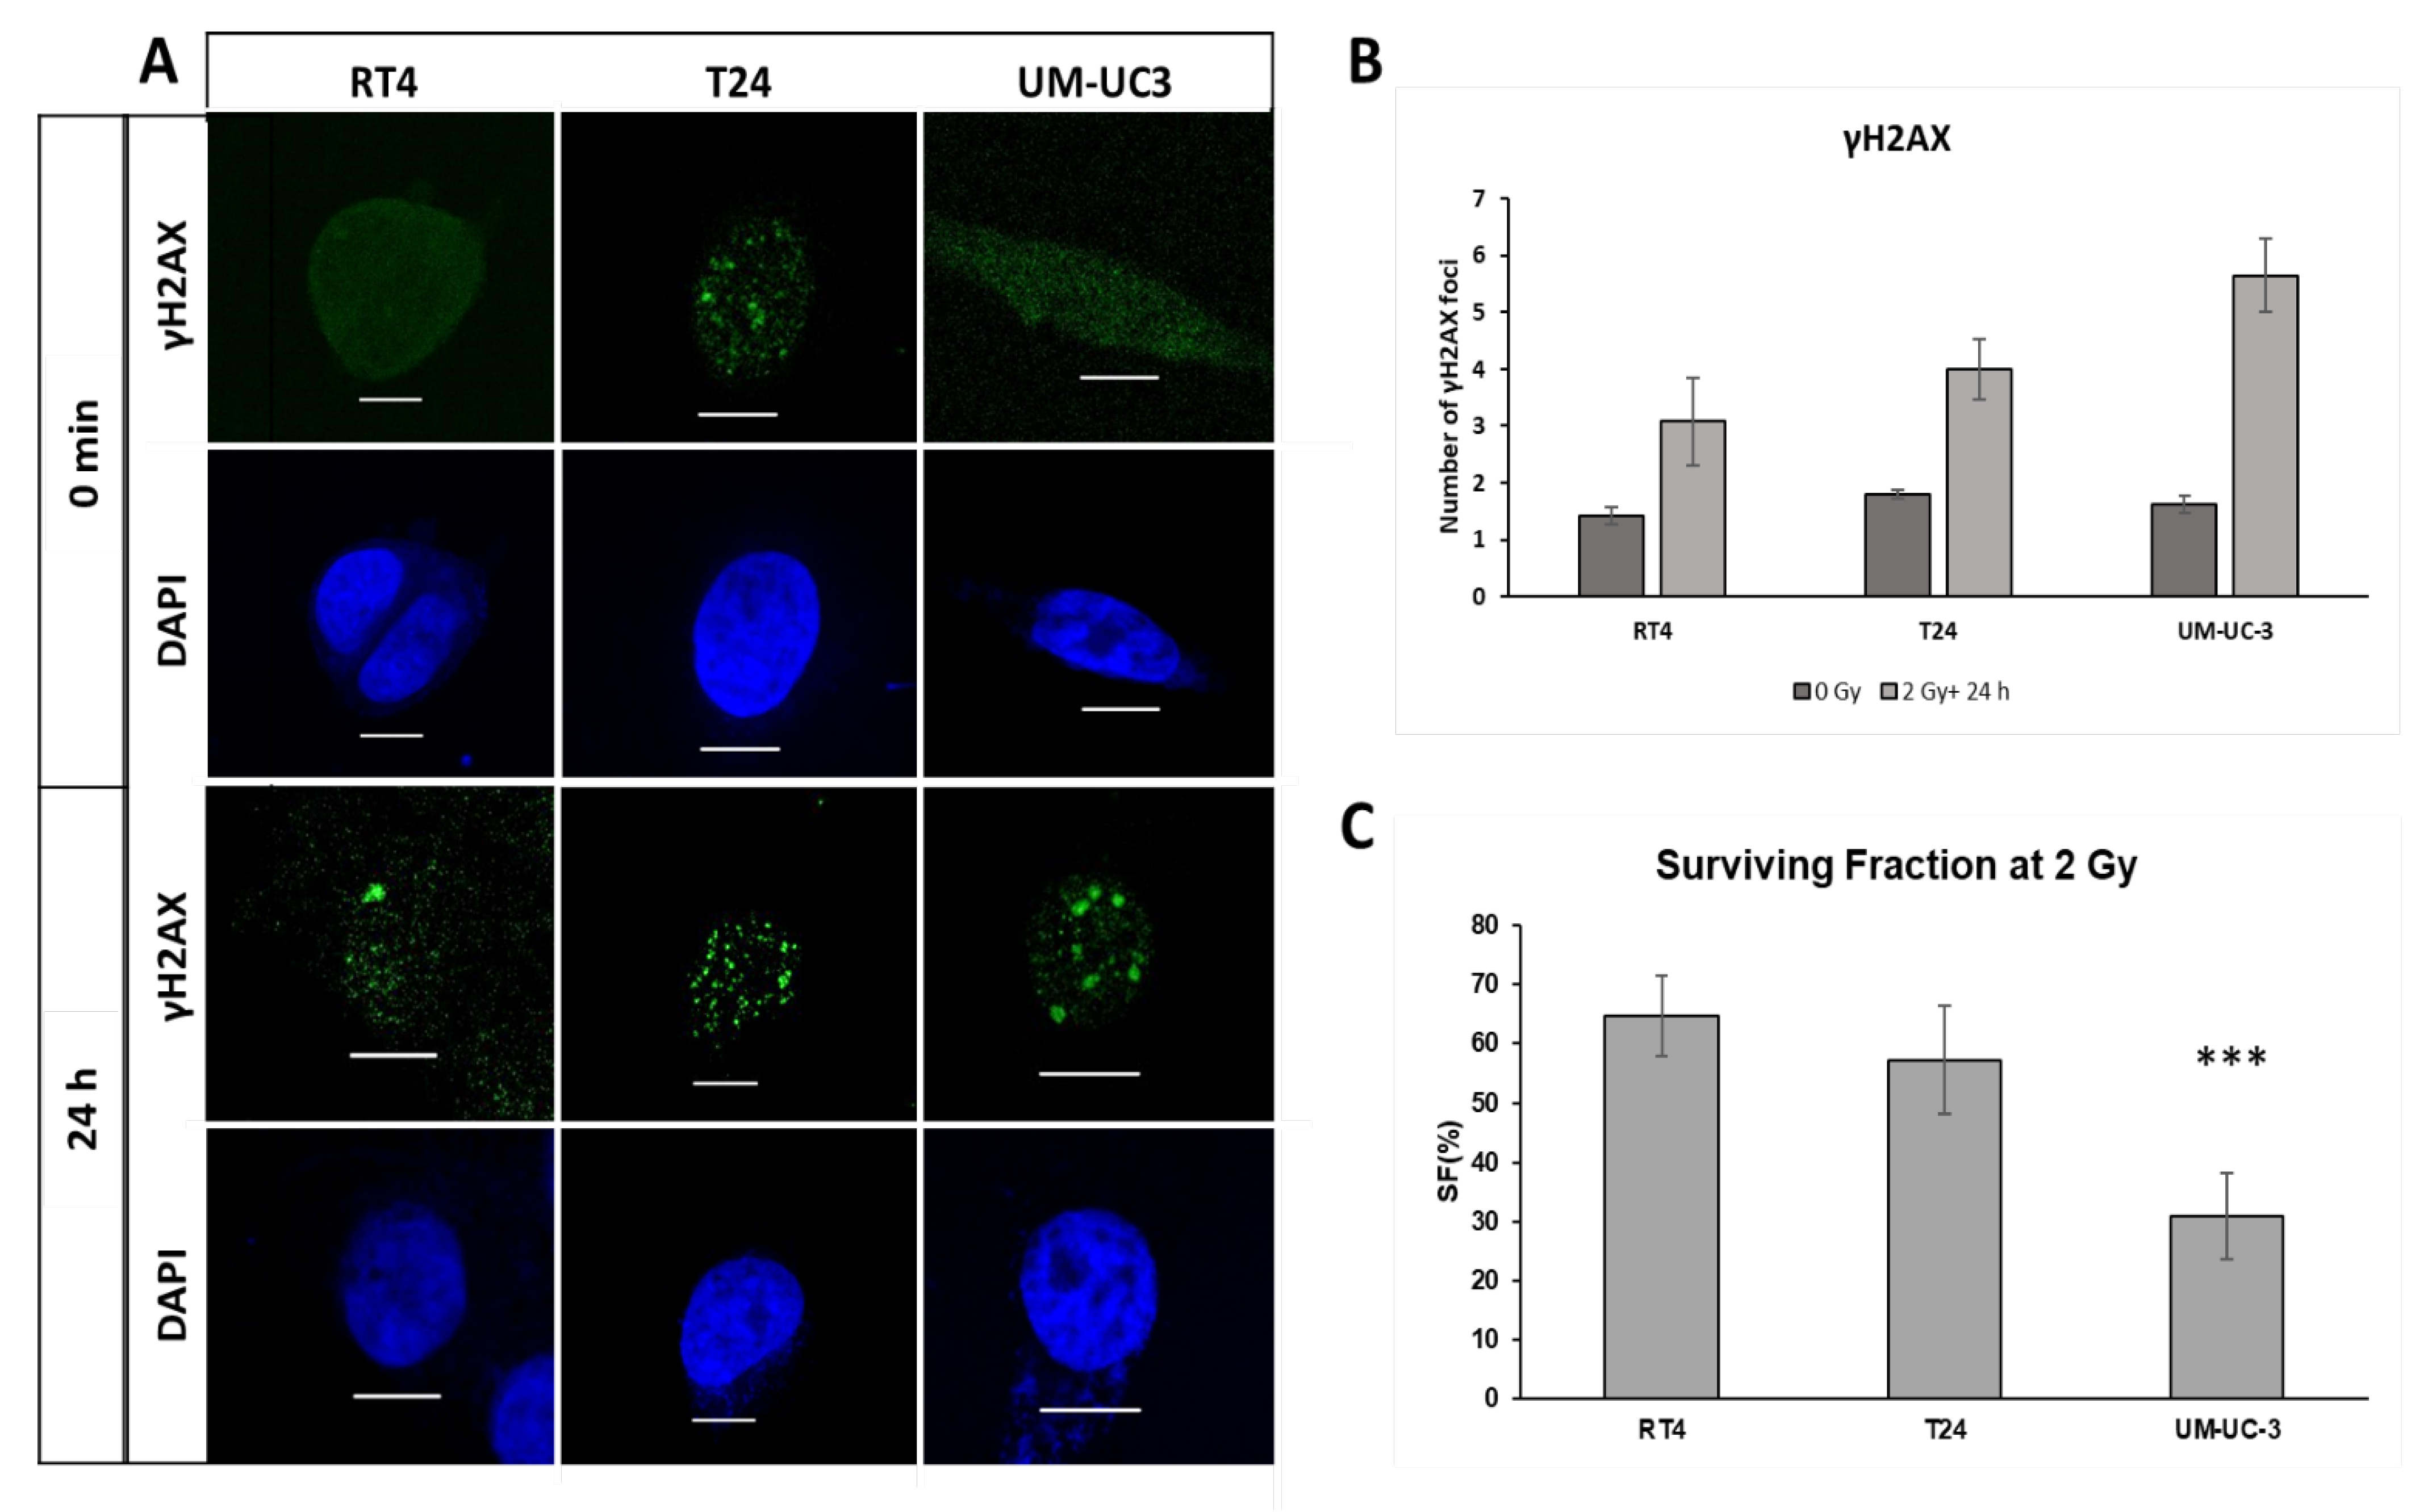
3.1. Radiosensitivity in 2D: Cell Survival and DNA DSB Repair

The three bladder cancer cell lines were irradiated with a single dose of 2 Gy. Radiosensitivity in 2D was assessed through the clonogenic assay for cell survival, and anti-γH2AX IF for the number of unrepaired DNA DSB.
Without IR, there was no significant difference in the number of spontaneous γH2AX between the three cell lines (p > 0.05, Figure 2A,B). After IR, there was a significant increase in the number of foci 24 h post-IR for the three cell lines (p < 0.001), with RT4 showing the lowest number of residual foci (3 ± 0.8 foci) compared to T24 (4 ± 0.5 foci) and UM-UC-3 (5.7 ± 0.6 foci) (Figure 2A,B).
The IF data were confirmed by the clonogenic assay results: UM-UC-3 had the lowest SF of 31 ± 7.3%, compared to 57 ± 9% and 64.8 ± 7% for T24 and RT4, respectively (Figure 3C).

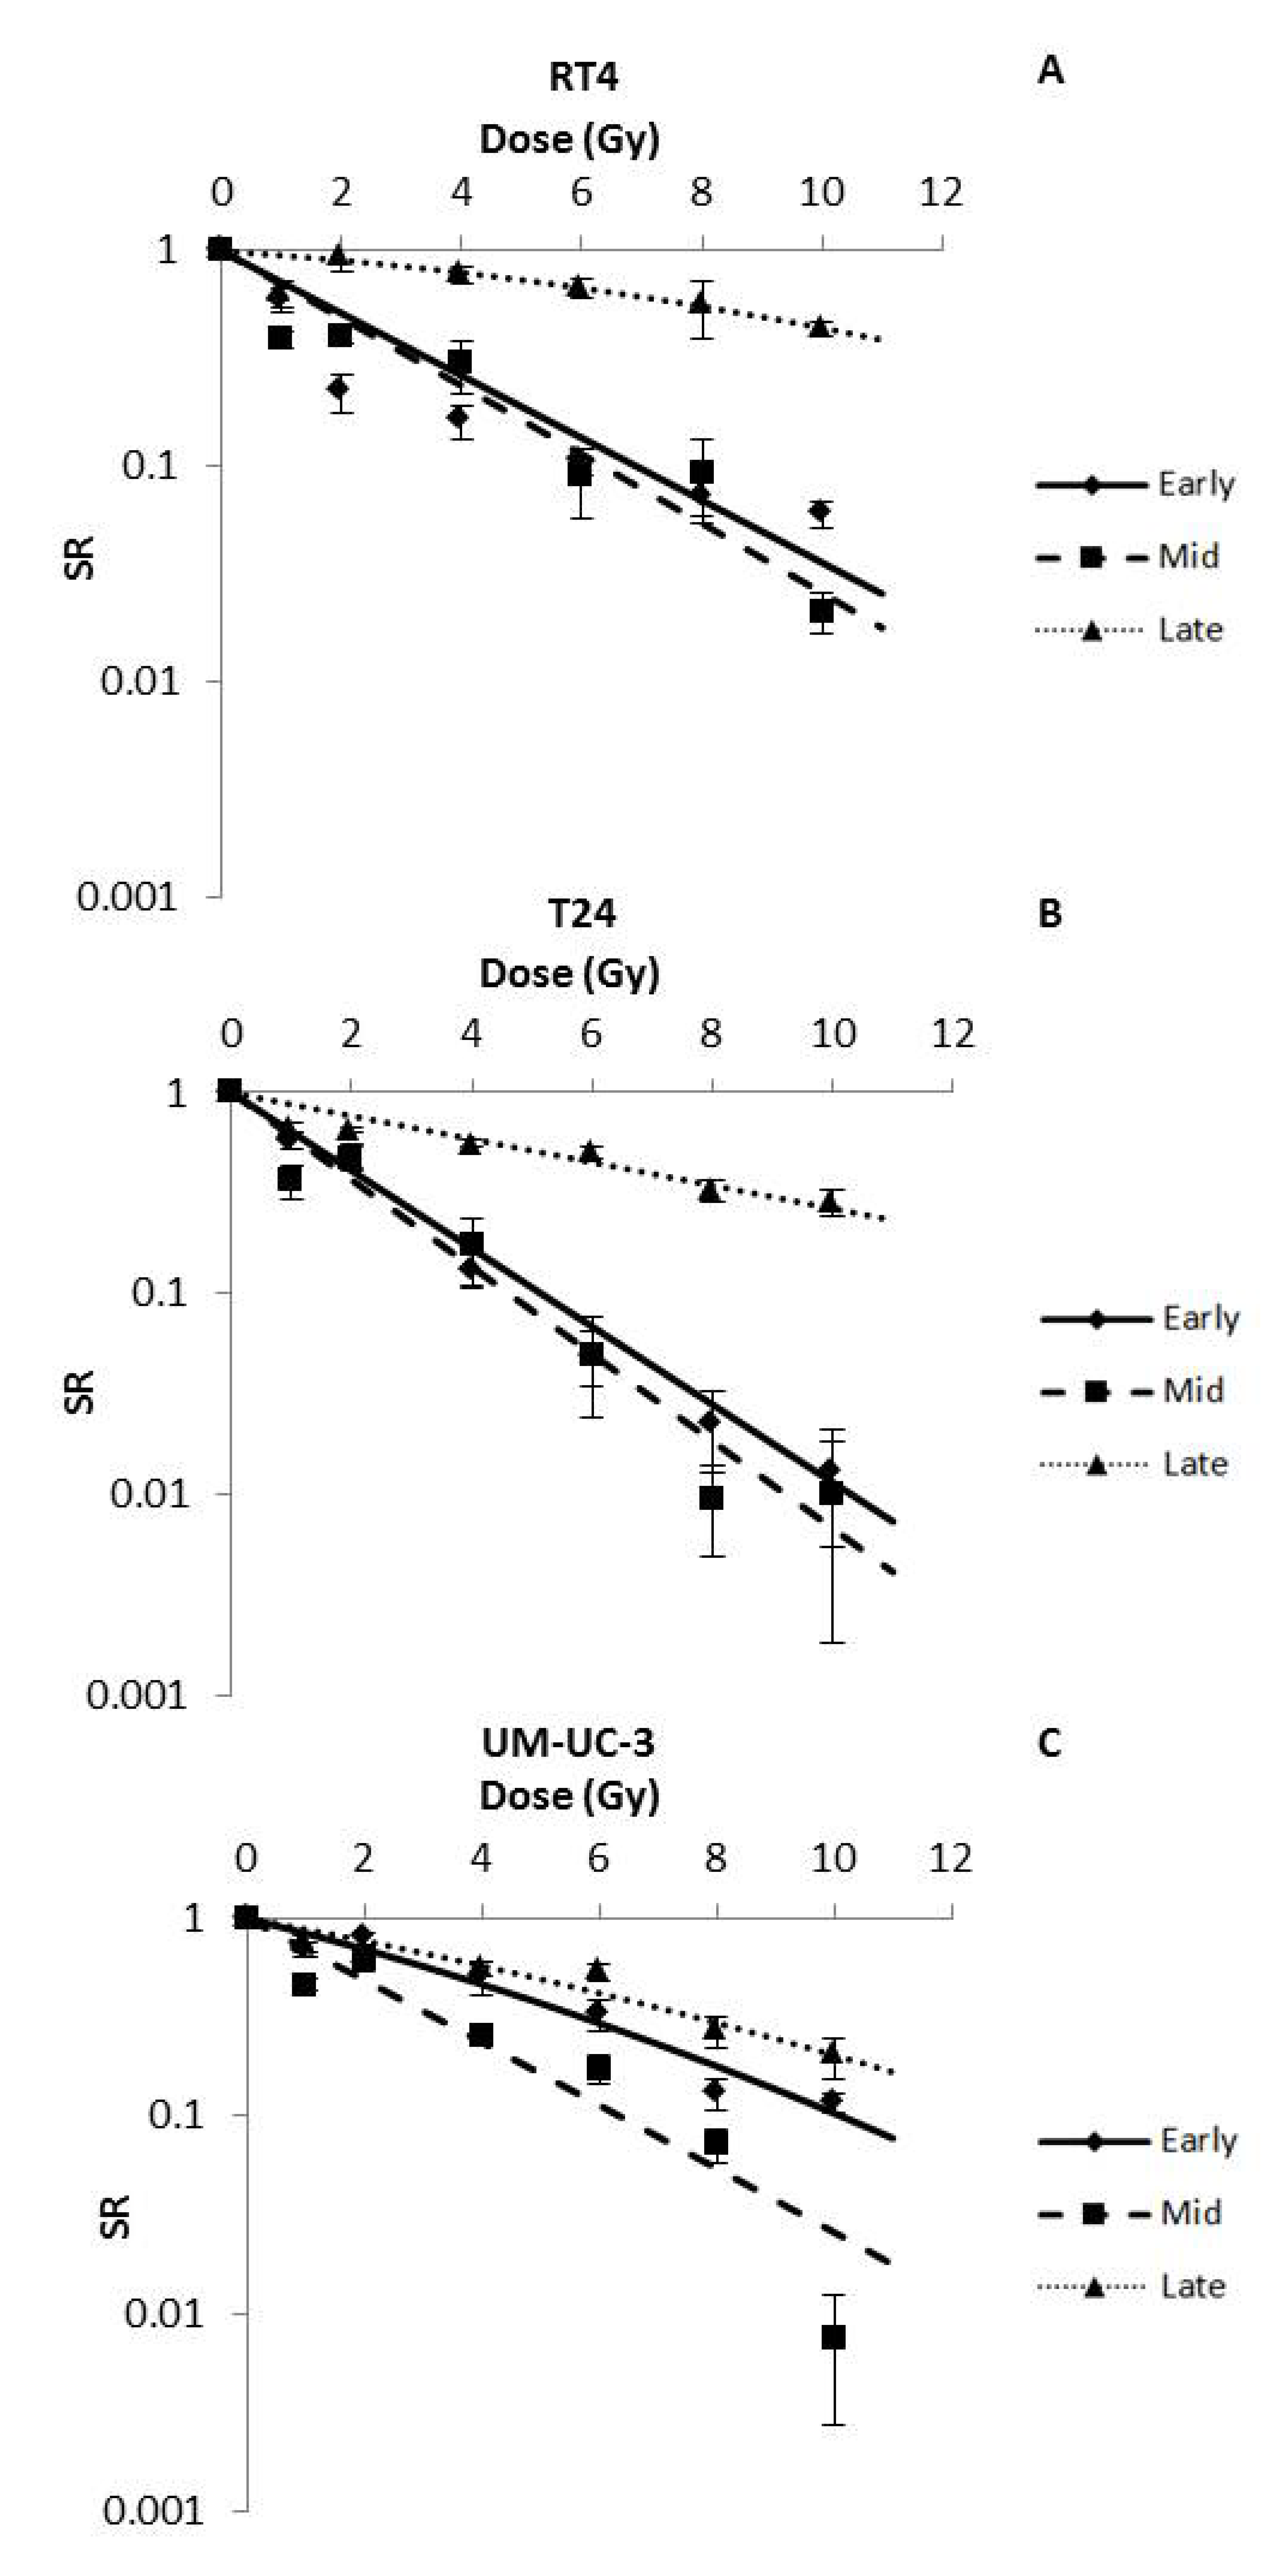
3.2. IR Dose and Timing Influence Sphere Numbers

In order to assess the capacity of spheres to survive after IR, bladder cancer cells were treated at different time points, after plating, with doses ranging between 0 Gy and 10 Gy (Figure 1A). Without IR, SFU was 5.35 ± 0.12%, 3 ± 0.04% and 1.39 ± 0.03% for RT4, T24 and UM-UC-3 cells, respectively. After IR, and for the three treatment timings (early, mid and late), SR of the 3 bladder cancer cell lines decreased significantly in a dose-dependent manner (p-value < 0.05) following the LQ model, with R2 values ranging from 0.8 to 0.99 (Figure 3 and Table 3). Interestingly, β parameters of the LQ models were all between 0 and 0.06 Gy−2 (early treatment for UM-UC-3), showing that the α parameter was the most dominant in describing SR.
The three cell lines responded differently to the early and mid-treatments (Figure 3A,B). While mid treatments showed a higher SR for RT4 at the lower doses (0.41 ± 0.04 vs. 0.22 ± 0.04 at 2 Gy, for mid and early treatments, respectively), the difference was smaller at higher doses (0.02 ± 0.05 vs. 0.06 ± 0.01 at 10 Gy, for mid and early treatments, respectively) (Figure 3A,B).Early treatments seemed to radioprotect UM-UC-3 spheres (Figure 3A): 0.79 ± 0.05 spheres remained after a 2 Gy early treatment while it was 0.62 ± 0.08 for the mid treatment (Figure 3B).
Late treatments were the least effective in inducing cell death, with SR values at 10 Gy reaching 0.44 ± 0.04, 0.28 ± 0.04 and 0.20 ± 0.05 for RT4, T24 and UM-UC-3, respectively (Figure 3C).
It is also worth mentioning that for most treatments, UM-UC-3 was the most radioresistant cell line with the highest SR, followed by T24 and then RT4. The only exception was with the late treatment, where RT4 had the highest SR (SR (2 Gy) = 0.95 ± 0.14) compared to T24 (SR (2 Gy) = 0.65 ± 0.02) and UM-UC-3 (SR (2 Gy) = 0.66 ± 0.07).

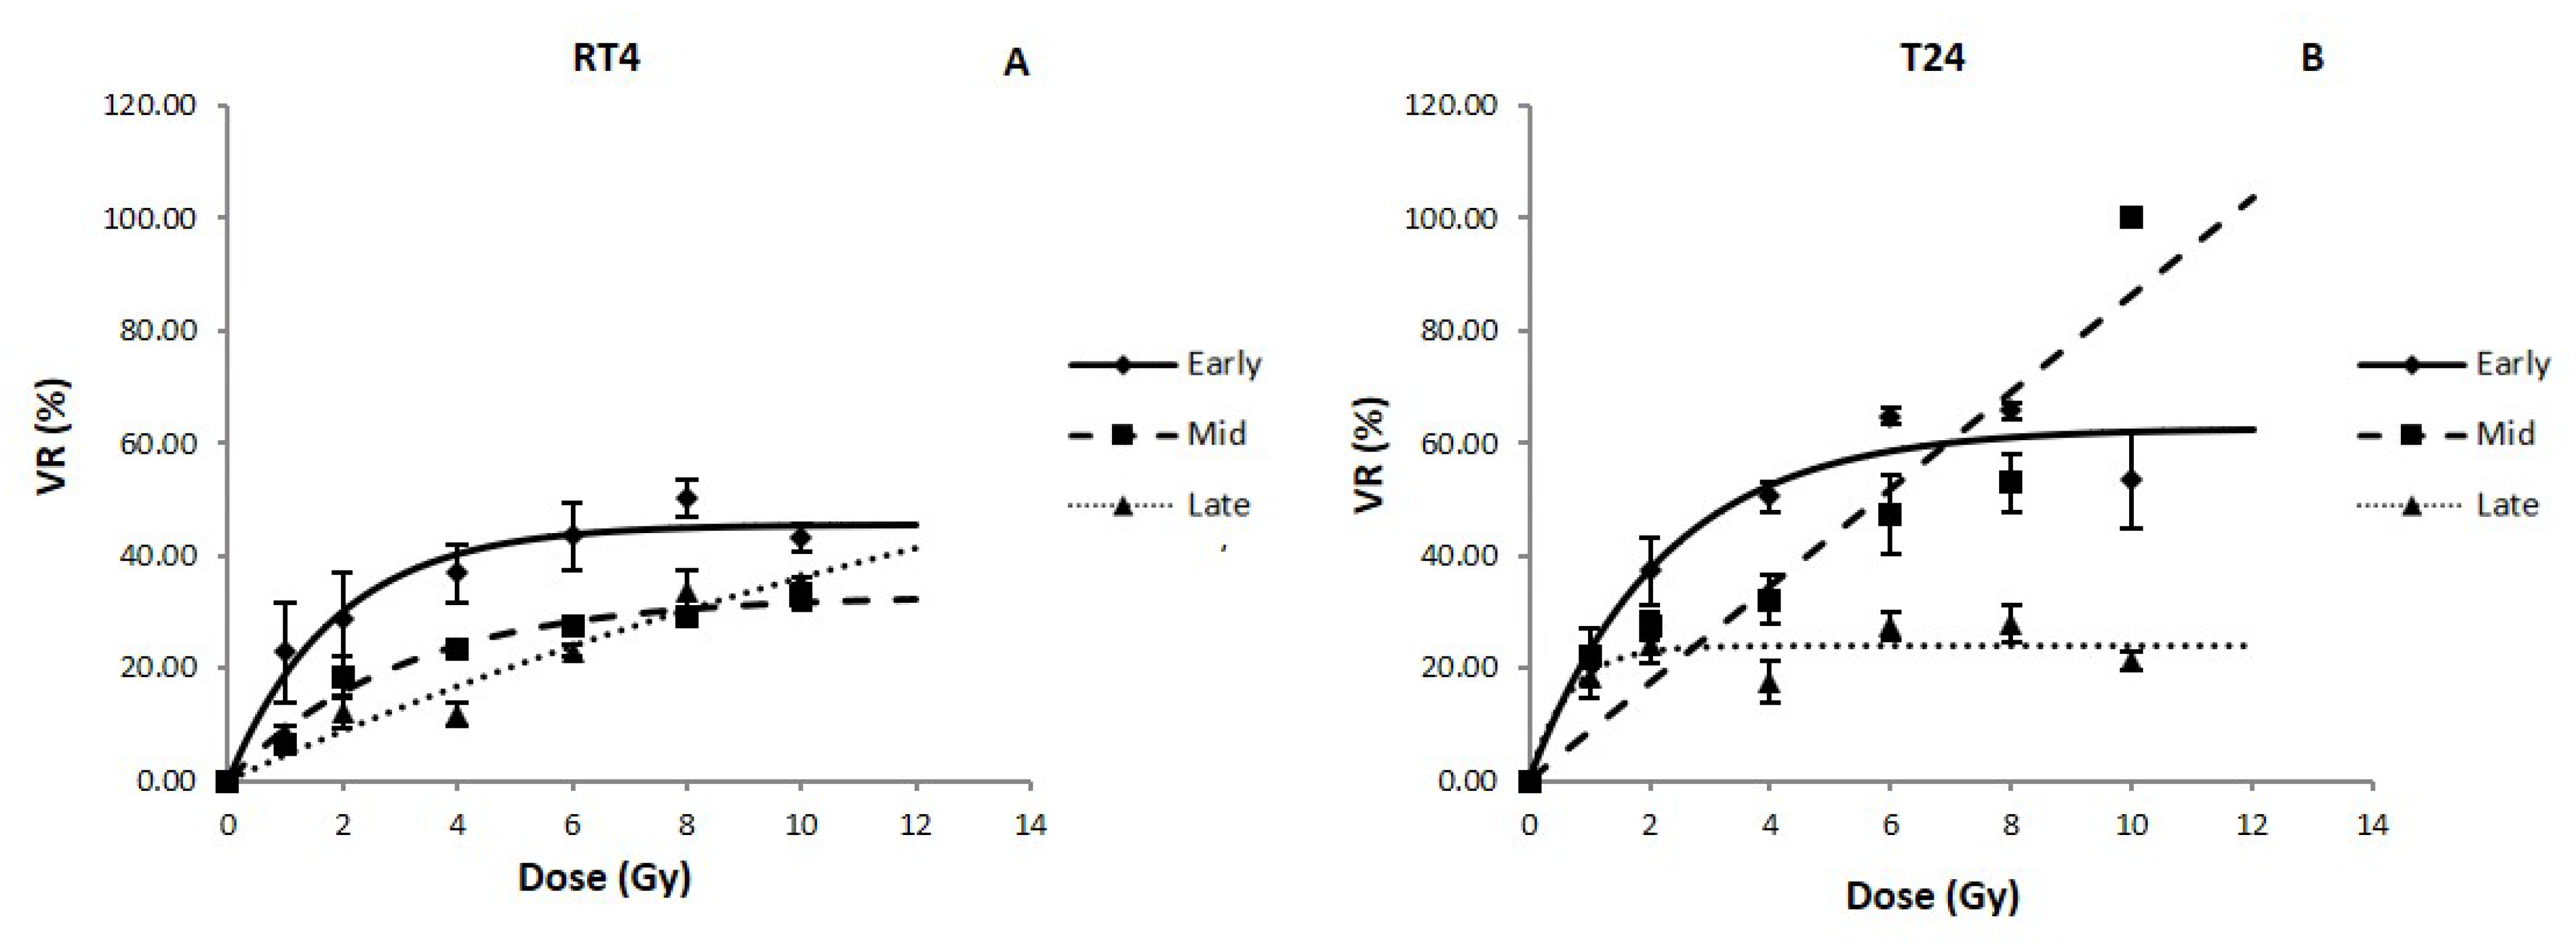
3.3. IR Time- and Dose-Dependent Effect on the Volume of Bladder Cancer Spheres
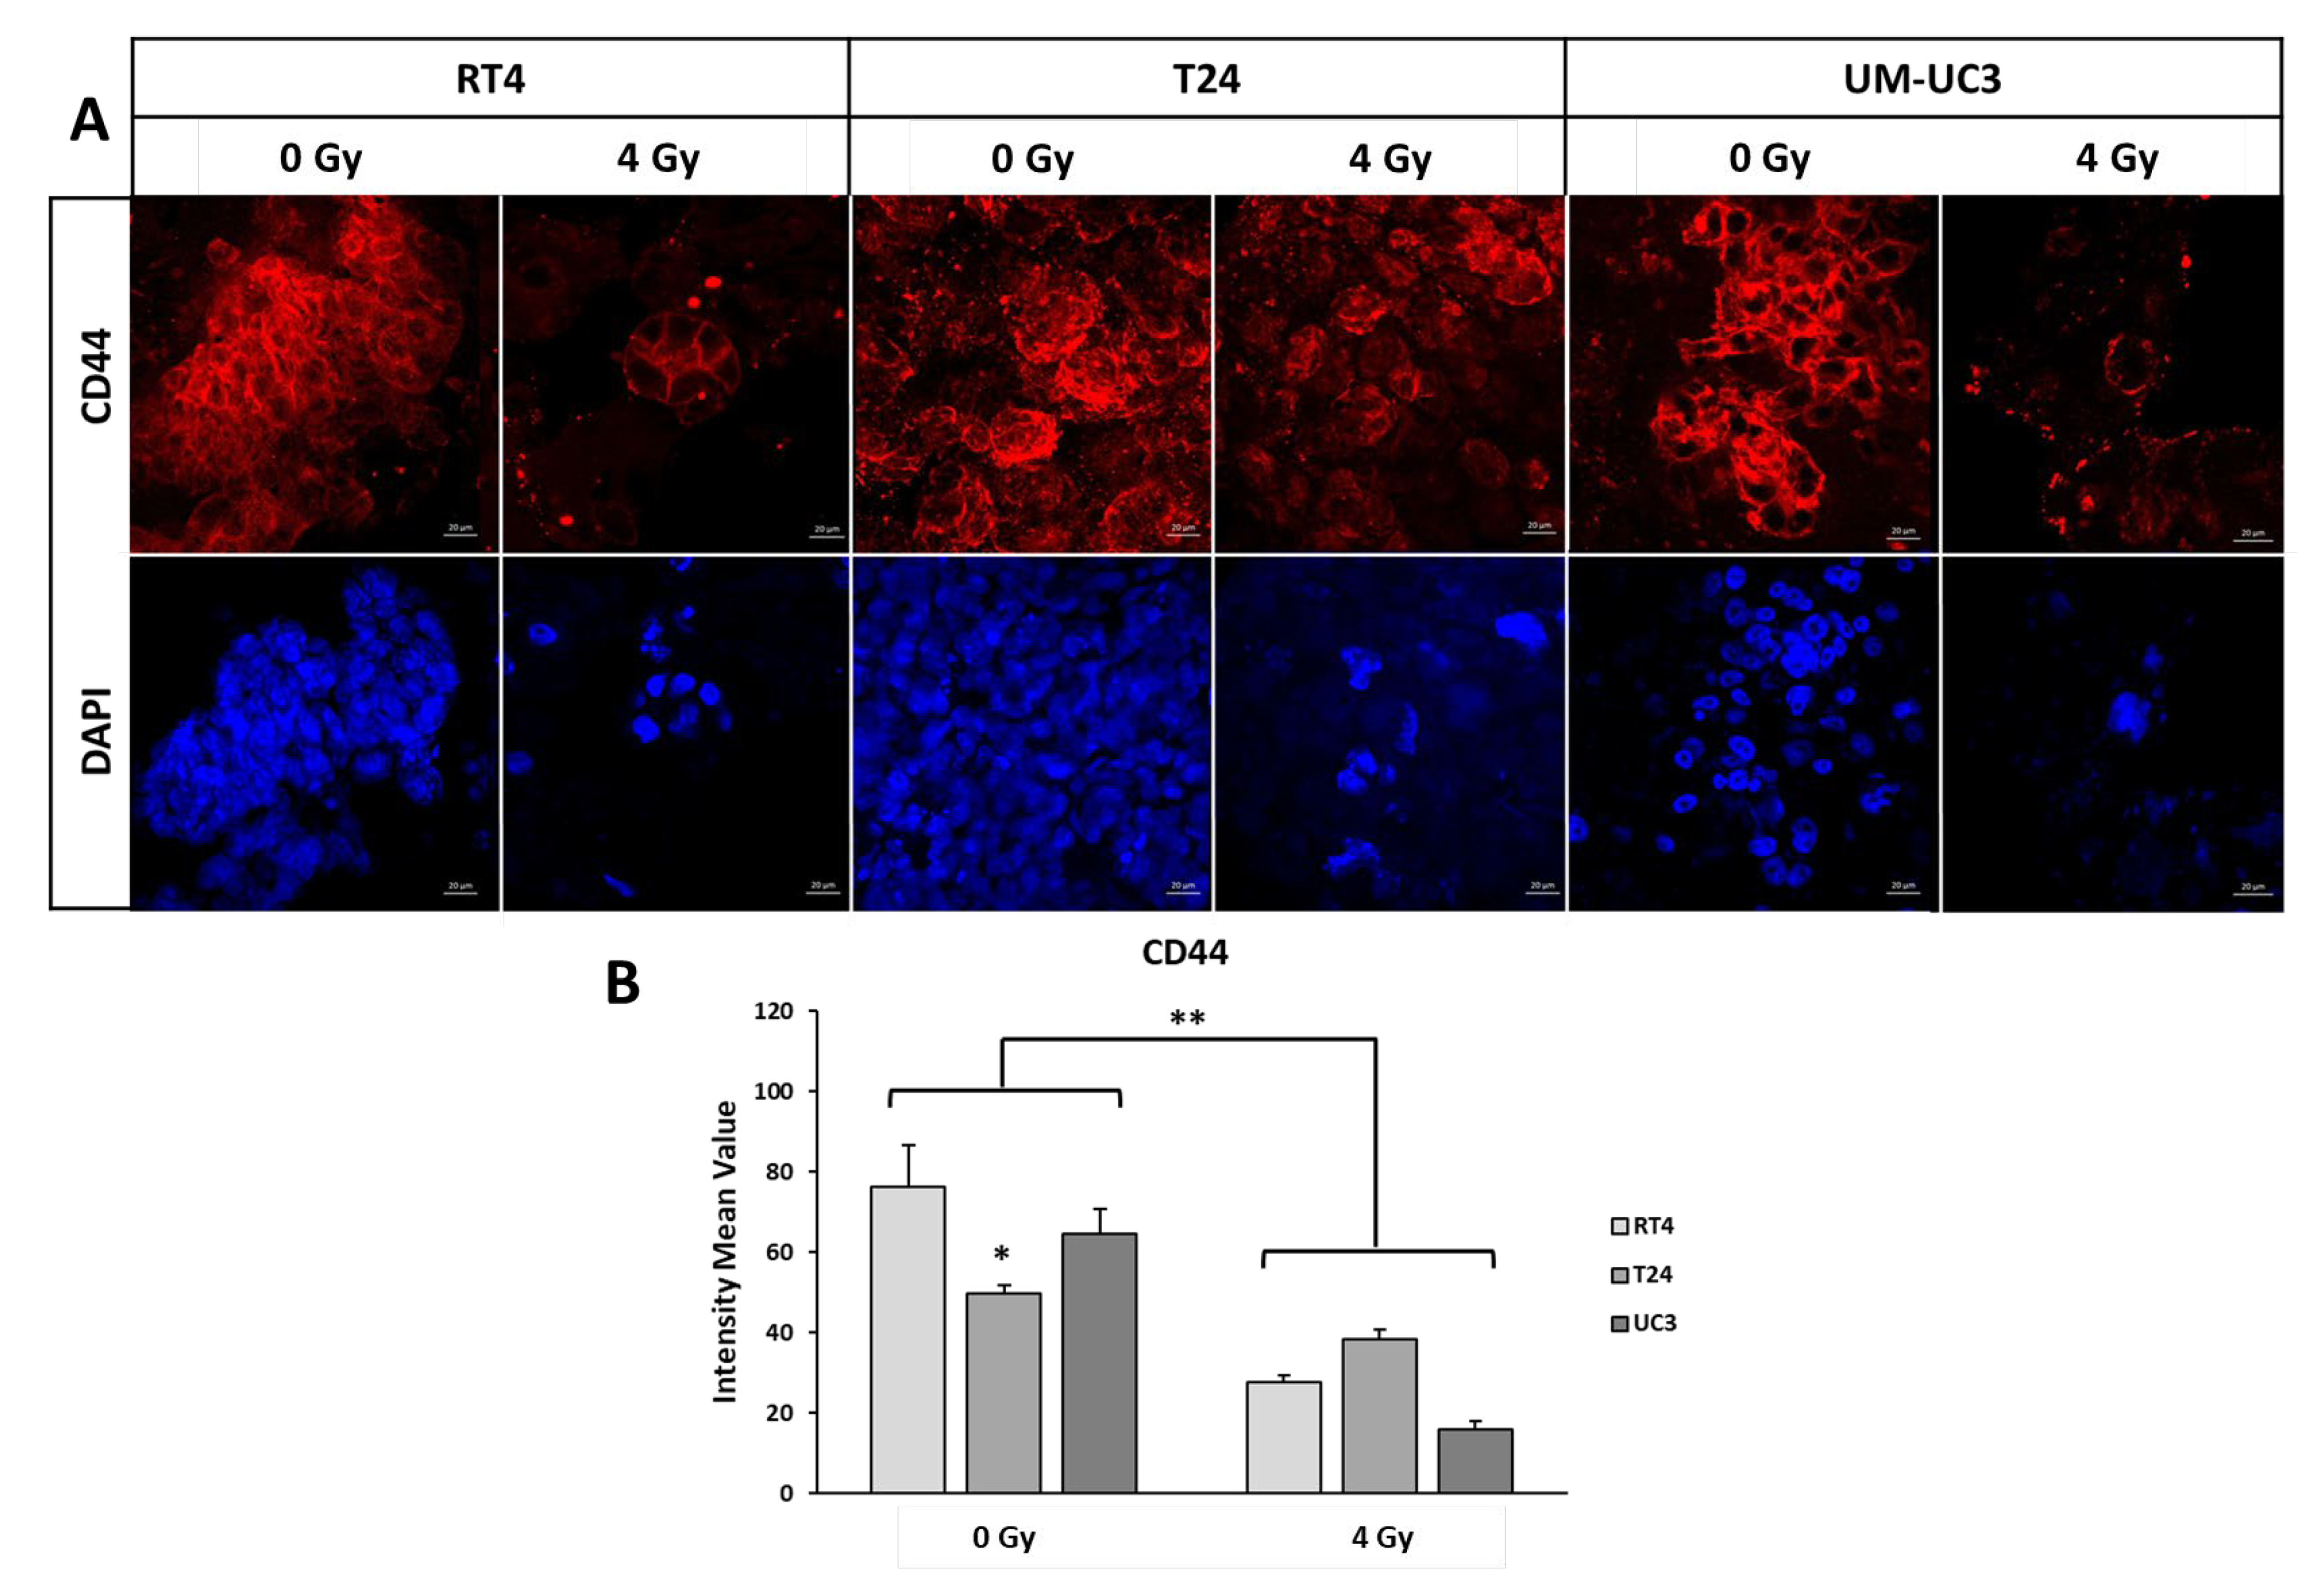
After analyzing the effect of dose and treatment timing on the number of surviving spheres, we sought to evaluate the effect of these treatments on the volume reduction in spheres. Without IR, spheres reached diameters of 55 ± 0.6 μm for RT4 (Figure S1), 66 ± 0.9 μm for T24 (Figure S2) and 45 ± 1.1 μm for UM-UC-3 (Figure S3). However, the diameter limit for a spheroid to be considered as such is 40 μm, as previously described [44,45,46,47]. This was shown to be a limiting factor, especially for the UM-UC-3 cell line, as any sphere with more than 10% of reduction cannot be taken into consideration. Furthermore, in a previous study from our group, we demonstrated that the volumetric response of UM-UC-3 to IR is negligible compared to the sphere number effect [28]. Therefore, we decided to omit the VR data of this cell line, as it is considered neither representative nor significant.
For both RT4 and T24, there was a significant decrease in sphere volume after exposure to IR for all treatment protocols (Figure 4). However, the effect of IR timing was different between the two cell lines. For RT4, VR decrease was most significant after early treatments, with the reduction reaching 50 ± 3.3% at 8 Gy while this value was 29 ± 0.2% and 33.5 ± 4.9% for mid and late treatments, respectively. On the other hand, mid treatments VR for T24 reached a value of 100% at 10 Gy, while for early and late treatments the values were 53 ± 8.5% and 21 ± 1.6%, respectively (Table 4).
It is also noteworthy mentioning that the volumetric radiosensitivity of both cell lines was modified by treatment timing: while RT4 was more resistant for early and mid-treatments than T24 the latter was more resistant to late treatments at higher doses (VR (8 Gy) = 28 ± 3.3% for T24 vs. VR (8 Gy) = 33.5 ± 3.9%).

3.4. CD44 Results

After assessing the dose and IR time effect on SR and VR, we analyzed the effect of a single 4 Gy irradiation on the expression of CD44, a stemness maker, in spheres.
Without IR, the intensity values of CD44 in RT4, T24 and UM-UC-3 spheres were 76 ± 10, 50 ± 2 and 64 ± 6, respectively. In order to better visualize the effect of IR, we calculated the percentage to the control of the intensity of CD44 after treatment. For all three cell lines, there was a significant decrease in the CD44 expression after IR (Figure 5, p < 0.001).
Interestingly, and after 4 Gy, the decrease was the highest for UM-UC3, with a percentage of expression to the control of 24.5 ± 3% (p < 0.001), followed by RT4 (36 ± 2.4%) and T24 (76.8 ± 5%)

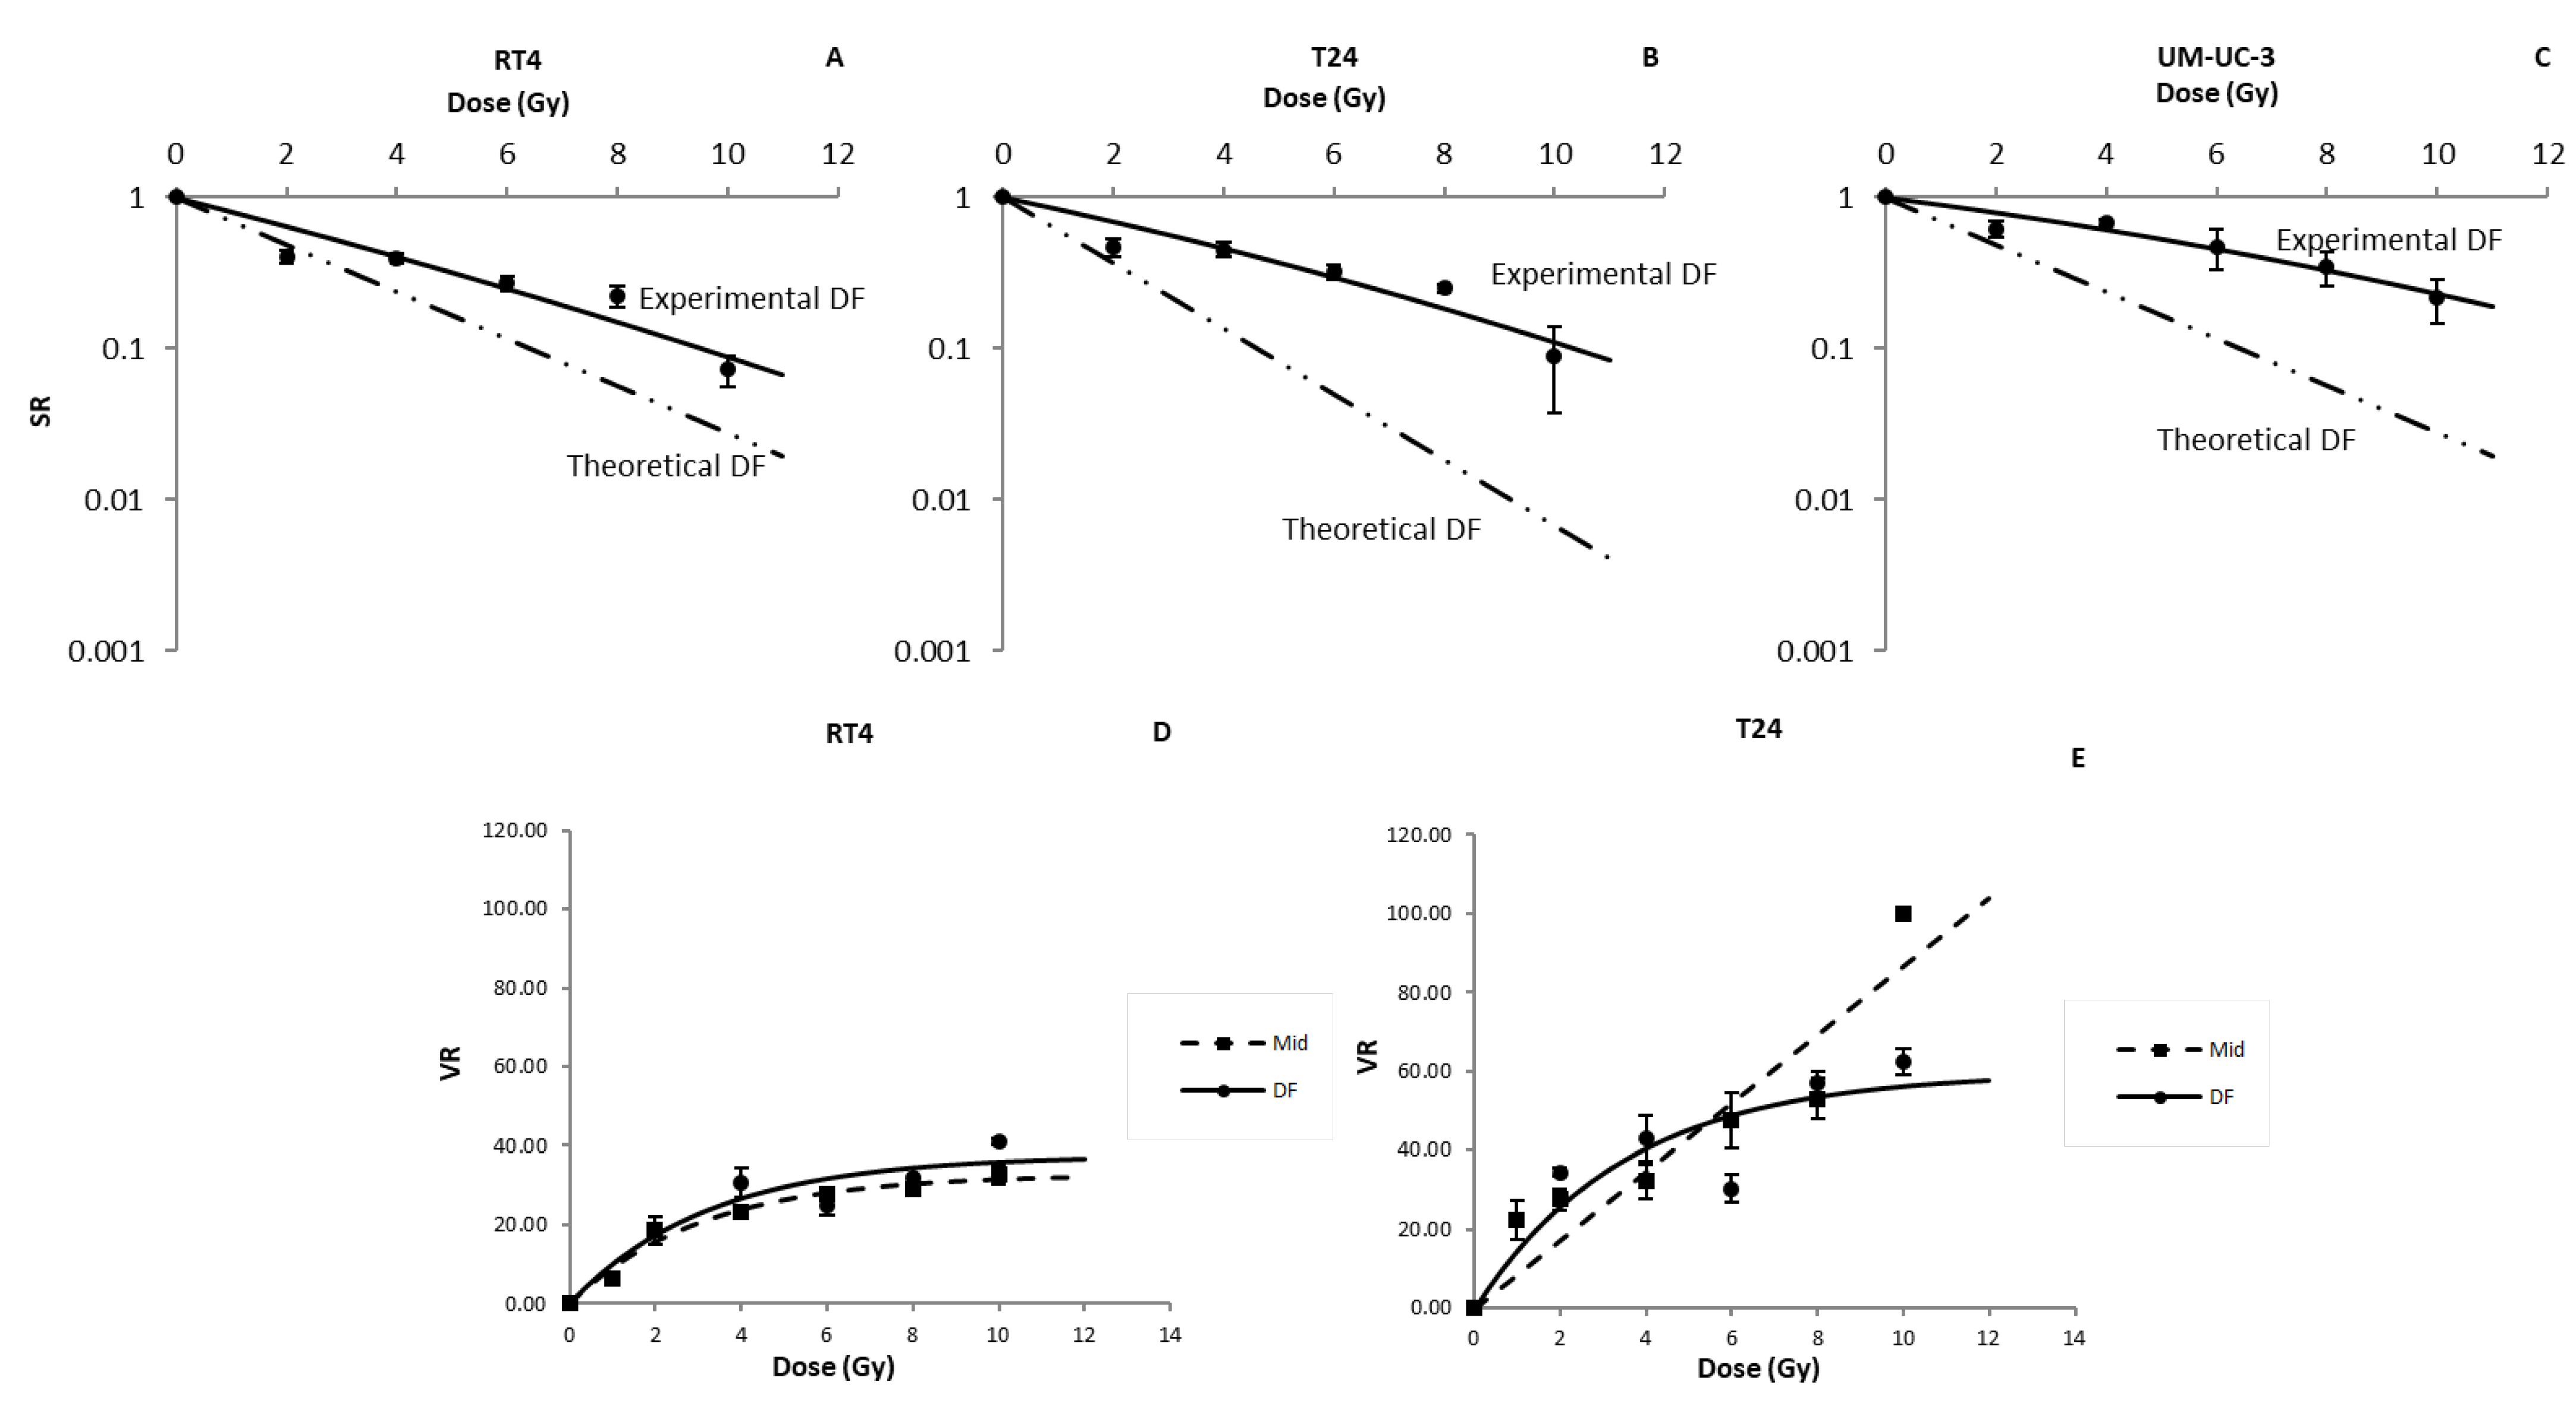
3.5. Dose Fractionation SR Results Are Not Compatible with the Predictions of the LQ Model

After assessing the effect of IR timing on bladder cancer spheres, we analyzed the response of RT4, T24 and UM-UC-3 to fractionated treatments, with the first dose being administered at the same time as the mid treatment protocol (2 Gy every 24 h, Figure 1B and Table 2), and to compare the results with the predicted LQ model for dose fractionation (Equation (8)). This timing protocol was chosen in order to allow spheres to grow enough before the treatment, and at the same time avoid them reaching their full maturation before the end of the treatment. For the three bladder cancer cell lines, SR followed the LQ model for single-dose treatments (SR = exp (−αD − βD2)). Here also, β parameters of the LQ model were very low, with values of 0.003 Gy−2, 0.004 Gy−2 and 0.004 Gy−2 for RT4, T24 and UM-UC-3, respectively.
Knowing that the first fraction of the DF treatment was performed at the same timing as the mid treatment protocol, we decided to analyze the theoretical curve of DF LQ model by using the α and β parameters of the mid experiments for each cell line. The purpose was to assess the compatibility between the DF LQ model and our experimental results.
However, DF LQ model failed to fit the data, showing an over-estimation of cell death (Figure 6A–C). The biggest relative difference for RT4 and T24 was at 4 × 2 Gy with SR values 75% and 77% higher than expected, respectively. For UM-UC-3, the biggest difference was at 5 × 2 Gy with a value of 87%. It is also noteworthy mentioning that, for all the treatment doses, UM-UC-3 showed the highest difference between theoretical and experimental DF, followed by T24 and then RT4.
Lastly, we evaluated the effect of DF treatment on sphere volume for both RT4 and T24. We purposely omitted the VR values of UM-UC-3 as they were deemed not significant for the reasons mentioned previously. VR for both cell lines decreased significantly after IR with a DF protocol following a curvilinear shape (Figure 6D,E and Equation (7)), with R2 values of 0.9 and 0.81 for RT4 and T24, respectively (Table 4). However, for both cell lines, there were no statistically significant variations in the VR values for DF treatments with total doses higher than 4 Gy (p-value > 0.05 for both cell lines).
Since we started irradiating the spheres at the same timing as the mid-treatments, a comparison between the latter and the DF results was performed (Figure 6): the only statistically significant difference between the two protocols was observed for RT4 after total doses of 6 and 10 Gy, and T24 at 10 Gy (p-value < 0.05).

3.6. Differences between Pre- and Post-Plating IR

In our previously published article, we studied the effect of irradiation on the capacity of cells to form spheres [28], where cells were treated before plating. In this study, however, all the experiments were performed after plating. Interestingly, the difference between all the treatment protocols was dependent on the cell line:
When treated before plating, RT4 cell line had a sensitivity comparable to early treatments (SR(2 Gy) values of 0.07 ± 0.05 for pre-plating IR vs. 0.07 ± 0.045 for early treatments, p-value < 0.05), while it was more sensitive than mid (SR(2 Gy) = 0.42 ± 0.04%) and late (SR(2 Gy) = 0.95 ± 0.014) treatment protocols.
T24 (SR(2 Gy) = 0.21 ± 0.03), when treated before plating, was more sensitive than all the post-plating treatments (SR(2 Gy) values of 0.49 ± 0.07, 0.47 ± 0.06 and 0.65 ± 0.02 for early, mid and late treatment protocols, respectively).
For UM-UC-3, cells irradiated pre-plating had SR values comparable to cells with late treatments, mainly at higher doses, with SR(8 Gy) values of 0.27 ± 0.06 and 0.27 ± 0.05 for pre-plating and late treatments, respectively.
Conversely, and for both RT4 and T24, sphere volume decreased significantly more after pre-plating treatment (VR(8 Gy) = 61 ± 11% and 99 ± 1% for RT4 and T24, respectively), than any other post-plating irradiation protocol.

4. Discussion

While cystectomy is still the most frequently performed bladder cancer therapeutic approach, its side effects and the quality of life of surviving patients have led to the development of new bladder preserving treatment strategies based on RT and chemo-radiotherapy [6,52,53,54,55,56,57,58,59,60,61]. The emergence of RT treatments for bladder cancer and the difference in radio-response between different patients have highlighted the need for a better understanding of bladder cancers’ radiosensitivity [4,9,62].
Scientists have always focused on the need to predict individual radiosensitivity for both tumor and normal tissues [63]. These studies concerned mainly functional assay based on cell death pathways such as apoptosis [64], radiogenomics [65], proteomics [66] and DNA repair [67,68,69]. Their main purpose is to personalize cancer treatments to have the highest efficiency with the least side effects. To date, the assay of reference to characterize cellular radiosensitivity remains the clonogenic assay, which is defined by the capacity of treated cells to form colonies [16]. Many theoretical models were developed to describe cell survival, but the LQ model is still considered the most relevant and best fitting model [17,19,20,25]. The α/β ratio is widely used in RT treatments to predict radio-induced toxicities and tumor response to fractionation [70,71,72].
However, one of the drawbacks of the clonogenic assay is that it over-simplifies the radioresponse by targeting cells cultured in 2D (monolayers) with no additional constraints. In a previous study, we aimed at comparing between radiosensitivity in 2D (surviving fraction, SF), and in 3D (SR and VR), for RT4, T24 and UM-UC-3 when treated before plating [28]. The response and the difference between 2D and 3D were highly dependent on the cell line: spheres were shown to be more resistant than monolayer cultures for RT4 and UM-UC-3, but they were more sensitive for T24. One of the explanations was that in 3D culture systems, only CSCs have the capacity to form spheres: there might be a difference in the radiosensitivity between CSCs and the average cell, and this difference is cell-line dependent [59,60,73,74].
In addition to that, 3D cultures add another constraint and endpoint for a more relevant assessment of radiosensitivity: volume, assessed here as VR. Irradiating spheres can therefore provide us with two critical pieces of information: the number of surviving CSCs (SR) and the proliferative capacity of these surviving CSCs which is described by the sphere volume (VR).
The purpose of this study was to analyze the effect of different treatment protocols on the number and size of spheres. We started by analyzing the radiosensitivity of the cell lines in 2D using the clonogenic assay and anti-γH2AX IF. Our results showed that in a monolayer culture system, UM-UC-3 was the most radiosensitive, and RT4 the most resistant (Figure 2). Then, we analyzed the effect of IR timing after plating the cells. Three treatment protocols were performed with the cells/spheres being subjected to IR right after plating, midway before maturity, and at maturity. For more clarity, we summarized all the results and the most important experimental values in Table 5.
There was a significant difference in the effect of IR timing on the three cell lines: while RT4 was the most sensitive for early treatments, it became the most resistant after late IR (Figure 3A). On the other hand, for both RT4 and T24, there was no statistically significant difference between early and mid, while the values of these treatments were different for UM-UC-3 (Figure 3B,C). Furthermore, early treatment for UM-UC-3 was shown to radioprotect the spheres, compared to mid treatment (Figure 3C). This shows that, in addition to personalized dose treatment, the timing effect in inducing CSCs death might also play an important role. We observed a reduction in SR for all 3 cell lines with an increase in radiation dose, as well as a VR in RT4 and T24 cell lines. We also noted a decrease in CD44 expression in all cell lines irradiated with a single 4 Gy dose. CD44 is a stemness marker, and as mentioned above cancer stem cells are believed to be responsible for treatment resistance and cancer recurrence.
A relationship between CD44 expression and radiosensitivity in bladder cancer has been previously established. Cells expressing CD44 were less likely to undergo radiation-induced apoptosis and expressed shorter growth tumor delay than their counterparts [34]. Thus, understanding the relationship between CD44 expression and sphere formation in-vitro could prove to be a vital step in our understanding of radiosensitivity of bladder cancer cell lines in relation to cancer stem cells. While there was no direct correlation between the levels of CD44 and cellular radiosensitivity (Table 5), the decrease in CD44 expression after irradiation could explain the decline in the ability of bladder cells to form full sized spheres; however, in our results, additional experiments on a larger panel of cells are required to confirm our results.
The volume of the sphere represents the capacity of a specific stem cell to form one sphere. Any decrease in the sphere volume represented by the VR describes both the stemness and the sensitivity of the cells in the sphere. In this study, we showed that the volumetric radiosensitivity is very dependent on both the cell line and the treatment protocol, with RT4 being more resistant in early and mid-treatments than T24 (Figure 4 and Table 5).
Employing the three different treatment protocols alludes to recapitulation of various therapeutic approaches. For instance, early treatment of plated cancer cells might signify targeting of cancer stem-like cells during their initial growth within a tumor, hence prophylactically preventing tumor growth. Mid and late treatments of spheres could denote an inhibiting effect on the progressive growth of a subpopulation and enriched population of CSCs within the tumor bulk, respectively, which suggests targeting cancerous lesions at their mid and late clinicopathological stages. It can also help in taking into consideration the oxygen effect in solid tumors: the core of the spheres is known to be hypoxic, which leads to a higher radioresistance [75,76,77].
In clinical practice, bladder cancer is usually treated with dose fractionation with a dose per fraction ranging between 1.8 and 2.5 Gy for a total dose that can reach 70 Gy [61]. To date, all the dose fractionation treatments plans are based on the LQ model for dose fractionation (Equation (8)) [25,70,72,78]. More precisely, the α and β parameters deduced from the LQ model are used in daily clinical practice to calculate the biologically effective dose (BED) from Equation (8) [70,79,80]. When comparing our results with those found in the literature, we can see that the α parameters are higher than those observed and used in clinical practices for bladder cancer treatments (α = 0.04 Gy−1 [0.022, 0.062], CI = 0.95%), while β parameters in 3D were lower for RT4 and T24 (β = 0.0034 Gy−2 [−0.0035, 0.0103]) [81]. This leads to an α/β ratio higher than the one used in clinical dose fractionation (recommended α/β = [10 Gy, 15 Gy]). Theoretically, a higher α/β usually means that DF will not radioprotect the tissue, and that it can be performed without modifying the tumor response.
These models are all based on the clonogenic assay results. In this study, we aimed to assess whether the same model can be applied to sphere numbers and volume. We chose a clinically relevant dose fractionation protocol that consists of a 2 Gy session every 24 h. Interestingly, there was a big and significant difference between the predicted SR based on the LQ model and the experimental data obtained after treating bladder cancer spheres (Figure 6). This difference was also cell line dependent, with UM-UC-3 showing that experimental SR after DF was 87% higher than the predicted value, while the maximal difference was 77% and 64% for T24 and RT4, respectively (Figure 6). This shows that by performing a DF treatment protocol on bladder cancer cell lines, theoretical models are over-estimating the radiosensitivity of the CSCs population: DF is radioprotecting CSCs more than expected while inducing more cell death to the rest of the cellular population. If we take into consideration the fact that a higher number of surviving spheres is generally correlated with poor clinical outcome, under-estimating SR can have serious clinical consequences [76,82]. This effect can, however, be overcome by a higher dose per fraction treatment: In fact, recent clinical studies showed that a dose escalation in bladder radiotherapy is linked to a better clinical response [83,84]. It is also necessary to develop a mathematical model that can describe and accurately fit the decrease in the number of spheres after a DF treatment. More cell lines are required to be able to propose this model.
In this study, we were able to better understand the radiobiology of bladder cancer cell lines. The differences observed between the three cell lines highlight the need for radiosensitivity predictive assays that can help us understand the response of bladder cancer to radiotherapy. Indeed, while 3D culture systems are very promising, one of the limitations of this study is that they still lack the capacity to take into consideration the effect of other constraints such as the cell-cell signaling, cell-ECM interaction, the heterogeneous nature of tissues and the vascular network that supplies a tissue [85]. Add to that the exhaustion of bladder cancer cell lines growing might not necessarily recapitulate the differences seen with patient’s response; hence, the need for a more personalized approach like patient-derived organoids methods. Finally, this study was performed on a limited number of bladder cancer commercial cell lines, and a larger panel of cell lines covering different types of tissues is required to confirm our results. Future studies should also assess the effect of a combination of RT with immunotherapy treatments and with CT or other compounds that can influence radiosensitivity [29,86]. Furthermore, in vivo experiments can be performed as a pre-clinical study, in addition to studies on primary bladder cancer cells and tissues. Understanding the radiobiology of bladder cancer might lead to the development of the predictive assays, which will help clinicians in personalizing RT treatments: Patients showing radiosensitive tumors can, therefore, be candidates to organ preserving strategies, while cystectomy will remain the mainstay of radioresistant bladder cancer treatment.

5. Conclusions

To conclude, our results altogether show that:
  • The radio-response of the 3 bladder cancer cell lines, in terms of VR and SR, is very dependent on the timing of the treatment and the cells’ intrinsic sensitivity to both the treatment timing and dose.
  • Current DF predictive models overestimate the sensitivity of the tested bladder cancer spheres.

Supplementary Materials

The following supporting information can be downloaded at: https://www.mdpi.com/article/10.3390/radiation2040025/s1, Figure S1: Representative images of RT4 spheres without IR and after single doses treatments with 2 Gy and 10 Gy. Figure S2: Representative images of T24 spheres without IR and after single doses treatments with 2 Gy and 10 Gy. Figure S3: Representative images of UM-UC-3 spheres without IR and after single doses treatments with 2 Gy and 10 Gy. Supplementary Materials and Methods: Clonogenic Assay and spheres protocols.

Author Contributions

Conceptualization, L.B., Y.H.Z. and W.A.-K., methodology L.B., J.A.-C. and T.A., validation, F.G., Y.H.Z. and W.A.-K.; formal analysis, L.B., J.A.-C. and T.A.; investigation, L.B., J.A.-C., T.A., J.A., J.B.-G., R.C. and C.F.; resources, F.G., Y.H.Z. and W.A.-K.; data curation, L.B., J.A.-C. and T.A.; writing—original draft preparation, L.B., J.A.-C. and T.A.; writing—review and editing, H.F.B., T.E., F.G., Y.H.Z. and W.A.-K.; visualization, T.E., Y.H.Z. and W.A.-K.; supervision, Y.H.Z. and W.A.-K.; funding acquisition, F.G., Y.H.Z., W.A.-K. and H.F.B. All authors have read and agreed to the published version of the manuscript.

Funding

This research was supported by funding from the Medical Practice Plan of the Faculty of Medicine of the American University of Beirut (MPP-AUBFM No: 320080) to W.A.-K., the Lebanese National Council for Scientific Research Grant Research Program (LNCSR-GRP No: 103540 and 103487) to Y.Z. and the Partenariat Hubert Curien—PROJET CEDRE (No: 47880PE) to F.G. The funders had no role in study design, data collection and analysis, decision to publish, or preparation of the manuscript.

Institutional Review Board Statement

All the fibroblast cell lines used in this study were purchased from commercial repositories (see Section 2).

Informed Consent Statement

The commercial repositories that have provided the fibroblast cell lines used in this study applied all the ethics and regulations related to the human samplings (informed and written consent, anonymization, and acceptance for publication).

Data Availability Statement

All the data can be provided on reasonable request.

Acknowledgments

We would like to thank all members of the Radiation Oncology Department of AUBMC, Abou-Kheir’s Laboratory for their support and all members of the core facilities in the DTS Building for their help and support.

Conflicts of Interest

The authors declare no conflict of interest.

References

  1. Ferlay, J.; Ervik, M.; Lam, F.; Colombet, M.; Mery, L.; Piñeros, M.; Znaor, A.; Soerjomataram, I.; Bray, F. Global Cancer Observatory: Cancer Today. Available online: https://gco.iarc.fr/today (accessed on 2 March 2022).
  2. Bray, F.; Ferlay, J.; Soerjomataram, I.; Siegel, R.L.; Torre, L.A.; Jemal, A. Global cancer statistics 2018: GLOBOCAN estimates of incidence and mortality worldwide for 36 cancers in 185 countries. CA Cancer J. Clin. 2018, 68, 394–424. [Google Scholar] [CrossRef] [PubMed] [Green Version]
  3. Siegel, R.L.; Miller, K.D.; Fuchs, H.E.; Jemal, A. Cancer Statistics, 2021. CA Cancer J. Clin. 2021, 71, 7–33. [Google Scholar] [CrossRef] [PubMed]
  4. Colquhoun, A.J.; Jones, G.D.D.; Moneef, M.A.L.; Bowman, K.J.; Kockelbergh, R.C.; Symonds, R.P.; Steward, W.P.; Mellon, J.K. Improving and Predicting Radiosensitivity in Muscle Invasive Bladder Cancer. J. Urol. 2003, 169, 1983–1992. [Google Scholar] [CrossRef]
  5. Zapatero, A.; Martin de Vidales, C.; Arellano, R.; Bocardo, G.; Pérez, M.; Ríos, P. Updated results of bladder-sparing trimodality approach for invasive bladder cancer. Urol. Oncol. Semin. Orig. Investig. 2010, 28, 368–374. [Google Scholar] [CrossRef] [PubMed]
  6. Shipley, W.U.; Zietman, A.L.; Kaufman, D.S.; Coen, J.J.; Sandler, H.M. Selective bladder preservation by trimodality therapy for patients with muscularis propria-invasive bladder cancer and who are cystectomy candidates—The Massachusetts General Hospital and Radiation Therapy Oncology Group experiences. Semin. Radiat. Oncol. 2005, 15, 36–41. [Google Scholar] [CrossRef] [PubMed]
  7. Gakis, G.; Efstathiou, J.; Lerner, S.P.; Cookson, M.S.; Keegan, K.A.; Guru, K.A.; Shipley, W.U.; Heidenreich, A.; Schoenberg, M.P.; Sagaloswky, A.I.; et al. ICUD-EAU International Consultation on Bladder Cancer 2012: Radical Cystectomy and Bladder Preservation for Muscle-Invasive Urothelial Carcinoma of the Bladder. Eur. Urol. 2013, 63, 45–57. [Google Scholar] [CrossRef] [PubMed]
  8. Tan, W.S.; Lamb, B.W.; Kelly, J.D. Complications of Radical Cystectomy and Orthotopic Reconstruction. Adv. Urol. 2015, 2015, 323157. [Google Scholar] [CrossRef] [PubMed] [Green Version]
  9. Rajab, N.F.; McKenna, D.J.; Diamond, J.; Williamson, K.; Hamilton, P.W.; McKelvey-Martin, V.J. Prediction of radiosensitivity in human bladder cell lines using nuclear chromatin phenotype. Cytom. Part A 2006, 69A, 1077–1085. [Google Scholar] [CrossRef] [PubMed]
  10. Moneef, M.A.L.; Sherwood, B.T.; Bowman, K.J.; Kockelbergh, R.C.; Symonds, R.P.; Steward, W.P.; Mellon, J.K.; Jones, G.D.D. Measurements using the alkaline comet assay predict bladder cancer cell radiosensitivity. Br. J. Cancer 2003, 89, 2271–2276. [Google Scholar] [CrossRef] [Green Version]
  11. Hinata, N.; Shirakawa, T.; Zhang, Z.; Matsumoto, A.; Fujisawa, M.; Okada, H.; Kamidono, S.; Gotoh, A. Radiation induces p53-dependent cell apoptosis in bladder cancer cells with wild-type- p53 but not in p53-mutated bladder cancer cells. Urol. Res. 2003, 31, 387–396. [Google Scholar] [CrossRef]
  12. Ruiz de Almodovar, J.M.; Nunez, M.I.; McMillan, T.J.; Olea, N.; Mort, C.; Villalobos, M.; Pedraza, V.; Steel, G.G. Initial radiation-induced DNA damage in human tumour cell lines: A correlation with intrinsic cellular radiosensitivity. Br. J. Cancer 1994, 69, 457–462. [Google Scholar] [CrossRef] [PubMed] [Green Version]
  13. Jeggo, P.A.; Lobrich, M. DNA double-strand breaks: Their cellular and clinical impact? Oncogene 2007, 26, 7717–7719. [Google Scholar] [CrossRef]
  14. Joubert, A.; Foray, N. Intrinsic radiosensitivity and DNA double-strand breaks in human cells. Cancer Radiother. 2007, 11, 129–142. [Google Scholar] [CrossRef] [PubMed]
  15. Joubert, A.; Zimmerman, K.M.; Bencokova, Z.; Gastaldo, J.; Rénier, W.; Chavaudra, N.; Favaudon, V.; Arlett, C.; Foray, N. DNA double-strand break repair defects in syndromes associated with acute radiation response: At least two different assays to predict intrinsic radiosensitivity? Int. J. Radiat. Biol. 2008, 84, 107–125. [Google Scholar] [CrossRef]
  16. Puck, T.T.; Marcus, P.I. Action of x-rays on mammalian cells. J. Exp. Med. 1956, 103, 653–666. [Google Scholar] [CrossRef] [PubMed]
  17. Fertil, B.; Malaise, E.P. Inherent cellular radiosensitivity as a basic concept for human tumor radiotherapy. Int. J. Radiat. Oncol. Biol. Phys. 1981, 7, 621–629. [Google Scholar] [CrossRef]
  18. Bodgi, L.; Foray, N. The nucleo-shuttling of the ATM protein as a basis for a novel theory of radiation response: Resolution of the linear-quadratic model. Int. J. Radiat. Biol. 2016, 92, 117–131. [Google Scholar] [CrossRef]
  19. Deschavanne, P.J.; Fertil, B. A review of human cell radiosensitivity in vitro. Int. J. Radiat. Oncol. Biol. Phys. 1996, 34, 251–266. [Google Scholar] [CrossRef]
  20. Fertil, B.; Reydellet, I.; Deschavanne, P.J. A benchmark of cell survival models using survival curves for human cells after completion of repair of potentially lethal damage. Radiat. Res. 1994, 138, 61–69. [Google Scholar] [CrossRef]
  21. Curtis, S.B. Mechanistic models. Basic Life Sci. 1991, 58, 367–382, discussion 382-366. [Google Scholar] [PubMed]
  22. Curtis, S.B. Lethal and potentially lethal lesions induced by radiation--a unified repair model. Radiat. Res. 1986, 106, 252–270. [Google Scholar] [CrossRef] [PubMed]
  23. Tobias, C.A. The repair-misrepair model in radiobiology: Comparison to other models. Radiat. Res. Suppl. 1985, 8, S77–S95. [Google Scholar] [CrossRef] [PubMed]
  24. Chadwick, K.H.; Leenhouts, H.P. A molecular theory of cell survival. Phys. Med. Biol. 1973, 13, 78–87. [Google Scholar] [CrossRef] [PubMed]
  25. Bodgi, L.; Canet, A.; Pujo-Menjouet, L.; Lesne, A.; Victor, J.M.; Foray, N. Mathematical models of radiation action on living cells: From the target theory to the modern approaches. A historical and critical review. J. Biol. 2016, 394, 93–101. [Google Scholar] [CrossRef]
  26. Bentzen, S.M.; Christensen, J.J.; Overgaard, J.; Overgaard, M. Some methodological problems in estimating radiobiological parameters from clinical data. Alpha/beta ratios and electron RBE for cutaneous reactions in patients treated with postmastectomy radiotherapy. Acta Oncol. 1988, 27, 105–116. [Google Scholar] [CrossRef] [PubMed] [Green Version]
  27. Bahmad, H.F.; Cheaito, K.; Chalhoub, R.M.; Hadadeh, O.; Monzer, A.; Ballout, F.; El-Hajj, A.; Mukherji, D.; Liu, Y.-N.; Daoud, G.; et al. Sphere-Formation Assay: Three-Dimensional in vitro Culturing of Prostate Cancer Stem/Progenitor Sphere-Forming Cells. Front. Oncol. 2018, 8, 347. [Google Scholar] [CrossRef] [PubMed] [Green Version]
  28. Bodgi, L.; Bahmad, H.F.; Araji, T.; Al Choboq, J.; Bou-Gharios, J.; Cheaito, K.; Zeidan, Y.H.; Eid, T.; Geara, F.; Abou-Kheir, W. Assessing Radiosensitivity of Bladder Cancer in vitro: A 2D vs. 3D Approach. Front. Oncol. 2019, 9, 153. [Google Scholar] [CrossRef] [Green Version]
  29. Azzi, J.; Waked, A.; Bou-Gharios, J.; Al Choboq, J.; Geara, F.; Bodgi, L.; Maalouf, M. Radiosensitizing Effect of Curcumin on Human Bladder Cancer Cell Lines: Impact on DNA Repair Mechanisms. Nutr. Cancer 2022, 74, 2207–2221. [Google Scholar] [CrossRef]
  30. Bou-Gharios, J.; Assi, S.; Bahmad, H.F.; Kharroubi, H.; Araji, T.; Chalhoub, R.M.; Ballout, F.; Harati, H.; Fares, Y.; Abou-Kheir, W. The potential use of tideglusib as an adjuvant radio-therapeutic treatment for glioblastoma multiforme cancer stem-like cells. Pharmacol. Rep. 2021, 73, 227–239. [Google Scholar] [CrossRef]
  31. Anderson, K.; Lutz, C.; Van Delft, F.W.; Bateman, C.M.; Guo, Y.; Colman, S.M.; Kempski, H.; Moorman, A.V.; Titley, I.; Swansbury, J.; et al. Genetic variegation of clonal architecture and propagating cells in leukaemia. Nature 2011, 469, 356–361. [Google Scholar] [CrossRef] [PubMed]
  32. Codony-Servat, J.; Rosell, R. Cancer stem cells and immunoresistance: Clinical implications and solutions. Transl. Lung Cancer Res. 2015, 4, 689–703. [Google Scholar] [CrossRef] [PubMed]
  33. Kitamura, H.; Okudela, K.; Yazawa, T.; Sato, H.; Shimoyamada, H. Cancer stem cell: Implications in cancer biology and therapy with special reference to lung cancer. Lung Cancer 2009, 66, 275–281. [Google Scholar] [CrossRef]
  34. Wu, C.-T.; Lin, W.-Y.; Chang, Y.-H.; Chen, W.-C.; Chen, M.-F. Impact of CD44 expression on radiation response for bladder cancer. J. Cancer 2017, 8, 1137–1144. [Google Scholar] [CrossRef] [PubMed] [Green Version]
  35. Dean, M.; Fojo, T.; Bates, S. Tumour stem cells and drug resistance. Nat. Rev. Cancer 2005, 5, 275–284. [Google Scholar] [CrossRef] [PubMed]
  36. Abdullah, L.N.; Chow, E.K.-H. Mechanisms of chemoresistance in cancer stem cells. Clin. Transl. Med. 2013, 2, 3. [Google Scholar] [CrossRef] [PubMed] [Green Version]
  37. Donnenberg, V.S.; Donnenberg, A.D. Multiple drug resistance in cancer revisited: The cancer stem cell hypothesis. J. Clin. Pharmacol. 2005, 45, 872–877. [Google Scholar] [CrossRef]
  38. Abou-Kheir, W.G.; Hynes, P.G.; Martin, P.L.; Pierce, R.; Kelly, K. Characterizing the contribution of stem/progenitor cells to tumorigenesis in the Pten-/-TP53-/- prostate cancer model. Stem Cells 2010, 28, 2129–2140. [Google Scholar] [CrossRef]
  39. Mouhieddine, T.H.; Nokkari, A.; Itani, M.M.; Chamaa, F.; Bahmad, H.; Monzer, A.; El-Merahbi, R.; Daoud, G.; Eid, A.; Kobeissy, F.H.; et al. Metformin and Ara-a Effectively Suppress Brain Cancer by Targeting Cancer Stem/Progenitor Cells. Front. Neurosci. 2015, 9, 442. [Google Scholar] [CrossRef] [Green Version]
  40. Morrison, B.J.; Steel, J.C.; Morris, J.C. Sphere Culture of Murine Lung Cancer Cell Lines Are Enriched with Cancer Initiating Cells. PLoS ONE 2012, 7, e49752. [Google Scholar] [CrossRef]
  41. Abou-Kheir, W.; Hynes, P.G.; Martin, P.; Yin, J.J.; Liu, Y.N.; Seng, V.; Lake, R.; Spurrier, J.; Kelly, K. Self-renewing Pten-/-TP53-/- protospheres produce metastatic adenocarcinoma cell lines with multipotent progenitor activity. PLoS ONE 2011, 6, e26112. [Google Scholar] [CrossRef]
  42. Riedl, A.; Schlederer, M.; Pudelko, K.; Stadler, M.; Walter, S.; Unterleuthner, D.; Unger, C.; Kramer, N.; Hengstschlager, M.; Kenner, L.; et al. Comparison of cancer cells in 2D vs 3D culture reveals differences in AKT-mTOR-S6K signaling and drug responses. J. Cell Sci. 2017, 130, 203–218. [Google Scholar] [CrossRef] [PubMed] [Green Version]
  43. Bissell, M.J. Goodbye flat biology—Time for the 3rd and the 4th dimensions. J. Cell Sci. 2017, 130, 3–5. [Google Scholar] [CrossRef] [PubMed] [Green Version]
  44. Sart, S.; Tomasi, R.F.X.; Amselem, G.; Baroud, C.N. Multiscale cytometry and regulation of 3D cell cultures on a chip. Nat. Commun. 2017, 8, 469. [Google Scholar] [CrossRef] [PubMed] [Green Version]
  45. Yoshida, T.; Sopko, N.A.; Kates, M.; Liu, X.; Joice, G.; McConkey, D.J.; Bivalacqua, T.J. Impact of spheroid culture on molecular and functional characteristics of bladder cancer cell lines. Oncol. Lett. 2019, 18, 4923–4929. [Google Scholar] [CrossRef] [Green Version]
  46. Amaral, R.L.; Miranda, M.; Marcato, P.D.; Swiech, K. Comparative analysis of 3D bladder tumor spheroids obtained by forced floating and hanging drop methods for drug screening. Front. Physiol. 2017, 8, 605. [Google Scholar] [CrossRef] [Green Version]
  47. Pereira, P.M.R.; Berisha, N.; Bhupathiraju, N.; Fernandes, R.; Tomé, J.P.C.; Drain, C.M. Cancer cell spheroids are a better screen for the photodynamic efficiency of glycosylated photosensitizers. PLoS ONE 2017, 12, e0177737. [Google Scholar] [CrossRef]
  48. Mann, H.B.; Whitney, D.R. On a Test of Whether one of Two Random Variables is Stochastically Larger than the Other. Ann. Math. Stat. 1947, 18, 50–60. [Google Scholar] [CrossRef]
  49. Wilcoxon, F. Individual Comparisons by Ranking Methods. Biom. Bull. 1945, 1, 80–83. [Google Scholar] [CrossRef]
  50. Kruskal, W.H.; Wallis, W.A. Use of Ranks in One-Criterion Variance Analysis. J. Am. Stat. Assoc. 1952, 47, 583–621. [Google Scholar] [CrossRef]
  51. Coleman, T.; Li, Y. An Interior Trust Region Approach for Nonlinear Minimization Subject to Bounds. SIAM J. Optim. 1996, 6, 418–445. [Google Scholar] [CrossRef]
  52. Burger, M.; Oosterlinck, W.; Konety, B.; Chang, S.; Gudjonsson, S.; Pruthi, R.; Soloway, M.; Solsona, E.; Sved, P.; Babjuk, M.; et al. ICUD-EAU International Consultation on Bladder Cancer 2012: Non–Muscle-Invasive Urothelial Carcinoma of the Bladder. Eur. Urol. 2013, 63, 36–44. [Google Scholar] [CrossRef] [PubMed]
  53. Chou, R.; Selph, S.S.; Buckley, D.I.; Gustafson, K.S.; Griffin, J.C.; Grusing, S.E.; Gore, J.L. Treatment of muscle-invasive bladder cancer: A systematic review. Cancer 2016, 122, 842–851. [Google Scholar] [CrossRef] [PubMed] [Green Version]
  54. Carillo, V.; Cozzarini, C.; Rancati, T.; Avuzzi, B.; Botti, A.; Borca, V.C.; Cattari, G.; Civardi, F.; Esposti, C.D.; Franco, P.; et al. Relationships between bladder dose–volume/surface histograms and acute urinary toxicity after radiotherapy for prostate cancer. Radiother. Oncol. 2014, 111, 100–105. [Google Scholar] [CrossRef]
  55. Feuerstein, M.A.; Goenka, A. Quality of Life Outcomes for Bladder Cancer Patients Undergoing Bladder Preservation with Radiotherapy. Curr. Urol. Rep. 2015, 16, 75. [Google Scholar] [CrossRef]
  56. Koga, F.; Kihara, K. Selective bladder preservation with curative intent for muscle-invasive bladder cancer: A contemporary review. Int. J. Urol. 2012, 19, 388–401. [Google Scholar] [CrossRef]
  57. Majewski, W.; Tarnawski, R. Acute and Late Toxicity in Radical Radiotherapy for Bladder Cancer. Clin. Oncol. 2009, 21, 598–609. [Google Scholar] [CrossRef]
  58. Milosevic, M.; Gospodarowicz, M.; Zietman, A.; Abbas, F.; Haustermans, K.; Moonen, L.; Rödel, C.; Schoenberg, M.; Shipley, W. Radiotherapy for Bladder Cancer. Urology 2007, 69, 80–92. [Google Scholar] [CrossRef] [Green Version]
  59. Ott, O.J.; Rödel, C.; Weiss, C.; Wittlinger, M.; St. Krause, F.; Dunst, J.; Fietkau, R.; Sauer, R. Radiochemotherapy for Bladder Cancer. Clin. Oncol. 2009, 21, 557–565. [Google Scholar] [CrossRef]
  60. Sengeløv, L.; Von der Maase, H. Radiotherapy in bladder cancer. Radiother. Oncol. 1999, 52, 1–14. [Google Scholar] [CrossRef]
  61. Zhang, S.; Yu, Y.-H.; Zhang, Y.; Qu, W.; Li, J. Radiotherapy in muscle-invasive bladder cancer: The latest research progress and clinical application. Am. J. Cancer Res. 2015, 5, 854–868. [Google Scholar]
  62. Pettiford, J.; Rashid, S.; Balyimez, A.; Radivoyevitch, T.; Koshkin, V.S.; Lindner, D.J.; Parker, Y.; Day, M.L.; Day, K.C.; Tomlins, S.; et al. Identification of gene expression determinants of radiosensitivity in bladder cancer (BC) cell lines. J. Clin. Oncol. 2018, 36, e16507. [Google Scholar] [CrossRef]
  63. Peters, L.J. The ESTRO Regaud lecture Inherent radio sensitivity of tumor and normal tissue cells as a predictor of human tumor response. Radiother. Oncol. 1990, 17, 177–190. [Google Scholar] [CrossRef]
  64. Brengues, M.; Lapierre, A.; Bourgier, C.; Pèlegrin, A.; Özsahin, M.; Azria, D. T lymphocytes to predict radiation-induced late effects in normal tissues. Expert Rev. Mol. Diagn. 2017, 17, 119–127. [Google Scholar] [CrossRef] [PubMed]
  65. Chattopadhyay, I. Application of radiogenomics in radiation oncology. J. Radiat. Cancer Res. 2017, 8, 74–76. [Google Scholar] [CrossRef]
  66. Azimzadeh, O.; Tapio, S. Proteomics approaches to investigate cancer radiotherapy outcome: Slow train coming. Transl. Cancer Res. 2017, 6, S779–S788. [Google Scholar] [CrossRef]
  67. Vogin, G.; Bodgi, L.; Canet, A.; Pereira, S.; Gillet-Daubin, J.; Foray, N. OC-0221: High-performance radiosensitivity assay to predict post radiation overreactions. Radiother. Oncol. 2017, 123, S110–S111. [Google Scholar] [CrossRef]
  68. Granzotto, A.; Benadjaoud, M.A.; Vogin, G.; Devic, C.; Ferlazzo, M.L.; Bodgi, L.; Pereira, S.; Sonzogni, L.; Forcheron, F.; Viau, M.; et al. Influence of Nucleoshuttling of the ATM Protein in the Healthy Tissues Response to Radiation Therapy: Toward a Molecular Classification of Human Radiosensitivity. Int. J. Radiat. Oncol. Biol. Phys. 2016, 94, 450–460. [Google Scholar] [CrossRef]
  69. Ferlazzo, M.L.; Bourguignon, M.; Foray, N. Functional Assays for Individual Radiosensitivity: A Critical Review. Semin. Radiat. Oncol. 2017, 27, 310–315. [Google Scholar] [CrossRef] [PubMed]
  70. Barendsen, G.W. Dose fractionation, dose rate and iso-effect relationships for normal tissue responses. Int. J. Radiat. Oncol. Biol. Phys. 1982, 8, 1981–1997. [Google Scholar] [CrossRef]
  71. Ellis, F. The relationship of biological effect to dose-time fractionation factors in radiotherapy. Curr. Top. Radiat. Res. 1965, 4, 357–397. [Google Scholar]
  72. Suit, H.; Wette, R. Radiation dose fractionation and tumour control probability. Radiat. Res. 1966, 29, 267–281. [Google Scholar] [CrossRef] [PubMed]
  73. Goodwin Jinesh, G.; Daniel Levi, W.; Ashish, M.K. Bladder Cancer Stem Cells: Biological and Therapeutic Perspectives. Curr. Stem Cell Res. Ther. 2014, 9, 89–101. [Google Scholar] [CrossRef] [PubMed]
  74. Seifert, H.-H.; Meyer, A.; Cronauer, M.V.; Hatina, J.; Müller, M.; Rieder, H.; Hoffmann, M.J.; Ackermann, R.; Schulz, W.A. A new and reliable culture system for superficial low-grade urothelial carcinoma of the bladder. World J. Urol. 2007, 25, 297–302. [Google Scholar] [CrossRef] [PubMed] [Green Version]
  75. Overgaard, J.; Horsman, M.R. Modification of hypoxia induced radioresistance in tumors by the use of oxygen and sensitizers. Semin. Radiat. Oncol. 1996, 6, 10–21. [Google Scholar] [CrossRef]
  76. Rich, J.N. Cancer Stem Cells in Radiation Resistance. Cancer Res. 2007, 67, 8980. [Google Scholar] [CrossRef] [PubMed] [Green Version]
  77. DelNero, P.; Lane, M.; Verbridge, S.S.; Kwee, B.; Kermani, P.; Hempstead, B.; Stroock, A.; Fischbach, C. 3D culture broadly regulates tumor cell hypoxia response and angiogenesis via pro-inflammatory pathways. Biomaterials 2015, 55, 110–118. [Google Scholar] [CrossRef] [PubMed] [Green Version]
  78. Thames, H.D.; Wither, H.R.; Peters, L.J.; Fletcher, G. Changes in early and late radiation responses with altered dose fractionation: Implications for dose-survival relationships. Int. J. Radiat. Oncol. Biol. Phys. 1982, 8, 219–226. [Google Scholar] [CrossRef]
  79. Jones, B.; Dale, R.G.; Deehan, C.; Hopkins, K.I.; Morgan, D.A. The role of biologically effective dose (BED) in clinical oncology. Clin. Oncol. 2001, 13, 71–81. [Google Scholar]
  80. Maalouf, M.; Granzotto, A.; Devic, C.; Bodgi, L.; Ferlazzo, M.; Peaucelle, C.; Bajard, M.; Giraud, J.Y.; Balosso, J.; Hérault, J.; et al. Influence of Linear Energy Transfer on the Nucleo-shuttling of the ATM Protein: A Novel Biological Interpretation Relevant for Particles and Radiation. Int. J. Radiat. Oncol. Biol. Phys. 2019, 103, 709–718. [Google Scholar] [CrossRef]
  81. Pos, F.J.; Hart, G.; Schneider, C.; Sminia, P. Radical radiotherapy for invasive bladder cancer: What dose and fractionation schedule to choose? Int. J. Radiat. Oncol. 2006, 64, 1168–1173. [Google Scholar] [CrossRef] [PubMed]
  82. Chamie, K.; Litwin Mark, S.; Bassett Jeffrey, C.; Daskivich Timothy, J.; Lai, J.; Hanley Jan, M.; Konety Badrinath, R.; Saigal Christopher, S. Recurrence of high-risk bladder cancer: A population-based analysis. Cancer 2013, 119, 3219–3227. [Google Scholar] [CrossRef] [PubMed] [Green Version]
  83. Huddart, R.; McDonald, F.; Hafeez, S.; Warren-Oseni, K.; Taylor, H.; Thompson, A.; Khoo, V.; Harris, V.; McNair, H.; Mohammed, K.; et al. Phase I dose-escalated image-guided adaptive bladder radiotherapy study: Results of first dose cohort (68Gy). J. Clin. Oncol. 2014, 32, 291. [Google Scholar] [CrossRef]
  84. Murthy, V.; Masodkar, R.; Kalyani, N.; Mahantshetty, U.; Bakshi, G.; Prakash, G.; Joshi, A.; Prabhash, K.; Ghonge, S.; Shrivastava, S. Clinical Outcomes with Dose-Escalated Adaptive Radiation Therapy for Urinary Bladder Cancer: A Prospective Study. Int. J. Radiat. Oncol. Biol. Phys. 2016, 94, 60–66. [Google Scholar] [CrossRef]
  85. Fennema, E.; Rivron, N.; Rouwkema, J.; Van Blitterswijk, C.; De Boer, J. Spheroid culture as a tool for creating 3D complex tissues. Trends Biotechnol. 2013, 31, 108–115. [Google Scholar] [CrossRef]
  86. El Chediak, A.; Shamseddine, A.; Bodgi, L.; Obeid, J.-P.; Geara, F.; Zeidan, Y.H. Optimizing tumor immune response through combination of radiation and immunotherapy. Med. Oncol. 2017, 34, 165. [Google Scholar] [CrossRef] [PubMed]
Figure 1. Protocols illustration (A) Schematic illustrating the 3 different treatment protocols performed. (B) Schematic representing the dose fractionation (DF) treatment protocol (mid treatment protocol was added for comparison).
Radiation 02 00025 g001
Figure 2. Radiosensitivity of RT4, T24 and UM-UC-3 in 2D. (A) Immunofluorescence (IF) imaging of ɣH2AX and DAPI for the three cell lines RT4, T24 and UM-UC3 at without irradiation and 24 h after a 2 Gy treatment (scale bar = 5 µm). (B,C) Histogram of the average number of ɣH2AX foci for RT4, T24 and UM-UC3 at 0 min and 24 h post-treatment. Results are represented as the mean of 3 independent experiments ± SEM. Each experiment was repeated 3 times and the number of foci was counted in 30 nuclei per experiment. Mann-Whitney-Wilcoxon tests were performed for statistical significance (*** p < 0.001).
Radiation 02 00025 g002
Figure 3. Radio-induced decrease in the sphere ratio (SR) for RT4 (A), T24 (B) and UM-UC-3 (C) after performing early, mid and late treatment protocols. Data represents the mean of at least three independent experiments ± SEM. Data are fitted to the Linear-Quadratic (LQ) equation (Equation (2)). Fitting parameters and the corresponding R2 values are shown in Table 3. Sphere images are shown in Figures S1–S3.
Radiation 02 00025 g003
Figure 4. Volume reduction (VR) for RT4 (A) and T24 (B) human bladder cancer cell lines after performing early, mid and late treatment protocols. Data represents the mean of at least three independent experiments ± SEM. Data are fitted to a curvilinear model (Equation (7)). Fitting parameters and the corresponding R2 values are shown in Table 4. Sphere images are shown in Figures S1–S3. A (RT4) and B (T24) show the VR (%) as a function of irradiation dose (Gy) in the early, mid and late protocols for all three cell lines.
Radiation 02 00025 g004
Figure 5. Anti-CD44 IF analysis. (A) IF imaging of stem cell marker CD44 and DAPI at 0 Gy and 4 GY for the 3 cell lines cultured in 3D. (B) The intensity mean value of CD44 for the 3 cell lines at 0 Gy and 4 Gy. Data was normalized to the control by dividing the intensity of CD44 signal of the irradiation condition by the signal without irradiation. Mann-Whitney-Wilcoxon tests were performed for statistical significance (* p < 0.05; ** p < 0.01).
Radiation 02 00025 g005
Figure 6. Effect of dose fractionation on the radiosensitivity of bladder cancer cell lines in 3D. Radio-induced decrease in the sphere ratio (SR) for RT4 (A), T24 (B) and UM-UC-3 (C), and Volume reduction (VR) for RT4 (D) and T24 (E) human bladder cancer cell lines after performing a dose fractionated treatment protocol. Data represents the mean of at least three independent experiments ± SEM. Fitting parameters and the corresponding R2 values are shown in Table 2.
Radiation 02 00025 g006
Table 1. Cell lines specifications.
Cell LineTissueDiseaseAgeSphere Maturity
RT4Urinary bladderTransitional cell papilloma63 yearsDay 7
UM-UC-3Urinary bladderTransitional cell carcinoma-Day 5
T24Urinary bladderTransitional cell carcinoma81 yearsDay7
Table 2. Summary of all the experiments performed in this study.
AssayDoseTreatment DeliveryEndpointEquation
2DClonogenic Assay2 GySingle dose, delayed platingSurviving Fraction S F = n u m b e r   o f   c o l o n i e s   c o u n t e d n u m b e r   o f   c e l l s   s e e d e d ( P E / 100 )
Immunofluorescence: anti-γH2AX2 GySingle doseNumber of foci 24 h after irradiationNA
3DSpheres assay0, 2, 4, 6, 8 and 10 GySingle dose: early, mid and late
treatment protocols (Figure 1)
SR: Sphere Ratio SR ( D ) = Number   of   spheres   at   dose   D Number   of   spheres   at   0 Gy
VR: Volume Reduction V   = 4 π 3 × ( d 2 ) 3 VR ( D ) = V 0 V ( D ) V 0 × 100
0, 2, 4, 6, 8 and 10 GyFactionated treatment: 2 Gy every 24 h
mid treatment protocol (Figure 1)
SR: Sphere Ratio SR ( D ) = Number   of   spheres   at   dose   D Number   of   spheres   at   0 Gy
VR: Volume Reduction V   = 4 π 3 × ( d 2 ) 3 VR ( D ) = V 0 V ( D ) V 0 × 100
Immunofluorescence: anti-CD44 4 GySingle dose, early treatment CD44 expressionNA
Table 3. Fitting parameters of SR(D). Data were fitted to the LQ model for single ( SR ( D ) =   e α D β D 2 ) and fractionated doses ( SR ( D ) =   e α D β dD ).
Conditionα (95% CI)β (95% CI)R2
RT4Early0.3328 (0.2556, 0.41)00.8
Mid0.3572 (0.0815, 0.6328)0.0007994 (−0.03194, 0.03354)0.92
Late0.04105 (0.019, 0.063)0.004094 (0.0014, 0.0067)0.99
DF0.2132 (−0.03186, 0.4583)0.002836 (−0.02621, 0.03188)0.9
T24Early0.4772 (0.4525, 0.5)00.99
Mid0.4999 (0.2068, 0.7931)0 (−0.032, 0.033)0.96
Late0.1328 (0.1098, 0.1558)00.9
DF0.176 (−0.03008, 0.3821)0.004437 (−0.01999, 0.02886)0.9
UC3Early0.1682 (0.03079, 0.3057)0.005847 (−0.01048, 0.02217)0.95
Mid0.3572 (0.0815, 0.6328)0.0007994 (−0.03194, 0.03354)0.92
Late0.1238 (0.01556, 0.232)0.003527 (−0.009326, 0.01638)0.94
DF0.1061 (−0.001762, 0.214)0.004011 (−0.008775, 0.0168)0.94
Table 4. Fitting parameters of VR(D). Data were fitted to a curvilinear model ( VR ( D ) =   VR max ( 1 exp ( eD ) ) .
ConditionVRmax (CI 95%)e (CI 95%)R2
RT4Early45.62 (39.75, 51.49)0.5378 (0.2835, 0.7922)0.97
Mid32.73 (27.55, 37.92)0.326 (0.1809, 0.471)0.98
Late88.94 (−136, 313.9)0.05236 (−0.1112, 0.2159)0.94
DF37.69 (21.43, 53.94)0.3101 (−0.07377, 0.6939)0.9
T24Early62.56 (52.29, 72.83)0.4551 (0.2019, 0.7083)0.96
Mid2.06 × 104 (−1.138 × 10⁷, 1.142 × 10⁷)0.000421 (−0.233, 0.2338)0.88
Late23.9 (18.93, 28.87)1.566 (−0.5936, 3.725)0.85
DF59.42 (19.33, 99.52)0.2845 (−0.233, 0.8021)0.81
Table 5. Summary of all the results. For treatments where many doses where used, only the results after 2 Gy and 8 Gy are shown here.
RT4 T-24 UM-UC3
2D Assays Clonogenic Assay SF (2 Gy) 64.8 ± 7%57 ± 9%31 ± 7.3%
Residual γH2AX foci (2 Gy)3 ± 0.8 foci4 ± 0.5 foci5.7 ± 0.6 foci
Sphere Ratio Early Treatment SR(2 Gy) 0.22 ± 0.04 0.49 ± 0.07 0.79 ± 0.05
SR(8 Gy) 0.07 ± 0.01 0.02 ± 0.010.13 ± 0.02
Mid Treatment SR(2 Gy) 0.41 ± 0.04 0.47 ± 0.06 0.62 ± 0.08
SR(8 Gy) 0.09 ± 0.05 0.01 ± 0.00 0.07 ± 0.015
Late Treatment SR(2 Gy) 0.41 ± 0.04 0.65 ± 0.020.66 ± 0.07
SR(8 Gy) 0.56 ± 0.05 0.33 ± 0.04 0.27 ± 0.05
DF treatment SR(2 Gy) 0.41 ± 0.04 0.47± 0.07 0.62 ± 0.08
SR(8 Gy) 0.22 ± 0.04 0.25 ± 0.016 35 ± 0.09
Volume Reduction Early Treatment SR(2 Gy) 28 ±8.4% 37.25 ± 6%Not applicable
SR(8 Gy) 50 ± 3.3% 65 ± 1.5% Not applicable
Mid Treatment SR(2 Gy) 18.5±3.5%27.5 ± 2.6%Not applicable
SR(8 Gy) 29.1 ± 0.26% 52.9 ± 5.2% Not applicable
Late Treatment SR(2 Gy) 12.1 ± 3.5%24.2 ± 3%Not applicable
SR(8 Gy) 33.5 ± 3.9% 28 ± 3% Not applicable
DF Treatment SR(2 Gy) 18.5 ± 3.5%27.5 ± 2.6%Not applicable
SR(8 Gy) 31.8 ± 2.6% 57 ± 2.8% Not applicable
CD44 Expression 0 Gy 76 ± 10%50 ± 2%64 ± 6%
4 Gy 36 ± 2.4%76.8 ± 5%24.5 ± 3%
Publisher’s Note: MDPI stays neutral with regard to jurisdictional claims in published maps and institutional affiliations.

